Article

Calculation of Coke Layers Situation in the Cohesive Zone of Blast Furnace

by
Mikolaj Bernasowski
*,
Arkadiusz Klimczyk
and
Ryszard Stachura
Faculty of Metals Engineering and Industrial Computer Science, AGH University of Science and Technology, Mickiewicza 30, 30-059 Krakow, Poland
*
Author to whom correspondence should be addressed.
Materials 2021, 14(1), 192; https://doi.org/10.3390/ma14010192
Submission received: 2 December 2020 / Revised: 26 December 2020 / Accepted: 30 December 2020 / Published: 3 January 2021
(This article belongs to the Special Issue Physical and Numerical Modeling of Process Metallurgy)

Abstract

:
Coke is the only batch component that does not soften in blast furnace thermal conditions. It is especially important at the temperatures of the cohesive zone forming because coke layers are the only gas-permeable charge. The aim of the work described in this article is the identification of individual coke layers situation in the cohesive zone. Numerical calculations of the cohesive zone situation are based on the horizontal below burden probe measures, however, coke layers are calculated using analytical geometry. The results can be presented as a bitmap; the individual and total area of the coke layers passing gases through the cohesive zone is also calculated. This form of results allows for subjective but quick assessment of the blast furnace operation by its crew.

1. Introduction

Hot metal (HM) production is the most expensive step in the steel production cycle. Although the efficiency of blast furnace (BF) mostly depends on the charge materials quality [1,2], mathematical modeling of partial phenomena or the whole process can help to understand and highlight current shortcomings in BF technology [3,4].
The cohesive zone (CZ) is one of the crucial issues related to the modeling of the BF process. It is a bottleneck for the flow of reducing gases in the BF shaft, and its location and shape determine the correctness and continuity of the hot metal production process.
According to the definition, the cohesive zone is an area closed between the isotherms of the softening and melting of the charge oxide materials (sinter, pellets, flux, lump ore), which, being in a soft state, stick to each other and thus are impermeable to gases [5]. The only places permitting gas flow are the coke slits between cohesive ore charge layers (Figure 1). Thus, the cohesive zone plays the role of a gas distributor in the charge materials solid-state area [6].
Numerous experimental and numerical studies devoted to charging particle behavior or identifying the shape and location of the cohesion zone can be found elsewhere. Among them should be mentioned cold models [7,8,9] or mathematical models [10,11,12,13,14,15]. Also, more advanced modeling techniques like the discrete element method (DEM) [9,16,17,18], computational fluid dynamics (CFD) models [19,20,21,22,23] and a combination of the two [24,25,26,27,28] are also reported.
All the mentioned models have a common goal, namely, to describe phenomena that cannot be measured or observed directly due to the working conditions of a sealed object, which a blast furnace is. However, cold models contribute to an understanding of macro-scale particle motion phenomena, while on the other hand, DEM–CFD models help to visualize the interaction between the different phases on a micro-scale.
The miscellaneous types of input data are used as an initial condition. Most of them are measured outside the burden by utilities like thermocouples in the wall, above burden probes, radar profilometer, or throat IR camera [13,15,29,30]; cooling water temperature may also be taken into account. However, there are measuring methods known to be more intrusive into the BF working space such as descending probe (DP) and horizontal below burden gas probe (BBP).
DP is a disposable pipe that dropped on the burden surface and allows for continuous measuring of gas composition and temperature 3–5 points from the wall to the axis of BF. Although the method is accurate, it takes a long time to reach the cohesive zone level (two–three hours), so any possible response to irregularities could be delayed. On the other hand, DP helped to learn and understand the phenomena in the BF shaft.
However, BBPs became more popular and have been widely used since the 1980s. Usually, BBP is situated 3–6 m below the burden surface and measures the gas composition and its temperature at 6–10 points (depending on the BF size). A measure lasts 3–4 min per point.
It can be seen that the mentioned models [7,8,9,10,11,12,13,14,15,16,17,18,19,20,21,22,23,24,25,26,27,28,29,30] differ from each other not only in the method used but mostly in the type and place of input data collection. The less intrusive the measure, the more sophisticated the modeling methods used. However, less complex models should be sufficient for quick assessment of BF operation, but they must be based on measurements taken as close as possible to the place where a specific phenomenon occurs.
To sum up, the selection of the modeling method for a specific phenomenon is based on the type and availability of input data, but also should depend on the speed of calculations, permissible error, and ease of implementation.
The current paper presents a mathematical model based on BBP measures. The Rist principles, namely the mass and heat transfer consideration in three separate zones, preparation, reserve, and producing, are taken as fundamentals. The work data of the blast furnace No.5 in the Krakow steel plant was used for the calculations.
The current model has been gradually developed for almost four decades. Invented by Itaya et al. [10], adopted to the conditions of Polish blast furnaces by Benesch et al. [31], upgraded by Stachura et al. [32], was finally improved by us and implemented in 2018 on the blast furnace No. 5 in Krakow. Here, the latest form is presented.

2. Materials and Methods

2.1. Object of Research

The referenced blast furnace has an overall volume of 2000 m3 and production ability is 1.2–1.4 million tons of hot metal annually. Hearth diameter is 9.75 m, along the perimeter of which is placed 24 tuyeres. The usual hot blast (HB) volume is about 190,000 m3 per hour.
BF No.5 is equipped with Dango & Dienenthal BBP situated 4.9 m below the throat and measures gas composition and temperature in 8 points, the distance between which is 0.54 m. In accordance with BBP geometry, a working space of BF is divided into 8 concentric segments (Figure 2). Therefore, we decided to define the levels of softening and melting isotherms occurrence for each segment and then to draw isotherms for the entire furnace. Next, it will be possible to calculate the coke slits situation. To achieve this goal, the work may be divided into the following main stages:
  • Determination of the charge materials mass and blast for each of the eight segments and their balance with the parameters of the entire furnace;
  • Determination of the preparation zone operating parameters and the levels of the 1000 °C isotherm as a thermal and chemical reserve zone;
  • Determination of the producing zone parameters using the 1000 °C isotherm level as input conditions;
  • Drawing of cohesion zone, coke layers, and calculating of their area.

2.2. Radial Material Balance

Radial distribution of materials charged from the top can be found using gas analyses of BBP measures. For this purpose, a system of linear equations describing the balance of elements or compounds such as nitrogen (1), hydrogen (2), carbon (3) and oxygen (4) was compiled:
28 22.4 · N 2 ( k ) · 0.01 · V g a s ( k ) = G N 2   t u y + N 2   c o k e C c o k e · { C d r ( k ) + ( G C H M + G C S i M n P ) · P H M ( k ) } ,
2 22.4 · H 2 ( k ) · 0.01 · V g a s ( k ) + 2 18 · W ( k ) = G H 2   t u y + H 2   c o k e C c o k e · { C d r ( k ) + ( G C H M + G C S i M n P ) · P H M ( k ) } ,
12 22.4 · { C O 2 ( k ) + C O ( k ) } · 0.01 · V g a s ( k ) = G C   t u y + C d r ( k ) + G C S i M n P · P H M ( k ) · 12 16 A m d O ( k ) ,
16 22.4 · { 2 C O 2 ( k ) + C O ( k ) } · 0.01 · V g a s ( k ) + 16 18 · W ( k ) = G O   t u y + { G O F e + G O S i M n P } · P H M ( k ) · A m d O ( k ) ,
where: (k)—index of one of eight concentric segments; CO2, CO, N2, H2—components of the gas measured on BBP level, in %; GN2tuy, GCtuy, GH2tuy, GOtuy—masses of basic elements or compounds at the tuyeres level, in kg/m3 of the hot blast(HB); Vgas—a volume of gas at the BBP level, in m3/m3HB; Cdr—a mass of carbon used in solution loss reaction (direct reduction of wustite), in kg/m3HB; PHM—hot metal production, in kg/m3HB; W—a mass of H2O produced in reduction by hydrogen, in kg/m3HB; GCHM—a mass of carbon solved in hot metal, in kg/kgHM; GCSiMnP—a mass of carbon used for the reduction of Mn, Si, and P, kg/kgHM; N2coke, Ccoke, H2coke—contents of nitrogen, carbon, and hydrogen in coke, in mass%; GOFe—a mass of oxygen coming from Fe reduction, in kg/kgHM; GOSiMnP—mass of oxygen coming from Si, Mn and P reduction, in kg/kgHM; AmdO—coefficient of oxygen amendment resulting from occurring reduction processes over BBP level (will be discussed further).
Variables in bold are unknowns. The system of Equations (1)–(4) is resolved for every eight concentric segments (k). Then, it is possible to calculate the share of charge materials masses, in kg/m3HB:
G c o k e ( k ) = G C C t u y + ( G C H M + G C S i M n P ) · P H M ( k ) + C d r ( k ) C c o k e · 0.01 ,
G i ( k ) = G i c h g P H M c h g · P H M ( k ) ,
where: i—means any material charged from the top except coke (i.e., sinter, pellets, etc.); GCCtuy—a mass of coke carbon burnt at the tuyeres level, in kg/m3HB; Gichg—a mass of i material in a single charge, in kg/chg; PHMchg—hot metal production from a single charge, in kg/chg.
It can be seen that most variables are expressed per cubic meter of the hot blast, so the most important thing now is the calculation of the blast volume for particular segments. The distribution of the blast volume will depend on the geometrical dimension and porosity of each segment. In turn, the porosity index depends on the share of coke and other charge materials.
P I ( k ) = P I c h g · G c o k e ( k ) i = 1 n G i ( k ) G c o k e c h g i = 1 n G i c h g ,
V H B ( k ) = V H B t u y · S ( k ) k = 1 8 S ( k ) · ( 1 + P I ( k ) k = 1 8 P I ( k ) · S ( k ) k = 1 8 S ( k ) k = 1 8 P I ( k ) · S ( k ) k = 1 8 S ( k ) ) ,
where: n—max number of input material (except coke); PI—segmental porosity index, in m3/chg; PIchg—porosity index of a single charge, in m3/chg; VHB—segmental hot blast volume, in m3/h; VHBtuy—overall hot blast volume at the tuyeres level, in m3/h; S—an area of segment cross-section at the BBP level, in m2.
After calculating the blast distribution, the segmental material distribution in kg/chg is calculated and then their sum is compared with the real mass of the single charge. In the first iteration, the difference is high, due to the fact that the calculations were carried out to the BBP level as if reduction processes take place only below the probe. On the other hand, it is known that in such a thick charge layer above the BBP, and at such a high temperature, the mass exchange must take place. For this reason, the carbon and oxygen balance Equations (3) and (4) are amended for oxygen.
A m d O ( k ) = 1 C O ( k ) · t g a s ( k ) C O t h r · t t h r ( C O t h r + C O 2   t h r ) · 1020 C O t h r · t t h r · A m d i t r ,
where: COthr,CO2 thr and tthr—gas composition and temperature of the gas at the throat level, in vol.%; 1020—the assumed gas temperature at the reserve zone level where charge temperature is 1000 °C (on this level CO2 does not exist yet and CO volume is the same as the sum of COthr and CO2 thr), in °C; Amditr—iteration amendment, which during balancing of segmental masses with a real mass of single charge is changed numerically from 1 down to 0 by 0.01 for each iteration and calculations carried out in loop from Equation (1) until misbalance reaches max 2%.

2.3. Preparation Zone Operating Parameters

2.3.1. Top Gas Temperature Radial Distribution

The most inconvenient for determination of the top heat exchange zone parameters is the lack of above burden probe (ABP). So, the gas temperature radial distribution at the throat level must be calculated numerically. It may be realized by transferring of the linearized temperature distribution at the BBP level to the throat level (Figure 3).
Firstly, an average gas temperature at the BBP level (10), linear dependence of the temperature distribution on the radius (11) and reference radius by which the transfer will take place are determined (12).
t B B P = k = 1 8 ( V H B ( k ) · t g a s ( k ) ) k = 1 8 V H B ( k ) ,
t g a s ( k ) = A · R ( k ) + B ,
R t r s f = t B B P B A ,
where: tBBP—the average gas temperature at the BBP level, in °C; RBBP—average weighted by segments squares radius at the BBP level, in m; R—radius of the cylindrical segment corresponding with BBP measuring points (so R(1)=0), in m; A,B—linear regression coefficients; Rtrsf—reference radius of temperature distribution transferring, in m.
Then, the gas temperature distribution (13) and average gas temperature (14) at the throat level are calculated:
t G A S ( k ) = A · { R ( k ) + R t r s f } + B { t B B P t t h r } ,
t T H R = k = 1 8 ( V H B ( k ) · t G A S ( k ) ) k = 1 8 V H B ( k ) ,
where, tGAS—the gas temperature distribution at the throat level, in °C; tTHR—calculated average gas temperature at the throat level, in °C.
If calculated tTHR is significantly different from tthr, the A parameter (tangent of the linear distributed temperature angle) is changed numerically.

2.3.2. Reserve Zone Situation

Preparation zone is characterized by following assumptions:
  • here is no direct reduction reaction of wustite;
  • Wall heat loss is neglected;
  • At the lower boundary, equated to the reserve zone, the batch temperature is 1000 °C and gas is 1020 °C.
Thus, heat exchange could be written as a differential equations system:
d { ω t ( k ) · t Z ( k ) } d Z T ( k ) = K 1 ( k ) · S ( k ) · { t Z ( k ) T Z ( k ) } ,
d { ψ T ( k ) · T Z ( k ) } d Z T ( k ) = K 1 ( k ) · S ( k ) · { t Z ( k ) T Z ( k ) } ,
where:—tZ and TZ mean gas and batch temperature at the level Z respectively, in C; ωt and ω ψT—heat capacities fluxes of gas and batch, in kJ/°C∙h; ZT—level of occurrence of T isotherm, in m; K1—volumetric heat transfer coefficient for preparation zone, in kJ/m3 °C∙h.
Assuming the initial integration conditions t0 = tGAS and T0 = 10 °C (temperature of loading batch), the solutions of the above-mentioned equation system are:
Z T ( k ) = ω t ( k ) · α ( k ) K 1 ( k ) · S ( k ) · { α ( k ) 1 } · l n α ( k ) · { T Z ( k ) T 0 } + t 0 ( k ) T Z t 0 ( k ) T 0 ,
t Z ( k ) = α ( k ) · { t 0 ( k ) T 0 } α ( k ) 1 · e x p { K 1 ( k ) · S ( k ) · Z T ( k ) · { α ( k ) 1 } ω t ( k ) · α ( k ) } + α ( k ) · T 0 t 0 ( k ) α ( k ) 1 ,
where: α—quotient ψTt which is assumed to be constancy in the whole preparatory zone for each segment k, wherein 0 < α < 1. From Equations (17) and (18) and using known BBP level, the K1 and α values can be found by inverse method. For this purpose, it is assumed:
Z T ( k ) = 4.91
t Z ( k ) = t 4.91 ( k ) = t g a s ( k )
T Z ( k ) = T 4.91 ( k ) = { 1000 T 0 } · t g a s ( k ) t G A S ( k ) 1020 t G A S ( k ) + T 0
ω t ( k ) = ω t g a s ( k ) ( k ) = V g a s ( k ) · V H B ( k ) · { C O ( k ) · C C O + C O 2 ( k ) · C C O 2 + H 2 ( k ) · C H 2 + N 2 ( k ) · C N 2 } · 0.01 22.4 + W ( k ) · V H B ( k ) · C H 2 O 18 ,
where: CCO, CCO2, CH2, CN2, CH2O—molar heat capacities of gas components calculated at the temperature of BBP level tgas, in kJ/°C mol.
Next, with K1 and α values, the level of 1000 °C is calculated according to Equation (17). Another value of ωt must be taken since at this level the gas temperature is 1020 °C and its composition is also different.

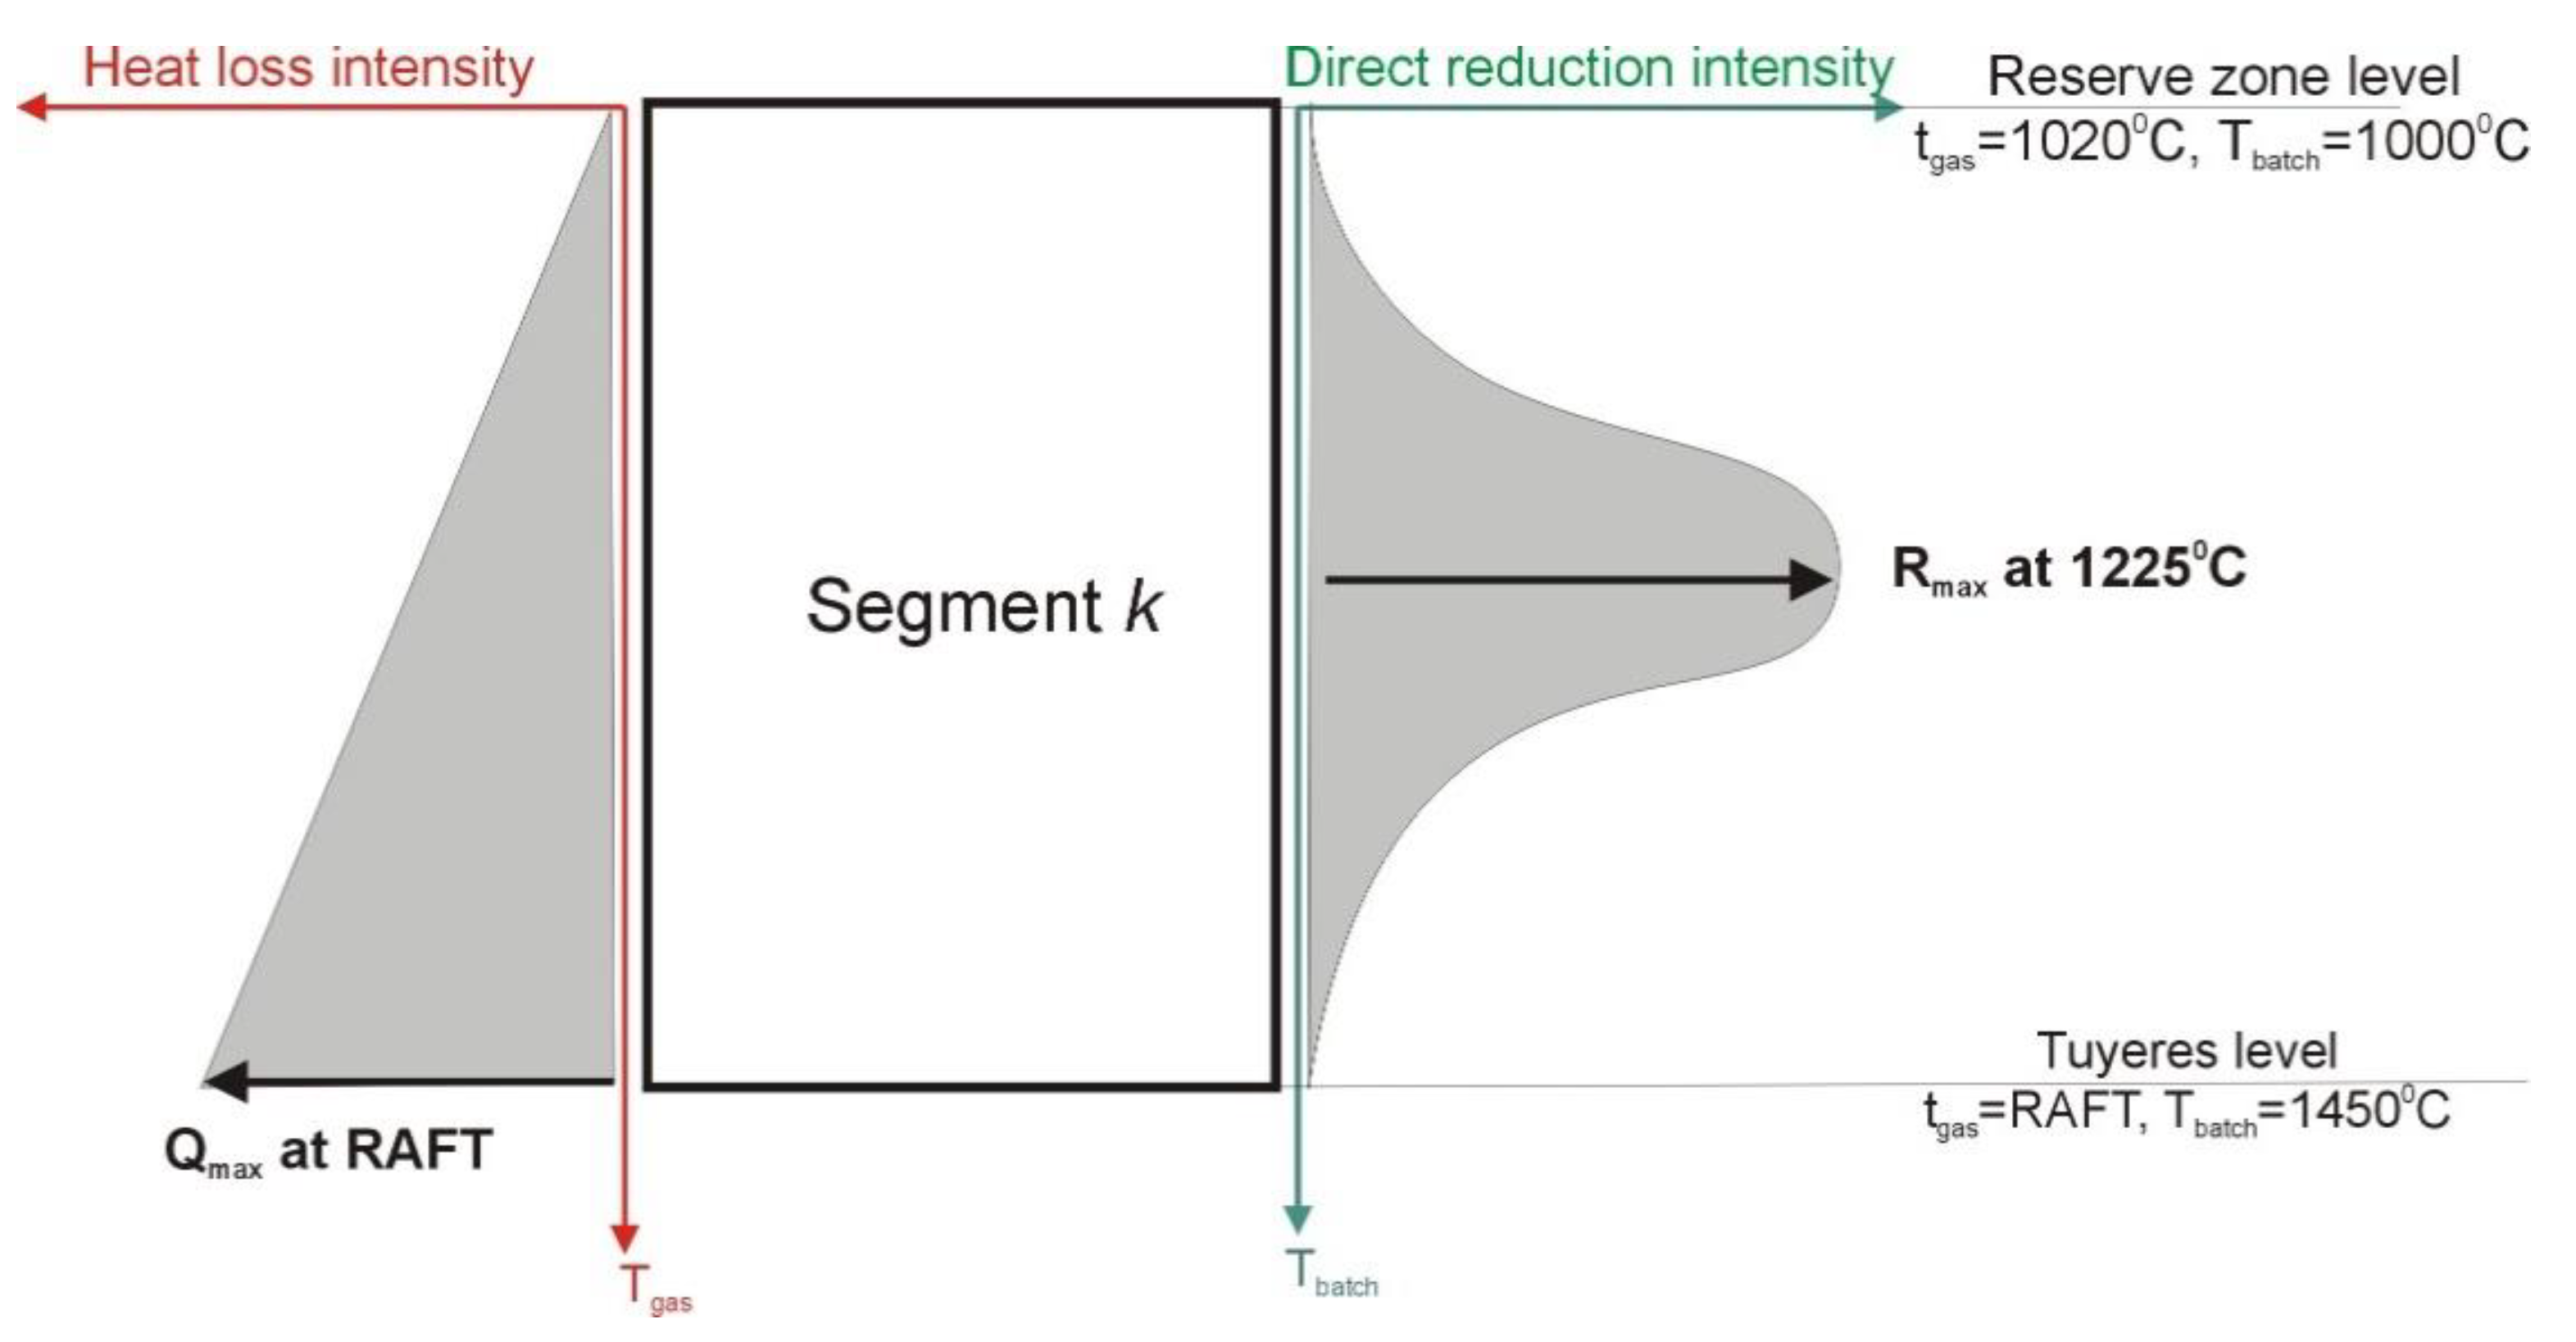
2.4. Producing Zone Operating Parameters

Producing zone is characterized by following assumptions (Figure 4):
  • At the top boundary (corresponding with the reserve zone level) the batch temperature is 1000 °C and gas is 1020 °C;
  • At the lower boundary the batch temperature is 1450 °C and gas is the same as raceway adiabatic flame temperature (RAFT);
  • Heat loss intensity is changed with the gas temperature, it achieves max value at the tuyeres level and min at the reserve zone level;
  • Intensity of direct reduction reaction is changed with the batch temperature according to the normal distribution; it achieves max value at 1225 °C.
In this zone, as a result of the direct FeO reduction reaction, the weight of the charge and gas is significantly decreased. Under the conditions of countercurrent motion, this phenomenon can be written as two differential equations:
d M ( k ) d T Z ( k ) = 28 12 · R D R ( k )
d m ( k ) d T Z ( k ) = 28 12 · R D R ( k )
where: m and M are mass fluxes of gas and batch, respectively, in kg/h; RDR is the intensity of carbon consumption by FeO direct reduction reaction in the producing zone at the temperature TZ, in kg/°C∙h. The minus sign means that gas and batch masses decrease downward.
The batch extracts heat from the gas for its heating, melting, and direct reduction, and the gas also covers heat losses. Thus, the heat transfer balance from gas to the charge can be presented in the form of the following differential equations:
d { ω t ( k ) · t Z ( k ) } d Z T ( k ) = K 2 ( k ) · S ( k ) · { t Z ( k ) T Z ( k ) }
d { [ ψ T ( k ) + Q H L ( k ) + R D R ( k ) · H D R ( k ) ] · T Z ( k ) } d Z T ( k ) = K 2 ( k ) · S ( k ) · { t Z ( k ) T Z ( k ) }
where: QHL—heat loss intensity at the tZ temperature, in kJ/°C∙h; HDR—enthalpy of direct reduction reaction per 1 kg of carbon, in kJ/kg; K2—volumetric heat transfer coefficient for producing zone, in kJ/m3·°C∙h.
Value of QHL depends on the gas temperature and max heat loss intensity for each segment (see Figure 4):
d { [ ψ T ( k ) + Q H L ( k ) + R D R ( k ) · H D R ( k ) ] · T Z ( k ) } d Z T ( k ) = K 2 ( k ) · S ( k ) · { t Z ( k ) T Z ( k ) }
Q m a x ( k ) = Q P Z ( k ) 1020 R A F T t Z ( k ) 1020 R A F T 1020 d t z ( k )
where QPZ—heat loss for the whole producing zone, in kJ/h.
However, the value of RDR depends on the batch temperature and max direct reduction intensity (see Figure 4):
Q m a x ( k ) = Q P Z ( k ) 1020 R A F T t Z ( k ) 1020 R A F T 1020 d t z ( k )
R m a x ( k ) = C d r ( k ) · V H B ( k ) 1000 1450 e 1 2 ( T Z ( k ) 1225 75 ) 2 d T z ( k )
Producing zone calculations are conducted numerically starting from the reserve zone level to tuyeres level (25.4 m) with the step of 0.01 m. Firstly, must be found coefficient K2 for each segment. Next, the softening and melting isotherms levels are calculated (Figure 5).
The temperatures of softening and melting isotherms are calculated from empirical equation:
T s o f t = 1094.5 + 6.45 · C a O S i O 2 0.62 · F e O
T m e l t = 1275 + 84.5 · C a O S i O 2 18.7 · F e O
where: CaO, SiO2 and FeO–mass% of respective compounds in sinter or pellets.
Equations (31) and (32) are found by sinter and pellets softening research conducted with a Tamman furnace. The method corresponds to another research [33,34,35,36,37,38].

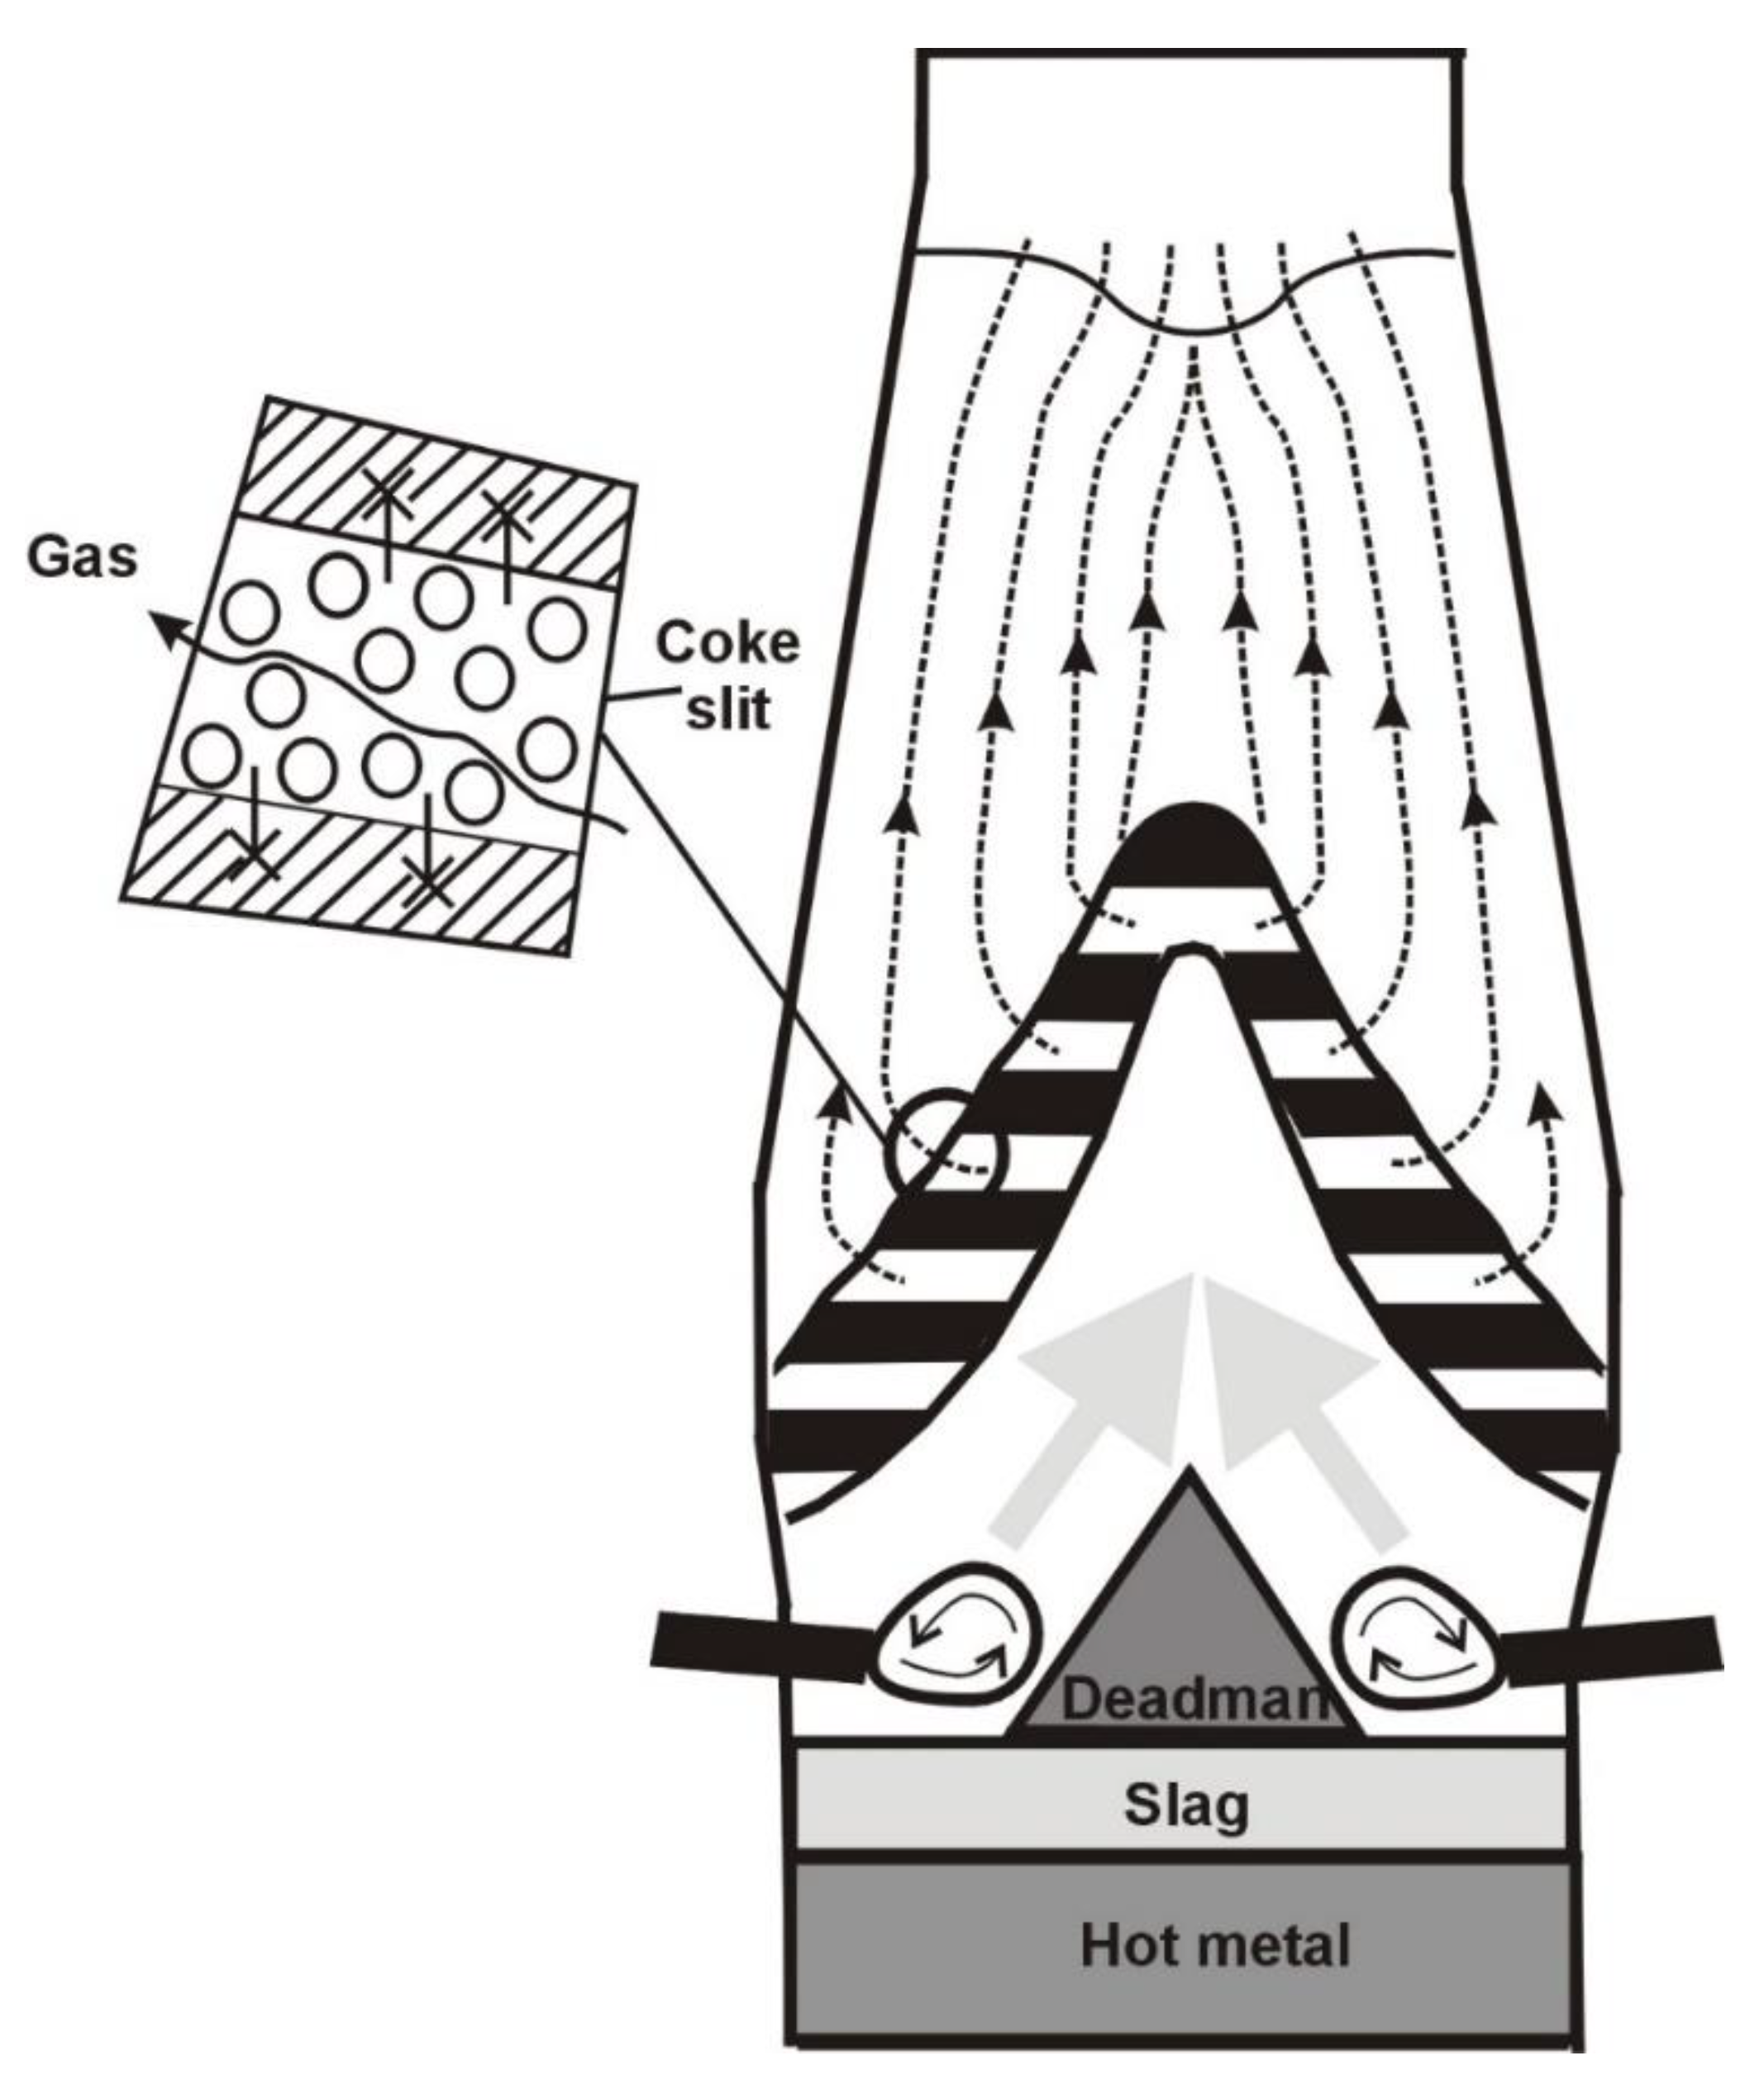
2.5. Coke Layers Situation

For the coke layers identification the following are assumed:
  • The upper boundary of the coke layer is horizontal;
  • The first coke layer in the cohesive zone always starts at the level of melting isotherm in the furnace axis (Figure 6)
  • Coke mass for each segment is reduced by carbon consumed at the direct reduction respective to the temperature of melting isotherm.
Parameters of permeable coke layers in cohesive zone can be find as following Equations (33)–(39):
U = V c h g · X c h g k = 1 8 S ( k )
Z a c t i v e = max ( k ) Z s o f t min ( k ) Z m e l t ,
n l a y e r s = X c h g · t a c t i v e
H c o k e ( k ) = G c o k e C Z ( k ) X c h g · S ( k ) · 550 ,
H o r e ( k ) = Z a c t i v e H c o k e ( k ) · n l a y e r s n l a y e r s ,
S l a y e r ( j ) = 2 · π · R m e l t ( j ) · H c o k e ( k ) ,
where: U—batch materials average descent speed, in m/h; Xchg—number of charges loaded into the furnace within 1 h, in chg/h; Vchg—bulk volume of one full charge, m3/chg; Zactive–active (permeable) height of cohesive zone, in m; τactive—average residence time of charge materials in the active part of the cohesive zone, in h; nlayers—number of coke layers, in psc; Hcoke—the height of coke layer, in m; Gcoke-CZ—coke mass lowered by carbon consumed at a direct reduction to the level of the melting isotherm, in kg/h; 550—assumed bulk density of coke, in kg/m3; Hore—the height of ore materials layer, in m; Slayer—an area of individual coke layer, in m2; Rmelt—radius of melting isotherm at individual coke layer, in m.

3. Results and Discussion

Although calculations are based on the BBP measure, another data must be provided such as:
  • Charge data (mass and chemical composition of every input material);
  • Hot blast data (input volume, moisture, oxygen enrichment, temperature, PCI technology parameters);
  • Hot metal and slag chemical composition and temperature;
  • Top gas composition and temperature.
In following tables (Table 1, Table 2, Table 3, Table 4 and Table 5) are shown the main measured data and modeling results representing the work of the blast furnace after BBP entering, which took place on 24 March 2018.
Table 1 shows the radial distribution of gas parameters obtained by BBP input and average gas parameters measured at the throat level for the whole furnace.
Table 2 shows that the materials segmental distribution sum is balanced with the entire furnace at a satisfactory level. For all materials calculation error is below 1%, despite the fact that mass exchange which takes place between the BBP and throat levels is amended according to Equation (9). However, it would be better if the material distribution was calculated based on ABP data.
In turn, from Table 3 it can be seen that quotient α in the axis region is lower than at the wall. It means that gas flux is much higher than batch flux at the axis. This is as expected since the increased axial gas flow is a prerequisite for obtaining the cohesive zone desired shape. So, the numerical calculation of α can be accepted as satisfactory. However, the K1 coefficient is also the result of numerical calculations, but its value is the result of closing the heat exchange balance between the throat and BBP levels. In the current model, the gas temperature radial distribution at the throat level is approximated according to Equation (13), so K1 values may be affected by a calculation error. On the other hand, from the temperature values shown in Table 1, it can be seen that heat exchange between the BBP and throat levels could not be omitted. The ideal solution for the direct determination of K1 is to use radius measurements on both levels with BBP and ABP. However, in lack of ABP the applied inverse method seems to be successful in the reserve zone level calculation. This is evidenced by the calculated gas temperature at the level of the burden isotherm 1000 °C; it is close to the assumed 1020 °C. Also from Figure 7, it can be seen that in the axis region the isotherm 1000 °C (red color line) is very close to BBP level and the measured gas temperature was 1024 °C. Calculations of other cases (see Supplementary Materials section) also show a good convergence of the mentioned parameters.
Table 4 shows the K2 coefficient values radial distribution, which is calculated as a heat exchange balance between the tuyeres and the isotherm 1000 °C levels. Because input data at these levels are known, the K2 values seem to be reliable. Calculated on the K2 basis levels of softening and melting isotherms are also in good convergence. However, in Figure 7, it can be seen that the shape of the cohesive zone (green color area) is generally the same as the shape of 1000 °C isotherm, which is assumed as the reserve zone level. It can therefore be concluded that in the present model the identification of the reserve zone level is of key importance. Figure 7 also shows the coke layer situation only in the active (permeable) part of the cohesive zone.
Summarizing the discussion, it should be noted that the current model uses BBP data as primary. However, when calculating the radial distribution of the charge and the heat transfer coefficient for the preparation zone, ABP was clearly missing and some simplifications were required. In the future, if possible, the model should be upgraded in accordance with the mentioned devices used, of which there should be at least two at different levels.

4. Conclusions

The paper describes the construction of a model that calculates the coke layers situation in the cohesive zone of a blast furnace; in particular, the fundamentals of mass and heat exchanges in blast furnace zones.
On the basis of measurements and chemical analyses obtained online, the model draws the situation of coke layers in the blast furnace vertical crosscut. Using only below burden probe radial data required several simplifications or assumptions in modeling. It would be much more reliable to also use the above burden probe and the profilometer. However, the presented model is satisfactory to visualize the shape of the cohesive zone and to determine the nature of the gas flow through the furnace. The model was tested in real conditions and then implemented. It can be adjusted to any blast furnace equipped with BBP only.

Supplementary Materials

The following are available online at https://www.mdpi.com/1996-1944/14/1/192/s1, zipped executable application and input data files.

Author Contributions

Conceptualization, M.B. and R.S.; methodology, R.S.; software, M.B.; validation, A.K. and M.B.; formal analysis, M.B.; investigation, A.K.; resources, A.K.; data curation, M.B.; writing—original draft preparation, M.B.; writing—review and editing, R.S.; visualization, A.K.; funding acquisition, M.B. All authors have read and agreed to the published version of the manuscript.

Funding

This research was funded by AGH University of Science and Technology, grant number 16.16.110.663

Institutional Review Board Statement

Not applicable.

Informed Consent Statement

Not applicable.

Data Availability Statement

The data presented in this study are available in the Supplementary Materials section.

Acknowledgments

Within this article, we pay tribute to all those who worked in the steel plant department of ArcelorMittal Poland in Krakow, previously Huta Tadeusza Sendzimira, former Huta Lenina, which finally decided to close in October 2020.

Conflicts of Interest

The authors declare no conflict of interest.

References

  1. Kardas, E.; Prusak, R. The influence of quality of ferrous charge materials on the efficiency of blast furnace process. Metalurgija 2020, 59, 221–224. [Google Scholar]
  2. Jursova, S.; Pustejovska, P.; Brozova, S. Study on reducibility and porosity of metallurgical sinter. Alex. Eng. J. 2018, 57, 1657–1664. [Google Scholar] [CrossRef]
  3. Kuang, S.; Li, Z.; Yu, A. Review on Modeling and Simulation of Blast Furnace. Steel Res. Int. 2018, 89, 1–25. [Google Scholar] [CrossRef]
  4. Bernasowski, M.; Klimczyk, A.; Stachura, R. Support algorithm for blast furnace operation with optimal fuel consumption. J. Min. Metall. Sect. B Metall. 2019, 55, 31–38. [Google Scholar] [CrossRef] [Green Version]
  5. Okosun, T.; Nielson, S.; D’Alessio, J.; Ray, S.; Street, S.; Zhou, C. On the impacts of pre-heated natural gas injection in blast furnaces. Processes 2020, 8, 771. [Google Scholar] [CrossRef]
  6. Geerdes, M.; Toxopeus, H.; van der Vliet, C. Modern Blast Furnace Ironmaking an Introduction; Verlag Stahleisen GmbH: Düsseldorf, Germany, 2004; ISBN 3-514-00713-6. [Google Scholar]
  7. Takahashi, H.; Tanno, M.; Katayama, J. Burden descending behaviour with renewal of deadman in a two dimensional cold model of blast furnace. ISIJ Int. 1996, 36, 1354–1359. [Google Scholar] [CrossRef]
  8. Kawai, H.; Takahashi, H.; Ichida, M. Segregation behavior for fine particles of sintered ores and coke supplied at the top of a two dimensional cold model of blast furnace. ISIJ Int. 2005, 45, 1112–1121. [Google Scholar] [CrossRef] [Green Version]
  9. Lu, Y.; Jiang, Z.; Zhang, X.; Wang, J.; Zhang, X. Vertical section observation of the solid flow in a blast furnace with a cutting method. Metals 2019, 9, 127. [Google Scholar] [CrossRef] [Green Version]
  10. Itaya, H.; Aratani, F.; Kani, A.; Kiyohara, S. A Multi-Cylindrical Model of Blast Furnace. Kawasaki Steel GIHO 1981, 13, 49–58. [Google Scholar]
  11. Yu, X.; Shen, Y. Model Study of Blast Furnace Operation with Central Coke Charging. Metall. Mater. Trans. B 2019, 50, 2238–2250. [Google Scholar] [CrossRef] [Green Version]
  12. Yu, X.; Shen, Y. Model study of central coke charging on ironmaking blast furnace performance: Effects of charing pattern and nut coke. Powder Technol. 2020, 361, 124–135. [Google Scholar] [CrossRef]
  13. Li, M.; Wei, H.; Ge, Y.; Xiao, G.; Yu, Y. A mathematical model combined with radar data for Bell-Less charging of a blast furnace. Processes 2020, 8, 239. [Google Scholar] [CrossRef] [Green Version]
  14. Yu, X.; Shen, Y. Modelling of Blast Furnace with Respective Chemical Reactions in Coke and Ore Burden Layers. Metall. Mater. Trans. B 2018, 49, 2370–2388. [Google Scholar] [CrossRef]
  15. Li, H.; Saxén, H.; Liu, W.; Zou, Z.; Shao, L. Model-based analysis of factors affecting the burden layer structure in the blast furnace shaft. Metals 2019, 9, 1003. [Google Scholar] [CrossRef] [Green Version]
  16. Ariyama, T.; Natsui, S.; Kon, T.; Ueda, S.; Kikuchi, S.; Nogami, H. Recent progress on advanced blast furnace mathematical models based on discrete method. ISIJ Int. 2014, 54, 1457–1471. [Google Scholar] [CrossRef] [Green Version]
  17. Geleta, D.D.; Lee, J. Effects of Particle Diameter and Coke Layer Thickness on Solid Flow and Stress Distribution in BF by 3D Discrete Element Method. Metall. Mater. Trans. B 2018, 49, 3594–3602. [Google Scholar] [CrossRef]
  18. Baniasadi, M.; Peters, B.; Pierret, J.C.; Vanderheyden, B.; Ansseau, O. Experimental and numerical investigation into the softening Behavior of a packed bed of iron ore pellets. Powder Technol. 2018, 339, 863–871. [Google Scholar] [CrossRef]
  19. Zhou, C.; Tang, G.; Wang, J.; Fu, D.; Okosun, T.; Silaen, A.; Wu, B. Comprehensive Numerical Modeling of the Blast Furnace Ironmaking Process. JOM 2016, 68, 1353–1362. [Google Scholar] [CrossRef]
  20. Yu, X.; Shen, Y. Computational Fluid Dynamics Study of the Thermochemical Behaviors in an Ironmaking Blast Furnace with Oxygen Enrichment Operation. Metall. Mater. Trans. B 2020, 51, 1760–1772. [Google Scholar] [CrossRef]
  21. Jiao, L.; Kuang, S.; Yu, A.; Li, Y.; Mao, X.; Xu, H. Three-Dimensional Modeling of an Ironmaking Blast Furnace with a Layered Cohesive Zone. Metall. Mater. Trans. B 2020, 51, 258–275. [Google Scholar] [CrossRef]
  22. Zhou, P.; Jia-ling, L.; Qi-quan, W.; En-xue, Z.; Wei-hua, G.; Zhou, C.Q. Soft-sensing method of cohesive zone shape and position in blast furnace shaft. IFAC-PapersOnLine 2018, 51, 48–52. [Google Scholar] [CrossRef]
  23. Okosun, T.; Silaen, A.K.; Zhou, C.Q. Review on Computational Modeling and Visualization of the Ironmaking Blast Furnace at Purdue University Northwest. Steel Res. Int. 2019, 90, 1–16. [Google Scholar] [CrossRef]
  24. Lichtenegger, T.; Pirker, S. Toward Data-Assisted Particle-Fluid Simulations of Heat Transfer in Blast Furnaces. Steel Res. Int. 2020, 2000132. [Google Scholar] [CrossRef]
  25. Hou, Q.; Dianyu, E.; Kuang, S.; Yu, A. A Transient Discrete Element Method-Based Virtual Experimental Blast Furnace Model. Steel Res. Int. 2020, 91, 1–11. [Google Scholar] [CrossRef]
  26. Wei, G.; Zhang, H.; An, X.; E, D. Numerical investigation on the mutual interaction between heat transfer and non-spherical particle dynamics in the blast furnace raceway. Int. J. Heat Mass Transf. 2020, 153, 119577. [Google Scholar] [CrossRef]
  27. Li, Z.; Kuang, S.; Liu, S.; Gan, J.; Yu, A.; Li, Y.; Mao, X. Numerical investigation of burden distribution in ironmaking blast furnace. Powder Technol. 2019, 353, 385–397. [Google Scholar] [CrossRef]
  28. Dong, Z.; Wang, J.; Zuo, H.; She, X.; Xue, Q. Analysis of gas–solid flow and shaft-injected gas distribution in an oxygen blast furnace using a discrete element method and computational fluid dynamics coupled model. Particuology 2017, 32, 63–72. [Google Scholar] [CrossRef]
  29. Agrawal, A. Blast Furnace Performance Under Varying Pellet Proportion. Trans. Indian Inst. Met. 2019, 72, 777–787. [Google Scholar] [CrossRef]
  30. Guha, M. Revealing cohesive zone shape and location inside blast furnace. Ironmak. Steelmak. 2018, 45, 787–792. [Google Scholar] [CrossRef]
  31. Benesch, R.; Ledzki, A.; Kopec, R.; Stachura, R.; Wilkosz, A. Identification of the cohesive zone in the blast furnace. Arch. Metall. 1992, 37, 115–127. [Google Scholar]
  32. Stachura, R.; Bernasowski, M.; Klimczyk, A.; Ledzki, A. The importance of the thermal reserve zone position determining in blast furnace. In Proceedings of the METAL 2014: 23rd International Conference on Metallurgy and Materials; TANGER LTD: Brno, Czech Republic, 2014; pp. 182–185. [Google Scholar]
  33. Small, J.; Adema, A.; Andreev, K.; Zinngrebe, E. Petrological study of ferrous burden-crucible interaction in softening & melting experiments: Implications for the relevance of pressure drop measurements. Metals 2018, 8, 1082. [Google Scholar] [CrossRef] [Green Version]
  34. Shatokha, V.; Velychko, O. Study of softening and melting behaviour of iron ore sinter and pellets. High. Temp. Mater. Process. 2012, 31, 215–220. [Google Scholar] [CrossRef]
  35. Ma, K.; Xu, J.; Deng, J.; Wang, D.; Xu, Y.; Liao, Z.; Sun, C.; Zhang, S.; Wen, L. Transient Interaction Between Reduction and Slagging Reactions of Wustite in Simulated Cohesive Zone of Blast Furnace. Metall. Mater. Trans. B 2018, 49, 2308–2321. [Google Scholar] [CrossRef]
  36. An, X.W.; Wang, J.S.; Lan, R.Z.; Han, Y.H.; Xue, Q.G. Softening and Melting Behavior of Mixed Burden for Oxygen Blast Furnace. J. Iron Steel Res. Int. 2013, 20, 11–16. [Google Scholar] [CrossRef]
  37. Kumar, V.; Patil, D.; Mrunmaya, K.P.; Sah, R.; Ranjan, M. Impact of Sinter Basicity and Alumina on Softening Melting Behavior in Blast Furnace. Trans. Indian Inst. Met. 2019, 73, 365–375. [Google Scholar] [CrossRef]
  38. Li, Y.-F.; He, Z.-J.; Zhan, W.-L.; Kong, W.-G.; Han, P.; Zhang, J.-H.; Pang, Q.-H. Relationship and Mechanism Analysis of Soft-Melt Dropping Properties and Primary-Slag Formation Behaviors of the Mixed Burden in Increasing Lump Ore Ratio. Metals 2020, 10, 1254. [Google Scholar] [CrossRef]
Figure 1. Permeability of cohesive zone in a blast furnace.
Materials 14 00192 g001
Figure 2. Dividing of working space according to BBP geometry and location of heat and mass exchange zones in BF.
Materials 14 00192 g002
Figure 3. Calculation scheme of gas distribution at the throat level.
Materials 14 00192 g003
Figure 4. Assumptions for producing zone.
Materials 14 00192 g004
Figure 5. Algorithm of softening and melting isotherm levels calculations for each segment.
Materials 14 00192 g005
Figure 6. Coke layers calculation assumptions.
Materials 14 00192 g006
Figure 7. An example of cohesive zone geometry and coke layers situation.
Materials 14 00192 g007
Table 1. Gas characteristics at the BBP and throat levels.
Measurement PointTemperature, °CCO, vol.%CO2, vol.%H2, vol.%
1102442.810.256.77
285937.6710.044.45
364927.9116.134.68
455220.4321.864.92
544320.4022.354.02
642220.0524.253.38
734420.1424.462.64
834621.3422.142.84
Throat16023.2821.873.75
Table 2. Hot blast and charge material segmental distribution.
Segment NumberHot Blast, m3/hCoke, kg/chgSinter1, kg/chgSinter2, kg/chgPellets1, kg/chgPellets2, kg/chgCoke Nut1, kg/chgFlux1, kg/chg
1249012090413752224
2944355387739935650613639
316,509869157871764091014470
421,6621101228910419281320137102
527,65214223083140212511778177137
631,98817464089185916592359260182
737,51020554926224019982841302220
847,00724495463248422163151312244
Sum194,22210,31522,39510,183908412,9161490999
Furnace 1194,22210,33922,20410,096900713,00014981000
Error,%0.000.180.860.860.850.640.530.10
1 Measured data.
Table 3. Reserve zone parameters and situation.
Segment Numberα, -K1, MJ/h∙m3∙°CtZ, °CZ1000, m
10.638328.981020.15.22
20.688313.821020.16.95
30.73848.721020.210.48
40.78857.411020.212.70
50.83866.631020.316.72
60.88858.691020.315.96
70.938610.091020.418.88
80.988621.861020.316.68
Table 4. Producing zone parameters and cohesive zone situation.
Segment NumberK2, MJ/h∙m3∙°CZsoft = Z1095, mZmelt = Z1279, m
141.737.9010.76
223.0010.4213.07
320.1513.6916.46
417.0315.7618.56
514.8619.8222.58
612.6719.1821.87
711.6622.1524.81
811.8219.9822.64
Table 5. Cohesive zone geometry.
Top Situation, mFoot Situation, mActive Height, mCoke Layers Number, pcsTotal Area of Coke Layers, m2
7.9024.8111.3911124
Publisher’s Note: MDPI stays neutral with regard to jurisdictional claims in published maps and institutional affiliations.

