1. Introduction
A compressed air system (CAS) is an energy system that utilizes compressed air as a medium for storing and transmitting energy. Compressed air is used for various purposes, such as energy storage, powering machines and devices, and controlling production lines. These systems are widely used in various industrial applications to power machinery, control processes, and automate production lines [
1]. The operation of these systems involves the conversion of electrical energy into compressed air energy (compressor) and the reverse conversion of compressed air energy into mechanical energy (actuator, motor). The compressed air system played a significant role in the third industrial revolution by automating manufacturing activities, which revolutionized production lines in manufacturing plants. The advantages of compressed air systems include simplicity, reliability, the ability to automate various processes, and a relatively low environmental impact [
2]. However, a significant drawback of CAS is their relatively low energy efficiency, making compressed air the most expensive energy medium, more expensive than natural gas, steam, or electricity [
3]. Energy efficiency is a measure of the usable energy compared to energy input, which indicates the amount of energy lost in a given process. Generally, systems with more components tend to have greater energy loss and lower energy efficiency.
CAS are extensively used in various industries such as textiles, furniture, paper, glass, mechanical, plastics, automotive, transport, chemistry, magnetics, food, paper, and steel [
1,
4,
5,
6,
7,
8]. Entrepreneurs value compressed air systems due to their simple technology, high power density, ability to generate substantial forces, lower initial investment costs, ease of development, high reliability, and easy maintenance [
2]. The popularity of compressed air is evident from its estimated contribution of up to 10% of electricity consumption in the industrial sector in the USA [
9], EU [
1], Japan [
2], and China. As mentioned above, the main drawback of compressed air systems is their low energy efficiency, with only 5–10% of the electrical energy input to the compressor effectively being utilized in pneumatic actuators or motors [
1,
9]. Other disadvantages of compressed air systems include low precision in motion control [
10], noise [
11,
12], and significant air leaks [
1]. As a result, the Compressed Air and Gas Institute (CAGI), the European Association of Manufacturers of Compressors, Vacuum Pumps, Pneumatic Tools and Air and Condensate Treatment Equipment (PNEUROP), and entrepreneurs are actively looking for solutions to address this energy loss issue [
13,
14]. Moreover, the EU directive on European energy targets for 2030 requires a minimum 32.5% improvement in process energy efficiency and a minimum 40% reduction in greenhouse gas emissions compared to 1990 levels. Ongoing efforts are being made to improve the efficiency of CAS and address environmental concerns related to their energy usage. Modern energy management in manufacturing plants is focused not only on investments in renewable energy sources, but also on reducing energy losses and utilizing waste energy to increase energy efficiency [
15,
16]. Consequently, reducing energy consumption in manufacturing plants contributes to increased energy security, lower energy costs, and environmental protection.
Therefore, scientists and researchers are quite well-versed on the topic of compressed air systems, particularly investigating the possibilities of improving energy efficiency, reducing noise, and increasing operational precision. To provide better guidance, numerous review studies have been written. An important study, published in 2008 by Radgen and Blaustein [
9], included the use of electricity for the production of compressed air in the world and by individual industry sectors. They indicated that 25–35% of the energy consumed by the compressor could be economically saved. They pointed out that the utilization stage has the greatest potential for energy savings but that the solutions are the most difficult to implement. They indicated general areas and solutions that, when applied, could bring tangible energy savings benefits. This is a geographical and economic overview of the courses of action proposed to improve the energy efficiency of CAS. Saidur et al. [
1] pointed out activities, mainly in the compression section of a CAS, that contribute to energy savings. They evaluated applicability, payback, and energy gains. Harris et al. [
17] presented state-of-the-art methods for optimizing the dynamics of actuator operation and saving compressed air consumption; however, this is no longer up-to-date. Nehler et al. [
4] presented the energy and non-energy benefits of various energy efficiency measures. They also presented the potential for these actions to be implemented in CAS. They focused on general actions that can be taken and their effectiveness in optimizing the supply and demand side. Unger and Radgen [
8], Merkelbach et al. [
18], and Herrera et al. [
19] estimate that the energy efficiency of pneumatic systems can be improved by up to 80%. Dindorf et al. [
20,
21] presented an overview of compressed air receiver tanks and their impact on energy efficiency and storage. Trianni et al. [
22] focused on assessing energy efficiency measures in terms of economics, energy, complexity, compatibility, and observability factors. They attempted to systematize the factors that describe CAS in the literature and presented a model whose mission was to assist in the decision-making process regarding improving the energy efficiency of CAS. Benedetti et al. [
23] proposed an energy efficiency maturity model for compressed air systems that could assist companies in identifying managerial and organizational improvements and which was validated in three case studies. Current reviews of the literature on CAS energy efficiency are no longer up-to-date or focus mainly on the overall process parameters or compression process to find energy savings benefits rather than focusing on structural solutions. The literature lacks a review of solutions that reduce the oversizing of pneumatic actuators in the utilization stage and reduce air overconsumption. On the other hand, there are a large number of technical solutions in the literature, with over 45 papers regarding the optimization of the utilization stage, resulting in the need to analyze, systematize, and classify. This review article is intended to fill the literature gap on solutions to reduce the oversizing of actuators in the utilization stage of the compressed air system and to indicate the best technical solutions that can be used. The paper characterizes CAS and the processes that occur in the utilization stage, and it attempts to propose a division of methods to reduce oversizing into three groups related to the thermodynamic cycle occurring in actuators. Their potential compressed air energy savings and the complexity of their implementation were compared.
2. Review Methodology
Finding current knowledge on the energy efficiency of compressed air systems and their utilization posed a challenge. The review process involved searching, selecting, and analyzing literature related to industrial compressed air systems and associated technical devices.
Section 1, Introduction, discussed a literature gap that focuses on review articles addressing energy efficiency and energy losses in compressed air systems, highlighting the novelty of this paper.
Section 2 shows the methodology used in the paper.
Section 3, Overview of Energy Overconsumption in Compressed Air Systems, introduces the overconsumption phenomenon in the utilization stage, attributed to the complexity and oversizing of actuators. Next,
Section 4, Assessment of Current Energy and Exergy Losses, details where they occur within the system as well as their sources and methods for reduction. Specifically, the section outlines the energy savings method in the utilization stage.
Section 5, Classification of Energy Savings Solutions in the Utilization Stage, presents a proposed classification of energy-saving methods based on the theory of air power. Technical solutions and their classification for each method are presented. Finally,
Section 6, Conclusions and Future Directions, summarizes the entire paper.
In order to gather relevant information, the researchers utilized online publication databases such as Scopus, IEEE, ResearchGate.net, Web of Science, Springer Link, Wiley Online Library, and Google Scholar, employing keyword search methods to find publications, patents, standards, and post-conference publications. Keywords were defined as follows: compressed air, exergy analysis, energy analysis, pneumatic system, actuator oversizing, energy recovery, pneumatic actuator, air overconsumption, exhaust air, exhaust air recovery, cut off supply, intermittent air supply, energy efficiency, energy savings, air power, transmission power, expansion power, recycling, energy optimization, compressor, compressor losses, heat losses, and leakage. These were used for search optimization. The researchers used the one thing led to another method of searching the bibliography for the found publications. Selected works were assessed to determine whether they were published within the last 5 years and how essential they were to the research topic. If works older than 5 years were deemed highly significant, unique results were taken into account. The selection of publications for review was guided by evaluation criteria, including the verifiability, authenticity, and reliability of data, whether experimental or computational research had been conducted, comparison to other data, thematic relevance, publication timeliness, scientific validity, source reputation and prestige, originality and innovativeness, completeness and comprehensiveness.
3. Overview of Energy Overconsumption in Compressed Air Systems
Figure 1 shows the typical topology of an industrial compressed air system (CAS).
The production stage is divided into two sub-stages: compression (compressor) and preparation (cooler, filter, and dryer). The compressed air production stage includes the compression sub-stage in piston, axial, or screw compressors, of which the latter are the most popular due to their durability and lack of work breaks needed for cooling [
24]. A typical CAS uses compressors with a constant speed of the electric motor. This means that the compressor does not work directly from the utilization stage, and the compressor is on/off. After compression, the process of providing the proper quality of compressed air takes place in the preparation sub-stage. The air is cooled, dried, and filtered to meet the appropriate quality class (standard). Depending on the purpose of the air, there are seven classes that differ in the content of moisture, solid particles, and oil. In some applications, the air is also lubricated [
25]. The compressed air prepared in this way goes to the tank. The typical gauge pressure in the tank and CAS system is 6 to 8 bar.
3.1. Complexity
The compressed air utilization stage is a distributed system consisting of production lines that use compressed air energy to power pneumatic machines (end devices) made up of actuators. An actuator is a mechanical device that converts the energy of compressed gas into the mechanical energy of the translation movement of a moving piston, called the stroke. There are extend and retract strokes, i.e., departing and returning movements, respectively. In the actuator, we distinguish the extend and retract chambers depending on which chamber is supplied with compressed air for a given movement. The direction of movement of the piston in the actuator is controlled sequentially by feeding the appropriate chamber, i.e., by supplying compressed air from the tank. This, in turn, is controlled by directional control valves, which are two-state or three-state valves. This means that they alternately connect a given chamber with the tank when supplying or with the ambient air via a muffler when venting. The CAS system is complemented by pneumatic lines used to distribute air between the elements. The compressed air demand of the actuators depends on the dynamics of their operation. This, in turn, results from the geometry, load, and pressure in the installation.
On the scale of an entire industrial plant, the utilization stage may consist of dozens or hundreds of machines connected to one tank, and the number of actuators in these machines may reach hundreds or thousands. In addition, there are valves or valve islands, cables, and a muffler for each actuator/actuator group. As a result, CAS are characterized by high complexity, i.e., a large number of basic elements connected in a distributed way and operating quasi-randomly [
26]. This presents CAS as structurally complex installations which cannot be standardized due to the specificity of each manufacturing plant.
3.2. Oversizing
Each actuator is designed to move a known mass
m (load) a specified distance
s (stroke) in an expected time
t. In addition, it takes in a certain amount of air at pressure
to generate the appropriate force that will overcome all resistance to movement and perform the movement in the assumed time. The amount of force generated depends on the pressure difference between the sides of the piston and its surface. In fact, what is most important is the dynamics of the piston movement, which can be analyzed in the context of the piston movement speed and the air inflow speed through the actuator ports.
Figure 2 illustrates the typical pressure dynamics inside an actuator. In fact, the force generated by the actuator is dynamic. It results from the relationship between the speed of the inlet and outlet air streams and the speed of piston movement. Classically, the operation/movement of the actuator is as follows. Point 0 is the moment of switching the control valve to supply the extend chamber and vent the retract chamber. In the first stage of movement (0–1), the free volumes in the actuator (mainly dead volumes: residual volume in the actuator, volumes in the pneumatic conduits) are filled to the supply pressure. At the same time, in the extend chamber, air is exhausted into the environment, and the pressure drops. The air inflow and outflow velocities define the position of point 1, at which the pressure in the extend chamber is appropriate to overcome the resistance to movement (friction, pressure in the retract chamber, load). The actuator piston begins to move, usually faster than the inflow of compressed air, which causes the pressure in the chamber to drop. At the same time, the pressure in the retract chamber drops to ambient pressure. The stabilization of both pressures defines point 2, at which the piston movement changes to a steady or quasi-steady state. Points 2–3 are the steady movement of the piston. The smaller the load, the greater the pressure drop in the extend chamber during steady movement, because less force is required to move the mass. This phenomenon determines the adaptability of the force generated by the actuator to the demand. In fact, an actuator controlled in this way will never achieve a constant speed of movement, but the momentary acceleration will decrease. At point 3, the actuator piston reaches its extreme position and stops. However, there is still an inflow of compressed air into the extend chamber, and the pressure increases to the supply pressure (3–4). This means that one movement of the actuator will always consume air with a mass corresponding to the volume of the total chamber and the supply pressure. In the retract movement, all the energy stored in this volume will be expelled as waste. Consequently, as the actuator piston moves at a higher speed, the volume change of the actuator chamber exceeds the speed of the mass flow of air entering the volume. This leads to a greater pressure drop
in the chamber. The dynamics of the actuator piston are the result of unbalanced forces acting on the piston. Any increase in pressure in the actuator volume above the pressure determined by the mass balance dynamics and volume expansion is unnecessary and wastes energy. In other words, the force needed to move the mass
m is smaller than the force resulting from the supply pressure and the area of the piston
. This phenomenon is known as oversizing.
Ideally, the actuator should move a given mass a distance
s with an infinitesimal speed. Therefore, when selecting the actuator, the optimal average speed of the extend movement of the piston is assumed to be in the range of 0.2 to 0.5 m/s or, in special applications, 1 m/s [
26,
27]. The minimum force should exceed the load by at least 33%. However, in real-world scenarios, it is advisable for the force to surpass the load by 50% to accommodate external factors like friction, inertia, and air leakage. According to the recommendations of Fleischer [
26], Beater [
28], the piston diameter should be twice as large as that resulting from the load in order to achieve the desired actuator cycle time, which defines a certain degree of over-dimensioning at the very beginning. Furthermore, the oversizing of a pneumatic actuator is a consequence of the standardized internal design described by the piston diameter, stroke, inlet/outlet ports, and dead volume, and the external infrastructure described by the directional control valve, pneumatic lines, and silencers. These elements are resistors. Several ISO standards provide detailed guidance on the geometric dimensions of commercially available components. Linear actuators should be made in accordance with the ISO 8140 [
29], ISO 15552 [
30], ISO 6432 [
31], and ISO 21287 [
32] standards, which specify that they should have discrete values for the diameters of the pistons, piston rods, and the diameters of the inlet and outlet ports. This implies that the additionally selected actuator is oversized due to the discrete series of types of piston, piston rod, and inlet connector diameters. Many actuator manufacturers define the mechanical properties of a pneumatic actuator, such as locking capacity, maximum piston rod speed, holding force, and number of duty cycles. To meet operating conditions, larger actuators are often selected for a wider range of loads. As a result, the actuator must be oversized to accommodate the limited range of the pneumatic actuator [
33]. However, due to the selection of oversized actuators, the actual dynamics of their movement may not correspond to the design assumptions, i.e., the average piston speed is higher as well as the displacement volume. In general, oversizing contributes to higher consumption of compressed air than if it were perfectly matched and contributes to the deterioration of the energy efficiency of the entire system.
Doll et al. [
34] presented the pneumatic frequency ratio (
) as a metric for evaluating actuator oversizing. This parameter is influenced by the transition time (
), supply pressure (
p), mass (
m), stroke (
), and piston cross-sectional area (
A).
If this parameter exceeds a value of 2.2, it signifies that the actuator is oversized. Nevertheless, the ideal range for this parameter is between 1.1 and 1.7. The specific scale of the pneumatic frequency ratio (PFR) is detailed in
Table 1.
This parameter was derived from the dependence of the eigenfrequencies during the operation of the pneumatic actuator. It assumes the phenomenon of similar operation of actuators. Pneumatic actuators should oscillate close to a PFR of 1, where energy consumption is minimal. However, it induces a quasi-static process, i.e., a process occurring infinitely slowly. This is the limit value for which we obtain a balance between the force generated by the piston and the load. Therefore, a well-selected actuator assumes a stroke in a certain finite time with a low piston movement speed of up to 0.5 m/s. Therefore, the optimal PFR range is 1.1–1.7.
4. Assessment of Current Results of Energy and Exergy Losses
There are only a few publications in the literature that present an analysis of the energy or exergy of classical CAS, shown in
Table 2. The estimated levels of energy and exergy losses in individual components of the compressed air system are presented, indicating the key elements in the system. The energy analyses shown by Shi et al. [
35], Krichel et al. [
36] indicate the efficiency of use of compressed air energy at the level of 7–8%. These are static analyses with rigidly adopted system parameters, addressing the efficiency of components such as the actuator, compressor, etc. In addition, they focus mainly on the air compression and preparation stage.
The analyses of Shi et al. [
35], Krichel et al. [
36] show significant discrepancies, especially in terms of the energy loss during compression (38.8% and 86.7%) and the remaining energy available in the utilization stage (41.0% and 6.9%). However, they are similar when it comes to the energy efficiency of air energy in the utilization stage, that is, 7–8%. In the case of exergy analysis, the number of items is larger but differs in scope. Most publications focus on the static analysis of the compression and preparation stage and less on the utilization stage. This is due to the difficulty of performing dynamic analysis. Static exergy analyses agree more regarding compression losses (38%) and exergy delivered to the utilization stage (43–55%), with a result that deviates to 85%. However, there are even fewer exergetic analyses of the utilization stage. Currently, two of those presented focus on the entire CAS [
38] and the other only on the utilization stage [
39]. The presented exergy losses in individual elements (pneumatic line, directional control valve, actuator, muffler, and output) differ significantly. This is due to the great diversity in the shaping of CAS parameters, such as lengths of pneumatic lines, diameters, number and size of valves, number and size of actuators, dead volumes, etc., which largely makes it difficult to obtain repeatable results from the exergy analysis of the dynamics of the utilization stage. Furthermore, the exergy analysis tool has been used in other studies [
18,
40,
41,
42] to assess the exergy efficiency of various CAS configurations. Rakova and Weber [
40] conducted a calculation of the exergy flow and accumulated exergy of individual pneumatic components, examining the transient exergy flow within each component. Exergy calculations reveal the behavior of pneumatic elements resembling pneumatic resistors, leading to a pressure drop during dynamic pneumatic system operations. Harris et al. [
41] briefly presented the role of exergy analysis in assessing energy efficiency and presented an indicator for the assessment of exergy efficiency. J. K. Bader [
42] contributed to the knowledge about the exergy efficiency of pneumatic systems; they presented a static account of the exergy balance for individual components. Using air power, they estimated the exergy efficiency to be 53% and 26% for loaded and unloaded running, respectively. They exergetically evaluated various case studies optimizing CAS operation. Merkelbach and Murrenhoff [
43] conducted an experimental and computer comparison of compressed air exergy consumption for various operating configurations: actuator orientation (vertical, horizontal), previous shut-off, cross-flow, and single-acting. It was indicated that the largest exergy losses in the compressed air system are for the compressor (almost 40%) and the use of compressed air (40–50%). The literature lacks an exergy analysis of processes including individual CAS stages. It is difficult to draw conclusions regarding exergy efficiency from the current analyses due to large discrepancies and a small number of studies. Almost all energy and exergy analyses are based on static balances and do not take into account the dynamics of air expansion processes. Moreover, each analysis has a different calculation methodology, which is why the results are very divergent. The configuration of process and structural parameters means that any result can be achieved. However, there is a lack of a full comparison of exergy analysis with experimental data, except in Merkelbach et al. [
18], which shows partially experimental data for exergy analysis in CAS.
4.1. General Classification of Losses in Compressed Air Systems
As highlighted above, the CAS energy/exergy efficiencies of compressed air energy consumption are 6–7% (see
Table 2). This results from the oversizing of components, especially actuators, and the complex structure of the CAS installation, characterized by high dissipation and dynamics. An unmet challenge is the appropriate selection, implementation, and integration of all components within all stages in CAS. The energy losses that occur in the installation can be divided into two main types: system losses, which result from the efficiency of components and processes, and operational losses, attributable to use and consumption [
17,
44]. System losses are further classified according to the specific CAS stage: compression, preparation, storage, and utilization. The classification of energy losses in CAS is shown in
Table 3. In the compressor, losses arise from the compression and mechanical process, the no-load mode, and heat losses. Subsequent energy losses occur during air preparation, including heat loss and pressure drops throughout the dryer, filter, and air cooler. The storage and distribution stage introduces energy losses through pressure drops in pneumatic lines and the air tank. Finally, in the utilization stage, pneumatic actuators, directional control valves, mufflers, and pneumatic lines contribute to energy losses, including dead volumes, mechanical losses, expansion losses, and oversizing. Operational losses associated with CAS include factors such as air leaks, excessive friction, clogged filters and mufflers, and broadly understood compressor operation. As shown in
Table 3, the compression and utilization stages are those mainly responsible for energy losses in CAS, which also coincides with exergy analyses. Currently, there are many methods in the literature to increase energy efficiency by searching for energy savings in CAS. Given the inherent complexity of the systems, energy gains can be made at any stage of the system and from any component. Harris et al. [
45] proposed the following division of methods aimed at increasing the energy efficiency of the system: preventing energy losses (air leaks, pressure drops, and minimizing dead volume), minimizing energy consumption (controlling pressure and mass air flow, oversizing pneumatic actuators), and waste energy recovery (heat, expansion energy, and kinetic energy).
Hepke and Weber [
44] introduced the division of CAS energy optimization methods into two groups, improving the ratio of energy consumed to useful energy and energy recovery [
44]. Zein et al. [
46] also classified energy savings in CAS as energy minimization, energy reuse, and energy recovery. The above classifications provide a definitive division of methods for increasing savings into loss prevention, consumption minimization, and energy recovery. The methods of improving energy efficiency can also be classified according to the place of occurrence: the compression and preparation stage (supply side) and the utilization stage (demand side) [
4].
4.2. Overview of General Energy-Saving Solutions in Compressed Air Systems
Table 4 shows the potential energy savings for different solutions in the compression and preparation stage. The most significant energy losses in the supply side of a pneumatic system occur during the compression stage. Various strategies have been proposed to reduce energy consumption in the compressor. The proposed solutions are to reduce the outlet pressure [
1,
3,
9,
42,
47,
48], reduce the temperature of the intake air [
1,
3,
9,
42,
47], recover heat [
1,
9,
42,
49,
50], minimize the use of air [
1,
9,
42,
48], select the appropriate compressor [
3,
9,
42,
47], and use a variable-speed motor [
1,
49,
51,
52]. For example, in a study conducted by J. K. Bader [
42], the exergy analysis of five different compressor modifications was explored: pressure reduction, reduction in intake air temperature, heat recovery, reduction in air consumption, and correct compressor selection. The results showed modest improvements in exergy efficiency with a reduction in inlet air pressure and temperature to 1.3% and 0.6%, respectively. In particular, significant reductions in compressor electrical power consumption were achieved through heat recovery (5%) and a decrease in compressed air demand (7.5%). Reducing the demand for compressed air is a broad concept and concerns the overall reduction of the air mass flow in the installation. This results in less load on the compressor or replacement with a smaller unit. Energy savings by selecting the appropriate compressor size for the pneumatic system can reach up to 49% [
3,
42].
The reduction of air overconsumption in CAS is general and is achieved mainly by reducing air leaks and air consumption in the actuators, i.e., in the utilization stage. Air overconsumption results from oversized pneumatic elements, especially actuators, which consume more air than they need to perform their task. This translates into greater air demand, a larger compressor, and additional air leaks. Solving this problem is of key importance to the energy optimization of CAS installations. The degree of air savings depends on the degree of oversizing of the actuators, and the optimization of the processes occurring in them has a major impact on the amount of air consumed. These methods are described in more detail in
Section 5.
Another approach to increase compression efficiency is to manage excess heat in isothermal compressors [
58,
59], which results in approximately 3–5% energy savings compared to adiabatic compression. However, the pressure obtained with the compressor is much lower than for classic compressors. Zahlan and Asfour [
61] investigated the impact of eight selected compressor locations on energy savings. They achieved maximum energy savings of 11%. Conversely, Saidur et al. [
1] emphasized heat recovery as the most efficient method with the potential for energy savings. The recovery and utilization of heat from the compression process can result in energy savings of 2–25% and increase the efficiency of the compressor to 80–90% [
1,
9,
42,
49,
50]. Krichel and Sawodny [
36] achieved substantial exergy savings (14.8%) by recovering waste heat from the compressor. Addressing variable air demand, Mousavi et al. [
49] analyzed a system with one fixed-speed drive compressor meeting basic demand and two variable-speed drive compressors for peak demand. They found that optimal electricity consumption was achieved with a ratio of 60% of the compressed air supplied by the FSD compressor and the remainder supplied by the VSD, resulting in energy savings of 34%. Liu et al. [
48] proposed an optimal control algorithm for screw compressors, which achieved up to 7.5% in energy savings through appropriate online and offline pressure settings. A different approach was suggested by Wang et al. [
60], which involved replacing an isochoric compressed air tank with an isobaric tank. This modification, operating at 4 bar, led to energy savings of 18% and a reduction in system pressure fluctuations by more than 2%. The exergy efficiency of the system using the isobaric tank was 52.9%, while the traditional isochoric tank achieved an exergy efficiency of 45.8% [
38].
The energy efficiency in pneumatic systems can be improved by conducting a systematic evaluation and improvement of the operational and maintenance factors [
9]. These factors mainly refer to the use of energy rather than the inherent characteristics of CAS. Important aspects to consider include:
Eliminating air leaks: It should be noted that significant energy losses can result from air leaks in pneumatic lines and connections [
1]. Strategies aimed at eliminating air leaks have been identified as effective approaches to conserve the installation ([
1,
3,
4,
53]). According to Dindorf [
47], addressing leaks in pneumatic lines can result in energy savings ranging from 15% to 50%. Furthermore, Saidur et al. [
1] demonstrated that even a small hole measuring 1 mm can result in energy losses of 1500 kWh per year, while a larger hole measuring 10 mm can lead to annual energy losses of 218,500 kWh at a gauge pressure of 6 bar.
Maintenance strategies: Consistent maintenance strategies, such as filter and muffler replacement, as well as reducing the pressure on the components, play a crucial role in energy conservation ([
3,
4,
47]). Furthermore, regular inspections of regulator valves, filters, lubricators, dryers, and condensers can result in energy savings of approximately 2% in pneumatic systems [
47]. Moreover, Dindorf and Wos [
53,
62] have proposed specific approaches for measuring and identifying air leaks.
Optimization of the pneumatic network: The optimization of the pneumatic network, which involves analyzing factors such as length, diameter, and pneumatic fittings, has been shown to result in energy savings of approximately 12% [
4,
54,
55,
56]. In simulations conducted by Sambandam et al. [
57], it was found that the use of properly shaped elbows in the installation can lead to energy savings of up to 0.04% per elbow.
Monitoring systems: Monitoring systems play a crucial role in tracking energy consumption and thermodynamic parameters in pneumatic systems. Negligence in the air preparation system can lead to disruptions and failures in system operation, affecting filters and mufflers. The use of poor-quality compressed air can result in various issues, such as reduced clamping force, slower movement speed, pressure drop, faulty valve operation, and overall deterioration of system components [
25].
Diagnostic devices: Devices designed to evaluate pneumatic power parameters, such as the diagnostic tool created by Cai et al. [
63,
64], can be beneficial for system diagnostics. This particular device uses air flow, temperature, and air mass flow measurements at specific locations within the CAS to assess air power. Furthermore, there are other patented solutions available, such as the portable measuring device introduced by Dindorf and Wos [
65], which contributes to a more thorough diagnostic analysis of pneumatic power systems [
66,
67].
The energy-saving methods presented for the entire compressed air system (CAS) and its individual stages exhibit both inverse and mutual interference. This implies that certain measures have localized effects, while others impact the system globally, influencing specific stages or the entirety of the installation. An example of a global intervention is the reduction of air overconsumption in end devices (utilization stage) or the prevention of air leaks. When end devices consume less air, the compressor operates less frequently, leading to reduced losses in the compression stage. Consequently, smaller equipment such as compressors and refrigeration dryers can be employed. Therefore, prioritizing such measures is advisable.
5. Overview of Energy-Saving Solutions in the Utilization Stage
One important aspect is the reduction of energy consumption by end devices such as actuators, pneumatic motors, or nozzles, which is closely related to the problem of oversizing these components. Oversizing leads to higher energy input due to excessive consumption of compressed air [
68]. The design of pneumatic systems is complex due to the intricate interactions among different elements. Beater [
28] emphasizes that components such as valves, long pneumatic lines, and elbows can increase the time it takes for the actuator to complete its stroke by up to 50%. Additionally, the dynamic nature of pneumatic drives, which involve dead volumes, acceleration forces, and variable friction phenomena, further complicates the pneumatic design process. Fleischer [
26] reports that pneumatic system design often leads to machines being oversized by 30–50% due to the standardization of pneumatic actuators. Efforts have been made to address these challenges.
Raisch and Sawodny [
69] attempted to develop an algorithm using various numerical methods to accurately select actuators and their operating parameters, providing potential support for the design process. However, making macroscale adjustments may still result in some actuators being oversized. The effect of designing compressed air machines is to oversize the actuators, which means that the piston movement times are inconsistent with the automation and the machines are highly energy-intensive. Despite these challenges, there are methods available to optimize pneumatic drives in terms of stroke time and energy consumption [
28]. The selection of pneumatic components in relation to positioning methods is also discussed in [
70,
71]. Furthermore, Yu et al. [
72] provide insight into optimizing actuator efficiency, achieving an increase of 28% by optimizing air mass flow and piston movement speed. Wang and Gordon [
73] demonstrate a servo pneumatic control strategy to improve tracking accuracy and energy efficiency, resulting in energy savings ranging from 3 to 7%.
In many cases, the solutions mentioned above can be combined synergistically. For instance, reducing the supply pressure can be paired with utilizing expansion energy, while at the same time, increasing back pressure can lead to reduced air consumption in dead volumes. This suggests that a comprehensive and integrated approach using multiple strategies simultaneously could offer more refined and efficient solutions for optimizing pneumatic systems. The key is to tailor the combination of solutions to meet the specific requirements and dynamics of each application, ensuring a comprehensive and effective enhancement in energy efficiency for pneumatic operations.
5.1. Classification of Energy-Saving Solutions in the Utilization Stage
A classification of energy-saving methods in the utilization stage is based on the theory of air power proposed by Cai et al. [
64]. The theory of air power is based on the exergy balance of air compression and utilization. The change in exergy over time (
) within a given control range can be obtained using the exergy flux rates in (
) and out (
) for the control volume, work flow performed in or by the system (
), exergy of exchanged heat (
) with environmental destruction, and exergy (
) as follows:
The exergy flux of thermodynamic work conducted on or by the system (
) is defined as the sum of the enthalpy and entropy in relation to the ambient conditions along with the kinetic and potential energy. For pneumatic systems, where kinetic and potential energy can be omitted, these equations simplify to:
Substituting these equations into Equation (
2), the final formula for the exergy balance in the system is obtained:
Thermodynamic processes in compressed air systems of compression and expansion are transient at a given moment. However, due to their cyclical nature, it can be assumed that after each cycle the parameters return to their initial values
:
Based on Equation (
7), Cai et al. [
64] developed a static indicator for determining the air power at any point in the system. The air power is based on assumptions for an ideal CAS, such as air as an ideal gas, perfectly reversible isothermal compression and expansion transitions, (
), no exergy destruction, no mechanical or electrical work, and no heat transfer. Applying these assumptions to Equation (
7) and
=
and
=
, the final relationship for air power is:
This formula is based on the thermodynamic work in the isothermal transformation during compression and expansion. The final formula is as follows:
It can be defined as the area of the compressed air work cycle during compression and expansion in a piston machine and defines the amount of energy consumed by the actuator. In processes 1–2, ambient air is sucked into the compressor chamber with a volume of
, then the air is compressed to a pressure of
and a volume of
by the moving piston. In processes 3–4, compressed air is discharged. During the air compression process, the thermodynamic cycle 1–2–3–4 is implemented, as shown in
Figure 3a.
Figure 3b illustrates the thermodynamic cycle of the utilization stage in a pneumatic actuator. The air power of the utilization process is divided into transmission
and expansion
. The work undertaken during air expansion in processes 3–4 is not utilized in the system and is lost when venting the actuator chamber. This portion is referred to as expansion work or power. Leszczyński and Gryboś [
33] further detailed the segment of the transmission power linked to charging dead volumes in the actuator. Consequently, the overall air work in the pneumatic system comprises dead air work (
), transmission work (
), and expansion work (
):
where the dead air work
is defined as:
The transmission air work
is the work conducted in isobaric transformation 2–3:
where
is stroke volume in the actuator. The expansion work
is [
64]:
Based on Equations (
9)–(
13), methods of improving the efficiency of the utilization stage can be proposed by optimizing energy consumption while minimizing the thermodynamic expansion cycle area 1–2–3–4, as shown in
Figure 3b. Due to the oversizing of the actuator, it consumes excessive energy to perform its task under specific parameters, relying only on transmission power, as shown in Equation (
12). The thermodynamic expansion cycle area 1–2–3–4 can be constrained by reducing the transmission work of the actuator, achieved through decreasing the pressure
, increasing the pressure
, or using expansion power in conjunction with transmission power in the actuator. Hence, this analysis allows for the classification of energy-saving solutions into three groups: supply pressure reduction, introduction of back pressure, and utilization of expansion power.
The study conducted by Radgen and Blaustein [
9] highlights the potential for significant energy savings, up to 40%, by optimizing the use of compressed air in the end devices. However, with the other solutions listed in
Table 5, compressed air consumption can be reduced by up to 85%. It largely depends on the degree of oversizing of the actuator in relation to the load and other elements of the utilization stage. However, they acknowledge the challenges associated with implementing such optimizations.
5.2. Method of Supply Pressure Reduction
In the context of controlling the supply pressure in pneumatic actuators, adjustments can be made throughout the system in the compressor setup or locally using pressure regulators. One approach is to decrease the supply pressure by lowering the mass flow into the actuator chamber. This can be achieved through a meter-in system [
28]. In the meter-in system, a flow regulator and a bypass with a non-return valve are installed before each actuator chamber. The flow regulator limits the air mass flow, while the bypass allows the outlet mass flow to pass through smoothly. This method offers significant energy savings, up to 40%, due to the low pressure in the supplied chamber of the actuator. The pressure in the expansion chamber is the result of the dynamics of the processes, the speed of the compressed air inflow, and the speed of the piston movement. Moreover, in this case, the expansion energy of compressed air is partially utilized within the actuator. However, this approach has many disadvantages, including high sensitivity to fluctuations in system parameters (such as pressure and piston speed), susceptibility to cavitation during deceleration, and significant motion delays [
28].
Another solution commonly employed to optimize actuator performance is the use of a pressure regulator [
17,
28,
74]. This device balances the force of compressed air against the spring force set by tightening a screw, enabling individual adjustment of supply pressure in the extend and retract movements. In particular, as the idle stroke, the retract movement often does not require high pressure, resulting in energy savings ranging from 20% to 40% [
17,
28,
74]. This method avoids cavitation in the actuator and piston speed fluctuations but introduces complexities due to additional system elements and the relatively short lifespan of the membranes used in the regulators.
Researchers have also explored dual-pressure systems, where different supply pressures are set for the extend and retract movements. Harris et al. [
17], Dindorf et al. [
25], Beater [
28] claimed 20–50% energy savings using the dual-pressure approach: that is, applying different pressures for the extend and retract movements, respectively. The disadvantage of the solution is the need to use two pressure regulators separately for each movement. When using a pressure regulator only with the retract movement, approximately 20% energy savings are achieved. The computational analysis conducted by Gryboś and Leszczyński [
74] for a single-pressure regulator in the extend movement showed energy savings of 20.5%. Hepke and Weber [
44] reduced pressure in a pneumatic actuator and achieved air savings of 44.4%, with the additional investment cost of the regulator being 20% of the total cost of the conventional pneumatic system. Despite the potential for energy savings, these methods increase the complexity of full-scale pneumatic systems and pose challenges to the installation and adjustment of the regulator.
5.3. Method of Introducing Back Pressure
Several approaches have been proposed to reduce the oversizing of the pneumatic actuator by introducing back pressure during the air exhaust of the chambers. The idea of the method is to introduce a buffer in place of the muffler into which the air released from the actuator expands. The pressure there is higher than the ambient pressure. This means that the actuator does not work between the supply pressure and the ambient pressure but instead between the supply pressure and back pressure. The impact on the dynamics of the actuator’s operation due to back pressure is shown in [
39]. The more the actuator is oversized, the smaller the impact of back pressure on the movement dynamics. A commonly used method to control the speed of the piston and the time of the stroke is the meter-out system, which has been described in detail by Beater [
28], Harris et al. [
45], Mutoh et al. [
75]. This system consists of a flow regulator and a bypass valve connected to reduce the flow of compressed air from the actuator chamber, thereby slowing the piston by creating an air cushion effect in the vented chamber. However, despite its ability to quickly adjust the actuator speed and its insensitivity to minor fluctuations in parameters compared to meter-in, which is the result of the dynamics of the compressed air flow process from the vented chamber and the speed of piston movement, this method offers only modest energy savings (up to 5%) and adds complexity to the system due to the additional components [
28]. Other solutions are currently under development.
Ferraresi et al. [
77] developed an air cushion system with kinetic energy recovery which uses two tanks and four 2/2 control valves. The system takes advantage of the higher pressure in the auxiliary tanks to assist in piston movement, achieving energy savings through air cushion creation and braking.
Another solution proposed by Yang et al. [
78] is a bypass actuator system that reuses the compressed exhaust air from the second cylinder chamber for subsequent movements. This solution provides approximately 15% energy savings but is intrusive and increases system complexity.
Hepke and Weber [
44] proposed an exhaust air recovery circuit specifically for the retract movement without load. This circuit connects the actuator chamber to an air tank using a 3/2 control valve, creating a gas spring effect and reducing exergy consumption by 43%. However, this solution introduces complexity and incurs an additional 83% investment cost compared to a traditional pneumatic system. Šešlija et al. [
76] presented a similar idea of recirculating exhaust air into the supplied chamber, achieving air consumption savings ranging from 12% to 38% when the stroke time increased to 1.2 to 5.7 s, respectively. Merkelbach et al. [
18] performed an experimental and computational exergetic analysis for cross flow in which they used the exhaust air of the chamber to retract movement and achieved 55% savings in compressed air.
Another approach involves modifying open CAS to a closed system by storing exhaust air in a low-pressure tank and then compressing it back to the system supply pressure using a compressor or booster [
33,
79,
80]. Li et al. [
80] demonstrated a 40% energy saving by using an air charge accumulator and a pneumatic booster. Theoretical calculations by Leszczyński and Gryboś [
33] suggested potential energy savings of up to 48% with a closed system. However, the implementation of closed systems presents challenges such as compensating for air loss, incorporating cascade booster systems, integrating return pneumatic lines, and accounting for pressure losses. Du et al. [
81] introduced small closed-circuit pneumatic systems with a reduced pressure of 3 bar, claiming almost 75% energy savings, although their solution was tested with a single actuator. Challenges associated with such systems include the need for compensatory compressors, the use of cascade booster systems for compression ratios above 2–3, expanding the pneumatic network with return lines, addressing pressure losses, and considering compatibility issues with certain pneumatic tools.
The idea of double transmission double expansion (DTDE) was put forward by Leszczyński and Gryboś [
27,
33]. It involves grading the compressed air system into high- and low-pressure stages. The first stage uses compressed air from the supply pressure to the back pressure. The second stage uses the exhaust air from the first actuator to power the next actuator at a lower pressure. Solutions from the literature that can be generally classified as the DTDE method are presented in
Table 6.
Raisch and Sawodny [
82] developed a technology demonstrator called a cascade system with high- and low-pressure segments and an external buffer supply. They achieved air savings of 65% compared to a classic pneumatic system.
Cummins et al. [
83] proposed a graduated compressed air system divided into high- and low-pressure sections with a stress accumulator as a buffer. Using the waste air from the first actuator to supply the next actuator at a lower pressure, they were able to achieve energy savings ranging from 32% to 78% in experimental tests.
Leszczyński and Gryboś [
27] demonstrated the energy harvester as the second stage of the DTDE system. The exhaust air from the high-pressure actuator is collected in an expansion air tank and then converted to electricity by a low-pressure air expander. The energy harvester consists of a linear actuator, a crank-slide mechanism, and an electric generator. What distinguishes this approach is that it takes a holistic view of all or a part of the CAS as opposed to focusing on single actuators. The authors suggest that energy savings of up to 32–70% could theoretically be achieved [
74]. In semi-industrial tests using the technology prototype, they observed an 11% reduction in the electricity consumption by the compressor. The system applied a back pressure of 2.5 bar.
Luo et al. [
84] presented a comparable concept based on a vane-type air expander, achieving energy savings ranging from 15% to 23%, although with a higher back pressure of 3.5 bar. Yu et al. [
85] introduced a pneumatic system that incorporates energy exhaust recycling, but they did not provide specific energy efficiency indicators in their presentation.
5.4. Method of Expansion Power Utilization
This group involves the use of expansion power in the extend and retract movements of the actuator compared to classic control in which only transmission power is used [
68]. Cutting off the power earlier causes the air inside the chamber to expand. A comparison of available methods in the literature is presented in
Table 7.
Raisch et al. [
86] proposed a solution which involves shutting off the directional control valve in a specific position of the piston during movement. They compared two models to predict valve override and achieved a reduction in compressed air consumption that was twice that of the normal control. Merkelbach et al. [
18] performed experimental and computational exergy analysis for cutting off the air supply at 7/8 and 3/4 of a stroke for which they obtained savings of 20% and 30%, respectively, compared to continuous supply. They did not state the limitations of this method. Boyko and Weber [
93] achieved a 71% reduction in compressed air consumption for the cut-off system. Moreover, this solution offers greater savings and slightly longer payback time compared to the use of a pressure regulator. When the actuator is oversized, the potential for even greater savings increases.
Another method for reducing supply pressure is called intermittent air supply. Through a directional control valve bridge system with a specialized control algorithm for valve switching, the compressed air is supplied in small amounts. As demonstrated by Harris et al. [
45], the dual directional control valve circuit (dual DCV) uses a control algorithm to switch two four-way, three-position (4/3) directional control valves between three states: supply, venting, and shut-off of the chamber. By injecting small amounts of compressed air into the actuator’s chamber during the stroke movement, they achieved energy savings of 29% for an actuator with a diameter of 16 mm, a stroke of 290 mm, and a supply pressure of 6 bar. The advantage of this approach lies in the utilization of the expansion energy of compressed air. Blagojević et al. [
92] proposed a similar arrangement with a 5/3 directional control valve, which achieved energy savings ranging from 11% to almost 30% depending on the timing of the valve opening. Doll et al. [
68] introduced a bridge system composed of five two-way, two-state control valves controlled by applying appropriate low and high signals to selected solenoid valves. This system, tested on actuators with piston diameters of 16 mm and 25 mm, can achieve air savings in the compressed air system (CAS) of up to 85%. Du et al. [
87] optimized the control algorithm proposed by Doll et al. [
68], achieving better stability of pneumatic actuator motion and similar energy savings of 55–85%. They also proposed a slightly modified valve bridge consisting of four two-way, two-state valves instead of five [
88,
91]. Furthermore, they introduced a nonlinear algorithm to optimize the dynamics of the actuator operation, using simultaneous collocation methods to determine optimal on/off times for individual valves. By testing the solution with various actuator and pneumatic system parameters, they achieved compressed air savings of 50–62%. A similar bridge system with four control valves but three-way valves was used by Pfeffer et al. [
89,
90], who developed their control algorithm based on measuring and controlling pressure and piston position. The disadvantage of these methods is the need to control the air supply by measuring and controlling pressure and piston position, which makes the entire system very complex. Moreover, availability of a fast switch valve is a barrier [
94].
6. Conclusions and Future Directions
Compressed air systems have very low energy and exergy efficiency, as the literature analysis has shown. They show an energy efficiency of 7–8% and an exergy efficiency of 30–50%. The exergy calculation is much more adequate to assess the effectiveness of CAS due to the analysis of not only thermal processes, but also entropy and exergy destruction in individual elements. Cai et al. [
64] introduced air power calculation, which is something between exergy and energy analysis. Due to the nature of CAS systems, their complexity, dispersion, and the different nature of the work of individual stages, exergy analyses are quite complex. They must take into account the phenomena occurring in each element, which is complicated and resource intensive when the quantities are in the hundreds of thousands. The focus of the energy and exergy analysis was primarily on the static analysis of the compressed air production stage and less on the dynamic expansion processes in the utilization stage. Nevertheless, there are few works analyzing energy balances as a whole, and it is difficult to obtain a full picture of energy/exergy efficiency in CAS based on the existing literature. Additionally, each industrial CAS is different, and there is no typical installation, making it difficult to indicate reliable ranges of efficiency values due to the different degrees of complexity and oversizing depending on the installation. The literature certainly lacks experimental and computational analyses of existing CAS installations as a case study analysis. This indicates future research directions.
Low energy efficiency results from a number of losses in processes and components. The main losses occur at the compression and utilization stages of compressed air and are divided into system and operational losses. The analysis of activities aimed at achieving energy savings in CAS in the literature is largely focused on the compression stage and reducing air leaks. The best and easiest energy savings are achieved by reducing air leaks, but this is a loss that is not related to the CAS processes themselves. Significant savings are achieved by improving the operating parameters of the compressor and the heat recovery. Furthermore, the broadly understood reduction of air consumption has high potential energy savings but is difficult to apply. This concept in the literature covers utilization stage optimization. However, there is currently a lack of reviews in the literature on methods to achieve savings in the utilization stage.
To reduce the consumption of compressed air by end devices, several technical solutions have been developed in the literature. Each is designed to compensate for oversizing, making much better use of compressed air energy and reducing the compressor. This paper proposes dividing these methods into the decrease in supply pressure, the introduction of back pressure, and the utilization of expansion power. They have the potential to save compressed air consumption by 20–50%, 5–78%, and 20–85%, respectively. Each of them requires interference in the existing installation, making implementation very difficult. Most of the time, they require the introduction of a large number of elements per actuator, making the installation even more complex. Currently, the most commonly used methods are local pressure regulation and metering because of the simplicity of installation, but they do not provide good results in terms of energy savings. The most promising methods are double transmission double expansion and intermittent air supply, which also cover various technical solutions. However, their potential savings in energy consumption are high and reach up to 80%. The energy harvester solution introduces the lowest complexity to the existing CAS due to the possibility of connecting a group of actuators to one second-stage installation. However, intermittent air supply installations are highly energy efficient but require additional valves, often fast switches (highly expensive) and changes in their control, which makes their implementation more difficult in current structures, although they have great potential in new ones. The literature on these installations lacks an assessment of their implementation in existing systems and presentations of technological tests. Further evaluation of the exergy of individual solutions and their comparison would also be a valuable study. Only such a comprehensive evaluation of potential solutions will provide a good analysis for the selection and development of technologies that are the most technically and economically profitable.
This paper focuses on supplementing the literature by reviewing technical solutions for reducing actuator oversizing, resulting in reduced compressed air consumption in the utilization stage. The energy and exergy analyses appearing in the literature were compared and, despite their small number, they indicated a drastically low efficiency of compressed air installations. The energy and exergy efficiency of the classical industrial CAS are 7–8% and 30–50%, respectively. Next, standard actions described in the literature were compared in terms of energy savings and ease of application, and the focus was on reducing air consumption. This solution achieves high energy savings, but its application is very complex. Therefore, a literature review of solutions to reduce the consumption of compressed air by pneumatic actuators is presented. A division into three groups was proposed, which results from the operation of the thermodynamic cycle taking place in the actuator. The most important methods were indicated as double transmission double expansion and intermittent air supply, in which it is possible to achieve even more than 80% savings in compressed air consumption. The complexity of a given technical solution in relation to the CAS installation was also indicated. Their further development seems promising in terms of optimizing energy consumption through the utilization stage.
Author Contributions
Conceptualization, D.G. and J.S.L.; methodology, J.S.L.; software, D.G.; validation, D.G. and J.S.L.; formal analysis, J.S.L.; investigation, D.G.; resources, J.S.L.; data curation, D.G.; writing—original draft preparation, D.G.; writing—review and editing, J.S.L.; visualization, D.G.; supervision, J.S.L.; project administration, J.S.L.; funding acquisition, J.S.L. All authors have read and agreed to the published version of the manuscript.
Funding
This research project was partly supported by the program “Excellence Initiative–Research University” for the AGH University of Krakow. This research was funded by a research subvention supported by the Polish Ministry of Education and Science, grant number 16.16.130.942.
Institutional Review Board Statement
Not applicable.
Informed Consent Statement
Not applicable.
Data Availability Statement
Data are contained within the article.
Conflicts of Interest
The authors declare no conflicts of interest.
Abbreviations
The following abbreviations are used in this manuscript:
| CAS | Compressed Air System |
| DTDE | Double Transmission Double Expansion |
| DCV | Directional Control Valve |
References
- Saidur, R.; Rahim, N.A.; Hasanuzzaman, M. A review on compressed-air energy use and energy savings. Renew. Sustain. Energy Rev. 2010, 14, 1135–1153. [Google Scholar] [CrossRef]
- Cai, M.; Kagawa, T.; Kawashima, K. Energy Conversion Mechanics and Power Evaluation of Compressible Fluid in Pneumatic Actuator Systems. In Proceedings of the 37th Intersociety Energy Conversion Engineering Conference (IECEC), Washington, DC, USA, 29–31 July 2002; pp. 471–474. [Google Scholar]
- Nourin, F.N.; Espindola, J.; Selim, O.M.; Amano, R.S. Energy, Exergy, and Emission Analysis on Industrial Air Compressors. J. Energy Resour. Technol. 2022, 144, 042104. [Google Scholar] [CrossRef]
- Nehler, T.; Parra, R.; Thollander, P. Implementation of energy efficiency measures in compressed air systems: Barriers, drivers and non-energy benefits. Energy Effic. 2018, 11, 1281–1302. [Google Scholar] [CrossRef]
- Benedetti, M.; Bonfa, F.; Bertini, I.; Introna, V.; Ubertini, S. Explorative study on Compressed Air Systems’ energy efficiency in production and use: First steps towards the creation of a benchmarking system for large and energy-intensive industrial firms. Appl. Energy 2018, 227, 436–448. [Google Scholar] [CrossRef]
- Salvatori, S.; Benedetti, M.; Bonfa, F.; Introna, V.; Ubertini, S. Inter-sectorial benchmarking of compressed air generation energy performance: Methodology based on real data gathering in large and energy-intensive industrial firms. Appl. Energy 2018, 217, 266–280. [Google Scholar] [CrossRef]
- Benedetti, M.; Bonfà, F.; Introna, V.; Santolamazza, A.; Ubertini, S. Real time energy performance control for industrial compressed air systems: Methodology and applications. Energies 2019, 12, 3935. [Google Scholar] [CrossRef]
- Unger, M.; Radgen, P. Energy Efficiency in Compressed Air Systems—A review of energy efficiency potentials, technological development, energy policy actions and future importance. In Proceedings of the 10th international Conference on Energy Efficiency in Motor Driven Systems (EEMODS’ 2017), Rome, Italy, 6–8 September 2017; Publications Office of the European Union: Luxembourg, 2018; pp. 207–223. [Google Scholar]
- Radgen, P.; Blaustein, E. Compressed Air Systems in the European Union. Energy, Emissions, Savings Potential and Policy Actions; Fraunhofer ISI: Stuttgart, Germany, 2001. [Google Scholar]
- Saravanakumar, D.; Mohan, B.; Muthuramalingam, T. A review on recent research trends in servo pneumatic positioning systems. Precis. Eng. 2017, 49, 481–492. [Google Scholar] [CrossRef]
- Gryboś, D.; Leszczyński, J.S.; Czopek, D.; Wiciak, J. Exhaust Noise Reduction by Application of Expanded Collecting System in Pneumatic Tools and Machines. Energies 2021, 14, 1592. [Google Scholar] [CrossRef]
- Czopek, D.; Gryboś, D.; Leszczyński, J.S.; Wiciak, J. Identification of energy wastes through sound analysis in compressed air systems. Energy 2022, 239, 122122. [Google Scholar] [CrossRef]
- Thollander, P.; Backlund, S.; Trianni, A.; Cagno, E. Beyond barriers—A case study on driving forces for improved energy efficiency in the foundry industries in Finland, France, Germany, Italy, Poland, Spain, and Sweden. Appl. Energy 2013, 111, 636–643. [Google Scholar] [CrossRef]
- Trianni, A.; Cagno, E.; Farné, S. Barriers, drivers and decision-making process for industrial energy efficiency: A broad study among manufacturing small and medium-sized enterprises. Appl. Energy 2016, 162, 1537–1551. [Google Scholar] [CrossRef]
- Nota, G.; Nota, F.D.; Peluso, D.; Lazo, A.T. Energy efficiency in Industry 4.0: The case of batch production processes. Sustainability 2020, 12, 6631. [Google Scholar] [CrossRef]
- Miśkiewicz, R.; Rzepka, A.; Borowiecki, R.; Olesińki, Z. Energy Efficiency in the Industry 4.0 Era: Attributes of Teal Organisations. Energies 2021, 14, 6776. [Google Scholar] [CrossRef]
- Harris, P.G.; O’Donnell, G.E.; Whelan, T. Modelling and identification of industrial pneumatic drive system. Int. J. Adv. Manuf. Technol. 2012, 58, 1075–1086. [Google Scholar] [CrossRef]
- Merkelbach, S.; Murrenhoff, H.; Brecher, C.; Fey, M.; Esser, B. Pneumatic or electromechanical drives – a comparison regarding their exergy efficiency. In Proceedings of the 10th International Fluid Power Conference, Dresden, Germany, 8–10 March 2016; pp. 103–116. [Google Scholar]
- Herrera, H.; Villalba, P.; Angarita, N.; Ortega, S.; Echavarría, C. Energy savings in compressed air systems a case of study. IOP Conf. Ser. Mater. Sci. Eng. 2021, 1154, 012009. [Google Scholar] [CrossRef]
- Dindorf, R.; Takosoglu, J.; Wos, P. Review of Compressed Air Receiver Tanks for Improved Energy Efficiency of Various Pneumatic Systems. Energies 2023, 16, 4153. [Google Scholar] [CrossRef]
- Dindorf, R.; Takosoglu, J.; Wos, P. Review of Hydro-Pneumatic Accumulator Models for the Study of the Energy Efficiency of Hydraulic Systems. Energies 2023, 16, 6472. [Google Scholar] [CrossRef]
- Trianni, A.; Accordini, D.; Cagno, E. Identification and Categorization of Factors Affecting the Adoption of Energy Efficiency Measures within Compressed Air Systems. Energies 2020, 13, 5116. [Google Scholar] [CrossRef]
- Benedetti, M.; Bonfà, F.; Bertini, I.; Introna, V.; Salvatori, S.; Ubertini, S.; Paradiso, R. Maturity-based approach for the improvement of energy efficiency in industrial compressed air production and use systems. Energy 2019, 186, 115879. [Google Scholar] [CrossRef]
- Krichel, S.V.; Sawodny, O. Mechatronics Dynamic modeling of compressors illustrated by an oil-flooded twin helical screw compressor. Mechatronics 2011, 21, 77–84. [Google Scholar] [CrossRef]
- Dindorf, R.; Takosoglu, J.; Woś, P. Development of Pneumatic Control Systems, m89 ed.; Wydawnictwo Politechniki Świetokrzyskiej: Warsaw, Poland, 2017. [Google Scholar]
- Fleischer, H. Manual of Pneumatic Systems Optimization; McGraw-Hill: Berlin/Heidelberg, Germany, 1995. [Google Scholar]
- Leszczyński, J.S.; Gryboś, D. Compensation for the complexity and over-scaling in industrial pneumatic systems by the accumulation and reuse of exhaust air. Appl. Energy 2019, 239, 1130–1141. [Google Scholar] [CrossRef]
- Beater, P. Pneumatic Drives; Springer: Berlin/Heidelberg, Germany, 2007. [Google Scholar] [CrossRef]
- ISO 8140:2018; Pneumatic Fluid Power, Cylinders, 1000 kPa (10 Bar) Series Mounting Dimensions of Rod-End Clevises. International Organization for Standardization: Geneva, Switzerland, 2018.
- ISO 15552:2018; Pneumatic Fluid Power, Cylinders with Detachable Mountings, 1000 kPa (10 Bar) Series, Bores from 32 mm to 320 mm. International Organization for Standardization: Geneva, Switzerland, 2018.
- ISO 6432:2015; Pneumatic Fluid Power, Single Rod Cylinders, 1000 kPa (10 Bar) Series, Bores from 8 mm to 25 mm. International Organization for Standardization: Geneva, Switzerland, 2015.
- ISO 21287:2004; Pneumatic Fluid Power, Cylinders, Compact Cylinders, 1000 kPa (10 bar) Series, Bores from 20 mm to 100 mm. International Organization for Standardization: Geneva, Switzerland, 2004.
- Leszczyński, J.; Gryboś, D. Sensitivity analysis of Double Transmission Double Expansion (DTDE) systems for assessment of the environmental impact of recovering energy waste in exhaust air from compressed air systems. Appl. Energy 2020, 278, 115696. [Google Scholar] [CrossRef]
- Doll, M.; Neumann, R.; Sawodny, O. Dimensioning of pneumatic cylinders for motion tasks. Int. J. Fluid Power 2015, 16, 11–24. [Google Scholar] [CrossRef]
- Shi, Y.; Cai, M.; Xu, W.; Wang, Y. Methods to Evaluate and Measure Power of Pneumatic System and Their Applications. Chin. J. Mech. Eng. 2019, 32, 42. [Google Scholar] [CrossRef]
- Krichel, S.; Hulsmann, S.; Hirzel, S.; Sawodny, O.; Elsland, R. Exergy flow diagrams as novel approach to discuss the efficiency of compressed air systems. In Proceedings of the International Fluid Power Conference (IFK 2012), Dresden, Germany, 26–28 March 2012; Volume 3, pp. 227–238. [Google Scholar]
- Taheri, K.; Gadow, R. Industrial compressed air system analysis: Exergy and thermoeconomic analysis. CIRP J. Manuf. Sci. Technol. 2017, 18, 10–17. [Google Scholar] [CrossRef]
- Tong, Z.; Wang, H.; Xiong, W.; Ting, D.S.; Carriveau, R.; Wang, Z. Accumulated and transient exergy analyses of pneumatic systems with isochoric and isobaric compressed air storage tanks. Energy Storage 2021, 3, e269. [Google Scholar] [CrossRef]
- Gryboś, D.; Leszczyński, J. Exergy analysis of pressure reduction, back pressure and intermittent air supply configuration of utilization/expansion stage in compressed air systems. Energy 2023, 285, 129419. [Google Scholar] [CrossRef]
- Rakova, E.; Weber, J. Process Simulation of Energy Behaviour of Pneumatic Drives. Procedia Eng. 2015, 106, 149–157. [Google Scholar] [CrossRef]
- Harris, P.; Nolan, S.; O’Donnell, G.E.; Meskell, C. Optimising Compressed Air System Energy Efficiency—The Role of Flow Metering and Exergy Analysis. In Re-Engineering Manufacturing for Sustainability; Springer: Singapore, 2013; pp. 129–134. [Google Scholar] [CrossRef]
- Bader, W.; Kissock, K. Exergy Analysis of Industrial Air Compression. In Proceedings of the IETC—Industrial Energy Technology Conference, New Orleans, LA, USA, 10–13 May 2005; pp. 89–98. [Google Scholar]
- Merkelbach, S.; Murrenhoff, H. Exergy based analysis of pneumatic air saving measures. In Proceedings of the ASME/BATH 2015 Symposium on Fluid Power and Motion Control, FPMC 2015, Chicago, IL, USA, 12–14 October 2015. [Google Scholar] [CrossRef]
- Hepke, J.; Weber, J. Energy saving measures on pneumatic drive systems energy consumption of pneumatic drives. In Proceedings of the 13th Scandinavian International Conference on Fluid Power, SICFP2013, Linköping, Sweden, 3–5 June 2013; Linkoping University Electronic Press: Dresden, Germany, 2013; pp. 475–483. [Google Scholar] [CrossRef]
- Harris, P.; Nolan, S.; O’Donnell, G.E. Energy optimisation of pneumatic actuator systems in manufacturing. J. Clean. Prod. 2014, 72, 35–45. [Google Scholar] [CrossRef]
- Zein, A.; Li, W.; Herrmann, C.; Kara, S. Energy Efficiency Measures for the Design and Operation of Machine Tools: An Axiomatic Approach. In Glocalized Solutions for Sustainability in Manufacturing; Springer: Berlin/Heidelberg, Germany, 2011; pp. 274–279. [Google Scholar] [CrossRef]
- Dindorf, R. Estimating potential energy savings in compressed air systems. Procedia Eng. 2012, 39, 204–211. [Google Scholar] [CrossRef]
- Liu, C.; Kong, D.; Cai, M. Research on Energy-Saving Operation of Screw Air Compressor. Res. J. Appl. Sci. Eng. Technol. 2013, 6, 325–333. [Google Scholar] [CrossRef]
- Mousavi, S.; Kara, S.; Kornfeld, B. Energy Efficiency of Compressed Air Systems. Procedia CIRP 2014, 15, 313–318. [Google Scholar] [CrossRef]
- Wang, L.; Ma, G.; Ma, A.; Liu, Y.; Zhou, F. Experimental investigations on a heat pump system for ventilation heat recovery of a novel dual-cylinder rotary compressor. Int. J. Refrig. 2019, 108, 26–36. [Google Scholar] [CrossRef]
- Broniszewski, M.; Werle, S. The study on the heat recovery from air compressors. E3S Web Conf. 2018, 70, 03001. [Google Scholar] [CrossRef]
- Vittorini, D.; Cipollone, R. Energy saving potential in existing industrial compressors. Energy 2016, 102, 502–515. [Google Scholar] [CrossRef]
- Dindorf, R.; Wos, P. Indirect Method of Leakage Flow Rate Measurement in Compressed Air Pipelines. Appl. Mech. Mater. 2014, 630, 288–293. [Google Scholar] [CrossRef]
- Krichel, S.V.; Sawodny, O. Analysis and optimization of compressed air networks with model-based approaches. Ventil 2011, 334, 341. [Google Scholar]
- Gai, Y.; Cai, M.; Shi, Y. Analytical and experimental study on complex compressed air pipe network. Chin. J. Mech. Eng. 2015, 28, 1023–1029. [Google Scholar] [CrossRef]
- Liu, Z.; Wang, F.; Liu, S.; Tian, Y.; Zhang, D. Modeling and Analysis of Soft Pneumatic Network Bending Actuators. IEEE/ASME Trans. Mechatron. 2021, 26, 2195–2203. [Google Scholar] [CrossRef]
- Sambandam, M.T.; Madlool, N.A.; Saidur, R.; Devaraj, D.; Rajakarunakaran, S. Investigation of energy saving potentials in T-junction and elbow in compressed air systems. Energy Effic. 2017, 10, 1099–1113. [Google Scholar] [CrossRef]
- Jia, G.; Nian, X.; Xu, W.; Shi, Y.; Cai, M. Water-spray-cooled quasi-isothermal compression method: Water-spray flow improvement. Entropy 2021, 23, 724. [Google Scholar] [CrossRef]
- Ren, T.; Xu, W.; Cai, M.; Wang, X.; Li, M. Experiments on air compression with an isothermal piston for energy storage. Energies 2019, 12, 3730. [Google Scholar] [CrossRef]
- Wang, H.; Tong, Z.; Dong, X.; Xiong, W.; Ting, D.S.; Carriveau, R.; Wang, Z. Design and energy saving analysis of a novel isobaric compressed air storage device in pneumatic systems. J. Energy Storage 2021, 38, 102614. [Google Scholar] [CrossRef]
- Zahlan, J.; Asfour, S. A multi-objective approach for determining optimal air compressor location in a manufacturing facility. J. Manuf. Syst. 2015, 35, 176–190. [Google Scholar] [CrossRef]
- Dindorf, R.; Wos, P. Automatic measurement system for determination of leakage flow rate in compressed air pipeline system. Metrol. Meas. Syst. 2018, 25, 159–170. [Google Scholar] [CrossRef]
- Cai, M.; Kagawa, T. Design and application of air power meter in compressed air systems. In Proceedings of the Proceedings—2nd International Symposium on Environmentally Conscious Design and Inverse Manufacturing, Tokyo, Japan, 11–15 December 2001; pp. 208–212. [Google Scholar] [CrossRef]
- Cai, M.; Kawashima, K.; Kagawa, T. Power assessment of Flowing Compressed Air. Trans. ASME 2006, 128, 402–405. [Google Scholar] [CrossRef]
- Dindorf, R.; Wos, P. Device for Measuring Leakage Rates in Pipelines for Gas Transmission, Especially Compressed Air. Patent P.426255, 6 June 2019. [Google Scholar]
- Dindorf, R.; Wos, P. Universal Programmable Portable Measurement Device for Diagnostics and Monitoring of Industrial Fluid Power Systems. Sensors 2021, 21, 3440. [Google Scholar] [CrossRef] [PubMed]
- Dindorf, R.; Wos, P. Test of measurement device for the estimation of leakage flow rate in pneumatic pipeline systems. Meas. Control 2018, 51, 514–527. [Google Scholar] [CrossRef]
- Doll, M.; Neumann, R.; Sawodny, O. Energy Efficient Use of Compressed Air in Pneumatic Drive Systems For Motion Tasks. In Proceedings of the 2011 International Conference on Fluid Power and Mechatronics (FPM), Beijing, China, 17–20 August 2011; pp. 340–345. [Google Scholar] [CrossRef]
- Raisch, A.; Sawodny, O. Analysis and optimal sizing of pneumatic drive systems for handling tasks. Mechatronics 2019, 59, 168–177. [Google Scholar] [CrossRef]
- Hildebrandt, A.; Kharitonov, A.; Sawodny, O.; Gottert, M.; Hartmann, A. On the zero dynamic of servo pneumatic actuators and its usage for trajectory planning and control. In Proceedings of the IEEE International Conference Mechatronics and Automation, Niagara Falls, ON, Canada, 29 July–1 August 2005; pp. 1241–1246. [Google Scholar] [CrossRef]
- Hildebrandt, A.; Neumann, R.; Sawodny, O. Optimal System Design of SISO-Servopneumatic Positioning Drives. IEEE Trans. Control Syst. Technol. 2010, 18, 35–44. [Google Scholar] [CrossRef]
- Yu, Q.; Cai, M.; Shi, Y.; Xu, Q. Optimization study on a single-cylinder compressed air engine. Chin. J. Mech. Eng. 2015, 28, 1285–1292. [Google Scholar] [CrossRef]
- Wang, J.; Gordon, T. Energy Optimal Control of Servo-Pneumatic Cylinders Through Nonlinear Static Feedback Linearization. J. Dyn. Syst. Meas. Control 2012, 134, 051005. [Google Scholar] [CrossRef]
- Gryboś, D.; Leszczyński, J. Double transmission double expansion technology as a method for reducing energy losses associated with oversizing of industrial compressed air systems. In Proceedings of the ECEEE Industrial Summer Study Proceedings, Gothenburg, Sweden, 14–17 September 2020; pp. 295–305. [Google Scholar]
- Mutoh, H.; Kawasakami, Y.; Hriata, Y.; Kawai, S. An Approach to Energy Conservation in Pneumatic Systems with Meter out Circuit. In Proceedings of the the 7th JFPS International Symposium on Fluid Power, Toyama, Japan, 15–18 September 2008; pp. 124–130. [Google Scholar]
- Šešlija, M.; Reljić, V.; Šešlija, D.; Dudić, S.; Dakić, N.; Jovanović, Z. Reuse of Exhausted Air from Multi-Actuator Pneumatic Control Systems. Actuators 2021, 10, 125. [Google Scholar] [CrossRef]
- Ferraresi, C.; Franco, W.; Quaglia, G.; Scopesi, M. Energy Saving in Pneumatic Drives: An Experimental Analysis. In Proceedings of the 9th International Workshop on Research and Education in Mechatronics, Bergamo, Italy, 18–19 September 2008; pp. 1–5. [Google Scholar]
- Yang, A.; Pu, J.; Wong, C.; Moore, P. By-pass valve control to improve energy efficiency of pneumatic drive system. Control Eng. Pract. 2009, 17, 623–628. [Google Scholar] [CrossRef]
- Yang, F.; Tadano, K.; Li, G.; Kagawa, T. Analysis of the energy efficiency of a pneumatic booster regulator with energy recovery. Appl. Sci. 2017, 7, 816. [Google Scholar] [CrossRef]
- Li, T.C.; Wu, H.W.; Kuo, M.J. A Study of Gas Economizing Pneumatic Cylinder. Proc. J. Phys. Conf. Ser. 2006, 48, 1227–1232. [Google Scholar] [CrossRef]
- Du, H.; Xiong, W.; Xu, C.; Jiangr, Z. Research on the controllability and energy saving of the pneumatic direct drive system. Int. J. Heat Technol. 2017, 35, 997–1004. [Google Scholar] [CrossRef]
- Raisch, A.; Sawodny, O. Energy Savings in Pneumatically Driven Plants. IEEE/ASME Trans. Mechatron. 2021, 27, 1023–1033. [Google Scholar] [CrossRef]
- Cummins, J.J.; Nash, C.J.; Thomas, S.; Justice, A.; Mahadevan, S.; Adams, D.E.; Barth, E.J. Energy conservation in industrial pneumatics: A state model for predicting energetic savings using a novel pneumatic strain energy accumulator. Appl. Energy 2017, 198, 239–249. [Google Scholar] [CrossRef]
- Luo, X.; Sun, H.; Wang, J. An Energy Efficient Pneumatic-electrical System and Control Strategy Development. In Proceedings of the American Control Conference, San Francisco, CA, USA, 29 June–1 July 2011; pp. 4743–4748. [Google Scholar]
- Yu, Q.; Zhai, J.; Wang, Q.; Zhang, X.; Tan, X. Experimental study of a new pneumatic actuating system using exhaust recycling. Sustainability 2021, 13, 1645. [Google Scholar] [CrossRef]
- Raisch, A.; Hülsmann, S.; Sawodny, O. Saving Energy by Predictive Supply Air Shutoff for Pneumatic Drives. In Proceedings of the 2018 European Control Conference, ECC 2018, Limassol, Cyprus, 12–15 June 2018; pp. 965–970. [Google Scholar] [CrossRef]
- Du, H.; Hu, C.; Xiong, W.; Wang, L. Heliyon Applicability of bridge-type pneumatic energy-saving systems and its experimental validation. Heliyon 2020, 6, e03826. [Google Scholar] [CrossRef]
- Du, H.; Hu, C.; Xiong, W.; Jiang, Z.; Wang, L. Energy optimization of pneumatic actuating systems using expansion energy and exhaust recycling. J. Clean. Prod. 2020, 254, 119983. [Google Scholar] [CrossRef]
- Pfeffer, A.; Glück, T.; Kugi, A. Soft Landing and Disturbance Rejection for Pneumatic Drives with Partial Position Information. IFAC-PapersOnLine 2016, 49, 559–566. [Google Scholar] [CrossRef]
- Pfeffer, A.; Glück, T.; Schausberger, F.; Kugi, A. Control and estimation strategies for pneumatic drives with partial position information. Mechatronics 2018, 50, 259–270. [Google Scholar] [CrossRef]
- Du, H.; Xiong, W.; Jiang, Z.; Li, Q.; Wang, L. Energy efficiency control of pneumatic actuator systems through nonlinear dynamic optimization. J. Clean. Prod. 2018, 184, 511–519. [Google Scholar] [CrossRef]
- Blagojević, V.; Šešlija, D.; Stojiljković, M.; Dudić, S. Efficient control of servo pneumatic actuator system utilizing by-pass valve and digital sliding mode. Sadhana-Acad. Proc. Eng. Sci. 2013, 38, 187–197. [Google Scholar] [CrossRef]
- Boyko, V.; Weber, J. Energy Efficiency of Pneumatic Actuating Systems with Pressure-Based Air Supply Cut-Off. Actuators 2024, 13, 44. [Google Scholar] [CrossRef]
- Padovani, D.; Barth, E.J. Exploiting Valve Timing for Pneumatic Energy Savings. In Proceedings of the BATH/ASME 2018 Symposium on Fluid Power and Motion Control. BATH/ASME 2018 Symposium on Fluid Power and Motion Control, Bath, UK, 12–14 September 2018. [Google Scholar] [CrossRef]
| Disclaimer/Publisher’s Note: The statements, opinions and data contained in all publications are solely those of the individual author(s) and contributor(s) and not of MDPI and/or the editor(s). MDPI and/or the editor(s) disclaim responsibility for any injury to people or property resulting from any ideas, methods, instructions or products referred to in the content. |
© 2024 by the authors. Licensee MDPI, Basel, Switzerland. This article is an open access article distributed under the terms and conditions of the Creative Commons Attribution (CC BY) license (https://creativecommons.org/licenses/by/4.0/).


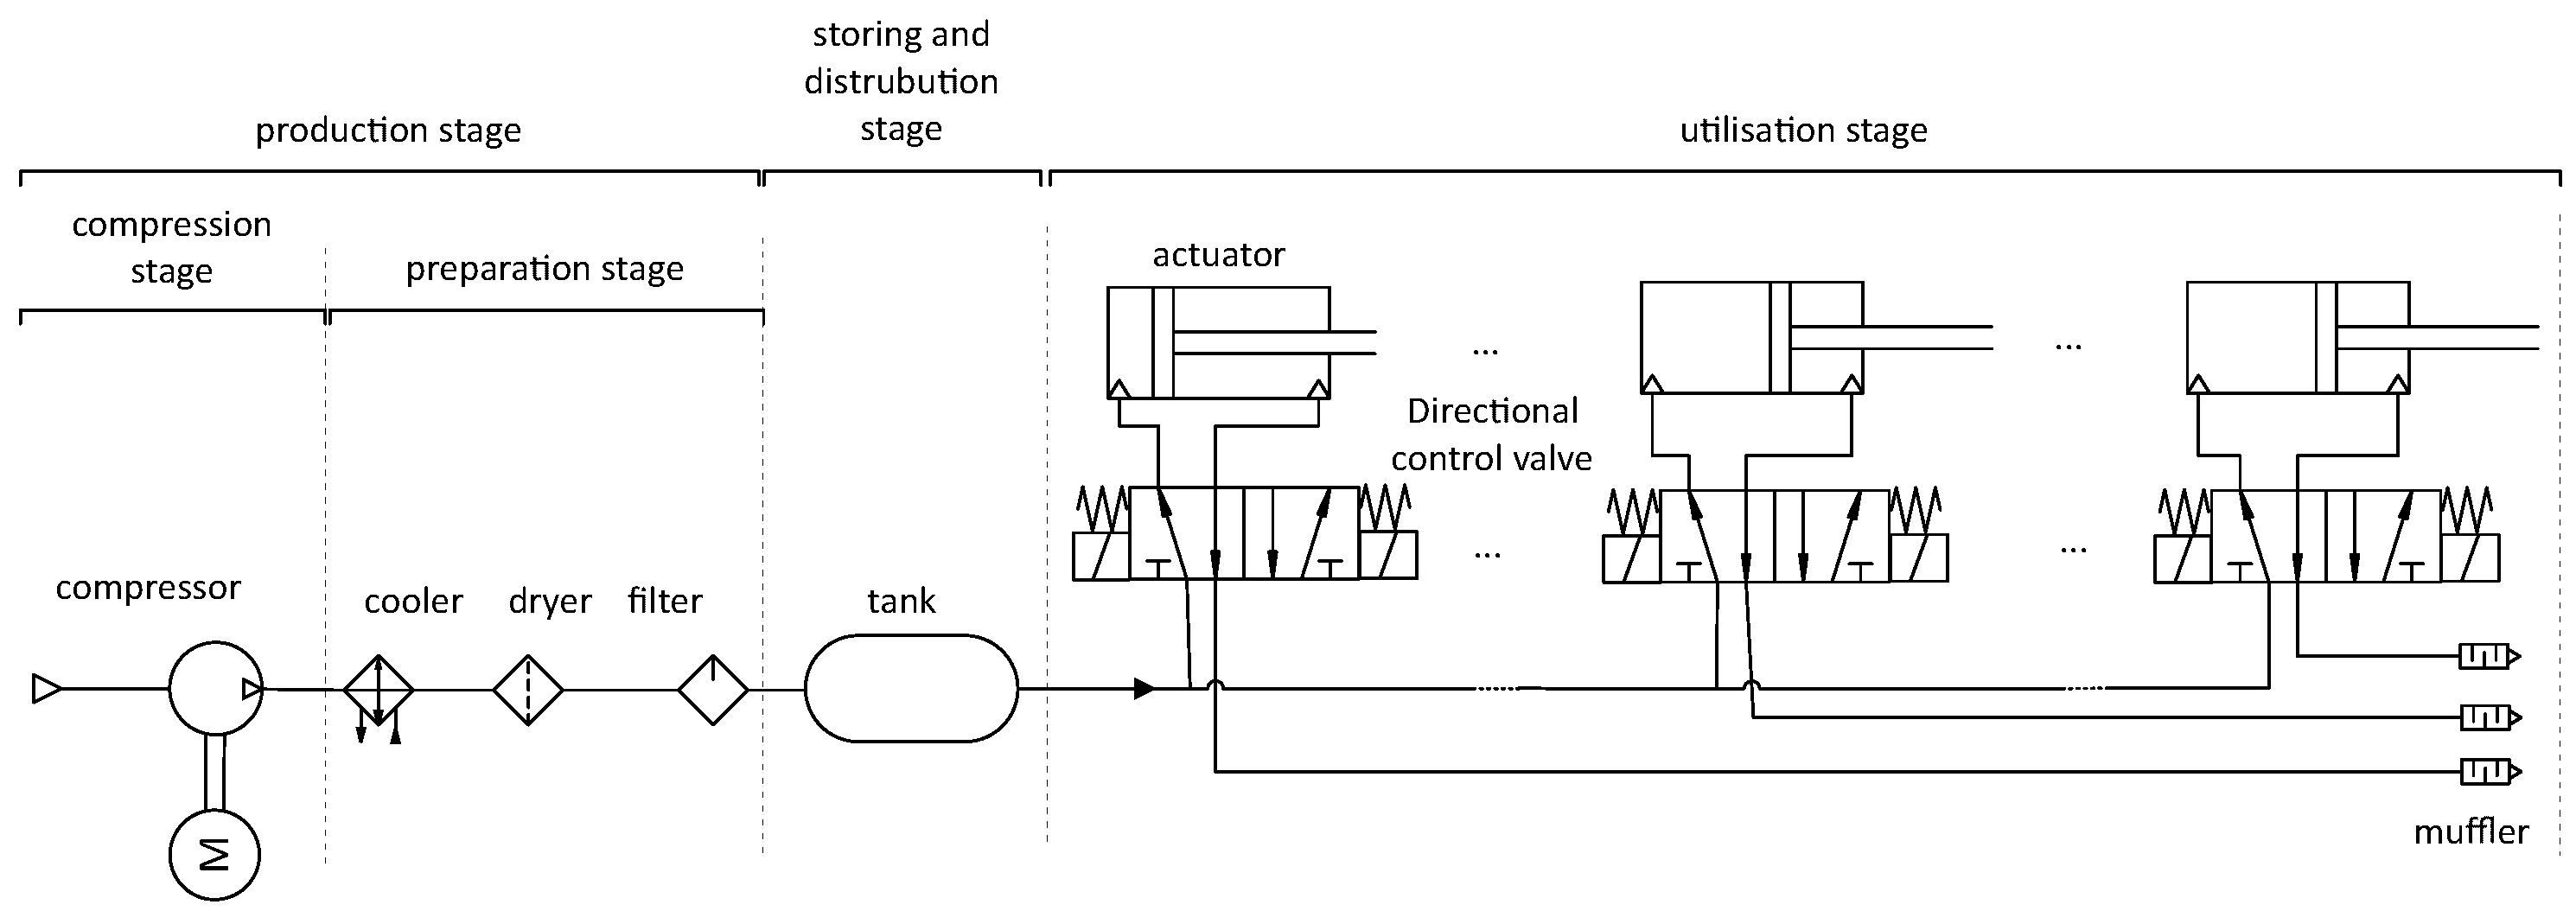
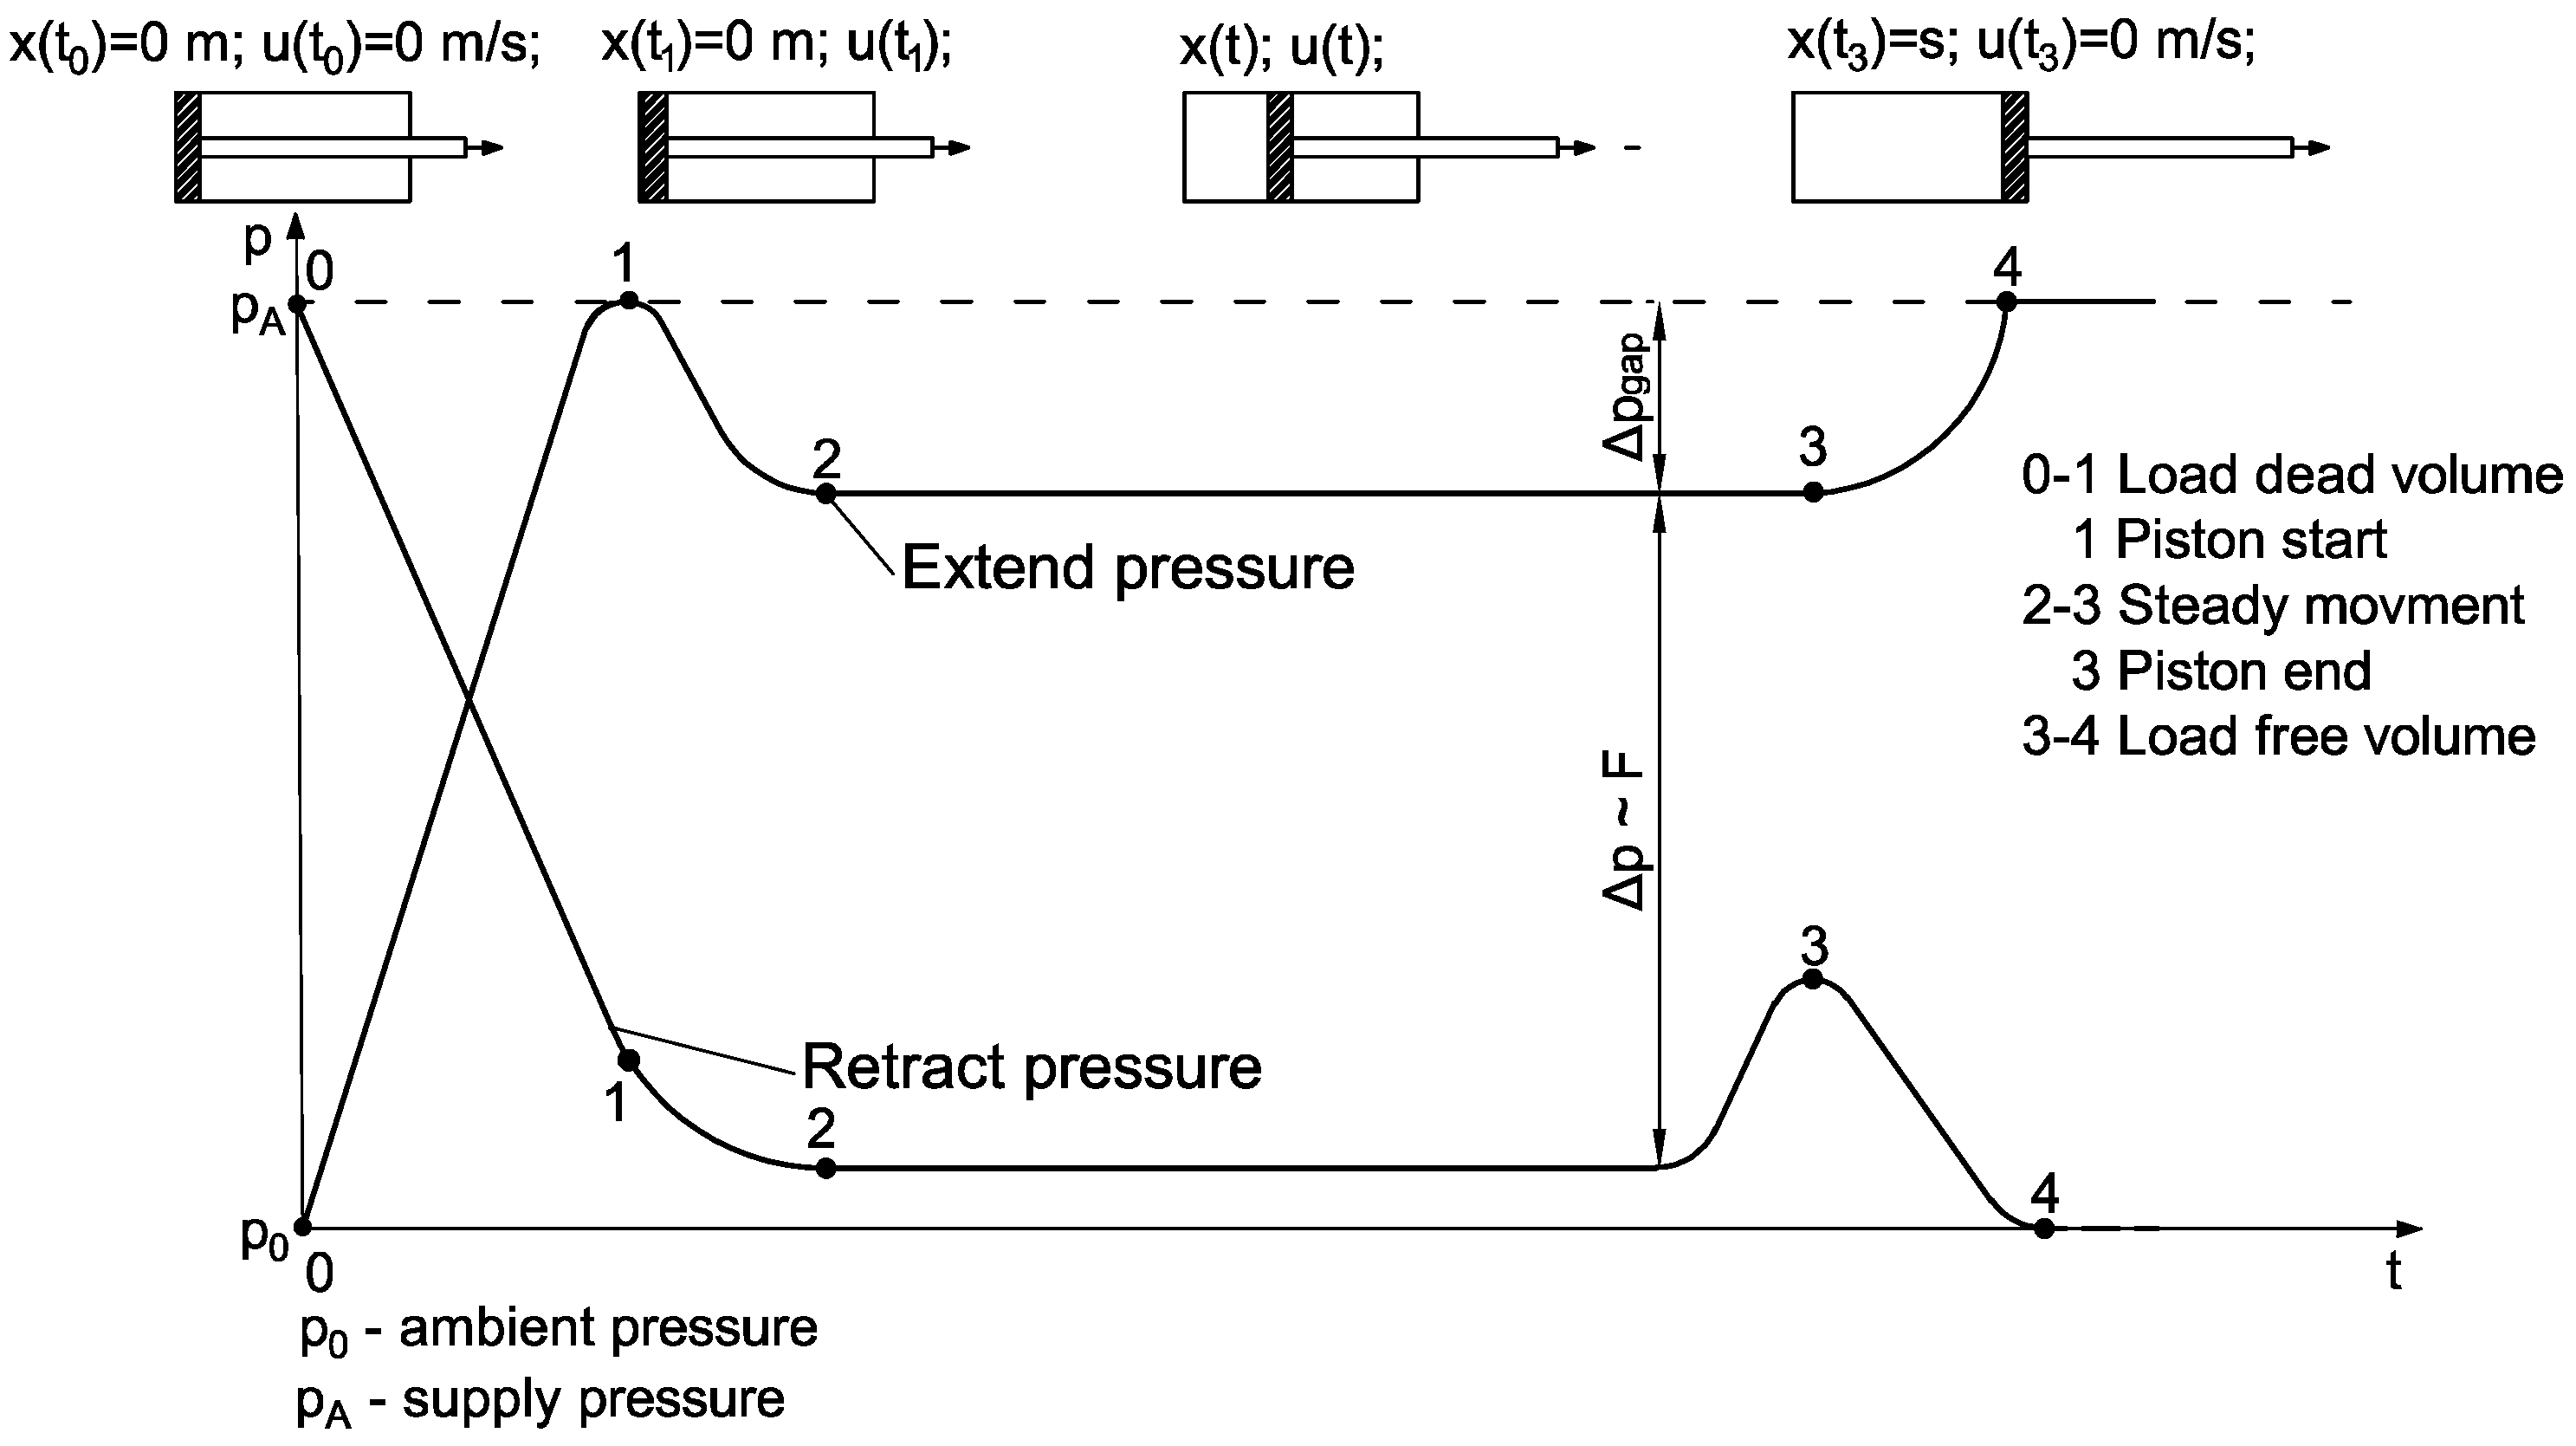
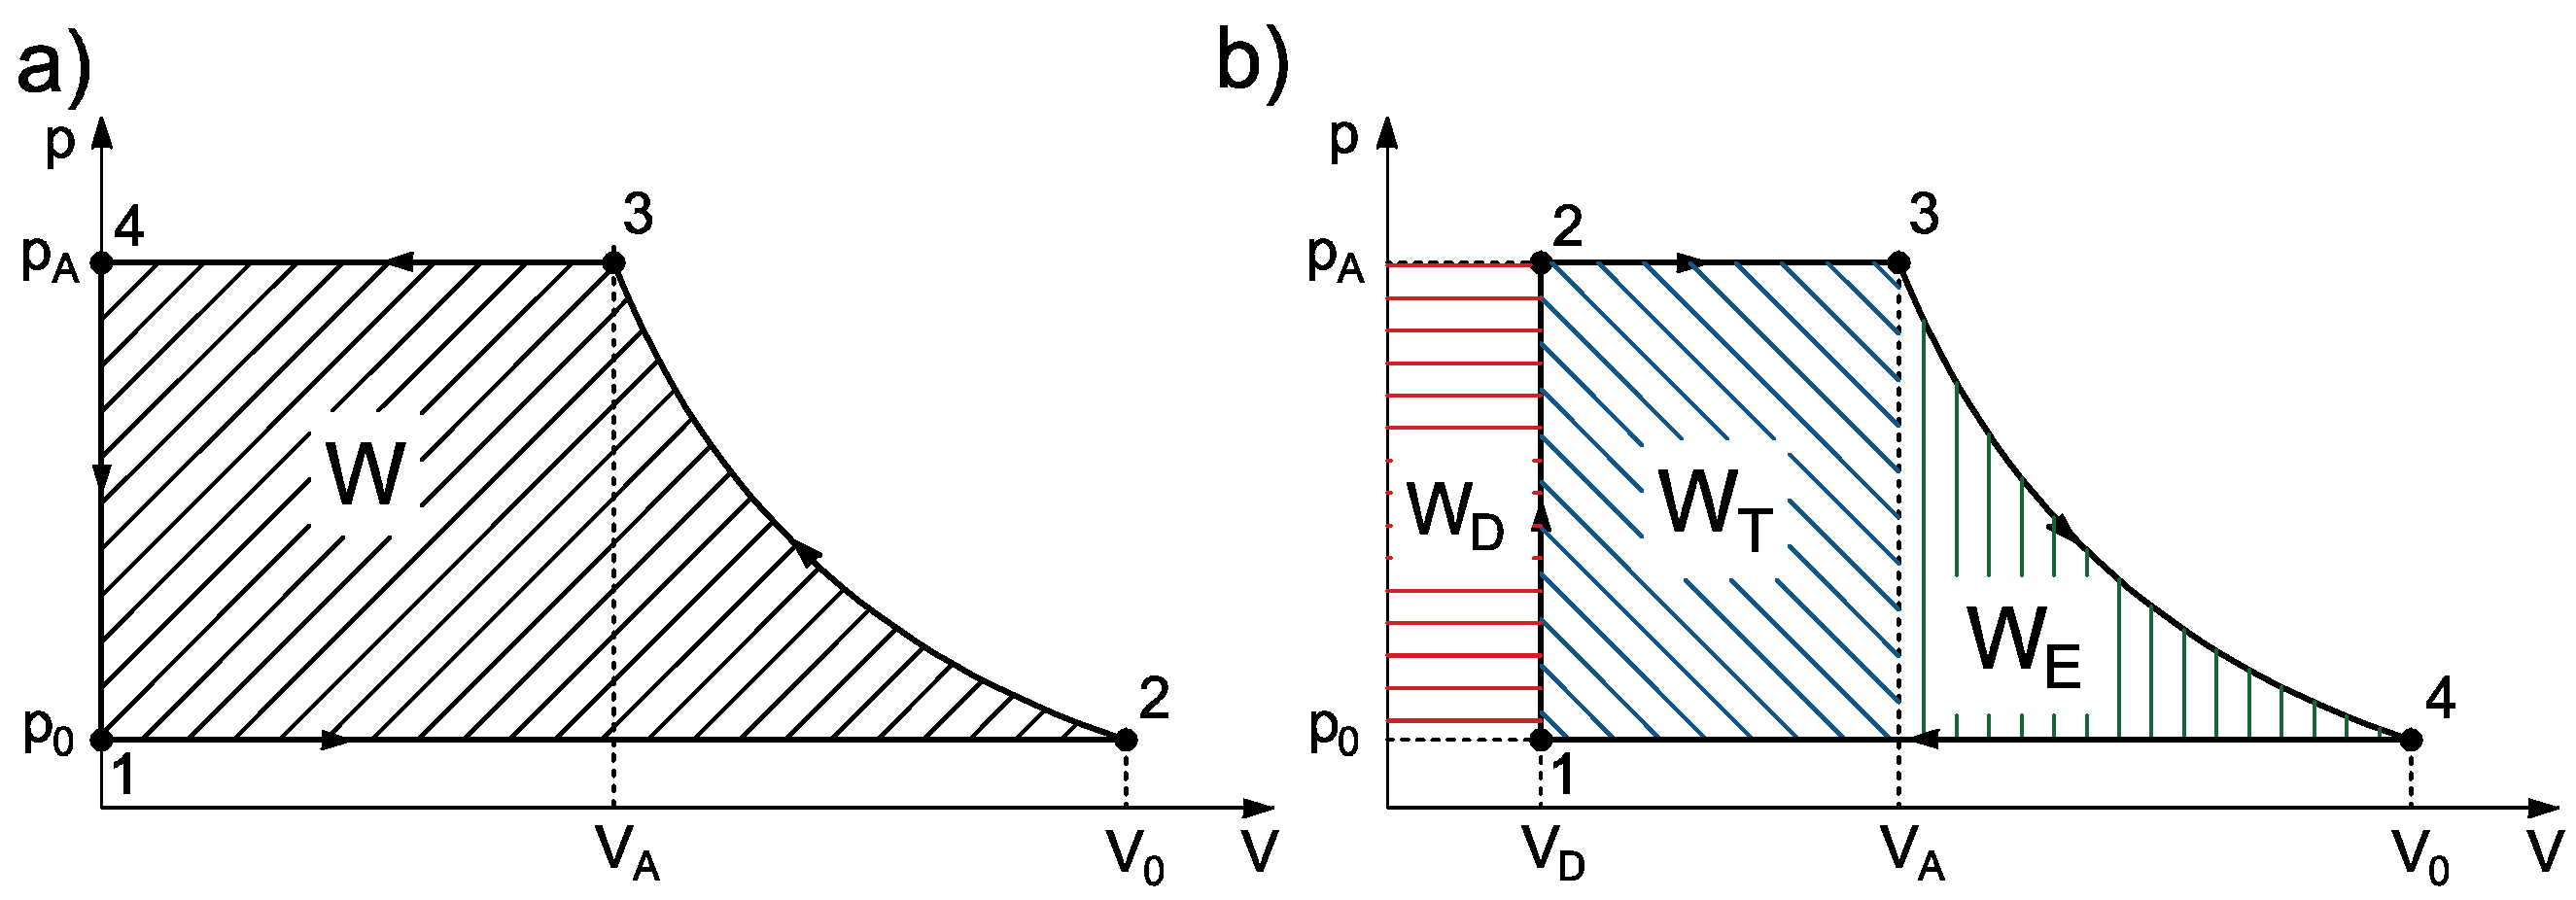