Article

Hydrogen Storage in Deep Saline Aquifers: Non-Recoverable Cushion Gas after Storage

by
Katarzyna Luboń
and
Radosław Tarkowski
*
Mineral and Energy Economy Research Institute, Polish Academy of Sciences, J. Wybickiego 7A, 31-261 Krakow, Poland
*
Author to whom correspondence should be addressed.
Energies 2024, 17(6), 1493; https://doi.org/10.3390/en17061493
Submission received: 29 January 2024 / Revised: 23 February 2024 / Accepted: 18 March 2024 / Published: 21 March 2024
(This article belongs to the Special Issue Green Hydrogen Economy in the Global Energy Transition)

Abstract

:
Underground hydrogen storage facilities require cushion gas to operate, which is an expensive one-time investment. Only some of this gas is recoverable after the end of UHS operation. A significant percentage of the hydrogen will remain in underground storage as non-recoverable cushion gas. Efforts must be made to reduce it. This article presents the results of modeling the cushion gas withdrawal after the end of cyclical storage operation. It was found that the amount of non-recoverable cushion gas is fundamentally influenced by the duration of the initial hydrogen filling period, the hydrogen flow rate, and the timing of the upconing occurrence. Upconing is one of the main technical barriers to hydrogen storage in deep saline aquifers. The ratio of non-recoverable cushion gas to cushion gas (NRCG/CG) decreases with an increasing amount of cushion gas. The highest ratio, 0.63, was obtained in the shortest 2-year initial filling period. The lowest ratio, 0.35, was obtained when utilizing the longest initial filling period of 4 years and employing the largest amount of cushion gas. The presented cases of cushion gas recovery can help investors decide which storage option is the most advantageous based on the criteria that are important to them.

1. Introduction

The green hydrogen economy is considered a potential successor to fossil fuel-based energy in the global energy transition [1,2]. It has been identified as an essential instrument in efforts toward global climate neutrality [3,4,5,6,7]. It is believed that, in the near future, hydrogen will be a key energy carrier in the transport, chemical, and metallurgical industries. In the long term, this also applies to the maritime and aviation sectors [8,9,10,11].
Hydrogen is currently produced from fossil fuels but can also be generated using renewable energy sources (RESs) through water electrolysis (green hydrogen) [2,12,13,14]. However, most RESs, such as wind or solar, are intermittent in production, and demand and energy production do not necessarily overlap. There is a need to store surplus energy during periods of increased supply to supplement deficiencies during increased demand. Renewable energy in the form of hydrogen produced in the large-scale water electrolysis process [2,15,16] will balance energy supply and demand, increase the efficiency of the energy network management, and improve energy security [2,15,17]. Ensuring suitable storage systems for hydrogen gas will pose a substantial challenge in the advancement of the hydrogen economy. The scale of hydrogen storage requires the use of various storage systems. Ekpotu et al. [18] discussed a historical review of hydrogen energy storage technologies. The types of hydrogen storage systems and their roles in the hydrogen economy were recently presented by Amirthan and Perera [19], and the prospects for underground hydrogen storage were characterized by Epelle et al. [20]. Al-Shafi et al. presented a review of underground gas storage systems to engage with this topic: sequestration of natural gas, hydrogen, and carbon dioxide [21]. It should also be emphasized that hydrogen storage on a small scale can be a solid hydrate [22].
Underground hydrogen storage requires the detailed consideration of numerous aspects: geological, technical, economic, and the social acceptance of this project. In particular, these aspects are concerned with geological characterization, screening, and ranking of geological structures suitable for this purpose, geochemical and microbial processes, storage integrity, storage performance, facilities and wells, economics and cost estimations, and the social embeddedness of UHS. These issues have been published in numerous studies today, including several review articles in this field [23,24,25,26]. Underground hydrogen storage requires legal regulations at the EU and individual country levels [27].
Due to its large capacity demand, underground hydrogen storage (UHS) in porous structures (deep aquifers) and caverns leached in salt deposits [23,24,28,29,30,31,32] is currently being considered. Several review articles have recently considered the issue of UHS. Aftab et al. [26] and Chen et al. [33] presented an analysis of the crucial aspects of underground hydrogen storage on an industrial scale. Raza et al. [34], Tarkowski and Uliasz-Misiak [35], Thiyagarajan et al. [36], Jafari Raad et al. [37], and Ma et al. [38] reviewed the challenges facing the implementation of this technology. Sambo et al. [39] characterized operational and potential UHS sites across the world.

1.1. State of the Art

Cushion gas and its role in UHS. UHS requires initial filling with a gas known as cushion gas (CG) [25,30,37,40,41,42]. As Heinemann et al. pointed out [42], cushion gas is one of the main factors controlling both the injection and withdrawal of hydrogen and, hence, directly impacting storage capacity. Cushion gas’s role is to create the minimum pressure to prevent water inflow into the storage space and ensure optimal gas injection and withdrawal from the underground storage. This gas remains in underground storage throughout its operation [42,43].
The sum of cushion gas (CG) and working gas (WG) represents the total volume of gas stored in an underground storage facility during its operation [44]. The cushion gas capacity in underground storage is influenced by the type of geological structure and the established scenario of gas injection and withdrawal, as well as the allowable pressures [42]. Cushion gas represents a significant cost in underground hydrogen-storage operations. Accurately determining the required cushion gas volume is crucial for a reliable estimate of the total cost of the UHS [42,45,46,47].
In the case of hydrogen storage, the share of cushion gas in underground storage is assessed differently. It is determined to range from approximately 22% [48] to two-thirds or more [49]. Bünger et al. [50] indicate that the share of cushion gas in the underground hydrogen storage of porous rocks was 40–50%, and in salt caverns, it was approximately 30%. In the case of depleted oil and gas fields, Bai et al. [51] and Zivar et al. [24] determined the amount to be approximately 33% and 33–80% for hydrogen storage in the aquifer. Muhammed et al. [52] calculated its share in the hydrogen storage of a salt cavern at 20–33%, in an aquifer at 45–80% and in a depleted oil or gas deposit at 50–60%. It is emphasized that using hydrogen as a cushion gas will be beneficial because it will affect the subsequent operating costs, which is also related to the need to purify the gas withdrawn [52]. The use of other gases as cushion gas is also being considered (CO2, CH4, N2) [36,46]. Saeed and Jadhawar [53] pointed out that the CG type can significantly impact the process’s recovery efficiency and hydrogen purity. Some researchers also show the advantages of using a gas other than hydrogen as a cushion gas [54,55]. Jahanbakhsh et al. [56] stated that using pure hydrogen as a cushion gas is not economically effective. From a flow point of view, he proposes other gases such as CO2, CH4, or N2 as more financially advantageous alternatives and chose nitrogen as the best for hydrogen storage. Higgs et al. [57] claimed that methane or nitrogen will be a better cushion gas economically than hydrogen. However, this may affect the purity of the withdrawn hydrogen. Kalam et al. [58] also proposed nitrogen, argon, and helium as suitable cushion gases for hydrogen storage, pointing to nitrogen as the best choice due to its abundance. Zhao et al. [46] indicate that the type of cushion gas plays a significant role in storage costs when considering hydrogen storage in saline aquifers. Chen et al. [33] examined many factors affecting the efficiency of UHS and concluded that cushion gas is one of the main economic factors that should be considered in UHS. Lin et al. [59] stated that the cushion gas could be included in working capital, assuming the possibility of selling it at the end of the storage life. Also, Heinemann et al. [45] proposed that hydrogen cushion gas would be a reserve in the event of an energy crisis. The research results mentioned above indicate the importance, from an economic point of view, of withdrawing as much cushion gas as possible from the underground hydrogen storage facility after its closure.
The ratio of cushion gas to working gas, extracted cyclically from the storage, is described in terms of the percentage of CG/WG. Research by Heinemann et al. [42] indicated that the CG/WG ratio varies depending on three geological parameters (reservoir depth, shape of trap, and permeability), and with subsequent injection cycles, the required ratio of CG/WG and the volume of water produced decrease. As Heinemann et al. point out [45], CG stored in the reservoir to support the production of the WG is a cost of CAPEX, which should be reduced to reduce the costs of implementing gas storage.
Preparation of underground storage for the cyclic operation. Simulations of hydrogen injection into deep saline aquifers show that the cushion gas can effectively displace the water present in formation from injection and withdrawal wells, creating conditions for the subsequent injection and withdrawal of hydrogen [60,61]. In relation to the numerical simulation of seasonal hydrogen storage in an anticline aquifer, Chai et al. [62] indicate that multiple cycles of hydrogen storage in an aquifer are helpful. They also point out that N2, as a cushion gas, performs better than CO2. In a nitrogen-injection scenario, the hydrogen-withdrawal phase has a very high recovery efficiency. By studying the solubility of carbon dioxide, utilized as a cushion gas during hydrogen storage, Wang et al. [63] found that approximately 58% of hydrogen can be withdrawn at a purity level above 98%. Ershadnia et al. [40] suggest that H2 recovery is successful if cushion gases other than hydrogen are considered, with low-density and viscosity injected before H2 storage. They also pointed out that if injection and withdrawal perforations are placed appropriately at the bottom and top of the aquifer, the shut-in period between the injection and withdrawal stages is minimized. Harati et al. [64] indicated that the efficiency of cyclic hydrogen withdrawal could reach around 70% without the need for upfront cushion gas injection, with the extraction of water from the aquifer having a minimal impact on the hydrogen withdrawal efficiency. Storage capacity and delivery capabilities increase as additional wells are added to the storage site [64]. Delshad et al. [65] found that cushion gas volumes strongly depend on the configuration of injection and production wells. In another work, Delshad et al. [66] examined various operational strategies and the arrangement of production wells to maximize the amount of working gas and minimize the cushion gas. The main takeaway is that effective hydrogen withdrawal involves strategic considerations. If another gas is used as a cushion gas, it should have low density and viscosity. Optimizing the placement of injection and withdrawal perforations in the aquifer is also noteworthy, as is exploring operational strategies for maximizing working gas capacity while minimizing the need for cushion gas.
One anticipated problem with hydrogen storage in aquifers is the high demand for cushion gas, compared to depleted gas reservoirs where the naturally occurring gas remaining in the reservoir can constitute a significant portion of the gas cushion [67].
When planning and designing the use of a depleted gas field for UHS, it is crucial to stop gas extraction at the correct time, which will enable the construction of a storage facility in less time and at a lower cost. The injection strategy, reservoir characteristics, and performance parameters significantly impact the performance of gas storage in depleted hydrocarbon deposits [24,52]. The results of a numerical simulation for seasonal hydrogen storage in hydrocarbon deposits [68] showed that implementing four annual hydrogen injection–withdrawal cycles after one more extended withdrawal period allows for a final hydrogen recovery factor of 87% to be obtained.
In the context of the presented article, the authors’ previous results on the simulation of hydrogen injection into the geological structures of deep saline aquifers are essential. A computer simulation of hydrogen injection performed for the Suliszewo structure showed that extracting a large amount of water could be a significant obstacle to the implementation of UHS [69] and determined the influence of the depth and the time of the initial filling with hydrogen on the subsequent UHS operation [43].
Our previous research focusing on the geological structure of Konary [70] was intended to determine the conditions for the preparation and operation of the UHS in the geological structure of Konary. This research defines the maximum injected hydrogen flow rate, total capacity, working gas, and cushion gas capacities. We analyzed three options for the initial hydrogen storage filling periods (2, 3, and 4 years), resulting in different cushion gas capacities. We assumed that the cushion gas needed is between 75% and 87%, which is the range for the shortest and longest initial filling period.

1.2. Objectives

In the literature on UHS facilities that use hydrogen as the cushion gas, issues related to preparation for the operation of an underground storage facility and the cyclical injection and withdrawal of this gas are usually analyzed. The withdrawal of hydrogen, which constitutes the cushion gas after the hydrogen storage is completed, is rarely discussed. Of interest is the amount of hydrogen that remains non-recoverable after the closure of the underground storage. From the point of view of the storage operator, the extent to which one can influence the amount of hydrogen withdrawn after the operation of the underground storage is completed is also worthy of note. As the authors’ previous results indicate [70], the answer should be sought when preparing the storage for cyclical operation.
The research conducted on modeling hydrogen withdrawal from an underground storage facility after the completion of its operation and closure of the storage facility had three goals:
  • To estimate the amount of hydrogen cushion gas that will remain in the geological structure as non-recoverable cushion gas (NRCG) at the end of the underground storage operations (gas injection and withdrawal);
  • To propose conditions for preparing the underground storage for operation in such a way as to limit as much as possible the amount of NRCG that will remain in the underground storage at the end of the work;
  • To present cushion gas recovery scenarios.

2. Materials and Methods

2.1. Geological Model of the Konary Structure and Previous Research

The Konary geological structure and the possibility of storing hydrogen and carbon dioxide are of interest to the authors [70,71,72]. The outline of the Konary structure model is presented in Figure 1. In the vertical section, the model of the reservoir was divided into 10 layers, each of which was assigned the designated values of porosity, permeability, and rock density, which are constant in each layer. The injection and subsequent hydrogen withdrawal would occur in one well located at the top of the Konary structure. The pressure and temperature in the model were determined based on the pressure and temperature gradient for each of the 10 separated layers. It was assumed that the structure’s model is impermeable from above and below the reservoir. The cells on the model’s side boundaries were given a large volume to simulate an open aquifer. In a previous work by Luboń and Tarkowski [70], fracturing pressure and capillary caprock pressure at the top of the reservoir layer were determined, and simulations of the three initial filling options (2, 3, and 4 years) were carried out. Then, a simulation of the 30 cycles operation (injection and withdrawal) of the UHS was performed. It was also assumed that hydrogen would not exceed the spill point (marked as a −1000 m isoline in Figure 1). The summary of the results of this research is presented in Table 1.
Hydrogen-injection simulations were carried out with the equation of the state 5 (EOS5) module in Transportation of Unsaturated Groundwater and Heat 2 (TOUGH2) software (version 5.4) [73]. TOUGH2 is a software package to simulate heat, mass, and transport flow in porous rocks and fractures. In the context of hydrogen storage, TOUGH2 can be used to simulate the processes involved in the injection and storage of hydrogen in underground geological formations such as porous rocks. EOS5 is one of the equations of state available in TOUGH2, which describes the thermodynamic properties of hydrogen in porous rocks. In the context of hydrogen, TOUGH2 can use EOS5 to model its behavior under different pressure and temperature conditions at different flow rates. It allows the modeling of various hydrogen storage conditions, such as injection, storage, and possible withdrawal. The software considers the flow of mass and heat in the deposit so it can be seen how hydrogen moves and diffuses in underground formations. It allows for assessing the possibility of hydrogen injection and withdrawal from the implemented model. The PVT relationships in TOUGH2 EOS5 for hydrogen are based on the principles of thermodynamics and use cubic equations of state that describe the thermodynamic properties of real gases. EOS5, which is a cubic equation, includes hydrogen-specific terms and coefficients. Detailed information on the algorithms, equations, and parameters used in the TOUGH2 program can be found in Pruess et al. [73].

2.2. Research Methodology and Assumptions

This article is a continuation of the authors’ previous results, particularly the impact of the initial filling options on the underground storage for cyclic operation. It constitutes the basis for modeling hydrogen withdrawal after closing the UHS, which is new in the presented work.
The modeling carried out for this article concerned the simulation of hydrogen withdrawal for 10 years after the closure of the 30-cyclical hydrogen storage. During the planning stage, it was assumed that the cushion gas withdrawal would be carried out until the upconing phenomenon, i.e., a significant increase in water extraction, occurred. The procedure is as follows:
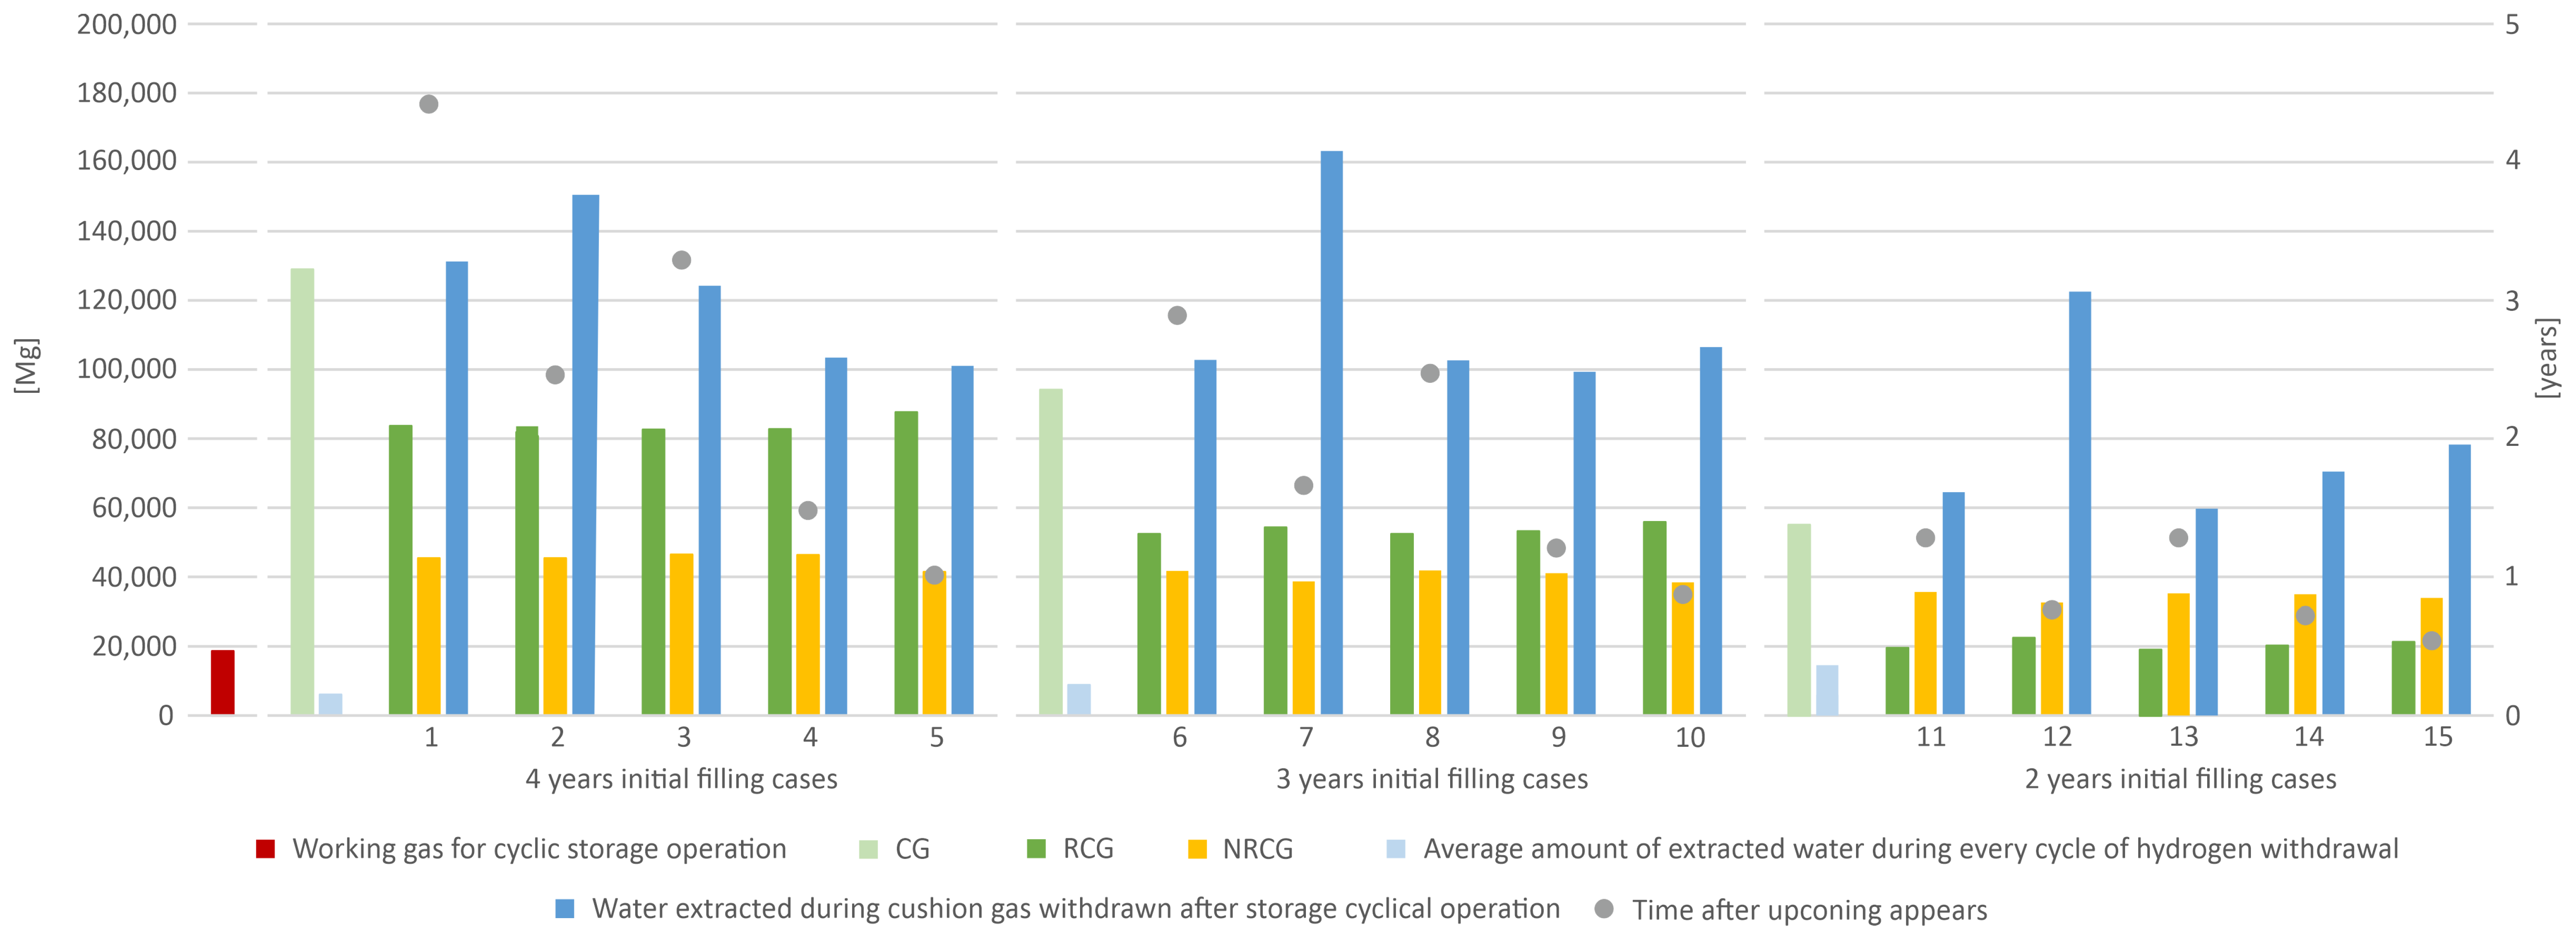
  • Simulation of cushion gas recovery across 10 years of operation after closing the storage for fifteen cases (five cases each for the 4, 3, and 2 years periods of initial filling shown in Table 2).
  • Determination of upconing for each of the 15 cases. The basis for determining the upconing was a significant (average above 80% in about a month) decrease in the hydrogen withdrawal and increased water extraction.
  • Calculation of recoverable cushion gas (RCG), non-recoverable cushion gas (NRCG), and the amount of extracted water for the designated upconing moment (in each of the 15 recovery cases).
After the hydrogen storage facility was closed (30 storage cycles), the modeling of the hydrogen cushion gas withdrawal was carried out. Five fluid flow rates were performed for each of the three initial filling periods (4, 3, and 2 years). Options 1, 6, and 11 used fluid flows determined in previous work [70] to achieve the desired hydrogen flow in each cycle, as shown in Table 2. For the initial filling period of 4 years, 1.54 kg/s of fluids was used; for 3 years, 1.71 kg/s was used; and for 2 years, 2.1 kg/s was used. In the second option, for each initial filling period (cases 2, 7, and 12, marked with an asterisk in Table 2), a constant hydrogen flow rate in the withdrawal well was assumed at 1.17 kg/s. This is the time-weighted hydrogen flow rate average from the initial injection period. The remaining cases (3, 4, 5, 8, 9, 10, 13, 14, 15) involved a constant flow of fluids in the well, 2 kg/s, 4 kg/s, and 6 kg/s, respectively.
The upconing moment was determined for the 15 cases considered, which involved reducing the hydrogen flow rate in the production well and increasing water extraction. The results of the simulation of hydrogen withdrawal up to the designated upconing moment allowed for the determination of recoverable cushion gas (RCG) for each of the 15 cases. By comparing RCG with the amount of CG, the non-recoverable cushion gas (NRCG) was calculated. The simulations also made it possible to determine the amount of water extracted during the recovery of the hydrogen CG. The calculation results were presented in absolute values and using the NRCG/CG ratio.

3. Results

Figure 2 shows the simulation results of hydrogen withdrawal (CG recovery) for 10 years for 15 analyzed cases. The individual graphs display the amount of hydrogen withdrawn (green) and extracted water (blue). The appearance of the upconing phenomenon (vertical red lines) was marked, corresponding to a sharp increase in water extraction and a decrease in hydrogen withdrawal (an average of above 80% in about a month).
A graph summarizing the CG recovery simulation results for the 15 analyzed cases is shown in Figure 3. It indicates the amount of WG (identical for all cases considered) used for the operation of the hydrogen storage (red on the left) and the amount of CG (light green color), which is different for each of the initial filling periods. The RCG is marked (green) depending on each of the 15 considered cases of CG recovery. The other values of NRCG (yellow) and time after upconing (grey dots), as well as the amount of water extracted through every cycle of hydrogen injection and withdrawal (light blue color), are presented similarly.
The values of the NRCG/CG ratio (color light blue) and WG/NRCG (color dark blue) ratio for each of the 15 considered cases of CG recovery are presented in Figure 4.
For the initial hydrogen filling period of 4 years (Figure 2, Table 3), with a fluid flow of cushion gas recovery of 1.54 kg/s (case 1), upconing was recorded after 4.42 years. In contrast, the phenomenon had already occurred after one year, with a fluid flow of cushion gas recovery of 6 kg/s (case 5). For the shortest initial injection period of 2 years, with a fluid flow of cushion gas recovery of 2 kg/s (case 13), upconing was recorded after 1.27 years, while with a fluid flow of cushion gas recovery of 6 kg/s (case 15) this occurred most quickly—after 0.53 years. The longer the initial hydrogen filling period and, thus, the greater the amount of CG, the lengthier the period of its withdrawal (until the upconing phenomenon occurred) after the end of the cyclical storage operation.
The amount of RCG increases after the cyclic storage operation as the length of the initial filling period increases (Table 3). With an initial filling period of 4 years (cases 1–5), this is, on average, approximately 84,000 Mg. For 3 years, approximately 54,000 Mg can be recovered, and for the initial filling period of 2 years, approximately 20,000 Mg can be recovered. The amount of the NRCG depends less on the length of the initial filling period than the amount of RCG (Table 3, Figure 3). For the largest amount of CG and, thus, the most extended initial filling period, this is less than 45,000 Mg; for 3 years, this is slightly over 40,000 Mg; and for the lowest volume of CG and the shortest initial filling period, this is almost 35,000 Mg (Table 3).
Based on the results obtained for the CG, RCG, and NRCG values, the NRCG/CG ratio and WG/NRCG ratio were calculated (Table 3, Figure 4). For a 4-year initial hydrogen filling period (cases 1–5), the NRCG/CG ratio was the smallest and amounted to approximately 0.35, while for 3-year period (cases 6–10), the value was 0.43, and for the 2-year period (cases 11–15), the value was 0.63 (Table 3, Figure 4). This shows that the largest quantity of CG was withdrawn during the most extended initial hydrogen filling period and, thus, constituted the largest volume of CG. Similar values were reported for the WG/NRCG ratio (Table 3, Figure 4). This is a ratio showing what part of the NRCG is WG. For a 4-year initial hydrogen filling period, the WG/NRCG ratio was the smallest and amounted to approximately 0.41, while for the 3-year period, this was 0.46, and for the 2-year period, this was 0.54. This shows that the greater the amount of CG, the greater the WG/NRCG ratio. It should be noted that the quantity of CG for each of these initial filling periods is different (light green bars in Figure 3).
It should also be noted that as the length of the initial hydrogen filling period increases, the amount of water extracted during the process of hydrogen withdrawal during the cyclic operation of the storage facility decreases (Figure 3). However, after 30 storage operation cycles, the longer the initial hydrogen filling period, the longer the recovery period and the greater the amount of extracted water during CG withdrawal. For the most extended initial filling period of 4 years, the amount of water extracted during the withdrawal of the CG was the greatest, amounting to approximately 122,000 Mg on average; for the 3-year injection period, the value is 115,000 Mg, and for the shortest period of 2 years, the value is 79,000 Mg (Table 3, Figure 3). A significantly higher quantity of water extracted was noted in the case of operation with a constant hydrogen flow rate (cases 2, 7, and 12).
The longer the initial hydrogen filling and, therefore, the greater the amount of CG injected into the storage at this stage, the longer the period of its recovery at the end of the storage operation (until the upconing phenomenon occurs). The amount of RCG after cyclic storage increases with the increase in the length of the initial filling period and, thus, with the rise in the amount of CG. The amount of NRCG depends to a lesser degree on the length of the initial filling period and, by extension, on the amount of CG. It decreases slightly as its volume decreases (the shortening of the initial filling period).
It should also be noted that as the length of the initial hydrogen filling period increases, the amount of extracted water in the course of hydrogen recovery during the cyclic storage operation decreases. However, after 30 storage cycles, the amount of extracted water in the process of CG withdrawal is the highest for the longest, 4-year initial filling period. This is because the CG recovery period increases. A much larger volume of extracted water is observed when operating with a constant hydrogen flow rate (cases 2, 7, and 12).
Regarding absolute values (expressed as mass), the 2-year option is best because, from an investor’s perspective, the final costs of hydrogen consumed as NRCG are significant. At the same time, adopting this option minimizes the cost of the CG at the initial filling stage. It should also be emphasized that each presented option (2, 3, and 4 years) allows for regular storage operation.

4. Discussion

Due to the high cost of cushion gas, which is H2, questions arise as to how much of it can be recovered after the end of the storage and what should be done to recover as much of it as possible. The research results indicate that when considering the amount of hydrogen to be recovered after storage, attention should be focused on limiting the amount of the cushion gas and on the upconing phenomenon at the end of the storage operation. This topic is essential because cushion gas is an expensive one-time investment. On the other hand, Heinemann et al. [45] observed that the recoverable portion of the cushion gas could serve as a strategic gas reserve, especially during an energy crisis. Lin et al. [59] propose that the cushion gas should be included in working capital, assuming the possibility of selling it at the end of the project/storage life.
The simulations presented, covering 10 years after the closure of the hydrogen storage facility, show that only some of the cushion gas is recoverable and that a significant percentage of the hydrogen will remain in underground storage as non-recoverable cushion gas (NRCG). The simulation of the cushion gas withdrawal allowed us to assess the amount of hydrogen remaining in the structure as NRCG in each of the 15 considered cases, covering the 4-, 3- and 2-year periods of initial hydrogen filling. The amount of NRCG is fundamentally influenced by the initial hydrogen filling period and the hydrogen flow rate, adapted to the allowable pressures of fracturing, the capillary caprock pressure, and the time when the upconing phenomenon was recorded [42,43,74].
Similar to the findings presented previously in the authors’ articles [43,69,70], the amount of cushion gas used changed with the elongation of the initial filling periods. Increasing the cushion gas (simultaneously increasing the CG/WG ratio) positively affects the subsequent operation of the storage because it reduces the amount of water extracted during hydrogen withdrawal. It was confirmed by the results of Heinemann et al. [42], showing that the amount of water extracted during hydrogen withdrawal decreases with an increase in the CG/WG ratio. Moreover, although nitrogen is used as a cushion gas, Pfeiffer et al. [75] agree that this initial period requires significant effort. Harati et al. [64] claim that it would be possible to operate a hydrogen storage facility without initial filling, i.e., without a cushion gas, but by using numerous wells and their appropriate configuration. The efficiency of cyclic hydrogen withdrawal in such a case could reach approximately 70% in the short term.
The simulation of cushion gas withdrawal allowed us to determine when upconing began. The longer the initial filling period, the later the upconing was recorded, and therefore, the more extensive the cushion gas, the lengthier the hydrogen withdrawal period after the end of the 30 operation cycles of the underground storage. The modeling results confirm previous observations [36,64,76] that upconing is one of the main technical barriers to hydrogen storage in deep saline aquifers. In the simulations of hydrogen injection and withdrawal shown by Chai et al. [62] and Sainz-Garcia et al. [48], as in the present paper, upconing depends on the duration of the initial hydrogen filling period. It is also affected by the option of the case to withdraw cushion gas at the end of the cyclical storage operation that was adopted in the article. In the case of the initial filling period of 2 years and thus the least amount of cushion gas, upconing occurs most quickly, and depending on the flow rate, this is between 0.53 and 1.27 years. However, for the 4-year option (the greatest amount of cushion gas), upconing is observed after a much more extended period of between 1 and 4.42 years. This phenomenon can be delayed by reducing the flow rate of fluids in the withdrawal well [77,78], which is also confirmed by the results of the presented article. The issue of upconing is especially noticeable when we operate the storage with one well, which is used for both the withdrawal and injection of hydrogen, as was presumed in this paper. Appropriate well-placement strategies [30,68] can help solve this problem. The Oldenburg et al. [79] analysis showed that horizontal permeability provides a stronger regulator on upconing if permeability is low and less sensitive when permeability is high. Upconing is also an issue when gases other than hydrogen are utilized as cushion gas [62,63].
The simulation of cushion gas withdrawal allowed us to determine the amount of water extracted through the cushion gas withdrawal. After 30 storage operation cycles, the longer the initial filling period, the longer the recovery period, and the greater the amount of extracted water during cushion gas withdrawal. In the case of the most extended initial filling period of 4 years, the greatest amount of water was extracted during the withdrawal of the cushion gas. The extraction of significantly more water was noted in the case of an operation with a constant hydrogen flow rate.
The 15 presented cases of cushion gas recovery allow the investor to decide on the method of storage (30 cycles) and the final plan of the cushion gas recovery. The two extreme groups of cases considered1–5, i.e., those with the 4-year first filling option, and 11–15, i.e., the 2-year first filling option—each have advantages and disadvantages. For the group of cases with a 4-year first filling option, the disadvantage is the large volume of the cushion gas. Still, the advantage is the small amount of water extracted during cyclic hydrogen withdrawal. The disadvantage for the cases with the 2-year first filling option is that a large amount of water is extracted during cyclic hydrogen withdrawal. The advantage is the small volume of the expensive cushion gas. The amount of recoverable and non-recoverable cushion gas for these two cases differs significantly, and both RCG and NRCG are larger for the 4-year injection period. However, it should be remembered that the size of the cushion gas is different for the initial injection periods considered, and the largest amount of RCG does not necessarily mean the best case because it is also associated with the largest amount of NRCG.
Therefore, the NRCG/CG and WG/NRCG ratios may help choose a cushion-gas-withdrawal scenario. The highest NRCG/CG ratio of 0.63 was obtained during the shortest 2-year initial filling period and thus used the least amount of cushion gas. However, the lowest value for this ratio, 0.35, was obtained during the longest initial filling period of 4 years, utilizing the largest amount of cushion gas. Concerning the working gas, the WG/NRCG ratio provides similar dependences—the shorter the initial filling period (i.e., the lower the volume of cushion gas), the higher the ratio, in the range of 0.41–0.54. Generally, the lower the ratio of both NRCG/CG and WG/NRCG, the better it is for the storage operation. The smaller the NRCG/CG ratio, the less cushion gas will remain unrecoverable and, therefore, lost. A lower WG/NRCG ratio also means that less cushion gas relative to the working gas will be lost. This would suggest that the group of cases for 4-year first filling option is the best in terms of cushion gas recovery and cyclic operation. However, it should be remembered that this group requires the highest investment outlays for the largest cushion gas.
Individual cases for each first filling option should also be taken into account. It can be concluded that the higher the flow rate we use, the faster we will complete the RCG withdrawal process (i.e., the faster the upconing will take place). For the group of 4-year cases, the first filling option (1–5) decreases the total water extraction, while for the remaining cases (6–15), it increases. When a constant hydrogen flow is used, the amount of water extracted is the highest of all options. RCG for each first filling option and each of the 15 cases increases with the increase in flow.
When analyzing the results of the conducted research, it should be remembered that they concern the considered geological structure of Konary. Considering the heterogeneity of underground geological structures in saline aquifers, the results of similar considerations in a different structure (especially with other parameters such as porosity, permeability, temperature, and pressure) may give different results. The relationship between various geological parameters may be a good field for future research. For example, Luboń and Tarkowski [43] researched the initial filling period and operation of hydrogen storage at different depths for a different geological structure [70].

5. Conclusions

Underground hydrogen storage facilities require cushion gas, which is an expensive one-time investment. Only some of this gas is recoverable after the end of the UHS operation. A significant percentage of the hydrogen will remain in the underground storage as non-recoverable cushion gas. Efforts must be made to reduce it.
The presented results of modeling the cushion gas withdrawal after the end of a cyclical storage operation carried out on a selected geological structure show that the amount of non-recoverable cushion gas is fundamentally influenced by the duration of the initial hydrogen filling period, the hydrogen flow rate, and the timing of the upconing occurrence. Upconing is one of the main technical barriers to hydrogen storage in deep saline aquifers. The longer the initial filling period, the later the upconing occurs.
The ratio of non-recoverable cushion gas to cushion gas (NRCG/CG) decreases with an increasing amount of cushion gas and, for the analyzed Konary structure, varies in the range of 0.35–0.63. The highest NRCG/CG ratio was obtained in the shortest 2 years initial filling period. The lowest value was obtained when utilizing the longest initial filling period of 4 years and employing the largest cushion gas.
The presented cases of cushion gas recovery can help the investor decide which scenario is the most advantageous based on the criteria they consider important.

Author Contributions

Conceptualization, K.L. and R.T.; methodology, K.L.; software, K.L.; validation, K.L. and R.T.; formal analysis, R.T.; investigation, K.L.; resources, R.T.; data curation, R.T.; writing—original draft preparation, K.L. and R.T.; writing—review and editing, K.L. and R.T.; visualization, K.L.; supervision, R.T.; project administration, R.T.; funding acquisition, R.T. All authors have read and agreed to the published version of the manuscript.

Funding

This work was supported by the Mineral and Energy Economy Research Institute of the Polish Academy of Sciences (research subvention).

Data Availability Statement

The original contributions presented in the study are included in the article, further inquiries can be directed to the corresponding author.

Conflicts of Interest

The authors declare no conflicts of interest.

Nomenclature

UHSunderground hydrogen storage
RESrenewable energy sources
Total storage capacitythe total amount of hydrogen injected into the structure at a given time, not exceeding allowable pressures and the spill point
WGworking gas—the amount of hydrogen that can be withdrawn from storage at a given time and flow rate
CGcushion gas—is the share of gas left in the reservoir, which is used to pressurize the reservoir to reach the target hydrogen withdrawal rate; it is the capacity difference between total storage capacity and working gas
CG/WGratio of cushion gas to working gas; a mass of injected and withdrawn hydrogen as WG relative to the mass of CG present in the reservoir
RCGrecoverable cushion gas
NRCGnon-recoverable cushion gas
NRCG/CGnon-recoverable cushion gas to cushion gas ratio; determines what part of the CG is left in storage after closure
WG/NRCGratio of working gas to non-recoverable cushion gas; determines what part of the NRCG is WG

References

  1. Abdin, Z.; Zafaranloo, A.; Rafiee, A.; Mérida, W.; Lipiński, W.; Khalilpour, K.R. Hydrogen as an energy vector. Renew. Sustain. Energy Rev. 2020, 120, 109620. [Google Scholar] [CrossRef]
  2. Noussan, M.; Raimondi, P.P.; Scita, R.; Hafner, M. The role of green and blue hydrogen in the energy transition—A technological and geopolitical perspective. Sustainability 2021, 13, 298. [Google Scholar] [CrossRef]
  3. Hanley, E.S.; Deane, J.; Gallachóir, B.Ó. The role of hydrogen in low carbon energy futures—A review of existing perspectives. Renew. Sustain. Energy Rev. 2018, 82, 3027–3045. [Google Scholar] [CrossRef]
  4. Tagliapietra, S.; Zachmann, G.; Edenhofer, O.; Glachant, J.M.; Linares, P.; Loeschel, A. The European union energy transition: Key priorities for the next five years. Energy Policy 2019, 132, 950–954. [Google Scholar] [CrossRef]
  5. COM/2020/301. Available online: https://eur-lex.europa.eu/legal-content/PL/TXT/?uri=CELEX:52020DC0301 (accessed on 30 December 2020).
  6. Ramesh Kumar, K.; Honorio, H.; Chandra, D.; Lesueur, M.; Hajibeygi, H. Comprehensive review of geomechanics of underground hydrogen storage in depleted reservoirs and salt caverns. J. Energy Storage 2023, 73, 108912. [Google Scholar] [CrossRef]
  7. Hassan, Q.; Sameen, A.Z.; Salman, H.M.; Jaszczur, M.; Al-Jiboory, A.K. Hydrogen energy future: Advancements in storage technologies and implications for sustainability. J. Energy Storage 2023, 72, 108404. [Google Scholar] [CrossRef]
  8. Arenillas, I.A.; Ortega, M.F.; Torrent, J.G.; Moya, B.L. Hydrogen as an Energy Vector: Present and Future. In Sustaining Tomorrow via Innovative Engineering; Ting, D.S.-K., Carriveau, R., Eds.; World Scientific: Singapore, 2021; pp. 83–129. [Google Scholar]
  9. Chapman, A.; Itaoka, K.; Hirose, K.; Davidson, F.T.; Nagasawa, K.; Lloyd, A.C.; Webber, M.E.; Kurban, Z.; Managi, S.; Tamaki, T.; et al. A review of four case studies assessing the potential for hydrogen penetration of the future energy system. Int. J. Hydrogen Energy 2019, 44, 6371–6382. [Google Scholar] [CrossRef]
  10. OECD. The Future of Hydrogen: Seizing Today’s Opportunities; OECD: Paris, France, 2019. [Google Scholar]
  11. Ghorbani, B.; Zendehboudi, S.; Saady, N.M.C.; Dusseault, M.B. Hydrogen storage in North America: Status, prospects, and challenges. J. Environ. Chem. Eng. 2023, 11, 109957. [Google Scholar] [CrossRef]
  12. Nikolaidis, P.; Poullikkas, A. A comparative overview of hydrogen production processes. Renew. Sustain. Energy Rev. 2017, 67, 597–611. [Google Scholar] [CrossRef]
  13. Olabi, A.G.; Bahri, A.S.; Abdelghafar, A.A.; Baroutaji, A.; Sayed, E.T.; Alami, A.H.; Rezk, H.; Abdelkareem, M.A. Large-vscale hydrogen production and storage technologies: Current status and future directions. Int. J. Hydrogen Energy 2021, 46, 23498–23528. [Google Scholar] [CrossRef]
  14. Yang, M.; Hunger, R.; Berrettoni, S.; Sprecher, B.; Wang, B. A review of hydrogen storage and transport technologies. Clean Energy 2023, 7, 190–216. [Google Scholar] [CrossRef]
  15. Schultz, R.A.; Heinemann, N.; Horváth, B.; Wickens, J.; Miocic, J.M.; Babarinde, O.O.; Cao, W.; Capuano, P.; Dewers, T.A.; Dusseault, M.; et al. An overview of underground energy-related product storage and sequestration. Geol. Soc. Lond. Spec. Publ. 2023, 528, 15–35. [Google Scholar] [CrossRef]
  16. Taie, Z.; Villaverde, G.; Speaks Morris, J.; Lavrich, Z.; Chittum, A.; White, K.; Hagen, C. Hydrogen for heat: Using underground hydrogen storage for seasonal energy shifting in northern climates. Int. J. Hydrogen Energy 2021, 46, 3365–3378. [Google Scholar] [CrossRef]
  17. Maggio, G.; Nicita, A.; Squadrito, G. How the hydrogen production from RES could change energy and fuel markets: A review of recent literature. Int. J. Hydrogen Energy 2019, 44, 11371–11384. [Google Scholar] [CrossRef]
  18. Ekpotu, W.F.; Akintola, J.; Obialor, M.C.; Philemon, U. Historical Review of Hydrogen Energy Storage Technology. World J. Eng. Technol. 2023, 11, 454–475. [Google Scholar] [CrossRef]
  19. Amirthan, T.; Perera, M.S.A. The role of storage systems in hydrogen economy: A review. J. Nat. Gas Sci. Eng. 2022, 108, 104843. [Google Scholar] [CrossRef]
  20. Epelle, E.I.; Obande, W.; Udourioh, G.A.; Afolabi, I.C.; Desongu, K.S.; Orivri, U.; Gunes, B.; Okolie, J.A. Perspectives and prospects of underground hydrogen storage and natural hydrogen. Sustain. Energy Fuels 2022, 6, 3324–3343. [Google Scholar] [CrossRef]
  21. Al-Shafi, M.; Massarweh, O.; Abushaikha, A.S.; Bicer, Y. A review on underground gas storage systems: Natural gas, hydrogen and carbon sequestration. Energy Rep. 2023, 9, 6251–6266. [Google Scholar] [CrossRef]
  22. Zhang, J.; Li, Y.; Yin, Z.; Linga, P.; He, T.; Zheng, X. Coupling amino acid L-Val with THF for superior hydrogen hydrate kinetics: Implication for hydrate-based hydrogen storage. Chem. Eng. J. 2023, 467, 143459. [Google Scholar] [CrossRef]
  23. Tarkowski, R. Underground Hydrogen Storage: Characteristics and prospects. Renew. Sustain. Energy Rev. 2019, 105, 86–94. [Google Scholar] [CrossRef]
  24. Zivar, D.; Kumar, S.; Foroozesh, J. Underground hydrogen storage: A comprehensive review. Int. J. Hydrogen Energy 2021, 46, 23436–23462. [Google Scholar] [CrossRef]
  25. Miocic, J.; Heinemann, N.; Edlmann, K.; Scafidi, J.; Molaei, F.; Alcalde, J. Underground hydrogen storage: A review. Geol. Soc. Lond. Spec. Publ. 2023, 528, 73–86. [Google Scholar] [CrossRef]
  26. Aftab, A.; Hassanpouryouzband, A.; Xie, Q.; Machuca, L.L.; Sarmadivaleh, M. Toward a Fundamental Understanding of Geological Hydrogen Storage. Ind. Eng. Chem. Res. 2022, 61, 3233–3253. [Google Scholar] [CrossRef]
  27. Martinez, S.; Simon, J. Assessment of the Regulatory Framework; Hystories Deliverable D6.1-1. 2021. Available online: https://hystories.eu/wp-content/uploads/2022/05/Hystories_D.6.1-1-Assessment-of-the-regulatory-framework.pdf (accessed on 20 March 2024).
  28. Tarkowski, R. Perspectives of using the geological subsurface for hydrogen storage in Poland. Int. J. Hydrogen Energy 2017, 42, 347–355. [Google Scholar] [CrossRef]
  29. Muhammed, S.N.; Haq, B.; Al Sheri, D.; Al-Ahmed, A.; Rahman, M.M.; Zaman, E. A review on underground hydrogen storage: Insight into geological sites, influencing factors and future outlook. Energy Rep. 2022, 8, 461–499. [Google Scholar] [CrossRef]
  30. Navaid, H.B.; Emadi, H.; Watson, M. A comprehensive literature review on the challenges associated with underground hydrogen storage. Int. J. Hydrogen Energy 2023, 48, 10603–10635. [Google Scholar] [CrossRef]
  31. Miocic, J.M.; Heinemann, N.; Alcalde, J.; Edlmann, K.; Schultz, R.A. Enabling secure subsurface storage in future energy systems: An introduction. Geol. Soc. Lond. Spec. Publ. 2023, 528, 1–14. [Google Scholar] [CrossRef]
  32. Tarkowski, R.; Lankof, L.; Luboń, K.; Michalski, J. Hydrogen storage capacity of salt caverns and deep aquifers versus demand for hydrogen storage: A case study of Poland. Appl. Energy 2024, 355, 122268. [Google Scholar] [CrossRef]
  33. Chen, Y.; Jin, X.; Zeng, L.; Zhong, Z.; Mehana, M.; Xiao, W.; Pu, W.; Regenauer-Lieb, K.; Xie, Q. Role of large-scale underground hydrogen storage and its pathways to achieve net-zero in China. J. Energy Storage 2023, 72, 108448. [Google Scholar] [CrossRef]
  34. Raza, A.; Arif, M.; Glatz, G.; Mahmoud, M.; Al Kobaisi, M.; Alafnan, S.; Iglauer, S. A holistic overview of underground hydrogen storage: Influencing factors, current understanding, and outlook. Fuel 2022, 330, 125636. [Google Scholar] [CrossRef]
  35. Tarkowski, R.; Uliasz-Misiak, B. Towards underground hydrogen storage: A review of barriers. Renew. Sustain. Energy Rev. 2022, 162, 112451. [Google Scholar] [CrossRef]
  36. Thiyagarajan, S.R.; Emadi, H.; Hussain, A.; Patange, P.; Watson, M. A comprehensive review of the mechanisms and efficiency of underground hydrogen storage. J. Energy Storage 2022, 51, 104490. [Google Scholar] [CrossRef]
  37. Jafari Raad, S.M.; Leonenko, Y.; Hassanzadeh, H. Hydrogen storage in saline aquifers: Opportunities and challenges. Renew. Sustain. Energy Rev. 2022, 168, 112846. [Google Scholar] [CrossRef]
  38. Ma, N.; Zhao, W.; Wang, W.; Li, X.; Zhou, H. Large scale of green hydrogen storage: Opportunities and challenges. Int. J. Hydrogen Energy 2024, 50, 379–396. [Google Scholar] [CrossRef]
  39. Sambo, C.; Dudun, A.; Samuel, S.A.; Esenenjor, P.; Muhammed, N.S.; Haq, B. A review on worldwide underground hydrogen storage operating and potential fields. Int. J. Hydrogen Energy 2022, 47, 22840–22880. [Google Scholar] [CrossRef]
  40. Ershadnia, R.; Singh, M.; Mahmoodpour, S.; Meyal, A.; Moeini, F.; Hosseini, S.A.; Sturmer, D.M.; Rasoulzadeh, M.; Dai, Z.; Soltanian, M.R. Impact of geological and operational conditions on underground hydrogen storage. Int. J. Hydrogen Energy 2023, 48, 1450–1471. [Google Scholar] [CrossRef]
  41. Muhammed, N.S.; Gbadamosi, A.O.; Epelle, E.I.; Abdulrasheed, A.A.; Haq, B.; Patil, S.; Al-Shehri, D.; Kamal, M.S. Hydrogen production, transportation, utilization, and storage: Recent advances towards sustainable energy. J. Energy Storage 2023, 73, 109207. [Google Scholar] [CrossRef]
  42. Heinemann, N.; Scafidi, J.; Pickup, G.; Thaysen, E.M.; Hassanpouryouzband, A.; Wilkinson, M.; Satterley, A.K.; Booth, M.G.; Edlmann, K.; Haszeldine, R.S. Hydrogen storage in saline aquifers: The role of cushion gas for injection and production. Int. J. Hydrogen Energy 2021, 46, 39284–39296. [Google Scholar] [CrossRef]
  43. Luboń, K.; Tarkowski, R. The influence of the first filling period length and reservoir level depth on the operation of underground hydrogen storage in a deep aquifer. Int. J. Hydrogen Energy 2023, 48, 1024–1042. [Google Scholar] [CrossRef]
  44. Amid, A.; Mignard, D.; Wilkinson, M. Seasonal storage of hydrogen in a depleted natural gas reservoir. Int. J. Hydrogen Energy 2016, 41, 5549–5558. [Google Scholar] [CrossRef]
  45. Heinemann, N.; Wilkinson, M.; Adie, K.; Edlmann, K.; Thaysen, E.M.; Hassanpouryouzband, A.; Haszeldine, R.S. Cushion Gas in Hydrogen Storage—A Costly CAPEX or a Valuable Resource for Energy Crises? Hydrogen 2022, 3, 550–563. [Google Scholar] [CrossRef]
  46. Zhao, Q.; Wang, Y.; Chen, C. Numerical simulation of the impact of different cushion gases on underground hydrogen storage in aquifers based on an experimentally-benchmarked equation-of-state. Int. J. Hydrogen Energy, 2023, in press. [CrossRef]
  47. Scafidi, J.; Schirrer, L.; Vervoort, I.; Heinemann, N. An open-source tool for the calculation of field deliverability and cushion gas requirements in volumetric gas reservoir storage sites. Geol. Soc. Lond. Spec. Publ. 2022, 528, 267–283. [Google Scholar] [CrossRef]
  48. Sainz-Garcia, A.; Abarca, E.; Rubi, V.; Grandia, F. Assessment of feasible strategies for seasonal underground hydrogen storage in a saline aquifer. Int. J. Hydrogen Energy 2017, 42, 16657–16666. [Google Scholar] [CrossRef]
  49. Foh, S.; Novil, M.; Rockar, E.; Randolph, P. Underground Hydrogen Storage; Final Report; Brookhaven National Laboratory: Upton, NY, USA, 1979. [Google Scholar]
  50. Bünger, U.; Michalski, J.; Crotogino, F.; Kruck, O. Large-scale underground storage of hydrogen for the grid integration of renewable energy and other applications. In Compendium of Hydrogen Energy; Ball, M., Basile, A., Veziroğlu, T.N., Eds.; Elsevier, Woodhead Publishing: Boston, MA, USA, 2016; pp. 133–163. ISBN 978-1-78242-364-5. [Google Scholar]
  51. Bai, M.; Song, K.; Sun, Y.; He, M.; Li, Y.; Sun, J. An overview of hydrogen underground storage technology and prospects in China. J. Pet. Sci. Eng. 2014, 124, 132–136. [Google Scholar] [CrossRef]
  52. Muhammed, N.S.; Haq, M.B.; Al Shehri, D.A.; Al-Ahmed, A.; Rahman, M.M.; Zaman, E.; Iglauer, S. Hydrogen storage in depleted gas reservoirs: A comprehensive review. Fuel 2023, 337, 127032. [Google Scholar] [CrossRef]
  53. Saeed, M.; Jadhawar, P. Optimizing underground hydrogen storage in aquifers: The impact of cushion gas type. Int. J. Hydrogen Energy 2023, 52, 1537–1549. [Google Scholar] [CrossRef]
  54. Huang, T.; Moridis, G.J.; Blasingame, T.A.; Abdulkader, A.M.; Yan, B. Compositional reservoir simulation of underground hydrogen storage in depleted gas reservoirs. Int. J. Hydrogen Energy 2023, 48, 36035–36050. [Google Scholar] [CrossRef]
  55. Wang, J.; Wu, R.; Wei, M.; Bai, B.; Xie, J.; Li, Y. A comprehensive review of site selection, experiment and numerical simulation for underground hydrogen storage. Gas Sci. Eng. 2023, 118, 205105. [Google Scholar] [CrossRef]
  56. Jahanbakhsh, A.; Louis Potapov-Crighton, A.; Mosallanezhad, A.; Tohidi Kaloorazi, N.; Maroto-Valer, M.M. Underground hydrogen storage: A UK perspective. Renew. Sustain. Energy Rev. 2024, 189, 114001. [Google Scholar] [CrossRef]
  57. Higgs, S.; Da Wang, Y.; Sun, C.; Ennis-King, J.; Jackson, S.J.; Armstrong, R.T.; Mostaghimi, P. Comparative analysis of hydrogen, methane and nitrogen relative permeability: Implications for Underground Hydrogen Storage. J. Energy Storage 2023, 73, 108827. [Google Scholar] [CrossRef]
  58. Kalam, S.; Abu-Khamsin, S.A.; Kamal, M.S.; Abbasi, G.R.; Lashari, N.; Patil, S.; Abdurrahman, M. A Mini-Review on Underground Hydrogen Storage: Production to Field Studies. Energy Fuels 2023, 37, 8128–8141. [Google Scholar] [CrossRef]
  59. Lin, N.; Xu, L.; Moscardelli, L.G. Market-based asset valuation of hydrogen geological storage. Int. J. Hydrogen Energy 2024, 49, 114–129. [Google Scholar] [CrossRef]
  60. Alms, K.; Ahrens, B.; Graf, M.; Nehler, M. Linking geological and infrastructural requirements for large-scale underground hydrogen storage in Germany. Front. Energy Res. 2023, 11, 1172003. [Google Scholar] [CrossRef]
  61. Kanaani, M.; Sedaee, B.; Asadian-Pakfar, M. Role of Cushion Gas on Underground Hydrogen Storage in Depleted Oil Reservoirs. J. Energy Storage 2022, 45, 103783. [Google Scholar] [CrossRef]
  62. Chai, M.; Chen, Z.; Nourozieh, H.; Yang, M. Numerical simulation of large-scale seasonal hydrogen storage in an anticline aquifer: A case study capturing hydrogen interactions and cushion gas injection. Appl. Energy 2023, 334, 120655. [Google Scholar] [CrossRef]
  63. Wang, G.; Pickup, G.; Sorbie, K.; Mackay, E. Numerical modelling of H2 storage with cushion gas of CO2 in subsurface porous media: Filter effects of CO2 solubility. Int. J. Hydrogen Energy 2022, 47, 28956–28968. [Google Scholar] [CrossRef]
  64. Harati, S.; Rezaei, S.; Gasanzade, F.; Bauer, S.; Pak, T.; Orr, C. Underground hydrogen storage to balance seasonal variations in energy demand: Impact of well configuration on storage performance in deep saline aquifers. Int. J. Hydrogen Energy, 2023, in press. [CrossRef]
  65. Delshad, M.; Alhotan, M.; Fernandes, B.R.B.; Umurzakov, Y.; Sepehrnoori, K. Pros and Cons of Saline Aquifers Against Depleted Hydrocarbon Reservoirs for Hydrogen Energy Storage. In Proceedings of the SPE Annual Technical Conference and Exhibition, Houston, TX, USA, 3–5 October 2022; p. SPE-210351-MS. [Google Scholar]
  66. Delshad, M.; Alhotan, M.M.; Fernandes, B.R.B.; Umurzakov, Y.; Sepehrnoori, K. Modeling Flow and Transport in Saline Aquifers and Depleted Hydrocarbon Reservoirs for Hydrogen Energy Storage. SPE J. 2023, 28, 2547–2565. [Google Scholar] [CrossRef]
  67. Josephs, R.E.; Porlles, J.; Tomomewo, O.S.; Gyimah, E.; Ebere, F. Geo-mechanical characterization of a well to store hydrogen. In Proceedings of the 57th US Rock Mechanics/Geomechanics Symposium, Atlanta, GG, USA, 25–28 June 2023; p. ARMA-2023-0528. [Google Scholar]
  68. Lysyy, M.; Fernø, M.; Ersland, G. Seasonal hydrogen storage in a depleted oil and gas field. Int. J. Hydrogen Energy 2021, 46, 25160–25174. [Google Scholar] [CrossRef]
  69. Luboń, K.; Tarkowski, R. Numerical simulation of hydrogen injection and withdrawal to and from a deep aquifer in NW Poland. Int. J. Hydrogen Energy 2020, 45, 2068–2083. [Google Scholar] [CrossRef]
  70. Luboń, K.; Tarkowski, R. Numerical simulation of hydrogen storage in the Konary deep saline aquifer trap. Gospod. Surowcami Miner.-Miner. Resour. Manag. 2023, 39, 103–124. [Google Scholar] [CrossRef]
  71. Luboń, K. CO2 storage capacity of a deep aquifer depending on the injection well location and cap rock capillary pressure. Gospod. Surowcami Miner./Miner. Resour. Manag. 2020, 36, 173–196. [Google Scholar] [CrossRef]
  72. Luboń, K. Influence of Injection Well Location on CO2 Geological Storage Efficiency. Energies 2021, 14, 8604. [Google Scholar] [CrossRef]
  73. Pruess, K.; Oldenburg, C.; Moridis, G. TOUGH2 User’s Guide, 2nd ed.; LBNL-43134; Lawrence Berkeley National Laboratory: Berkeley, CA, USA, 1999; pp. 1–197. [Google Scholar]
  74. Cavanagh, A. Pressurisation and Brine Displacement Issues for Deep Saline Formation CO2 Storage; Report 2010/15; IEAGHG: Cheltenham, UK, 2010. [Google Scholar]
  75. Pfeiffer, W.T.; Beyer, C.; Bauer, S. Hydrogen storage in a heterogeneous sandstone formation: Dimensioning and induced hydraulic effects. Pet. Geosci. 2017, 23, 315–326. [Google Scholar] [CrossRef]
  76. Wallace, R.L.; Cai, Z.; Zhang, H.; Zhang, K.; Guo, C. Utility-scale subsurface hydrogen storage: UK perspectives and technology. Int. J. Hydrogen Energy 2021, 46, 25137–25159. [Google Scholar] [CrossRef]
  77. Heinemann, N.; Alcalde, J.; Miocic, J.M.; Hangx, S.J.T.; Kallmeyer, J.; Ostertag-Henning, C.; Hassanpouryouzband, A.; Thaysen, E.M.; Strobel, G.J.; Schmidt-Hattenberger, C.; et al. Enabling large-scale hydrogen storage in porous media-the scientific challenges. Energy Environ. Sci. 2021, 14, 853–864. [Google Scholar] [CrossRef]
  78. Hashemi, L.; Blunt, M.; Hajibeygi, H. Pore-scale modelling and sensitivity analyses of hydrogen-brine multiphase flow in geological porous media. Sci. Rep. 2021, 11, 8348. [Google Scholar] [CrossRef]
  79. Oldenburg, C.M.; Finsterle, S.; Trautz, R.C. Water Upconing in Underground Hydrogen Storage: Sensitivity Analysis to Inform Design of Withdrawal. Transp. Porous Media 2023, 150, 55–84. [Google Scholar] [CrossRef]
Figure 1. Model of the Konary structure divided into 10 layers with vertical permeability and porosity profile based on [70].
Energies 17 01493 g001
Figure 2. Simulation results for 10 years of CG withdrawal after the closure of the 30 operation cycles of hydrogen storage.
Energies 17 01493 g002
Figure 3. Results for the RCG and NRCG after the closure of the 30 storage operation cycles.
Energies 17 01493 g003
Figure 4. NRCG/CG and WG/NRCG ratio for 15 considered cases.
Energies 17 01493 g004
Table 1. Characteristics of hydrogen storage in the Konary structure based on [70].
Initial Filling Period Length Options4 Years3 Years2 YearsUnit
Amount of hydrogen injected during the initial filling (total storage capacity)147,453112,65073,543[Mg]
WG for six months of hydrogen withdrawal18,531
CG for six months of hydrogen withdrawal128,92294,12055,012
Average amount of extracted water during every cycle of hydrogen injection and withdrawal6145852514,421
Total amount of extracted water during the 30 cycles of hydrogen injection and withdrawal177,183247,923418,406
Table 2. Case explanations.
Initial Filling Period Length Options4 Years3 Years2 Years
CaseValueCaseValueCaseValue
Fluid flow (kg/s)11.5461.71112.1
21.17 *71.17 *121.17 *
3282132
4494144
56106156
* refers to hydrogen flow.
Table 3. Simulation results of CG withdrawal after the closure of the cyclical hydrogen storage operation.
Initial Filling Period Length Options4 Years3 Years2 YearsUnit
CaseValueAverageCaseValueAverageCaseValueAverage
Period when upconing appears14.422.5362.881.81111.270.91[Year]
22.4571.65120.75
33.2882.46131.27
41.4891.21140.72
51.00100.86150.53
RCG183,63284,040652,38153,6651119,45320,363[Mg]
283,695754,8451221,916
382,541852,2941319,214
482,698953,0901420,063
587,6171055,7121521,170
NRCG145,29044,890641,73840,4551135,55934,649
245,227739,2751233,096
346,381841,8261335,798
446,224941,0301434,949
541,3041038,4071533,842
Amount of extracted water during CG withdrawal1131,321122,4556102,822114,9171164,55479,369
2152,1947163,26012122,667
3124,2148102,6641360,793
4103,492999,3171470,483
5101,05210106,5231578,348
NRCG/CG ratio10.350.3560.440.43110.650.63
20.3570.42120.60
30.3680.44130.65
40.3690.44140.64
50.32100.41150.62
WG/NRCG ratio10.410.4160.440.46110.520.54
20.4170.47120.56
30.4080.44130.52
40.4090.45140.53
50.45100.48150.55
Disclaimer/Publisher’s Note: The statements, opinions and data contained in all publications are solely those of the individual author(s) and contributor(s) and not of MDPI and/or the editor(s). MDPI and/or the editor(s) disclaim responsibility for any injury to people or property resulting from any ideas, methods, instructions or products referred to in the content.

