Article

A Novel Control Strategy for Hydraulic Turbines to Consider Both Primary Frequency Regulation and Ultra-Low Frequency Oscillation Suppression

School of Electrical and Electronic Engineering, Chongqing University of Technology, Chongqing 400054, China
*
Author to whom correspondence should be addressed.
Energies 2024, 17(5), 1067; https://doi.org/10.3390/en17051067
Submission received: 27 January 2024 / Revised: 17 February 2024 / Accepted: 20 February 2024 / Published: 23 February 2024

Abstract

:
In response to the requirements of mitigating ultra-low frequency oscillation (ULFO) and enhancing primary frequency regulation (PFR) performance in hydropower-dominated systems, a novel control strategy, namely the center-frequency-structured governor-side power system stabilizer (CFS_GPSS) is proposed. In this study, the transfer function model of the hydropower system with a proportional-integral-derivative (PID)-type governor is established. Through analysis of damping torque and amplitude-frequency characteristics, the dominant links and key characteristics of ULFO are revealed. Based on these findings, a CFS_GPSS strategy is proposed to compensate for the phase and increase system damping. Finally, the effectiveness of the CFS_GPSS is verified under normal operating conditions of 0.04 Hz, strong network and low hydropower output conditions of 0.034 Hz, and weak grid-connected conditions of 0.054 Hz based on the 3-machine, 9-bus system. Compared to the conventional structured governor-side power system stabilizer (CS_GPSS) control strategy and PID parameter optimization method, the CFS_GPSS demonstrates efficient ULFO suppression across a wide frequency range while significantly enhancing PFR performance. The proposed control strategy exhibited the expected performance under various operating conditions, providing effective technical means to enhance the reliability of hydraulic turbines and guide the safe and stable operation of hydropower-dominated systems.

1. Introduction

Against the backdrop of global constraints on fossil fuel resources and the urgent need to address carbon emissions, the robust advancement of clean energy sources such as hydropower, wind power, and photovoltaics is pivotal for China’s ambitious “30–60” carbon peaking and carbon neutrality objectives. In recent years, both the installed capacity and power generation of hydropower have experienced a significant increase, making it a significant contributor to China’s energy supply. More than 70% of China’s hydropower resources are concentrated in the western and central-south regions, which has promoted the successful construction of the back-to-back DC asynchronous interconnection project and formed typical sending-end systems with a high proportion of hydropower, such as Yunnan Power Grid and Southwest Power Grid. However, following asynchronous interconnection, the issue of frequency stability has emerged as the primary threat to stable operation within these high-proportion hydropower sending-end systems [1,2,3].
The issue of frequency stabilization in asynchronous networked sending-end systems consists of two primary aspects. On the one hand, under the combined influence of the water hammer effect within the prime mover system and the speed control system in the hydropower unit, the system exhibits negative damping characteristics within the ultra-low-frequency range. Consequently, several instances of ultra-low-frequency oscillation events have been reported. For example, during the Tianguang DC and Jinsu DC islanding tests, ultra-low-frequency oscillations of 0.1 Hz and 0.07 Hz were observed, respectively. Similarly, the frequency fluctuation events with oscillation periods of 0.07 Hz and 0.05 Hz were recorded in the Tibetan Power Grid and Yunnan Power Grid. The occurrence of ultra-low-frequency oscillations has also been observed around the world, including in Turkey and Colombia [4,5,6,7,8]. On the other hand, following asynchronous networking, this is a notable reduction in rotational inertia, which significantly weakens a grid’s ability to withstand disturbances and decreases the system frequency stability [9,10,11,12]. In the case of the Southwest Power Grid, the rotational inertia is only approximately 1/6 to 1/5 compared to that in the original AC synchronous grid. As a result, there is a significant increase in the occurrence of system frequency breaking through the frequency regulation dead zone, as indicated by operational statistics. Extensive research has shown that unlike low-frequency oscillations related to power angle stabilization, ultra-low-frequency oscillations are mechanical oscillations greatly influenced by control parameters within the speed control system. Therefore, ensuring the safe and stable operation of power grids while enhancing frequency regulation performance necessitates effective measures for suppressing ultra-low-frequency oscillations.
Recently, numerous scholars have conducted extensive research on the optimization of control parameters for the speed control system to address the aforementioned issue [13]. Refs. [14,15] employed a trial-and-error approach to adjust the PID control parameters of the speed regulator, thereby enhancing the system damping and initially achieving the suppression of ULFO in the system. However, this parameter configuration process is intricate and does not guarantee an optimal solution. Refs. [16,17,18] employed optimization algorithms such as the particle swarm algorithm and deep reinforcement learning algorithm to optimize the PID parameters of the speed regulator, resulting in significant improvement in oscillation suppression performance. While these methods effectively focus on suppressing ULFO, modifying speed control system parameters to enhance damping characteristics may potentially compromise the power frequency regulation (PFR) performance of a system. Therefore, taking into account the PFR requirement, a PID parameter optimization method was proposed in Ref. [19] considering both PFR performance and ULFO suppression. Ref. [20] reconciled the contradiction by the segmented optimization of PID parameters. However, it is important to note that when improving the frequency regulation performance, there will inevitably be a compromise in the system damping level.
As the ULFO phenomenon of a system is strongly related to the speed control system, some scholars have proposed a governor-side power system stabilizer (GPSS) control strategy inspired by the working principle of PSS [21,22,23,24,25]. Ref. [21] compared the effects of PSS and GPSS on increasing the damping ratio of a system and demonstrated that GPSS is superior for ULFO suppression. In Ref. [22], a linear state space model of the multi-machine system with a PID-type hydro-turbine governor was established, and a GPSS design method based on the phase compensation principle was proposed. Ref. [23] successfully applied a GPSS control method to enhance ultra-low-frequency oscillation suppression after the asynchronous operation of Yunnan Power Grid. Additionally, some researchers have conducted extensive research on optimizing GPSS control parameters. In Ref. [26], the time-varying accelerated particle swarm optimization algorithm (TVAPSO) was employed to tune the controller parameters, which improved the control effect of GPSS. Although the aforementioned GPSS control method demonstrates superior performance in ULFO suppression, its impact on PFR performance has not been discussed.
The hydraulic turbine regulating system is a complex and nonlinear control system characterized by static and dynamic properties that vary with different operating water heads and guide vane openings. Specifically, the water hammer effect coefficient, which has a significant impact on the ULFO, undergoes continuous changes in response to variations in unit power output, resulting in a shift in the frequency of the ULFO. Based on the aforementioned review, previous studies have left several aspects to be improved. (1) The PID parameter optimization method fails to effectively address both ULFO suppression and enhancing PFR performance simultaneously. (2) The CS_GPSS suppression strategy exhibits limited robustness under varying operating conditions and its impact on PFR needs further investigation.
By addressing these research gaps, a novel GPSS control strategy incorporating a center-frequency structure is proposed to effectively tackle both primary frequency regulation performance and the suppression of ultra-low-frequency oscillations across a wide frequency range. The introduction of this control strategy in this study holds significant practical implications for ensuring the safe and stable operation of hydropower-dominated systems. The key contributions of this study are as follows:
  • Building upon the analysis of both the damping and the phase characteristics of the governor, a center-frequency-structured governor-side power system stabilizer is proposed. Additionally, the method for setting the parameters of the center filter is provided.
  • The oscillation suppression and PFR performance between the CFS_GPSS and the CS_GPSS are compared under three operating conditions with frequency shifts. The simulation results demonstrate the effectiveness and robustness of the CFS_GPSS.
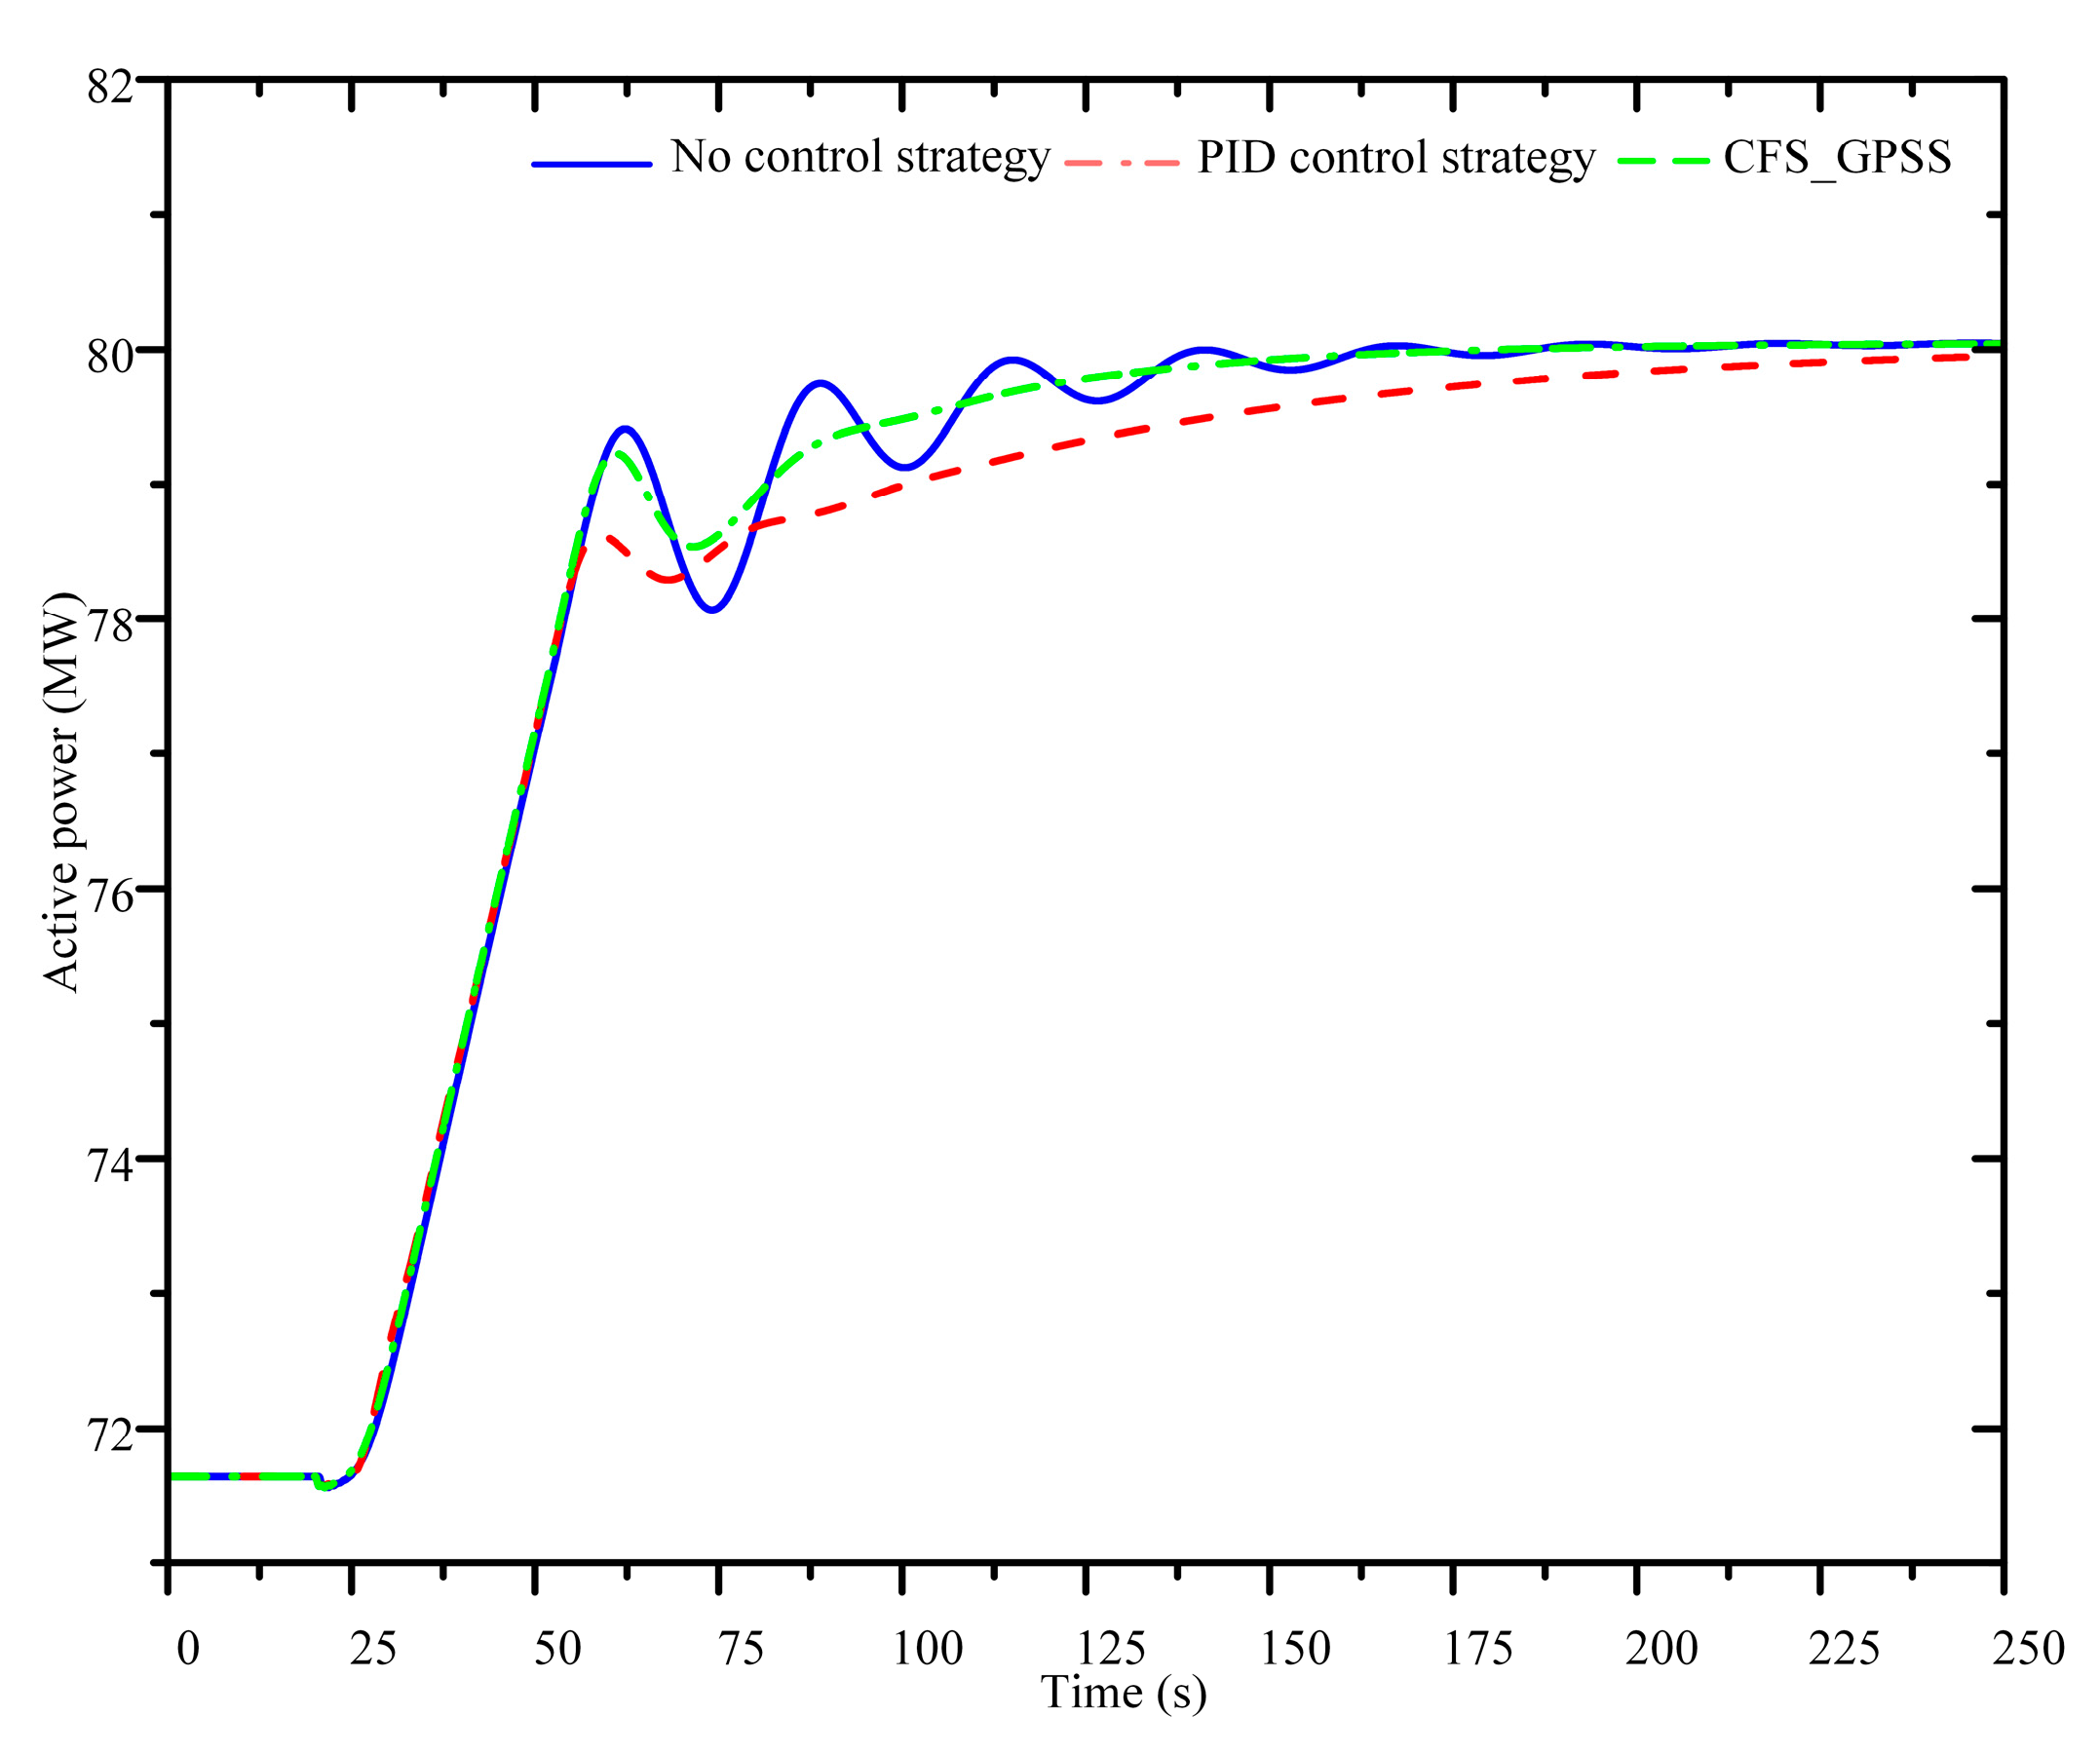
  • It is demonstrated for the first time that the CFS_GPSS has better frequency regulation performance than the PID parameter optimization method while having similar oscillation suppression effects.
The remainder of this paper is organized as follows. Section 2 establishes the model of a hydropower system with the proportional-integral-derivative (PID)-type governor to analyze the damping and phase characteristics of the speed control system. In Section 3, the structure and parameters of the CFS_GPSS are designed. Section 4 compares the performance of different control strategies over a wide range of operating conditions. Section 5 evaluates the PFR performance of PID parameter optimization and the CFS_GPSS control method. Conclusions are drawn in Section 6.

2. Analysis of ULFO Mechanism

This section builds a small-signal model for the hydropower system, aiming to investigate the system’s damping characteristics and analyze the influencing factors of ultra-low-frequency oscillation phenomena using the complex damping torque coefficient method.

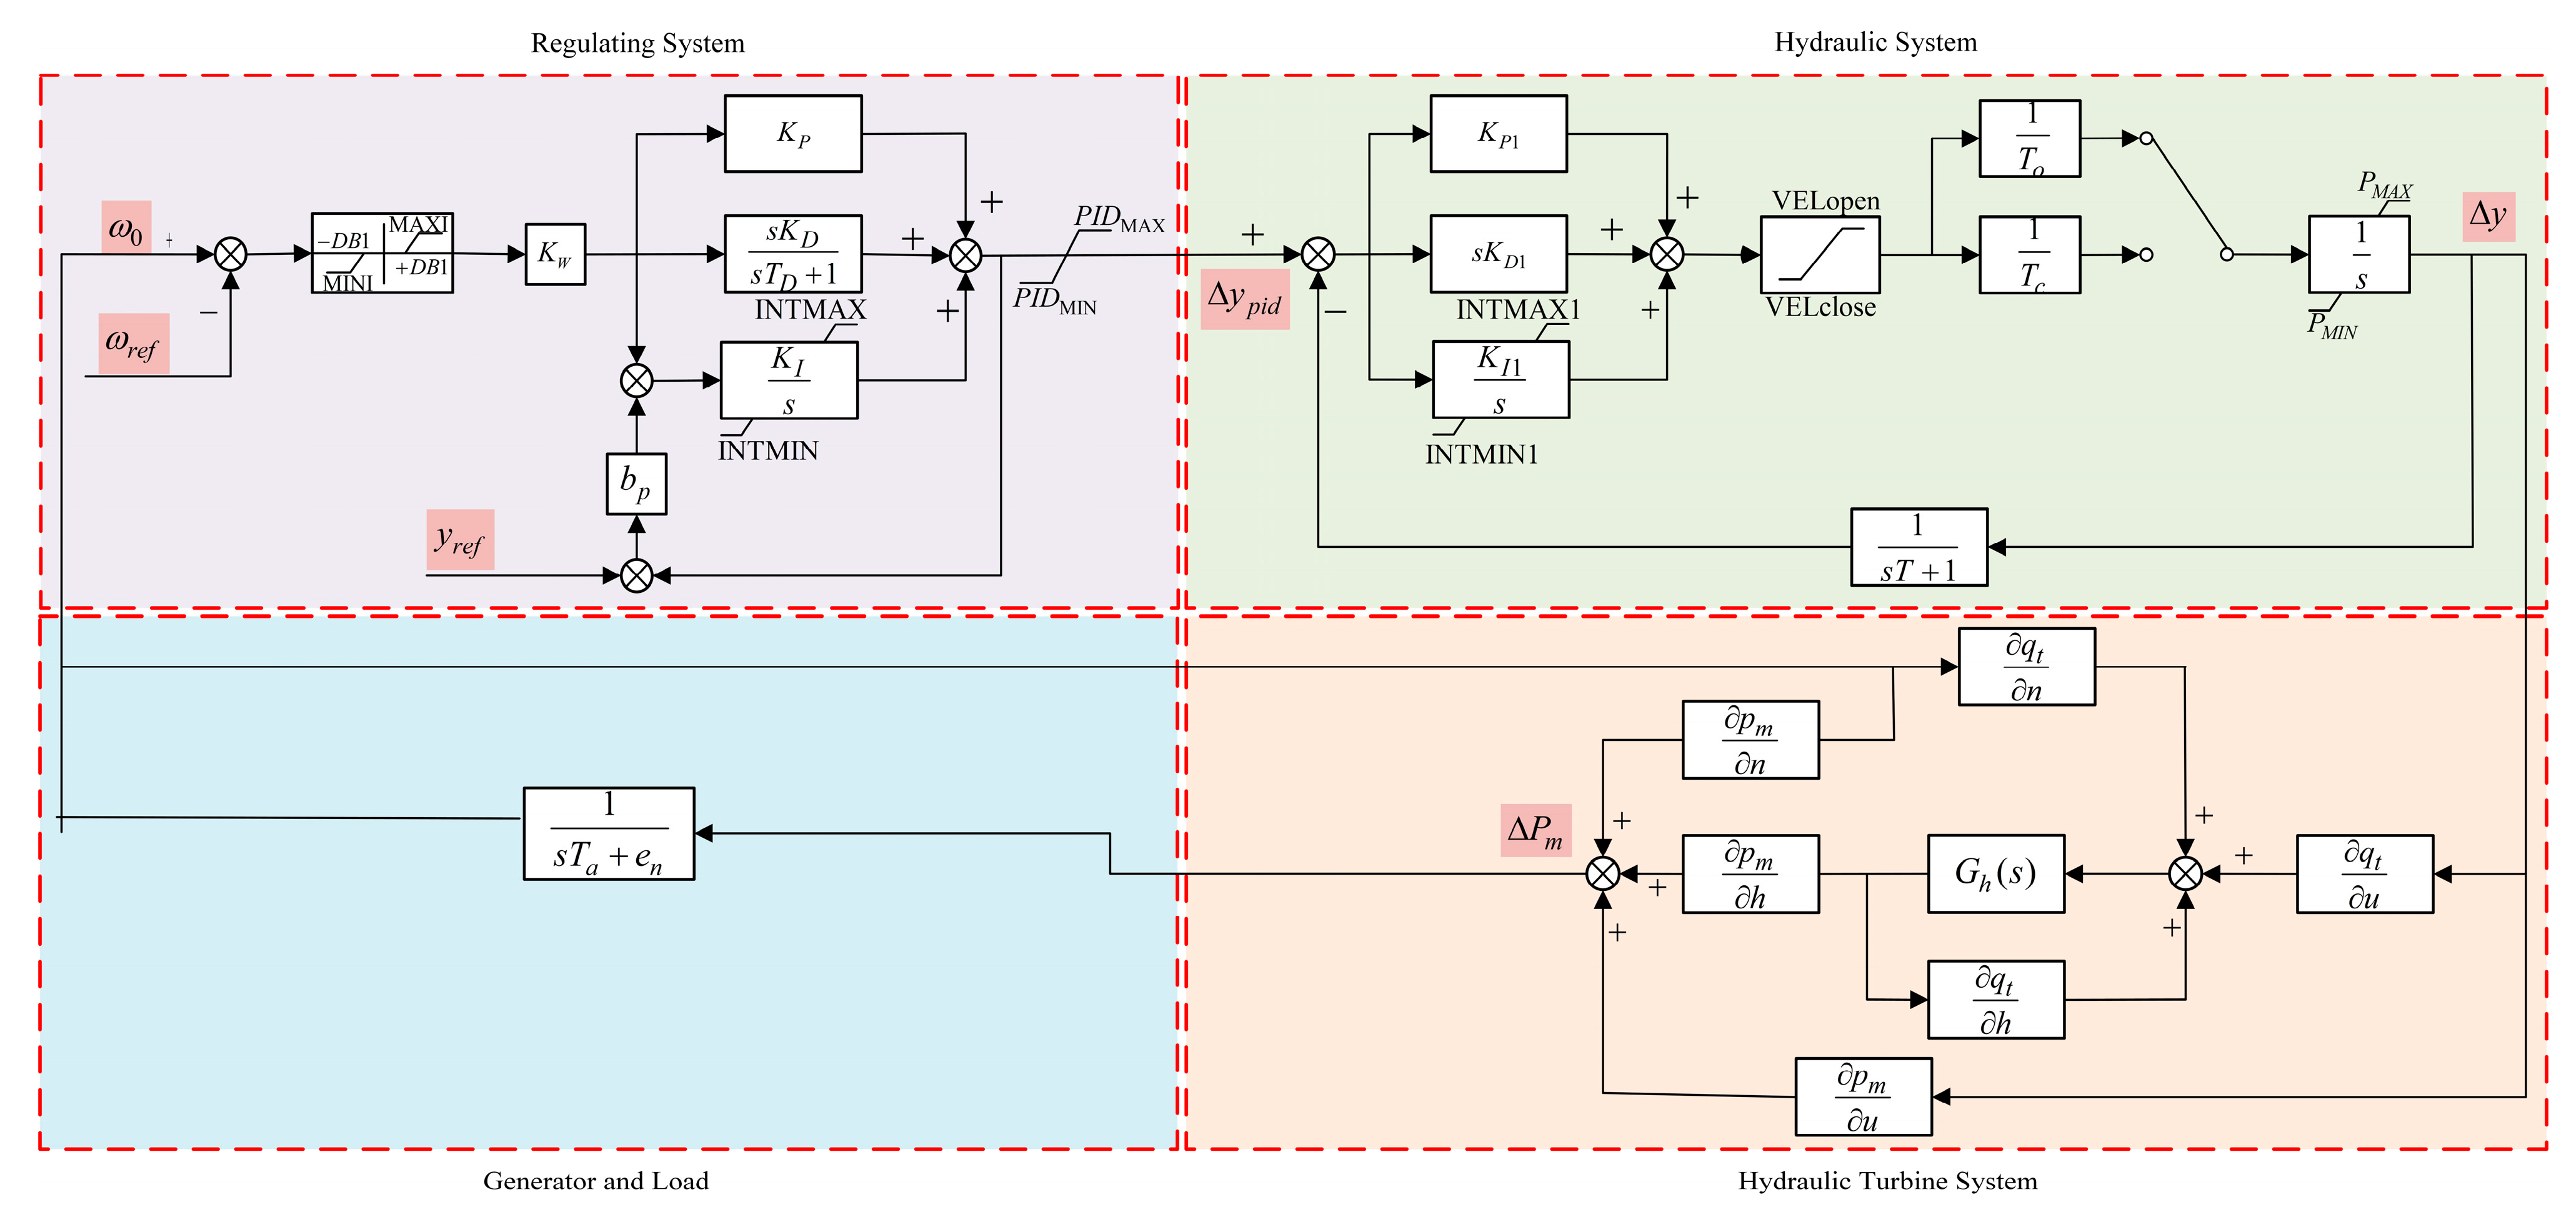
2.1. Theoretical Model of Hydropower System

Extensive on-site investigations reveal that the speed regulation system for domestic hydraulic turbines is predominantly electro-hydraulic, offering superior response times and adjustment quality compared to older mechanical hydraulic speed regulators. Figure 1 illustrates a typical control model block diagram of a hydropower system, encompassing a regulating system, hydraulic system, turbine system, generator and load system.

2.1.1. Regulating System

The regulating system adopts PID regulation. ω 0 represents the measured speed signal, and ω r e f represents the speed reference value. KP, KI, KD, and TD represent the proportional gain, integration gain, differential gain, and time constants of PID control, respectively. bp refers to the permanent droop coefficients. Consequently, the transfer function of the regulating system is formulated as Equation (1).
G P I D ( s ) = Δ y p i d Δ ω = s 2 K D s T D + 1 + s K P + K I s + K I b p
In practical system operation, the regulating system predominantly operates in PI control mode, wherein the differential gain is set to zero. Consequently, the transfer function of the regulating system is simplified and presented as Equation (2).
G P I D ( s ) = Δ y p i d Δ ω = s K P + K I s + K I b p

2.1.2. Hydraulic System

The hydraulic system serves to amplify control signals and facilitate the regulation of the guide vane opening. Its transfer function is outlined in Equation (3):
G y ( s ) = Δ y Δ y p i d = ( s 2 K D 1 + s K P 1 + K I 1 ) s 2 T o + ( 1 + s T ) ( s 2 K D 1 + s K P 1 + K I 1 )
where KP1, KI1, and KD1 indicate the proportional gain, integration gain, and differential gain of the hydraulic system PID adjustment, respectively. T and To are the electrical feedback time constants and the open time constants of the oil engine, respectively. Typically, both the integral and differential gains are set to 0, simplifying the hydraulic system’s transfer function, as indicated in Equation (4).
G y ( s ) = Δ y Δ y p i d = s K P 1 s 2 T o + s K P 1 ( 1 + s T )

2.1.3. Hydraulic Turbine System

The dynamic characteristics of a flow turbine system are typically characterized by parameters such as water head h, rotational speed n, guide vane opening y, torque, and water flow rate qt. When the unit is connected to the grid and operating under load, its speed exhibits minimal variation. Therefore, the impact of unit speed on turbine output can be considered negligible. In this scenario, the turbine’s relative torque mt is almost equivalent to its relative power Pm. The prime mover system’s nonlinear steady-state is expressed in Equation (5).
P m = P m ( h , n , y ) q t = q t ( h , n , y )
Given the minor fluctuations around the operating point, the Taylor series expansion is applied to Equation (5). By ignoring the second-order and higher-order terms, Equation (6) is derived:
Δ p m = p m h Δ h + p m n Δ n + p m y Δ y Δ q t = q t h Δ h + q t n Δ n + q t y Δ y
where p m / h , p m / n , p m / y , q t / h , q t / n , and q t / y are the transfer coefficients of the turbine and are obtained in the hydro-turbine characteristic curve.
The water diversion system consists of pressure pipes, which may induce a water hammer effect during turbine operation. Assuming the pipe walls and water are rigid, the water hammer model for the water diversion system can be equated to Equation (7):
G h ( s ) = T w s
where Tw represents the water hammer effect coefficient and ranges from 0.5 s~4 s.
The dynamic structural diagram of the hydraulic turbine system is illustrated in Figure 1. Based on Equations (5)–(7), a mathematical transformation was performed. When the relative speed approximates 1, the Francis turbine system’s transfer function is represented by Equation (8).
G w ( s ) = Δ P m Δ y = p m y + ( q t y p m h p m y q t h ) G h ( s ) 1 q t h G h ( s )
In rated operating conditions, it is possible to approximate all coefficients in Equation (8) as constants. Based on the literature [27], the standard parameters were set as p m / h = 1.5 , p m / n = 0 , p m / y = 1 , q t / h = 0.5 , q t / n = 0 , and q t / y = 1 . Consequently, the turbine system’s transfer function, which accounts for the water hammer effect, was derived as Equation (9).
G w ( s ) = Δ P m Δ y = s T w + 1 0.5 s T w + 1

2.1.4. Generator and Load System

The generator and load system employs a simplified single-machine model, with the transfer function presented in Equation (10):
G g ( s ) = 1 s T a + e n
where Ta represents the unit’s inertia time constants and the value range is 3~12 s. en represents the unit’s static frequency self-adjustment coefficient, which is related to the load characteristics and ranges from 0.5 to 1.5.
To summarize, the open-loop transfer functions for the speed control system and the hydropower system are presented in Equations (11) and (12), respectively.
G g o v ( s ) = Δ P m Δ ω = ( s K P + K I ) × s K P 1 × ( s T w + 1 ) ( s + K I b p ) s 2 T o + s K P 1 ( 1 + s T ) ( 0.5 s T w + 1 )
G ( s ) = G g o v ( s ) × G g ( s ) = ( s K P + K I ) × s K P 1 × ( s T w + 1 ) ( s + K I b p ) s 2 T o + s K P 1 ( 1 + s T ) ( 0.5 s T w + 1 ) ( s T a + e n )

2.2. Damping and Phase Characterization of Speed Regulation System

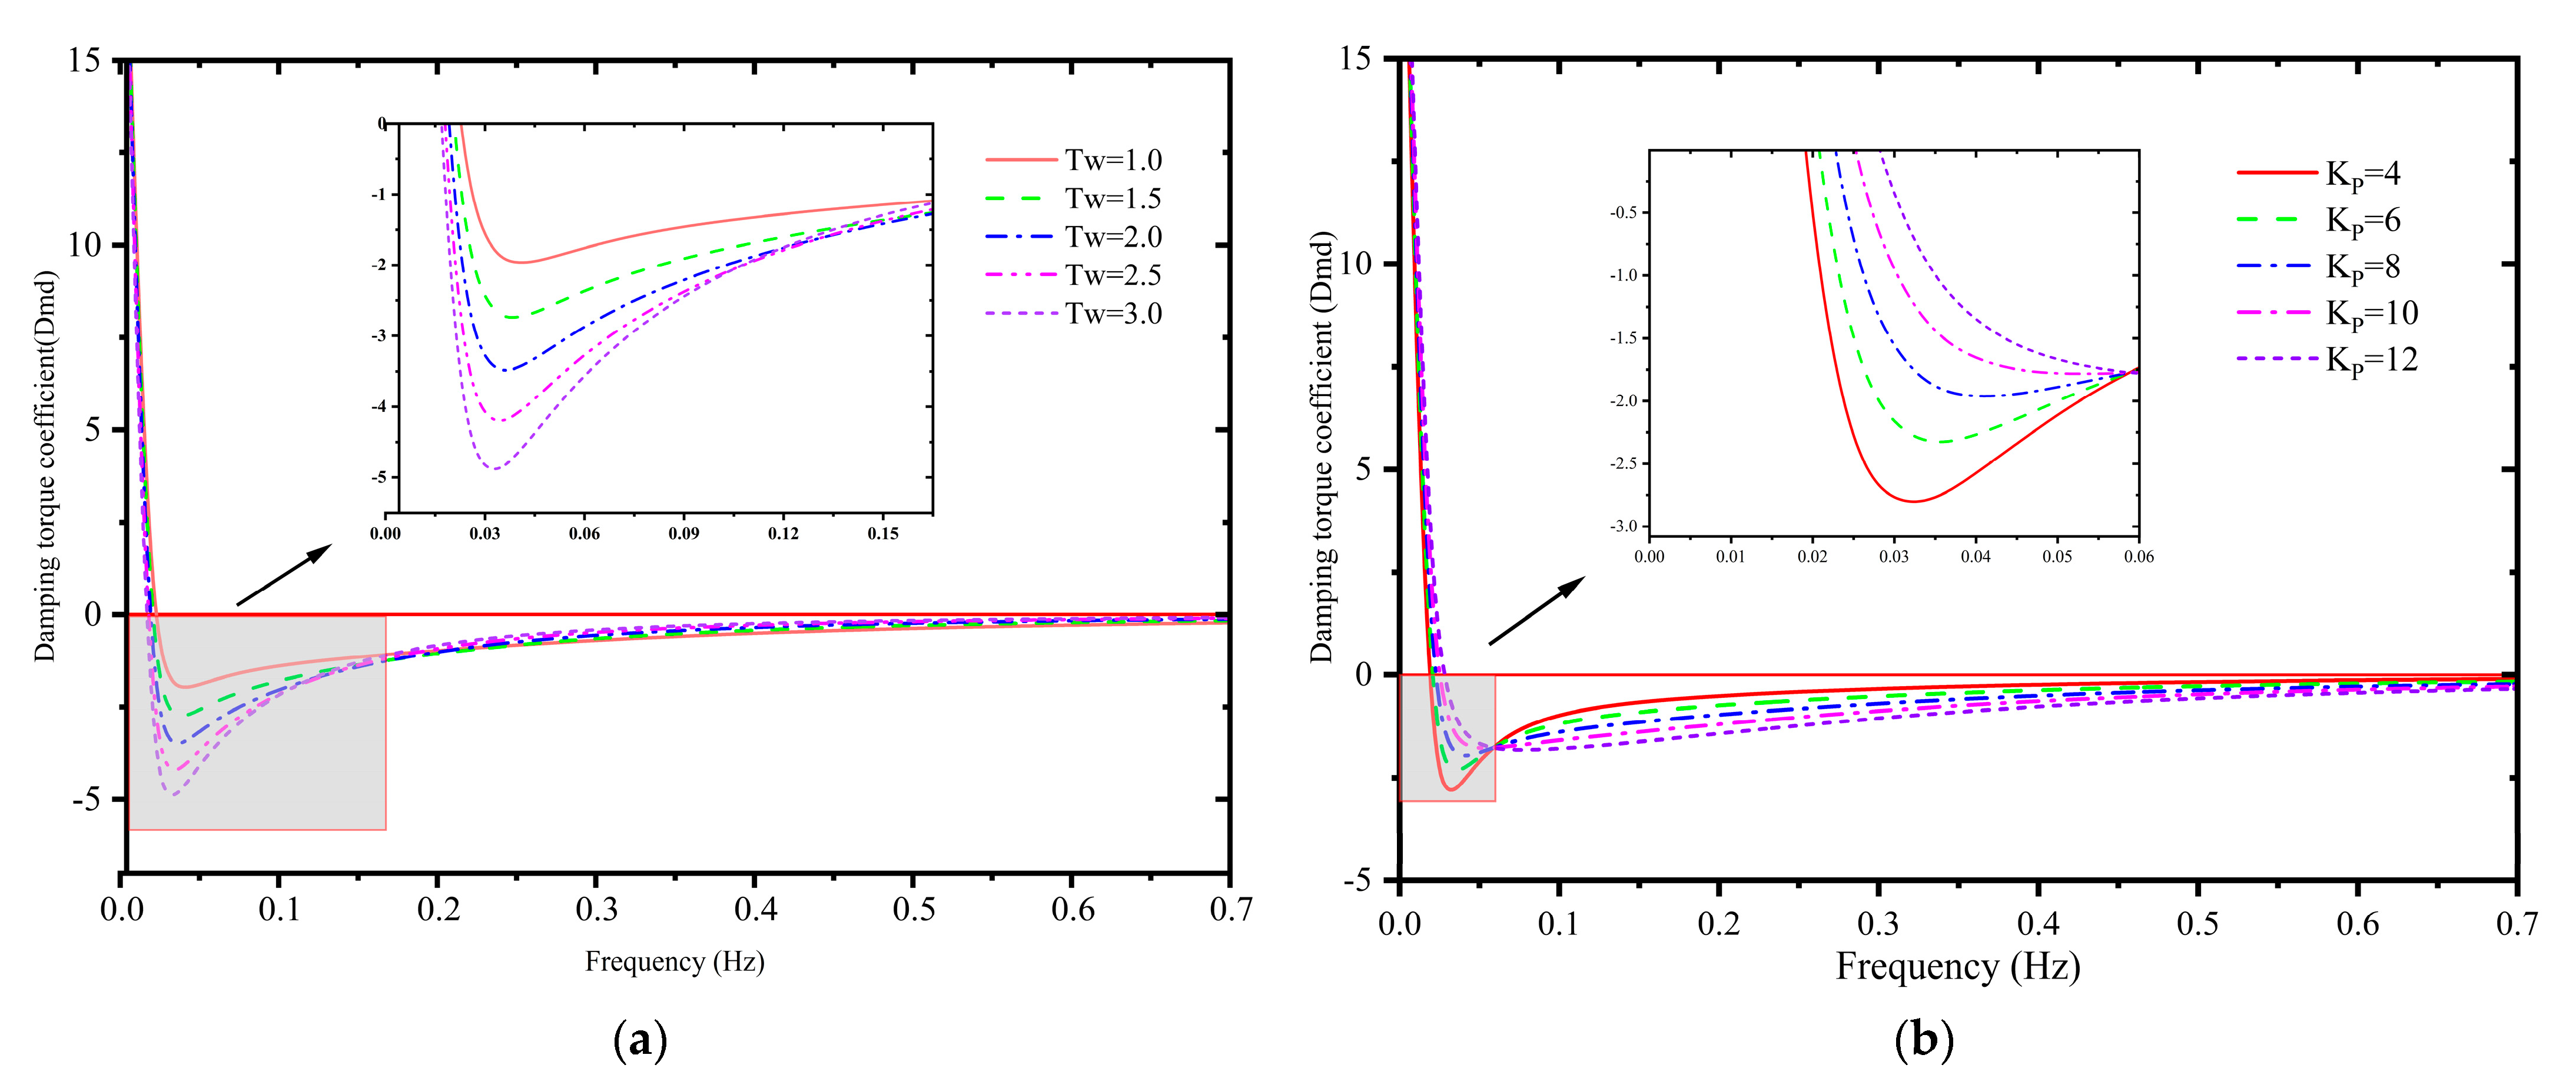
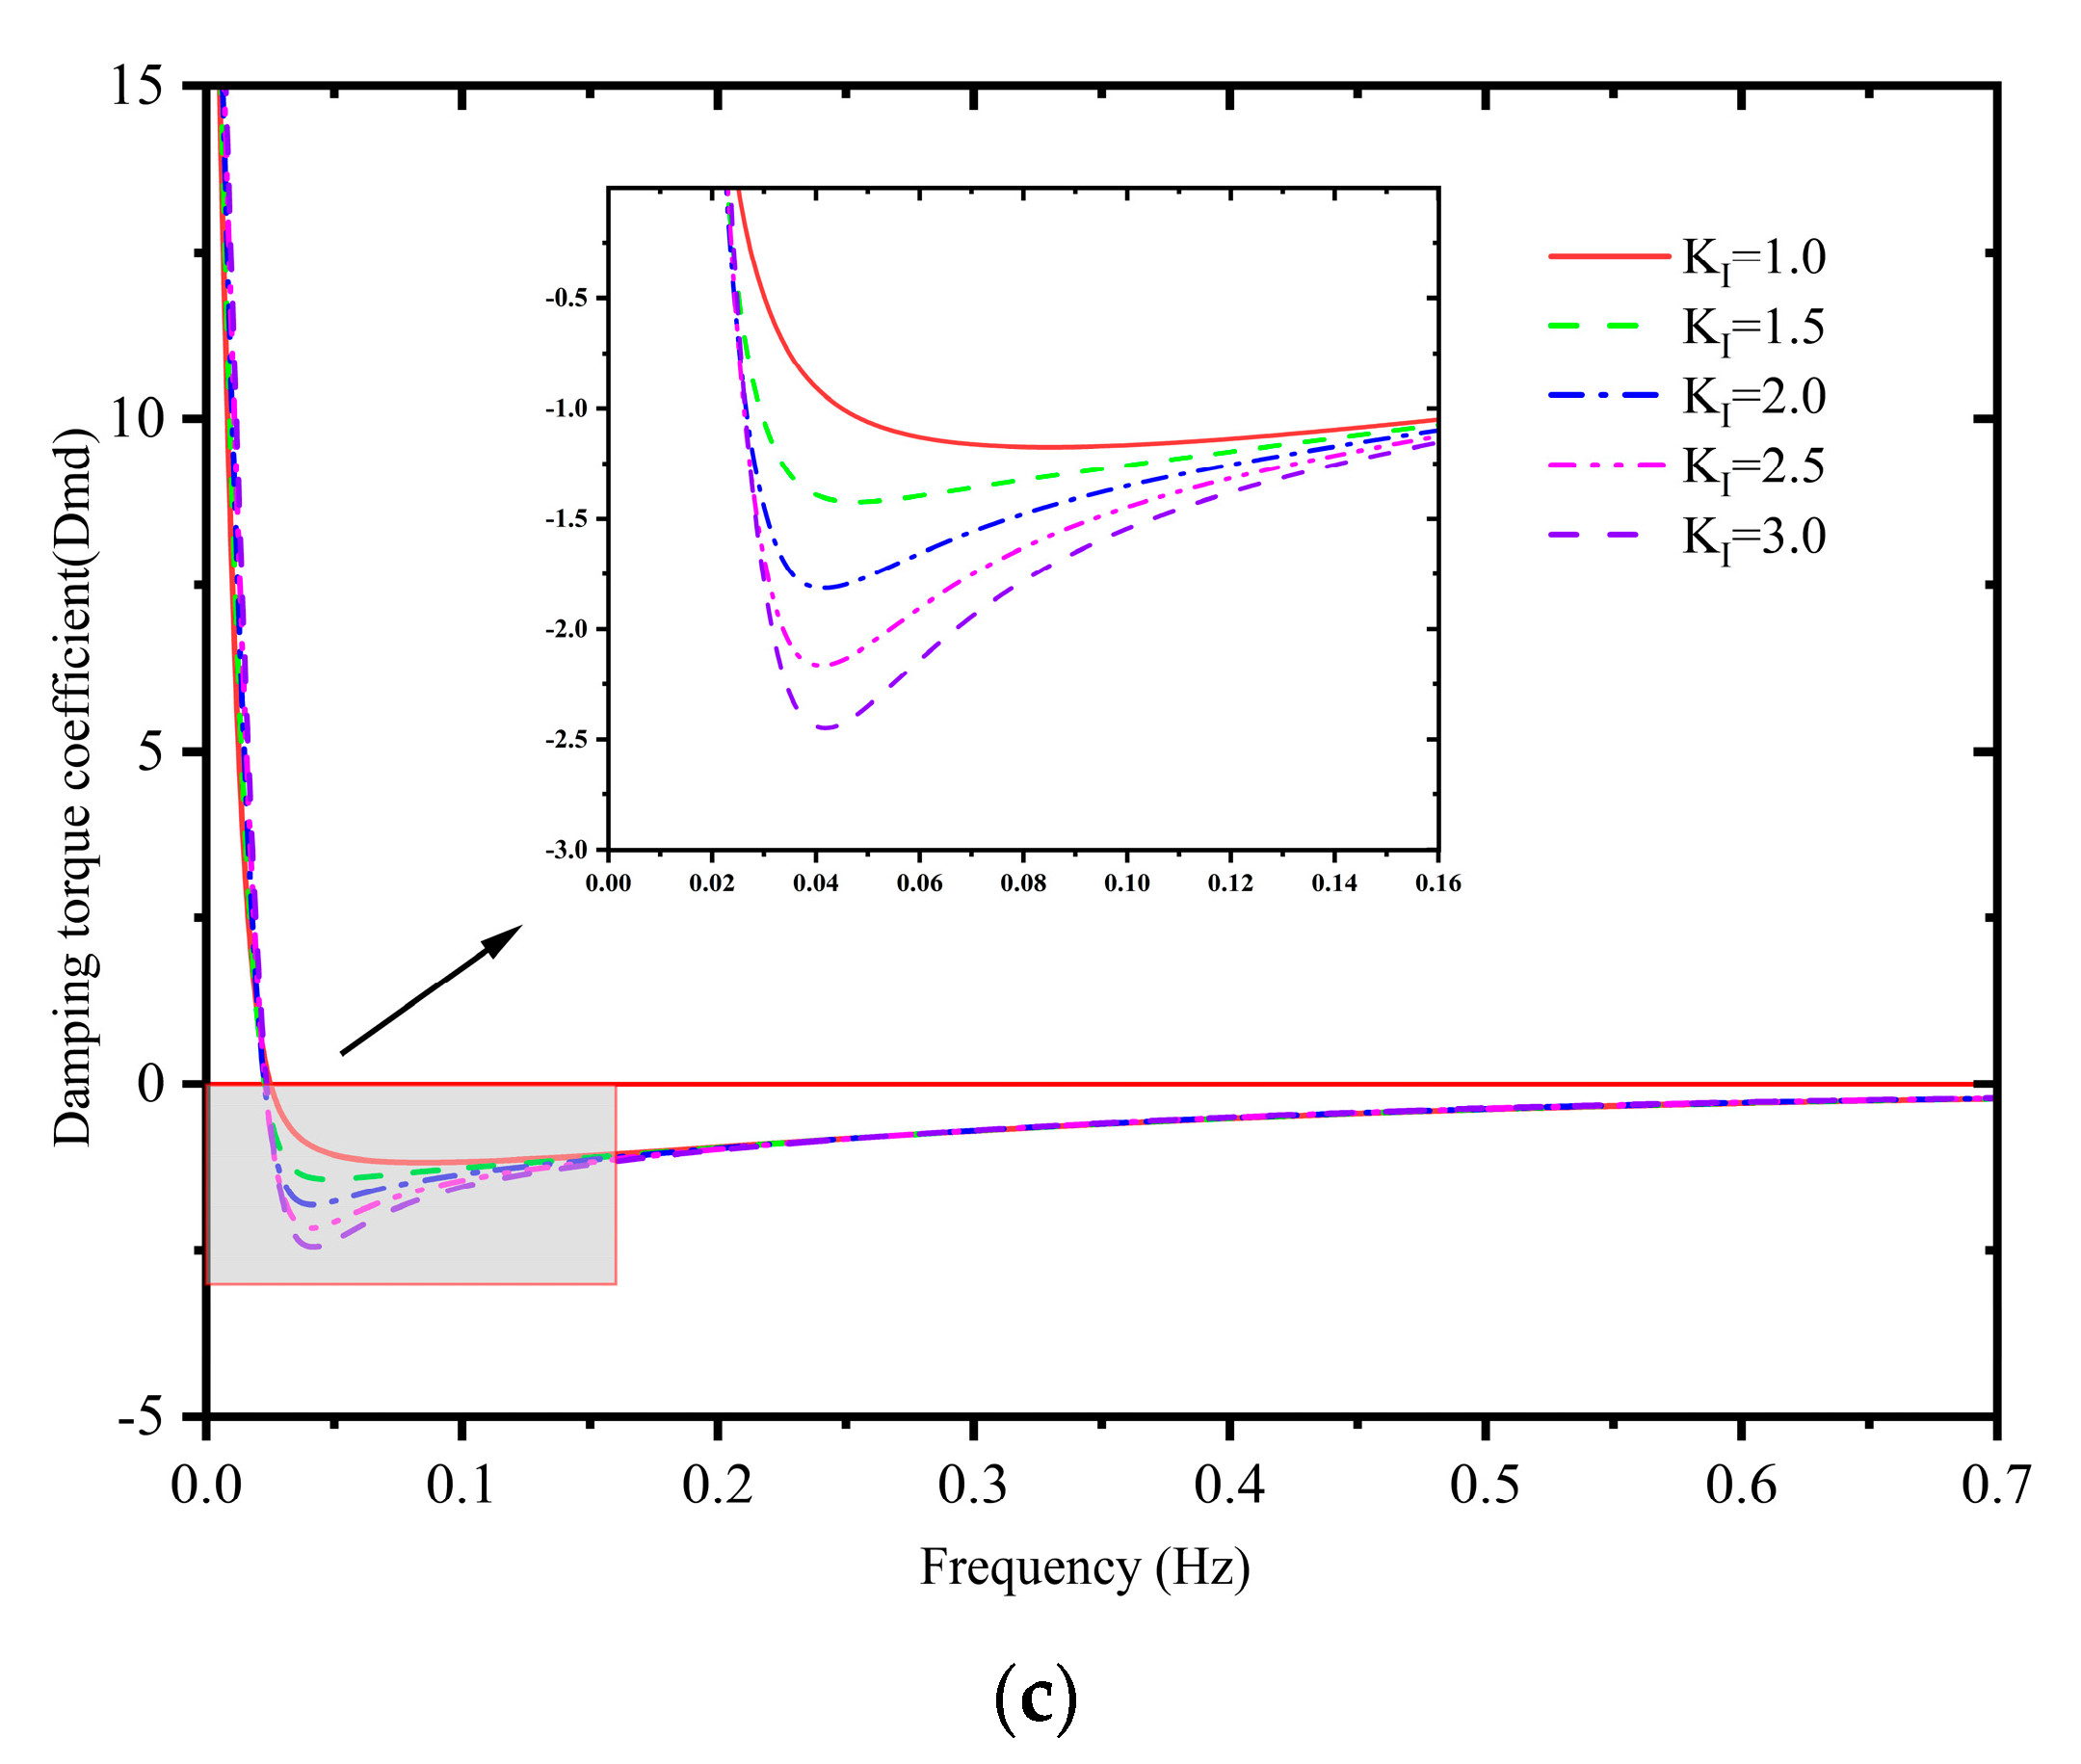
2.2.1. Negative Damping Characteristics of Speed Control System

The influence of mechanical power on the power system can be studied with rotor motion, as expressed in the following:
s T j Δ ω = Δ P m Δ P e D Δ ω s Δ δ = ω 0 Δ ω
where Tj is the inertia time constant and D represents the comprehensive damping coefficient of the generator.
The speed control system plays a dominant role in the ULFO process. To simplify Equation (13), it was assumed that variables unrelated to the speed regulation system were constants, thereby omitting Δ P e and D. Consequently, the generator rotor motion equation was further derived as follows:
s T j Δ ω = Δ P m s Δ δ = ω 0 Δ ω
Utilizing the complex damping torque coefficient method, the mechanical power could be decomposed in the Δ δ Δ ω plane. Then, the mechanical power could be expressed as follows:
Δ P m = D m d Δ ω + D m s Δ δ
where Dmd is the additional damping torque coefficient. Its physical meaning is the projection of mechanical torque on the Δ ω -axis, indicating the magnitude of the damping torque. Dms represents the additional synchronous torque.
Then, s was replaced with d in Equation (11), where ωd is the oscillation frequency. The transfer function of the turbine governor could then be described as follows:
Δ P m = G g o v ( s ) Δ ω = K g o v e j φ g o v Δ ω = K g o v cos φ g o v Δ ω + K g o v sin φ g o v ω d ω 0 Δ δ
Kgovcosφgov is defined as the additional damping coefficient adjusted by the turbine governor to the system, using the expression of Dmd:
D m d = = K g o v cos φ g o v
where the amplitude Kgov indicates the damping strength. When cosφgov > 0 and Dmd > 0, the turbine governor provides positive damping. Conversely, cosφgov < 0 and Dmd < 0, the turbine governor provides negative damping. When the system exhibits negative damping characteristics, the system exhibits an unstable state.
The preceding analysis indicates that the damping state significantly influences system stability. Based on the main dynamic parameters of the speed regulation system in Table 1, the correlation between the damping torque coefficient and frequency variations under various control parameter scenarios was investigated. The influence of the water hammer effect coefficient and the PI parameter of the speed regulation system on the damping torque coefficient of the system is illustrated in Figure 2. It is seen that the speed regulation system demonstrates negative damping characteristics in the ultra-low-frequency range. Specifically, the increase of Tw and KI deteriorate the damping characteristics in the ultra-low-frequency range, which is harmful to the dynamic stability and response performance of the system. However, the mitigate the occurrence of KP can enhance damping characteristics and suppress the ultra-low-frequency oscillation.

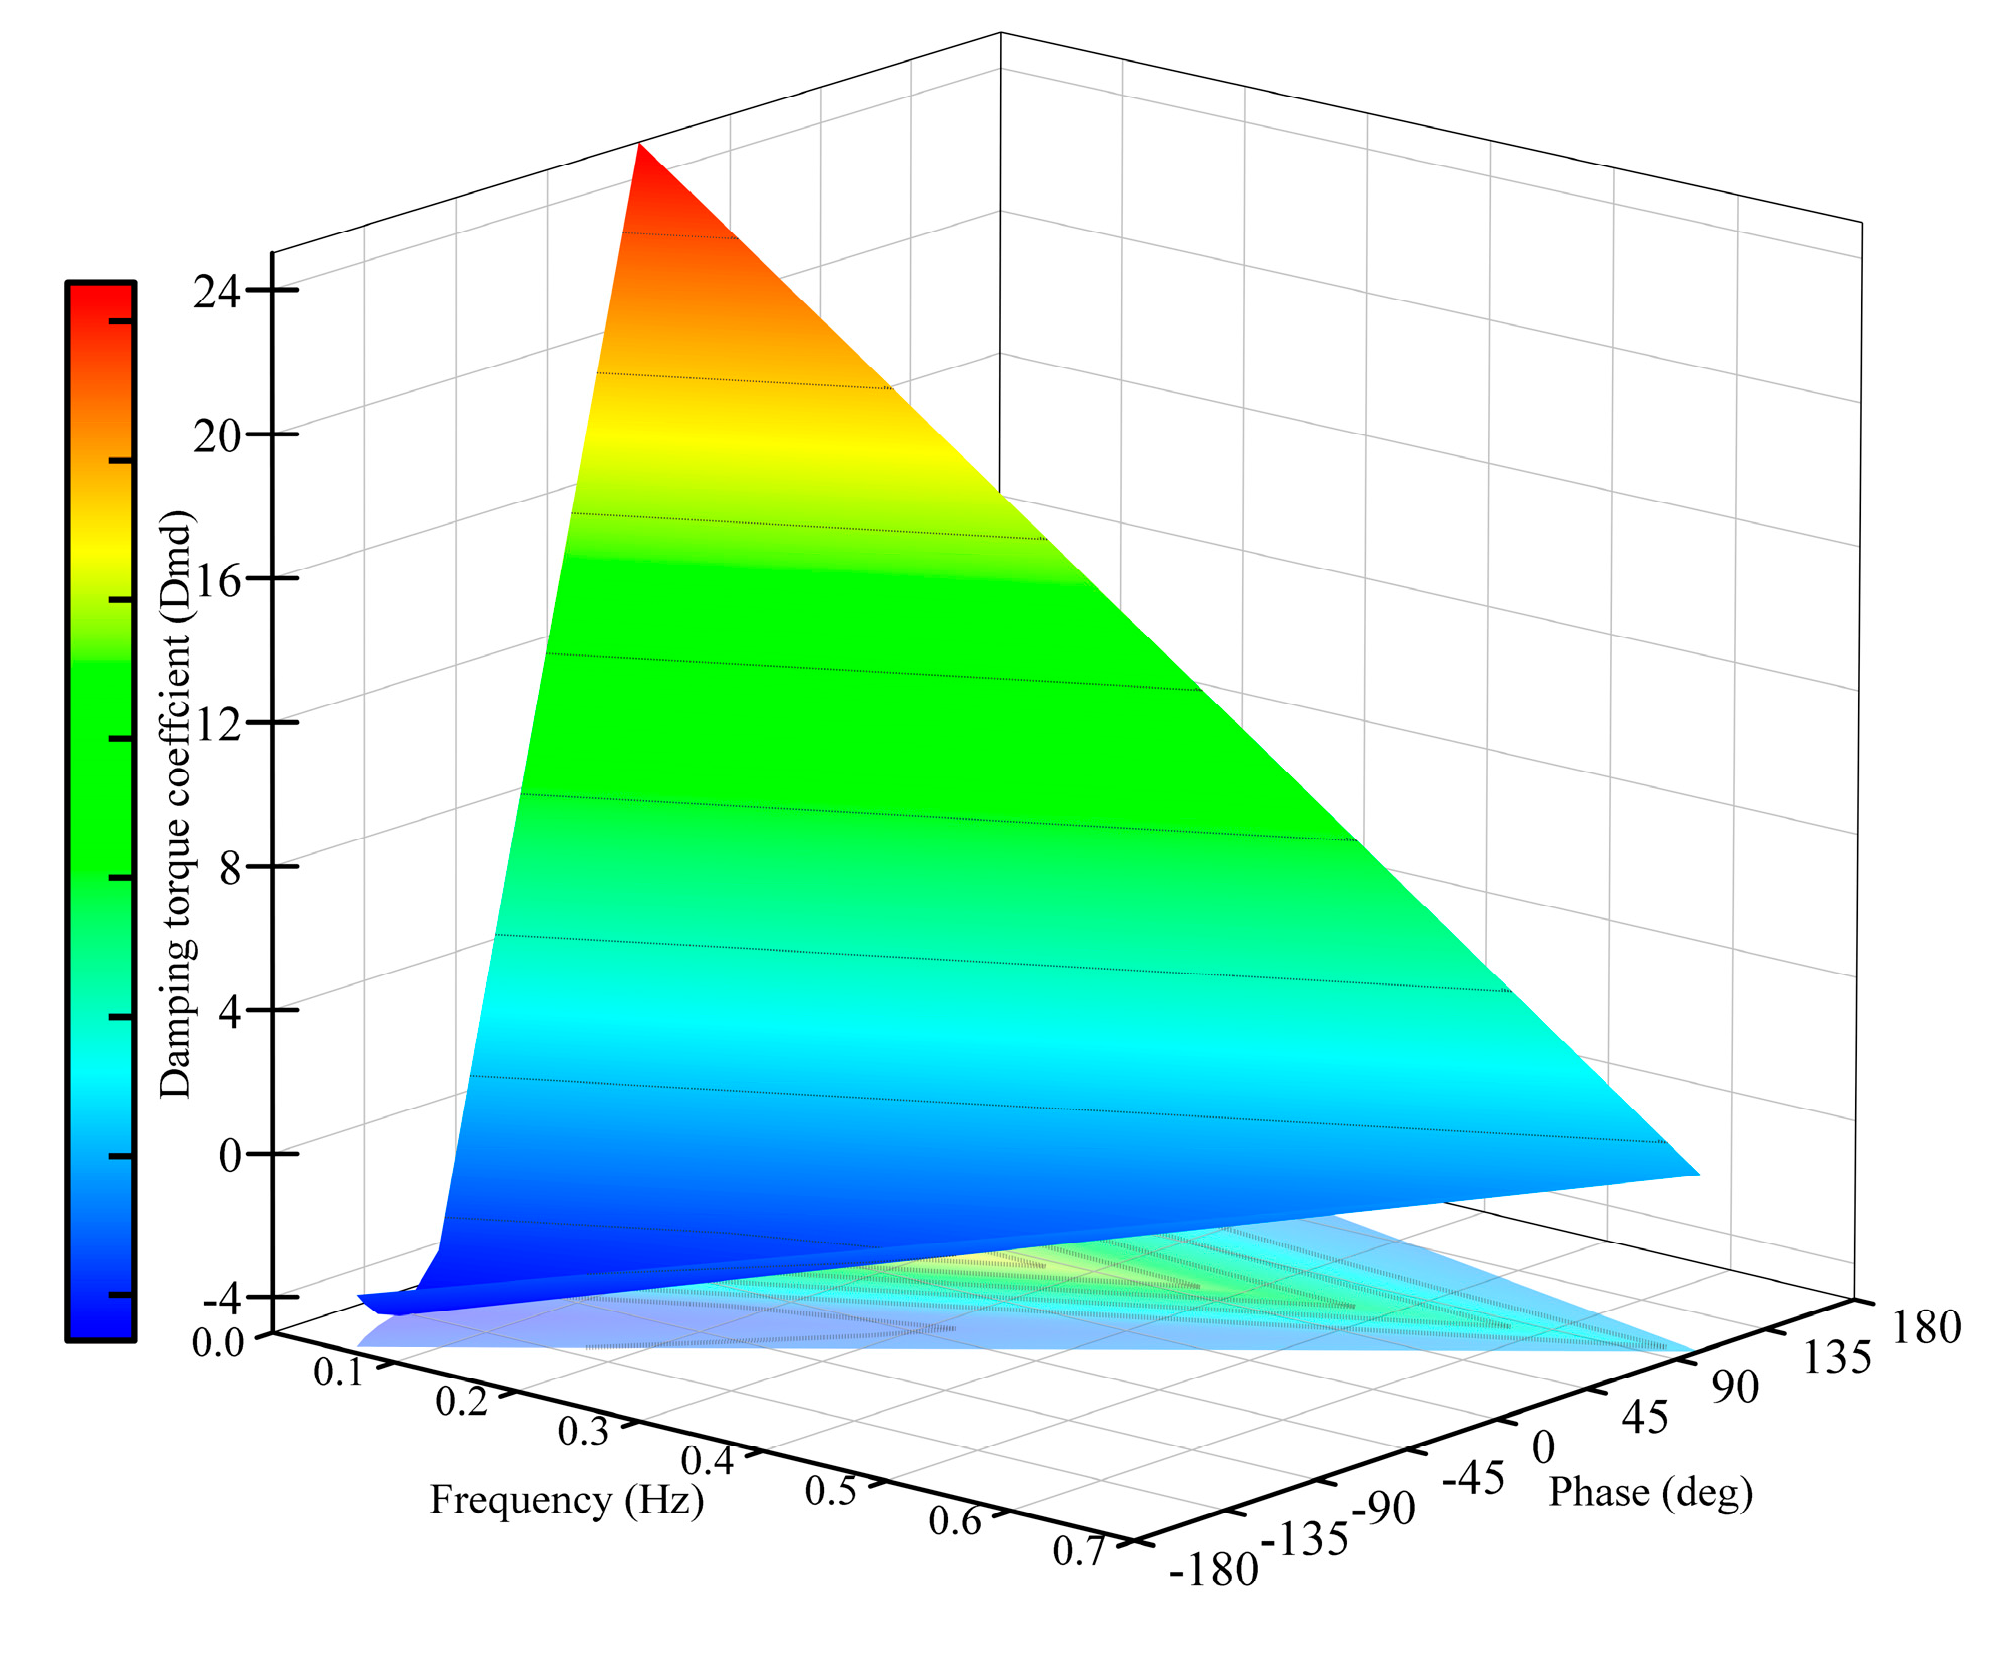
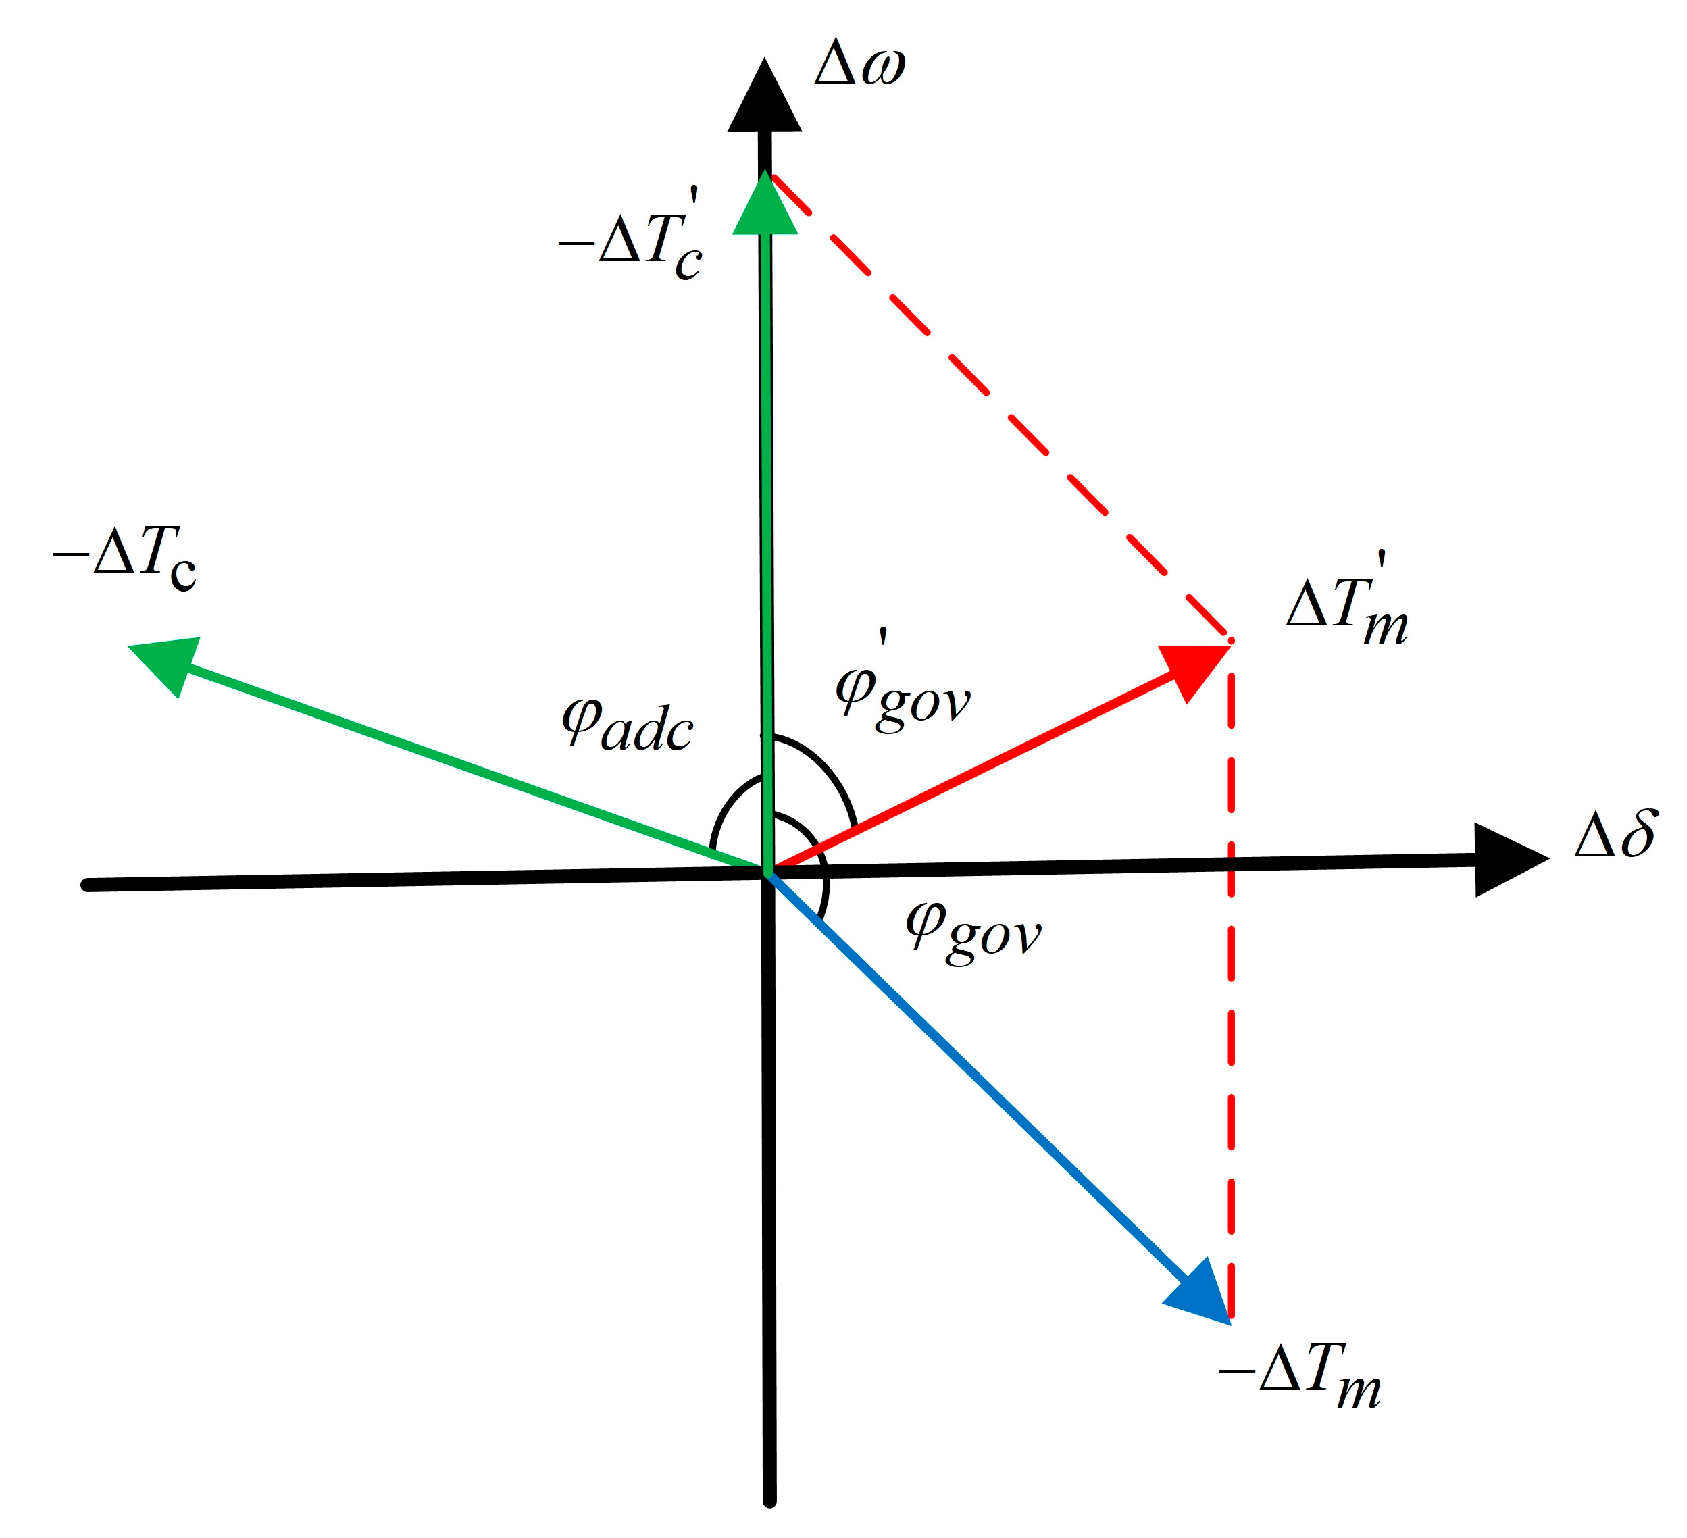
2.2.2. Governor Phase Characteristics

The additional damping torque coefficient was jointly determined by both the amplitude and the phase angle of the speed regulation system’s transfer function. Hence, a more comprehensive analysis of the phenomenon of ULFO could be conducted by investigating the phase angle difference between Δ ω and Δ P m in the speed control system. Figure 3 illustrates the relationship between the system’s damping characteristics and phase characteristics within the frequency band of 0~1.0 Hz, where the control parameters in Table 1 were also adopted.
It can be observed intuitively that the hydraulic turbine speed control system exhibits positive damping characteristics when the phase difference between Δ ω and Δ P m lies within the range of −90° to 90°. Conversely, the damping characteristics become negative when this phase difference ranges from 90° to 270°. Especially in the ultra-low-frequency band, a decrease in frequency leads to an increased phase angle difference between Δ ω and Δ P m , resulting in a reduction in the damping torque coefficient.
The analysis reveals that the system exhibits negative damping characteristics within the ultra-low-frequency band. This is primarily due to the phase angle in the speed regulation system, where Δ P m lags behind Δ ω by a phase angle ranging from 90° to 270°. Moreover, the water hammer effect coefficient Tw of the prime mover system significantly influences the damping properties of the system.

3. Additional Damping Controller Structure and Parameter Design

Building on the analysis in Section 2, the Dmd of the speed regulation system can quantitatively describe the characteristics of the ULFO, and the phase characteristics of the speed regulation system can further determine the damping state of the system. Therefore, this section designs an additional damping controller suitable for multiple operating conditions from the perspective of phase compensation.

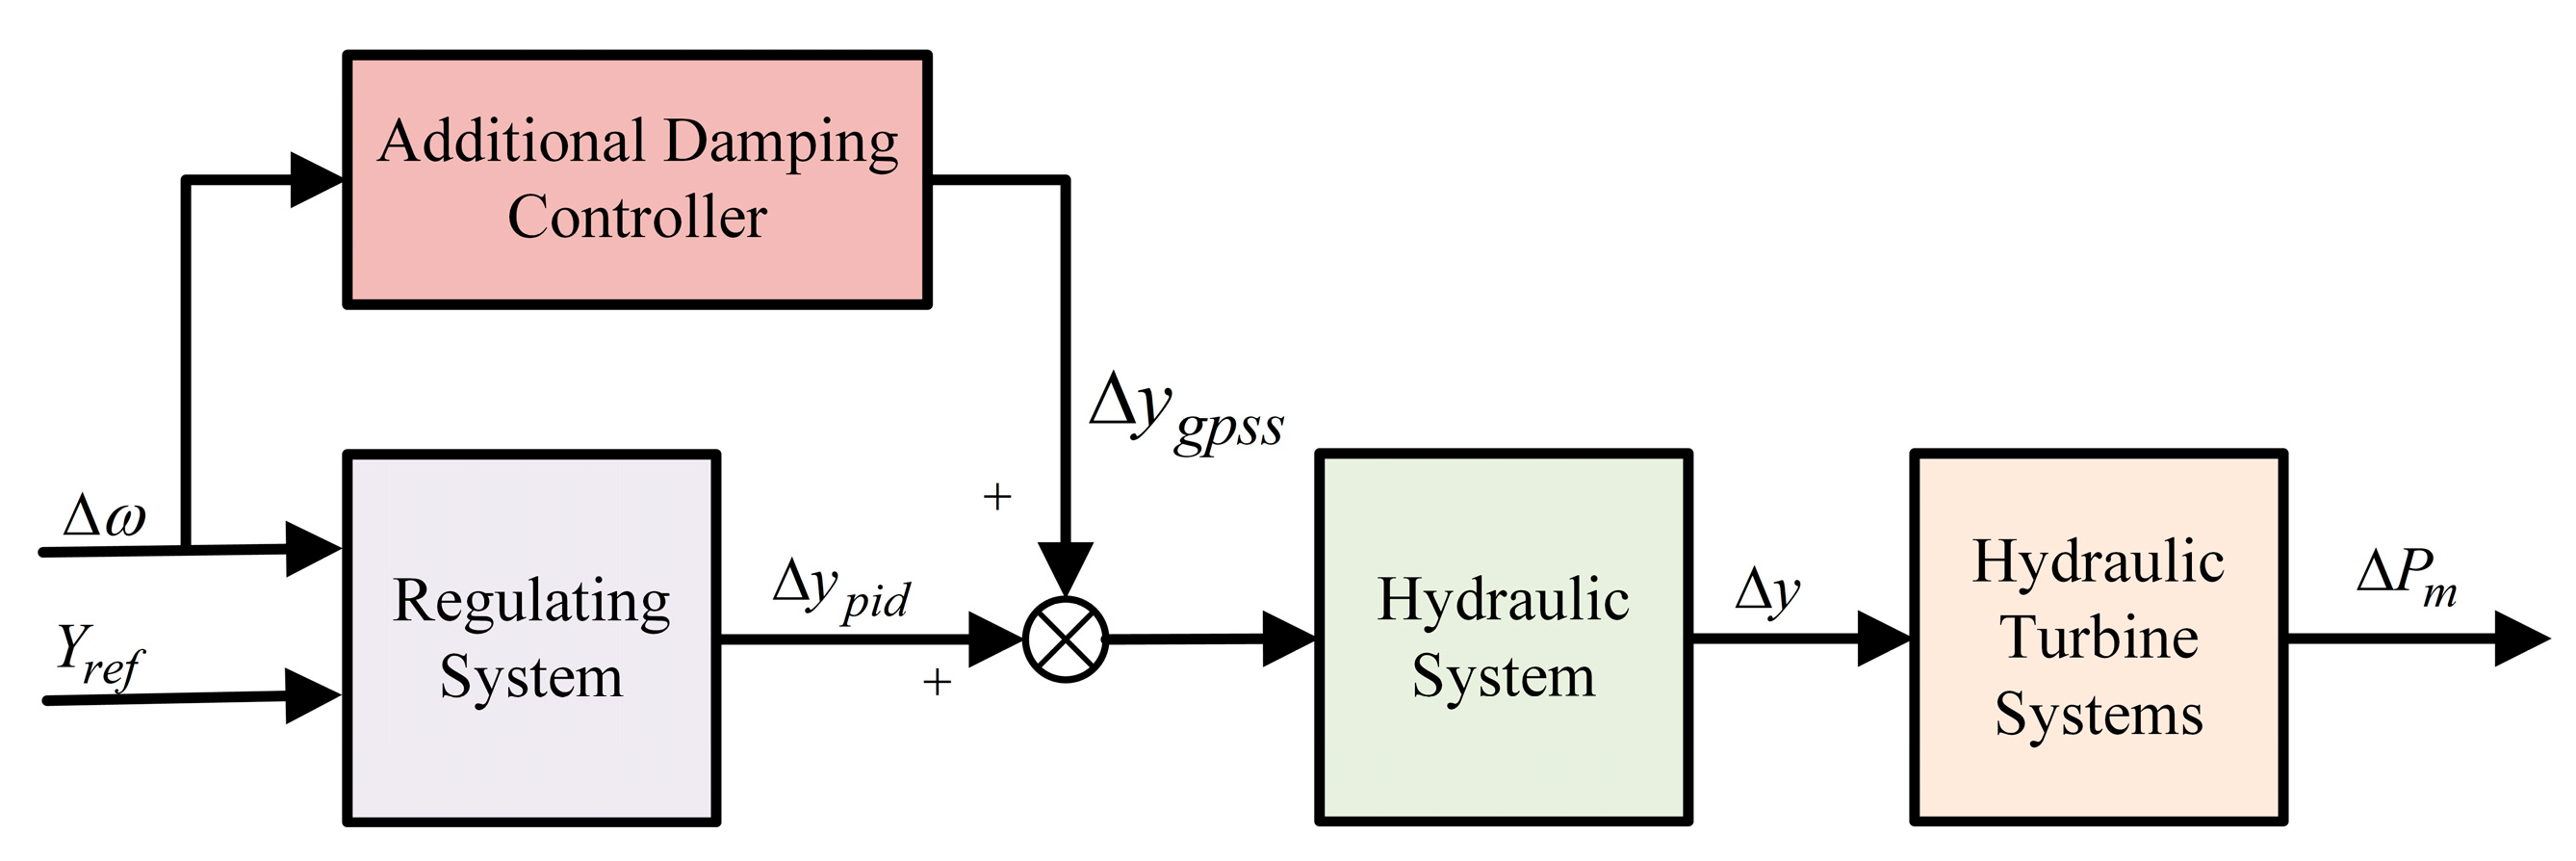
3.1. Design Principle

Upon understanding the phase characteristics of the turbine speed regulator system, the additional damping controller should compensate for the phase lag angle of the speed regulator system within the specified oscillation frequency range. When the system is disturbed, the generator will produce a rotational speed deviation, causing mechanical torque changes. A phase angle difference is observed between the input and output of the speed control system. The design principles of the GPSS are elucidated in Figure 4.
In normal operating conditions, the Δ T m of the speed regulation system was located in the fourth quadrant, forming an angle φgov with the speed deviation. Under these circumstances, the system demonstrated negative damping characteristics. When GPSS was added to the speed regulation system, the increased input torque was Δ T c . The vector addition of Δ T c and Δ T m generated Δ T m , located in the first quadrant. In this case, Δ T m projected onto the Δ ω -axis was positive, indicating that the speed regulation system had transitioned to positive damping. The structural design of GPSS, employing a composite control approach, is illustrated in Figure 5, as informed by the preceding theoretical analysis.
The transfer function of the speed regulation system that included the additional damping controller is expressed by Equation (13) at this point.
G g o v ( s ) = G P I D ( s ) + G G P S S ( s ) × G y ( s ) × G w ( s )

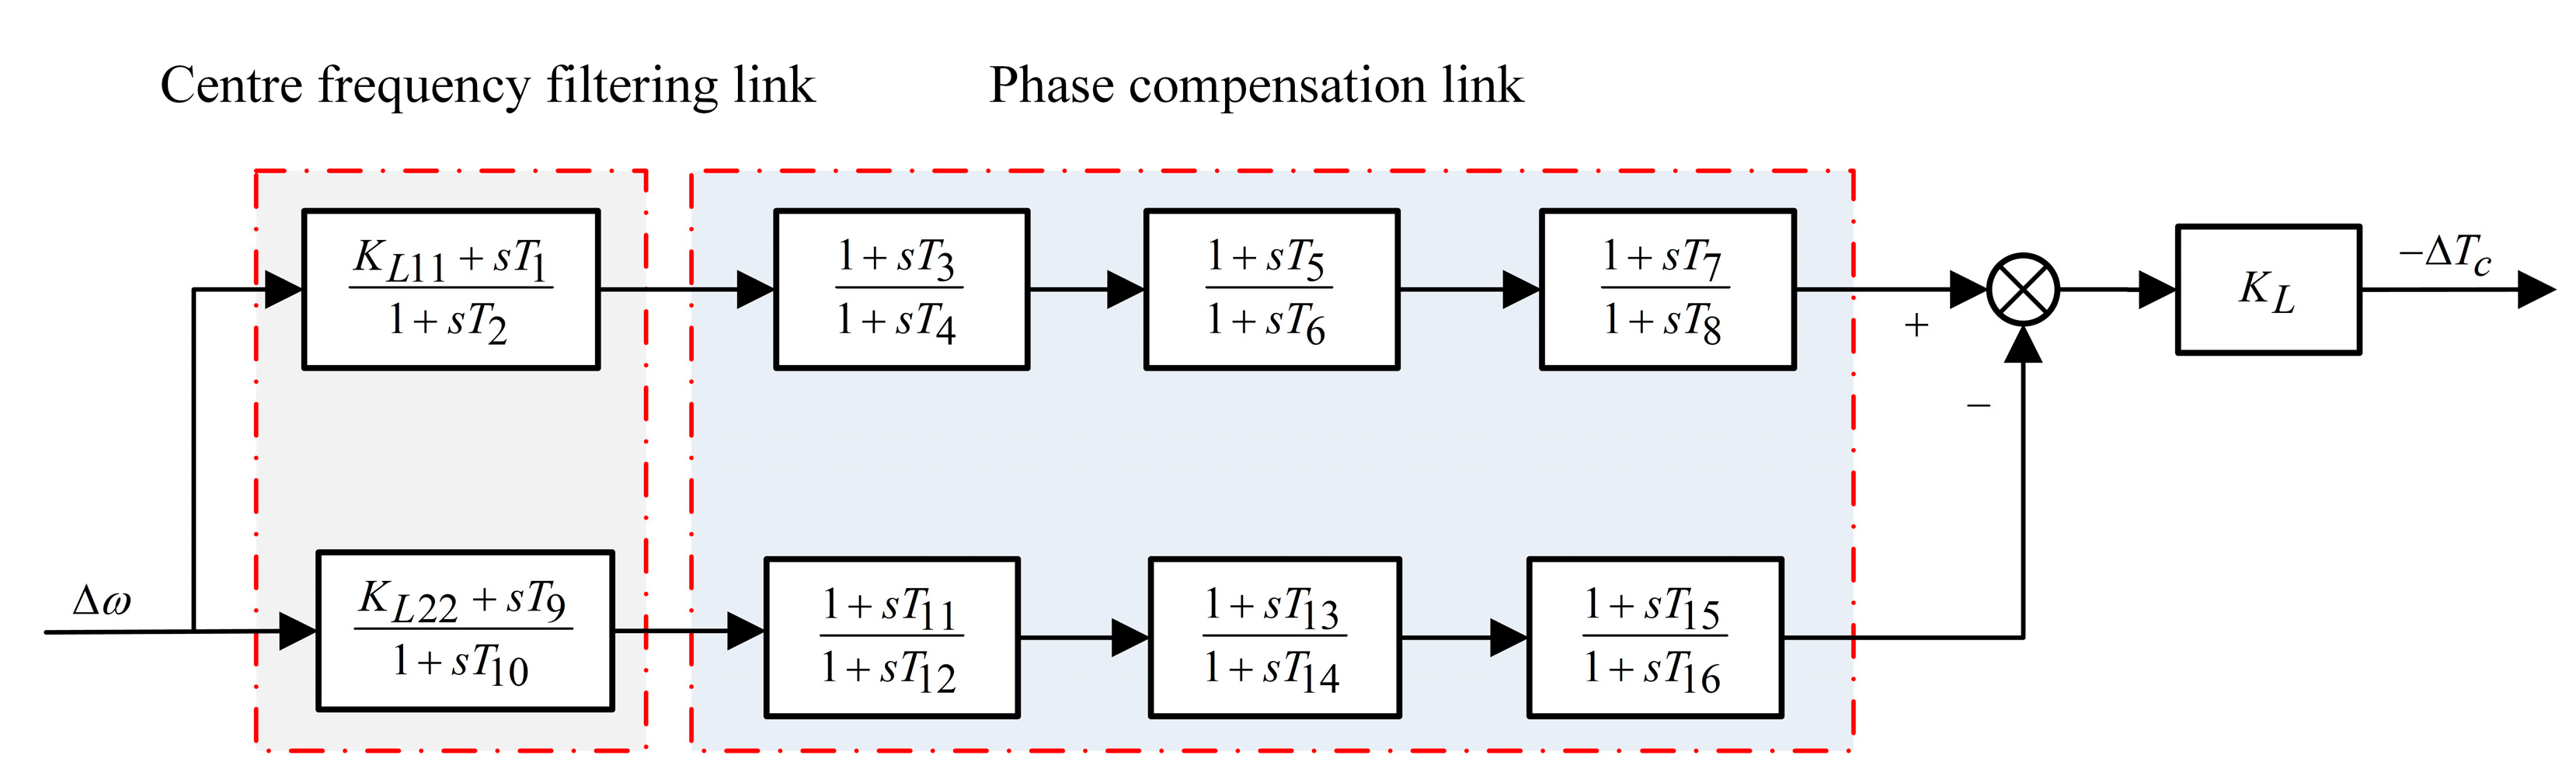
3.2. Structure and Parameter Design

The CS_GPSS consisted primarily of a low-pass filter link and a phase offset link. The low-pass filter was responsible for selecting the target frequency to be compensated and the phase offset link was responsible for the phase compensation of the controller. In this study, an additional damping controller of the central filter structure was employed, which utilized the central filter to determine the controller’s frequency. This approach not only enhanced the dynamic characteristics at the target frequency but also minimized interference in other frequency bands. The details are shown in Figure 6.
The center frequency filtering link used dual center frequency filters to process the rotational speed signal and determine the target frequency for compensation, thereby serving as an alternative to the low-pass filter for precision-focused frequency compensation. The phase compensation link utilized a third-order lead-lag link to control the selected target frequency to improve the overall control accuracy. The transfer function of the CFS_GPSS is summarized as follows:
G G P S S ( s ) = G 1 ( s ) G 2 ( s ) G 1 ( s ) = ( K L 11 + s T 1 1 + s T 2 1 + s T 3 1 + s T 4 1 + s T 5 1 + s T 6 1 + s T 7 1 + s T 8 ) G 2 ( s ) = ( K L 22 + s T 9 1 + s T 10 1 + s T 11 1 + s T 12 1 + s T 13 1 + s T 14 1 + s T 15 1 + s T 16 )
The target frequency of the CFS_GPSS, denoted as f, was typically chosen based on the frequency exhibiting the most pronounced negative damping effect. The parameter settings of the center filter were as follows:
T 2 = T 9 = 1 / ( 2 π f R ) T 1 = T 2 R T 10 = T 9 × R
where R represents the bandwidth of the center frequency, and the typical value is 1.2.
According to Equations (11) and (17), the lag phase angle for the target frequency was determined, and the parameters of the phase compensation link were tuned by Refs. [21,25].

3.3. Performance Analysis

To investigate the superiority of the proposed method, comparative analysis and discussion were conducted on the dynamic performance and PFR performance of the CFS_GPSS and CS_GPSS. Specifically, when the compensation target frequency was set to 0.04 Hz, an in-depth examination was performed on the amplitude-frequency characteristics and phase-frequency characteristics of both controllers. The parameter values for the CFS_GPSS were configured as follows: KL11 =KL22 = 1, T1 = 3.025, T2 = 3.63, T9 = 3.63, T10 = 4.356.
The bode diagrams drawn under different control strategies are shown in Figure 7. It can be seen that both controllers exhibited the ability to compensate for identical amplitude and phase at the designated frequency. Nevertheless, notable disparities arose in the compensatory effects across other frequency ranges. The ensuing conclusions can be summarized as follows:
(a)
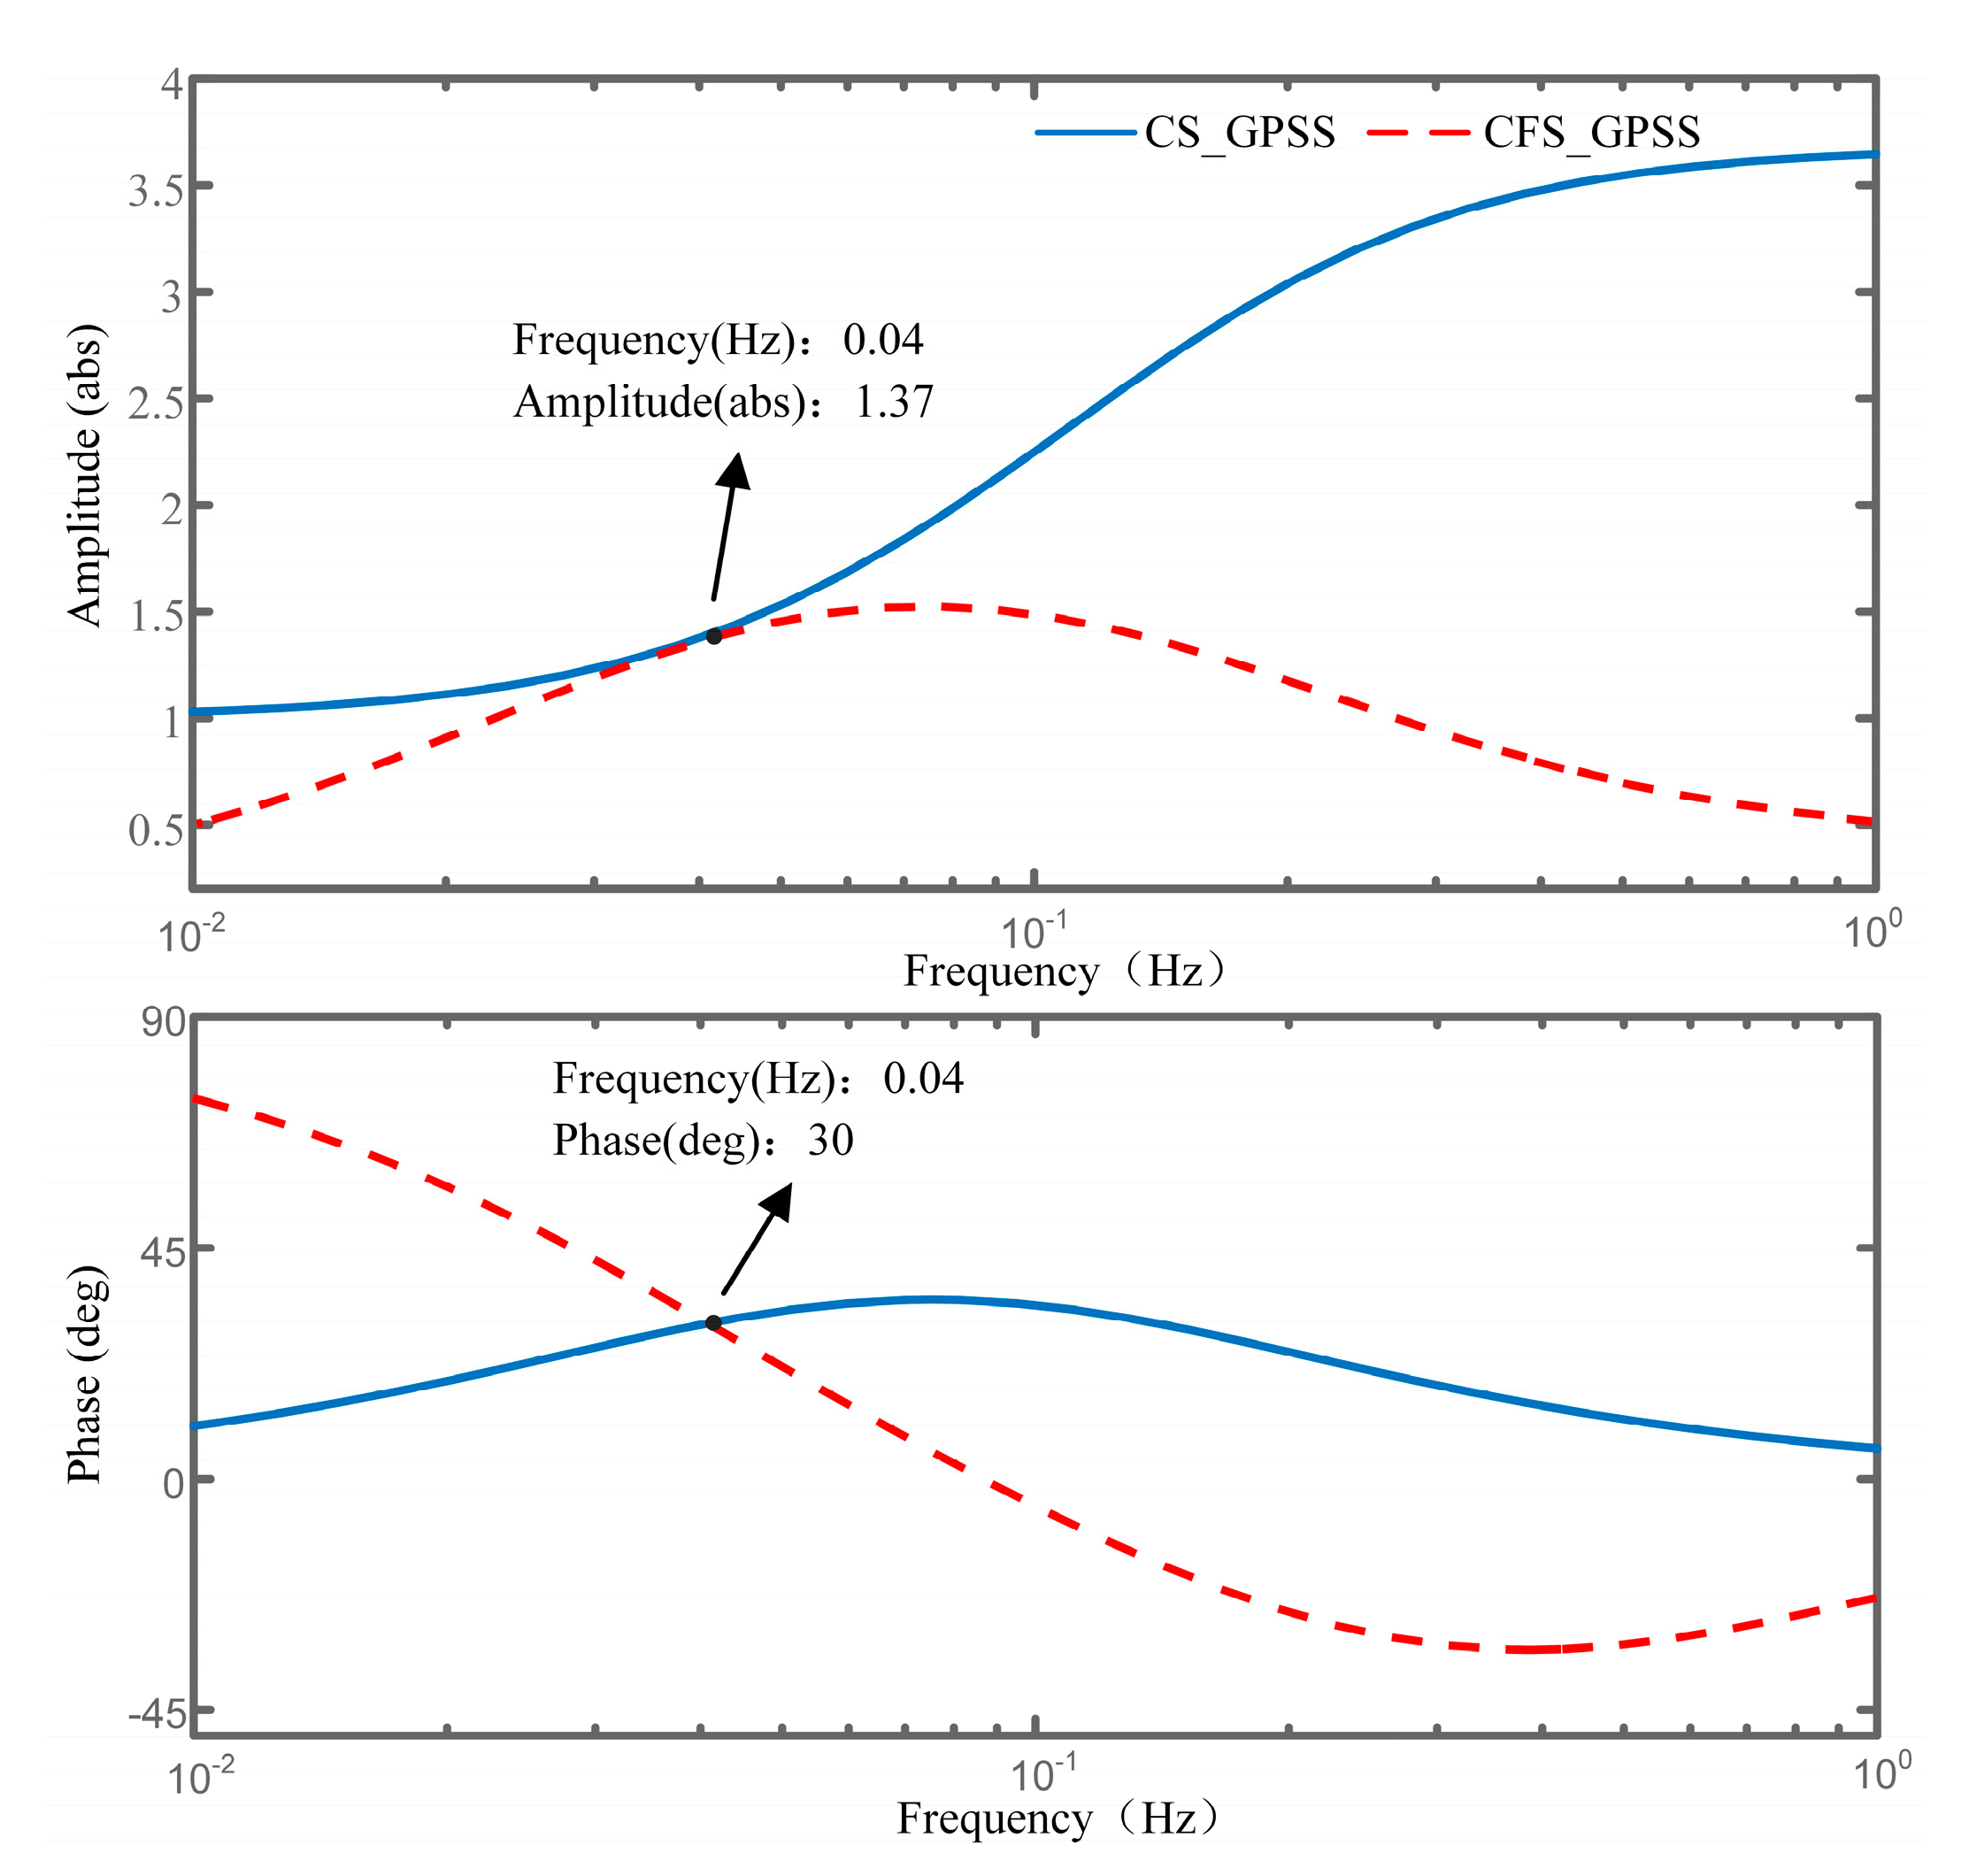
In comparison to the CS_GPSS, the CFS_GPSS can compensate for larger phase angles within a narrower frequency range centered around the target frequency. This characteristic effectively enhances the damping characteristics of this specific frequency band.
(b)
Beyond the frequency range requiring phase compensation, the CS_GPSS tends to produce a larger amplitude, potentially introducing errors in system compensation. In contrast, the CFS_GPSS exerts a minimal impact on frequencies outside the ultra-low-frequency range due to its significantly reduced gain.
The primary task of the governor is to participate in the PFR of the system. Hence, while effectively suppressing ULFO, it was also necessary to analyze the performance of the PFR of the speed regulator.
In Figure 8, the frequency response is obtained using the CS_GPSS, the CFS_GPSS, and without a GPSS when the 0.2 Hz step disturbance is applied to the simplified single-machine system shown in Figure 1. Compared to no GPSS and the CS_GPSS, the CFS_GPSS significantly improved the performance of PFR by substantially reducing power overshoot, shortening the settling time to 60 s, and minimizing oscillations during regulation.

4. Numerical Simulations and Analysis

In this section, the load disturbance and frequency step disturbance are carried out in the 3-machine, 9-bus system. This study evaluates the oscillation suppression performance and PFR performance of the speed regulation system, considering various operating conditions and diverse control strategies.

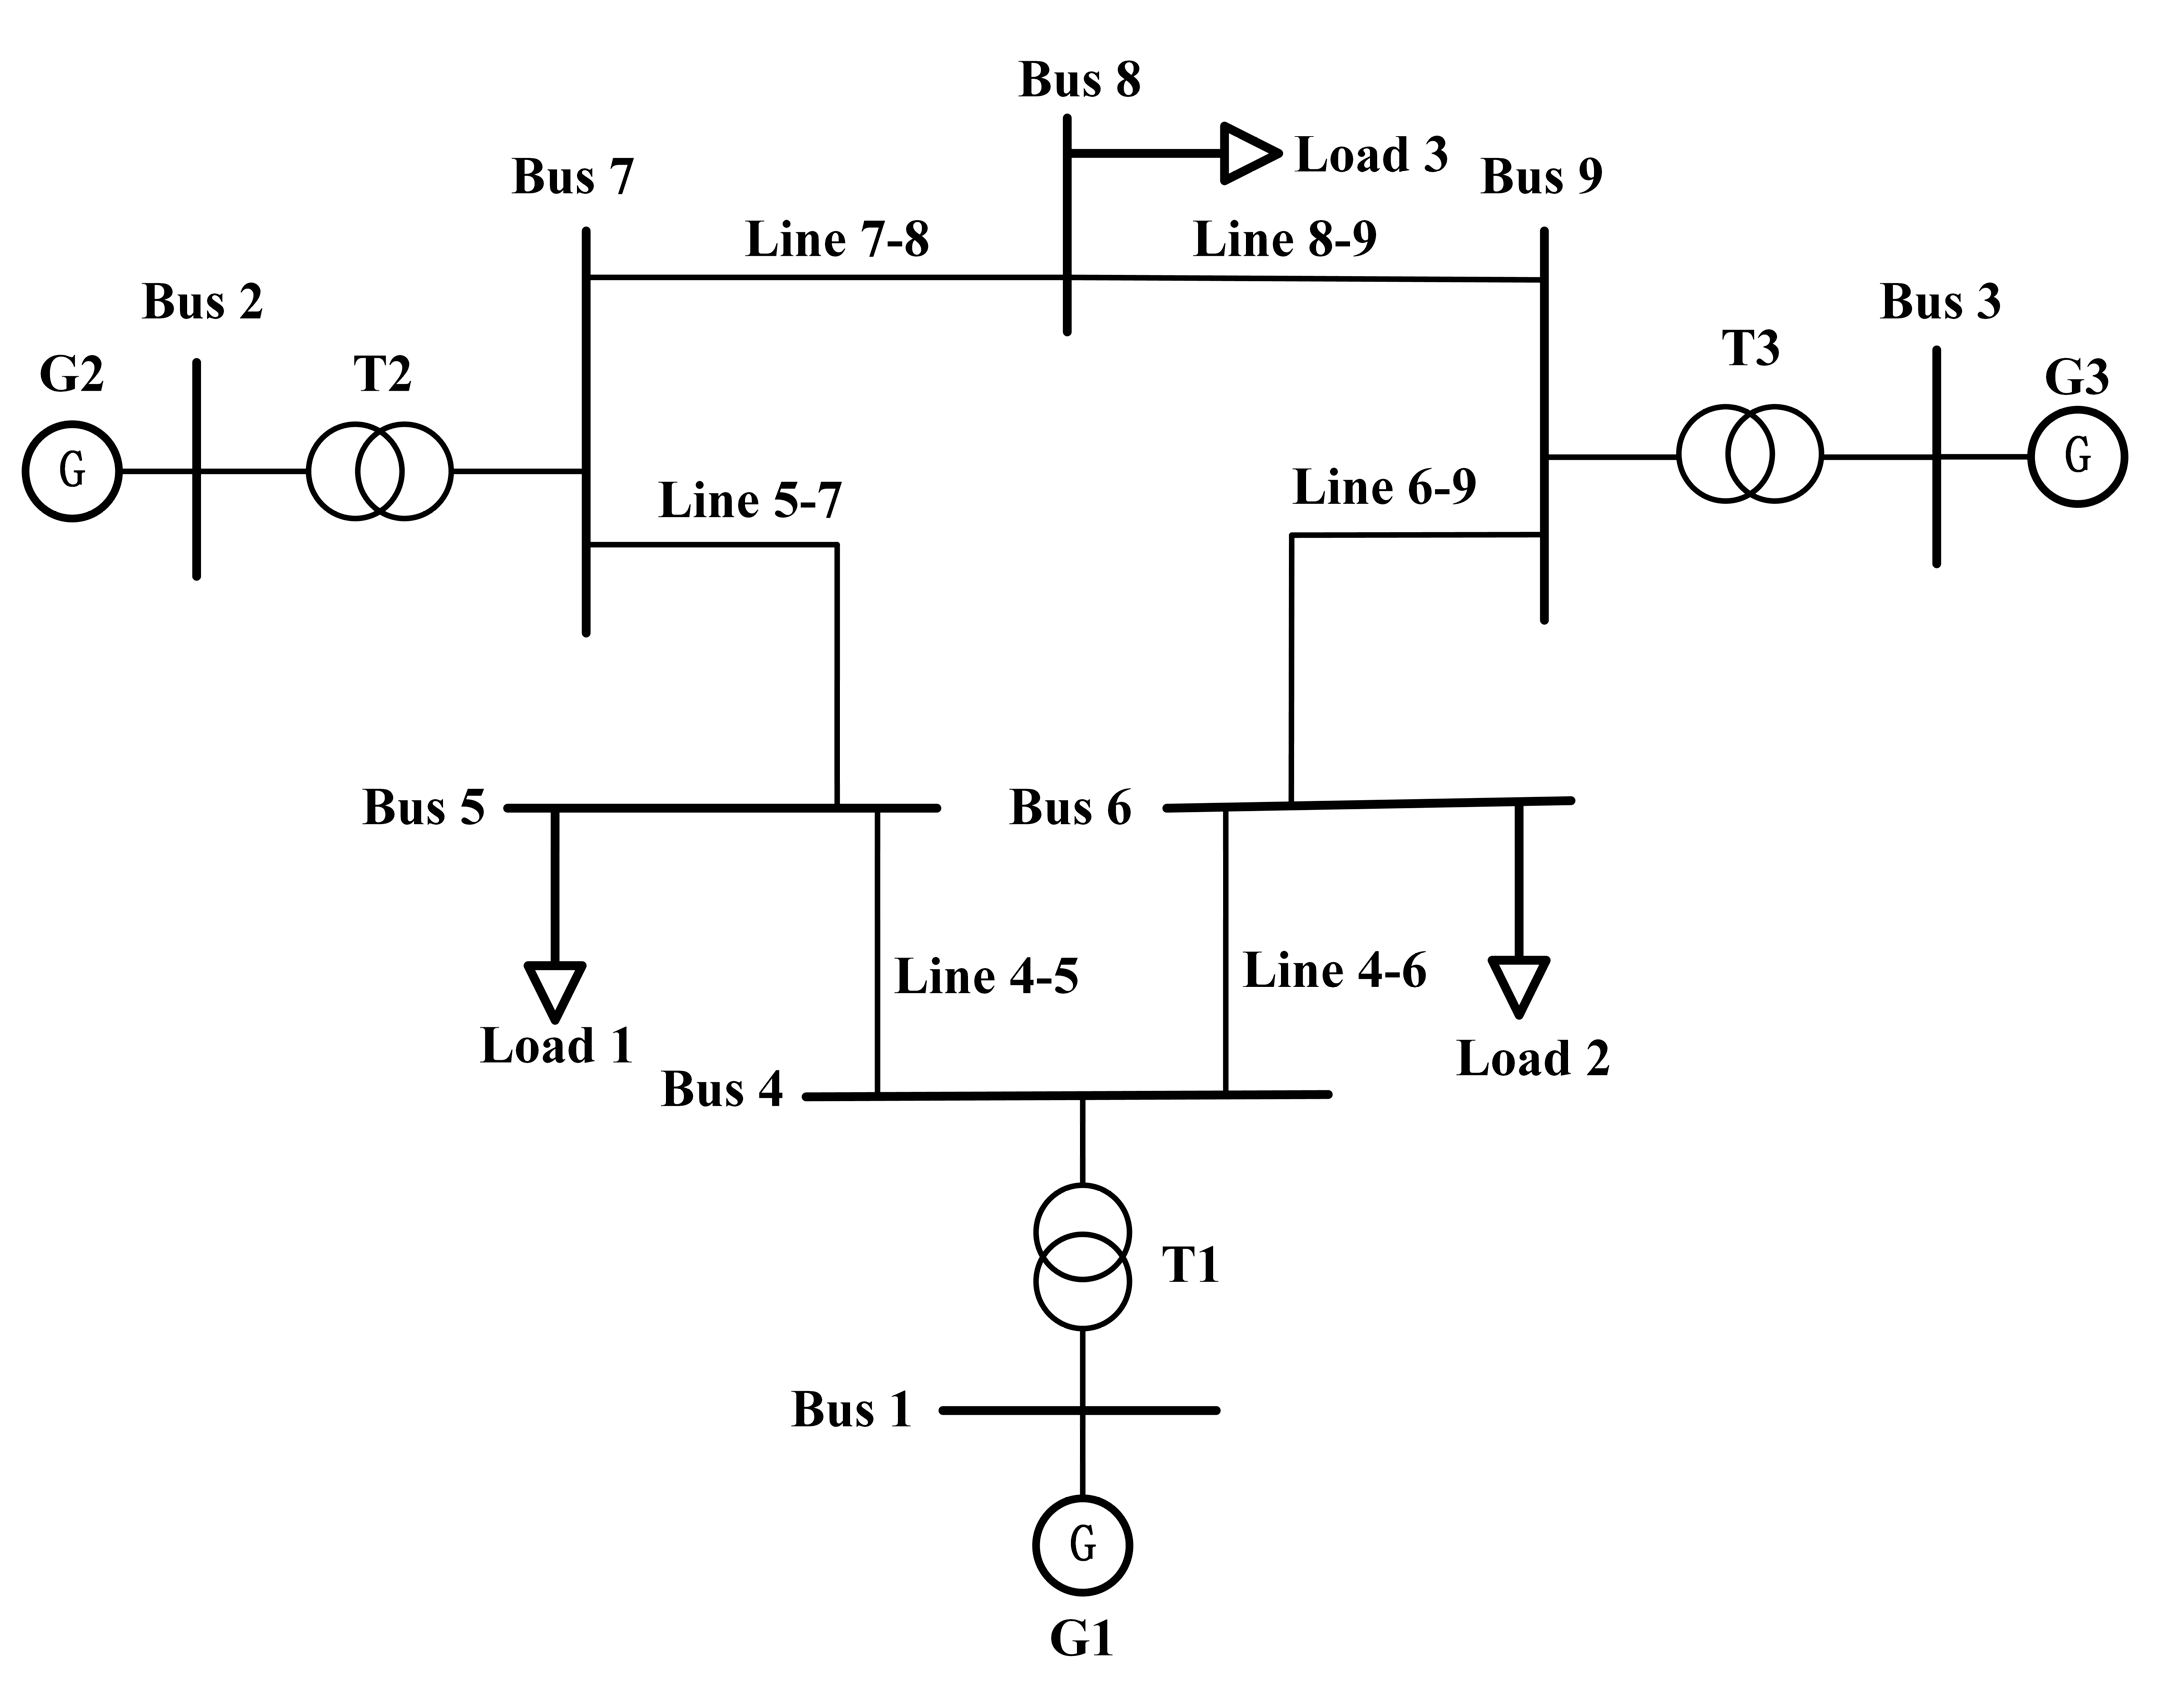
4.1. Simulation Environment

The 3-machine, 9-bus system with a high proportion of hydropower is shown in Figure 9 below. Generators G1 and G3 were configured with a fifth-order hydraulic generator model, coupled with a speed regulator model as outlined in Figure 1. Generator G2 was based on a sixth-order thermal generator model equipped with an IEEE G1-type speed regulator model. The respective rated capacities for these generators were 247.5 MVA, 128 MVA, and 192 MVA. Detailed parameters of the system model are delineated in the Appendix A and Table A1 and Table A2.
Three operating conditions were set to comprehensively evaluate the control and frequency regulation performance of the CFS_GPSS within a wide ULFO range. The operating condition settings referred to [28] and the specific settings were as follows: operating condition 1 represented the basic operating mode; operating condition 2 simulated a strong grid connection with a 10% reduction in hydroelectric power output; operating condition 3 simulated a weak grid connection in which the hydroelectric power output was increased by 10%. The corresponding parameter settings are shown in Table 2.
Operating condition 2 will explore the performance of the CFS_GPSS when the hydropower output is reduced and the oscillation frequency is 0.034 Hz. Operating condition 3 will reveal the control effect of the CFS_GPSS in response to increased hydropower output and an oscillation frequency of 0.054 Hz.

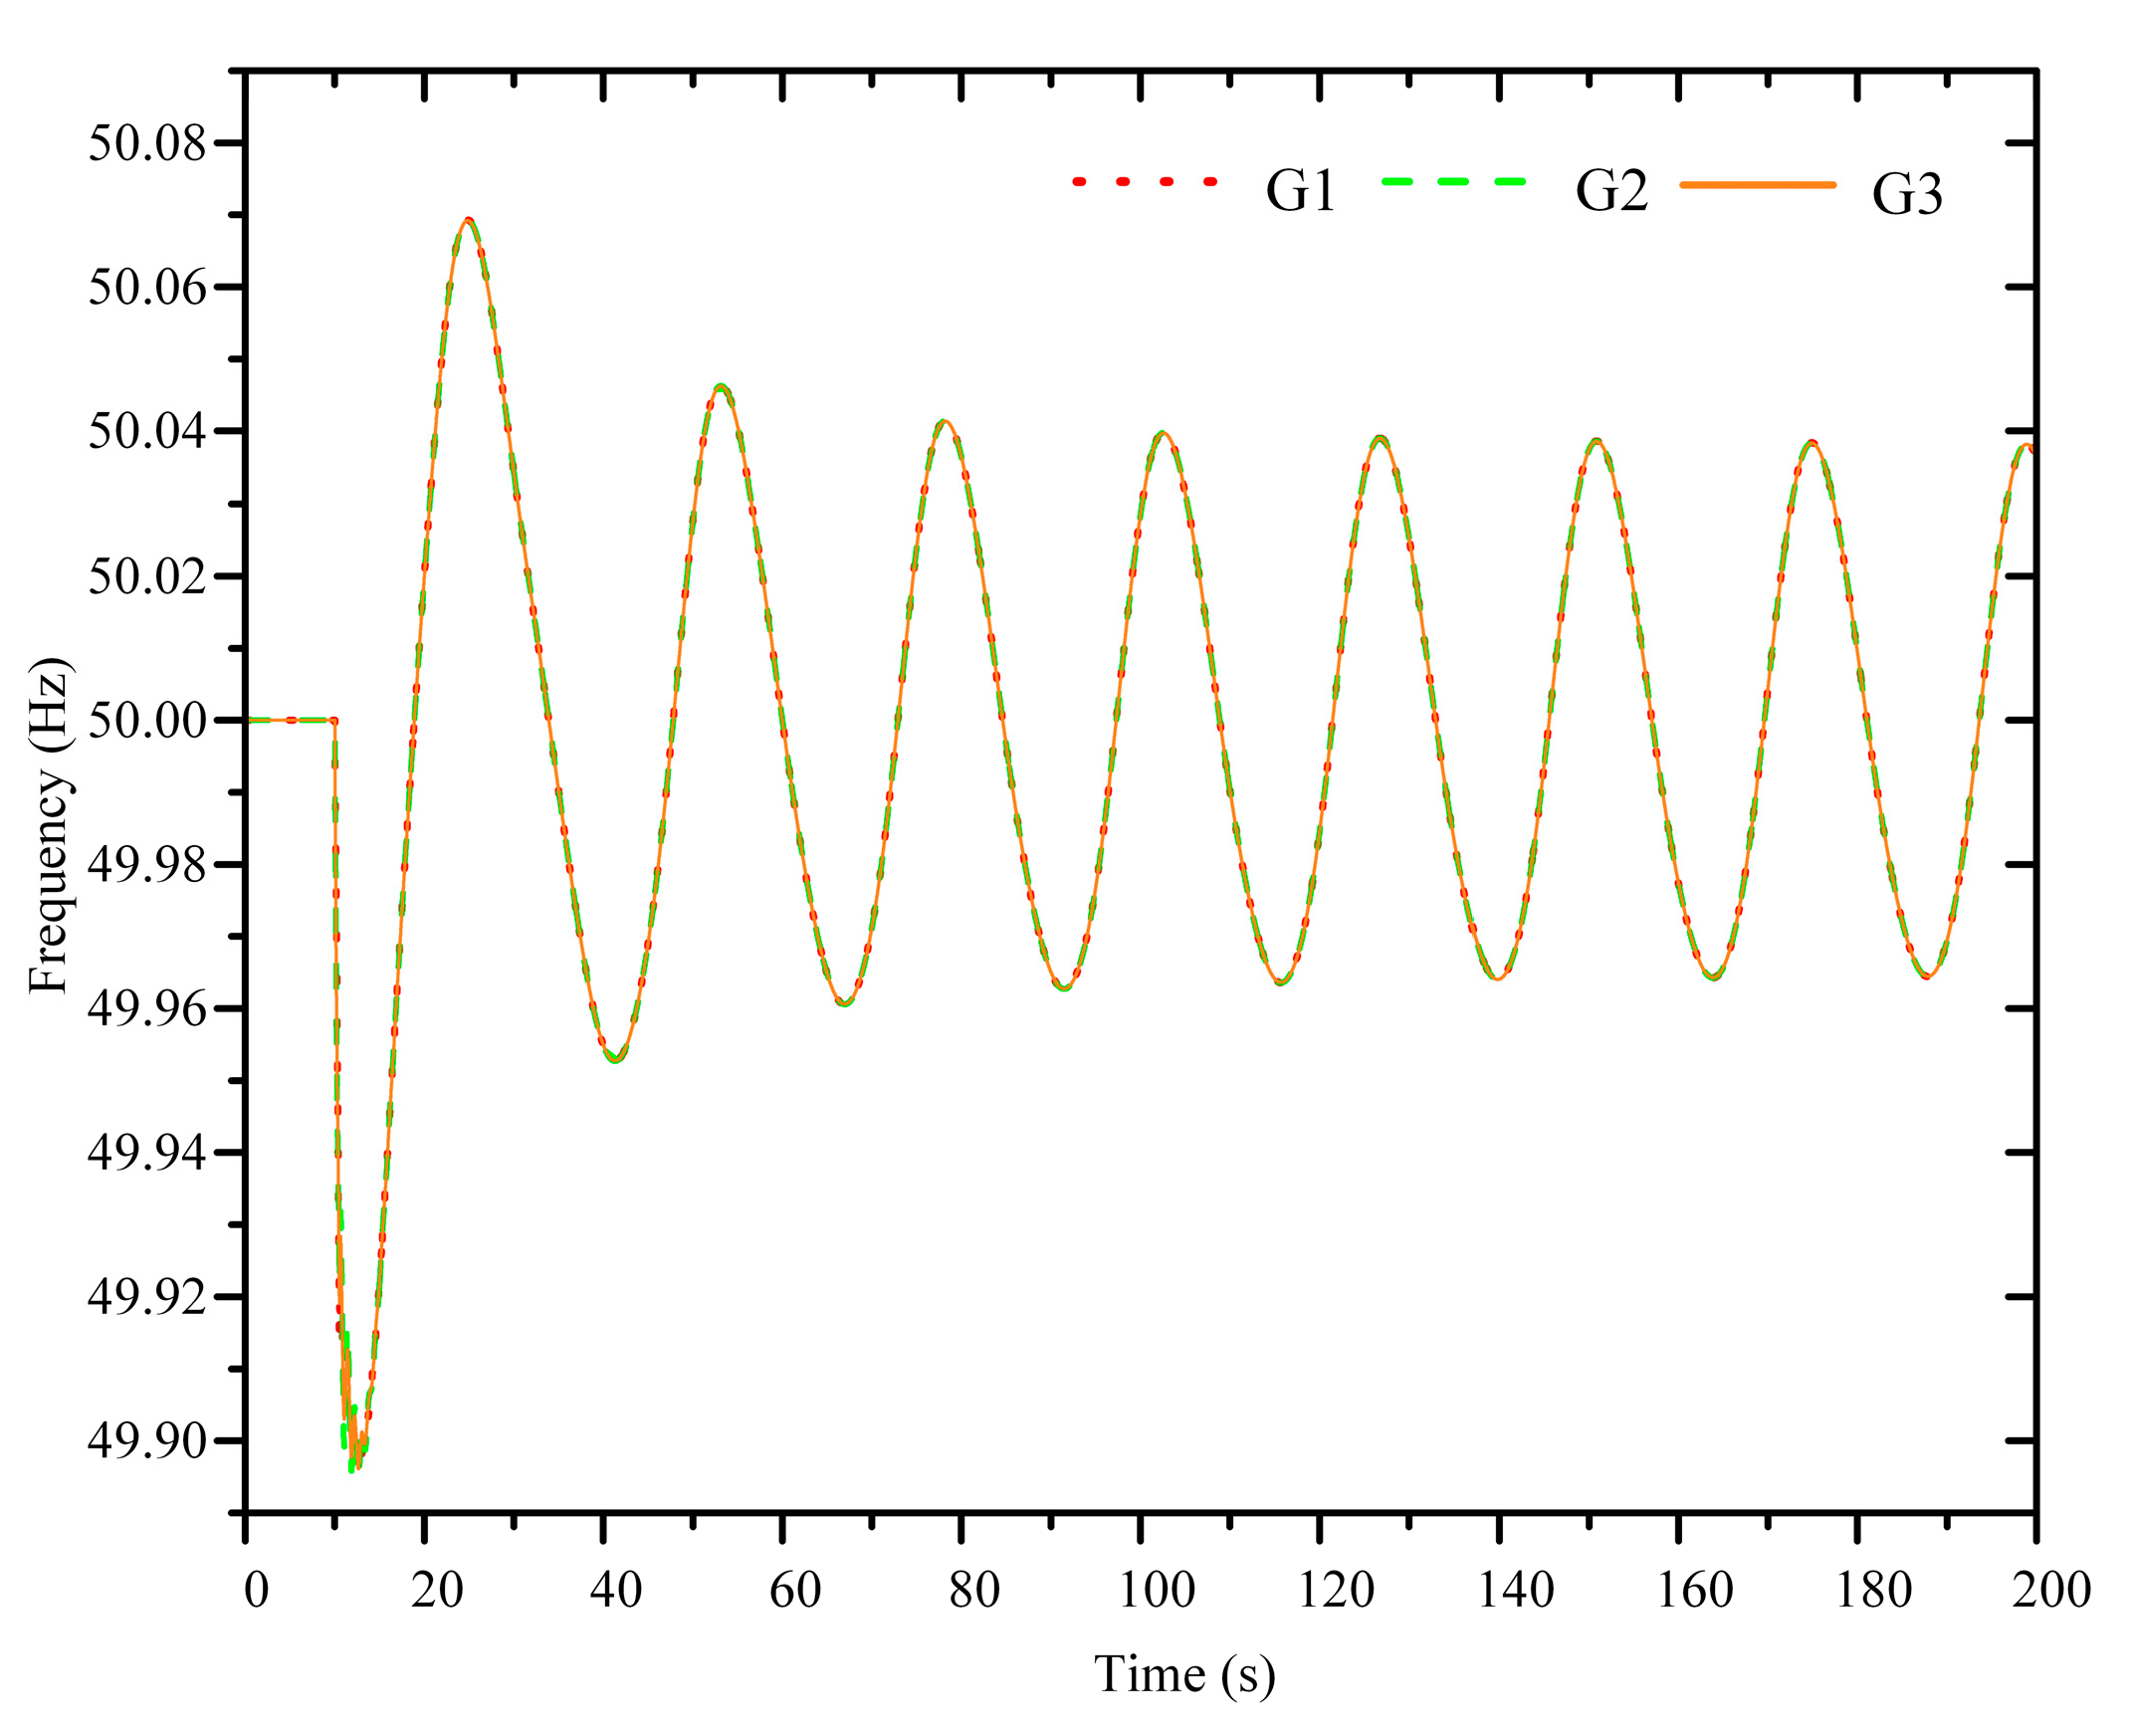
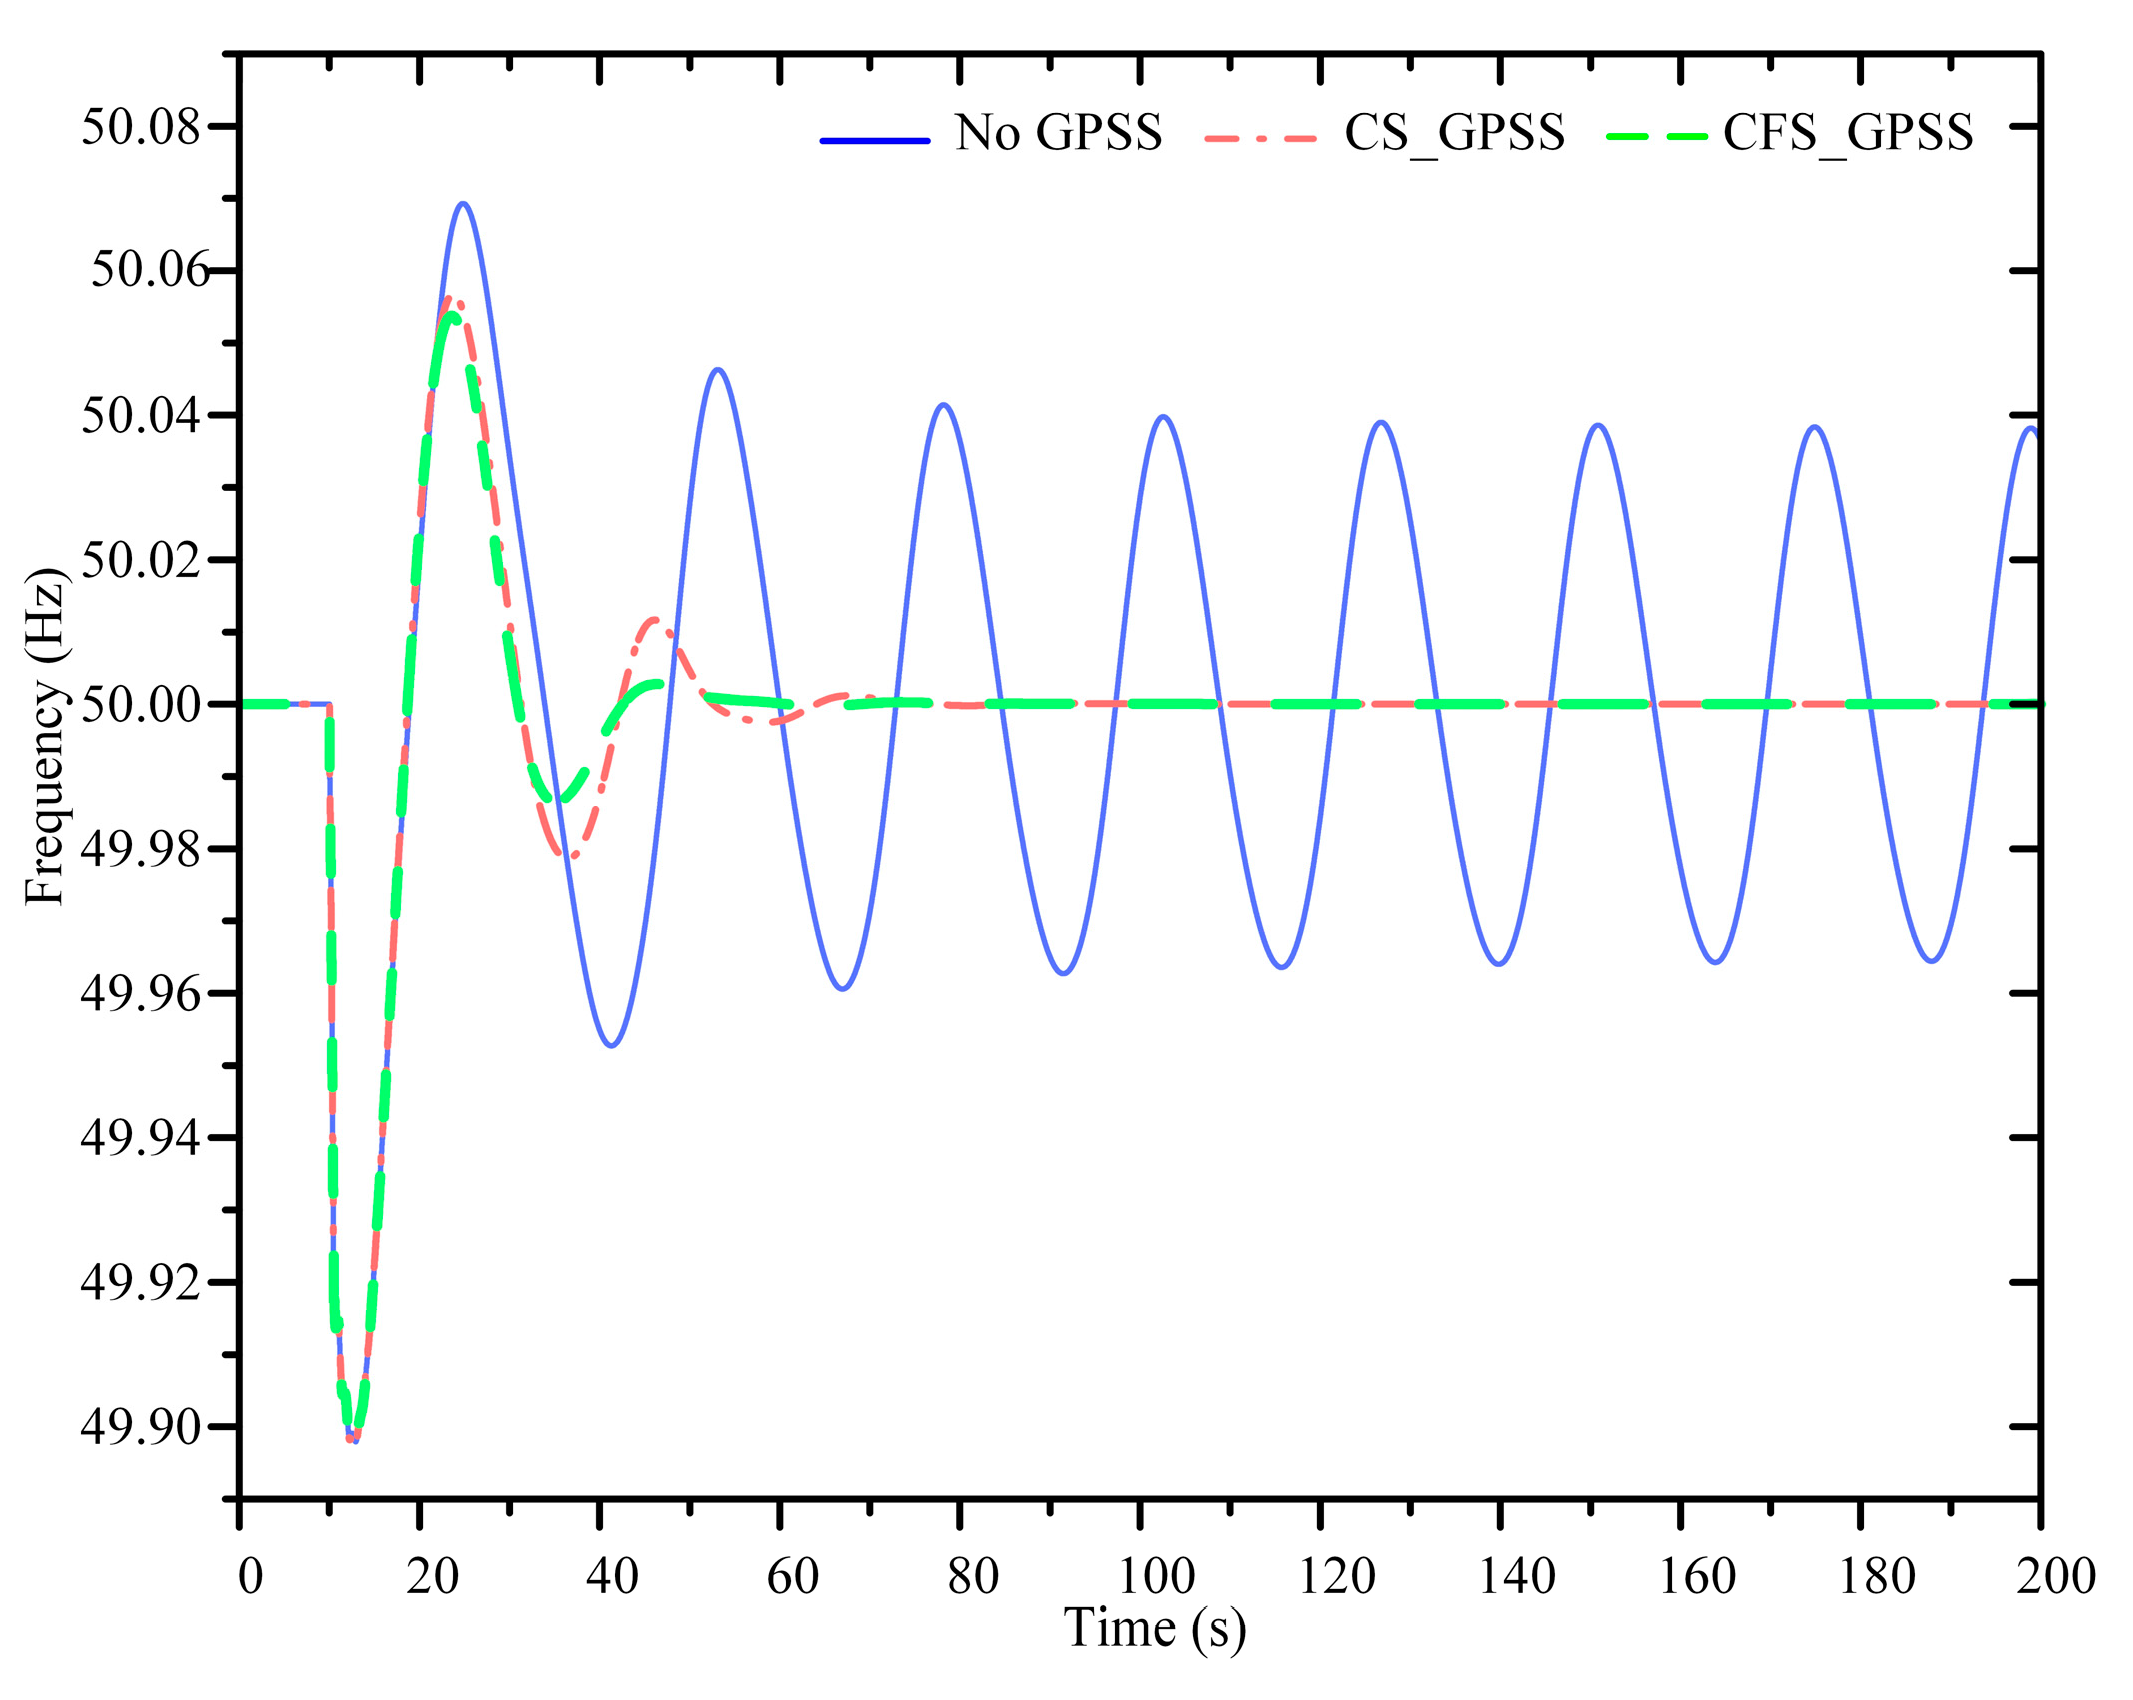
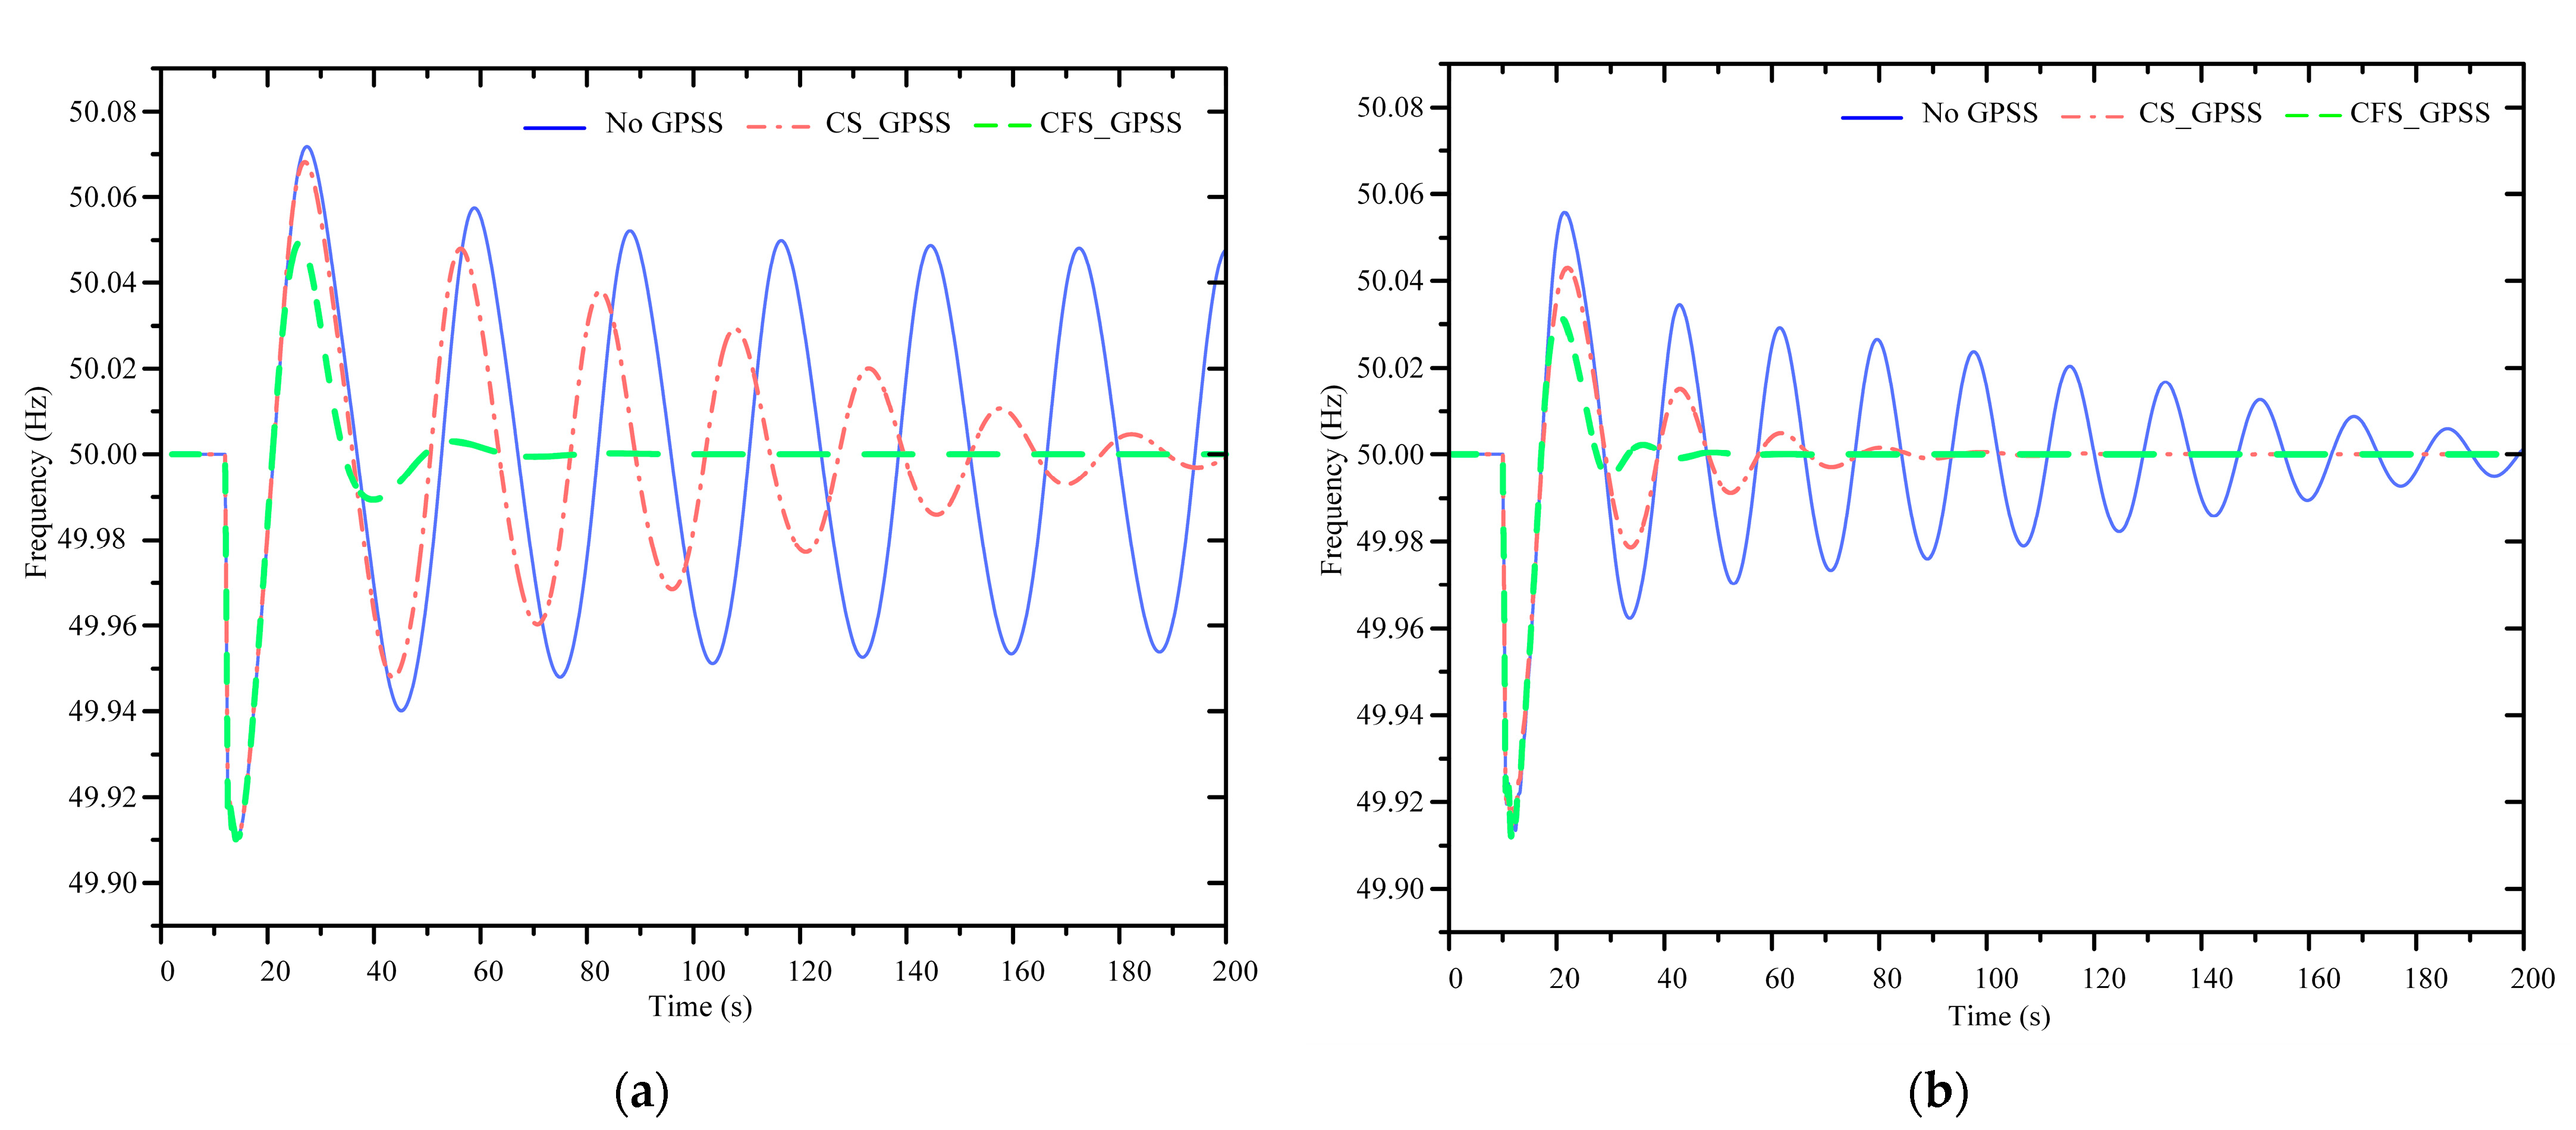
4.2. Oscillation Suppression Performance Analysis

In this subsection, the suppression effect of different control strategies on the ULFO is investigated under load disturbance conditions, including scenarios without GPSS, with CS_GPSS, and with CFS_GPSS control strategies. To comprehensively examine the effectiveness of the CFS_GPSS control strategy, operating condition 1 is thoroughly analyzed. The simulation duration was set to 200 s. At 10 s, a 20% increase in active power for load 1 occurred for a duration of 5 s. The frequency response curves of the three generators in the system are shown in Figure 10.
It should be noted in Figure 10 that the ULFO occurred when the load was disturbed. It is seen from Figure 10 that the oscillation frequencies of the three generators were the same, indicating a co-frequency oscillation state. The oscillation amplitude was less than 0.1 Hz and showed a slow attenuation trend. By employing the matrix pencil method, an estimated damping ratio of 0.71% was obtained for an oscillation frequency of 0.04 Hz.
Furthermore, the values |Ggov| = 5 and φ = −140° were determined based on Equations (11) and (17). At the oscillation frequency of 0.04 Hz, the output power of the prime mover exhibited a lagging behavior with respect to the rotational speed deviation, resulting in pronounced negative damping characteristics within the system. When the CFS_GPSS was introduced to improve system damping, the center frequency was selected as 0.04 Hz and the compensation phase angle needed to be greater than 60°. The parameter settings of the CF_GPSS are shown in Table 3.
The G1 frequency under different control strategies is illustrated in Figure 11, demonstrating the effective suppression of ULFO by the proposed CF_GPSS. To further quantitatively evaluate the proposed strategy and the traditional methods, several key indicators including the number of oscillations, steady time, and amplitude of oscillation are summarized in Table 4.
The simulation results in Table 4 show that the CS_GPSS and CFS_GPSS could significantly reduce the steady time and the number of frequency oscillations while also decreasing the upper limit of the oscillation amplitude and increasing the lower limit to suppress the ULFO. However, it should be noted that the CS_GPSS exhibited slightly inferior performance compared to the CFS_GPSS, with the system’s steady time being 10 s longer.
Additionally, in order to further investigate the oscillation suppression performance of the CFS_GPSS across a wide frequency range, load disturbances were conducted under operating conditions 2 and 3. The frequency variation curve of generator G1 during these two operating conditions is illustrated in Figure 12.
It can be seen from Figure 12a that a ULFO of 0.034 Hz occurred in the system when the hydropower output decreased. The CS_GPSS method exhibited inadequate suppression effectiveness, with a steady time and number of oscillations of approximately 90 s and four cycles, respectively. In contrast, the CFS_GPSS method achieved regulation within 50 s and demonstrated minimal oscillations. Compared to the CS_GPSS, the CFS_GPSS significantly enhanced the damping level and effectively suppressed the system oscillation. This conclusion aligns with the theoretical analysis presented in Figure 7. Figure 12b shows that the system had a ULFO of 0.054 Hz when the hydropower output increased. It is noteworthy that both control strategies effectively mitigated the ULFO, with the CFS_GPSS demonstrating a more pronounced suppression effect in this particular case. Specifically, the steady time of the system was reduced to 50 s, resulting in approximately two cycles of oscillations and a decrease in oscillation amplitude.
To sum up, the CS_GPSS control strategy exhibited limited robustness across a wide range of operating conditions. The CFS_GPSS control strategy demonstrated superior performance at preset frequencies but also effectively suppressed oscillation over a wider frequency range. This characteristic effectively solves the issue of frequency drift caused by variations in system output and holds significant potential for extensive applications in the ultra-low-frequency band.

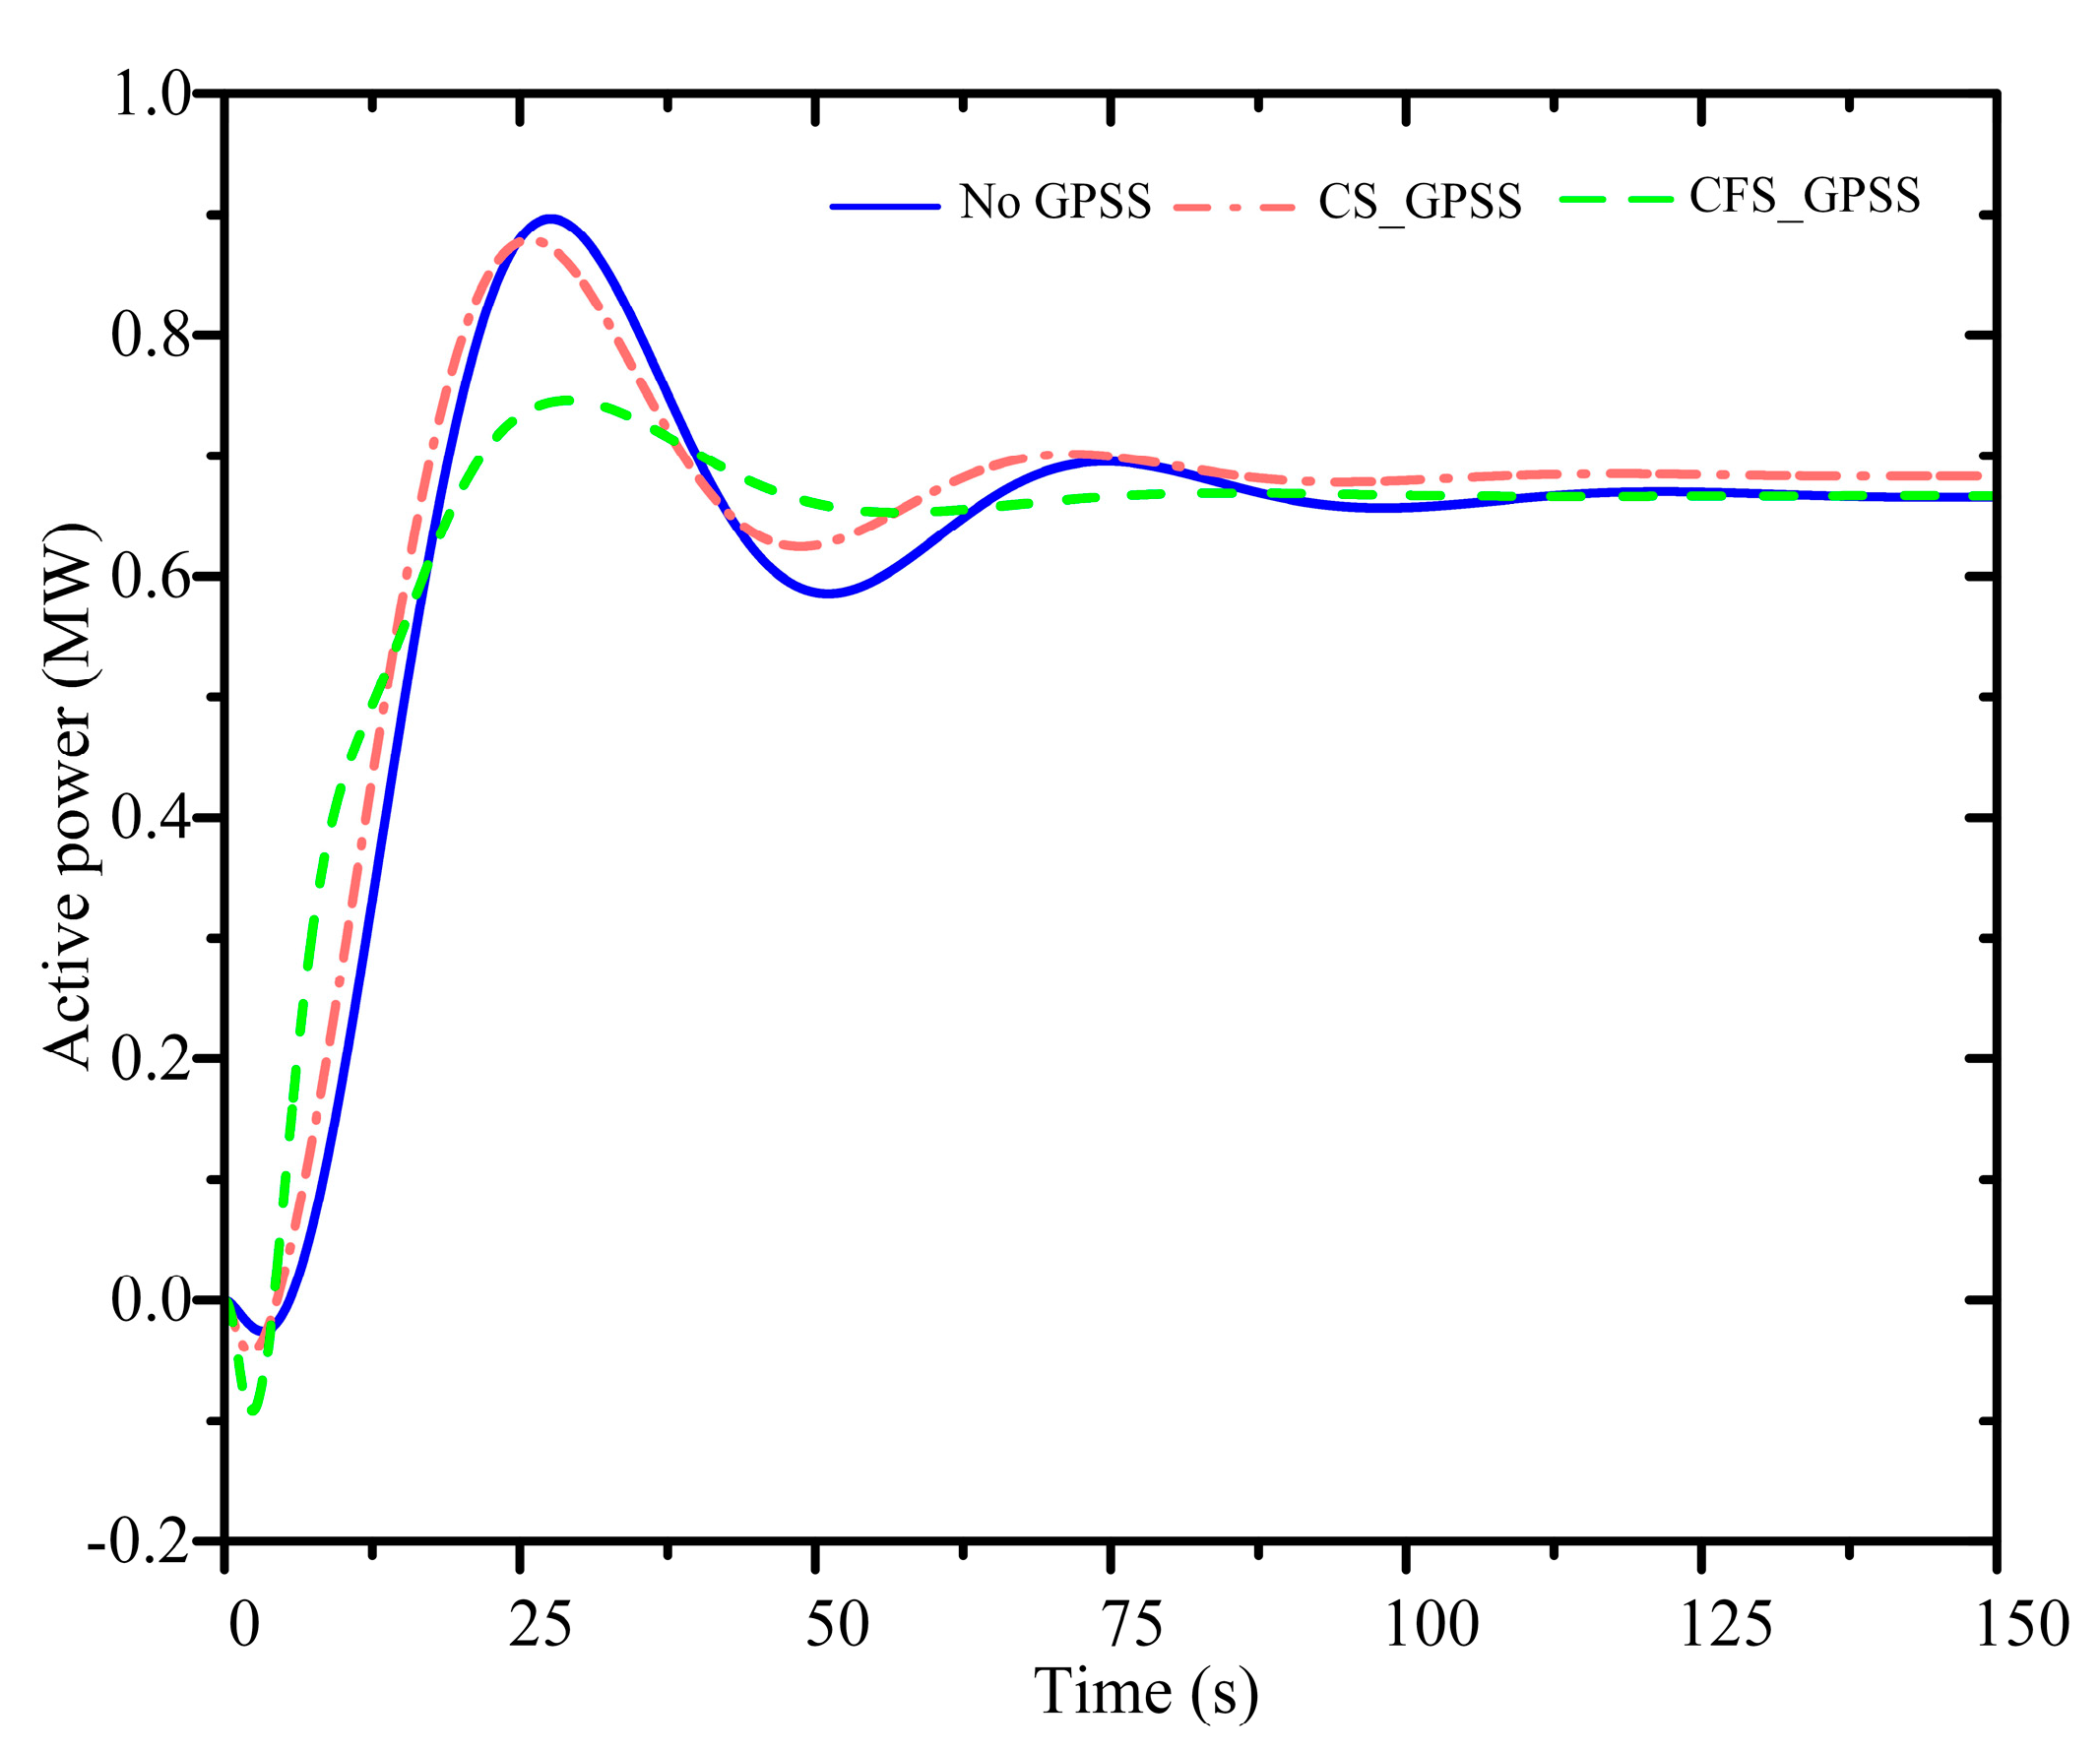
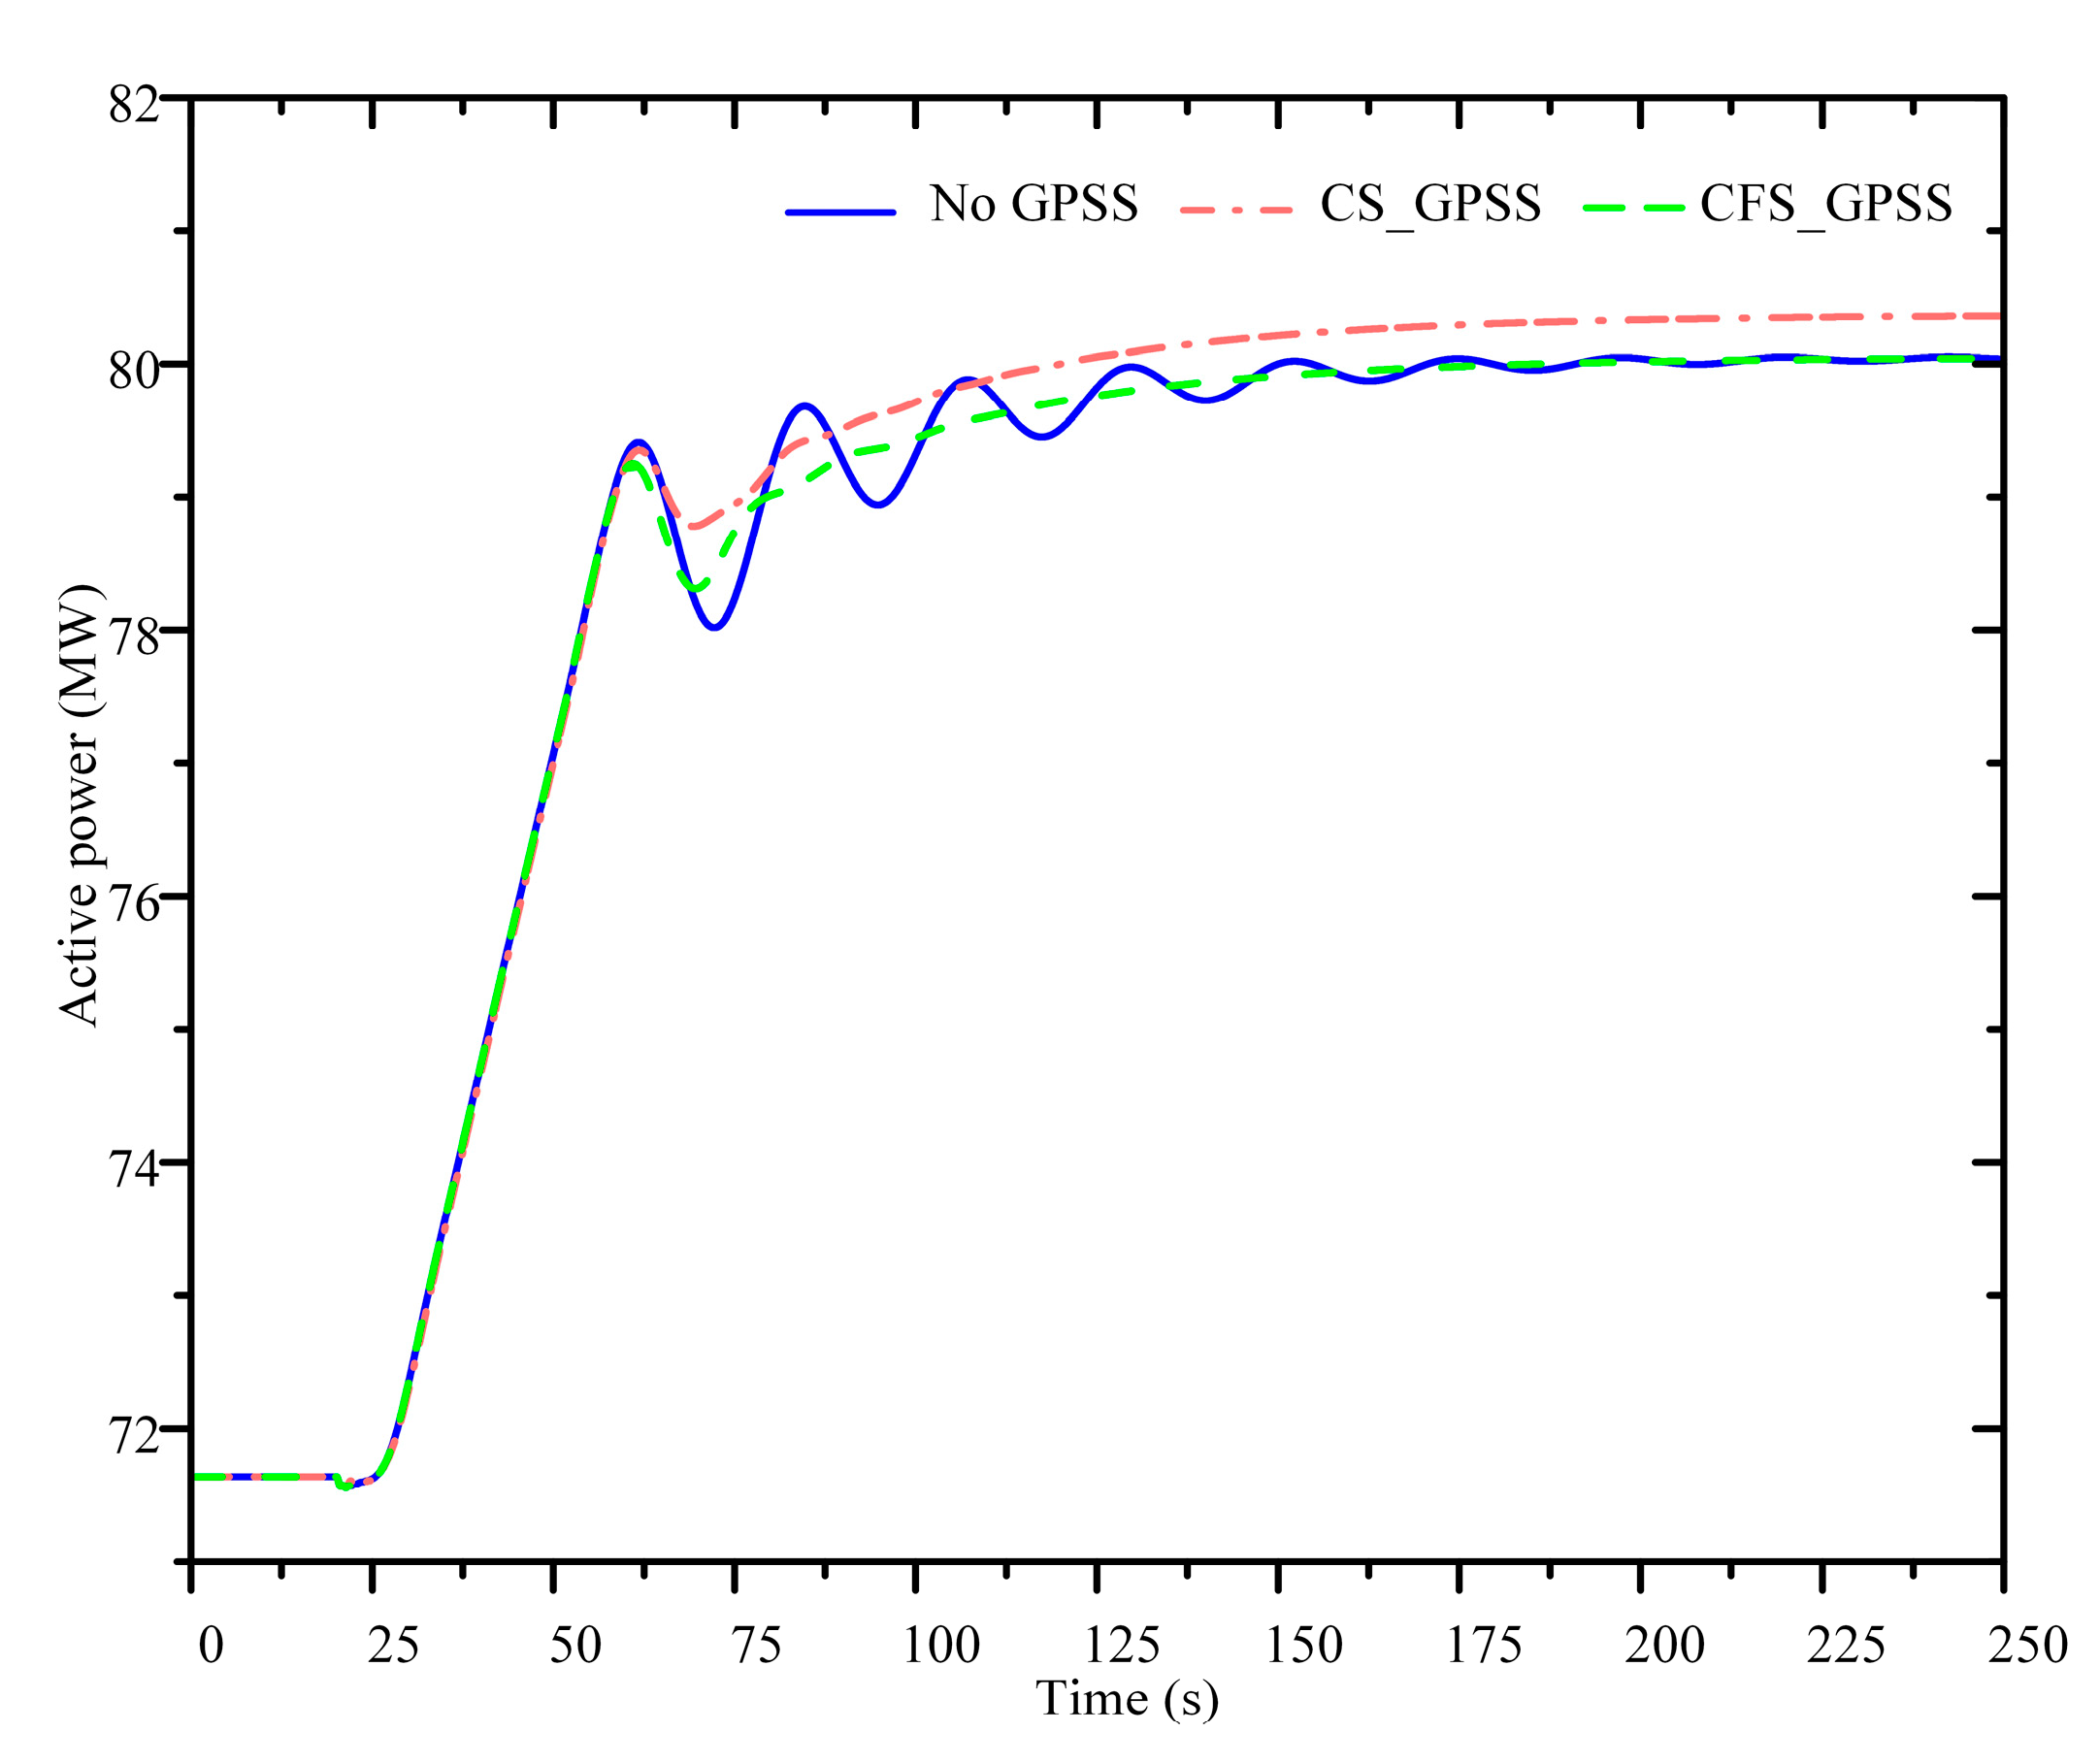
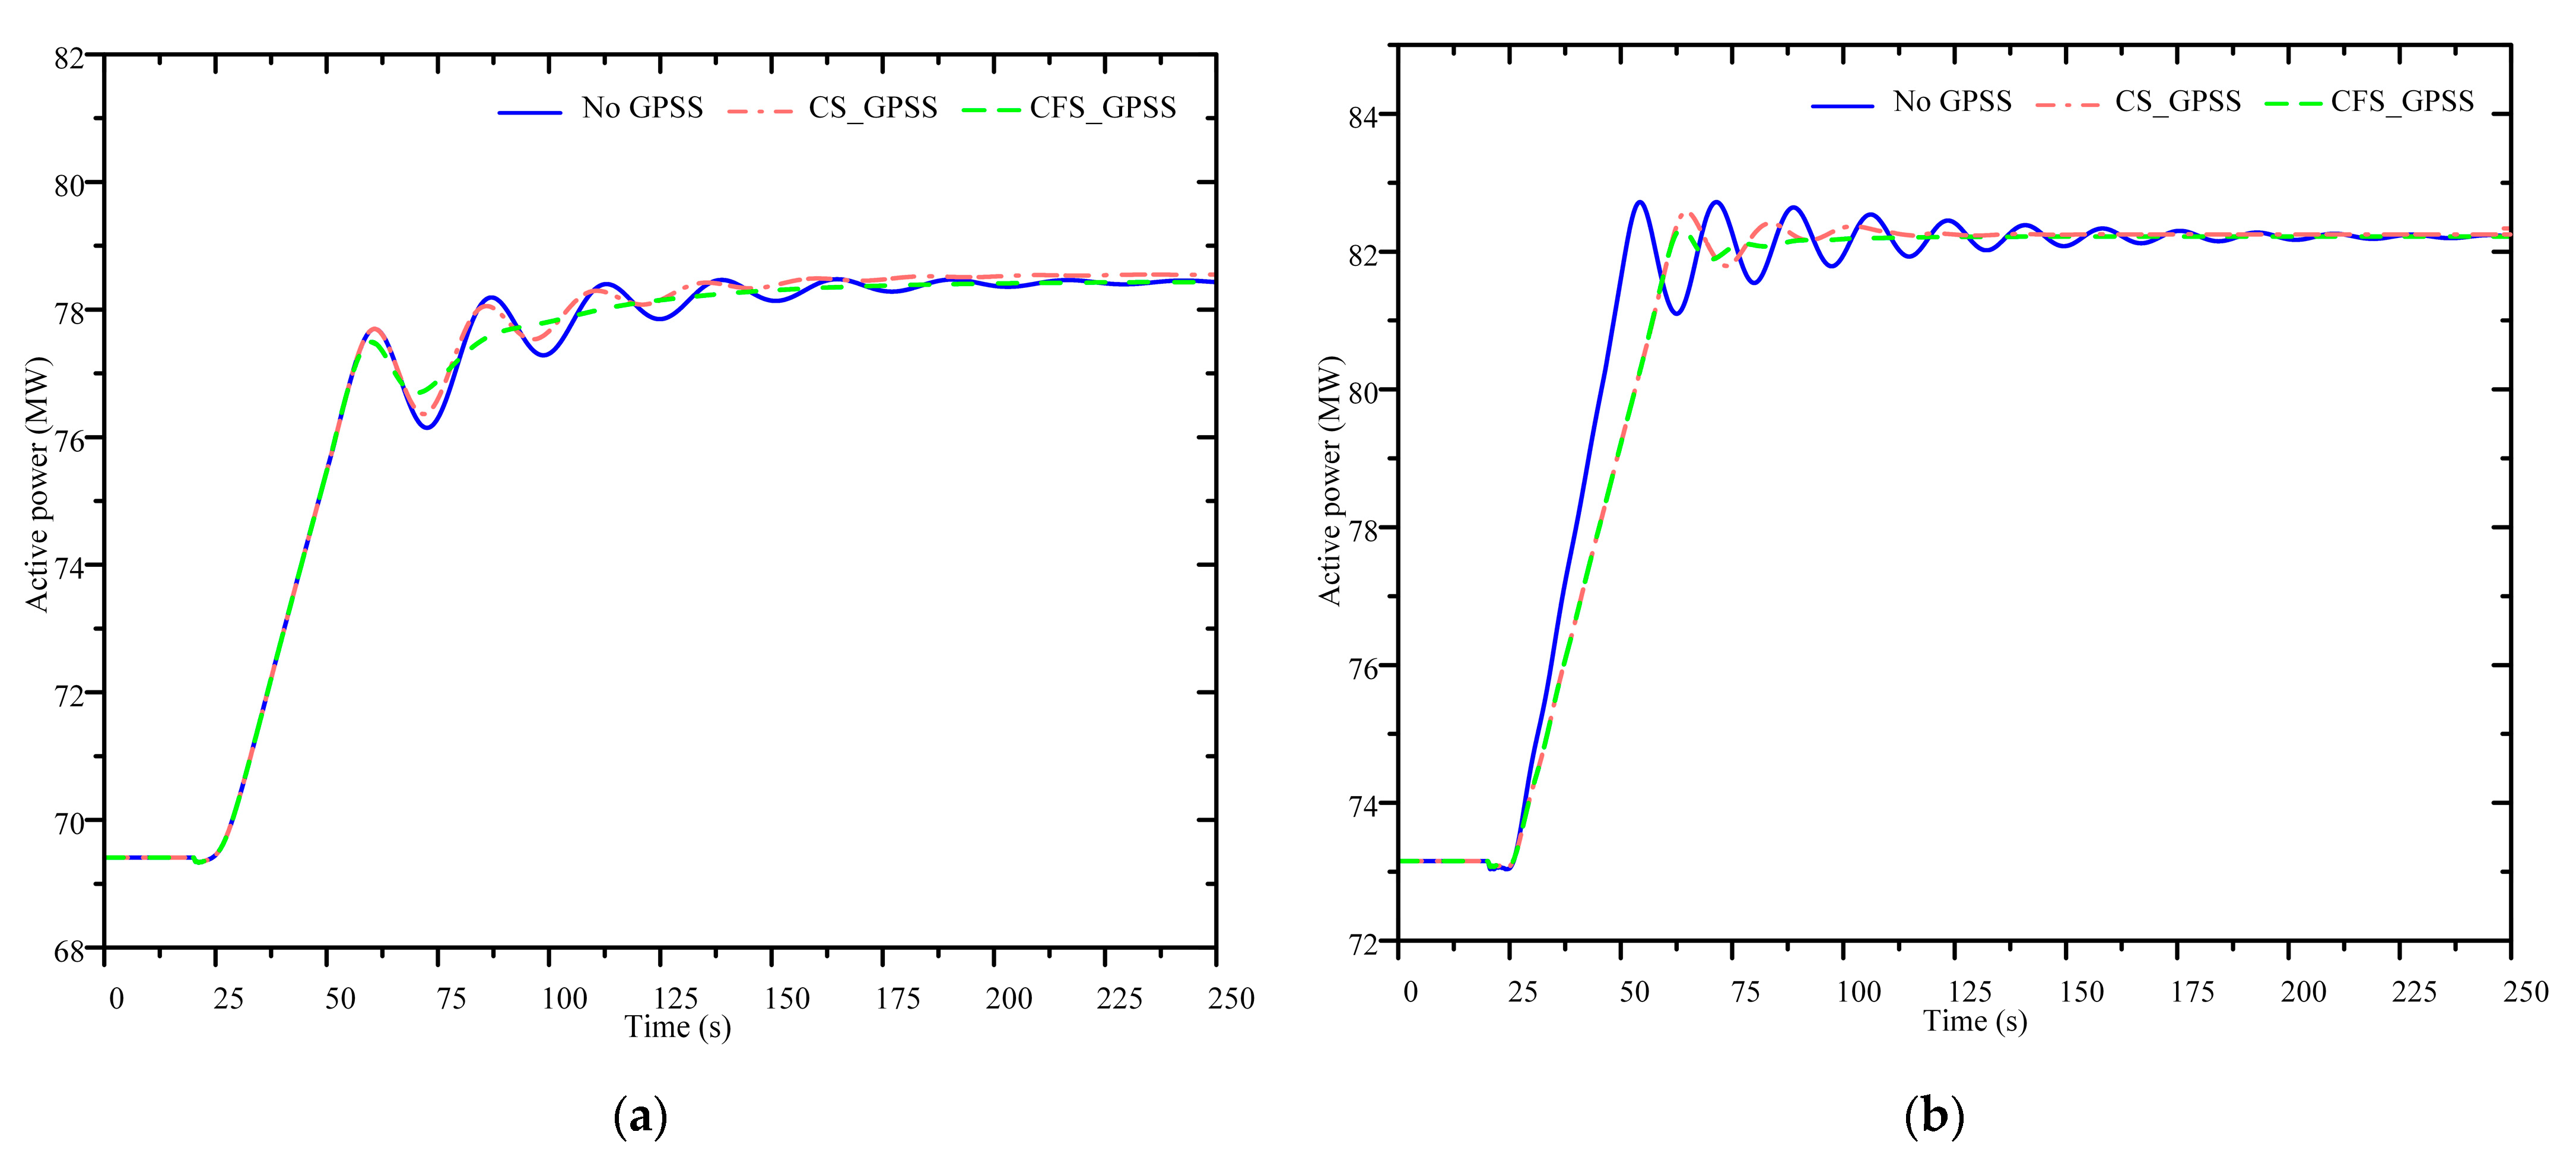
4.3. PFR Performance Analysis

To investigate the impact of the CFS_GPSS on PFR performance, a frequency step test was conducted to study the frequency regulation performance of control strategies without a GPSS, with the CS_GPSS, and with the CFS_GPSS. In accordance with the “Guide for Technology and Test on Primary Frequency Control of grid-connected power resource”, the applied step disturbance must be greater than ±0.1 Hz and less than or equal to ±0.2 Hz when evaluating the dynamic performance of PFR.
In this case, the G1 speed control system was subjected to a 0.2 Hz step disturbance, and the resulting change in the active power of G1 is illustrated in Figure 13. The delay time, rise time, and settling time were chosen as indices to evaluate the dynamic performance of PFR, as shown in Table 5.
The system delay times were observed to be nearly identical across the three control strategies, approximately 10 s when the active power increased from 0 to 10%, as depicted in Figure 13 and Table 5. Furthermore, incorporating a GPSS into the speed regulator effectively mitigated power fluctuations, resulting in a reduction in oscillations to just one cycle for both the CS_GPSS and the CFS_GPSS. However, in comparison to systems without a GPSS, the CS_GPSS method exhibited an increase in both rise time and settling time by 24 s and 23 s, respectively. On the other hand, the CFS_GPSS method significantly reduced system stabilization time to 92 s. These findings demonstrate that the implementation of the CFS_GPSS control strategy could effectively enhance PFR performance within the system.
The performance of frequency regulation was investigated under operating conditions 2 and 3 in a similar manner. Figure 14 illustrates the active power. It can be observed that both the CS_GPSS and the CFS_GPSS could effectively enhance the PFR performance of the system. Notably, the frequency regulation performance of the CFS_GPSS control strategy surpassed that of the CS_GPSS method. In operating conditions 2 and 3, the stabilization time for PFR was reduced to 88 s and 40 s, respectively, and the oscillation period was shortened to half a cycle.
In conclusion, the CFS_GPSS effectively reconciled the trade-off between the rapidity and accuracy of the PFR process. Compared with the CS_GPSS, the CFS_GPSS had a faster regulation speed and fewer oscillations, thereby significantly enhancing the performance of PFR.

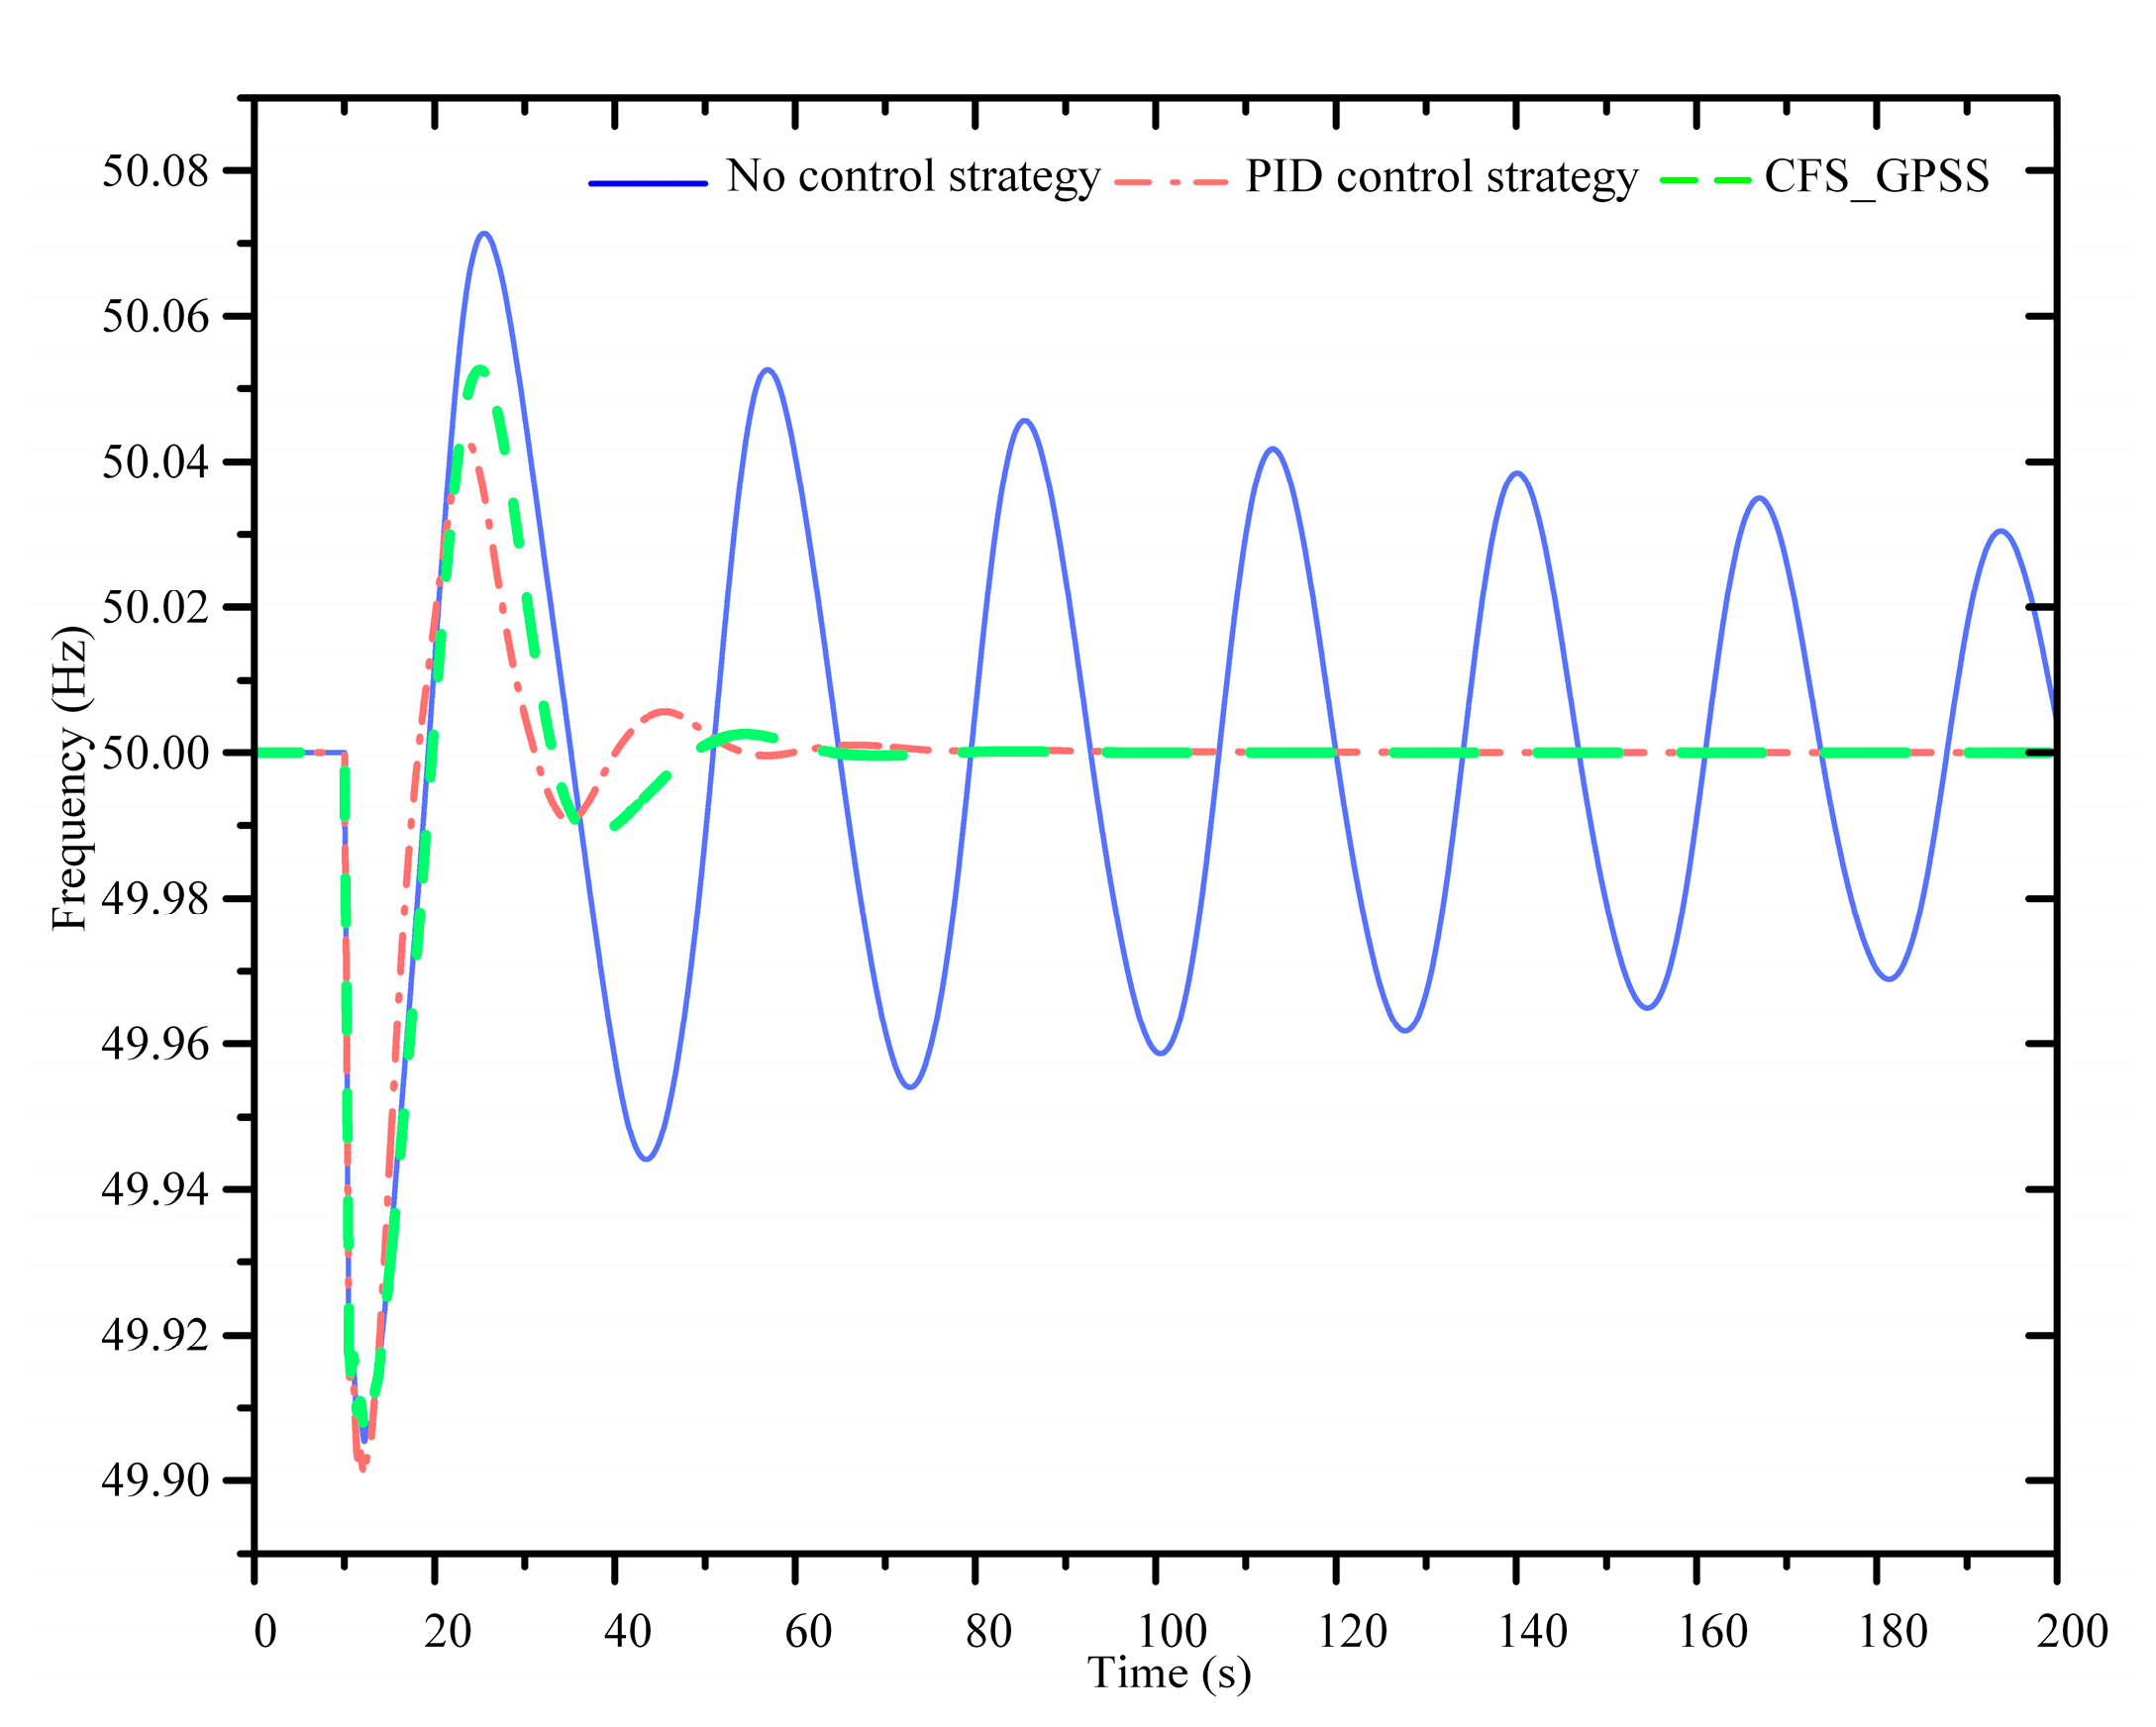
5. Performance Comparison between PID and the CFS_GPSS

In practical systems, PID parameter optimization control strategies are extensively employed for suppressing the ULFO. However, modifying the PID control parameters of the speed regulation system may potentially impact the frequency regulation performance of the system.
In order to assess the PFR performance of PID parameter optimization and the CFS_GPSS control strategy, a further investigation was carried out in operating condition 1. Firstly, it was assumed that both control methods exhibited similar oscillation suppression effects. Secondly, a comparative analysis of the PFR performance between the two control methods was conducted.
The PID parameters were optimized using the method in [16]. The PID parameters of G1 were set as KP = 11.5 and KI = 0.6 and the PID parameters of G2 were set as KP = 8.6 and KI = 0.35. Figure 15 illustrates the control effects of the different methods. It can be observed from Figure 15 that both control methods exhibited similar suppression effects, with the ULFO being suppressed within approximately 70 s.
By applying the frequency step perturbation as described in Section 4.3, the active power and frequency regulation evaluation indicators are shown in Figure 16 and Table 6. Based on these results, it is evident that both the PID parameter optimization and the CFS_GPSS control strategies effectively reduced the frequency oscillation during the PFR process. In terms of PFR performance, the CFS_GPSS achieved a rise time of 40 s and settling time of 92 s, which were respectively shorter by 59 s and 34 s compared to the PID parameter optimization method. Consequently, the CFS_GPSS exhibited superior frequency regulation performance with approximate damping levels compared to PID parameter optimization. This implies that PID parameter optimization fails to simultaneously address both the improvement of damping levels and the enhancement of PFR performance.

6. Conclusions

The present study addressed the crucial issue of frequency stability in high-proportion hydro-power sending-end systems. The damping and phase characteristics of the speed control system were thoroughly analyzed while discussing the limitations of the CS_GPSS control strategy through establishing a transfer function model. Based on this analysis, a novel CFS_GPSS control strategy was proposed to mitigate ultra-low-frequency oscillation and enhance the primary frequency regulation performance in hydropower-dominated systems. The main conclusions are summarized as follows:
The robustness of the CFS_GPSS has been demonstrated under different operating conditions, including normal operations conditions at 0.04 Hz, strongly connected grids with low hydropower output conditions at 0.034 Hz, and weakly connected grids with high hydropower output conditions at 0.054 Hz. In comparison to the CS_GPSS, the CFS_GPSS exhibits superior oscillation suppression effects and effectively addresses the issue of oscillation frequency drift caused by changes in operating conditions.
The CFS_GPSS method can significantly improve the performance of PFR and effectively balance the contradiction between the rapidity and accuracy of the PFR process. Compared with the CS_GPSS method, the CFS_GPSS has faster regulation speeds and fewer oscillations. Compared with PID parameter optimization methods with similar damping levels, the CFS_GPSS can take into account both damping levels and PFR performance.
The proposed CFS_GPSS control strategy effectively addresses the issue of ULFO frequency drift in hydropower-dominated systems while simultaneously reconciling the trade-off between the speed and accuracy of PFR. The research findings presented in this paper can provide valuable theoretical guidance and technical support to system operators. With a higher penetration of renewable power units, new power systems encounter oscillations across a broader frequency range. Therefore, future research should focus on studying the joint control of GPSSs and PSSs.

Author Contributions

Y.J., subfunding acquisition, supervision, writing—review and editing; B.T., conceptualization, methodology, software, writing—original draft, writing—reviewing and editing; W.Z., software, formal analysis, and data curation; D.J. and C.Y., supervision, writing—review and editing; Y.W., formal analysis, data curation. All authors have read and agreed to the published version of the manuscript.

Funding

This work was supported in part by the Chongqing Basic Research and Frontier Exploration General Project (no. cstc2020jcyj-msxmX0349) and Youth project of science and technology research program of Chongqing Education Commission of China (no. KJQN202101118).

Data Availability Statement

The data presented in this study are available in Appendix A.

Conflicts of Interest

The authors declare that they have no known competing financial interests or personal relationships that could have appeared to influence the work reported in this paper.

Nomenclature

ULFOultra-low-frequency oscillations
PFRprimary frequency regulation
PSSpower system stabilizer
GPSSgovernor-side power system stabilizer
CS_GPSS conventional structured governor-side power system stabilizer
CFS_GPSScenter-frequency-structured governor-side power system stabilizer
PIDproportional-integral-derivative

Appendix A. The Specific Parameters of the 3-Machine, 9-Node System

Table A1. Generator parameters.
Parameters G 1 G 2 G 3 Parameters G 1 G 2 G 3
S N ( MVA ) 247.5192128 U N ( kV ) 16.51813.8
x d 0.361.720.36 x q 0.231.660.23
x d 0.150.230.15 x q --0.38--
x d " 0.10.10.1 x q " 0.10.10.1
x l 0.080.10.08 T q 0 --0.54--
T d 0 8.9668.96 T q 0 " 0.050.050.05
T d 0 " 0.050.050.05 H ( s ) 9.5546
Table A2. Load parameters.
LoadActive Power (MW)Reactive Power (Mvar)
Load 112550
Load 29030
Load 310035

References

  1. Wu, P.; Zhao, B.; Cheng, Y.; Sun, H.D. Benchmark for AC-DC Hybrid System with High Penetration of Renewables (2): Frequency Stability CSEE-FS. Proc. CSEE 2023, 1–12. Available online: http://kns.cnki.net/kcms/detail/11.2107.TM.20230901.2141.004.html (accessed on 20 October 2023).
  2. Liu, Q.; Yu, R.; Zhang, Y.D.; Liang, X.B. Practice and Prospect of Frequency Oscillation Suppression Technology in Power Grids With High Proportion of Hydropower. Power Syst. Technol. 2022, 46, 3840–3848. [Google Scholar] [CrossRef]
  3. Li, S.; Cao, Z.; Hu, K.; Chen, D. Performance Assessment for Primary Frequency Regulation of Variable-Speed Pumped Storage Plant in Isolated Power Systems. Energies 2023, 16, 1238. [Google Scholar] [CrossRef]
  4. Yue, L.; Xue, A.; Li, Z.Q.; Meng, H.M.; Yan, J.F.; Li, B.Q.; Bi, T.S.; Yang, Q.X. Effects on Extra-Low Frequency Oscillation Caused by Hydro Generator Governor System and Model Suitability Analysis. Proc. CSEE 2019, 39, 227–235+337. [Google Scholar] [CrossRef]
  5. Sun, L.; Zhao, X. Modelling and Analysis of Frequency-Responsive Wind Turbine Involved in Power System Ultra-Low Frequency Oscillation. IEEE Trans. Sustain. Energy 2022, 13, 844–855. [Google Scholar] [CrossRef]
  6. Wang, P.; Li, B.; Zhao, J.; Liu, T.; Jiang, Q.; Chen, G. The Mechanism of Ultra-Low Frequency Oscillations With the Same Mode Shapes. IEEE Access 2020, 8, 198047–198057. [Google Scholar] [CrossRef]
  7. Xue, Y.; Bin, Z. Analysis of Mode Interaction in Ultra-low Frequency Oscillation Based on Trajectory Eigenvalue. J. Mod. Power Syst. Clean Energy 2020, 8, 1208–1220. [Google Scholar] [CrossRef]
  8. Pico, H.V.; McCalley, J.D.; Angel, A.; Leon, R.; Castrillon, N.J. Analysis of Very Low Frequency Oscillations in Hydro-Dominant Power Systems Using Multi-Unit Modeling. IEEE Trans. Power Syst. 2012, 27, 1906–1915. [Google Scholar] [CrossRef]
  9. Liu, B.; Tang, F.; Yu, R.; Liu, F.S.; Zhang, Y.D. Frequency Stability Coordination Control Technology and Practice of a Multi-DC outgoing Power Grid with a High Proportion of Hydropower. Power Syst. Prot. Control 2021, 49, 181–187. [Google Scholar] [CrossRef]
  10. Wang, X.; Zhang, Y.; Wang, G.H.; Yu, R.; Zhang, J.; Sun, H.; Luo, X.; Chu, X.J.; Zhang, S.Y.; Peng, L. Research on Ultra-Low Frequency Oscillation Risk and Influencing Factors of High-Ratio Hydroelectric Transmission System. Power Syst. Technol. 2019, 43, 206–212. [Google Scholar] [CrossRef]
  11. Mehigan, L.; Al Kez, D.; Collins, S.; Foley, A.; Ó’gallachóir, B.; Deane, P. Renewables in The European Power System and The Impact on System Rotational Inertia. Energy 2020, 203, 117776. [Google Scholar] [CrossRef]
  12. Tielens, P.; Van Hertem, D. The relevance of inertia in power systems. Renew. Sustain. Energy Rev. 2016, 55, 999–1009. [Google Scholar] [CrossRef]
  13. Cai, W.J. Technical Study on Improvement of Generator-Grid Coordination Capability of Turbine Governor. Mech. Electr. Technol. Hydropower Stn. 2019, 42, 59–62+97. [Google Scholar] [CrossRef]
  14. Chen, G.; Tang, F.; Shi, H.; Yu, R.; Wang, G.; Ding, L.; Liu, B.; Lu, X. Optimization Strategy of Hydrogovernors for Eliminating Ultralow-Frequency Oscillations in Hydrodominant Power Systems. IEEE J. Emerg. Sel. Top. Power Electron. 2018, 6, 1086–1094. [Google Scholar] [CrossRef]
  15. Xiao, C.; Wang, D.L.; Li, Z.P.; Li, Z.; Zhou, X.; Kang, J.T. Research on Parameter Optimization Control of Turbine Governor for Suppressing Ultra-low Frequency Oscillation in Power Systems. Power Syst. Technol. 2020, 44, 2135–2142. [Google Scholar] [CrossRef]
  16. Su, Y.P.; Liu, T.Q.; Li, B.H.; Jiang, Q.; Han, X.Y.; Chen, G. Mechanism Analysis of Ultra-low Frequency Oscillation and Parameter Optimization of Hydro Turbine Governor. Power Syst. Technol. 2020, 44, 1008–1016. [Google Scholar] [CrossRef]
  17. Deng, W.; Wang, D.L.; Wei, M.X.; Zhou, X.; Wu, S.J.; He, P.; Kang, J.T. Influencing Mechanism Study on Turbine Governor Parameters Upon Ultra-low Frequency Oscillation of Power System. Power Syst. Technol. 2019, 43, 1371–1377. [Google Scholar] [CrossRef]
  18. Zhang, G.; Zhao, J.; Hu, W.; Cao, D.; Duan, N.; Chen, Z.; Blaabjerg, F. Deep Reinforcement Learning Enabled Bi-Level Robust Parameter Optimization of Hydropower-Dominated Systems for Damping Ultra-Low Frequency Oscillation. J. Mod. Power Syst. Clean Energy 2023, 11, 1770–1783. [Google Scholar] [CrossRef]
  19. Shi, H.B.; Chen, G.; Ding, L.J.; Han, X.Y.; Zhang, Y.D.; Chen, Z.; Zhang, H.; Liu, C. PID Parameter Optimization of Hydro Turbine Governor Considering the Primary Frequency Regulation Performance and Ultra-Low Frequency Oscillation Suppression. Power Syst. Technol. 2019, 43, 221–226. [Google Scholar] [CrossRef]
  20. Dong, W.; Cao, Z.; Zhao, P.; Yang, Z.; Yuan, Y.; Zhao, Z.; Chen, D.; Wu, Y.; Xu, B.; Venkateshkumar, M. A Segmented Optimal PID Method to Consider both Regulation Performance and Damping Characteristic of Hydroelectric Power System. Renew. Energy 2023, 27, 1–12. [Google Scholar] [CrossRef]
  21. Shi, X.; Ruan, G.; Lu, H.; Chen, H.; Cai, W.; Ron, H.; Chen, G.; Zhao, Y. Analysis of Ultra-Low Frequency Oscillation in Hydro-Dominant Power System and Suppression Strategy by GPSS. IEEE Trans. Ind. Appl. 2023, 59, 2796–2806. [Google Scholar] [CrossRef]
  22. Liu, S.B.; Wang, D.L.; Ma, N.N.; Deng, W.; Zhou, X.; Wu, S.J.; He, P. Study on Characteristics and Suppressing Countermeasures of Ultra-low Frequency Oscillation Caused by Hydropower Units. Proc. CSEE 2019, 39, 5354–5362+5582. [Google Scholar] [CrossRef]
  23. Zhang, J.X.; Chen, C.; Zhou, J.; Xu, G.F.; Mei, Y.; Liu, W.; Dai, Z.F.; Cai, D.Y.; Zhou, Y.H.; Hong, C. Suppression of Very Low Frequency Oscillation in Asynchronous Yunnan Grid Based on Hydroelectric Governor Additional Damping Control. South. Power Syst. Technol. 2018, 12, 38–43+51. [Google Scholar] [CrossRef]
  24. Wang, G.H.; Tang, Y.; Li, Y.; Ai, D.P.; Chen, G.; Wei, W. Control Method for Additional Damper in Hydro-turbine Speed Governor of Hydro-dominant Power Systems. CSEE J. Power Energy Syst. 2023, 9, 589–598. [Google Scholar] [CrossRef]
  25. Zhang, J.X.; Shi, X.L.; Chen, G.; Zhou, J.; Cai, D.Y.; Cai, W.J.; Jiang, C.Y.; Zhao, Y. Simulation Test on Additional Damping Control of Hydropower Unit Governor. South. Power Syst. Technol. 2019, 13, 24–28. [Google Scholar] [CrossRef]
  26. Satapathy, S.; Nahak, N.; Sharma, R.; Samal, J. A Coordinated Hydro Turbine Governor with Fractional STATCOM for Critical Power Oscillation Damping. In Proceedings of the IEEE Drives and Energy Systems, Jaipur, India, 14–17 December 2022; pp. 1–5. [Google Scholar] [CrossRef]
  27. Chen, J.; Zheng, Y.; Liu, D.; Du, Y.; Xiao, Z. Quantitative Stability Analysis of Complex Nonlinear Hydraulic Turbine Regulation System Based on Accurate Calculation. Appl. Energy 2023, 351, 121853. [Google Scholar] [CrossRef]
  28. Wang, P.; Jiang, Q.; Li, B.; Liu, T.; Li, X.; Chen, G.; Zeng, X.; Blaabjerg, F. Ultra-low Frequency Oscillation Analysis Considering Thermal-Hydro Power Proportion. Int. J. Electr. Power Energy Syst. 2023, 148, 108919. [Google Scholar] [CrossRef]
Figure 1. Block diagram of a hydropower system model. In the diagram, y r e f represents the reference value for the turbine opening. Δ y p i d represents the corresponding variation in the guide vane opening, which is usually zero under stable operating conditions. Δ y represents the guide vane opening of the hydraulic system. Δ P m represents the mechanical power output by the turbine and s is the differential operator.
Energies 17 01067 g001
Figure 2. The influence of Tw, KP, and KI on the damping torque coefficient of the system: (a) varying Tw; (b) varying KP; (c) varying KI.
Energies 17 01067 g002aEnergies 17 01067 g002b
Figure 3. Phase-frequency characteristics versus damping torque coefficient.
Energies 17 01067 g003
Figure 4. Schematic diagram of phase compensation, where Δ T m represents the mechanical torque output, φgov represents the initial phase angle difference, Δ T c represents GPSS output torque, φadc represents the phase angle compensated by GPSS, Δ T c represents the equivalent torque by GPSS, Δ T m represents the mechanical torque output after compensation, and φ g o v represents the phase angle difference after compensation.
Energies 17 01067 g004
Figure 5. Structure of the speed regulation system with GPSS.
Energies 17 01067 g005
Figure 6. Structure diagram of CFS_GPSS, where KL11 and KL22 are the transfer function constants of the central filter link and T1, T2, T9, and T10 are the time constants of the filter link. T3, T4, T5, T6, T7, T8, T11, T12, T13, T14, T15, and T16 are the lead-lag time constants and KL is the gain of the additional damping controller. KL11 and KL22 have the same value, usually 0 or 1. When K L 11 = K L 22 = 0 , the central filter link only acts on filtering; otherwise, the central filter link can both filter and compensate a certain phase.
Energies 17 01067 g006
Figure 7. Dynamic performance comparison of CS_GPSS and CFS_GPSS.
Energies 17 01067 g007
Figure 8. PFR performance of CS_GPSS, CFS_GPSS, and without GPSS.
Energies 17 01067 g008
Figure 9. Structure of 3-machine, 9-bus system.
Energies 17 01067 g009
Figure 10. Frequency response curves of the three generators.
Energies 17 01067 g010
Figure 11. Frequency response of G1 under different control strategies for operating condition 1.
Energies 17 01067 g011
Figure 12. Frequency response of G1 under different control strategies: (a) operating condition 2; (b) operating condition 3.
Energies 17 01067 g012
Figure 13. Power response of G1 under different control strategies for operating condition 1.
Energies 17 01067 g013
Figure 14. Power response of G1 under different control strategies: (a) operating condition 2; (b) operating condition 3.
Energies 17 01067 g014
Figure 15. Suppress effects of PID, CFS_GPSS, and without GPSS.
Energies 17 01067 g015
Figure 16. Power response of G1 of PID, CFS_GPSS, and without GPSS.
Energies 17 01067 g016
Table 1. Main dynamic parameters of the speed regulation system.
ParametersbpKDTDKP1KI1KD1TTo
Value0.04006000.1255
Table 2. Parameter settings for three operating conditions.
Operating Condition 1Operating Condition 2Operating Condition 3
ParametersValueParametersValueParametersValue
G 1 _ S N ( M V A ) 247.5 G 1 _ S N ( M V A ) 220 G 1 _ S N ( M V A ) 270
G 3 _ S N ( M V A ) 128 G 3 _ S N ( M V A ) 115 G 3 _ S N ( M V A ) 140
Line 4–55.3 + j45.0Line 4–52.7 + j22.5Line 4–510.6 + j89.9
Line 4–69.0 + j48.7Line 4–64.5 + j24.3Line 4–618.0 + j97.3
Line 6–920.6 + j89.9Line 6–910.3 + j45.0Line 6–941.3 + j179.9
Line 8–96.3 + j53.3Line 8–93.2 + j26.7Line 8–912.6 + j106.7
Table 3. Dynamic parameters of the additional damping controller.
ParametersValueParametersValue
K L 30 T 9 3.63
T 1 3.025 T 10 4.356
T 2 3.63 T 11 3.7
T 3 3.7 T 12 0.98
T 4 0.98 T 13 3.7
T 5 3.7 T 14 0.98
T 6 0.98 T 15 3.7
T 7 3.7 T 16 0.98
T 8 0.98
Table 4. Comparison of load disturbance responses.
Control StrategiesNumber of Oscillations
(Cycle)
Steady Time
(s)
Amplitude of Oscillation
(Hz)
Upper LimitLower Limit
No GPSS>15>10050.0749.95
CS_GPSS25250.0549.98
CFS_GPSS1.54150.0549.99
Table 5. Comparison of frequency step responses.
Control StrategiesNumber of Oscillations
(Cycle)
Delay Time
(s)
Rise Time
(s)
Settling Time
(s)
No GPSS4.510.8340102
CS_GPSS11164125
CFS_GPSS110.834092
Table 6. Frequency step response comparison.
Control StrategiesNumber of Oscillations
(Cycle)
Delay Time
(s)
Rise Time
(s)
Settling Time
(s)
No GPSS4.510.8340102
PID110.8399126
CFS_GPSS110.834092
Disclaimer/Publisher’s Note: The statements, opinions and data contained in all publications are solely those of the individual author(s) and contributor(s) and not of MDPI and/or the editor(s). MDPI and/or the editor(s) disclaim responsibility for any injury to people or property resulting from any ideas, methods, instructions or products referred to in the content.

