1. Introduction
Lithuania’s goal to reach 45% electricity production from renewable energy resources by 2030 is recognized as one of the most ambitious throughout the EU. The renewable energy sector in Lithuania includes biomass, biogas, waste-to-energy, hydro, wind, and solar power, and only a small percentage of heat is produced by shallow geothermal heat pumps. Geothermal energy has the capability to provide a sustainable, equitable, and secure energy supply, and its associated technologies are low carbon, clean, and do not suffer from the intermittency issues experienced by other renewable energy sources such as wind and solar. The average annual temperature in Lithuania varies between 5 °C and 9 °C, resulting in the need for heating in residences from October to April. Total energy consumption in Lithuania was 223,499 TJ in 2020, 26% of which was used in the heating and cooling sector (data from Lithuanian Statistics department). Out of this 26%, the heat provided by the centralized district heating system accounts for about 42% (8574.8 GWh). Natural gas (27.3%) and biofuel (70.3%) remain the dominant types of fuel in heat production, and no geothermal energy plant contributes towards heat production in Lithuania.
Geothermal investigation in Lithuania started in the early 1990’s with the first geothermal well, Vydmantai-1, drilled in 1989 [
1]. Subsequently, the Baltic geothermal project was initiated in 1992, which led to the drilling of a number of other wells for geothermal exploration. Geothermal exploration led to the development of the Klaipėda Geothermal Demonstration Plant, Geoterma, which was the first geothermal heating plant in the Baltic Sea region [
2,
3,
4,
5,
6,
7]. The Geoterma plant made use of the 38 °C water from a Devonian sandstone aquifer located at depth of 1135 m [
2,
3,
4,
5,
6,
7]. Over time, the Geoterma project experienced operational and financial difficulties because of decreasing production rates and challenges related to water injection issues and not being able to compete with the cheap energy produced at the nearby and newly-opened incineration plant, resulting in its bankruptcy and eventual closure in 2007 [
8,
9,
10].
Ever since the closure of the Geoterma plant, investment in deep geothermal exploration have stopped in Lithuania. Although deep geothermal energy remains one of the most reliable sources of energy to fulfill long term energy needs, the government’s current plans for renewable heating and energy expansion do not include any projects on deep geothermal resources as one of the options. Nonetheless, geothermal energy has the potential to play an important role in the decarbonization of energy supply in Lithuania. The development of a geothermal site in Lithuania offers a dual advantage, encompassing environmental sustainability and economic prosperity. By tapping into the Earth’s natural heat reservoirs, the initiative ensures a reliable and renewable energy source, significantly reducing carbon emissions and enhancing air quality. Importantly, it diminishes reliance on foreign fossil fuels, translating into economic savings and bolstering energy resilience. The project’s economic merits encompass job creation, stable energy costs, and a platform for technological advancements. Diversification of the energy mix adds a layer of security against potential supply disruptions, while the promotion of geothermal tourism contributes to local economies. Despite the high initial investments, the long-term cost-effectiveness and the positive transformation of Lithuania’s energy landscape underscore the strategic significance of geothermal development.
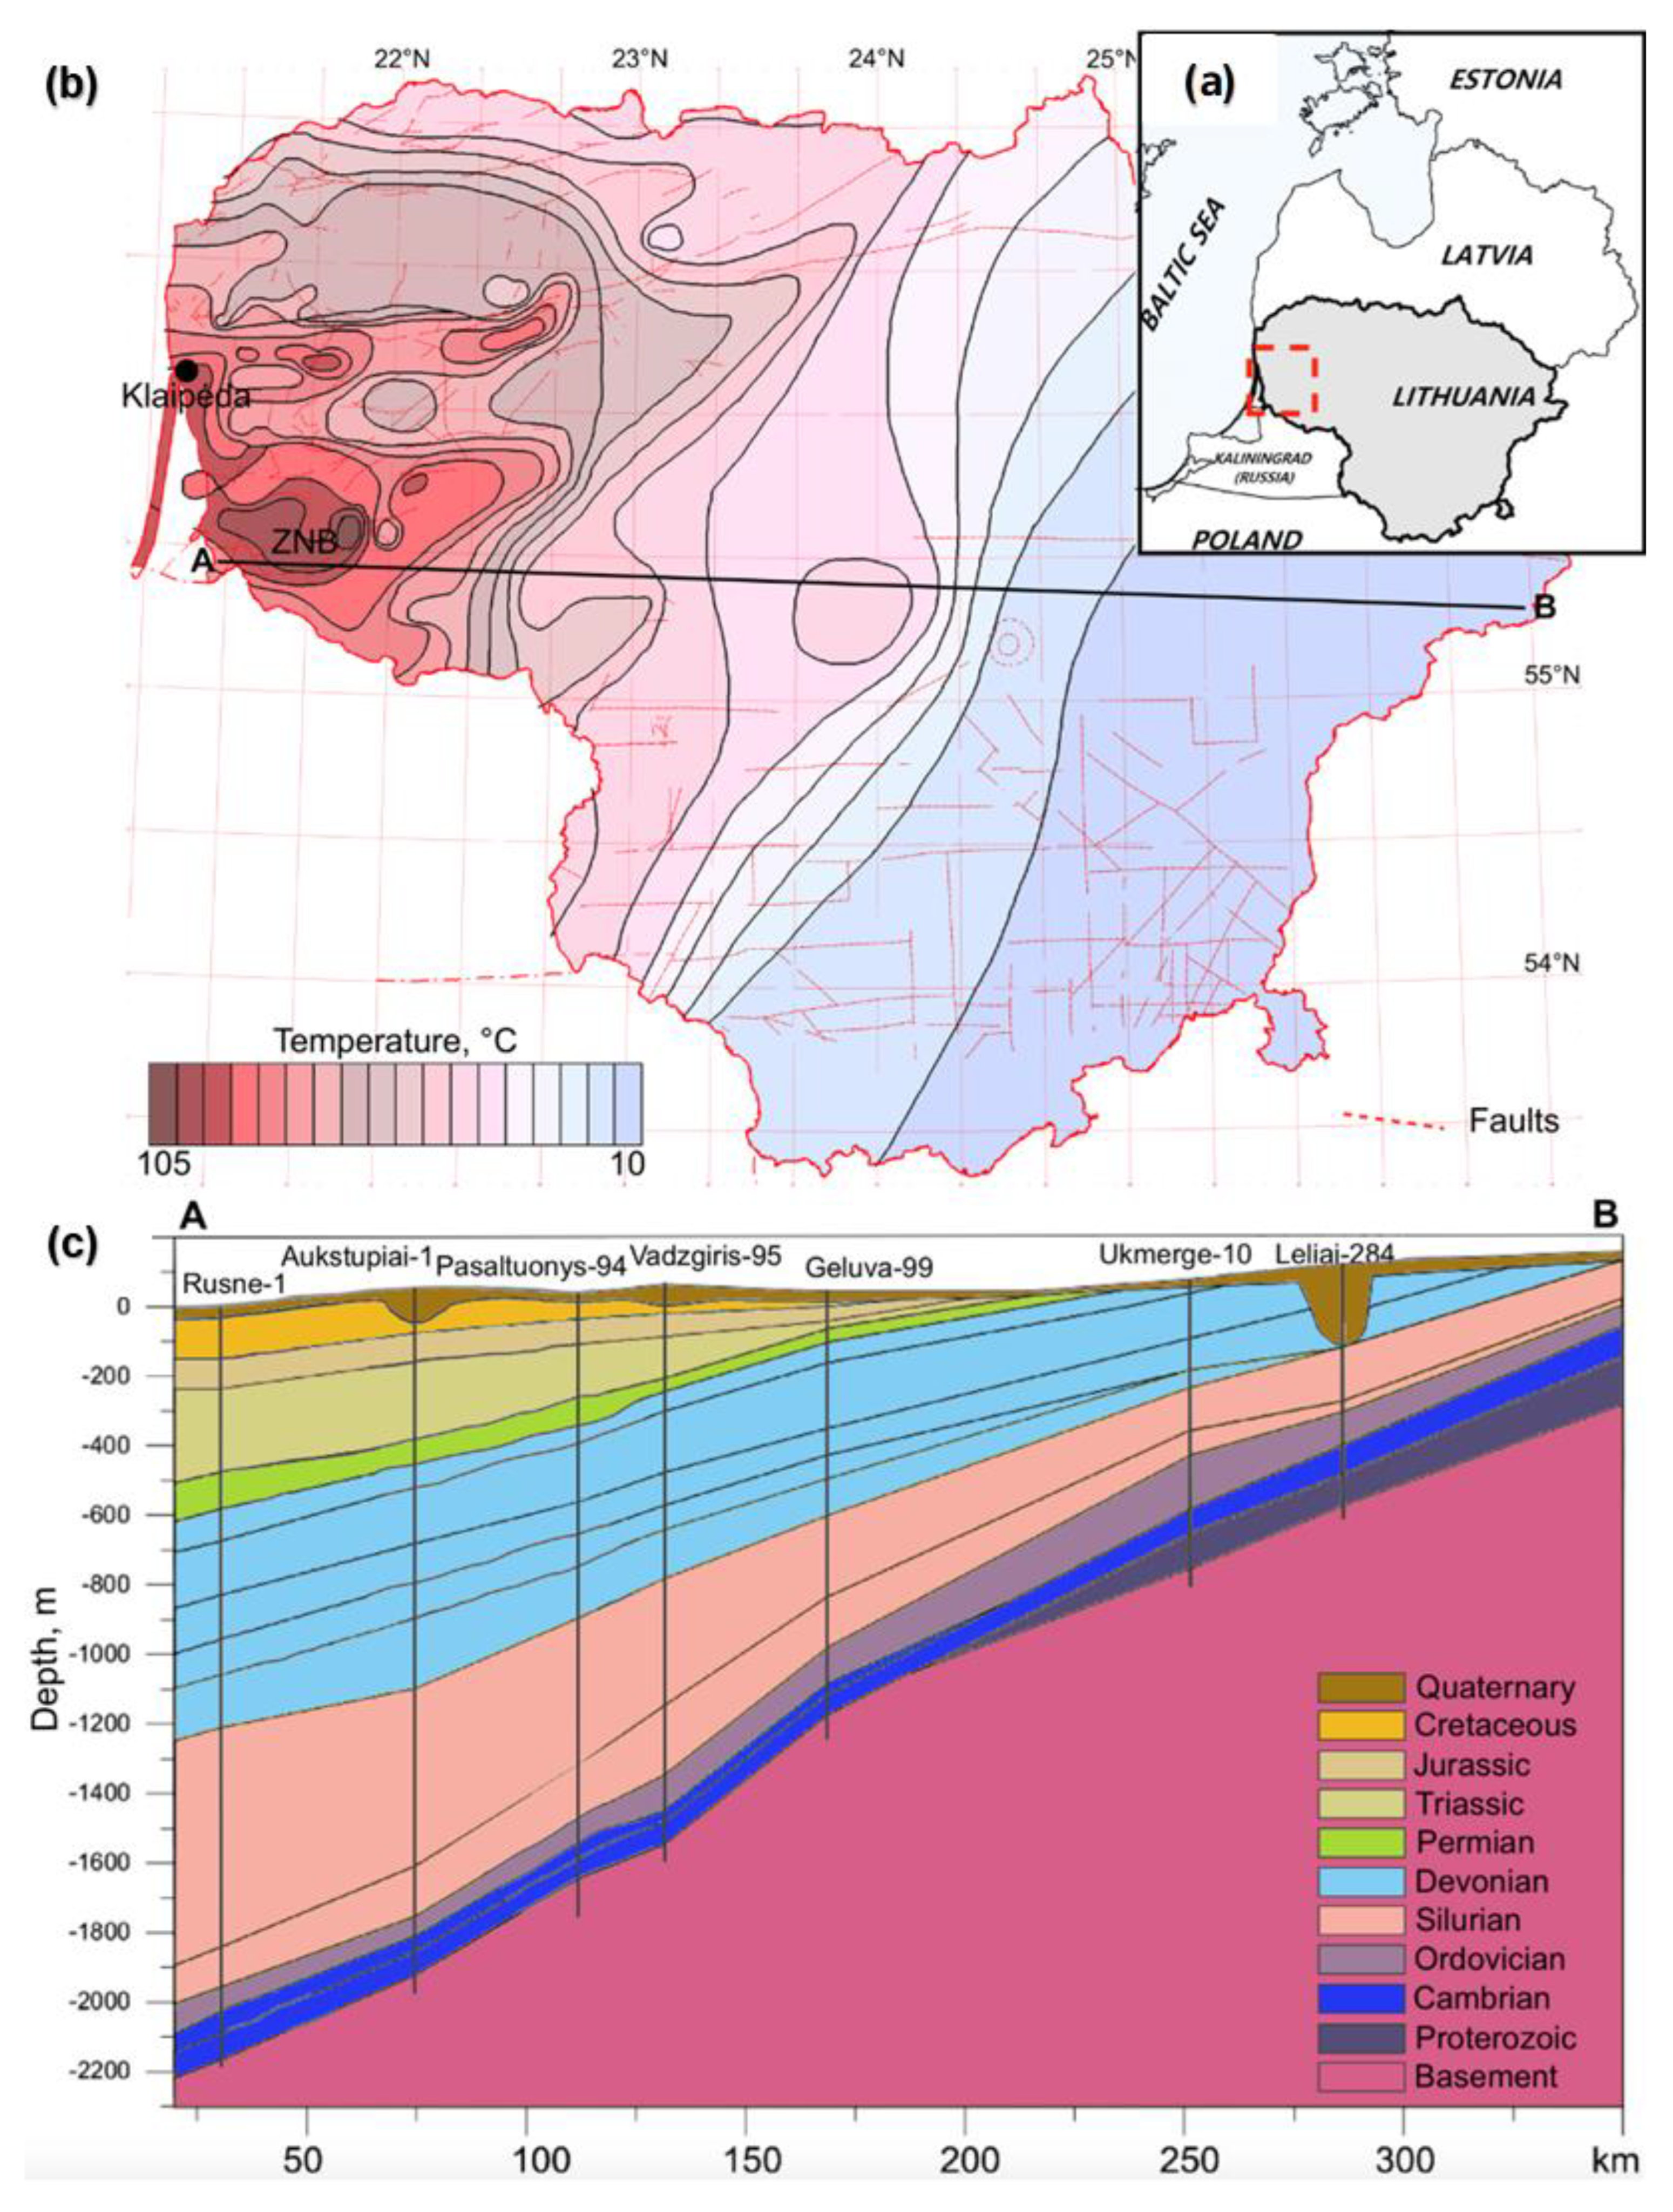
Lithuania has a geothermal anomaly, despite its location in the stable thick East European Craton of the Early Precambrian consolidation [
11]. The anomaly is situated in the southwest of the country, and is related to Middle Proterozoic cratonic granitoid intrusions that are rich in radiogenic heat-producing elements [
12,
13,
14,
15]. These intrusions mainly consist of massive biotite and monzogranites, along with a minority of biotite syenogranites and porphyric quartz monzodiorites. In general, all of the granitoids are dominantly alkali-calcic and shoshonitic. Enrichment in incompatible elements, particularly K, REE, U, and Th is remarkable. The intrusions are located at depths greater than 2 km, right below the Cambrian formation. The largest anomaly in the southwestern part of Lithuania is related to the largest Zemaiciu Naumiestis Batholith (ZNB), which is as large as 30 × 45 × 4 km (
Figure 1a). Intrusions of a similar composition were found along the whole southern coast of Lithuania. The thickest sedimentary cover overlaps with the increased geothermal gradient in the country, providing potentially prolific zones for geothermal energy utilization (
Figure 1). The increased heat flow is also influenced by the thermal insulation of those sedimentary rocks [
11,
14,
15]. The geothermal gradient in this area reaches up to 45 °C/km [
11,
14,
15].
The two main hydrothermal complexes that exist in western Lithuania are the sandstones of the Cambrian (80 m) and Lower Devonian (180 m) ages. The Kemeri Formation (Lower-Devonian) sandstones show the best flow properties (porosity averages 26%, permeability 2000–4000 mD) but reservoir temperatures reach only up to 45 °C; whereas the Cambrian sandstones have the highest reservoir temperatures (ranging from 14 to 96 °C). Cambrian sandstones show west-to-east regional scale variations in porosity (3 to 24%) and permeability (5–200 mD in West Lithuania to about 600–900 mD in Middle Lithuania) [
11,
14,
15].
One of the principal challenges of geothermal power projects is the cost of drilling and completion, which can account for 30–40% of the total project cost [
16]. The repurposing of abandoned oil and gas wells has been proposed as a possible source of renewable power that benefits from the pre-existing knowledge of the reservoirs and fluids in the subsurface by oil and gas exploration [
17]. Cambrian sandstones are the primary target for oil exploration in West Lithuania. Cambrian sandstones have thus been studied in detail by extensive deep drilling accompanied by logging, hydrogeological testing, 2D and 3D seismic surveys for oil field exploration, and planning for natural gas and CO
2 storage [
18,
19,
20,
21]. There are a large number of hydrocarbon reservoirs, either depleted or with hydrocarbon production coming to an end [
22,
23], see
Figure 2. These hydrocarbon reservoirs present a unique opportunity and a possibility to re-purpose them for geothermal energy production with small incremental cost [
17,
24]. With this idea in mind, we have selected the Cambrian sandstone formation as the target of the screening study.
The objectives of this study are many fold. First, it entails conducting a geological screening of various geothermal sites within the existing and depleted Cambrian hydrocarbon reservoirs. Such a study has not been conducted before to best of the authors knowledge. Subsequently, numerical modeling will be employed to evaluate the geothermal potential of some of the selected sites for potential commercial development. Ultimately, the study aims to create a techno-economic model for the top five screened sites.
The geological screening process involves an in-depth analysis of the petrophysical characteristics of the chosen reservoirs. Additionally, static and dynamic parameters such as well placement, reservoir pressure, and temperature ranges are assessed to identify the most promising sites. Once the initial sites are identified, further comprehensive modeling is undertaken, utilizing advanced multiphysics numerical models for each site that successfully passes the geological screening. These multiphysics modeling techniques are designed to simulate the evolution of transport properties in coupled thermo-hydro processes. To accomplish this, a series of high-resolution 3D reservoir box/mechanistic models are constructed using real data sourced from the existing Cambrian hydrocarbon reservoirs in Lithuania. Simulations are performed using the industry standard software, T-navigator 21.3 the using geothermal modelling option [
25].
The culmination of the screening process will yield a list of the five most promising geothermal sites. These sites will then be used to conduct a detailed analysis involving uncertainty modeling of both dynamic and static parameters. A probabilistic forecasting approach will then be used to estimate the geothermal energy production potential of the top five selected sites. This study aims to serve as a benchmark for evaluating the sustainable geothermal energy potential of similar reservoirs in Lithuania, Latvia, Kaliningrad, and Poland.
The paper is organized as follows: we first introduce the geological background under which the study is carried out. A high level summary of geothermal site screening methodology is then introduced. Next, we provide an introduction to the modelling methodology and workflow for the construction of the box/mechanistic models for detailed evaluation of the geothermal sites, including criteria for selecting distance between the doublet pairs for geothermal modelling. Next, the concept of Tornado and Pareto analysis is introduced for carrying out the uncertainty analysis, which is then applied to the selected sites. Finally, the outcome of the modelling approach used is shown through the results for one of the screened sites in the Cambrian reservoir, where injection/production rates and borehole temperature ranges are shown with time and for high mid and low cases, which are then used as criteria for ultimate site selection for geothermal development.
2. Geological and Structural Background
The Cambrian formation is the most widely spread geological unit in the Baltic region. It is found in Lithuania, Latvia, Estonia, Belarus, the Kaliningrad region, Poland, and the Baltic Sea. Cambrian sandstone succession is also the most prospective part of the sedimentary sequence for petroleum exploration in the region. The formation consists of shallow sea shelf deposits of sandstones, siltstones, and argillites. In Lithuania, the top of the Cambrian occurs at a depth range of 300–500 m in the eastern part to 2200–2300 m in the western part of the country and the Lithuanian offshore sector (
Figure 1b). The thickness of the Cambrian formation varies from 90–100 m in Central Lithuania to 120–170 m in Western Lithuania and 170–250 m in the Baltic Sea area. The most proliferous unit within the Cambrian is the Deimena group sandstone. The Deimena Series have a thickness of 70–90 m. Mineralogically, the Deimena sandstone is considered to be a mature rock as detrital quartz makes up to 90–99% of the framework grains and, consequently, falls into the quartz arenite group. Detrital quartz grains are fine to medium in size (0.15–0.5 mm), however, occasionally coarse grains are observed [
26]. Due to deposition in the active marine environment, the original grains are well rounded. Grain sorting, however, is rather poor and generally improves in the Pajuris sandstone compared to overlying part of the Middle Cambrian succession. Besides prevailing quartz, the feldspars, clay minerals, carbonates, pyrite, apatite, and other minerals constitute a small part of the rock volume. Many of these volumetrically unimportant minerals formed during diagenesis and are present as cement. The quality of sandstones mainly depends on the amount of secondary quartz cement, which is unevenly distributed in both lateral and vertical directions. Quartz cement occurs mainly as overgrowths on detrital quartz. Low permeability is associated with poor sorting and the presence of clay minerals. Sometimes quartz cementation is suppressed due to grain-coating apatite. Minor cements include kaolin and Fe-dolomite. Porosity and permeability are very heterogeneously distributed even on a single oil field scale. Closely located wells within an oil field may have extremely different reservoir quality; one might have commercial net pay thickness while another has no potential flow units and is impermeable in the pay part of the succession [
27]. The porosity of the effective layers is in the range of 7–15%, and the permeability is in the range of 0.0004–765 mD, with an average of 45 mD.
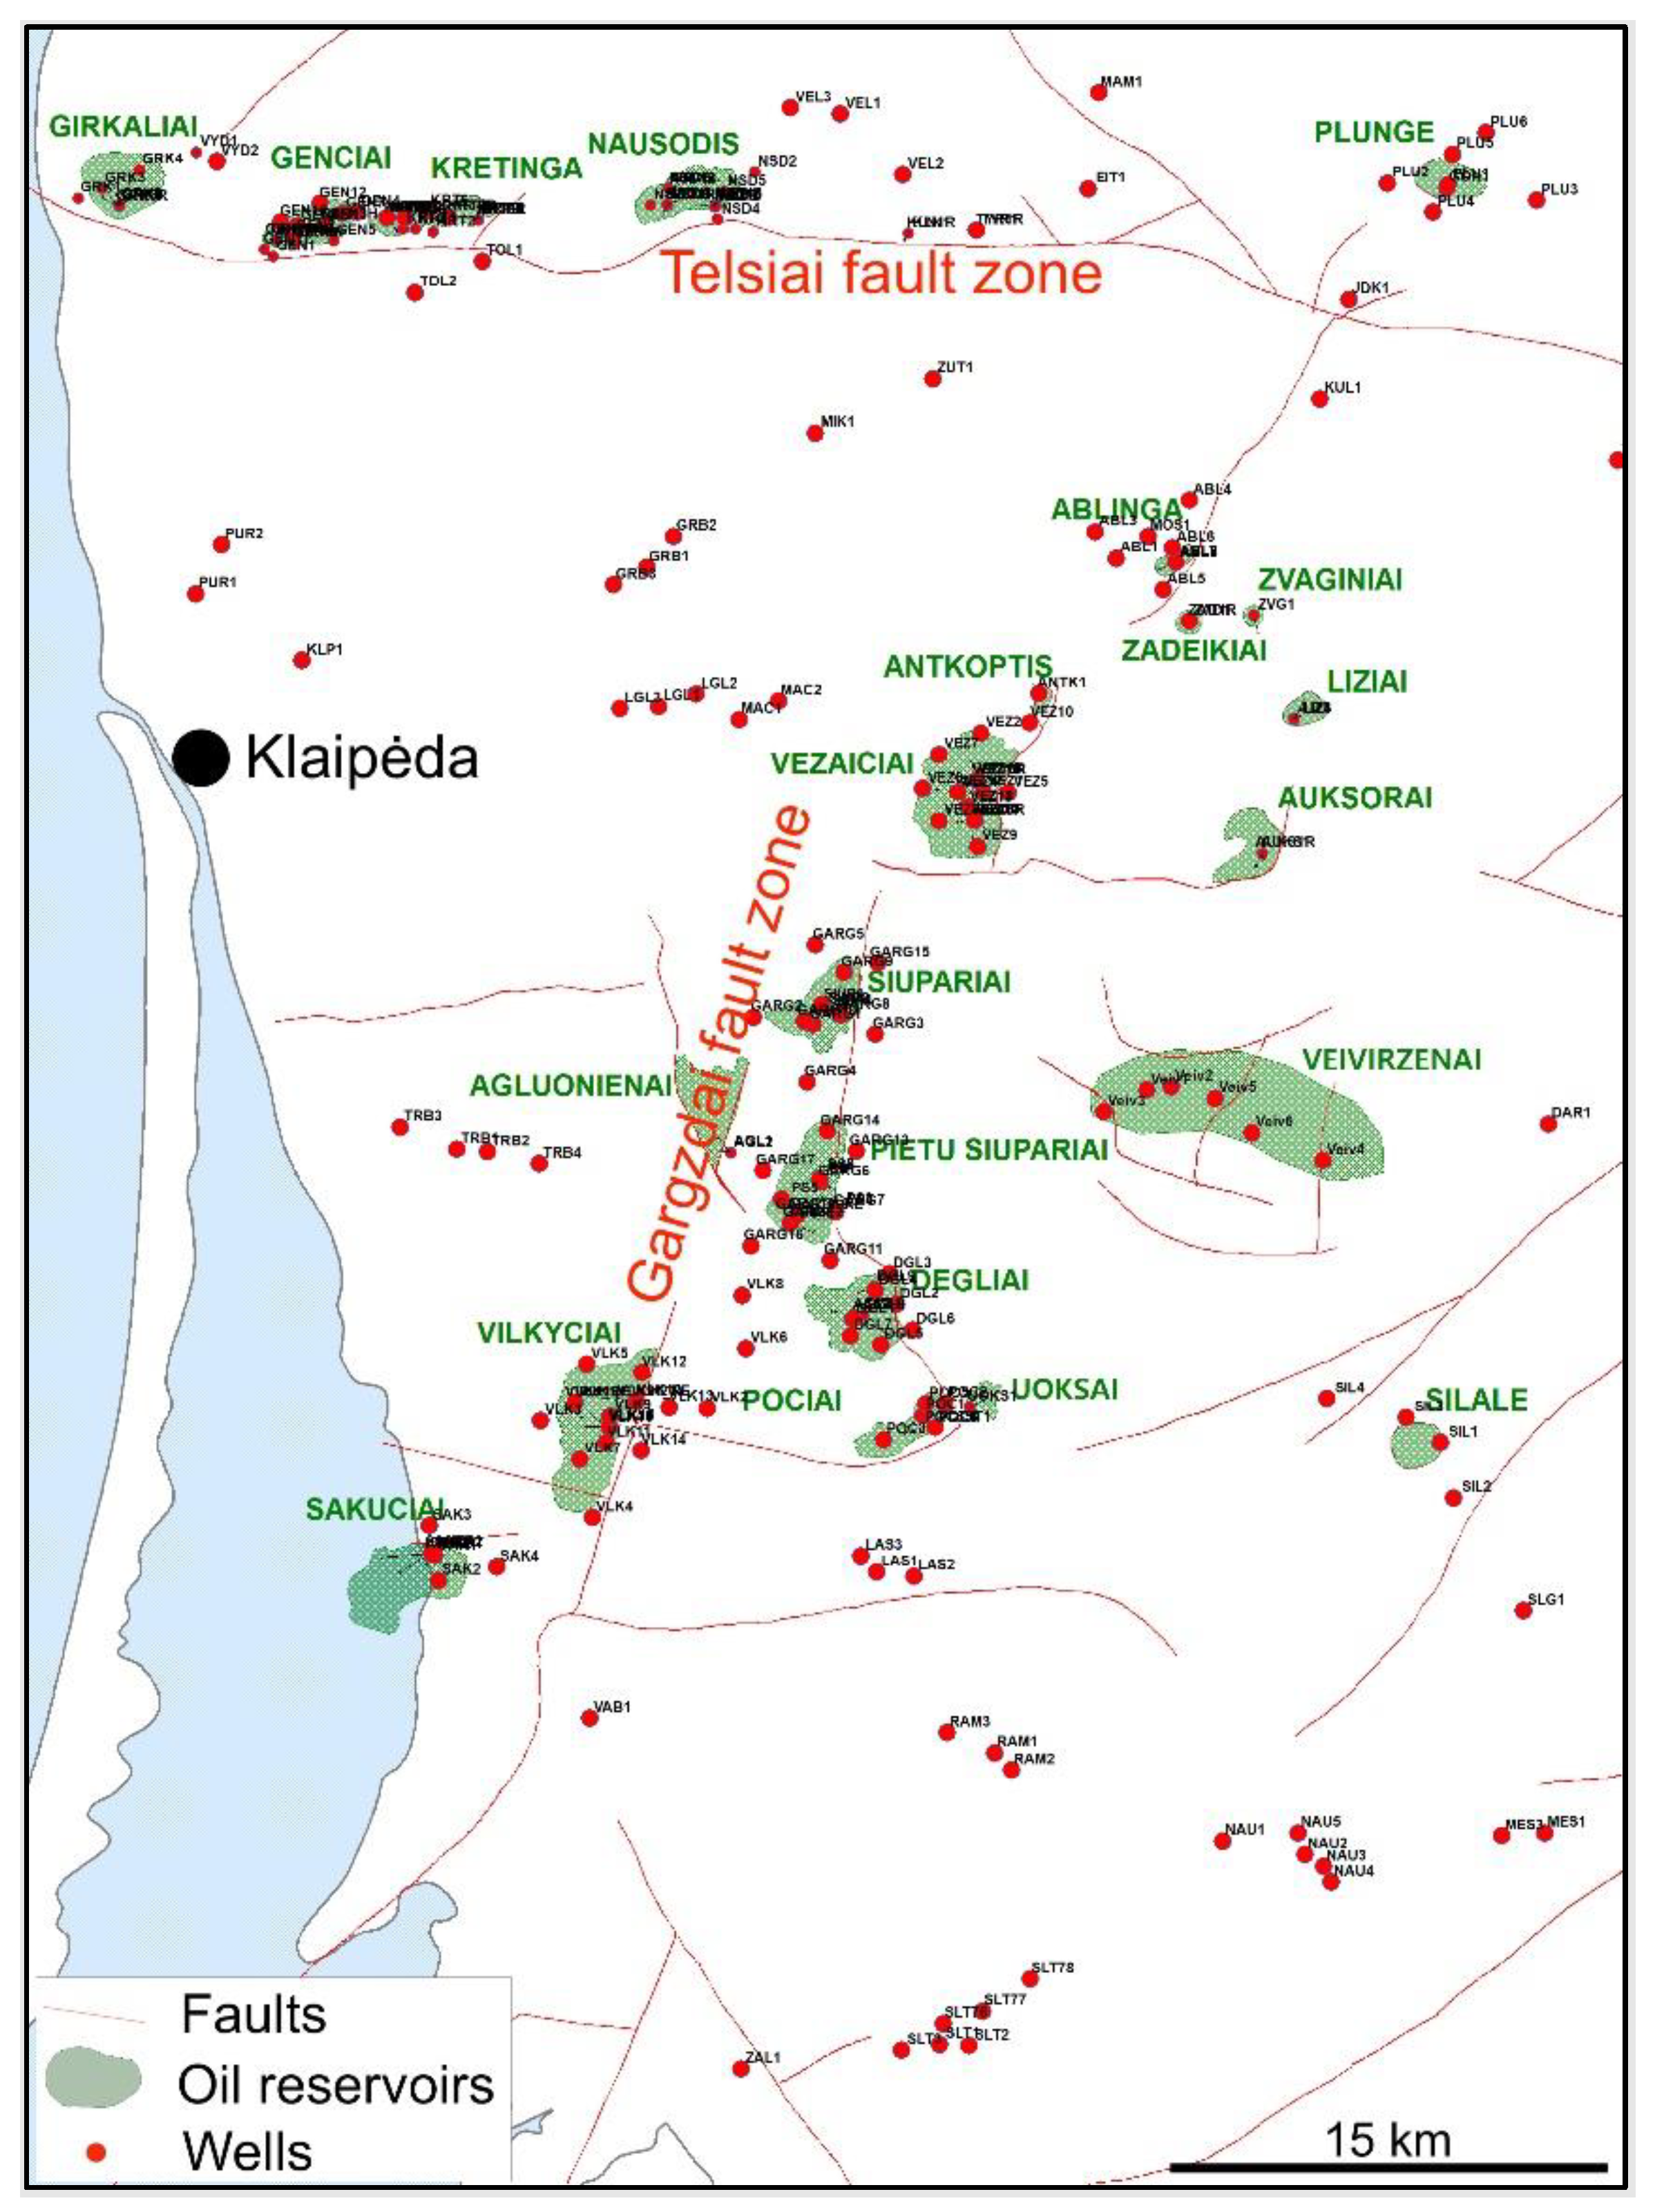
Prospective Cambrian reservoirs in Lithuania are related to local uplifts formed due to faulting. Numerous uplifts have been identified, although closures rarely exceed 65–75 m in amplitude [
28]. The reservoirs are located in the hanging walls of the E-W oriented Telsiai and NNE-SSW striking Gargzdai fault zones (
Figure 2). Traps are mostly asymmetric brachy-anticlinal domes. The Telsiai thrust fault has an amplitude of 250–300 m and a dipping angle of 65–70 degrees. The Gargzdai fault zone comprises a system of NE-SW trending compressional faults [
13]. They have a total amplitude of 300 m [
13]. The Gargzdai Elevation contains small-scale structures that are either fault-related, cross-faults, drape structures, or combined types [
12]. Due to the proximity to major fault zones, the studied reservoirs are fractured. Oil is accumulated in the upper part of the Cambrian Deimena series, located at a depth of about 1940–2100 m.
3. Screening Methodology
Initial screening was done by firstly identifying the sites with the highest amount of water extracted from the fields since the start of production (
Table 1). Water production data was collected from the reports held at the Lithuanian Geological Survey and oil companies upon request (e.g., Minijos Nafta). The presence of water production infrastructure was an important selection criterion, i.e., the higher number of wells provides a better chance of extracting more water. Therefore, a number of wells were included in the screening. The status of the wells is also important (e.g., if the well is currently open, plugged, or abandoned), with priority given to the fields that are still in operation and producing large amounts of water. That is because abandoned and plugged wells would require additional costs to re-open them for operation. The temperature of the co-produced water is another screening criterion as it determines the potential geothermal end uses of the reservoir.
The five top sites targeting the Cambrian geothermal system were identified (
Table 1). Then, the petrophysical properties of each site were mapped, including porosity, permeability, depth, average subsurface temperature, water salinity, injection water temperature, reservoir pressure, expected flow rates, reservoir thickness, and NTG (Net-to-Gross) (
Table 2). All of the property ranges listed in
Table 2 were collected from the reports prepared by oil companies and submitted to Lithuanian Geology Survey during oil exploration. The reservoir properties indicate that the sandstone reservoirs are rather heterogeneous containing at least four different effective layers of sandstones of varying properties alternating with more clayey layers in between.
In our models, we used the property ranges given in
Table 2 for building 3D mechanistic models. Details of the modelling workflow are provided in next section.
4. Mechanistic Mini-Modelling Methodology
A study using computer generated models for evaluating geothermal heat potential in Lithuania has been carried out previously for a specific site [
29]. In this paper, we used a more elaborate modelling approach, which involves the construction of mechanistic box models imitating the fundamental characteristics of the geological site through an integrated modeling approach [
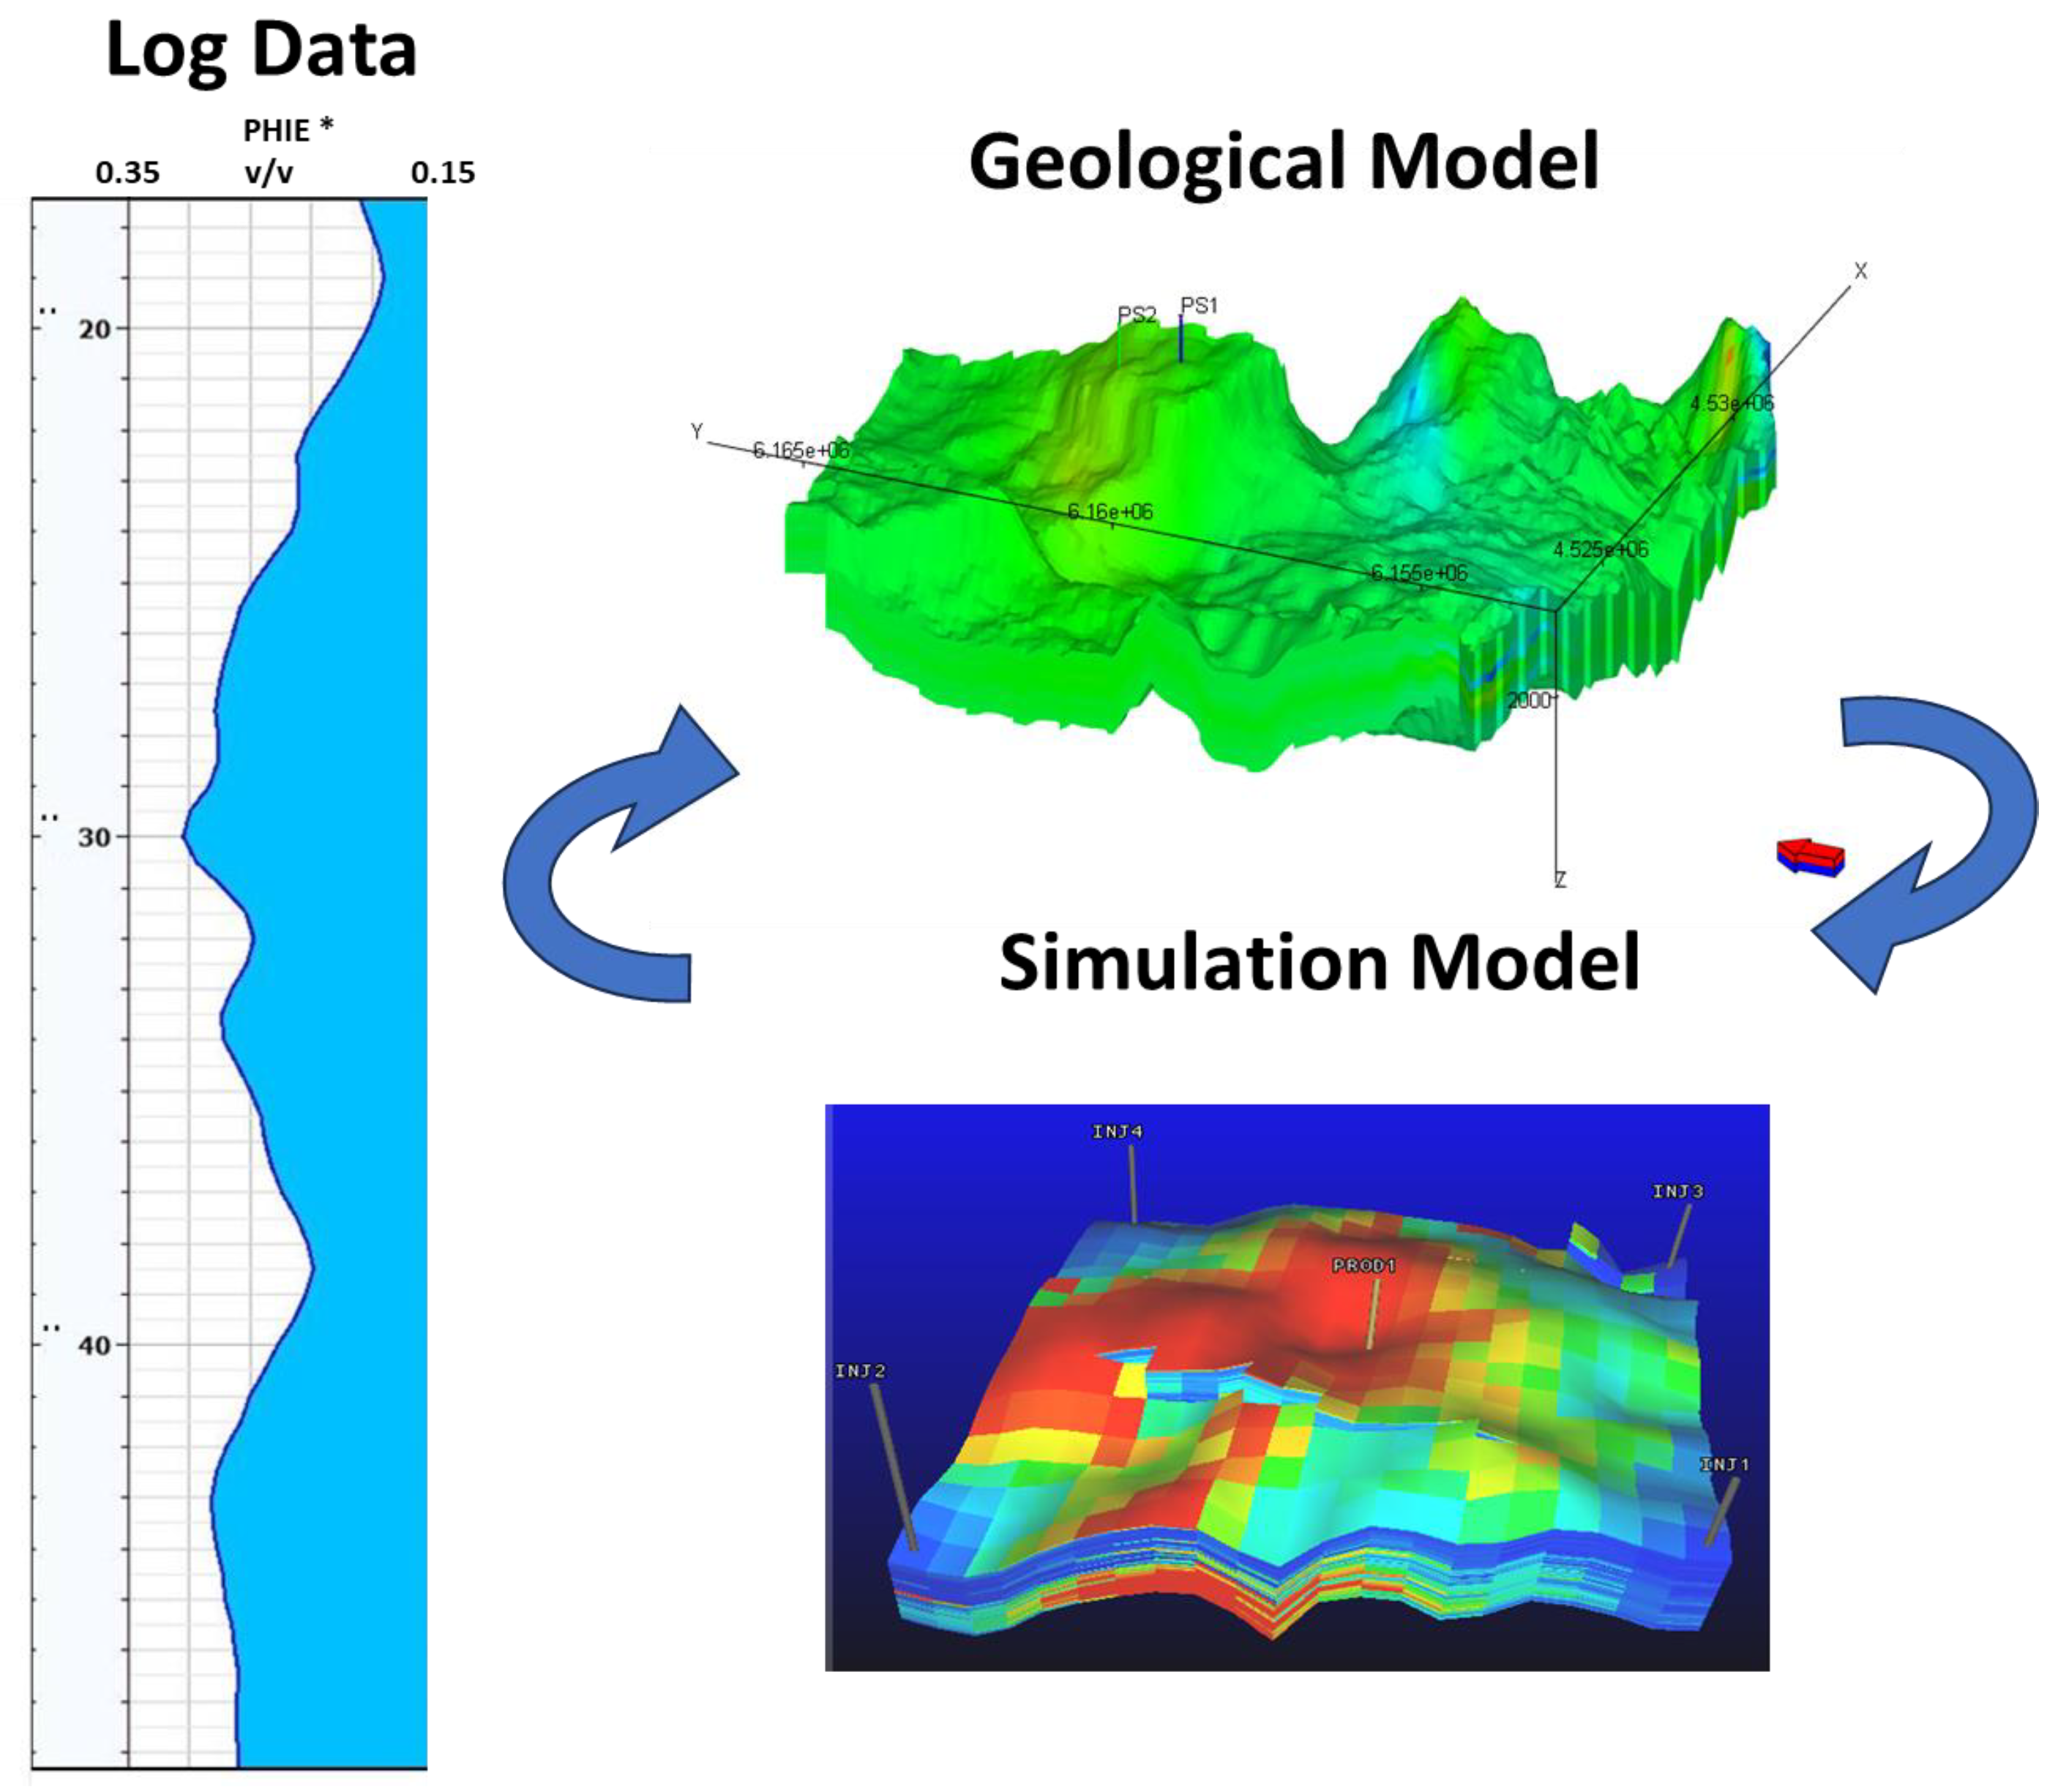
30]. These models were subsequently employed to simulate the flow of hot geothermal fluids in subsurface reservoirs. To initiate this modeling process, data was gathered from logs and core measurements, which were subsequently integrated into a simulation model, wherein dynamic properties were assigned to conduct thermal flow physics simulations.
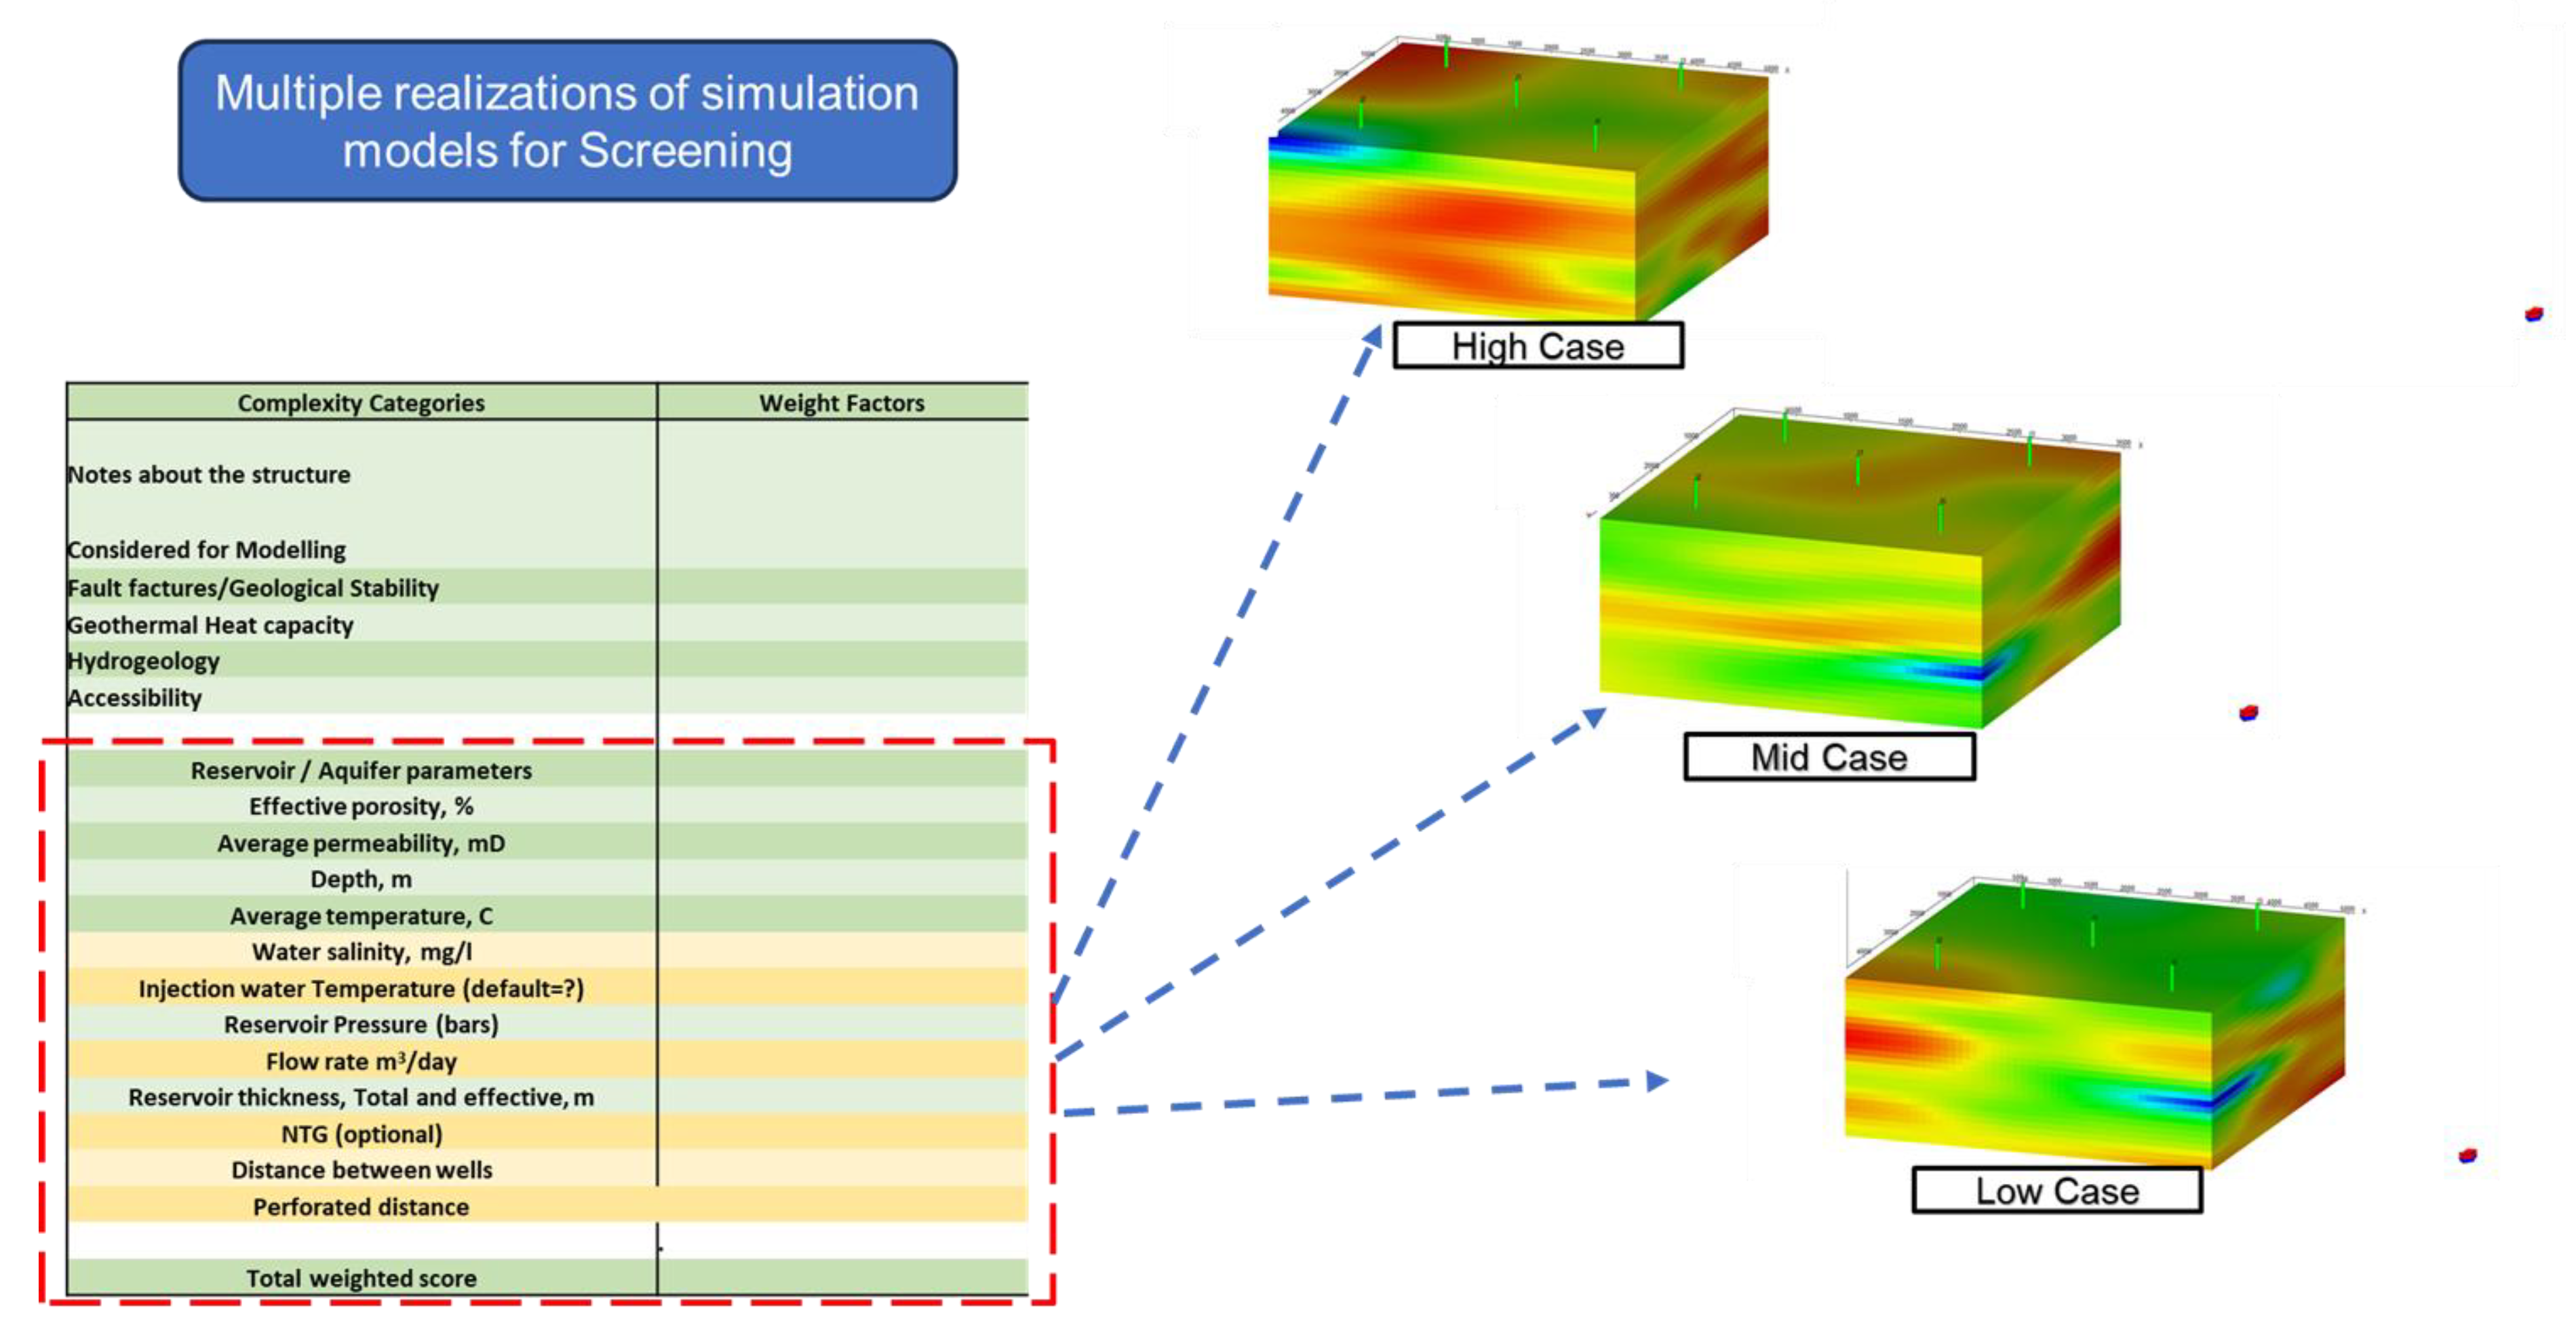
Figure 3 illustrates a typical integrated modelling workflow utilized in building 3D geological models. We used a similar approach in this paper, where geological data is integrated to developed 3D mechanistic models, which are then used in simulation. Also, a conceptual plot illustrating the construction of mechanistic box models is shown in
Figure 4.
The 3D mechanistic models are built using integrated modelling workflow using the reservoir parameters given in
Table 2. First, a 3D static model corresponding to the depth of the reservoir was built matching the reservoir thickness. The model was then populated with reservoir properties such as permeability, porosity, NTG, etc. Due to the limitation of integrating log data with a static model, mainly due to modelling software limitations, we used a permeability and porosity population method in the models such that mean, low, and high value of the properties match the ones provided in
Table 2. For each reservoir, three 3D models corresponding to low, mid, and high case properties were built for carrying out the simulation study.
The initial phase involved determining the optimal well placement strategy. This was achieved by employing a doublet well pair to assess the total energy output from the model, identifying the most promising sites for further consideration. To evaluate the various geological sites listed in the preceding section, a sequence of mechanistic models was constructed.
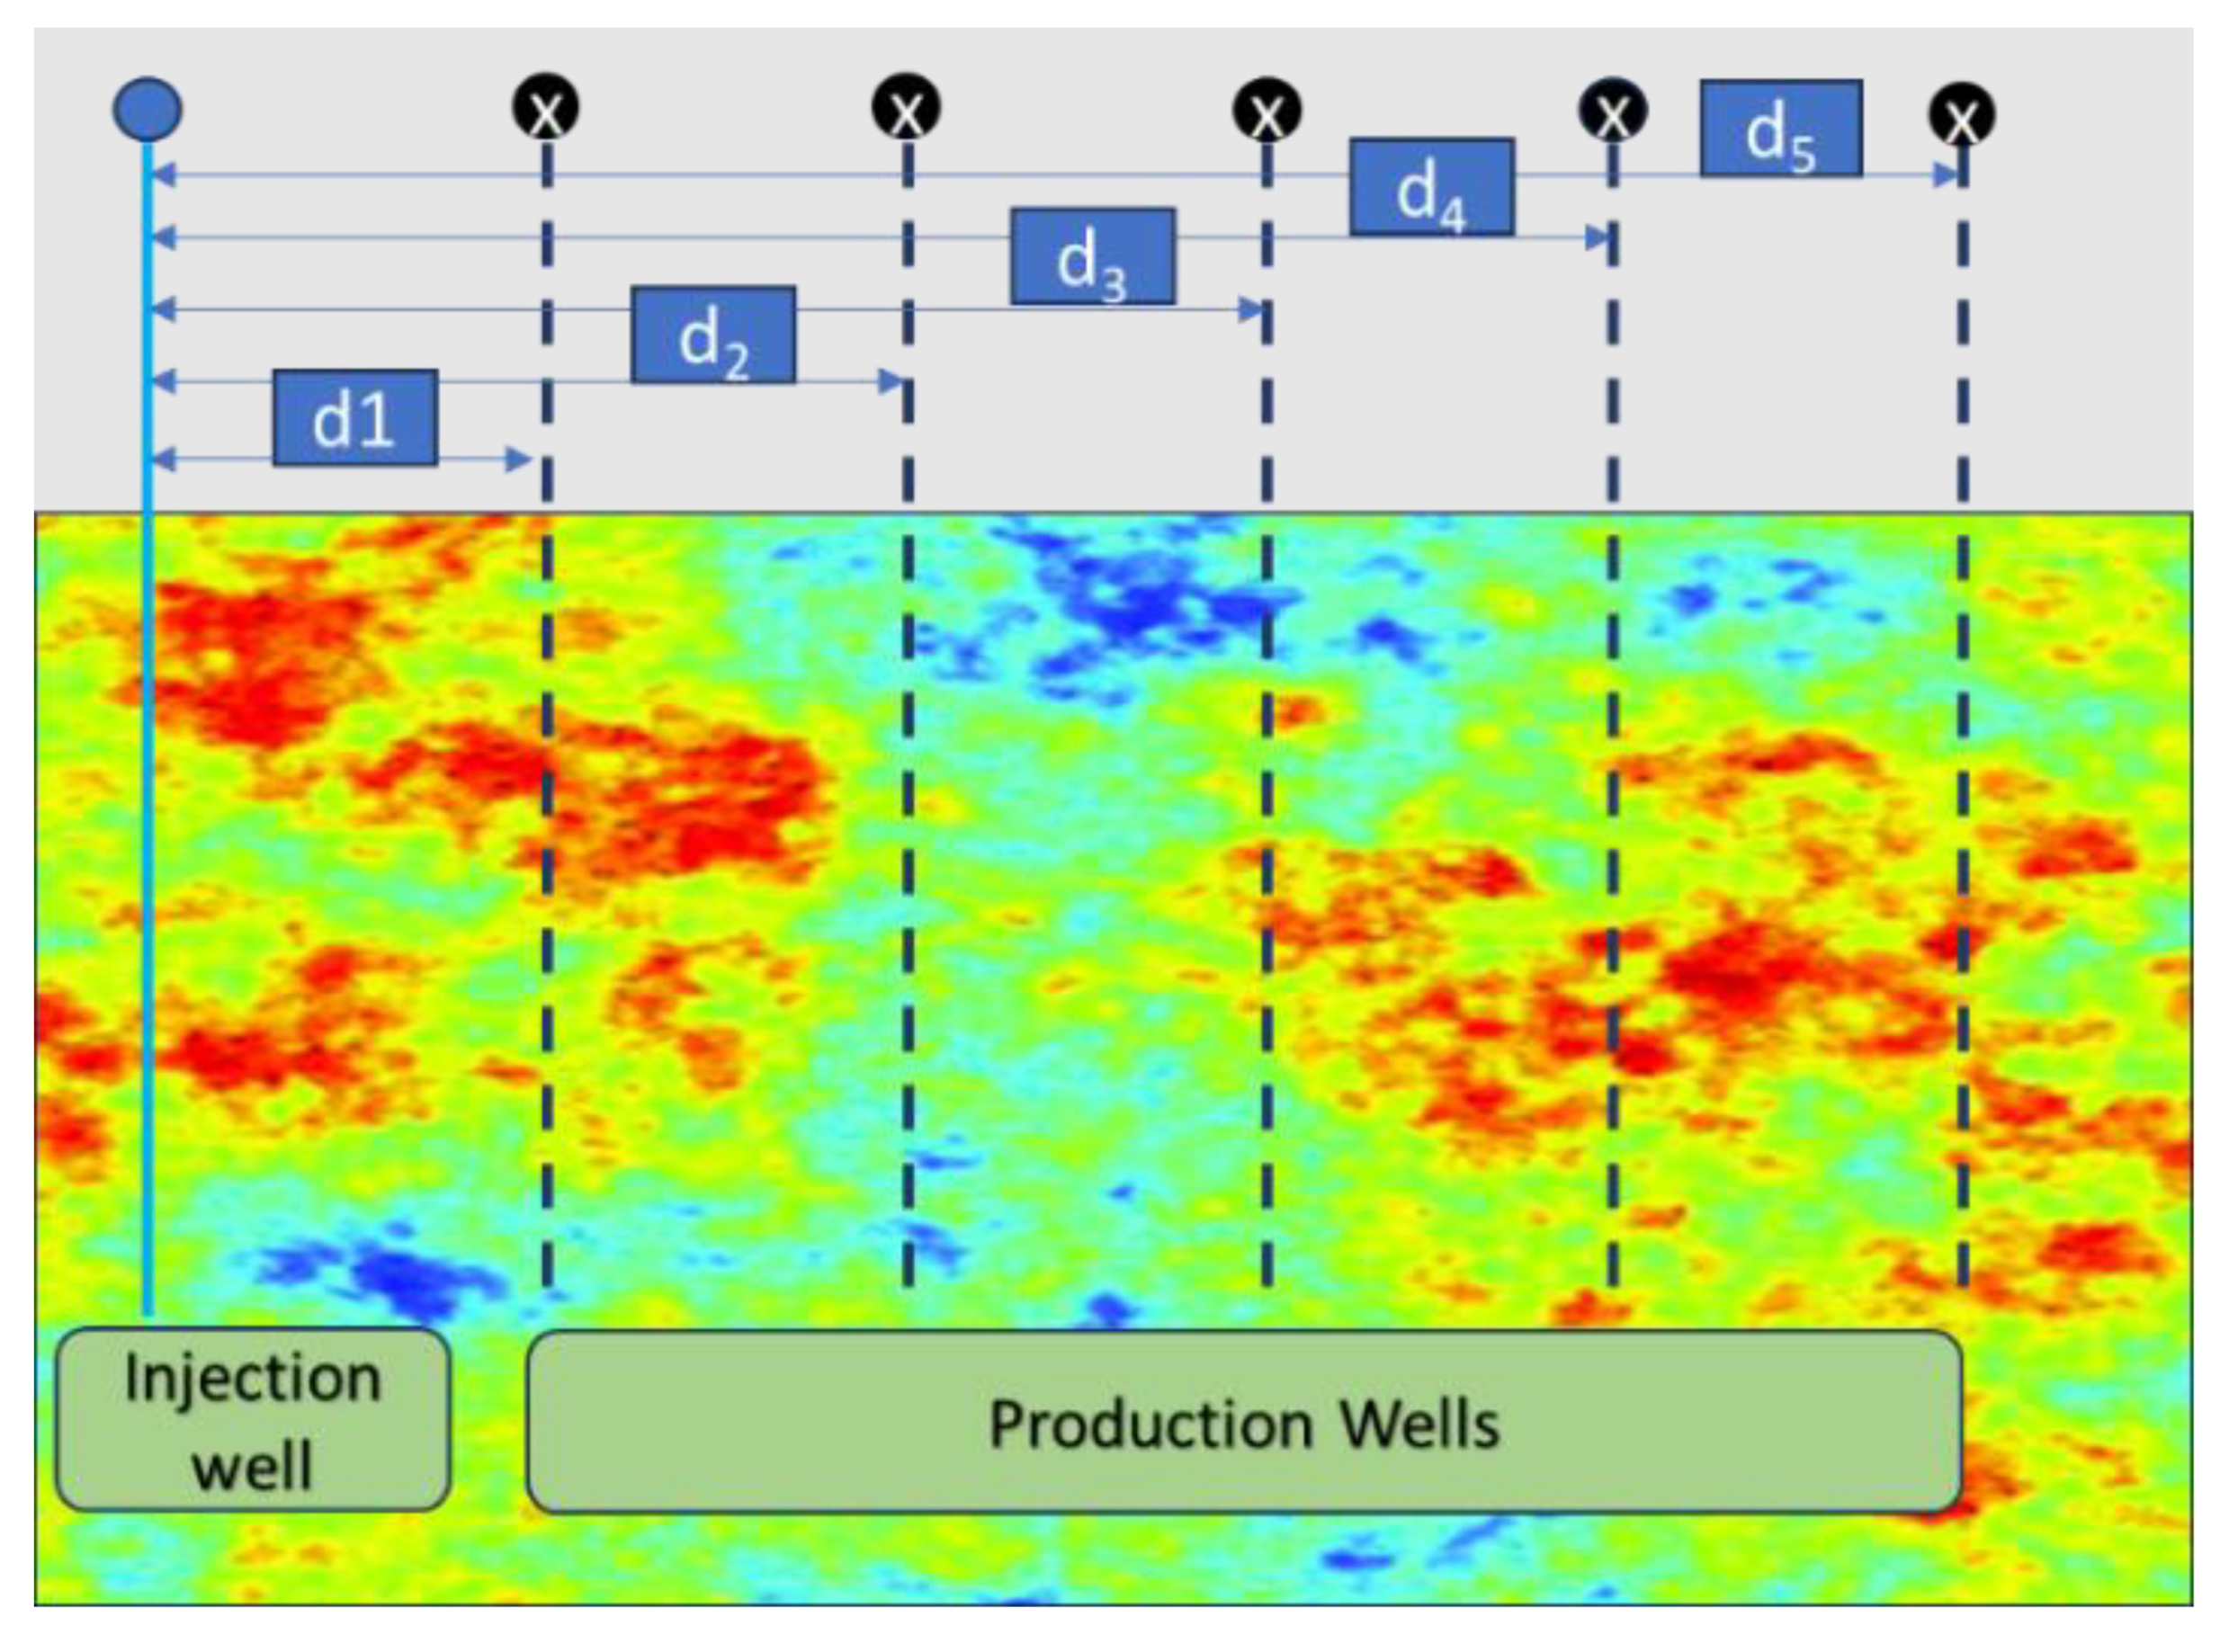
4.1. Well Placement Analysis
Prior to initiating the reservoir modeling-based screening process, an assessment of reservoir models for thermal energy production was conducted, focusing on determining the minimum well spacing required [
27,
30,
31]. To achieve this, a site model was chosen and subjected to evaluation by varying the distance between wells. The exploration commenced with a minimum distance of 900 m, progressively increasing the spacing to over 2 km, as illustrated in
Figure 5, for a conceptual model.
Each model with varying spacing was assessed over a production period of 50 years. The primary criteria for the evaluation of well spacing included temperature and production rates at the producer wells. The objective was to maximize both production temperature and rates. Although this undertaking was theoretical, it provided insights into the minimum well spacing required for optimal thermal energy output. It is crucial to emphasize that local conditions, such as the presence of existing well stock, may constrain design options. Additionally, the occurrence of increased fault/fracture densities in an area might necessitate larger than optimum well spacings to mitigate the risk of short-circuiting. These factors represent important criteria that need to be addressed in subsequent stages as part of uncertainties analysis.
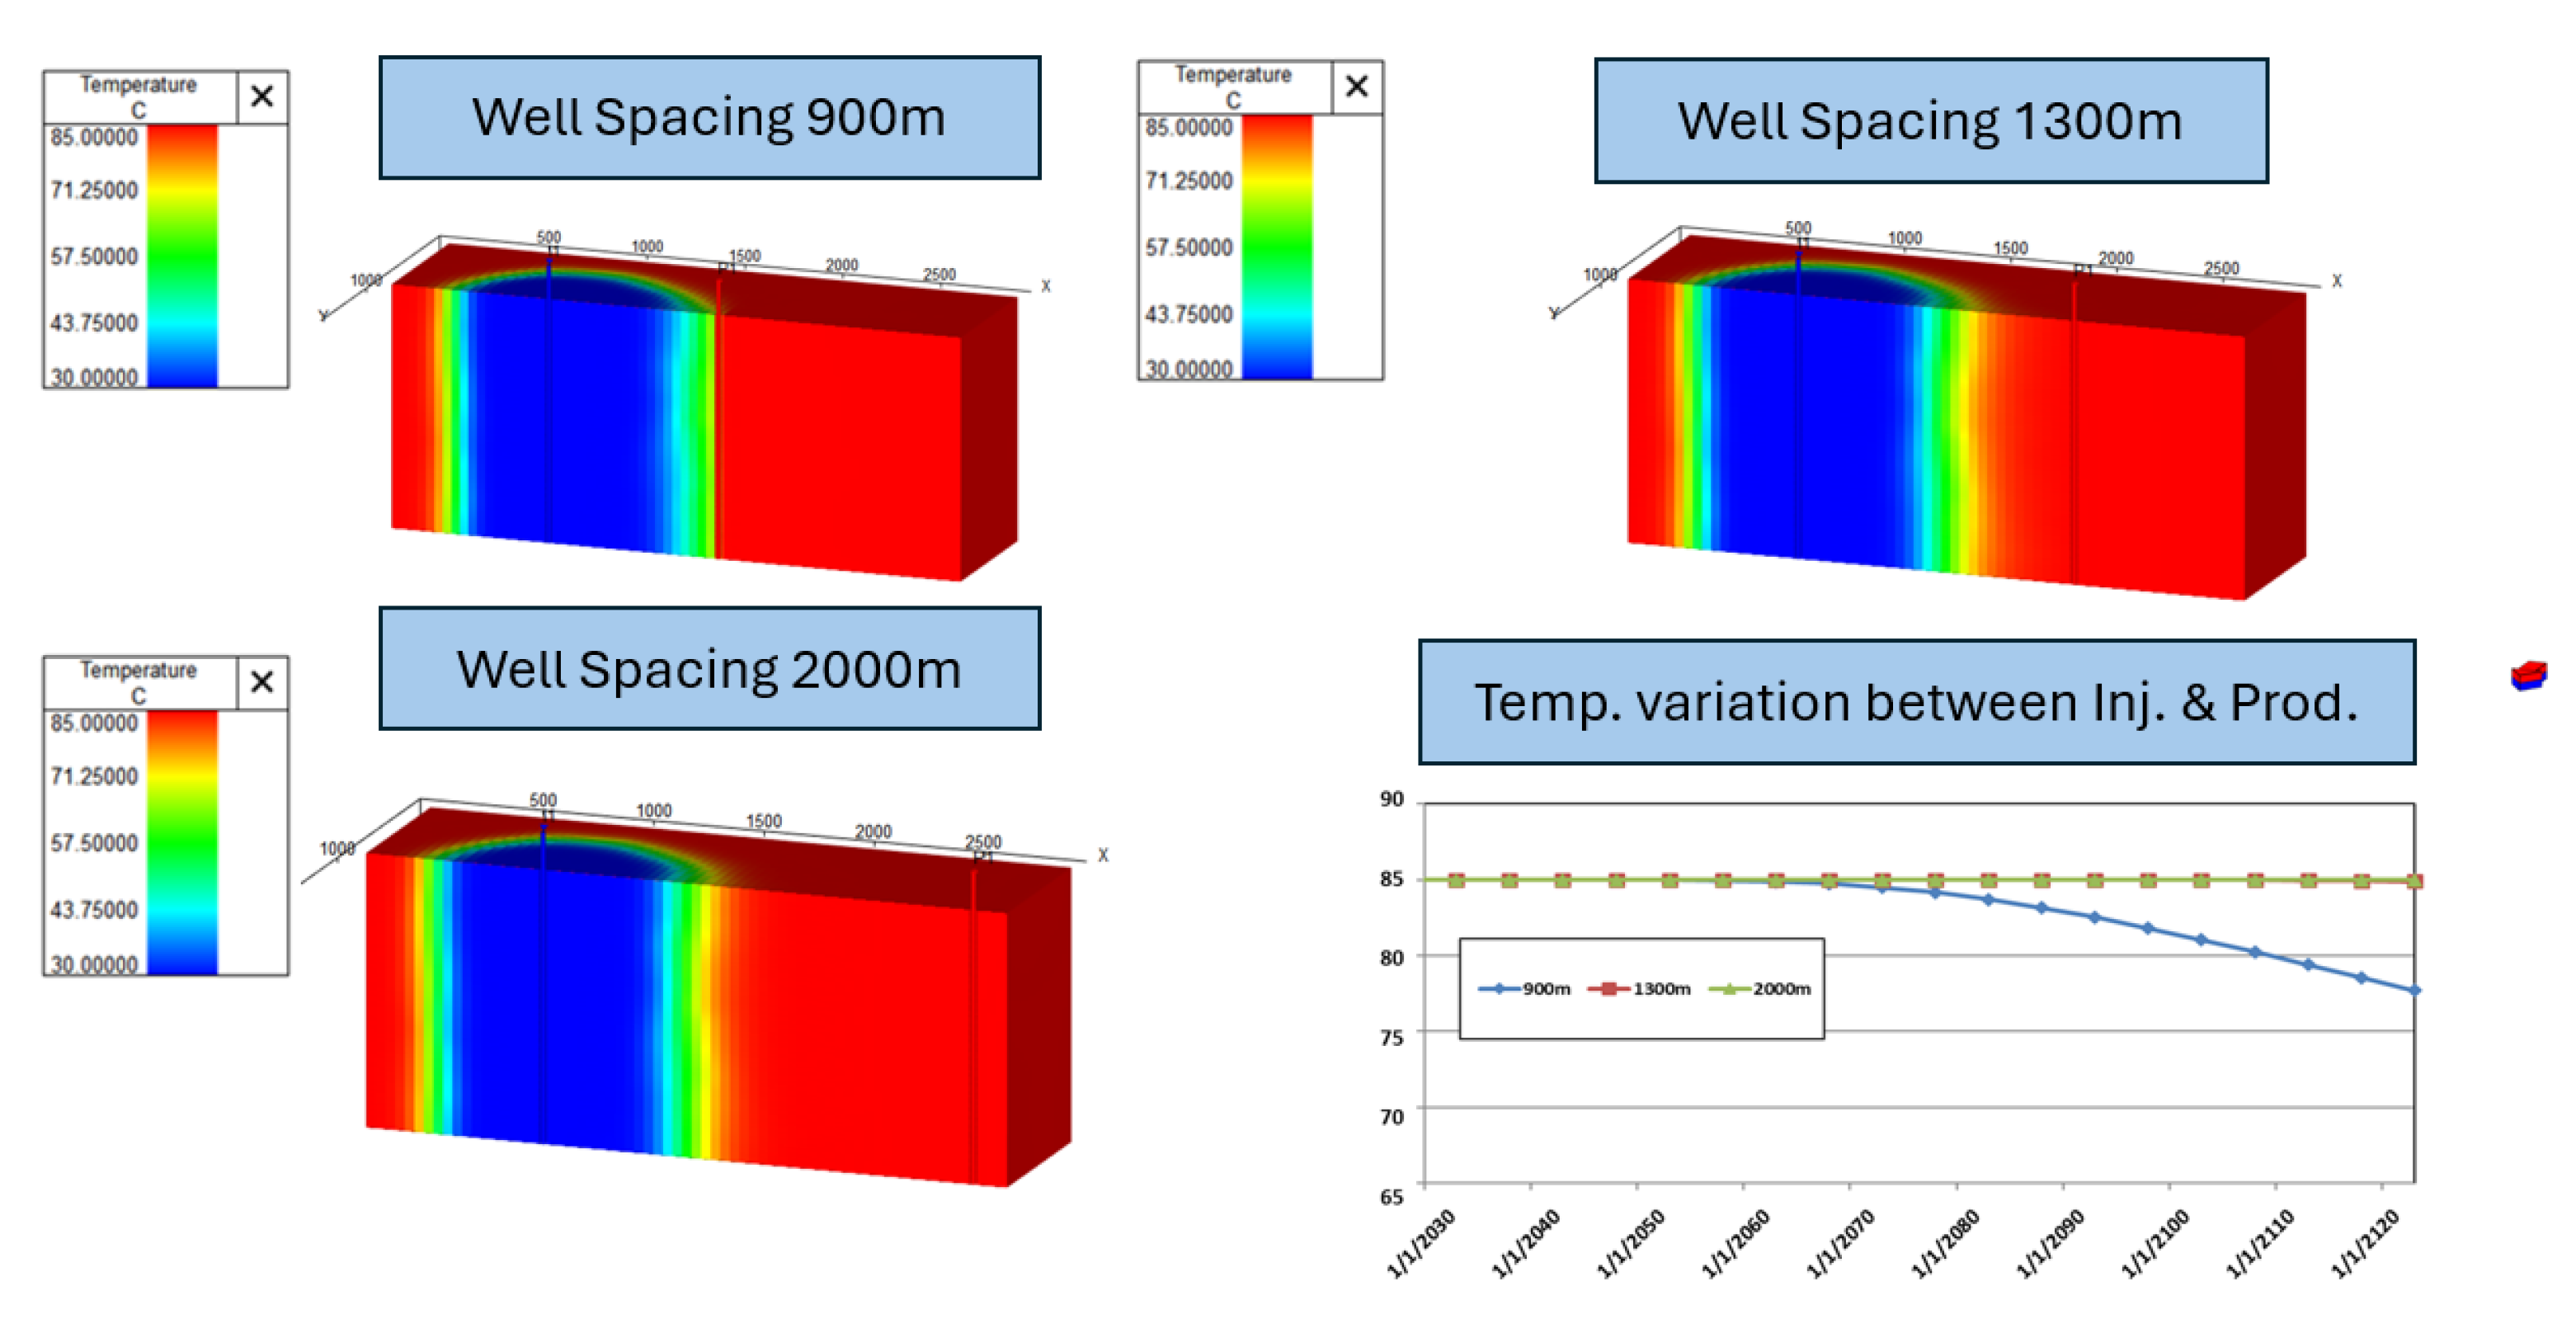
The simulation results demonstrated that in the absence of fractures, the optimal well spacing was 1300 m, as illustrated in
Figure 6. Notably, only at a spacing of 900 m is a discernible decline in temperature observed. Upon increasing the spacing to 1300 m, this decline in temperature at the producer is absent, even after 50 years of production.
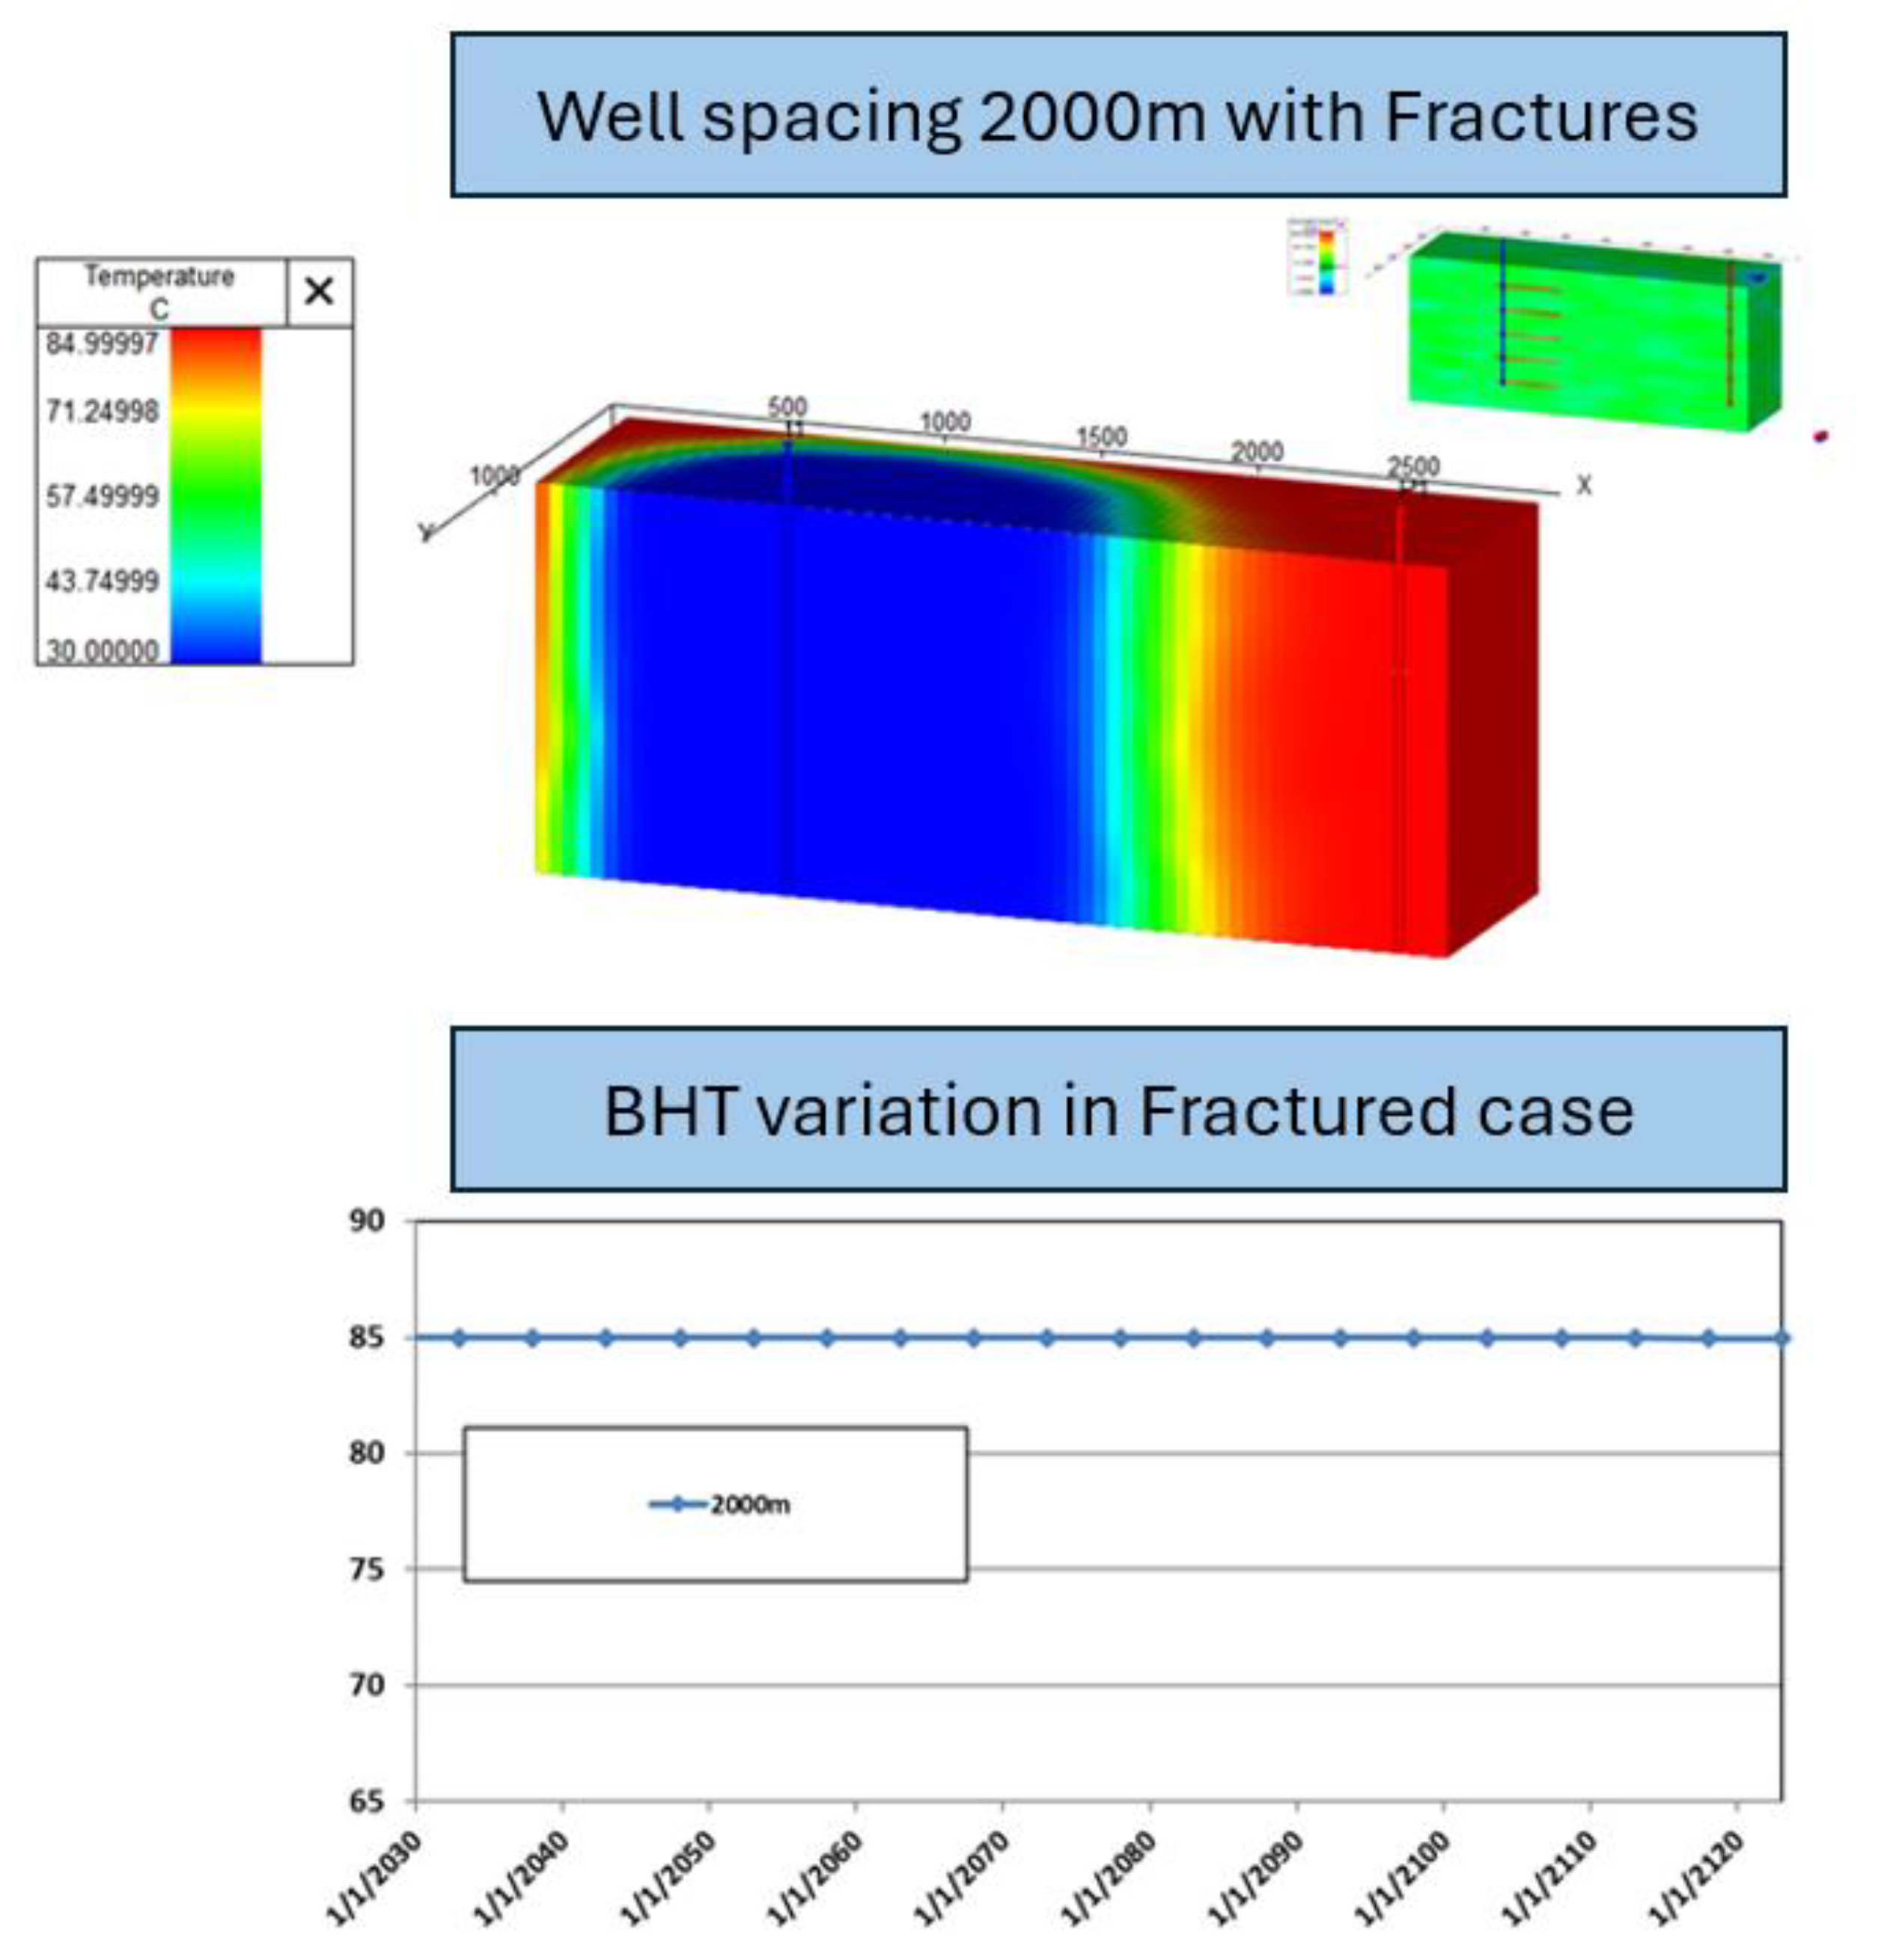
A sensitivity analysis on well spacing was conducted, encompassing scenarios where the presence of fractures could influence overall well spacing dimensions. It was determined that in the presence of induced fractures, the well spacing needed to be increased to beyond 1300 m to prevent the rapid breakthrough of a cold waterfront, as evidenced in the model and corresponding simulation result depicted in
Figure 7. Additionally, the study revealed that induced fracturing contributed to an augmentation in both production and injection rates, establishing it as potentially advantageous for geothermal project development in low permeability reservoirs. However, the decision was made to maintain a spacing of 1300 m for the thermal evaluation process, given the absence of fractures in the models.
4.2. Mechanistic Modelling and Experimental Design Workflow
Upon selecting the optimal well spacing, geological screening criteria were employed to construct a series of mechanistic simulation models for each geological site. These models were subsequently utilized to assess the geothermal potential of each site through fluid flow simulations. A conceptual representation of this approach is depicted in
Figure 8, which shows that for each geological site, multiple models were generated based on high, mid, and low case properties. Next, an experimental design approach was used to identify the most impactful parameter for each geological site. The workflow applied for experimental design approach is rather simple and straight-forward to implement. The steps of this workflow are shown below:
Identify the most impactful model/reservoir parameter through sensitivity analysis.
For sensitivity analysis, a parameter range is decided, then prediction is performed.
Using the set of model/reservoir parameters, the impact on prediction accuracy is checked.
Several combinations of different model/reservoir parameters could be tested.
Finally, the model/reservoir parameters giving the best prediction accuracy are selected.
Based on the above workflow, the most impactful parameters were identified and used with the high, mid, and low cases to assess the geothermal potential of the site.
Although, some of the selected sites were primarily designed for hydrocarbon production, the wells used in hydrocarbon production lack open-hole sections and are drilled only at the topmost layer, which possesses relatively poor collector properties in the Cambrian layer. Despite these limitations, in order to stay true to the assessment of potential geothermal potential, these models were configured to represent a potential scenario for well doublets repurposed for geothermal fluid extraction with spacing selection as demonstrated in
Section 4.1.
Based on the workflow described above, Tornado and Pareto charts were created for each site. For this analysis, the Static Model provides low/mid/high ranges for parameters such as porosity, permeability, thickness, and NTG to account for the reservoir petrophysical uncertainties for all selected sites. Additional parameters such as Kv/Kh in hardgrounds were also included in the sensitivity analysis. Here, low, mid, and high cases for geological parameters were assumed.
A base case simulation was defined for the selected development site option using a reference case input for all parameters (denoted as the mid case in the mechanistic model). The key project metric, cumulative water production after 50 years, was recorded from the base/reference case. These base case results form the basis for comparison with the results of the parameter sensitivities.
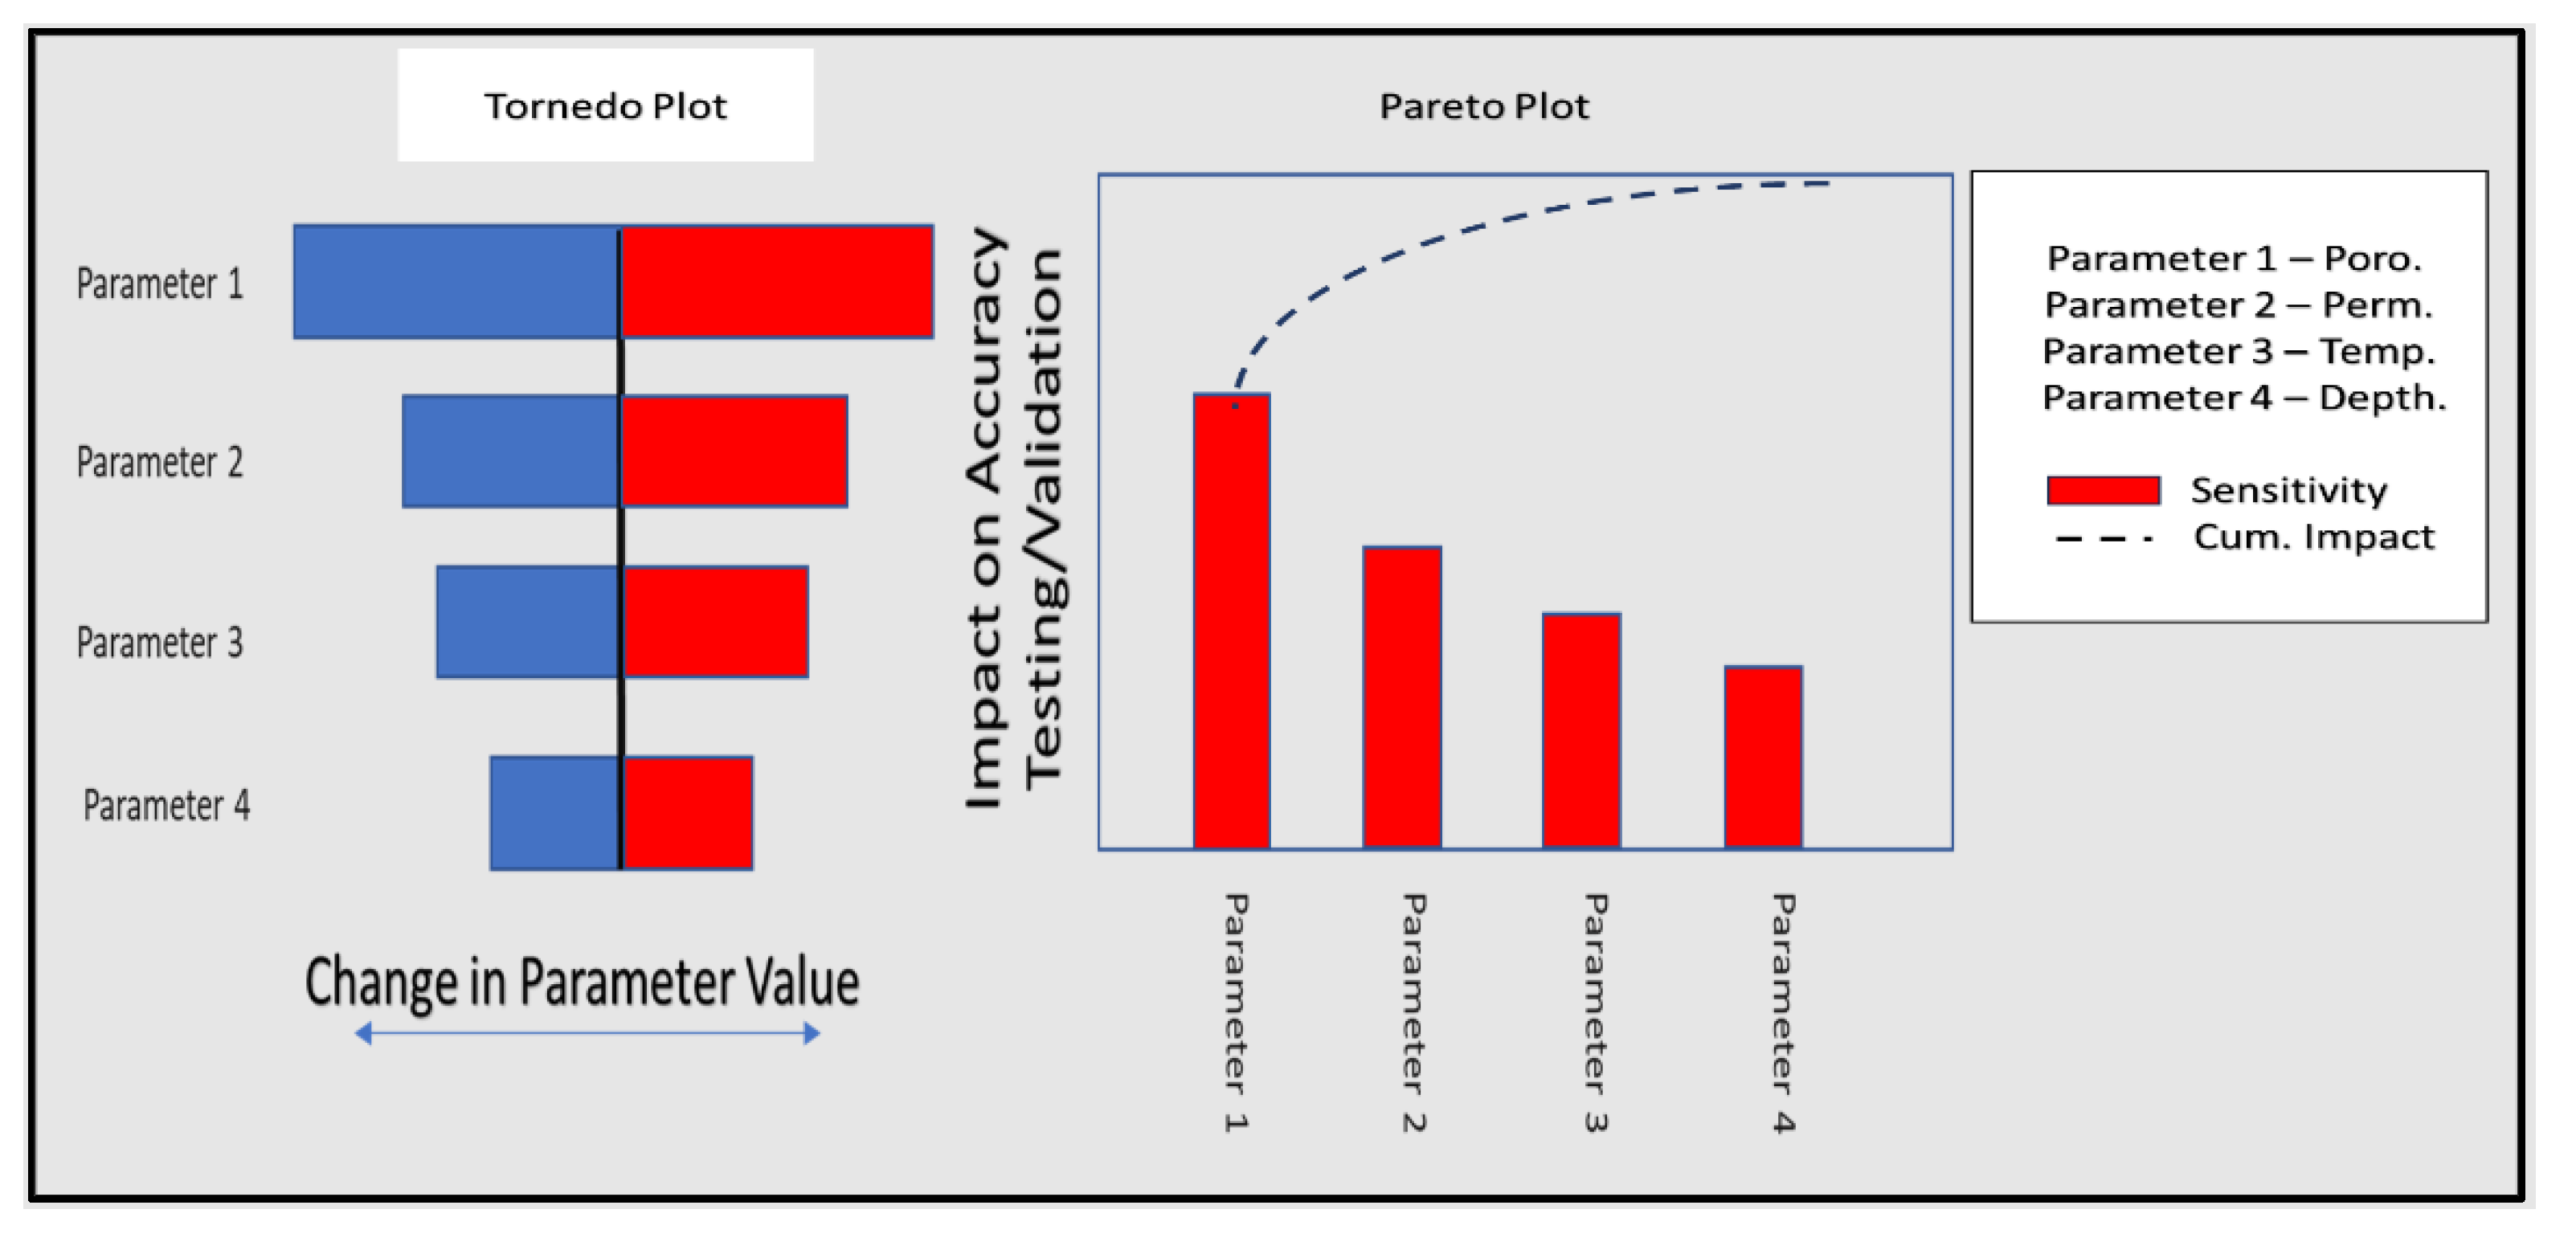
Individual parameter sensitivities were conducted by single parameter changes to the model. For each parameter the values were changed from the lower to the upper limits to gauge the maximum potential impact of that particular parameter. Results of all sensitivities were collated and are presented in the Tornado charts in
Figure 8. For the example shown in
Figure 8, a total of four reservoir/fluid parameters were selected to investigate the key uncertainties associated with this development. The example Tornado chart in
Figure 8 shows that the range associated with the uncertainty on Parameter 1 is the most dominating factor, followed by Parameter 2, 3, and 4. The red color indicates the high case realization of the reservoir parameter, and the low case realization is colored blue.
In order to rank and select key parameters for the probabilistic uncertainty evaluations, another step was included to provide consistency across all investigated development scenarios. The Pareto analysis is a technique that provides the required ranking and selection of the most influential input parameters for particular metrics, e.g., thermal recovery for a geothermal development.
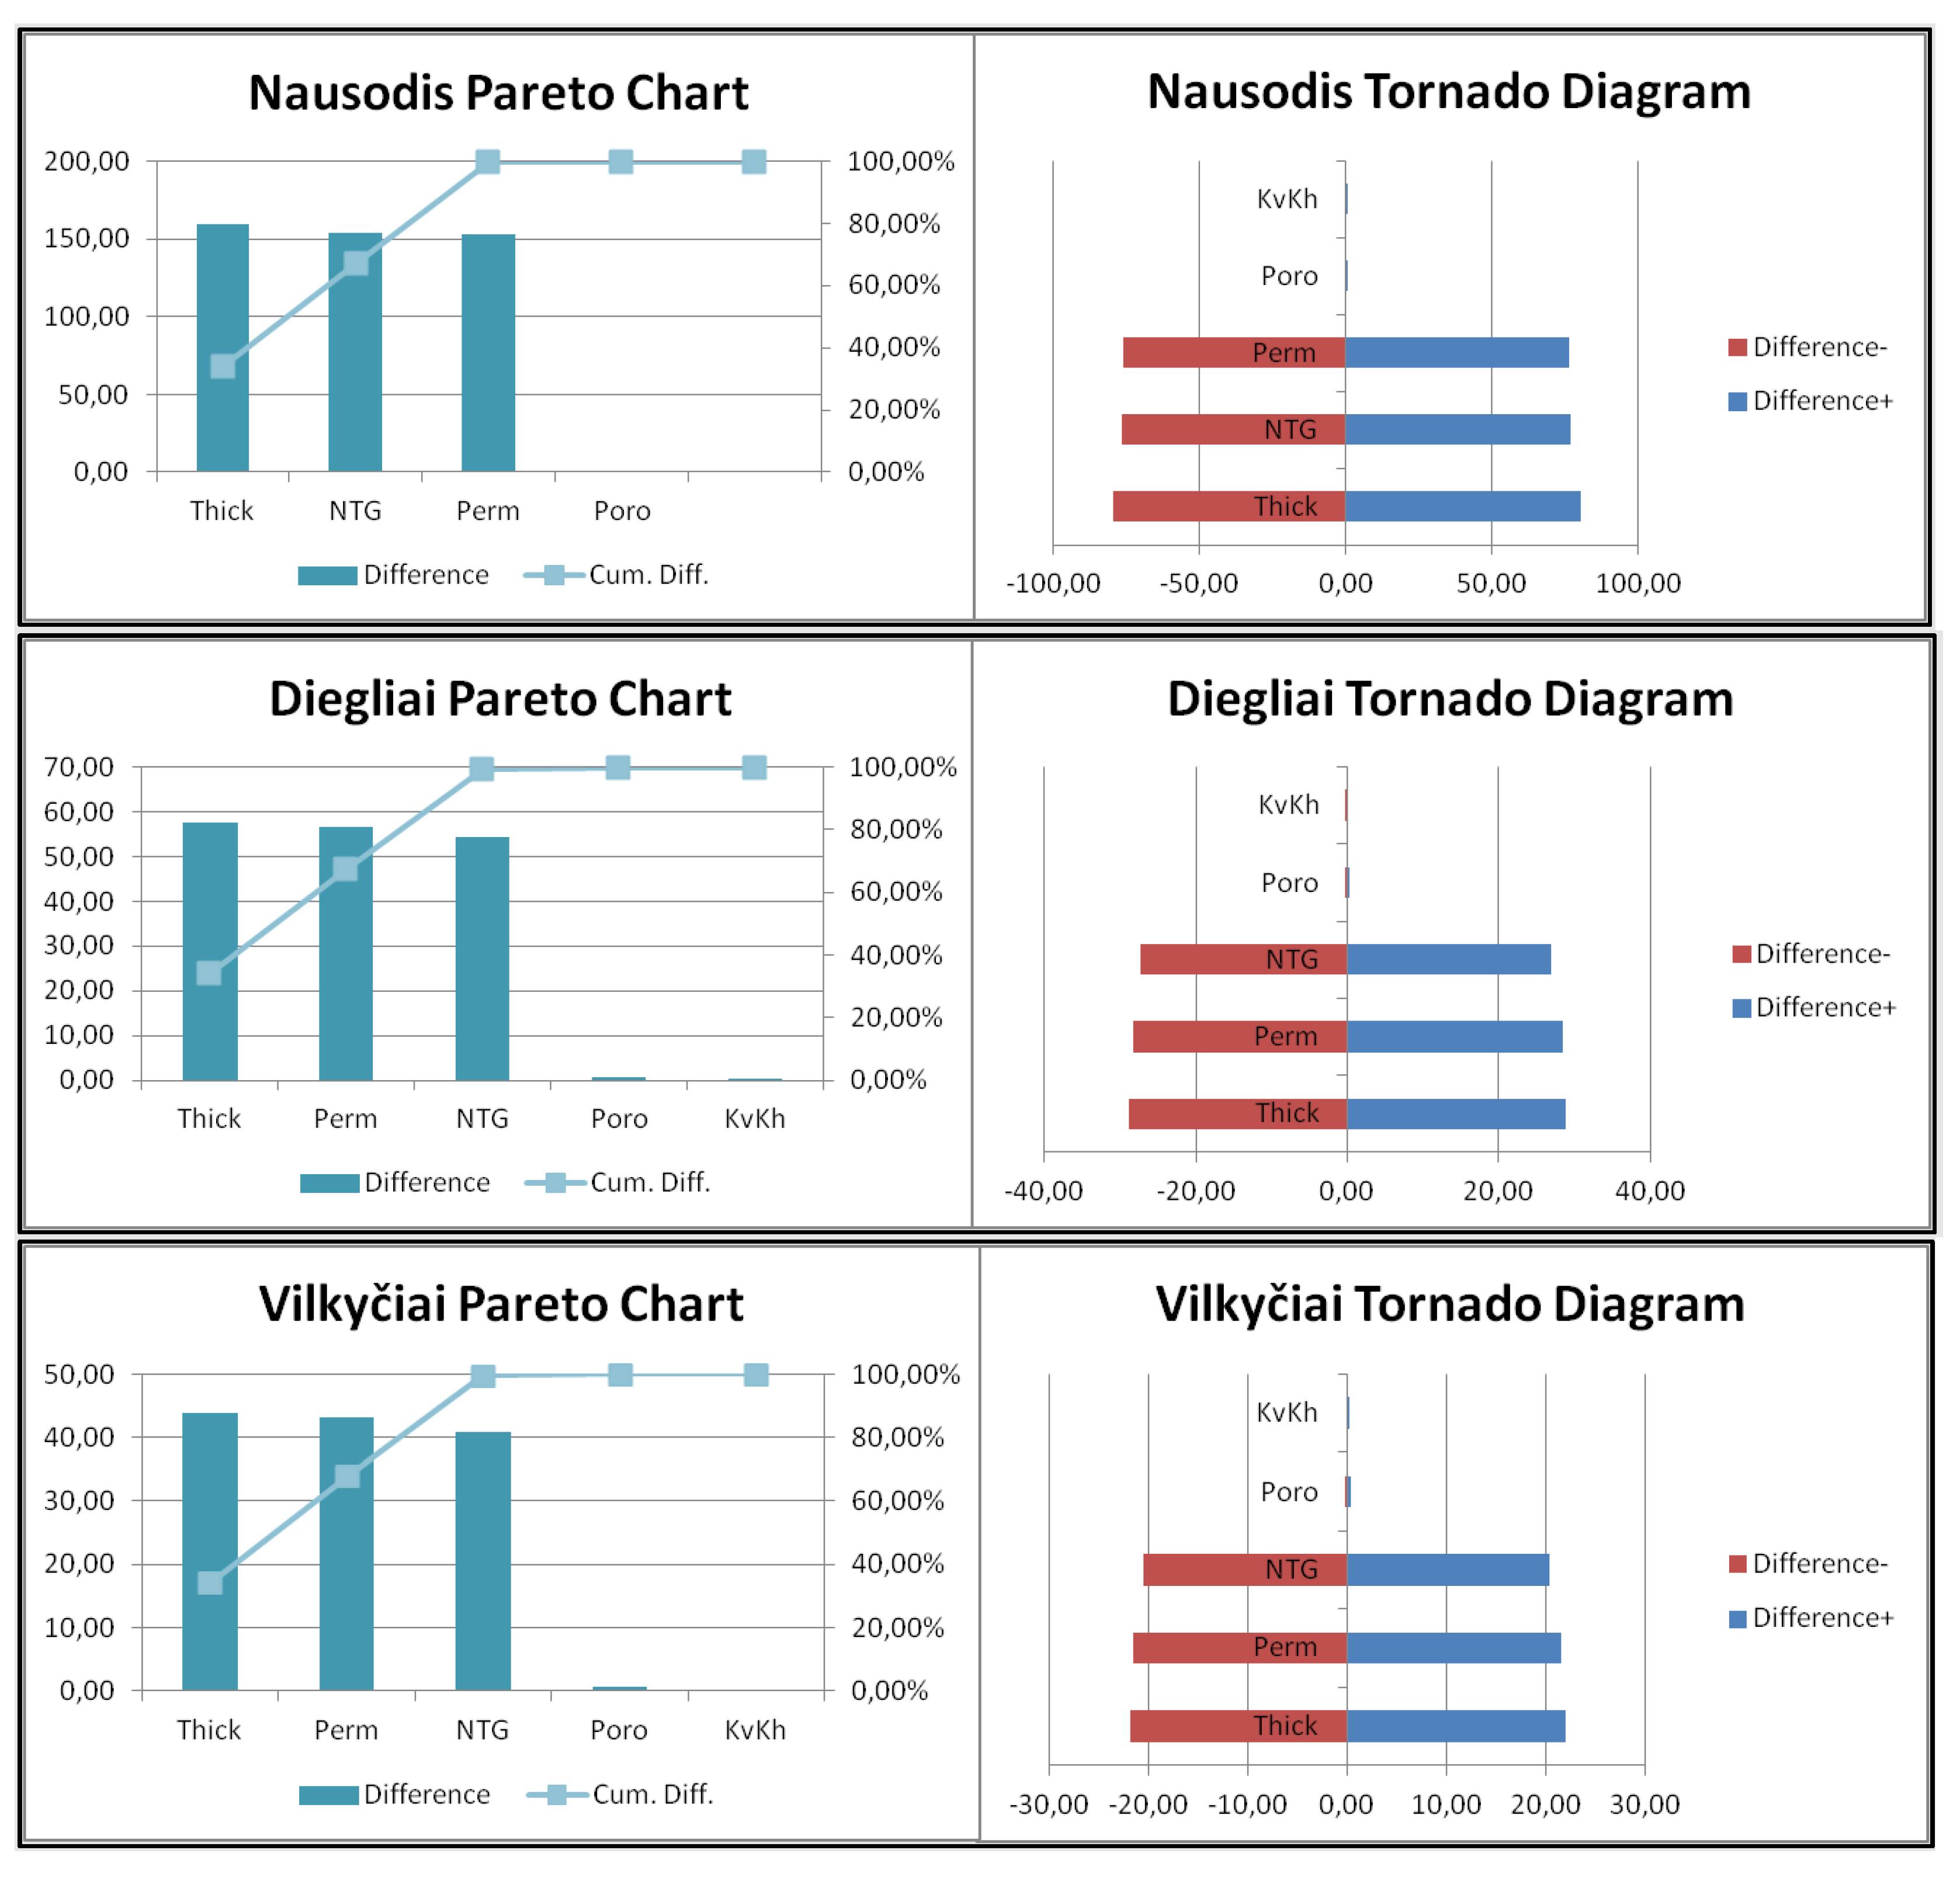
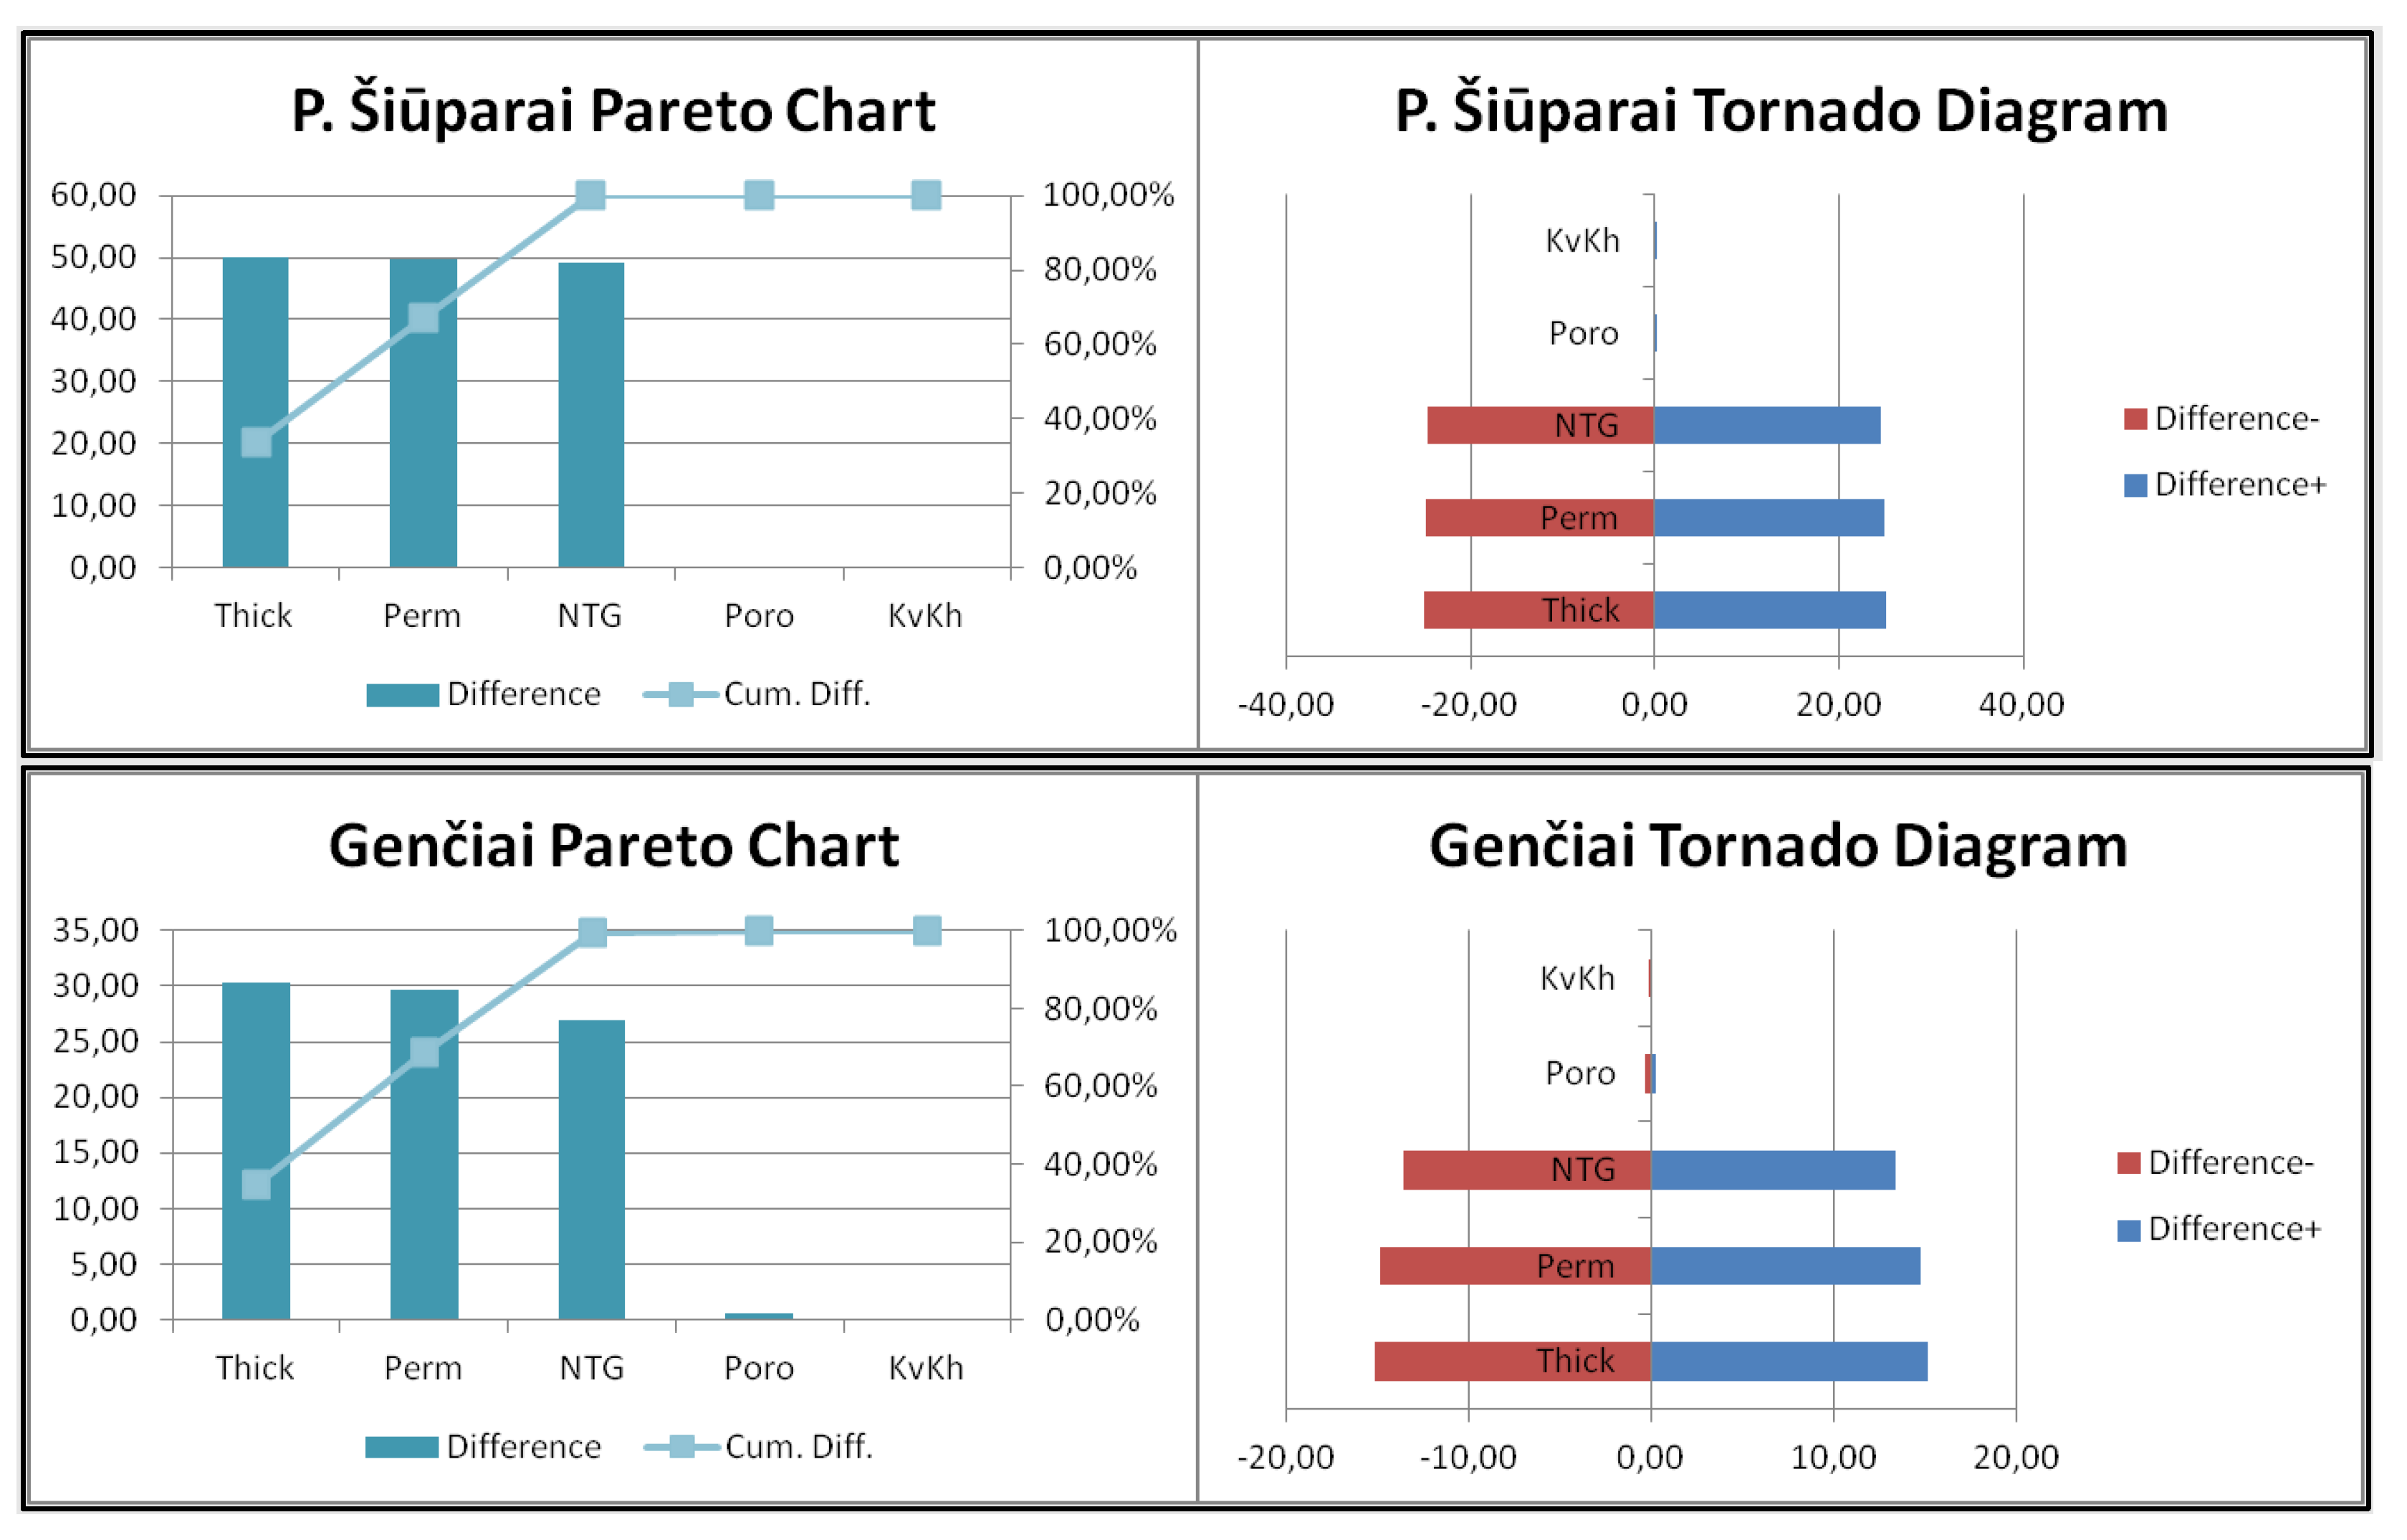
Figure 9 depicts the results of the Tornado and Pareto analysis performed on an example model for geothermal recovery and total production rate sensitivities. The vertical bars shown in the Pareto charts reflect the uncertainty range associated with the individual sensitivities, sorted in descending order. The Pareto chart also shows a curve representing the cumulative normalized uncertainty. Parameters corresponding to 80% of the full uncertainty (blue dashed line in Pareto chart) are considered the most important and are therefore selected for probabilistic forecasting.
The Tornado and Parato charts for the five selected sites, based on preliminary screening, are shown in
Figure 9. From the Tornado and Pareto analysis, it can be said that for all the selected sites, the most impacting parameters turn out to be thickness, permeability, and NTG. The porosity and Kv/Kh have a very insignificant impact on the total production rates. Next, these selected parameters were used to carry out the probabilistic forecasting for these sites and were used in the creation of the high, mid, and low cases for carrying out the simulation, see
Table 3.
4.3. Geothermal Output
In accordance with the well spacing and geological screening criteria, models were developed for each site. This section presents results for a specific site (see
Table 4), focusing on a screened Cambrian reservoir. An analysis was conducted to examine the trajectory of injected water from injection to production wells and to assess achievable production rates. The findings indicated that with a well spacing of 1300 m, it is theoretically feasible to produce heat at a rate from 38 to 187 GWh annually (power output from 178.8 kW to 854.5 kW). The following equation was used for the power
calculation:
This is how power
is defined in physics in general, where
is energy (heat in our case) and
is the time taken to transfer that much energy. Heat is extracted from the water directly, so the formula used is known as a heat equation:
Lastly, the amount of water affected by heat loss is known from the water rate
. However, in order to get the mass, this quantity is multiplied by the water density
:
Putting Equations (2) and (3) in Equation (1) we derive a general formula for power through the intrinsic loss of heat from the water:
Here is power, is the specific heat, is the volumetric flow rate of water, is water density, and is the temperature change of water. This formula does not include real life heat losses and equipment efficiencies, but describes the fundamental heat transfer of water. Furthermore, the results demonstrate the potential for achieving doublet injection and production rates potentially reaching 800 m3/day for some Cambrian reservoirs.
The analysis underscores the significance of both the water temperature and production rate in determining the geothermal potential of each site over a 25-year period. Comparing these sites, Nausodis stands out with by far the highest thermal output due to its substantial production rate, which can be explained by a huge reservoir thickness combined with a high NTG value. Diegliai, Vilkyčiai, and P. Šiūparai fall closely to each other, displaying competitive thermal outputs since they have very similar geological properties. The fifth place goes to Genčiai, which exhibits comparatively lower potential due to a low reservoir temperature as well as poor production rates.
5. Discussion
Obtaining comprehensive data, including well placement, historical injection/production records, and precise distributions of porosity and permeability, proved challenging. The reported numerical values often exhibited inconsistencies among various sources, employing distinct measurement systems and diverse ranges (e.g., minimum effective percentages) for assessing identical properties. Additionally, the provided permeability values were predominantly gas permeability, with a prevalent tendency to assume porosity as effective rather than total, indicating a lack of standardized reporting practices.
Furthermore, the modeling process excluded the incorporation of seismic data, relying instead on simplistic box models with randomly generated distributions based on average geological properties. The absence of gamma logs in the modeling process is notable, compounded by the challenge of dealing with data primarily presented in Russian, often spanning extensive reports. Notably, the study overlooked considerations for cooling effects resulting from fluid extraction and within surface machinery. However, the assumption of injection temperatures considerably exceeding the plausible range of 10 °C to 40 °C was made to account for that. In order to more critically address the injection fluid temperature, a potential geochemical study should be carried out in future work.
The predominant dataset originates from the poor collector properties identified at the uppermost stratum of productive sand layers, where hydrocarbons are extracted using perforated tubing rather than open-hole bores. Moreover, the absence of an economic analysis is noteworthy, as all of these sites are situated at a considerable distance from major urban centers that would derive benefits from the heat energy produced. Additionally, the data is derived from year-round water extraction, whereas the heating season in Lithuania spans approximately five months. Furthermore, as a sidenote, extracted water temperatures are insufficient for any meaningful electricity generation. This prompts further investigation into locations with greater economic potential, particularly in proximity to cities such as Klaipėda (population approximately 150,000), Šilutė (population approximately 15,000), and Kretinga (population approximately 17,000). These locations exhibit promise, with Šilutė boasting a notably elevated temperature of 90 °C and high reported rates. Kretinga has operational wells in close proximity, having been in use for several years, while Klaipėda, as the third-largest city in Lithuania, represents an opportunity despite the absence of drilled Cambrian wells.
The main challenges associated with site exploration included heightened sand cementation with increasing temperature and depth. Moreover, there are recurrent reports of the Cambrian layer displaying considerable variability in both thickness and permeability, rendering it unpredictable until drilled. This introduces substantial complexities in estimating potential rates, particularly in scenarios involving the reworking of old hydrocarbon wells or the prospect of drilling new wells. Furthermore, many locations lack comprehensive information about underground regions, a circumstance particularly challenging in areas such as Klaipėda.
Regarding the deficit of information, there is a notable number of unknowns, including details on natural fracturing, pertaining to the granites within the crystalline basement underground. The most recent and practical geothermal research on the Cambrian dates back approximately 30 years, specifically with the drilling of two wells, Vydmantai-1 and 2, which were subsequently abandoned due to their insufficient flow rates.
Finally, repurposing hydrocarbon wells for geothermal energy production presents several challenges and limitations. One significant challenge is the potential thermal mismatch between the temperatures associated with hydrocarbon extraction and the temperatures of geothermal fluids. This disparity can compromise the efficiency of energy extraction. Corrosion and scaling issues arise due to the corrosive nature and mineral content of geothermal fluids, leading to increased maintenance costs and potential wellbore damage. Material compatibility concerns may also arise, as the materials used in hydrocarbon wells may not withstand the specific chemical composition of geothermal fluids. Adjusting the well infrastructure to accommodate varying reservoir conditions, including pressure and flow rates, poses technical challenges. Silica scaling, formation damage, and potential environmental impacts, especially if residual hydrocarbons or contaminants are present, further contribute to the complexity of repurposing hydrocarbon wells for geothermal use. Regulatory compliance differences between hydrocarbon and geothermal projects introduce additional complexities, necessitating careful assessment, engineering studies, and modifications to address these multifaceted challenges effectively.
6. Conclusions
The analysis highlights the pivotal role of current production availability and application of uncertainty modelling workflow in computing the geothermal potential of potential sites. Based solely on that, five Lithuanian sites that have the biggest reported fluid production among all of its wells were selected. Their average geological properties were compiled in five different doublet wells, then computer models were used to determine an optimal well spacing of 1300 m. Each case provided different thermal output estimations over a 25-year period, with water temperature and production rate being the determining factors.
Nausodis stands out as the most promising site due to its significantly high thermal output, attributed to a substantial production rate resulting from a large reservoir thickness and a high Net-to-Gross (NTG) value. Diegliai, Vilkyčiai, and P. Šiūparai displayed competitive thermal outputs owing to their similar geological properties. Genčiai, in fifth place, exhibited a comparatively lower potential, attributed to a lower reservoir temperature and poor production rates.
Finally, this study presents a workflow to systematically evaluate potential development of possible geothermal sites in Lithuania. Developing a geothermal site in Lithuania promises both environmental and economic advantages. Harnessing heat from the Earth’s interior provides a renewable and sustainable energy source, contributing to a reduction in greenhouse gas emissions and improving air quality. This initiative also lessens dependence on imported fossil fuels, leading to foreign exchange savings and increased energy security. The economic benefits include job creation across various sectors, stability in energy costs, and the potential for technological innovation. Furthermore, geothermal development diversifies the energy mix, fostering resilience against supply disruptions, while the promotion of geothermal tourism adds a unique dimension to local economies. Despite initial investment, the long-term cost savings and the overall positive impact on Lithuania’s energy landscape make geothermal development a strategic and sustainable choice.


