Article

Polyolefin Pyrolysis in Multilayer Fluidized Beds: An Innovative Approach to Obtain Valuable Alternative Fuels

1
Faculty of Chemical Engineering and Technology, Cracow University of Technology, Warszawska 24, 31-155 Kraków, Poland
2
Doctoral School, Cracow University of Technology, Warszawska 24, 31-155 Kraków, Poland
3
Faculty of Environmental Engineering and Energy, Cracow University of Technology, Warszawska 24, 31-155 Kraków, Poland
*
Author to whom correspondence should be addressed.
Energies 2024, 17(5), 1034; https://doi.org/10.3390/en17051034
Submission received: 6 January 2024 / Revised: 16 February 2024 / Accepted: 19 February 2024 / Published: 22 February 2024
(This article belongs to the Collection Energy-Efficient Chemistry)

Abstract

:
This paper presents the application of two versions of the multilayer fluidized bed made out of two materials with significantly different densities. The first type of fluidized bed was composed of raw cenospheres and quartz sand. The second type of fluidized bed was composed of cenospheres coated with iron oxides and quartz sand. A variable vertical density profiles in the prepared fluidized beds were confirmed, making them suitable for processing polymeric materials, specifically, polyolefins with a density below 1 g/cm3. The polyolefin pyrolysis process was investigated in both versions of the fluidized bed at temperatures of 520, 540, 560, and 590 °C. The products of the pyrolysis were monitored using high-resolution infrared spectroscopy (with a resolution of 1 cm−1). While the process is organized in these fluidized beds, the absence of the accumulation of solid residues is notable. The results show that the pyrolytic gaseous mixture is composed of numerous compounds, namely, unsaturated and saturated aliphatic hydrocarbons and benzene. The possibility of producing a gas rich in ethylene, propylene, and 1-butene during the pyrolysis was demonstrated. Additionally, during the pyrolysis of both polymers, the production of benzene was shown with yields, ranging from 5%wt. in the fluidized bed made out of raw cenospheres to 11 %wt. in the fluidized bed made out of cenospheres modified by iron oxides. Due to the complex nature of the resulting pyrolytic gas, it is suggested that we process the created gaseous mixtures entirely in a steam conversion process, making them a potential source of hydrogen.

1. Introduction

Creating a modern, resource-efficient, competitive, and net-zero greenhouse gas emission economy is the present focus of the European Green Deal [1,2]. The circular economy aims to minimize waste generation and maximize resource efficiency by promoting the reuse, recycling, and repurposing of waste materials and by-products [3,4]. Pyrolysis of plastic wastes involves breaking down high-molecular-weight polymers into smaller molecules, resulting in the production of valuable alternative fuels and chemical raw materials [5,6]. The process holds promise in advanced recycling and has captured the attention of numerous scientists, emphasizing its potential impact on sustainable development [7,8].
The pyrolysis of plastic wastes on a small laboratory scale is already well investigated. However, the commercialization of the process on a larger scale requires overcoming certain challenges. Impurities and variability of the feedstock, the formation of harmful by-products, energy requirements, the quality of end products, and the scaling of the process are the main issues that need to be dealt with [9,10,11].
Waste plastics often contain contaminants, such as paper labels, food residues, and other materials that are not made out of plastics and require different processing conditions. These contaminants can affect the efficiency of the pyrolysis process and the quality of the end products [12]. Furthermore, different types of plastics are characterized by varying compositions, melting points, and thermal degradation behaviors. The feedstock variability can make it challenging to optimize the pyrolysis conditions for consistent and high-quality output [13]. Plastic waste pyrolysis is often the source of hazardous gases and volatile organic compounds (VOCs) emission into the environment [14]. Proper emission control systems and treatment methods are necessary to minimize the release of harmful substances and ensure compliance with environmental regulations [15].
One of the main challenges in scaling the pyrolysis up to industrial dimensions is ensuring a uniform temperature and effective mixing of the input materials. Maintaining a constant temperature in the reactor during the pyrolysis of polyolefins is particularly challenging due to their low thermal conductivity [16]. Uneven heating of the pyrolyzed material results in areas that are not reaching the required temperature for complete processing, while others may be overheated. Consequently, the pyrolysis process leads to the formation of undesirable products, such as soot [17], low-calorific value gases [18], or toxic chemical compounds [19]. Another difficulty is ensuring the appropriate quality of the end product, which must meet specific standards for later utilization [20]. The quality of pyrolysis products, such as oil or gas, may vary depending on the process organization [21]. Obtaining consistent and high-quality degradation products that can be effectively utilized in various industries is an additional issue [22]. Achieving a high degree of fuel conversion into desired alternative fuels is particularly important during the waste pyrolysis process [23,24]. Factors such as heat transport, reaction kinetics, residence time, and reactor design play a significant role in maximizing waste conversion into useful products while simultaneously minimizing energy consumption and optimizing resource utilization [25]. Furthermore, scaling up small laboratory or pilot projects to large-scale industrial operations poses challenges related to logistics, raw material supply chains, and integration with existing waste management infrastructure [26].
To achieve proper mixing during the pyrolysis process, and thereby better control process conditions to transform waste plastics into alternative fuels and the desired chemical raw materials in a repeatable manner, the organization of the process in a fluidized bed (FB) is proposed. This is a crucial element for the commercialization of pyrolysis, ensuring uniform process conditions. In the present study, multilayer fluidized beds were created, characterized by a variable vertical density profile. Three layers were distinguished in the prepared fluidized beds: the upper layer with the lowest density, the lower layer with the highest density, and the middle layer characterized by variable density. The innovative approach of the multilayer fluidized beds provided the ability to feed polymers from the top of the reactor, allowing them to freely immerse in the FB volume by passing through the low-density layer. Degradation of fuel particles and the release of gaseous products occurred in the layer with variable density, adapted to the density of polyolefins. The high-density layer protected the bottom sieve from the pyrolysis of polyolefins at the gas distributor and thus from clogged gas inlets.

2. Materials and Methods

2.1. Materials

Multilayer fluidized beds were prepared using quartz sand and cenospheres. In the study, raw cenospheres and cenospheres coated with an iron oxides layer were utilized. The natural quartz sand with a grain size of 120–200 μm was selected.
Cenospheres (i.e., spheres of aluminosilicate filled with gas) were obtained from fly ash from the combustion of hard coal in a pulverized coal boiler at the Połaniec Power Plant (Zawada, Poland). The cenospheres were boiled in distilled water to isolate perforated cenospheres from undamaged ones. Subsequently, undamaged cenospheres were collected from the top layer above the solution, dried, and sieved to a fraction of 140–160 μm. The hydrothermal method of separating undamaged cenospheres from perforated ones is shown in Figure 1. The method is divided into I–IV steps:
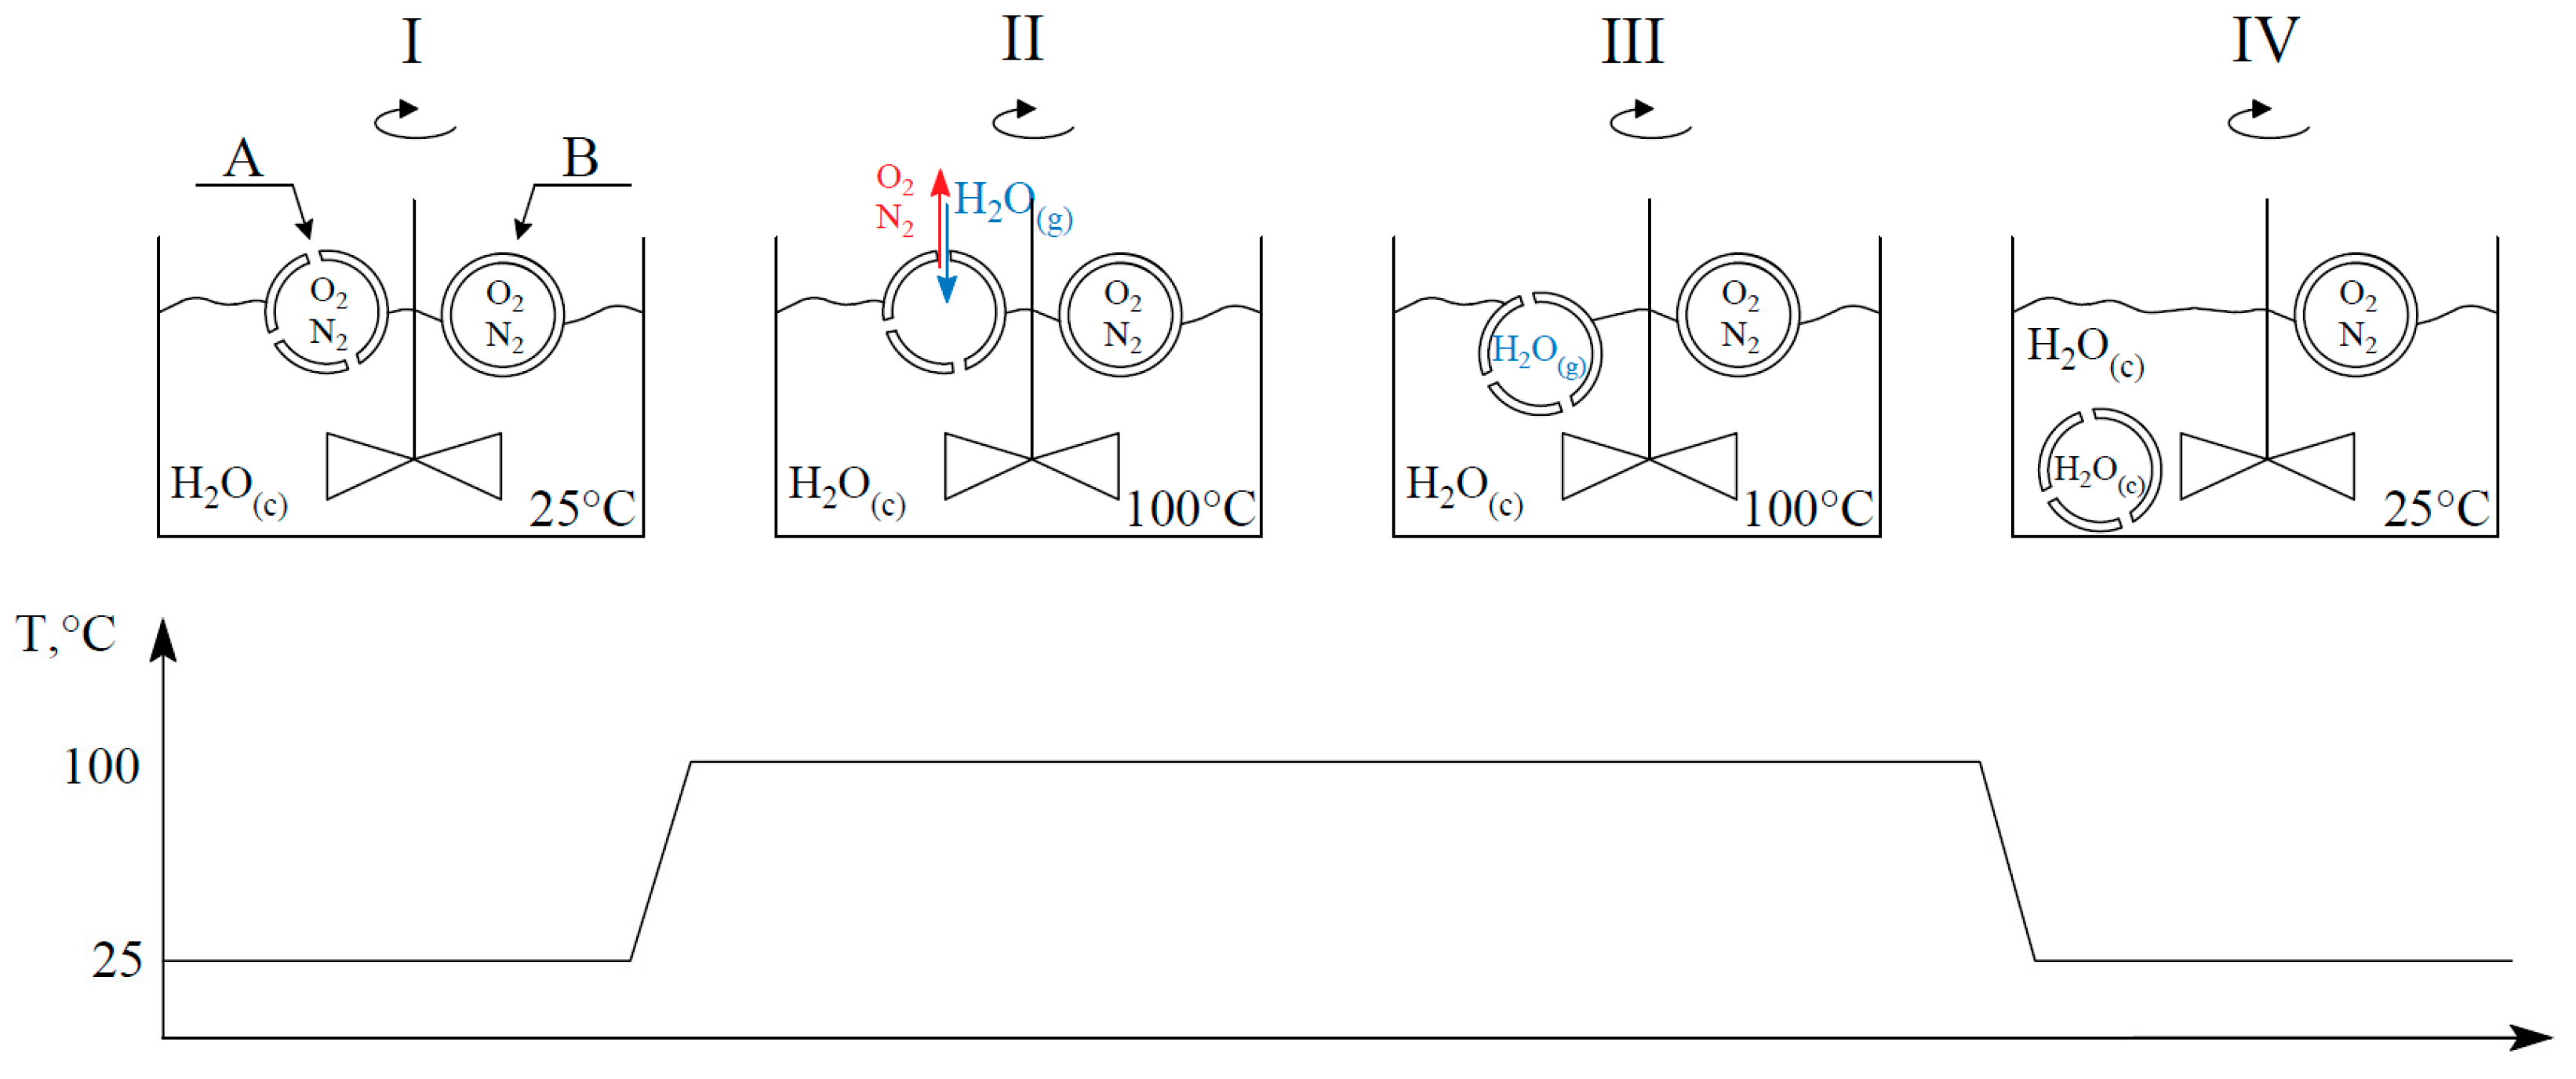
  • Step I: Perforated (A) and undamaged (B) cenospheres float on the water surface. Water is mixed continuously.
  • Step II: In the boiling process, water vapor fills the interior of the perforated cenospheres due to gas exchange. Oxygen and nitrogen diffuse out of the damaged particles.
  • Step III: Cenospheres are completely filled with water vapor.
  • Step IV: During the cooling process, the water vapor condenses inside the perforated grains, generating a vacuum and filling damaged cenospheres with liquid water, which leads these cenospheres to sink to the bottom of the vessel.
Figure 1. Scheme of isolating perforated cenospheres (A) from undamaged ones (B). Cenospheres not to scale.
Energies 17 01034 g001
The raw cenospheres were coated with iron through the gas decomposition process of Fe(CO)5, as described in [27]. The iron content deposited on the cenospheres was 8%wt. The whole layer of iron was oxidized to a mixture of Fe2O3 and Fe3O4 oxides. The oxidation was conducted in the fluidization state at 500 °C for 30 min. The process was completed when the measured oxygen concentration at the reactor outlet was equal to the value in the atmospheric air.
Commercial sheets of polyethylene (PE) and polypropylene (PP) made out of pure polymers with a thickness of 1 mm were used in the pyrolysis tests. Discs weighing approximately 20 mg were cut from the sheets. The density of PE was 0.94 g/cm3, and the density of PP was 0.90 g/cm3. The PerkinElmer 2400 Series II C/H/N analyzer was chosen to investigate the elemental composition of polyethylene and polypropylene. The CHN analysis of polyolefin samples showed that the C/H content in the polymers equals 85.5%wt./14.1%wt. and 85.6%wt./14.2%wt. for PE and PP, respectively. In this study, pure polyolefins were intentionally used. Experiments with pure samples are important in terms of reference points (benchmarks) and evaluating the effectiveness of various thermal recycling methods. Nitrogen Premium (with a purity of 99.995%) was purchased from Air Products (Allentown, PA, USA) and used as a fluidizing agent.

2.2. Methods

Thermogravimetric analysis of PP and PE samples was conducted on a TGA 8000 analyzer (by Perkin Elmer, Waltham, MA, USA) in a nitrogen atmosphere. The analysis of the chemical composition of gases produced in the polyolefin pyrolysis process was performed using the atmosFIR spectrometer (by ProteaTM, Middlewich, UK). Matlab® R2020b, Update 8 software was used for the deconvolution of pyrolysis gas FTIR spectra based on reference spectra provided by the FTIR analyzer manufacturer.

2.3. Experimental Procedure

The laboratory stand for the pyrolysis of polyolefins in multilayer fluidized beds is presented in Figure 2. A quartz reactor with an external diameter of 80.0 mm and a height of 500.0 mm was utilized in the research. The quartz tube was placed on a gas distributor, which was a perforated plate made out of stainless steel. The plate had evenly distributed holes with a diameter of 0.5 mm. Between the quartz tube and the nickel–chromium plate, serving as a gas distributor, a ring-shaped seal made of heat-resistant soft fibrous material was placed. The entire reactor was mounted on a frame, which allowed for the precise pressing of the quartz tube to the metal plate using pressure exerted by four springs pressing the upper, horizontal mounting plate, in which the upper part of the quartz tube was centrally mounted. To prevent micro gas leaks, the junction between the quartz tube and the sieve bottom was additionally sealed with a high-temperature silicone sealant. The temperature in the reactor was controlled by a thermocouple located 8 cm above the sieve bottom. The open-top design of the reactor allowed for the free dosing of polyolefin samples into the fluidized bed volume and the collection of gases for analysis. In the studies, samples of polyolefins were manually dosed into the reactor. Thanks to the open-top design of the reactor, with the use of special feeders, the risk of premature fuel degradation and nozzle clogging was avoided. The gaseous products were directed to a heated cell of the FTIR spectrometer with an optical path length of 4.2 m and a volume of 300 cm3. Gas samples from pyrolysis and infrared radiation were transmitted through the cell, allowing for the acquisition of interferograms using a Michelson interferometer. The interferograms were then transformed into IR absorption spectra of the gas mixture using Fourier transformation. During reactor operation, the spectra of the gases exiting the fluidized bed reactor were continuously monitored. The absence of an increase in absorbance in the range from 900 to 5000 cm−1 indicated the end of the gas emission and readiness to dose another sample (periodically dosing).
In this research, two types of multilayer fluidized beds, created from powders characterized by different densities (Table 1), were used.

3. Results

3.1. The Minimum Flduization Velocity of the Multialyer Fluidized Beds

The minimum fluidization velocities in the multilayer fluidized beds were determined according to the following steps [28]:
(a)
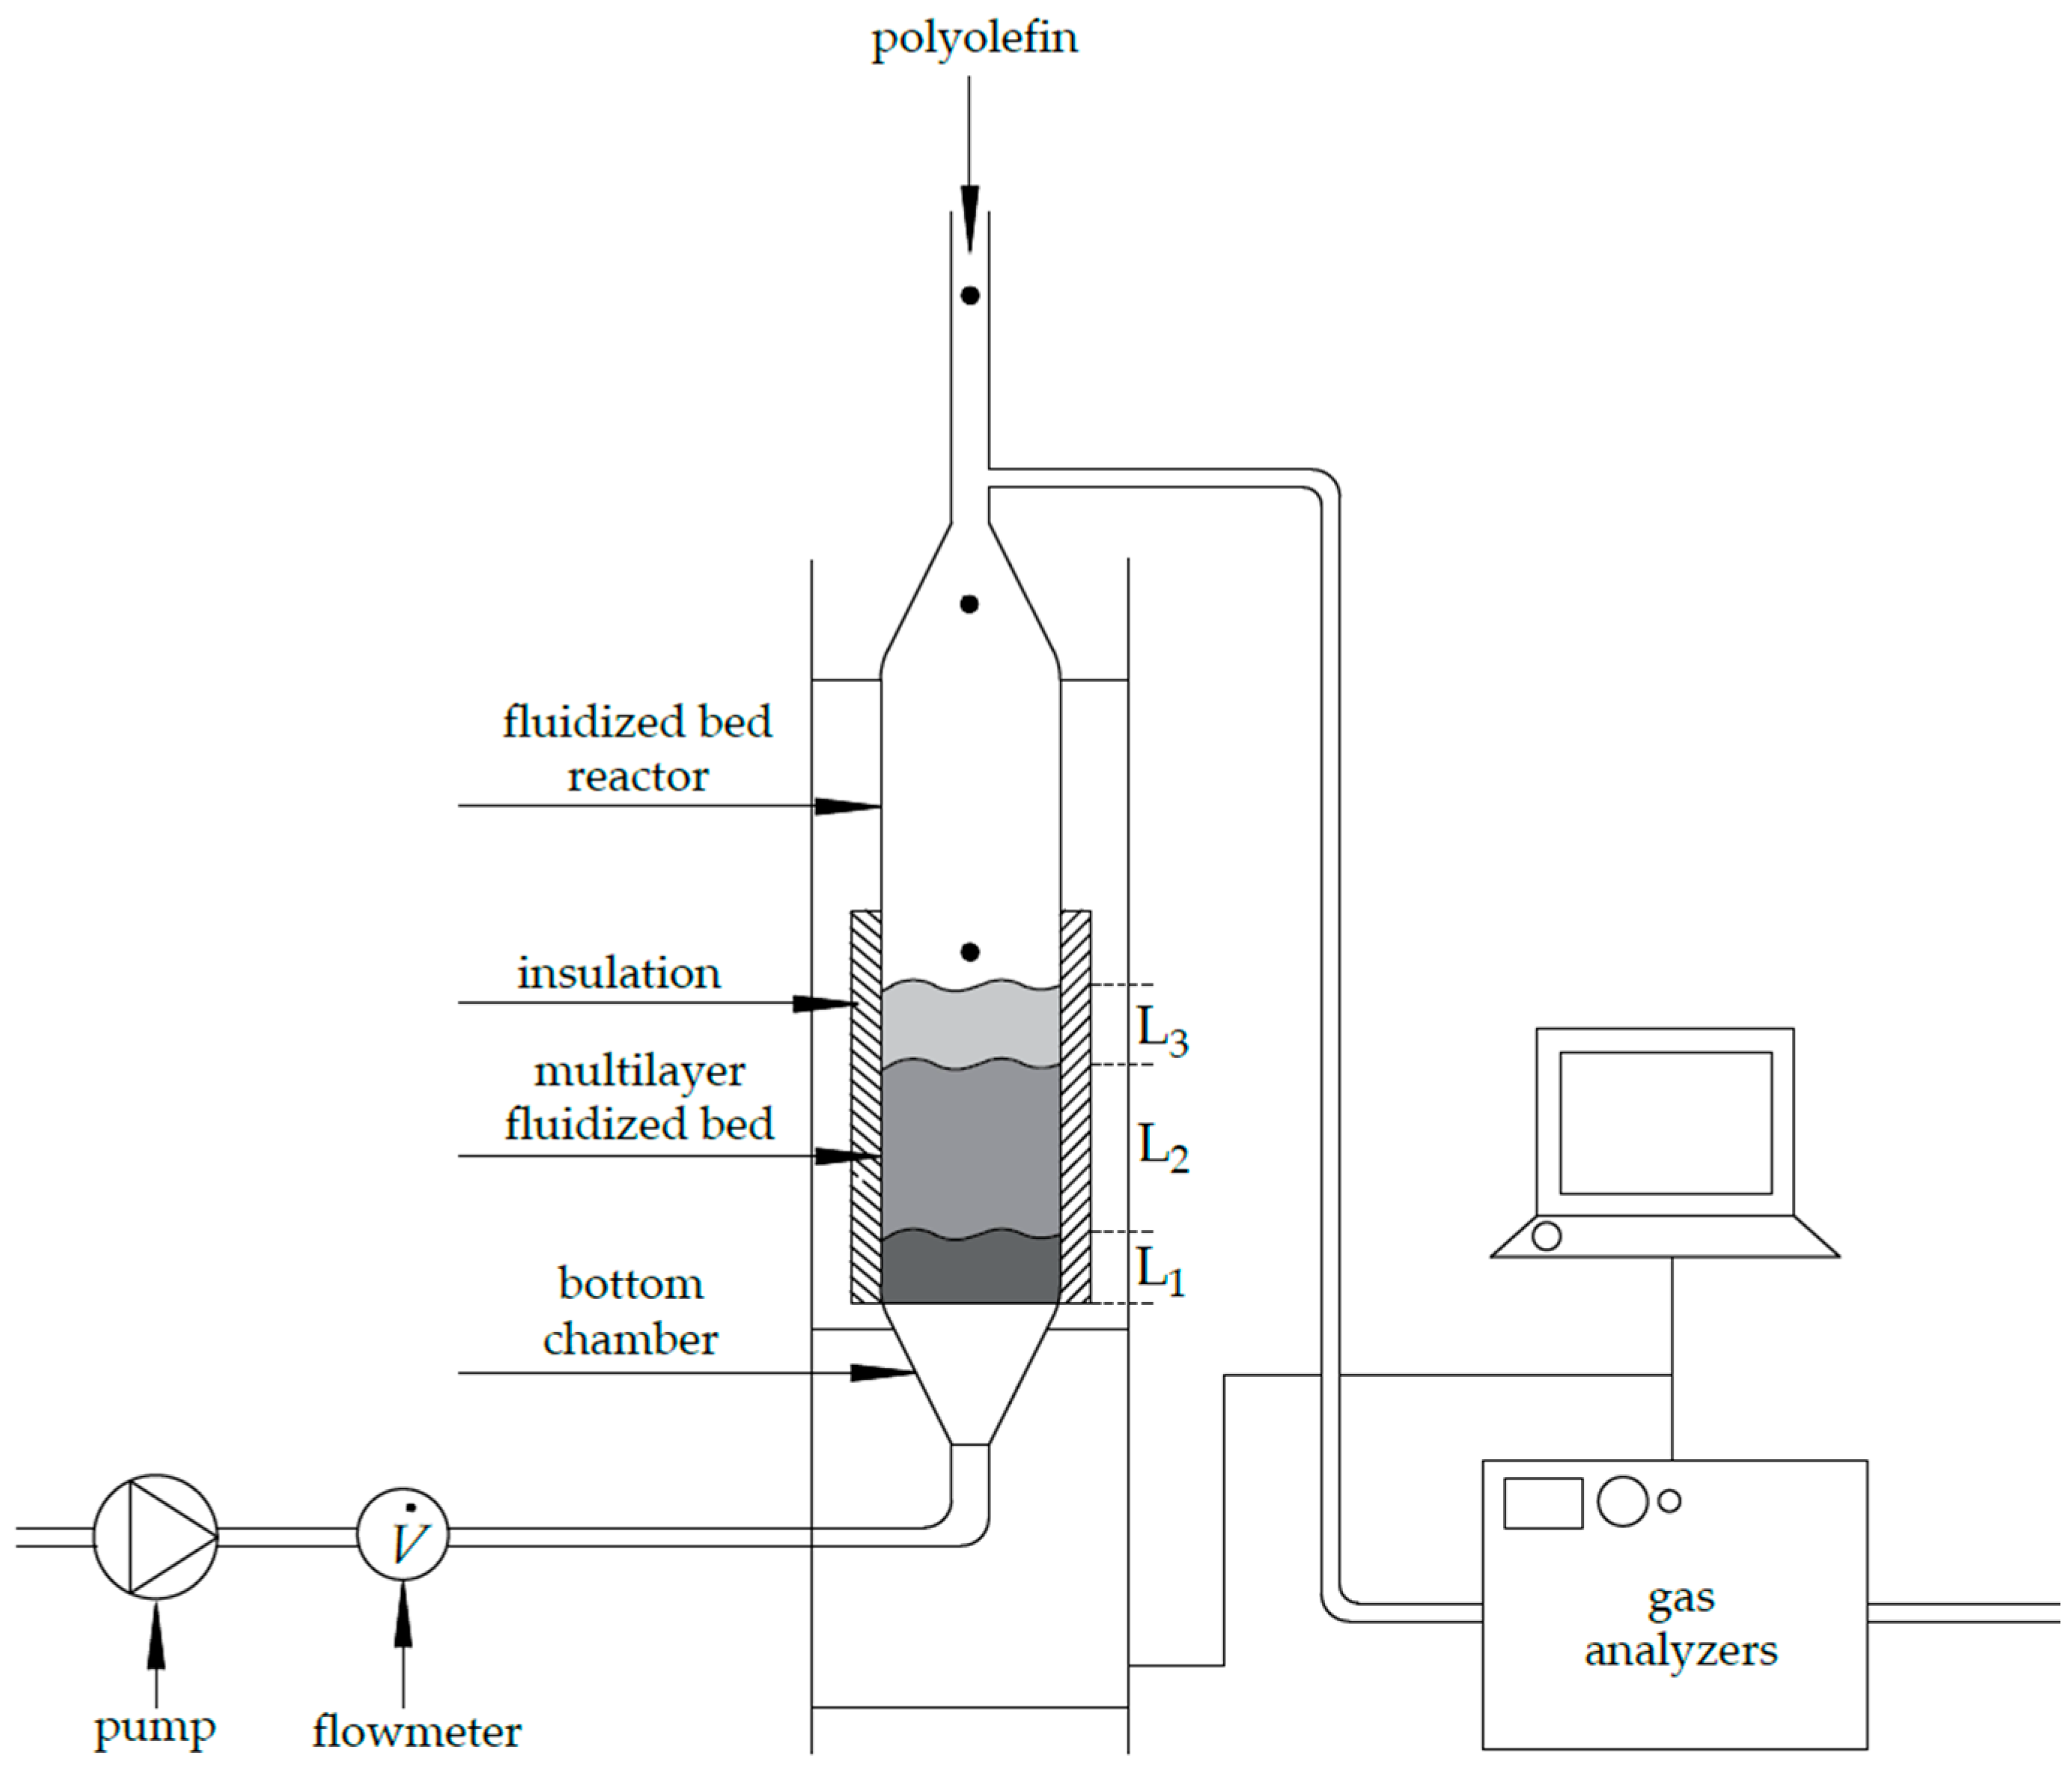
Initiating the data acquisition, starting the flow of nitrogen, and setting the flow regulator to the lowest possible value (to prevent powder grains from overflowing through the holes in the bottom sieve);
(b)
Placing the lower layer of the multilayer fluidized bed (quartz sand) into the reactor;
(c)
Placing the upper layer of the fluidized bed (cenospheres) into the reactor;
(d)
Gradually increasing the gas flow while recording the pressure drop in the fluidized bed at a given flow rate through the pressure drop sensor located in the bottom chamber;
(e)
Slowly reducing the gas flow to the minimum value (after achieving the fluidized state).
These steps allowed for the determination of the fluidization curves of the multilayer fluidized beds. Two inflection points were observed in the curves: the first point was at the gas surficial velocities of 0.81 cm/s (for raw cenospheres) and 0.83 cm/s (for modified cenospheres), which corresponds to the cenospheres’ minimum fluidization velocity obtained in the multilayer fluidized bed; the second point, at the gas surficial velocity of 2.60 cm/s, corresponds to the minimum fluidization velocity of quartz sand and determines the beginning of the fluidization of the lower layer of the multilayer bed, which is equivalent to reaching of the fluidized state of the entire multilayer fluidized bed. On this basis, it was assumed that the minimum fluidization velocity of the multilayer fluidized beds is determined based on the minimum fluidization velocity of the material with the highest density in the multilayer system.

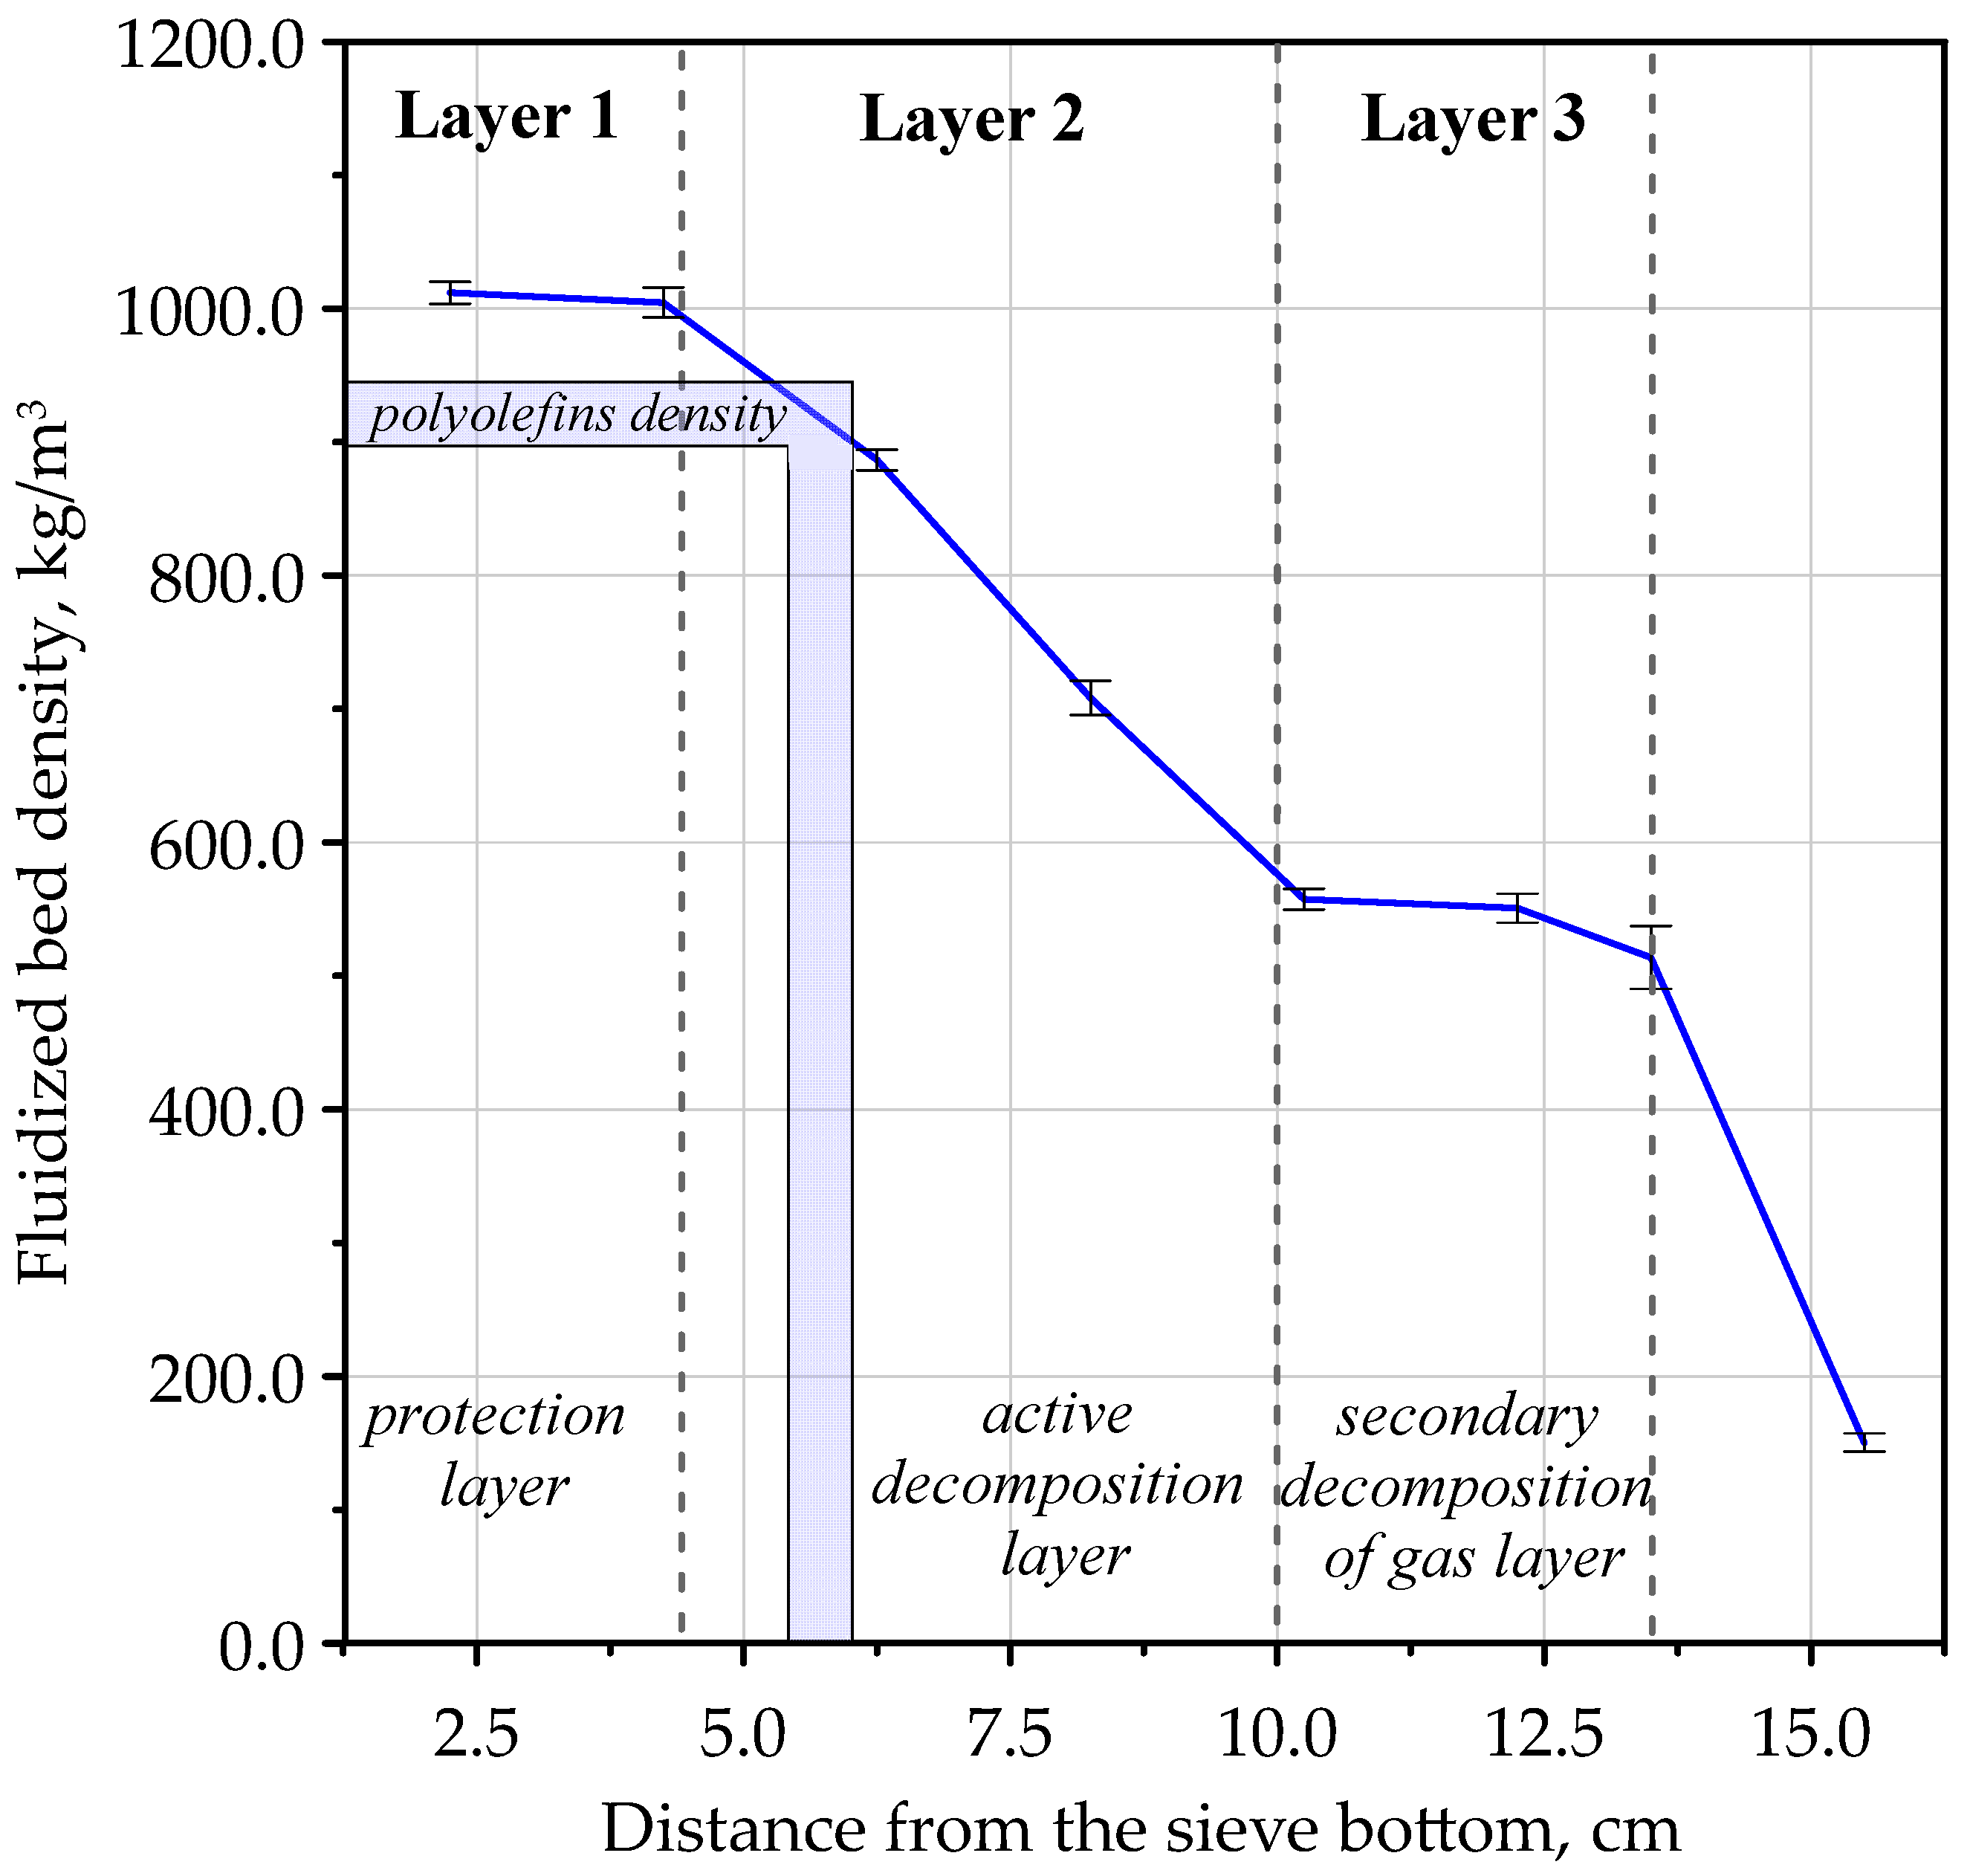
3.2. The Density Profile of the Multilayer Fluidized Beds

Figure 3 illustrates the density profile of a multilayer fluidized bed made out of raw cenospheres and quartz sand. The density profile was obtained by fluidizing the two-component FB with nitrogen at a flow rate 60% higher than the minimum fluidization velocity of quartz sand (i.e., the lowest layer); thus, u/umf, sand = 1.6. Due to the similarity of the fluidized beds made out of raw cenospheres and chemically modified cenospheres, the density profiles of both fluidized beds are equivalent.
Vertical density profiles in the multilayer fluidized beds were examined based on the pressure drop within the fluidized beds. To accomplish this, a measurement probe was constructed. The probe consisted of 6 differential pressure sensors connected to brass tubes forming the probe’s frame. The ends of the tubes were placed at various heights from each other, allowing for pressure drop measurements at different heights from the bottom sieve inside the fluidized beds. The experimental procedure for determining vertical density profiles in the multilayer fluidized beds was divided into several parts [28]:
(a)
Initiating the data acquisition and setting the nitrogen flow to the lowest possible value;
(b)
Placing of lower and upper layers of the multilayer fluidized bed into the reactor;
(c)
Adjusting the gas flow to achieve u/umf, sand = 1.6 and fluidizing the multilayer fluidized beds for 10 min to achieve the desired mixing;
(d)
Recording pressure drop values at different heights inside the fluidized bed, for 10 min, at a frequency of 10 Hz;
(e)
Slowly reducing the gas flow to the minimum value (after achieving the fluidized state).
The methodology for calculating the vertical density profiles in the multilayer fluidized beds involved determining the pressure drop values at different heights within the fluidized beds and then converting the pressure drop values into density values. The pressure in the pseudo-liquid layer of the fluidized bed is described by Equation (1):
Δp = g · h · ρ.
After introducing the differential form and making minor algebraic transformations, the formula for density calculation is obtained in the form of Equation (2):
ρ(h) = [g−1 · dp(h)] · dh−1,
where:
  • ρ(h)—fluidized bed density at height h [kg/m3];
  • dp(h)—change of differential pressure in the fluidized bed at height h [Pa];
  • dh—height difference between two heights in the fluidized bed [m].
The density profile consists of three characteristic regions representing individual layers in the multilayer fluidized bed. The first layer (L1) is located at the bottom of the FB and extends up to 4.5 cm above the gas distributor. The density of the layer remains constant at 1008.2 ± 2.6 kg/m3, indicating that L1 is primarily composed of quartz sand grains (sand bulk density: approx. 1300 kg/m3) with a small contribution from the cenospheres. Layer L1 serves as a protection against the contact of pyrolyzed polymer (density: approx. 920 kg/m3) with the bottom sieve, continually cooled by the cold fluidizing gas. Layer L2 (above L1) is characterized by a linear decrease in density from 1004.5 kg/m3 to 557.4 kg/m3 as raised from the bottom sieve. Layer L2 is located between 4.5 and 10 cm above the gas distributor and represents the region where pyrolysis of polyolefins occurs. In layer L2, the mixing of cenospheres and sand also takes place, ensuring that it is composed of grains of both powders. Layer L3 (above L2) exhibits a relatively constant density of 540.7 ± 19.1 kg/m3, indicating that it mainly consists of cenospheres grains (cenospheres bulk density: approx. 450 kg/m3) with a small contribution from quartz sand. Layer L3 is situated between 10 and 13.5 cm above the gas distributor and is referred to as the zone of additional decomposition processes as the decomposition of gas bubbles formed from polyolefin pyrolysis in layer L2 occurs in layer L3. The rare zone, which is located above the L3 layer, is characterized by a low presence of solid particles. In the rare zone, free spaces between grains predominate, resulting in low-density values reaching below 200 kg/m3.
The selected masses of the two materials in the multilayer fluidized bed and the applied ratio of u/umf, sand allowed for the creation of a variable vertical density profile in the FB. The variable density provides space for the pyrolysis of lightweight polyolefins inside the fluidized bed. Polyethylene and polypropylene samples were characterized by densities higher than the density of layer L3. This allows for polyolefin particles to immerse into the FB to a height corresponding to their density. It also protects against fuel processing in the freeboard, which means that the advantages of fluidization are fully utilized. A space in layer L2, located approximately 5 to 6 cm above the gas distributor, was characterized by density matching the density of polyolefins. According to Archimedes’ principle, this space is where the buoyancy force balances the gravitational force acting on the pyrolyzed material particles, keeping particles in that zone. It is the preferred zone where the pyrolysis processes of PE and PP occur.

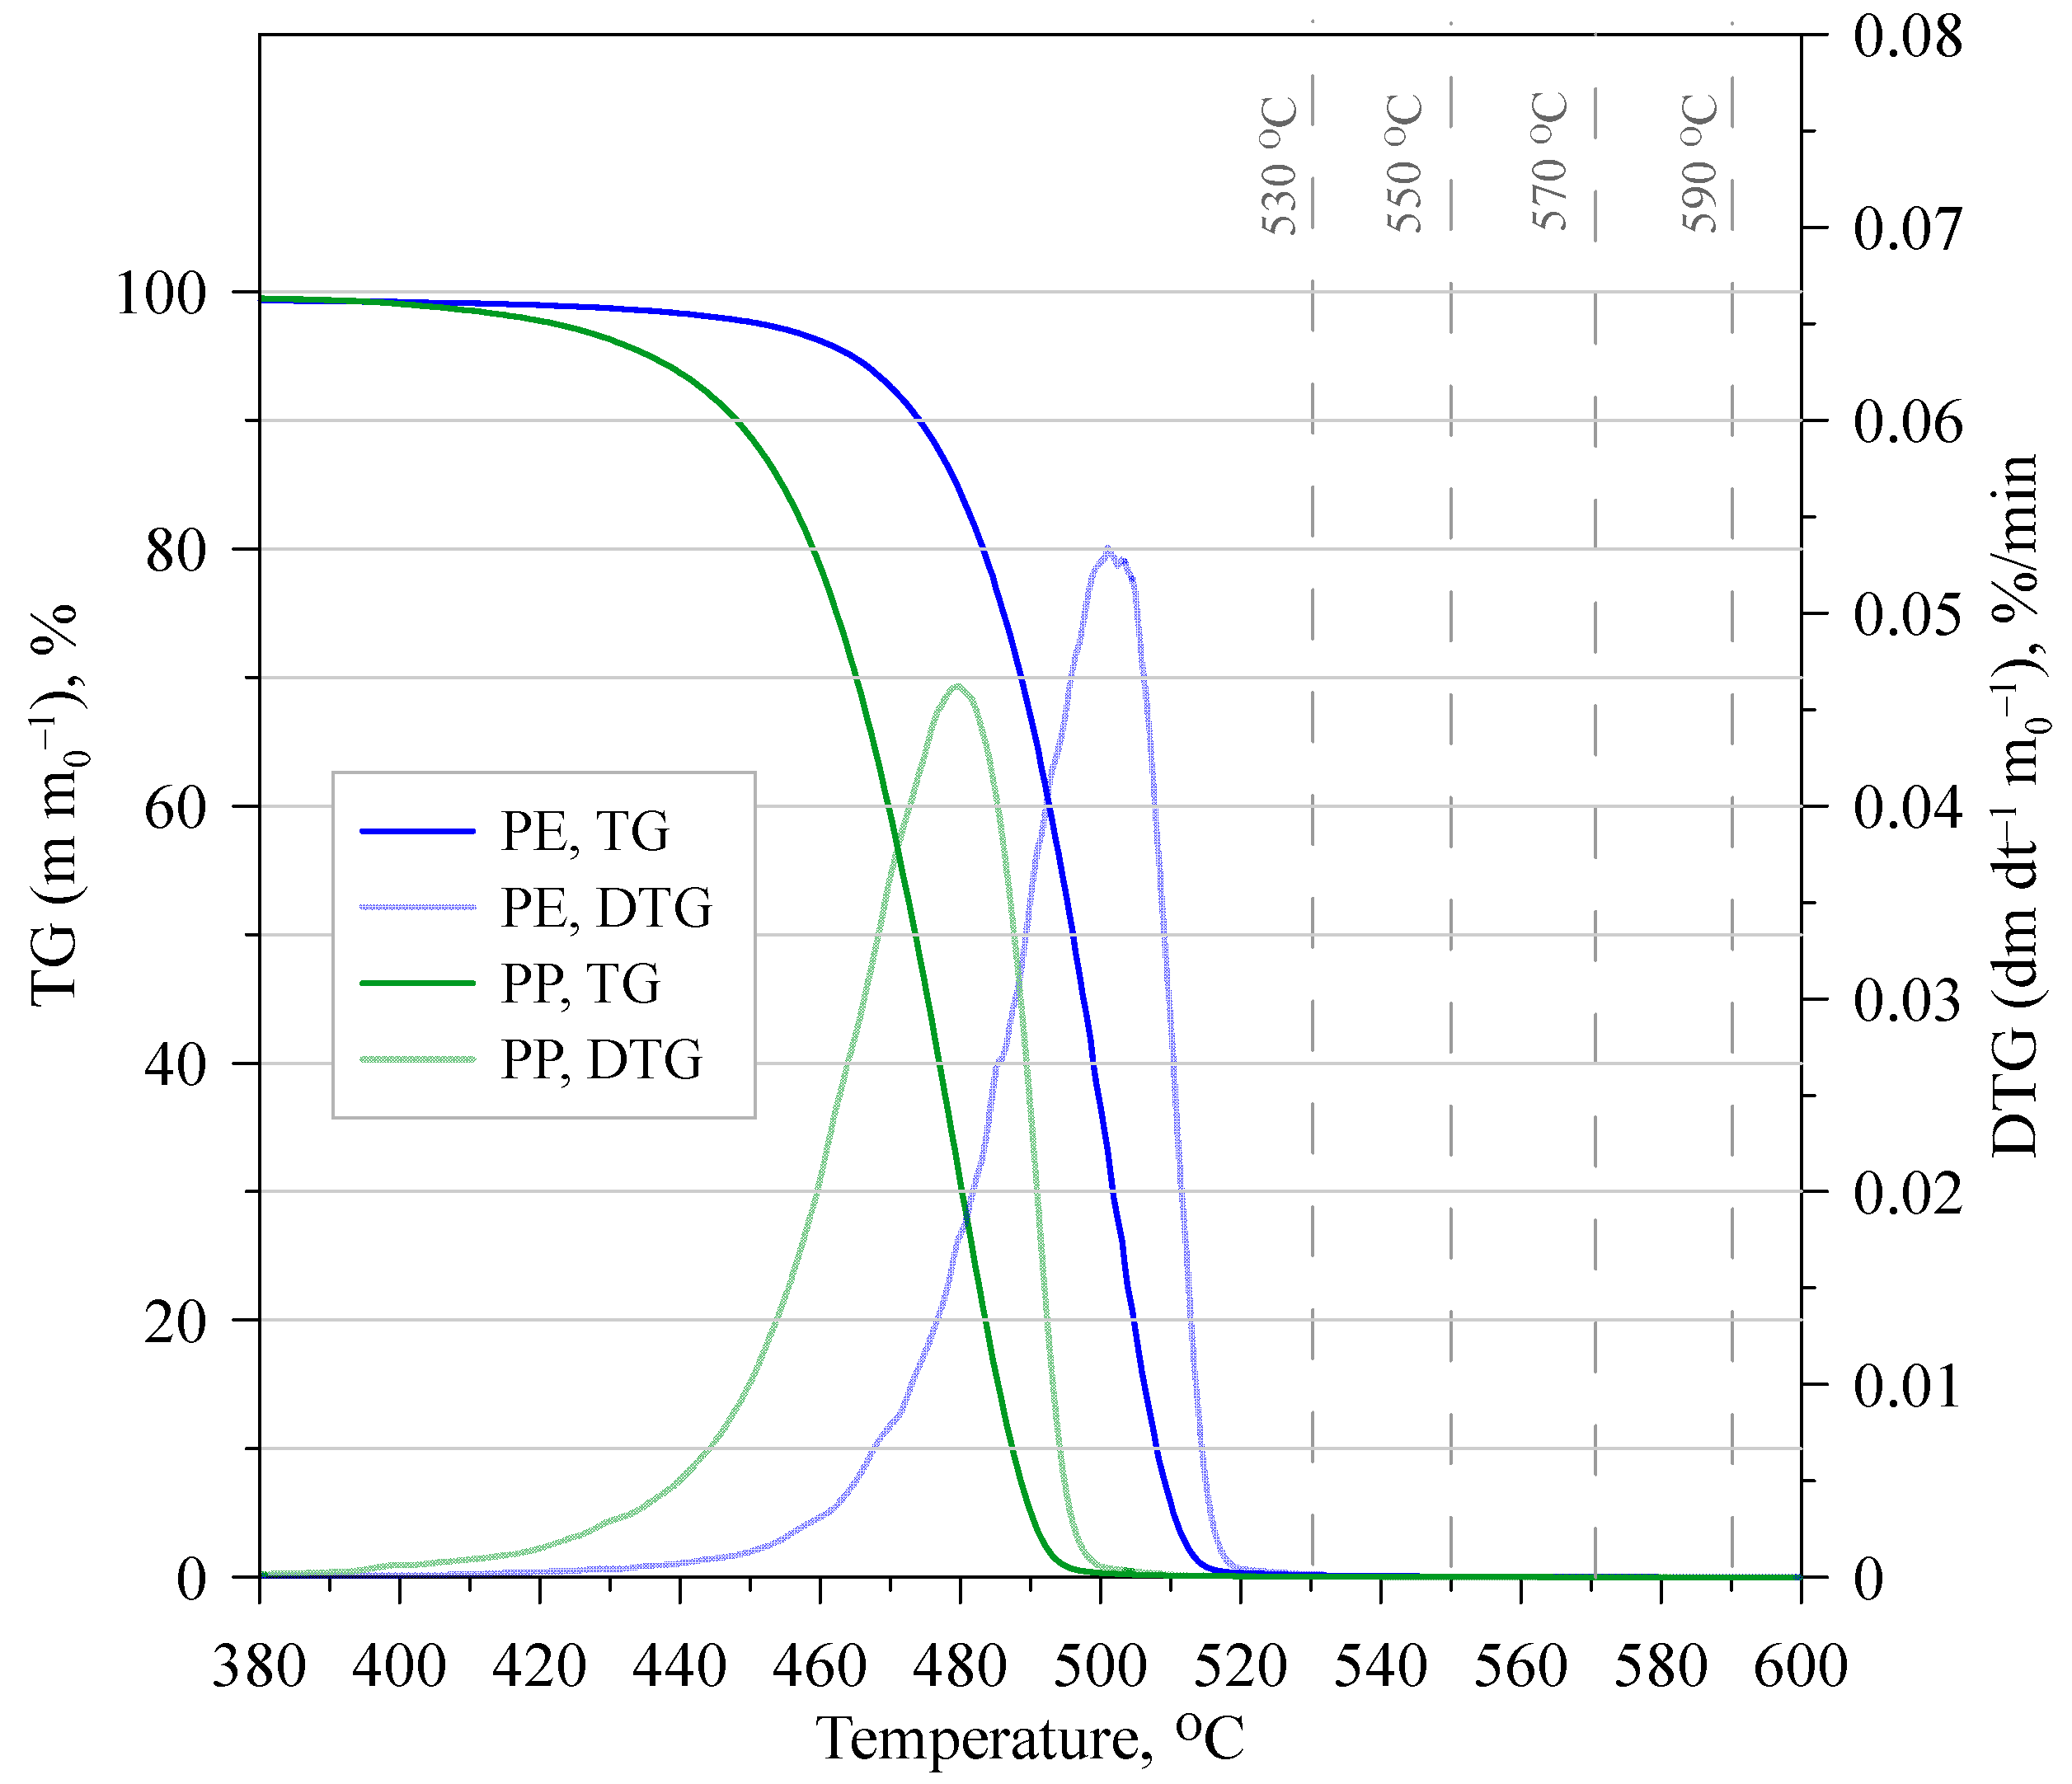
3.3. Polyolefin Thermogravimetric Analysis

Thermogravimetric analysis of PP and PE was conducted in a nitrogen atmosphere with a gas flow rate of 60 mL/min and a heating rate of 100 °C/min. Samples weighing 5.0 mg were used in the experiments. The purpose of the analysis was to determine the lower limit of the temperature range for conducting the pyrolysis in the fluidized bed reactor. During the fluidized pyrolysis, where samples experience rapid heating upon contact with the hot fluidized bed material, a relatively fast heating rate was chosen for the TG analysis. The thermogram (TG) and differential thermogram (DTG) of PP and PE samples are presented in Figure 4. It was observed that the initial decomposition temperature corresponding to 1% decomposition of PP and PE was 400 °C. It was also noted that the final decomposition temperature corresponding to 99% decomposition was 495 °C for PP and 515 °C for PE. Based on the obtained curves, four fluidized bed process temperatures for PE and PP were selected, all above the maximum decomposition temperature of the samples, to ensure an efficient degradation. Temperatures ranging from 530 °C to 590 °C were chosen at 20 °C intervals and are marked on the graph with vertical dashed lines.

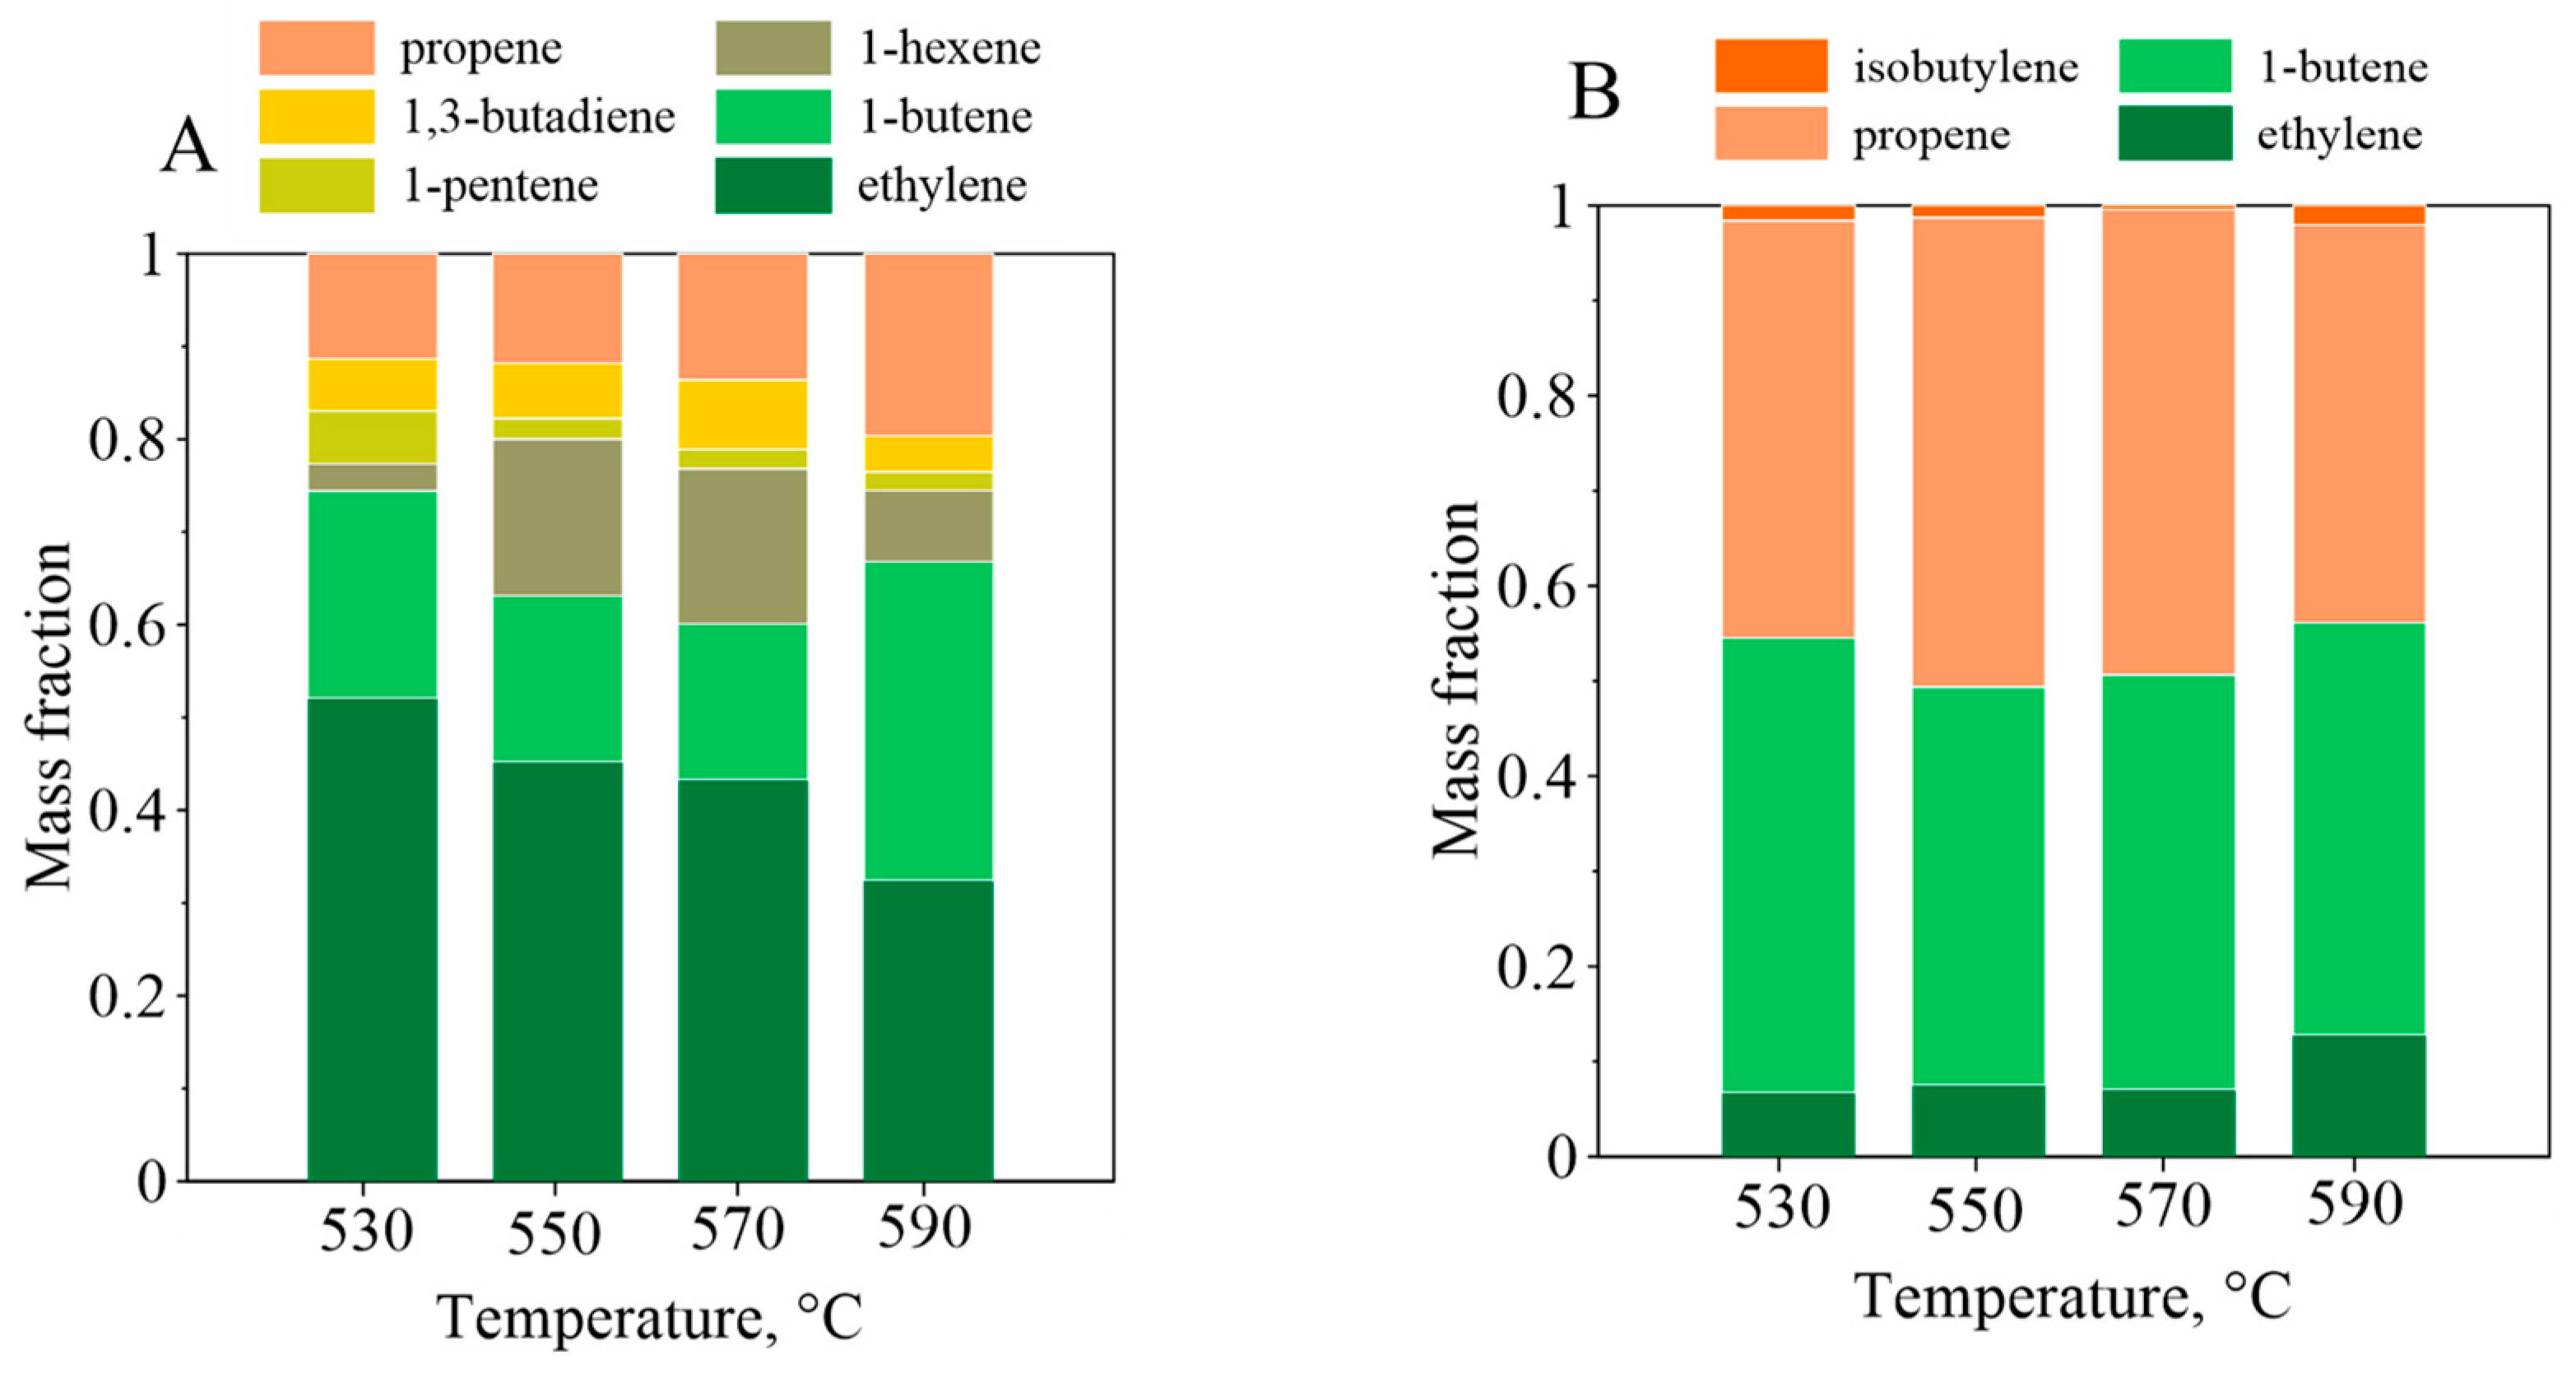
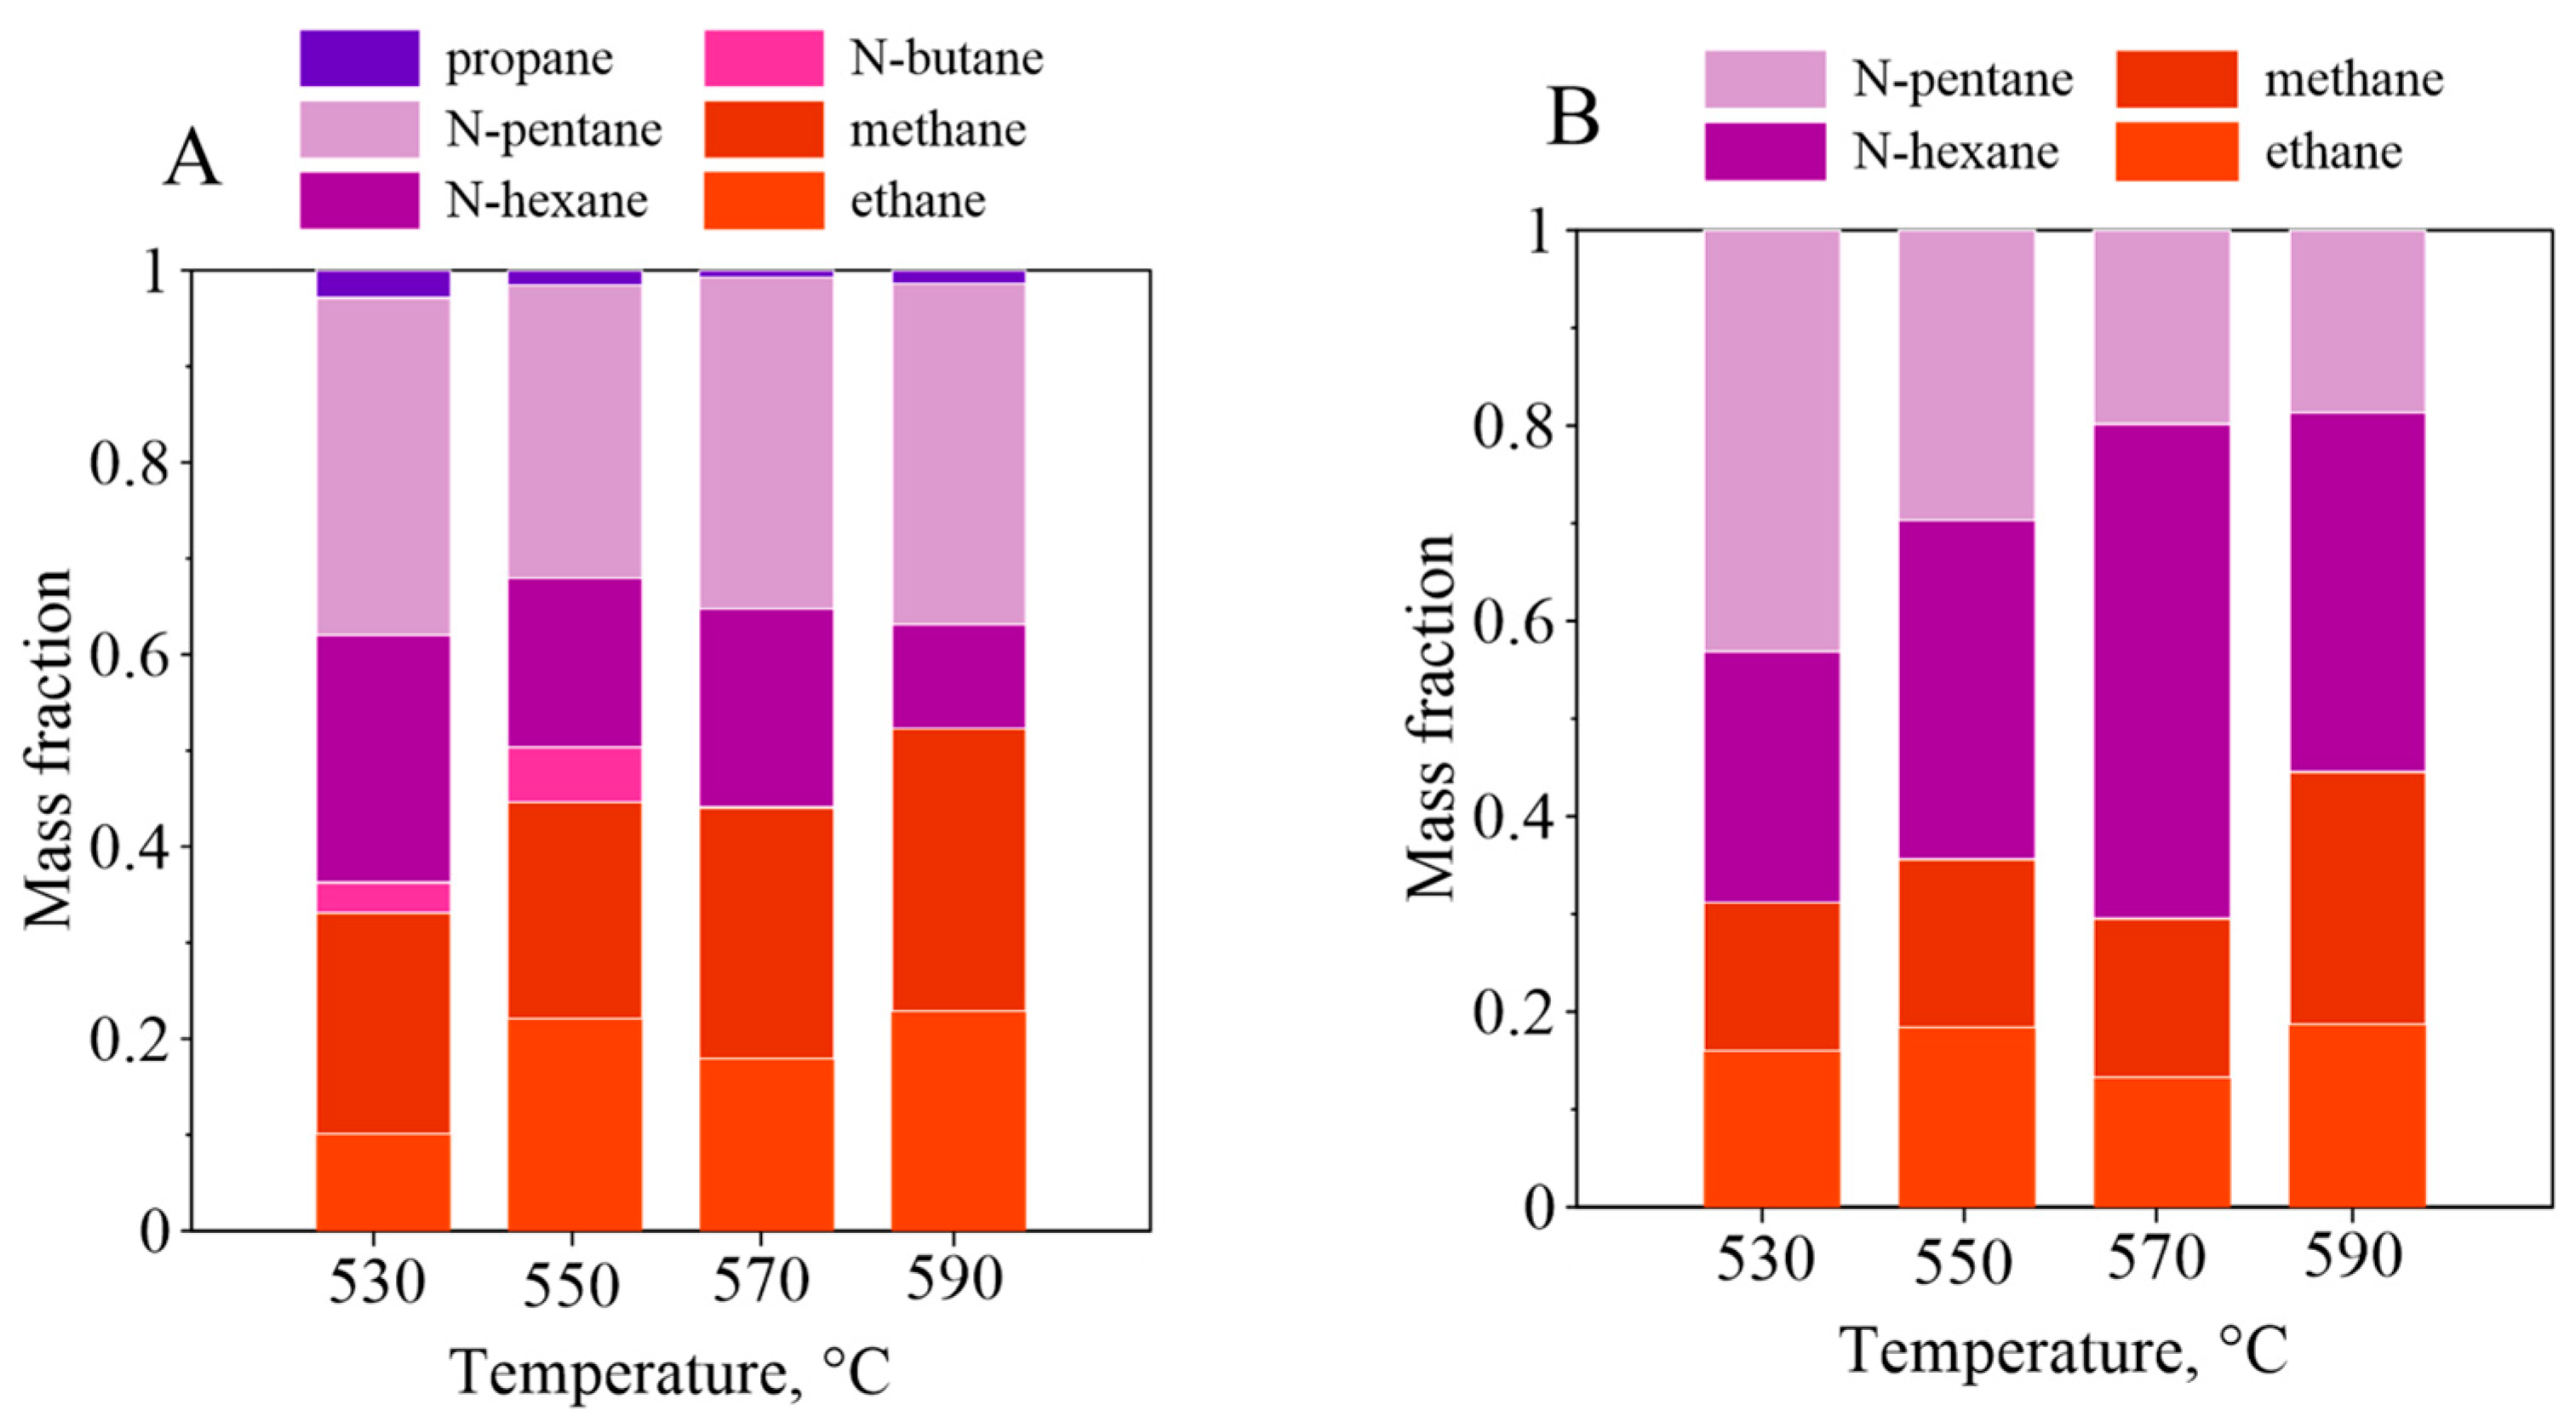
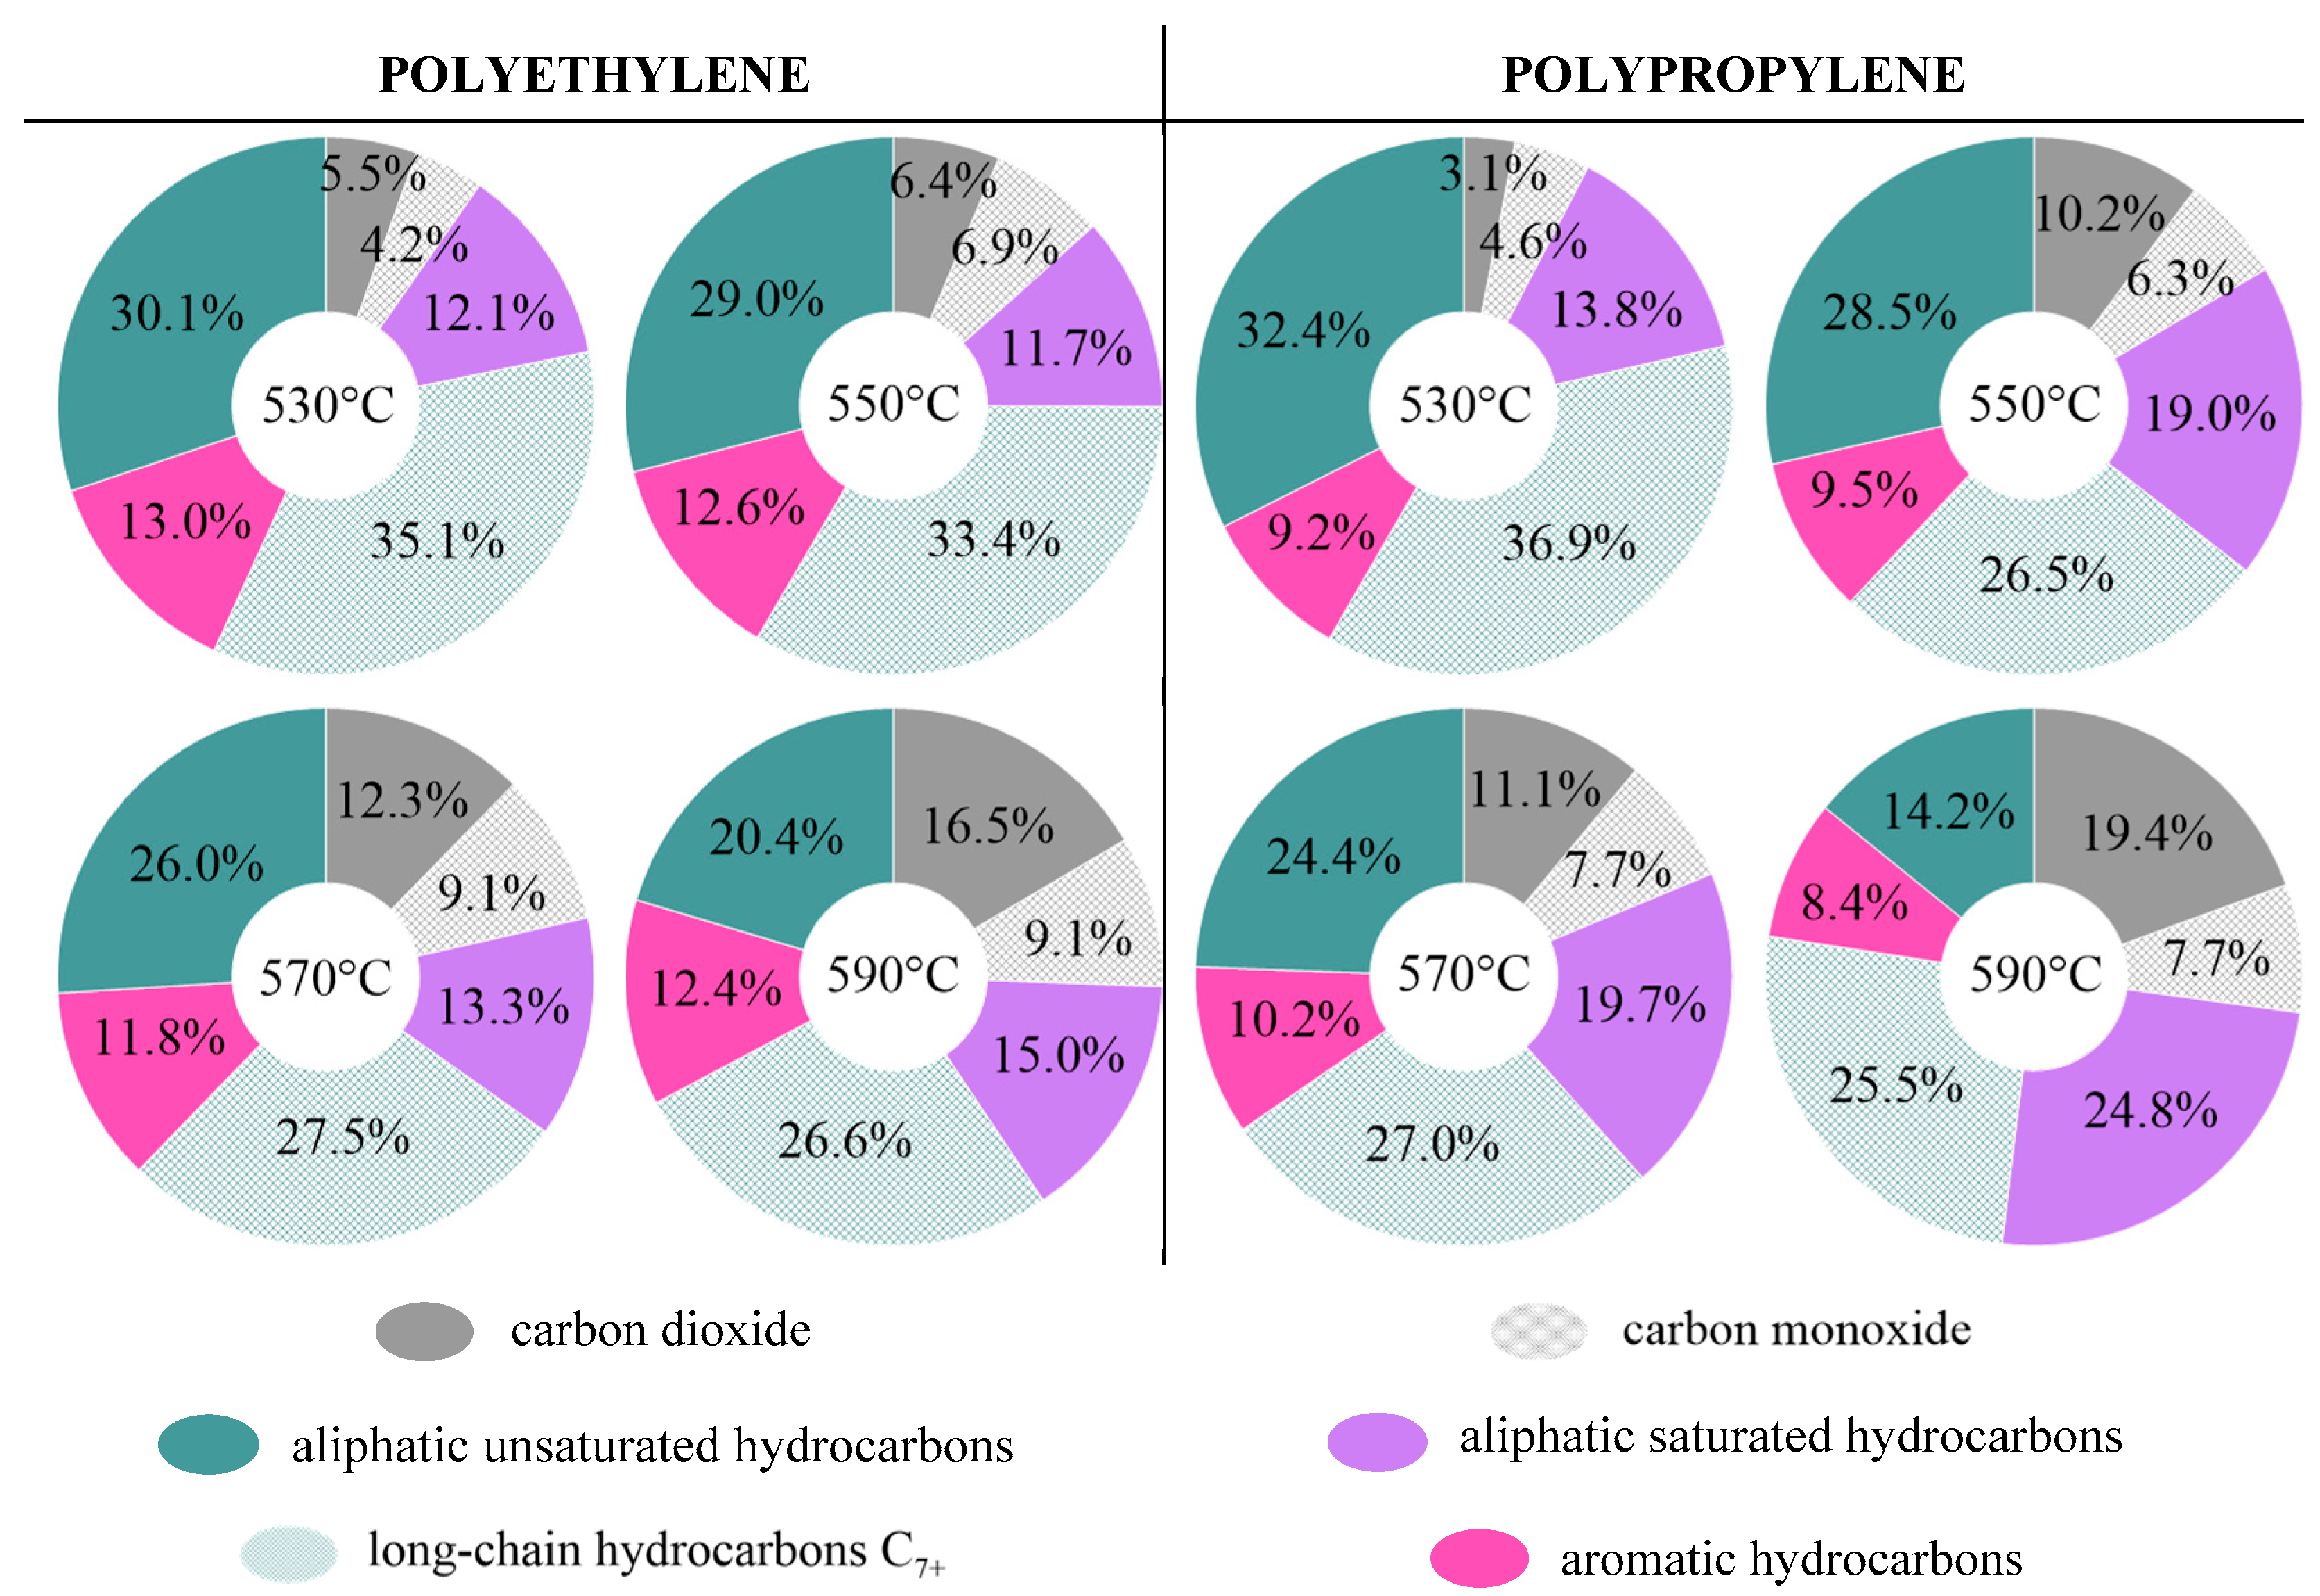
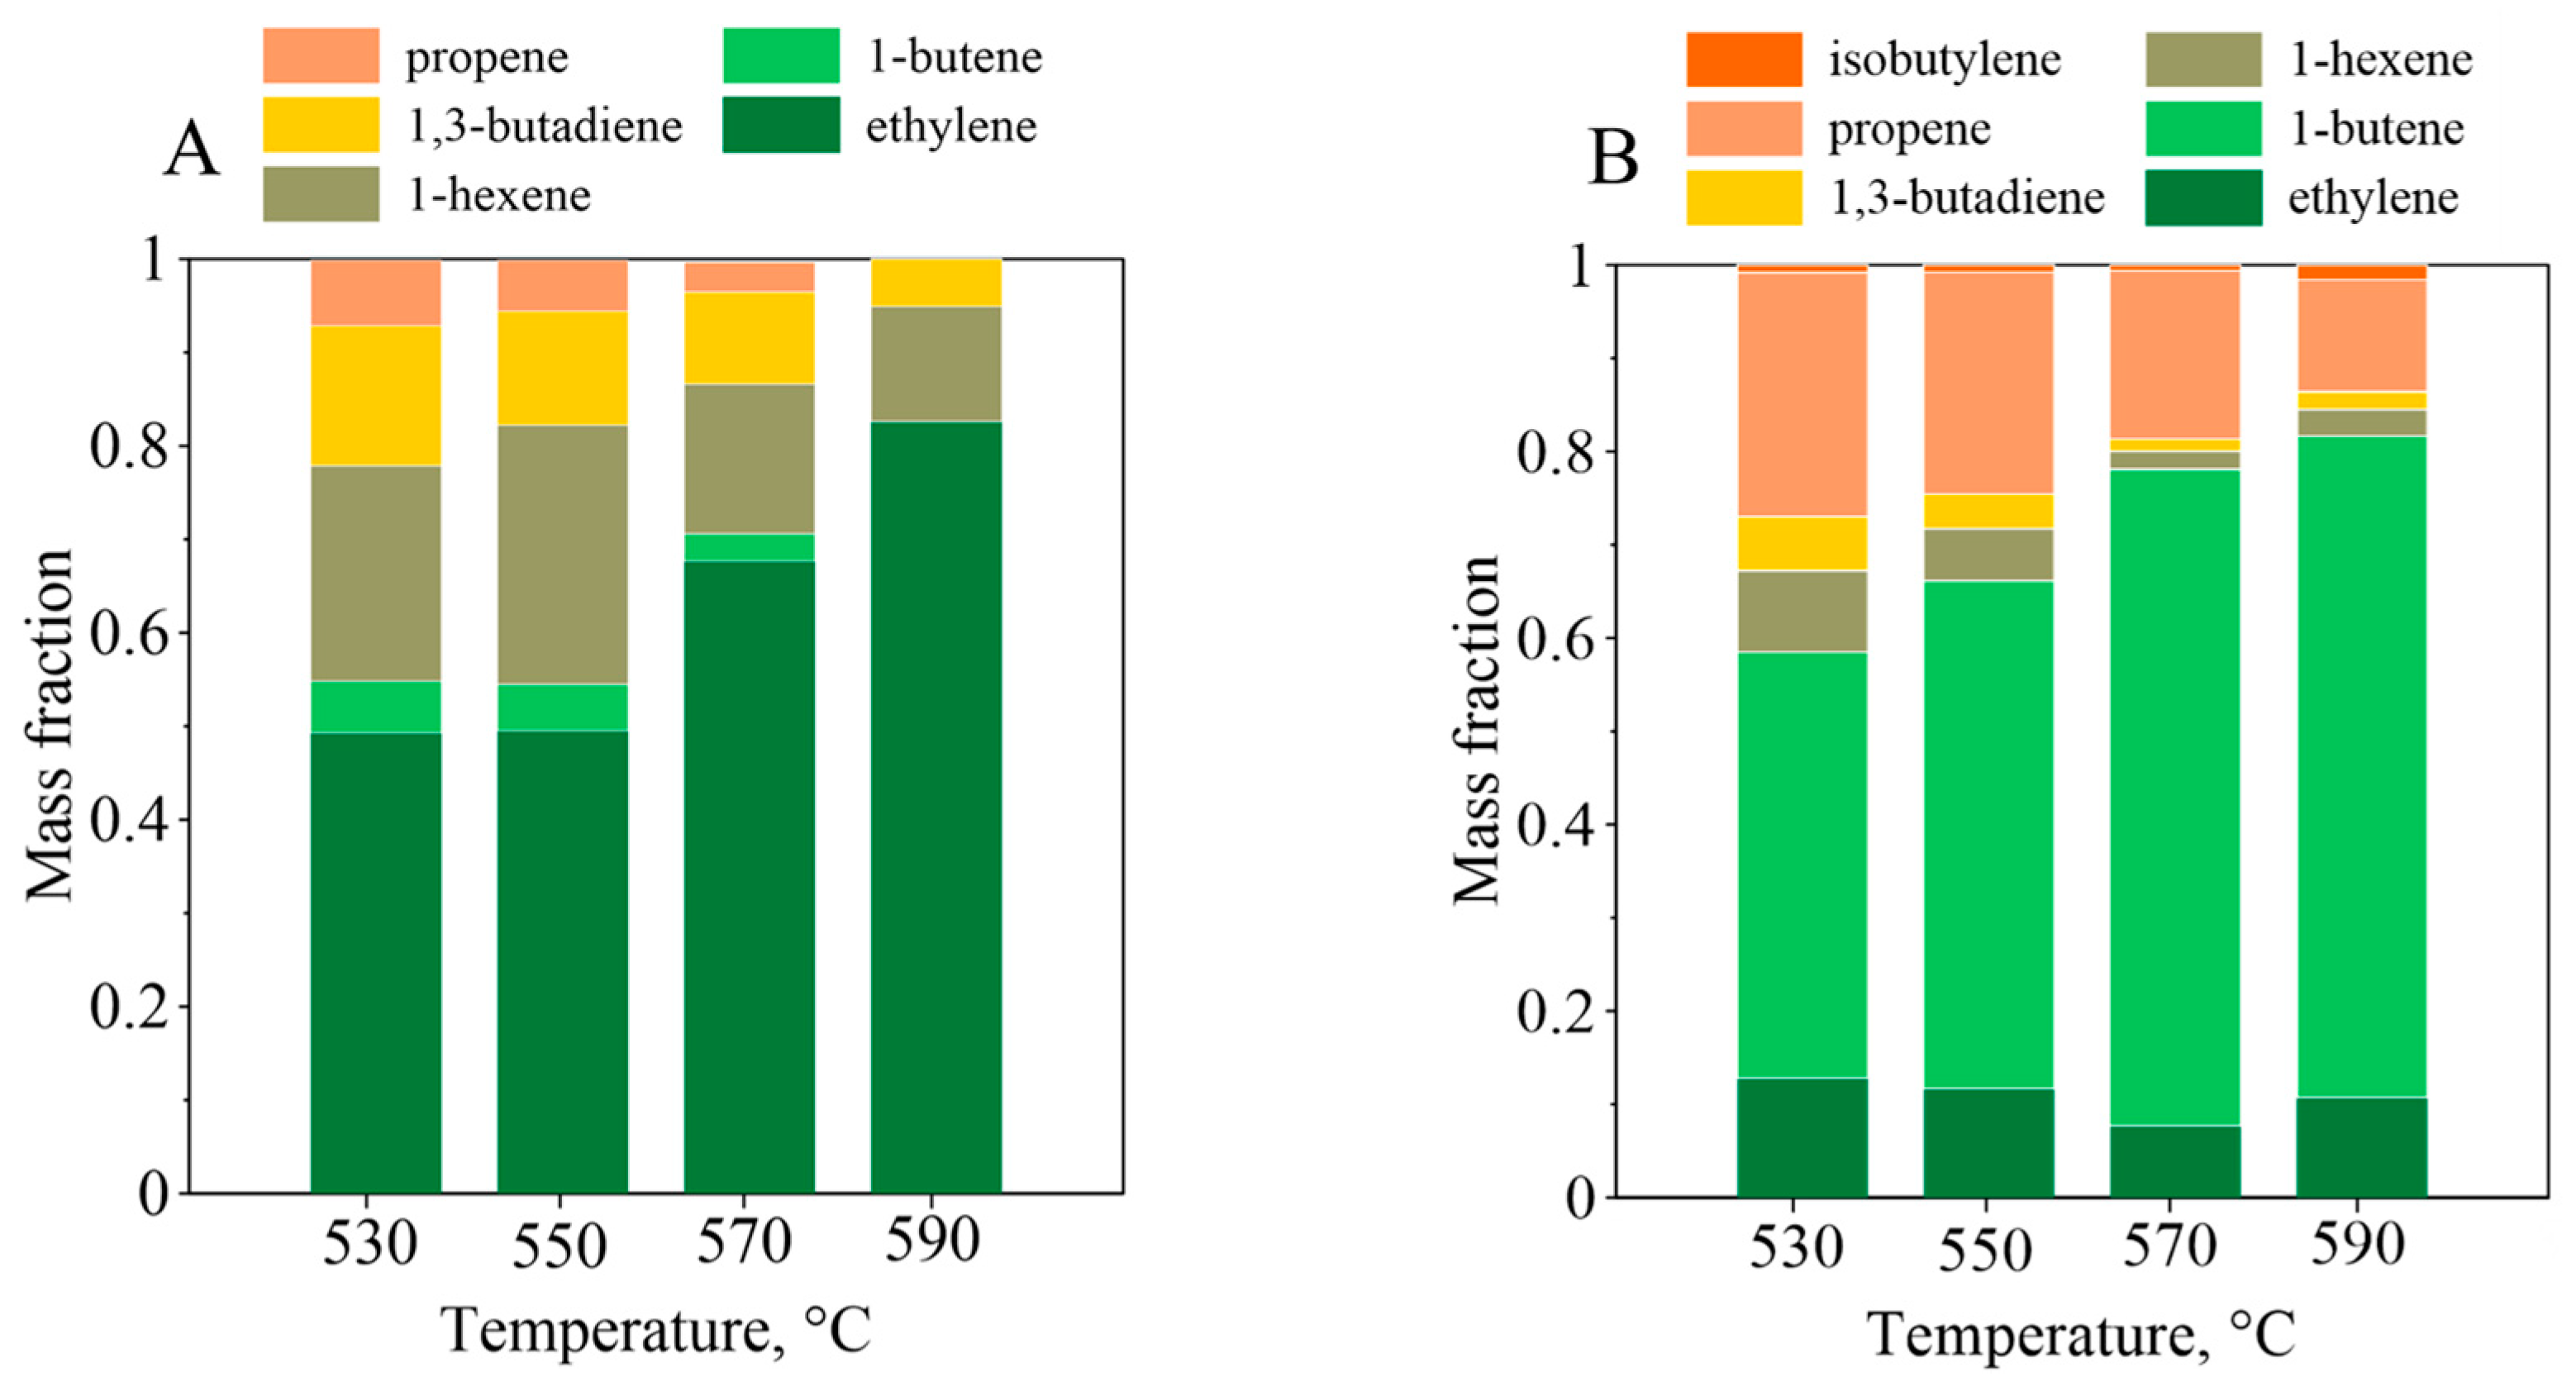
3.4. Polyolefin Pyrolysis in the Fluidized Beds

As the temperature of the process changes, the chemical parameters of fluids, such as density and viscosity, change. The minimum fluidization velocities of the multilayer fluidized beds were additionally calculated in the process temperatures. In Table 2, the umf values of the multilayer fluidizeds bed at temperatures of 530, 550, 570, and 590 °C based on the Grace correlation are presented with the nitrogen velocities used in the experiments. Due to our assumption that the minimum fluidization velocity of the multilayer fluidized bed is equal to the heaviest component, umf values were calculated for quartz sand.
During the pyrolysis of polyolefins, FTIR spectra of gaseous products were recorded every 20 s. The registered spectra represented the sum of the absorbance of optically active compounds in the gaseous mixture. Based on a set of spectra provided by the FTIR analyzer manufacturer, a deconvolution of the data was performed. The procedure of minimizing the sum of squares of differences between the sample spectrum and the sum of reference spectra with known concentrations was used. The original program written in MATLAB® was used in the deconvolution using the method described in [29]. An example of a recorded spectrum of the gas mixture produced during the pyrolysis of PE in the multilayer fluidized bed made out of raw cenospheres and quartz sand at 550 °C is shown in Figure 5 as a gray line. Two specific regions suitable for deconvolution and concentration calculations were selected from the spectrum. In the analysis, wavelength ranges where no optical activity of components was observed were excluded, as well as regions where intense signals from water vapor were detected (water vapor was analyzed in a narrower wavelength range from 1250 to 1400 cm1). The calculated spectrum (blue line) was overlaid on the sample spectrum, achieving very good agreement between the two spectra.
Figure 6 presents the deconvolution of the PE spectrum divided into regions I and region II. In region I, the strongest signal at a wavenumber of 950 cm1 is attributed to the presence of ethylene in the product’s mixture [30]. The peak at 909 cm1 is characteristic of 1,3-butadiene and arises from the rotational fine structure in the molecule of the diene [31]. Another absorption peak in region I, at a wavenumber of 911 cm1, is characteristic of 1-butene and propylene [32]. The absorption bands of these compounds are associated with vibrations in the methylene group, typical for hydrocarbon molecules. Methane was also identified in region I through its characteristic spectrum structure, with a peak at a wavenumber of 1305 cm1 [33]. In the sample spectrum, characteristic signals stretching in the wavenumber range of 1400–2000 cm1 were attributed to the presence of water vapor [34].
In region II, selected for analysis (2750–3250 cm1), many organic compounds exhibit optical activity. One of the most characteristic absorption bands in this range is attributed to methane. The CH4 band, in the form of densely spaced signals (comb structure), extends in the wavenumber range of 2800–3200 cm1, with the strongest signal at a wavenumber of 3018 cm1, corresponding to the stretching vibrations of C-H bonds [35]. Other components of the comb structure appeared on both sides of the maximum, including at 3086 cm1. Additionally, other alkanes and alkenes were optically active in the wavenumber range of 2700–3200 cm1. Due to the stoichiometry of polyolefins, the products of the process were dominated by unsaturated aliphatic hydrocarbons. Ethylene, previously identified at 950 cm1, also exhibited a distinct peak at 2989 cm1 and a series of narrow peaks at 3062 and 3132 cm1, attributed to the bending vibrations of carbon–hydrogen bonds [30]. In the studied range, propene’s spectrum appeared as a broad band with a sharp signal at 2953 cm1. The infrared spectra of aliphatic hydrocarbons with five or more carbon atoms are characterized by a broad, triple band between 2850 and 3100 cm1. Aromatic compounds in the wavenumber range of 3000–3150 cm1 show optical activity due to the stretching vibrations of =C–H bonds. The possibility of benzene formation seems likely due to the high temperature and hydrogen deficiency in the process [36].
The preliminary spectrum analysis showed various chemical compounds in the product mixtures, such as benzene, ethylene propylene, ethane, 1-butene, 1-hexene, 1-pentene, 1,3-butadiene, methane, N-butane, N-hexane, N-pentane, propane, and also water. Software developed in MATLAB® was used for the spectrum deconvolution of the samples. Minimization of the objective function, defined based on the least squares method, allows for the determination of a calculated spectrum that closely approximates the sample spectrum using reference spectra and known concentrations. Through iterative calculations, a series of coefficients were obtained. The compound concentrations were calculated based on the obtained coefficients and concentrations of reference standards.
In Figure 7, the conversions of polyolefins into different product groups (aliphatic unsaturated hydrocarbons, aliphatic saturated hydrocarbons, and aromatic hydrocarbons) during pyrolysis in the multilayer fluidized bed made out of raw cenospheres and quartz sand are presented.
Within the aromatic hydrocarbons, only benzene was detected, with an average content of 4.6 ± 1.1%wt. in the case of PE pyrolysis and 5.7 ± 0.5%wt. in the case of PP pyrolysis. These values are similar to those reported by some literature sources [37,38]. Aliphatic hydrocarbons analyzed by the FTIR spectrometer were characterized by up to six carbon atoms per molecule. Long-chain products were not analyzed using FTIR spectroscopy because this fraction was condensed before flue gases were introduced into the cuvette of the FTIR spectrometer to avoid contamination of its mirrors. However, their presence was calculated by the carbon balance (see Figure 7). The carbon conversion to C7+ products averaged 27.3–33.2%wt. in the case of PE and 20.6–22.6%wt. in the case of PP. The literature also suggests the presence of liquid (and solid under non-FB conditions) long-chain polyolefins pyrolysis products [39,40]. Additionally, the visual observation of tubes directing the gases to the analyzer proved that liquid process products were condensed.
As can be seen in Figure 7, the average conversion of carbon from polyethylene and polypropylene to aliphatic unsaturated hydrocarbons was 53.0 ± 1.6%wt. and 55.0 ± 0.7%wt. respectively. Alongside the aliphatic unsaturated hydrocarbons, saturated aliphatic hydrocarbons were identified in the gas mixtures. The carbon conversion from polyethylene to saturated compounds was approximately 13.8 ± 0.8%wt., and it was 17.8 ± 1.2%wt. in the case of polypropylene.
As can be seen in Figure 8, in the case of polyethylene pyrolysis, ethylene was the main component of the aliphatic unsaturated hydrocarbons fraction, decreasing from 52.1% at 530 °C to 32.4% at 590 °C. Additionally, 1-butene constituted an average of 22.9 ± 6.9% in the abovementioned fraction. At temperatures of 550 °C and 570 °C, a significant part of the unsaturated fraction was 1-hexene, with a value of approximately 16%. The content of other aliphatic unsaturated hydrocarbons in the mixture, namely, propene, 1,3-butadiene, and 1-pentene, was significantly lower, totaling approximately 25% of the entire fraction.
Pyrolysis of polypropylene in the multilayer fluidized bed made out of raw cenospheres and quartz sand led to the recovery of a monomer with an average content of 46.0 ± 3.2% in the aliphatic unsaturated hydrocarbon fraction. Similar to polyethylene, a relatively high conversion of polymeric carbon to 1-butene was observed during PP pyrolysis, reaching an average value of 44.1 ± 2.2% of the abovementioned fraction. The content of other aliphatic unsaturated hydrocarbons, such as ethylene and isobutylene, was low and amounted to about 10%.
Within saturated aliphatic hydrocarbons, methane, ethane, and other aliphatic hydrocarbons such as propane, N-butane, N-pentane, and N-hexane were detected (see Figure 9). In the degradation products, N-hexane and N-pentane were identified in the highest concentration, and in the case of PE pyrolysis, constituted 52.6 ± 5.8% of the aliphatic saturated fraction and 64.8 ± 5.7% in the case of PP degradation.
Figure 10, Figure 11 and Figure 12 present the conversions of polyolefins into product groups (aliphatic saturated hydrocarbons, aliphatic unsaturated hydrocarbons, aromatic hydrocarbons) and individual compounds during pyrolysis conducted in the fluidized bed made out of modified cenospheres and quartz sand. The pyrolysis process of polyolefins differed when using cenospheres coated with the iron oxide layer to form the fluidized bed. This variation was explored because d-block metal oxides can catalytically influence degradation processes, and iron oxides are one of the most low-cost materials easily applied to raw cenospheres [41,42]. Additionally, iron oxides can be the source of oxygen, which can lead to a change in the composition of the degradation gaseous products.
Both effects were observed during experiments; catalytic effects were observed due to the presence of a micrometric layer of iron oxides applied to the cenospheres particles in the multilayer fluidized bed, and CO/CO2 were identified among the pyrolysis products. The conversion of polymeric carbon to carbon dioxide and carbon monoxide increased with temperature, with CO2 exhibiting a faster growth rate. In the pyrolysis products of polyethylene, the conversion of carbon to CO2 increased from 5.5%wt. at 530 °C to 16.5%wt. at 590 °C, and for polypropylene, it increased from 3.1%wt. at 530 °C to 19.4%wt. at 590 °C. The average conversion to CO during PE pyrolysis ranged from 4.2%wt. to 9.1%wt., and for PP, it ranged from 4.6%wt. to 7.7%wt. Furthermore, the conversion of polymeric carbon to benzene (also the only aromatic product) increased in comparison to the multilayer fluidized bed made out of raw cenospheres and quartz sand. The average carbon conversion to benzene changed in the case of PE and PP from 4.6%wt. and 5.7%wt., respectively, to 12.4%wt. and 9.3%wt. in the case of the fluidized bed made out of modified cenospheres and quartz sand. The increase in carbon conversion to aromatic products during pyrolysis in a catalytic environment is already known in the literature. Chen et al. [43] demonstrated that the impregnation of Fe on the Pt/Al2O3 catalyst during polyethylene pyrolysis improves oil production efficiency and promotes the formation of aromatic compounds and alkenes. Shen et al. [44] proved that polyethylene pyrolysis using a Ga/HZSM-5 catalyst allows for achieving a process selectivity towards BTEX of 77.0%.
In the fluidized bed made out of modified cenospheres and quartz sand, primarily long-chain hydrocarbons were obtained. The PE conversation to C7+ fraction varied from 35.1%wt. to 26.6%wt. and from 36%wt. to 25.5%wt. in the case of PP. The fraction of aliphatic unsaturated hydrocarbons with up to six carbon atoms per molecule was also obtained. The conversion of polymer carbon to the abovementioned fraction decreased with increasing temperature. For PE, the fraction decreased from 31.0%wt. to 20.4%wt., and for PP, from 32.4%wt. to 14.2%wt. Alongside unsaturated hydrocarbons, aliphatic saturated hydrocarbons were also identified in the gas mixtures, with their quantity increasing with temperature from 12.1%wt. to 15.0%wt. in the case of polyethylene and from 13.8%wt. to 24.8%wt. in the case of polypropylene.
Among the aliphatic unsaturated hydrocarbons obtained during PE pyrolysis, the main component of the fraction was gas rich in ethylene. Its content increased from 49.3% at 530 °C to 82.6% at 590 °C in the whole fraction. The majority of the unsaturated fraction obtained during PP pyrolysis constituted 1-butene. The content of the compound increased with the increasing temperature from 45.6% at 530 °C to 70.9% at 590 °C. This suggested that selectivity towards ethylene and 1-butene increased rapidly in comparison to the fluidized bed made out of raw cenospheres and quartz sand.
The aliphatic saturated hydrocarbon fraction obtained during PP pyrolysis constituted mainly N-pentane, increasing from 35.6% to 72.1% with increasing temperature. In a similar concentration, menthane and ethane were detected at each applied temperature. In the case of the saturated fraction obtained via PE pyrolysis, all components were detected in similar concentrations in temperatures ranging from 520 °C to 570 °C, and only N-hexane showed the highest content in the fraction at the highest temperature of 590 °C, with a value of 41.3%.

4. Conclusions

  • The paper introduces an alternative method for conducting the polyolefin pyrolysis process in a fluidized bed reactor.
In this study, the possibility of creating multilayer fluidized beds was demonstrated. Density measurements of the multilayer fluidized beds revealed a variable vertical density profile. The chosen materials and used ratio of u/umf, sand (equal to 1.6) were suitable for the pyrolysis of polyolefins. According to Archimedes’ principle, in the investigated multilayer FB, a balance between gravitational and buoyancy forces acting on polymer particles would occur in the central part of the fluidized bed. Based on density measurements, three characteristic FB layers were distinguished. Layer L1 was located at the bottom of the multilayer fluidized bed and had a constant density of about 1000 kg/m3. The first layer served as protection for the bottom sieve against the falling of processed polymers and the clogging of the gas distributor. In layer L2, where the density varied from 1000 kg/m3 to 550 kg/m3, the distribution of the particles of polymers took place. Layer L3, with a density of about 500 kg/m3, was situated at the top of the fluidized bed. Polyolefins were immersed freely into the FB volume, passing through the third, low-density layer, where the decomposition of gases produced during pyrolysis in layer L2 also occurred.
2.
The new approach used in the investigation avoids the formation of a solid phase, a common challenge in pyrolysis processes.
The specially designed fluidized bed reactor was constructed using a transparent quartz tube in this research. This allowed for the observation of the fluidization state during the pyrolysis process. It was possible to monitor changes in the coloration of quartz sand and cenospheres, which could serve as early indicators of the formation of solid pyrolysis products (soot). The outlet of the reactor (where finer soot particles could accumulate) and FB materials were additionally investigated after the completion of the pyrolysis to identify any particles that were distinct from the initial materials. No changes in the coloration of the material particles and foreign soot particles in the FB and at the reactor outlet were observed. Additionaly, the color of the multilayer fluidized bed consisting of raw cenospheres grains and quartz sand after pyrolysis process was varified. Upon detailed color analysis, it was not observed that sand and cenospheres grains were covered with soot. The color of the sand remained beige, while the cenospheres were light gray.
3.
Hydrocarbon mixtures containing CO and CO2 were obtained in the case of a multilayer fluidized bed made out of modified cenospheres.
Quantitative and qualitative FTIR analysis of products from pyrolysis revealed the formation of complex gas mixtures. Mainly unsaturated aliphatic hydrocarbons were obtained during pyrolysis in the multilayer fluidized bed made out of raw cenospheres and quartz sand. If the goal of pyrolysis is to produce a gas rich in ethylene, the reasonable solution would be to pyrolyze polyethylene in the fluidized bed made out of raw cenospheres. However, if the aim of the process is to obtain 1-butene and propene, polypropylene should be processed in the same multilayer fluidized bed consisting of raw cenospheres; the average content of product rich in the desired gases was a 90% aliphatic unsaturated hydrocarbons fraction. In the multilayer fluidized bed made out of modified cenospheres coated with iron oxides and quartz sand, alongside aliphatic and aromatic hydrocarbons, the presence of carbon oxides was also detected. The mixture containing CO, formed after the pyrolysis process, could be directed to various industrial applications, including the production of syngas and chemicals (e.g., formic acid and methanol) and iron ore reduction in metallurgical industries. The hydrocarbons fraction, in this case, was lower than in the FB consisting of raw materials. However, the selectivity towards ethylene and 1-butene significantly increased. At 590 °C, during PE pyrolysis, approximately 80% of the aliphatic unsaturated hydrocarbons fraction was ethylene, and during PP, approximately 70% of the same fraction was 1-butene. Benzene was detected as the only aromatic hydrocarbon identified in the gaseous products. The average carbon conversion to benzene in the multilayer fluidized bed made out of raw cenospheres was 5%, increasing to a value of approximately 11% in the multilayer fluidized bed consisting of modified materials. Thus, if pyrolysis aims to produce benzene, the reasonable method would be to use cenospheres coated with iron oxides.
4.
The gas mixtures obtained during pyrolysis are suitable for various catalytic processes. Depending on the chosen catalytic process for gas mixtures, saturated hydrocarbons and hydrogen can be produced.
The complex nature of the mixture of pyrolysis products poses potential challenges in physically separating the resulting chemical gas products. The simplest solution would be to process the mixture as a whole. Utilizing the generated hydrocarbon mixture in a steam conversion process to produce hydrogen could be an application for the obtained mixture.
5.
The general benefits of using multilayer fluidized beds.
(I)
The low-density (upper) layer of the multilayer fluidized beds allows for the free dosing of fuel samples into the fluidized bed volume without the use of special feeders. The premature fuel degradation and nozzle clogging in the feeders are eliminated.
(II)
The variable-density (middle) layer acts as a space for material pyrolysis, characterized by even temperature, good mass and heat exchange, and intensive mixing, and imposing a specific residence time for reagents inside the fluidized beds. According to Archimedes’ principle, polyolefins freely sink into the multilayer fluidized beds’ depth, where the density is like that of PE and PP. The decomposition process then takes place inside the fluidized bed layer.
(III)
The high-density (bottom) layer protects the reactor from the falling of the polyolefins to the bottom sieve during the operation and from the clogging of the gas inlets.

Author Contributions

Conceptualization, K.L. and G.B.-P.; methodology, W.Ż., K.L. and G.B.-P.; software, W.Ż.; validation, G.B.-P.; formal analysis, K.L. and J.W.; investigation, W.Ż., K.L., G.B.-P. and J.W.; resources, W.Ż. and J.W.; data curation, K.L., G.B.-P. and J.W.; writing—original draft preparation, K.L.; writing—review and editing, W.Ż., K.L., G.B.-P. and J.W.; visualization, K.L. and G.B.-P.; supervision, W.Ż. and G.B.-P.; project administration, W.Ż. and J.W.; funding acquisition, W.Ż. and K.L. All authors have read and agreed to the published version of the manuscript.

Funding

The research was supported by a subsidy of the Ministry of Science and Higher Education of Poland for Cracow University of Technology supporting the development of young scientists and PhD students. Interial number: C09.31.734.2023.

Data Availability Statement

The data presented in this study are available on reasonable request.

Conflicts of Interest

The authors declare no conflict of interest. The funders had no role in the design of the study; in the collection, analyses, or interpretation of data; in the writing of the manuscript, or in the decision to publish the results.

References

  1. Golub, G.; Tsyvenkova, N.; Kukharets, S.; Holubenko, A.; Omarov, I.; Klymenko, O.; Mudryk, K.; Hutsol, T. European Green Deal: An Experimental Study of the Biomass Filtration Combustion in a Downdraft Gasifier. Energies 2023, 16, 7490. [Google Scholar] [CrossRef]
  2. Nitkiewicz, T.; Ociepa-Kubicka, A. Eco-Investments-Life Cycle Assessment of Different Scenarios of Biomass Combustion. Ecol. Chem. Eng. S 2018, 25, 307–322. [Google Scholar] [CrossRef]
  3. Garcia-cortes, S. Repurposing End-of-Life Coal Mines with Business Models. Energies 2023, 16, 7617. [Google Scholar]
  4. Barmparitsas, N.; Karellas, S.; Pallis, P.; Thanopoulos, S.; Kobelt, D. An Innovative Heating, Ventilation, Air Conditioning and Refrigeration Circular Economy System for Reducing Carbon Dioxide Emissions in Europe via Extensive Reuse of Existing Fluorinated Gases. Energies 2023, 16, 7705. [Google Scholar] [CrossRef]
  5. Leski, K.; Berkowicz-Płatek, G. Pyrolysis of Plastic Wastes as a Way of Obtaining Valuable Chemical Raw Materials. Chem. Rev. Lett. 2021, 4, 92–97. [Google Scholar] [CrossRef]
  6. Holubčík, M.; Klačková, I.; Ďurčanský, P. Pyrolysis Conversion of Polymer Wastes to Noble Fuels in Conditions of the Slovak Republic. Energies 2020, 13, 4849. [Google Scholar] [CrossRef]
  7. Anuar Sharuddin, S.D.; Abnisa, F.; Wan Daud, W.M.A.; Aroua, M.K. A Review on Pyrolysis of Plastic Wastes. Energy Convers. Manag. 2016, 115, 308–326. [Google Scholar] [CrossRef]
  8. Harussani, M.M.; Sapuan, S.M.; Rashid, U.; Khalina, A.; Ilyas, R.A. Pyrolysis of Polypropylene Plastic Waste into Carbonaceous Char: Priority of Plastic Waste Management amidst COVID-19 Pandemic. Sci. Total Environ. 2022, 803, 149911. [Google Scholar] [CrossRef]
  9. López, A.; de Marco, I.; Caballero, B.M.; Laresgoiti, M.F.; Adrados, A. Pyrolysis of Municipal Plastic Wastes: Influence of Raw Material Composition. Waste Manag. 2010, 30, 620–627. [Google Scholar] [CrossRef]
  10. Schwartz, N.R.; Paulsen, A.D.; Blaise, M.J.; Wagner, A.L.; Yelvington, P.E. Analysis of Emissions from Combusting Pyrolysis Products. Fuel 2020, 274, 117863. [Google Scholar] [CrossRef]
  11. Sciazko, M.; Mertas, B.; Kosyrczyk, L.; Sobolewski, A. A Predictive Model for Coal Coking Based on Product Yield and Energy Balance. Energies 2020, 13, 4953. [Google Scholar] [CrossRef]
  12. Brown, R.M.; Hoover, A.N.; Klinger, J.L.; Wahlen, B.D.; Hartley, D.; Lee, H.; Thompson, V.S. Decontamination of Mixed Paper and Plastic Municipal Solid Waste Increases Low and High Temperature Conversion Yields. Front. Energy Res. 2022, 10, 834832. [Google Scholar] [CrossRef]
  13. Ganguly, A.; Brown, R.C.; Wright, M.M. Investigating the Impacts of Feedstock Variability on a Carbon-Negative Autothermal Pyrolysis System Using Machine Learning. Front. Clim. 2022, 4, 842650. [Google Scholar] [CrossRef]
  14. Sanito, R.C.; Chen, C.H.; You, S.J.; Yang, H.H.; Wang, Y.F. Volatile Organic Compounds (VOCs) Analysis from Plasma Pyrolysis of Printed Circuit Boards (PCB) with the Addition of CaCO3 from Natural Flux Agents. Environ. Technol. Innov. 2023, 29, 103011. [Google Scholar] [CrossRef]
  15. European Commission A Green Deal Industrial Plan for the Net-Zero Age. 2023. Available online: https://commission.europa.eu/system/files/2023-02/COM_2023_62_2_EN_ACT_A%20Green%20Deal%20Industrial%20Plan%20for%20the%20Net-Zero%20Age.pdf (accessed on 21 February 2024).
  16. Jia, Y.; Mao, Z.; Huang, W.; Zhang, J. Effect of Temperature and Crystallinity on the Thermal Conductivity of Semi-Crystalline Polymers: A Case Study of Polyethylene. Mater. Chem. Phys. 2022, 287, 126325. [Google Scholar] [CrossRef]
  17. Wang, X.; Jin, Q.; Zhang, J.; Li, Y.; Li, S.; Mikulčić, H.; Vujanović, M.; Tan, H.; Duić, N. Soot Formation during Polyurethane (PU) Plastic Pyrolysis: The Effects of Temperature and Volatile Residence Time. Energy Convers. Manag. 2018, 164, 353–362. [Google Scholar] [CrossRef]
  18. Onwudili, J.A.; Insura, N.; Williams, P.T. Composition of Products from the Pyrolysis of Polyethylene and Polystyrene in a Closed Batch Reactor: Effects of Temperature and Residence Time. J. Anal. Appl. Pyrolysis 2009, 86, 293–303. [Google Scholar] [CrossRef]
  19. Font, R.; Aracil, I.; Fullana, A.; Martín-Gullón, I.; Conesa, J.A. Semivolatile Compounds in Pyrolysis of Polyethylene. J. Anal. Appl. Pyrolysis 2003, 68–69, 599–611. [Google Scholar] [CrossRef]
  20. Antoniou, N.A.; Zorpas, A.A. Quality Protocol and Procedure Development to Define End-of-Waste Criteria for Tire Pyrolysis Oil in the Framework of Circular Economy Strategy. Waste Manag. 2019, 95, 161–170. [Google Scholar] [CrossRef]
  21. Islam, M.N.; Joardder, M.U.H.; Hoque, S.M.N.; Uddin, M.S. A Comparative Study on Pyrolysis for Liquid Oil from Different Biomass Solid Wastes. Procedia Eng. 2013, 56, 643–649. [Google Scholar] [CrossRef]
  22. Supriyanto; Usino, D.O.; Ylitervo, P.; Dou, J.; Sipponen, M.H.; Richards, T. Identifying the Primary Reactions and Products of Fast Pyrolysis of Alkali Lignin. J. Anal. Appl. Pyrolysis 2020, 151, 104917. [Google Scholar] [CrossRef]
  23. Oliveri, L.M.; Chiacchio, F.; D’Urso, D.; Matarazzo, A.; Cutaia, L.; Luciano, A. Circular Economy and Industrial Symbiosis in Sicily. IFIP Adv. Inf. Commun. Technol. 2022, 663 IFIP, 432–439. [Google Scholar] [CrossRef]
  24. Baral, B.; Raine, R. Performance and Emissions of a Spark Ignition Engine Running on Gasoline Adulterated with Kerosene; SAE Technical Paper; SAE International: Warrendale, PA, USA, 2009; Volume 2009-Decem. [Google Scholar] [CrossRef]
  25. Igliński, B.; Kujawski, W.; Kiełkowska, U. Pyrolysis of Waste Biomass: Technical and Process Achievements, and Future Development—A Review. Energies 2023, 16, 1829. [Google Scholar] [CrossRef]
  26. Peters, J.; May, J.; Ströhle, J.; Epple, B. Flexibility of CFB Combustion: An Investigation of Co-Combustion with Biomass and RDF at Part Load in Pilot Scale. Energies 2020, 13, 4665. [Google Scholar] [CrossRef]
  27. Żukowski, W.; Berkowicz, G. The Combustion of Liquids and Low-Density Solids in a Cenospheric Fluidised Bed. Combust. Flame 2019, 206, 476–489. [Google Scholar] [CrossRef]
  28. Berkowicz-Płatek, G.; Żukowski, W.; Leski, K. Combustion of Polyethylene and Polypropylene in the Fluidized Bed with a Variable Vertical Density Profile. Energy 2024, 286, 129611. [Google Scholar] [CrossRef]
  29. Berkowicz, G.; Majka, T.M.; Żukowski, W. The Pyrolysis and Combustion of Polyoxymethylene in a Fluidised Bed with the Possibility of Incorporating CO2. Energy Convers. Manag. 2020, 214, 112888. [Google Scholar] [CrossRef]
  30. Merrill, P.B.; Madix, R.J. Hydrogenation of Weakly Rehybridized Ethylene on Fe(100)−H: Ethyl Group Formation. J. Am. Chem. Soc. 1996, 118, 5062–5067. [Google Scholar] [CrossRef]
  31. Vouvoudi, E.C.; Rousi, A.T.; Achilias, D.S. Effect of the Catalyst Type on Pyrolysis Products Distribution of Polymer Blends Simulating Plastics Contained in Waste Electric and Electronic Equipment. Sustain. Chem. Pharm. 2023, 34, 101145. [Google Scholar] [CrossRef]
  32. Abdel-Rahman, M.K.; Trenary, M. Propyne Hydrogenation over a Pd/Cu(111) Single-Atom Alloy Studied Using Ambient Pressure Infrared Spectroscopy. ACS Catal. 2020, 10, 9716–9724. [Google Scholar] [CrossRef]
  33. Azzolina-Jury, F.; Thibault-Starzyk, F. Mechanism of Low Pressure Plasma-Assisted CO2 Hydrogenation over Ni-USY by Microsecond Time-Resolved FTIR Spectroscopy. Top. Catal. 2017, 60, 1709–1721. [Google Scholar] [CrossRef]
  34. Hakkarainen, T.; Mikkola, E.; Laperre, J.; Gensous, F.; Fardell, P.; Le Tallec, Y.; Baiocchi, C.; Paul, K.; Simonson, M.; Deleu, C.; et al. Smoke Gas Analysis by Fourier Transform Infrared Spectroscopy—Summary of the SAFIR Project Results. Fire Mater. 2000, 24, 101–112. [Google Scholar] [CrossRef]
  35. Plyler, E.K.; Tidwell, E.D.; Blaine, L.R. Infrared Absorption Spectrum of Methane from 2470 to 3200 cm−1. J. Res. Natl. Bur. Stand. Sect. A Phys. Chem. 1960, 64A, 201. [Google Scholar] [CrossRef] [PubMed]
  36. Kınaytürk, N.K.; Kalaycı, T.; Tunalı, B.; Altuğ, D.T. A Spectroscopic Approach to Compare the Quantum Chemical Calculations and Experimental Characteristics of Some Organic Molecules; Benzene, Toluene, P-Xylene, P-Toluidine. Chem. Phys. 2023, 570, 111905. [Google Scholar] [CrossRef]
  37. Cho, M.H.; Jung, S.H.; Kim, J.S. Pyrolysis of Mixed Plastic Wastes for the Recovery of Benzene, Toluene, and Xylene (BTX) Aromatics in a Fluidized Bed and Chlorine Removal by Applying Various Additives. Energy Fuels 2010, 24, 1389–1395. [Google Scholar] [CrossRef]
  38. Namioka, T.; Saito, A.; Inoue, Y.; Park, Y.; Min, T.J.; Roh, S.A.; Yoshikawa, K. Hydrogen-Rich Gas Production from Waste Plastics by Pyrolysis and Low-Temperature Steam Reforming over a Ruthenium Catalyst. Appl. Energy 2011, 88, 2019–2026. [Google Scholar] [CrossRef]
  39. Maqsood, T.; Dai, J.; Zhang, Y.; Guang, M.; Li, B. Pyrolysis of Plastic Species: A Review of Resources and Products. J. Anal. Appl. Pyrolysis 2021, 159, 105295. [Google Scholar] [CrossRef]
  40. Calero, M.; Solís, R.R.; Muñoz-Batista, M.J.; Pérez, A.; Blázquez, G.; Ángeles Martín-Lara, M. Oil and Gas Production from the Pyrolytic Transformation of Recycled Plastic Waste: An Integral Study by Polymer Families. Chem. Eng. Sci. 2023, 271, 118569. [Google Scholar] [CrossRef]
  41. Pal, P.; Ting, J.M.; Agarwal, S.; Ichikawa, T.; Jain, A. The Catalytic Role of D-Block Elements and Their Compounds for Improving Sorption Kinetics of Hydride Materials: A Review. Reactions 2021, 2, 22. [Google Scholar] [CrossRef]
  42. Ranjbar, N.; Kuenzel, C. Cenospheres: A Review. Fuel 2017, 207, 1–12. [Google Scholar] [CrossRef]
  43. Chen, Z.; Xu, L.; Zhang, X. Upgrading of Polyethylene to Hydrocarbon Fuels over the Fe-Modified Pt/Al2O3 Catalysts at a Mild Condition without External H2. Chem. Eng. J. 2022, 446, 136213. [Google Scholar] [CrossRef]
  44. Shen, X.; Zhao, Z.; Li, H.; Gao, X.; Fan, X. Microwave-Assisted Pyrolysis of Plastics with Iron-Based Catalysts for Hydrogen and Carbon Nanotubes Production. Mater. Today Chem. 2022, 26, 101166. [Google Scholar] [CrossRef]
Figure 2. Laboratory stand for polyolefins pyrolysis in the multilayer fluidized beds: L1—high-density layer; L2—decomposition layer; L3—low-density layer.
Energies 17 01034 g002
Figure 3. Vertical density profile of multilayer fluidized bed (u/umf, sand = 1.6). Distance from the sieve bottom, where the buoyancy force balances the gravitational force acting on the pyrolyzed material particle, is additionally marked.
Energies 17 01034 g003
Figure 4. Thermogram and differential thermogram of PE and PP under nitrogen atmosphere.
Energies 17 01034 g004
Figure 5. FTIR spectra of the flue gases registered during polyethylene (PE) pyrolysis (gray line) and calculated spectrum (blue line).
Energies 17 01034 g005
Figure 6. Individual components of the calculated spectrum correspond to the sample spectrum recorded during polyethylene (PE) pyrolysis in region I (A) and region II (B,C) at 550 °C.
Energies 17 01034 g006aEnergies 17 01034 g006b
Figure 7. Polyethylene and polypropylene conversion (%wt.) to product groups during polyolefin pyrolysis in the multilayer fluidized bed made out of raw cenospheres and quartz sand.
Energies 17 01034 g007
Figure 8. Composition of aliphatic unsaturated hydrocarbon fraction obtained during polyethylene (A) and polypropylene (B) pyrolysis in the fluidized bed made out of raw cenospheres and quartz sand.
Energies 17 01034 g008
Figure 9. Composition of aliphatic saturated hydrocarbon fraction obtained during polyethylene (A) and polypropylene (B) pyrolysis in the fluidized bed made out of raw cenospheres and quartz sand.
Energies 17 01034 g009
Figure 10. Polyethylene and polypropylene conversion (%wt.) to product groups and carbon oxides during pyrolysis in the multilayer fluidized bed made out of modified cenospheres and quartz sand.
Energies 17 01034 g010
Figure 11. Composition of aliphatic unsaturated hydrocarbon fraction obtained during polyethylene (A) and polypropylene (B) pyrolysis in the fluidized bed made out of modified cenospheres and quartz sand.
Energies 17 01034 g011
Figure 12. Composition of aliphatic saturated hydrocarbon fraction obtained during polyethylene (A) and polypropylene (B) pyrolysis in the fluidized bed made out of modified cenospheres and quartz sand.
Energies 17 01034 g012
Table 1. Characterization of the multilayer fluidized beds investigated in this research.
Fluidized Bed
Version
Mass, gParticle
Diameter, μm
Static Height
in the FB, cm
Bulk Density, g/cm3
Fluidized bed Iquartz sand
360120–20061.36
raw cenospheres
160140–16080.46
Fluidized bed IIquartz sand
360120–20061.36
modified cenospheres
160140–16080.47
Table 2. Minimum fluidization velocities of the multilayer fluidized beds and the operation velocities of nitrogen used in the research.
Temperature, °Cumf, multilayer fluidized bed Based on Grace Equation, cm/sQuartz Sand
Fluidization
Number u/umf, sand
Nitrogen Velocity
under Process
Conditions, cm/s
5301.171.61.87
5501.141.82
5701.081.73
5901.091.68
Disclaimer/Publisher’s Note: The statements, opinions and data contained in all publications are solely those of the individual author(s) and contributor(s) and not of MDPI and/or the editor(s). MDPI and/or the editor(s) disclaim responsibility for any injury to people or property resulting from any ideas, methods, instructions or products referred to in the content.

