1. Introduction
Underground coal gasification (UCG) is a technology that converts coal into a synthetic gas (i.e., syngas) by heating. Currently, more than 909 trillion tons of coal are in stock worldwide, and only 15% of the available coal is for traditional mining methods. UCG technology is still evolving and provides an alternative to conventional underground coal mining. This technology can be attractive from an environmental and economic point of view and may have extensive use in the future. The technology is also less expensive than conventional coal mining. UCG allows using coal resources that would otherwise be economically or technically unfeasible to extract through conventional mining methods. UCG can lead to lower emissions compared to traditional coal mining and combustion because the process takes place underground and can include carbon capture and storage (CCS) technologies. UCG can potentially reduce the carbon footprint associated with traditional coal utilization. By converting coal in situ, UCG can facilitate the capture and storage of carbon dioxide (CO) produced during the process, reducing greenhouse gas emissions.
Additionally, syngas production through UCG can be combined with the technology of carbon capture and storage (CCS), which reduces the emission of CO
from industrial processes. Although countries worldwide are placing increased emphasis on reducing greenhouse gas emissions, mitigating climate change, and diversifying their energy mix away from fossil fuels, UCG is discussed as a potential technology that could provide a bridge between traditional coal-based energy systems and cleaner energy alternatives. UCG can be integrated with renewable energy sources to enhance overall energy efficiency. For instance, the syngas produced from UCG can be a backup fuel for renewable energy systems, ensuring a continuous and reliable energy supply. Additionally, surplus renewable energy can be utilized in UCG operations during periods of low demand, optimizing energy utilization. The main benefits of UCG compared to conventional coal utilization methods are listed in [
1].
On the other hand, it must be said that there is also criticism of UCG, which is based on the fear of groundwater contamination, subsidence, and the release of harmful gases during the UCG process. The environmental risks associated with UCG should have regulatory frameworks which need to be stringent to ensure safety and environmental protection. Moreover, the global energy situation is shifting towards renewable energy sources due to increasing concerns about climate change. Solar and wind energy have grown substantially and have become more economically viable. Governments, industries, and investors are focusing more on sustainable energy solutions and reducing their reliance on fossil fuels. In this context, the prospects for UCG can be uncertain, as it remains an intermediate solution with potential environmental risks, competing against the rapid advancements in cleaner and more sustainable energy technologies.
However, it is likely that, in times of energy crisis, there may be a lack of energy, and countries may return to using fossil fuels. In addition, some countries have stopped using nuclear power, and renewable sources are insufficient to meet the population’s energy needs. Moreover, renewable energy technologies depend on the weather (e.g., sun and wind) to generate energy. They are still significantly new to the market and lack the much-needed efficiency. Setting up renewable energy generation facilities requires a substantial financial outlay.
In a chemical view, gasification is the conversion of bigger organic macromolecules of solid fuel to smaller volatile or gas molecules consisting of syngas fuel. This conversion is obtained by heating the solid fuel to temperatures above 750
C. Such temperatures are achieved by partial combustion of the solid fuel or indirectly by heating it with an overheated mean. UCG is performed as an auto-thermal process, in which, with the help of injected gasification agent from an injection well, heat is generated in the coal deposit through combustion reactions with coal. When coal is heated, it releases volatile substances, leading to the production of combustible gases. Raw-unprocessed fuel (i.e., solid coal) is converted into combustible syngas, mainly containing CO, CH
, and H
. The gasification process also generates heat, CO
, and H
O. The primary chemical reactions in coal gasification include drying, pyrolysis, combustion, and gasification of solid hydrocarbons. UCG essentially represents the acquisition of a spatially and thermally distributed reaction zone in a coal seam, in which regions of coal oxidation, coal reduction, and coal pyrolysis occur (see
Figure 1).
The principle of UCG technology was well illustrated in [
3], and the description of the leading chemical processes of UCG has been well described in [
4,
5,
6].
In an in situ UCG test, the coal is converted into syngas underground in its natural location within a georeactor. A typical in situ UCG test involves drilling injection and production wells into the coal seam. The coal is ignited, and the injection well supplies oxidants (such as air, oxygen, or steam) to the coal seam to initiate the gasification process. Next, the syngas formed is extracted through the production well and can be further processed for various applications. In situ UCG tests provide insights into the behavior of coal, gasification reactions, and the potential for underground resource utilization.
Ex situ UCG involves performing UCG tests aboveground, typically in laboratory gasifiers or reactors. In this method, coal samples are taken from underground coal seams and brought to the surface for gasification experiments. The coal bedding in the ex situ reactor usually corresponds to the underground seam under conditions of geometric similarity. Ex situ UCG tests allow researchers to study and analyze the gasification process in a more controlled and manageable setting. The results obtained from ex situ tests help us to understand the fundamental aspects of coal gasification and optimize the process parameters. In addition, valuable data from laboratory tests can be used to design mathematical models of UCG and perform simulations [
7].
Both approaches are valuable in the development and understanding of UCG technology. In situ UCG tests are crucial for evaluating the viability of underground coal gasification in specific geological formations and providing site-specific data. Ex situ UCG tests, on the other hand, help in fundamental research, process optimization, and developing efficient gasification techniques.
This review study focuses on UCG trials performed in laboratory conditions. The motivation for writing this review was to provide a comprehensive view of recent research and achievements in the field. The study aims to overview current trends in UCG laboratory research and the achieved results. Experimental research using ex situ reactors plays an essential role in advancing UCG technology. In addition, the study wants to increase interest in this technology. The scope of the study is wide-ranging. The study aims to provide the reader with automated UCG control and optimization knowledge. Researchers are developing various supporting UCG automatic control algorithms that stabilize or optimize process variables. Such control algorithms make it possible to eliminate the human factor when deciding on control interventions. Moreover, laboratory-scale experiments allow researchers to investigate various parameters and conditions to optimize the UCG process.
Furthermore, the study provides an overview of the field of modeling temperatures in UCG. The UCG operation can be optimized by understanding temperature variations to maximize gas production and minimize undesirable byproducts. This study reviews the effects of different gasification agents (such as air, oxygen, or steam) on the gasification efficiency and syngas composition. The influence of gasification agents, and their flows and pressures, on syngas composition, tar concentration, and cavity growth is also investigated in this study. High-pressure gasification and multiphase gasification with oxygen and steam have great potential. Much attention in UCG research is devoted to steam gasification, methane-oriented gasification, and hydrogen-oriented gasification. In many countries, lignite is mined, while deep, inaccessible deposits or deposits with tectonic faults remain unmined by conventional mining techniques. However, these deposits can be mined with UCG technology.
Therefore, the study provides an overview of recent research in the gasification of various types of lignite with high humidity (i.e., ortho-lignites and meta-lignites). The study compares the calorific values of the produced syngas using different techniques and operating conditions. Laboratory research also investigates the environmental and safety aspects of UCG. These aspects need to be monitored during the operation of the UCG. This study, therefore, includes an overview of research in the field of analysis of pollutants and potential ecological impacts. The research focuses on potential groundwater pollution, analysis of gasification residues, and elimination of risks associated with gas leakage and poisoning in the vulnerable UCG area.
Overall, laboratory-scale research on UCG in ex situ reactors plays a crucial role in understanding the gasification process, which is improved by this technology, and addressing environmental and safety concerns. The findings from such studies contribute to the development of UCG technology and provide valuable insights for potential industrial-scale implementation.
2. Automated Control of UCG
Improving UCG technology also requires implementing advanced automatic control tools. Recent research has focused on developing adaptive control (AC), extreme seeking control (ESC), optimal control, or model predictive control (MPC). Such algorithms can calculate the optimal flow of gasification agents to the UCG reactor. The objective of the control system is the maximization of syngas calorific value or tracking desired calorific values (i.e., setpoints). The control system can be model-free or model-based.
Kostúr et al. [
8,
9] proposed two experimental reactors (i.e., marked as G1 and G2) to test UCG and develop automated control based on the programmable logic controller (PLC), and supervisory control and acquisition (SCADA). The ex situ reactor G1 had the shape of a cuboid and G2 of a truncated cylinder. The proposed ex situ reactors (i.e., the syngas generator) allow the simulation of UCG in laboratory conditions with controlled air and oxidizer flow. Also designed was the UCG control by an exhaust ventilator on the outlet from the ex situ reactor. These reactors were created as steel vessels to simulate the underground coal seam (see
Figure 2).
Ex situ reactors were used for testing overpressure control by the regulated flow of injected gasification agents and under pressure control by the regulated sucking pressure. In in situ UCG, the second-mentioned UCG control method can eliminate syngas losses to the surrounding layers, as under negative pressure, air enters the georeactor from the surface through various cracks and fissures in the overlying rock layers and through the injection well. This control method, also called burnout control, was successfully applied in Calamity Hollow at the site of an abandoned shallow drift mine in Pittsburgh [
10]. The idea of combined under-pressure and over-pressure UCG control applied in practice is shown in
Figure 3.
2.1. Stabilization of Temperature and Oxygen in Syngas
The gasification temperature is critical in determining the reaction kinetics, gas composition, and tar formation during UCG. Optimization involves identifying the temperature range that promotes desired gasification reactions while minimizing undesired byproducts and ensuring reactor integrity. Temperature stabilization on the optimal setpoint with an adaptive controller can provide the optimal flow of gasification agents to keep the intended temperature within the oxidation zone. The most severe problem in the control of UCG is the long-term maintenance of the syngas calorific value at the desired values. Hence, it becomes essential to stabilize either the underground temperature or the concentration of oxygen in the produced syngas. Adding oxygen to the oxidation zone can improve the energy efficiency of the UCG, but it can also increase the amount of CO
. In addition, too much oxidizer can lower the temperature in the oxidation zone due to the cooling of the coal. Therefore, it is necessary to search for the optimal flow rate of the oxidizer. At elevated temperatures, endothermic reactions (such as the Boudouard reaction: CO
+ C = 2CO) become dominant over exothermic reactions, resulting in a decrease in CH
concentration and an increase in CO and H
. The maximum effect of CO
consumption is at a temperature of 1000
C. Increasing the temperature to levels above 1000
C is necessary to achieve a higher proportion of combustible components in the syngas. As the temperature rises, there is an increase in CO production (see
Figure 4), and this component continues to be the prevailing one. The CO/(CO + CO
) ratio, which is an essential indicator of the progress of gasification, also rises. However, a higher temperature must be maintained for a long time to produce as much heating gas as possible. The above shows that an algorithm is needed to stabilize the temperature to the selected setpoint.
The stabilization level of UCG control based on the adaptive discrete controller that continuously calculated the optimal airflow or exhaust ventilator power to stabilize the underground temperature or oxygen concentration in syngas at the desired value was proposed in [
2,
12]. The equation of the used proportional-integration controller has the following form:
where
represents an increase in the control variable
in the step
k (i.e., gasification agent flow rate or exhaust fan power),
is the control error,
is the controlled variable to be stabilized (i.e., measured temperature, oxygen content in syngas),
and
are the proportional gain and integration constant, the parameter
represents the sampling period (s), and
and
are parameters of the discrete controller. The adaptation of the controller was based on repeated discrete system model identification and the recalculation of controller parameters
,
[
2].
Figure 5a shows the oxidation zone’s regulated airflow and stabilized temperature.
Figure 5b shows the stabilization of oxygen in syngas. In both cases, the discrete proportional-integral (PI) controller algorithm was adapted when stabilization quality decreased and because the coal bed changes its properties when it passes through different phases of UCG. The stabilized temperature or oxygen in syngas resulted in an increased heating value of syngas.
2.2. Model-Free Maximization of the Syngas Calorific Value
Uncertainty is a common feature of many systems, and model-free extreme search control has been proven to be a relevant approach to avoid typical problems related to optimization with a model, e.g., time- and resource-consuming derivation and identification of dynamic models and lack of robustness of optimal control [
13,
14,
15]. Using a perturbation signal at the system input and observing its effect at the output to estimate the slope of a nonlinear static map can be traced back to the work of the French engineer Leblanc in 1922 [
16]. Ariyur and Krstic popularized the extremum-seeking control based on this principle [
17] and successfully applied it in various fields (e.g., [
18,
19,
20]).
Kostúr and Kačur [
21] proposed a complex UCG control system based on two levels, i.e., stabilization and optimization. While the stabilization level was based on discrete proportional-integrating (PI) controllers, the optimization level was based on a continuous search for the extremum of the objective function. Optimal control based on the principle of a simple extreme controller and control based on the principle of a simple gradient method with constraints were proposed.
Figure 6 illustrates a schematic diagram of the UCG complex control system.
The extremum-seeking control (ESC) based on a simplified extremum-seeking controller calculated the optimal airflow
(i.e., for next control step
) injected to the ex situ reactor to maximize the average concentration of CO in syngas (i.e., the objective function
). The equation of the simple extremum-seeking controller applied in ex situ UCG has the following form [
11]:
where
represents the calculated optimized airflow that enters the PI controller as a new setpoint (m
/h),
is empirically determined by the flow stabilization quality and
,
is positive if
and
are the same (i.e., positive or negative), otherwise
is negative. If
changes from (+) to (–) or from (–) to (+) then it is need to modify the parameter
m (i.e.,
) and the algorithm continues from the beginning.
The monitoring system was designed in the SCADA system Promotic (see
Figure 7), which provides measured data, the controllers’ setup, and turning on various control algorithms.
Figure 8 shows the continual maximization of CO concentration in syngas during ex situ coal gasification. As seen, the controller successfully increased the CO concentration from 14% to 30%, resulting in the syngas calorific value increasing [
11,
21,
22,
23].
In the ESC of UCG with three manipulation variables (i.e.,
is the desired airflow (m
/h) or servo valve opening,
is the desired oxygen flow to the oxidation mixture (m
/h), and
represents the controlled under-pressure (Pa) or sucking ventilator power frequency (Hz)), the gradient method with constraints was used to optimize the vector
. The optimized manipulation variables for each new control step
i were calculated according to the following equation:
where the cost function
was expressed as the average syngas calorific values recorded in the history buffer. The vector of gradients
is continually calculated in the steady-state by loading perturbations on manipulation variables during gasification. Afterward, a new action intervention
was computed using the gradient method so that the cost function converges to extreme (i.e., maximum). The value of the iterative constant
h is chosen to ensure that the values in
will lead to the existence of the objective function and its continual maximization (i.e.,
). Constraints represent limitations for manipulation variables (i.e.,
,
, and
) and selected output variables (e.g., allowed concentration of oxygen in syngas) The principle of model-free ESC based on the gradient method applied on UCG is shown in
Figure 9 [
12,
24].
The presented optimal control was tested during gasification on an ex situ reactor where the syngas’s heating value was elevated from 4.4 MJ/m
to 8 MJ/m
(see
Figure 10).
Figure 11a shows the ex situ reactors (i.e., larger green and smaller gray), coal model preparation in the sizeable reactor G1 (see
Figure 11b), and the result from gasification with optimal control (see
Figure 11c,d). The coal model was bedded only on the right side of the reactor.
2.3. Model-Based Robust Control
Model-based robust control involves using a mathematical representation of the UCG process to create a controller that can effectively handle uncertainties and variations within the system. This advanced control is more complex than the mentioned PI control or SMC. Uppal and colleagues introduced a one-dimensional packed bed model for UCG, which they combined with a robust sliding mode controller (SMC) in a closed-loop configuration. This SMC approach aimed to maintain the desired syngas calorific value by adjusting the flow rates of the gasification agents, even in the presence of disturbances and model-related uncertainties. The input of the UCG process was the airflow rate during injection, while the output was the heating value of the produced gas.
Figure 12 shows the principle of SMC application in UCG.
The control law of SMC is represented by the following equation [
25]:
where
U represents the vector of control variables (i.e., injected flow rate of H
O, O
, and N
(moles/cm
.s)),
and
, which represent the equivalent and switching parts of the control effort. Parameters
t,
x,
s,
e, and
K represent the time (s), state vector, sliding function, control error, and positive constant, which determine the speed of trajectory converging to the sliding surface. Parameter
L represents the length of the UCG reactor (cm). Parameter
represents the sum of the syngas component concentration and
,
depends on the rates of the chemical reactions.
To address uncertainties stemming from coal and char ultimate analysis and the steam-to-oxygen ratio, an optimized version of the one-dimensional packed bed UCG model was proposed. Another advancement represents the robust dynamic integral sliding mode control (DISMC), which was recently developed to ensure the desired syngas calorific value is accurately tracked. Unknown states were estimated through a gain-scheduled modified Utkin observer (GSMUO) for effective model-based control. Compared with the integral sliding mode control (ISMC), described in a previous work by Uppal, the newly proposed controller exhibited enhanced performance. Notably, compared to the conventional SMC algorithm, the euro-adaptive sliding mode control (NASMC), introduced by Khattak et al. [
26], demonstrated superior syngas calorific value tracking capabilities.
2.4. Tracking the Syngas Calorific Value by Model Predictive Control
Another control principle proposed in [
27] was based on model predictive control (MPC) (see
Figure 13). A model predictive control (MPC) represents a robust control technique that can be applied to multivariable linear and nonlinear processes. UCG is also among such processes. This principle requires an internal prediction model in state space. In general, some applications of MPC for the gasification industry can be found in the literature (e.g., [
28,
29,
30,
31,
32]). Unfortunately, only insufficient evidence of this technique can be found for UCG [
27,
33]. In each control step, the MPC finds the optimized manipulation variables (i.e., oxygen flow, airflow, and regulated under pressure) while observing technological constraints and minimizing the cost function
J (i.e., measured the syngas’s heating value). The optimization in the MPC algorithm was based on quadratic programming. To imitate UCG, a data-driven machine learning model was used in simulations. The new optimal values will ensure tracking of the desired calorific value of the syngas. Such a control method is also called adaptive MPC (APMC) [
12,
27].
The simulation model designed in Matlab Simulink in each new control step calculated a new predictive autoregressive–moving-average model (ARX) from the linearized machine learning model. The ARX model is transformed into the state space for MPC. A model based on multivariate adaptive regression splines (MARSs) was used for UCG process imitation in simulation (see
Figure 14).
Figure 15 presents the course of the syngas’s heating value tracking and the behavior of optimized airflow by MPC and the discrete PI controller.
Figure 16 shows the behavior of the syngas’s heating value tracking by three optimized manipulation variables (i.e., air and oxygen volume flow and sucking relative pressure; see
Figure 17). Results show that a higher quality of calorific value tracking was obtained using three optimized manipulation variables instead of one. The MPC performed better when compared with the discrete PI controller [
27].
Recently, Chaudry et al. [
33] proposed a constrained linear model for model predictive control (MPC) of the UCG process. The unknown states of the MPC internal predictive model were reconstructed using a linear adaptive Kalman filter (AKF) and an unscented Kalman filter (UKF). The proposed control was compared with MPC based on an unscented Kalman filter predictor, with MPC based on a gain-scheduled modified Utkin observer (GSMUO) [
34], and with the control based on dynamic integral sliding mode control (DISMCGSMUO). The simulation was performed in an open-loop and closed-loop (see
Figure 18) [
35]. Research has shown that MPC with a linear adaptive Kalman filter (AKF) improves MPC in the absolute relative root-mean-squared error. In addition, the proposed MPC is more robust to changes in initial measurement values and process covariances [
33].
2.5. Model-Based Maximization of the Syngas Calorific Value
The ESC was also experimentally verified based on regression models in the linear and nonlinear form [
23,
36]. The regression models, whose parameters were continuously adapted based on measured data, calculated the optimal air (
) and oxygen flow (
) to keep the calorific value within the required limits (i.e., 1–3 MJ/m
, 3–6 MJ/m
, or >6 MJ/m
). The regression analysis was based on least squares. The first type of the model has the following form:
where
is the measured concentration of CO, CO
, and CH
in the syngas (%) and
T represents coal temperature in the gasification channel (
C).
For example,
Figure 19 shows online control using the proposed model that continuously calculates the optimal injected airflow based on five measured parameters. As a result, the control system maximized the syngas calorific value up to 10 MJ/m
[
23,
36].
2.6. Syngas Composition Prediction
Recently, a thermodynamic UCG model was developed to find the syngas composition at a known temperature and pressure [
37,
38]. The optimization task in the model was based on the method of Langrage multipliers. This model can predict the amount of injected gasification agents to the geo-reactor [
39,
40].
The regarded system consists of chemical equations of evaporation, pyrolysis, and heterogeneous and homogeneous reactions. The task is to determine the number of kilomoles of the system with
n equations that are stabilized in a state of equilibrium near a given temperature during a relatively short time. The model is based on minimizing the system’s total Gibson energy
G at the known temperature and pressure. Minimized is the following equation:
where
is the standard chemical potential, calculated as
where
R is the universal gas constant,
T is the temperature,
p is the pressure of the system (Pa), and
is the standard pressure. The model (i.e., its unknown parameters,
and
) can be found analytically by minimization of the Langrage function:
The model for known pressure and temperature can determine the composition of the products of gasification reactions at equilibrium (see
Figure 20) [
8,
9]. An alternative method for forecasting syngas composition relies on the use of partial differential equations [
41].
3. Effect of Gasification Agent on UCG
The choice and composition of the gasification agent, which can be air, oxygen, or steam, can significantly impact the gasification process. Optimizing the gasification agent involves determining the optimal oxygen ratio to coal, or steam to coal, to achieve the desired gasification reactions and syngas composition. Controlling the oxidant ratio (i.e., air, oxygen, or steam) to coal is crucial for optimizing gasification. The stoichiometric balance of the oxidant-to-fuel ratio influences the gasification efficiency, syngas composition, and heat release. Optimizing this ratio allows for efficient utilization of the available energy in the coal.
3.1. Effect of Additional Oxygen on the Calorific Value of Syngas
Air is usually used as the primary oxidizer during gasification experiments on ex situ reactors. Because, in actual gasification operations, oxygen-enriched air is used to improve syngas production, Kačur et al. [
11,
42] performed three ex situ trials where the impact of additional oxygen injected on the syngas calorific value was investigated. In the experimental reactor (see
Figure 11), the lignite blocks from the Cige’ mine (Slovakia) were gasified. The received coal had a total moisture of 22.25% and a calorific value of 13.74 MJ/kg.
Figure 21 presents the time behavior of the syngas calorific value of the syngas calculated from the composition and the percentage ratio of the oxygen volume flow to the airflow (i.e., V
/(V
+ V
) · 100). The figure shows that the syngas’s heating value also elevates with the increasing ratio.
Table 1 indicates the average syngas composition and heating value at different average temperatures and the considered ratio. The results show increased gasification efficiency with higher added oxygen to the oxidation mixture. Still, the economic return of UCG must be considered, considering that oxygen production can be expensive.
Feng et al. [
43] confirmed that gasification with oxygen, unlike gasification with air, brings higher temperatures in the oxidation zone and a higher quality of syngas, and the reaction zone is closer upstream. In addition, they found that, although an increased gasifier flow can improve syngas quality, it can also cause coal cooling. Moreover, they experimented with the initial gasification channel length (
). Their findings revealed that igniting the gasification at
results in higher temperatures than ignition at
, leading to a shorter effective syngas production time (
). However, this time increases as the gasification channel increases. The reaction zone is closer to the upstream with a wider gasification channel. In addition, they found that, although an increased gasifier flow can improve syngas quality, it can also cause coal cooling. The increased oxygen concentration in the oxidation mixture was evaluated as an effective tool for increasing the calorific value while increasing the flow rate of the input oxidizer will extend the effective time of syngas production. By increasing the oxygen flow, it was possible to increase the temperature of the oxidation zone up to 1300
C and the syngas’s heating value to 12.1 MJ/m
. When air was injected, the oxidation zone’s temperature was lower, resulting in a lower calorific value of syngas. Other researchers, e.g., Zagorscak et al. [
44] found that when the flow rate increased from 6 Nm
/h to 10 Nm
/h during air gasification, the proportion of CO and CO
in syngas increased. And, the average heating value and maximum heating value of gas produced under air at 10 m
/h were lower than those under air 6 m
/h. Stanczyk et al. [
45] found that compared with air gasification, in oxygen gasification, the proportion of CO, CO
, H
, and CH
syngas and heating value is higher, which is consistent with the results obtained in [
43].
3.2. Effect of Gasification Agent on Tar Concentration
The tars from UCG are black, viscous liquids with visible inclusions of dust and high-molecular-weight agglomerates. Smaller-scale experiments are useful for studying the tar evolution mechanisms in coal gasification. Researchers usually sample from the syngas or the neighboring water. Wiatowski et al. [
46,
47] carried out a series of measurements on the yields, composition, heating value, density, and viscosity of tar samples in the UCG trial at Mine “Wieczorek” and “Barbara” (Poland). Xu et al. [
48] investigated the relationship between tar behaviors, including its yields, viscosity, and composition at low pyrolysis temperature, and tar formation in a fixed bed reactor. Xu et al. [
49] found the tar yield decreased with the increase in pyrolysis temperature on a high-temperature tube furnace in UCG conditions.
In their study, Dong et al. [
50] investigated the spatial and temporal changes of tar during ex situ coal gasification. They carried out multiple experiments, varying the flow rates of gasification agents (i.e., oxygen and air), and analyzed the tar composition at different locations and time intervals. The artificial coal bed consisted of bituminous coal cut into blocks with gasification channels and channels for tar removal. The coal moisture was 14.39%, and the ash content was 5.67%. They found that the concentration of tar in the reaction zone decreased during gasification with oxygen. Also, the percentage of PAHs (i.e., polycyclic aromatic hydrocarbons) fell when the oxygen flow rate increased from 10 to 15 L/min.
Moreover, with this increase in oxygen flow, a decrease in carbon emissions in the gases and an increase in the percentage of tar were observed. The tar concentration was found to be much lower in gasification with air than in gasification with oxygen. In addition, when the airflow rate increased (i.e., from 10 to 50 L/min), a more even distribution of concentration and tar composition occurred. Carbon emissions also decreased, but the percentage of tar-polluting substances increased. The highest temperature of more than 1300 C was reached during gasification with pure oxygen. With air, this temperature was only reached at a flow rate of 50 L/min.
Pankiewicz-Sperka et al. [
51] have found that the higher values of PAHs were in the case of wastewater from semi-anthracite while from bituminous coal gasification PAHs values are in lower ranges. Studies have shown that concentrations of phenols, BTEX, and PAHs decrease with increasing pressure. Other results showed that the yield and viscosity of tar increased with the increase in heating rate and pyrolysis temperature [
48]. In addition, the tar yield under a hydrogen atmosphere was observed to be higher than that under a nitrogen, carbon dioxide, methane, and carbon monoxide atmosphere. The tar yield increased gradually with the increasing of H
flow rate [
49].
3.3. Effect of Gasification Agent on Cavity Growth and Syngas Production
The experiments reported in [
52,
53] showed the cavity growth under certain operating conditions in a horizontal channel of a coal block, through which the flow of gas takes place. It was assumed that the cavity size and shape are likely to substantially impact the gasification extent. The effect of the gasification agent on cavity enlargement during coal gasification was investigated by Daggupati et al. [
54]. Moreover, they studied various UCG operating parameters required to convert coal to syngas (i.e., initial burn time, steam-to-oxygen ratio, feed water temperature). They gasified an artificial coal seam with a moisture of 40%. The mixture of steam and oxygen was injected to support ex situ coal gasification. The experiments have shown that the optimum oxygen-to-steam ratio depends on the type of coal being gasified. Several experiments showed that this optimal ratio is 2.5. During the test, they produced syngas with a heating value of 178 kJ/mol and content of H
in the syngas of up to 38%. Moreover, the gasification cavity’s growth rate was observed to be relatively higher than that of the cavity of coal combustion. It was mainly due to the higher speed of the reaction gases in the case of gasification. The speed of the cavity enlargement also significantly affects the coal spalling, increasing the reaction surface. It was also found that the cyclic steam injection into the cavity could cause thermal shocks due to structural failures of the coal. Shu-qin et al. [
55] have also reported that the optimum value of the ratio of injected steam and oxygen for lignite is circa 2.5. Hettema et al. [
56] have experimentally demonstrated that the surface material cracks and breaks due to local temperature variations and they have also shown the effect of steam pressure on thermal spalling using laboratory-scale experiments.
4. High-Pressure Coal Gasification
Among the essential operational parameters of UCG, the process pressure stands out as particularly significant. The pressure during UCG operations impacts the gasification rate, syngas composition, and the thermodynamic equilibrium of the reactions. Pressure optimization involves determining the optimal range that provides high gasification efficiency, syngas quality, and reactor stability. A higher operating pressure can positively affect the concentration of methane and hydrogen, ultimately affecting the syngas’s calorific value [
57]. Existing numerical models considered UCG up to a pressure of 0.5 MPa [
58,
59,
60,
61]. Recently, a UCG test was conducted in Alberta (Canada) with an operating pressure of up to 12 MPa. Increased operating pressure mainly affects the kinetics and balance of gasification. For example, recent research has shown that reaction rates increase by 1.5–2.0 MPa [
62]. Experiments by Roberts and Harris [
63] with coal reactivity in the presence of CO
and H
O at pressures ranging from 0.1 to 3.0 MPa demonstrated that reaction rates elevate as the pressure increases. Still, the rate of increase decreases or may be constant at higher pressures. Studies of the effect of pressure on pyrolysis have shown that pressure reduces the extent of pyrolysis [
64]. The study [
65] showed that increased pressure has a negligible effect on gaseous products and coal pyrolysis but a more significant impact on chemical reactions. Research conducted in [
66,
67,
68] indicates that, as the coal seam depth increases, the hydrostatic pressure is elevated, and there is a corresponding need to utilize higher pressures in the gasification process. The deeper coal allows for significantly elevated pressures in the georeactor, leading to higher methane content and, consequently, a higher calorific value of the gas, as observed in Bhutto’s study [
1].
4.1. Methane-Oriented Gasification of Semi-Anthracite and Hard Coal
The research on the gasification of hard coal in an underground environment at an elevated pressure of 0.5 MPa was conducted by Wiatowsky et al. [
69]. The coal used for gasification was sourced from Poland’s Upper Silesia coal basin. The gasification was supported using pure oxygen, air, and oxygen-enriched air. Their experiment showed that the increased pressure most affected the thermodynamic conditions during gasification with only oxygen. Higher methane and carbon dioxide concentrations were achieved at a higher pressure than gasification under atmospheric pressure. It was found that the concentration of combustible components in syngas and the syngas calorific value increased in proportion to the oxygen content in the gasification agent. During gasification with oxygen, the average calorific value of syngas was 8.1 MJ/Nm
, and the average energy efficiency of gasification was 60.5%. Changing the gasification agent in the air resulted in a decrease in temperatures, the concentration of combustible components in the syngas, and the average calorific value of the syngas (2.1 MJ/Nm
) (see
Table 2).
An increased concentration of methane at higher operating pressure was also noted by Kapusta et al. [
70]. They have performed gasification with two types of coal (i.e., “Six Feet” semi-anthracite (Wales, United Kingdom) and “Wesoła” hard coal (Poland)) at different operating pressures (i.e., 20 and 40 bar) with pure oxygen and a mixture of oxygen and steam. The experiment also showed that 40 bars gradually increased the syngas production rate (see average CH
at 20 and 40 bar in
Table 2). Furthermore, the efficiency increased with higher gasification pressure in both cases. It was found that a mixture of oxygen and steam supported heating better than oxygen alone (see
Figure 22). During the experiments, no significant influence of the pressure on the temperatures in the reactor was recorded.
Figure 22.
Changes in gas calorific value throughout gasification experiments: (
a) “Six Feet” semi-anthracite at 20 bar; (
b) “Wesoła” hard coal at 20 bar; (
c) “Six Feet” semi-anthracite at 40 bar; (
d) “Wesoła” hard coal at 40 bar [
71]. Reproduced under
CC BY 4.0.
Figure 22.
Changes in gas calorific value throughout gasification experiments: (
a) “Six Feet” semi-anthracite at 20 bar; (
b) “Wesoła” hard coal at 20 bar; (
c) “Six Feet” semi-anthracite at 40 bar; (
d) “Wesoła” hard coal at 40 bar [
71]. Reproduced under
CC BY 4.0.
Table 2.
Results of laboratory UCG tests with different types of coal and operating pressures.
Table 2.
Results of laboratory UCG tests with different types of coal and operating pressures.
| Coal | Origin | Coal Characteristic (As Received) | Gasification
Agent | Pressure
(Bar) | Average Syngas Composition (vol.%) | Average
Calorific
Value
(MJ/Nm) | Reference |
|---|
Moisture
(%) | Ash
(%) | Volatiles
(%) | Total
Sulphur
(%) | Calorific
Value
(kJ/kg) | CO | N | H | CH | CO | CH | HS |
|---|
“Six Feet”
Semi-anthracite | South Wales,
UK | 1.15 | 4.61 | 9.92 | 1.55 | 33,416 | O + HO | 20 | 36.3 | 0.4 | 19.2 | 15.8 | 27.2 | 0.7 | 0.4 | 11.7 | [70] |
| | | | | | | | O + HO | 40 | 41.6 | 0.6 | 14.1 | 19.1 | 23.2 | 1.1 | 0.3 | 12.1 | [70] |
| | | | | | | | O, O + HO,
Air, Air + O,
Air + O + HO | Atmos. | 28.9 | 18.8 | 18.1 | 2.3 | 31.6 | 0.1 | 0.3 | 6.9 | [44] |
| | | | | | | | O, O + HO,
Air, Air + O,
Air + O + HO | 30 | 38.4 | 16.9 | 12.0 | 11.8 | 20.1 | 0.6 | 0.3 | 8.5 | [44] |
| | | 0.88 | 2.99 | 13.42 | 0.7 | - | HO + O | 36 | 52.0 | - | 20.9 | 15.3 | 6.3 | - | - | 8.6 | [72] |
“Wesoła”
Hard Coal | Upper Silesia,
Poland | 3.60 | 8.74 | 27.67 | 0.31 | 28,798 | O + HO | 20 | 46.3 | 0.7 | 21.6 | 10.9 | 19.5 | 0.6 | 0.4 | 9.2 | [70] |
| | | | | | | | O + HO | 40 | 46.1 | 0.7 | 17.7 | 14.8 | 19.3 | 0.9 | 0.5 | 10.4 | [70] |
| | | | | | | | HO + O | 36 | 56.3 | - | 15.7 | 14.6 | 6.3 | - | - | 7.7 | [72] |
| | | 3.88 | 14.79 | - | 0.72 | 24,638 | O | 0.5 | 36.6 | 0.5 | 32.1 | 3.7 | 27.0 | 0.1 | - | 8.1 | [69] |
| | | | | | | | Air | 0.5 | 17.5 | 68.9 | 8.2 | 2.0 | 3.3 | 0.0 | - | 2.1 | [69] |
| | | | | | | | Air + O | 0.5 | 21.3 | 53.7 | 9.3 | 2.6 | 12.9 | 0.2 | - | 3.3 | [69] |
| Ortho-lignite | Oltenia,
Romania | 45.64 | 8.86 | 25.78 | 1.49 | 10,642 | O | 10 | 75.5 | 1.1 | 13.9 | 3.6 | 4.1 | 0.2 | 1.5 | 3.9 | [73] |
| Meta-lignite | Velenje,
Slovenia | 31.62 | 4.29 | 43.67 | 0.51 | 13,615 | O | 35 | 75.3 | 1.3 | 10.5 | 8.7 | 2.4 | 0.6 | 1.2 | 5.0 | [73] |
Likewise, a positive effect of increased operating pressure (i.e., from 20 to 36 bar) and doubling the amount of injected steam concerning oxygen on methane production was reported by Sadasivam et al. [
72]. The research also revealed that raising the temperature from 650
C to 850
C enhanced methane production. Under the conditions of this optimal temperature, an operating pressure of 36 bar, and a H
O:O
ratio of 2:1, the average concentrations of CH
in syngas were measured at 15.34
vol.% for semi-anthracite coal and 14.64
vol.% for bituminous coal. CH
concentration increased by 94% and 129% for “Six Feet” and “Wesoła” coal. From a practical point of view, maintaining the optimum temperature for methane production depends on the amount of water and hydrogen in the georeactor. Therefore, it is necessary to assess the hydrogeology of the coal deposit.
Further gasification trials published [
44] with “Six Feet” semi-anthracite coal confirmed that, under atmospheric pressure, syngas with a lower calorific value (6.92 MJ/Nm
) was produced compared to under increased pressure 30 bar (8.49 MJ/Nm
) (see
Table 2). The linked vertical wells (LVWs) technique combined with the controlled retracting injection point (CRIP) was used for gasification. Likewise, the energy efficiency of gasification was lower in atmospheric gasification (51.72%) than in high-pressure gasification (57.67%), which was caused by higher methane production. The syngas contained a slightly lower calorific value when using oxygen as a gasification agent at 30 bar. Syngas contained more methane but less H
and CO than in atmospheric gasification with oxygen.
The positive effect of increased gasification pressure was also recorded in ex situ hydrogasification. Recently, Kapusta et al. [
74] have performed experimental trials of methane-oriented UCG using hydrogen. Hydrogen was used as the gasification medium. They investigated the effect of coal quality and gasification pressure on hydrogasification. In underground coal hydrogasification (UCHG), coal is gasified under increased pressure, which is related to the depth of the seam. This operation should not exceed the hydrostatic pressure of the water to avoid contamination of the surrounding layers, as reported in [
57]. The experiments were performed on different types of coal, semi-anthracite “Six Feet” and hard coal “Wesoła” (Poland). It was found that the operating pressure and the physicochemical properties of coal affect hydro-gasification. Syngas obtained from “Six Feet” semi-anthracite demonstrated higher methane content at the specified pressures. Specifically, during the H
phase of the experiment, the average methane concentration for “Six Feet” semi-anthracite was recorded at 24.12% at 20 bar and 27.03% at 40 bar.
On the other hand, in the gasification of “Wesoła” black coal, CH concentrations were higher by 19.28% and 21.71% at 20 and 40 bar. Experiments have shown that the composition of syngas from UCHG depends not only on the coal grade but also on the gasification pressure. A negative correlation was found between gasification pressure (i.e., O and H) and syngas production rate and yield.
4.2. Ortho-Lignite and Meta-Lignite Gasification
Comparison of gasification low-quality Ortho-lignite Oltenia (Romania) and Meta-lignite Velenje (Slovenia) was recently performed by Wiatowski et al. [
73]. Both types of coal had a high moisture content. Oxygen was used as a gasification agent with a pressure of 10 bar (i.e., for Oltenia lignite) and 35 bar (i.e., for Velenje lignite). The results showed that operating pressure and physicochemical properties significantly affect gasification. The higher content of moisture in Oltenia lignite enabled it to efficiently produce H
and CH
over an extended duration. Although the gasification of Oltenia brown coal brought a more stable production of syngas, and the methane and carbon dioxide concentrations were increased at a pressure of 10 bar, this type of coal contained more moisture, which led to significant heat loss due to excessive water evaporation. Overall, Velenje lignite’s gasification produced better results than the Oltenia lignite process (see
Table 2).
Table 2 shows summary results of previously discussed laboratory tests with different types of coal and operating pressures. The summary shows that the highest average calorific value of syngas (12.1 MJ/Nm
) was recorded in the gasification of semi-anthracite coal under a pressure of 40 bar with the help of oxygen and steam, and the lowest (2.1 MJ/Nm
) during the gasification of hard coal with air. In general, at lower operating pressures, the average calorific value of the syngas was lower.
5. Gasification of Lignite with Different Gasification Agents
Lignite coal has a relatively high moisture content compared to other coal types. The presence of moisture can affect the efficiency of the gasification process, as it requires additional energy to evaporate the water present in the coal. It can reduce the overall energy efficiency and make the process less economical. In addition, lignite is low-rank coal with a lower calorific value than higher-rank coal such as bituminous or anthracite coal. The lower energy content of lignite can limit the amount of useful gas produced during the gasification process. It means that more lignite may need to be gasified to obtain the same amount of energy, resulting in increased operational costs and potentially lower gas quality. Several ex situ experiments with lignite gasification have been performed. Optimum gasification conditions, various gasification reagents, and gasification techniques were investigated. The following subsections discuss the experiments performed and the results obtained.
5.1. Gasification of Lignite with High Moisture
The combination of low-heating coal with higher moisture can be critical in the decision to start UCG operation. Kostúr et al. [
75] experimentally gasified low-calorific lignite (i.e., from mine Cigel, Slovakia) with moisture of 38.2%. They used only air as a gasification agent. An experiment was also performed with technical oxygen added to the air. The trials showed that higher coal moisture had a beneficial impact on water vapor formation. In turn, it led to the cooling of the oxidation zone on the one hand, while on the other hand, it contributed to the higher enthalpy of gases in the subsequent gasification areas.
Additionally, the increased water vapor facilitated increased methane concentrations due to chemical reactions involving oxygen, water vapor, and carbon. However, the downside was the augmented consumption of thermal energy generated in the oxidation zone, primarily used for water evaporation. The calorific value of the syngas was 2.5–5 MJ/Nm
when only air was injected. When a mixture of air and oxygen was used, the calorific value reached 10 MJ/Nm
(see
Table 3).
The results from gasification of Slovak lignite were also reported by Laciak et al. [
76]. The experiments used the same gasification technique and the same ex situ reactors as in [
75]. The air was used as the primary gasification agent, and technical oxygen was added to injected air in a short period of the experiment. The average calorific value of produced syngas was 3.27 MJ/Nm
when injected with air and 4.13 MJ/Nm
when injected with oxygen (see
Table 3). During the experiment, approximately 30% of the chemical energy of the coal was transformed into the energy of the produced syngas.
A comparison of lignite and hard coal gasification was performed by Stańczyk et al. [
45]. The gasified lignite had a moisture content of 53.0% and hard coal had a moisture content of 1.6%. The coal was gasified with air and a mixture of oxygen-enriched air. The experiments showed that gasification only with the air caused a drop in temperatures and a decrease in the calorific value of the syngas, and eventually, the gasification reactions stopped.
On the other hand, gasification by the mixture of oxygen and air with a ratio of 4:2 produced syngas with a higher calorific value. In the gasification of hard coal, the quality of the produced syngas was higher than in the case of lignite for all gasification agents (see
Table 3 and
Table 4).
Large bulk lignite samples were experimentally gasified by Kapusta [
71]. The research focused on the possibilities of gasification of two different types of lignites, i.e., “Velenje” meta-lignite (Slovenia) and “Oltenia” ortho-lignite (Romania), with an average moisture content of 31.6 wt% and 45.6 wt%. Temperatures in the reactor were measured using 14 sensors (see
Figure 23). Air, oxygen, and water vapor, injected individually or supplied as a gas mixture, were used as gasification agents (see
Figure 24a,b).
UCG tests were performed under near-atmospheric pressure conditions. Velenje lignite’s gasification resulted in an average heating value of 6.4 MJ/Nm
and a gasification efficiency of 44.6%. During the gasification of Oltenia, lignite was 4.8 MJ/Nm
, and the gasification efficiency was 33.4% (see
Figure 24c,d). The primary reason for this difference is the higher moisture and ash content in the Oltenia lignite sample utilized in the test.
Experiments showed that the lignite’s physicochemical properties significantly influence the in situ gasification process. Research also recommends gasifying lignite with lower moisture content and higher energy density [
71].
The results from the gasification of ortho-lignite with higher humidity were also presented in the work [
81]. The average moisture content of the coal was 46.5%. The artificial coal seam was gasified under atmospheric pressure with a higher oxygen flow rate of up to 5 m
/h. The average heating value of syngas was 7.2 MJ/Nm
(see
Table 3), and the gasification efficiency was 59%, which is close to the gasification of black coal [
46,
83]. The results prove that the given type of wet brown coal (i.e., Miocene ortho-lignite) can be gasified with oxygen with good syngas quality. It was found that the high moisture content of lignite eliminates the need to supply additional water and the gasification agent in the initial stages of the gasification process. Excess water can reduce the efficiency of gasification due to significant heat losses. The experiment shows that the poor mechanical strength of the lignite in the deposit could influence the mining of UCG lignite deposits, as it may cause the collapse of the seam roof and uncontrolled gas flow. Therefore, for such coal seams, a geomechanical analysis of the stability of the overlying layers is necessary.
Previous studies (e.g., [
84]), which presented results from the gasification of similar wet Miocene lignites, achieved a syngas calorific value of only 5 MJ/Nm
and a low UCG efficiency. However, these field tests were performed at high pressures (approximately hydrostatic) to increase syngas quality and UCG efficiency [
1]. In addition, passing studies on lignites were performed on shorter coal seams, resulting in heat loss to evaporate water. It is assumed that the geo-rector dimensions influence the gasification efficiency of high-moisture lignites.
5.2. Three-Stage Lignite Gasification
Three-stage lignite gasification was tested by Stańczyk et al. [
77]. In this technique, the coal was ignited in the first stage, then heated and gasified with oxygen, and in the last stage, steam gasification was carried out. They gasified coal with a moisture content of 53%. The results showed that the given coal was not suitable for steam gasification. During gasification, significant heat losses occur as a result of heat consumption and evaporation of water from coal. During gasification with oxygen in the stable operation of the reactor, the average calorific value was 5.2 MJ/m
. The analysis results showed the regular development of individual zones of the cavity during the experiment. Therefore, it is necessary to control the flow of water in the lignite layer and the surrounding layers with a suitable technique. It is also recommended that the lignite layer be thicker to prevent heat dissipation because it increases with the contact surface between the reaction space and the adjacent layer. The comprehensive review of cavity growth measurement techniques was well-discussed in [
85]. Laboratory studies on cavity growth and product gas composition in the context of UCG was also studied in [
54].
5.3. Gasification of Turkish Lignite
Gur et al. [
78] gasified Turkish lignite with moisture 25.17%. Oxygen, air, steam, and their mixtures in different proportions were used as gasification agents. The test found that most calorific syngas was produced in gasification with oxygen (6–9 MJ/Nm
) (see
Table 3). In the pure oxygen phase, the syngas had a heating value of 5.14 MJ/m
. When injecting a mixture of air with technical oxygen, a lower-quality syngas was produced (i.e., 3.87 MJ/m
). The experiment revealed that the optimal air/oxygen ratio by volume was 2:1.
Turkish brown coal has a relatively low moisture content, predisposing it to low hydrogen production. In further research, Gur et al. [
79] performed an ex situ UCG hydrogen-oriented experiment with Turkish lignite with a moderate moisture of 22.83. Oxygen and steam were injected into the ex situ reactor. When only oxygen was injected, the average heating value was 4.28 MJ/Nm
. When using steam as a gasification agent, the average heating value was 4.56 MJ/Nm
. The highest recorded syngas’s heating value was 8.30 MJ/Nm
. However, it should be noted that steam was added only at the stage when the lignite block was preheated (i.e., by the two-stage gasification method) to extend the hydrogen production time. In the first phase, the combustion reactions were supported, and the coal was heated by injecting air or oxygen-enriched air. In the second phase, only water vapor was injected, which supports hydrogen production. This technique was also investigated in [
77,
86].
5.4. Gasification of Chinese Lignite
Liu et al. [
80] have researched the effect of different gasification agents on the gasification efficiency of Chinese coal in a cylindrical ex situ reactor (see
Figure 25). The coal seam model consisted of coal lumps connected by clay and powdered coal (see
Figure 26). The reverse gasification technique was employed, comparing the use of air solely and oxygen-enriched air as gasifying agents.
The research results showed that a proportion of combustible components in the syngas that is higher than the total calorific value can be achieved using oxygen with a concentration higher than 21% in the oxidizing mixture.
The course of gasification and composition of syngas is presented in
Figure 27.
Figure 27a shows the increased concentration of the combustible syngas component and average calorific value when enriched oxygen was employed as the gasifying agent. The average calorific value, in this case, was 1430.19 kcal/Nm
(i.e., 5983.12 kJ/Nm
) (see
Table 3). It turned out that gradually increasing the gasifying agent’s flow rate also increases the combustion front’s speed (see
Figure 27b). Moreover, it was shown that the gasification rate was higher when using oxygen-enriched air than when using air as a single oxidizer. Moreover, the enriched mixture induces a faster flame front movement towards the gas-injection well in reverse gasification, where the oxidant is injected from one well. In reverse gasification, the entire coal seam is positioned in the reaction zone, resulting in significantly longer reduction and dry distillation zones than when air is utilized (refer to
Figure 28).
The results from previously discussed experiments are summarized in
Table 3. The summary shows coal analysis, used gasification agent, final product analysis, and syngas calorific value. The great potential to be used in practice has three-state or two-state steam gasification reported in [
77,
79]. Alternating the oxygen of steam as a gasification agent contributed in several experiments to the stable production of syngas with a calorific value of 5–7 MJ/Nm
.
6. Gasification of Hard Coal
Hard coal is often considered suitable for underground gasification. This type of coal has high carbon content (i.e., typically above 80%) and low volatile matter content, which refers to the components of coal that vaporize or transform into gases at relatively low temperatures. Low volatile matter content reduces the risk of excessive gas pressure or uncontrolled combustion during the gasification process, making it safer and more manageable. Hard coal exhibits relatively high porosity, with many tiny pores and crevices. This porous nature facilitates the flow of gases and liquids within the coal bed, allowing for better distribution of heat and reactants during gasification.
Moreover, hard coal has a high energy density, meaning it contains a large amount of energy per unit of volume or mass. This characteristic makes it an efficient fuel source, as it can produce a substantial amount of syngas when subjected to gasification. Hard coal is known for its stability and resistance to deformation under high temperature and pressure conditions.
Gasification of Hard Coal Seam with a Siderite Layer
Siderite is an iron carbonate mineral occasionally found in coal seams. Its presence in coal seams can be attributed to several factors (e.g., paleoenvironmental conditions, organic matter decay, or diagenetic processes). Wiatowski et al. [
82] have performed a gasification test in an ex situ reactor (
Figure 29) with low moisture hard coal and a 2 cm siderite layer (see
Figure 30), using technical oxygen with a constant flow rate of 4.5 Nm
/h as an oxidizer. The surroundings of the coal were simulated with sand with 11% moisture.
The results showed that siderite has no direct effect on the course of gasification. On the other hand, the water contained in the sand had the most significant influence on the gasification efficiency. The average calorific value of the produced syngas was 9.71 MJ/m
(see
Figure 31).
Another hard coal gasification result with a 2 cm siderite layer was reported in [
87]. The configuration of the artificial coal seam seam was similar to [
82]. As listed in
Table 4, the produced syngas had an average heating value of 9.41 MJ/m
. The calculations showed that only 34.1% of the bedded siderite was decomposed into CO
, which has little effect on the CO
balance during gasification. The depicted isolines with the concentration of CO
in the siderite layer after gasification provide a view of the location of the high-temperature zones in the reactor (see
Figure 32).
7. Modeling Temperatures in UCG
Temperature modeling helps to optimize the UCG process by providing insights into temperature distribution and profiles within the coal seam. It helps to identify regions of high and low temperatures, enabling the adjustment of process parameters to achieve more efficient and controlled gasification. The UCG operation can be optimized by understanding temperature variations to maximize gas production and minimize undesirable byproducts. By understanding temperature dynamics, appropriate measures can be taken to ensure the stability and integrity of the UCG process, reducing the risk of accidents or operational failures. Temperature modeling helps to understand the temperature profiles and gradients in the surrounding rock formations and aquifers, thus enabling the evaluation of potential heat transfer and groundwater contamination risks. In addition, temperature modeling allows for real-time process monitoring and control during UCG operations. By predicting and analyzing the thermal effects, steps can be taken to minimize or mitigate the impact on the surrounding environment.
Although thermocouples in ex situ reactors can measure temperatures, their utilization in in situ coal gasification can be problematic, given that the reactor is underground. Therefore, various proxies (e.g., radon emanation [
89,
90], carbon isotopes [
91], or acoustic emission measurement [
92]) and model-based soft sensors are used to determine the underground temperature. The model-based temperature prediction is discussed in the following sections.
7.1. Modeling Based on the Theory of Non-Stationary Heat Conduction
A temperature model based on the theory of non-stationary heat conduction and measured ex situ data was developed by Kostúr et al. [
93]. The temperature prediction model relied on Fourier’s partial equations for the solid phase, encompassing coal and rock. The model is based on the following equation:
where
c represents the specific heat capacity (J.kg
),
is the density (kg.m
),
x,
y are the coordinates (m),
t is the temperature (
C),
is the thermal conductivity (W.m.K
),
is the time (s),
j is the index of
j-th layer.
The system of equations (
10) can solve each layer in overburden, including coal. It means that the mathematical model for coal and overburden consists of
L layers (i.e., coal, sandstones, claystone, …).
The mathematical model was solved using the first boundary condition, defined by the measured temperature on the interface of the gasification channel and the coal. The model considers only very low heat transfer by convection in the
y axis direction due to the limited permeability of underground rocks for gas streaming. Heat transfer by radiation and convection in the
x axis direction was mainly relevant within the gasification channel. The proposed 2-D model to simulate gasification front movement was regarded for one gasification channel. The input to the model was the ambient temperature
and temperatures measured in the gasification channel (see
Figure 1). The model’s output was the coal’s predicted temperature at the selected position (e.g.,
, see
Figure 33). The results showed excellent accordance between the simulated and measured temperature (see
Figure 34).
7.2. Data-Driven Modeling Based on Regression Models
For temperature prediction, regression models calculated from measured ex situ data were also proposed. Durdán et al. [
94] modeled the temperature in a small ex situ reactor using multiple linear regression models. Compared to the previous approach [
93], applying thermo-physical parameters to the calculation is unnecessary. They performed two UCG experiments with Slovak Cigel’s coal glued with tar, coal dust, and water (see
Figure 35). The experiments differed in the weight of bedded coal (i.e., 214 kg vs. 472 kg), the diameter of the gasification channel (i.e., 20 mm vs. 40 mm), the maximum temperature reached (1200
C vs. 1400
C), and the calorific value of the syngas (i.e., 2.5 MJ/m
vs. 5 MJ/m
). The model preparation and results after gasification are shown in
Figure 36. Recorded process data were used in temperature modeling by regression analysis.
Various measured variables from experimental gasification (i.e., oxygen and airflow, exhaust fan speed, the calorific value calculated from syngas composition, and measured coal temperatures) were used as independent variables in regression analysis. The regression parameters were calculated using the least squares method for different modeled temperatures in the gasification channel. The simulation results achieved were outstanding.
Figure 37 shows the excellent agreement of the modeled and measured temperature in the gasification channel. From the comparison, we can see that the regression model achieved better performance in the case of the first experiment.
7.3. Machine Learning Approach
Machine learning is a type of artificial intelligence (AI) that allows software applications to become more accurate at predicting outcomes without being explicitly programmed to do so. Machine learning algorithms use historical data as input to predict new output values. Kačur et al. [
95] proposed and verified several data-driven machine learning models for forecasting the syngas’s heating value and temperature in the oxidizing zone. The models investigated were back propagation neural networks (BPNNs) [
95], multivariate adaptive regression splines (MARSs) [
27,
95,
96], and support vector regression (SVR) as a part of support vector machines (SVM) [
97]. The models were trained on data from experimental trials on ex situ UCG reactors. The experimental data were divided into training and testing sets, and statistical indicators evaluated the performance of the models (
Figure 38). For example,
Figure 39a shows the SVR prediction of underground temperature in the oxidizing zone based on measured syngas composition. These models achieved higher prediction performance than classical multivariate linear regression models.
On the second side, the syngas’s heating value can be predicted from the volume flows of gasification agents measured (i.e., steam, oxygen, and airflow) (see
Figure 38b). The size of the training set and the number of input observations, as well as the setting of the learning parameters have an impact on the prediction performance both in the phase of training on known data and in the stage of testing the model on unknown input data (e.g., adjustable can be the number of neurons in the hidden layers of the NN, the types of the kernel functions in SVM, or the types of the MARS model). Learned or trained models, however, can be used as an effective tool for temperature soft sensing or calorific value prediction in advanced control algorithms.
Figure 40 shows principle of adapted soft sensor based on a data-driven machine model [
27,
95].
For example, in Support Vector Regression (SVR) the data
are mapped into a high-dimensional feature space, to do linear regression in this space. Non-linear SVR finds the optimal function
in the transformed predictor space. The prediction function has the following form [
98,
99]:
where
y is target variable,
is the kernel matrix of inner products between all pairs of points
,
and
are non-negative Lagrange multipliers for each observation
,
is the vector of the observations where
l denotes the size of sample. A threshold
b can be determined from the Lagrange multipliers.
Observations with nonzero Lagrange multipliers are called support vectors. The prediction of new values is based on a function that depends only on the support vectors. Lagrange coefficients can be found by minimization of the following function [
95,
98,
99]:
subject to the constraint and Karush–Kuhn–Tucker complementary conditions required to obtain the optimum.
The minimization problem can be solved by common quadratic programming techniques, e.g., the chunking and working set method, sequential minimal optimization (SMO), or iterative single data algorithm (ISDA) [
98,
99].
For comparison, the MARS model is based on the so-called basis functions, which express the mutual interaction of input observations. The MARS model can be expressed by the following equation [
100]:
where
y represents the output variable,
is the vector of input variables,
M is the number of basis functions in the model (i.e., number of spline functions,
is the coefficient of the constant basis function
, and sum is over the basis functions
).
A good comparison of SVR and MARSs was also made in [
101]. The research showed that both methods perform similarly depending on the training set. Although in [
95], the SVR-based machine model performed slightly better in temperature prediction, MARS-type models are more portable and can be quickly implemented into control algorithms. For example, the MARS model has been successfully applied to test AMPC [
27] and ESC [
96] for UCG imitation and prediction model adaptation. The disadvantage of MARS-type models is the high computational complexity in the machine-modeling phase. The disadvantage of the neural network is frequent overfitting and the need for the experimental setup of the network [
95].
7.4. Application of Geostatistical Methods
Laciak et al. [
102] and Kostur et al. [
9] have applied geostatistical methods in spatio-temporal modeling of temperature changes of UCG experimental trials. They used the Kriging method for modeling temperature fields in a georeactor. Kriging is a geostatistical estimation procedure to interpolate or predict values at unobserved locations within a spatial domain. The Kriging process involves constructing a mathematical model that characterizes the spatial correlation of the variable across the study area. Utilizing the principles of geostatistics and Isatis’s geostatistical environment, a spatiotemporal model was developed to analyze temperature changes within the experimental generator during laboratory trials of UCG (see
Figure 41).
This model was created from measured temperatures from an ex situ UCG experiment. The vertical dimension in a spatial-time model of temperature represents time. A time-space model of temperature changes or temperature sections was derived from this model, which was used to analyze the movement of the combustion front in the UCG reactor. Individual time sections of temperatures in the reactor were analyzed using ArcGIS-ArcMap software, in which an animation of the movement of temperature zones in time and space was created. Such an animation provides insight into the dynamics of the process. The model can calculate the movement vectors of temperature zones. From the space-time visualization of the gasified layer, it is possible to transform even the in situ UCG. It is possible to identify places with high temperatures or places with tectonic faults. It is also possible to locate drying, oxidation, and reduction zones.
8. Research of Gasification Techniques
Various gasification techniques, such as linked vertical wells (LVWs), retreating injection points (CRIPs), or reverse gasification, are tested in the UCG experimental tests. These techniques are used alone or in combination to enhance the permeability of a coal bed and to increase the efficiency of UCG. Some methods for connecting injection and production wells have been well documented in [
11,
103]. In the following sections, applications of these techniques in ex situ tests will be reviewed.
8.1. Reverse Gasification
Dobbs and Krantz [
104] investigated the combustion front propagation in UCG and designed one of the first experimental gasification reactors. They used a technique of reverse gasification. The research also aimed to determine the amount and composition of syngas produced under different pressures in the reactor. This UCG research used a pressure vessel as a gasification container. The container was loaded with blocks of sub-bituminous coal and a mixture of oxygen and nitrogen-supported reverse combustion under a pressure of 200 kPa. It was found that, in reverse gasification, the combustion front moves upstream of the oxidizer flow. The fuel for combustion is gases that are gradually released from the coal into the generator space while the porosity of the coal changes. A critical insight in reverse combustion is that the combustion reaction is confined to only a very thin reaction zone. The reverse gasification was also tested by Liu et al. [
80] in the gasification of Chinese lignite.
8.2. Gasification with Axial Injection and Moving Reaction Point
Su et al. [
92] designed a coaxial UCG system with a horizontal well, which was tested on an ex situ reactor (see
Figure 42). They used horizontal borehole for gasification agent injection and syngas extraction.
Figure 23 shows a schematic of the experimental reactor with the coaxial-hole model and the equipment for measurement and regulation. The received coal had fixed moisture, 2.10%.
During the gasification experiment, they achieved an average heating value of 6.85 MJ/Nm and a gasification efficiency of 65.43%.
It was found that the coaxial UCG method achieved the same results as the traditional UCG so that it can be applied to abandoned underground coal seams. The experiment shows that the locations of acoustic emission (AE) sources aligned with those derived from temperature profiles, indicating that numerous acoustic emissions were generated in regions experiencing thermal stress (refer to
Figure 43). Furthermore, it was shown that changing the position (shifting) of the injection reaction point during gasification affected the calorific value of the syngas positively (see
Figure 44).
The coaxial UCG technique with a horizontal inlet well was also studied by Hamanala et al. [
105]. In tests with UCG, the model was composed of coal with two types of coal. Coal with a heating value of 30.18 MJ/kg and moisture content of 2.9%, and coal with a calorific value of 22.66 MJ/kg and a moisture content of 2.2% (i.e., type 2) were used. These coals were gasified using air and technical oxygen and obtained an average calorific value of 8.05 MJ/m
and 6.91 MJ/m
. It was found that the reaction zone gradually increased along the wall of the coaxial opening. Moreover, Su et al. [
106] investigated three gasification techniques, i.e., a coaxial model using a coaxial pipeline as a gasification channel, a coaxial model using a coaxial pipeline combined with a bottom cross-hole, and a linking-hole model using a horizontal V-shaped cross-hole. The proximate analysis showed that the moisture content of the coal was 2.10%, and the gross calorific value of the gasified coal was 32.12 MJ/kg. They performed three UCG trials where oxygen-enriched air of about 60%, 50%, and 60% was used as a gasification agent. The largest AEs were recorded when temperature fluctuated between 400–900
C. In these three experiments, calorific values of 5.11 MJ/Nm
in test 1, 5.51 MJ/Nm
in test 2, and the highest 8.43 MJ/Nm
in test 3, where a horizontal V-shaped linking-hole model was used, were achieved.
8.3. Technique CRIP and LWM
The combination of the controlled retreating injection point (CRIP) along with the linked vertical wells (LVWs) technique was simulated by Zagorcak et al. [
44] where semi-anthracite coal was gasified under atmospheric pressure, and an increased pressure of 30 bar. The results indicate that, by correct dosing of reactants, stable quality of syngas both with the LVM technique and with the CRIP technique can be ensured. In both methods, as the cavity grows, the calorific value of the syngas decreases, which must then be compensated by the correct dosing of the oxidizer and not exceed the hydrostatic pressure, to avoid gas losses and leaks into the environment. The most important factors that influence the composition of syngas and its stable production are the gasification agent used. It has been found that the most suitable gasifying agent is a mixture of oxygen and water, unless natural water is available in excess. However, it should be noted that the gradual reduction in calorific value cannot be avoided, and, therefore, the oxygen injection point (CRIP) must be shifted. The LVWs technique was applied in practice at the Hanna and Hoe Creek deposits during in situ UCG, while, when gasifying highly volatile bituminous coal with air, the average calorific value of syngas was in the range of 3.4–5.3 MJ/m
and when gasifying with a mixture of oxygen and vapors 6.9–9.0 MJ/m
[
107]. The CRIP technique was applied to the gasification of sub-bituminous coal in the Rocky Mountain deposit, where it was gasified with a mixture of oxygen and steam, while the calorific value of the produced syngas was 9.5 MJ/m
[
108]. Similarly, this technique was also used at the El Tremedal site [
109], where, with a mixture of oxygen and steam, the calorific value of syngas was up to 10.9 MJ/m
.
9. Change in the Coal Properties during Gasification
During the gasification process, several changes occur in the properties of coal. These changes result from the chemical and physical transformations that occur when coal reacts with gasifying agents like oxygen, steam, or air. The key changes in coal properties during gasification include a decrease in carbon content, release of gaseous products (e.g., CO, CO, CH, H, and other hydrocarbons), increased porosity, loss of volatiles, change in calorific value, and formation of tar and ash. Gasification substantially changes coal properties, converting solid coal into a mixture of gases and byproducts. The specific changes depend on various parameters, including the gasification technique used, the composition of the gasifying agent, and the characteristics of the coal being gasified. The following subsection discusses recent research on coal’s optical and petrographic changes.
9.1. Change in the Optical Properties of Coal during Gasification
Previous studies [
110,
111,
112] showed that light reflectance and vitrinite birefringence begin to change when coal is heated. Variations in optical properties are associated with thermal alterations occurring within the internal structure of Vitrinite and its resultant transformation products, such as mesophases and matrix. The type and magnitude of these alterations are contingent upon the coal rank and the coking susceptibility of the initial material. Vitrinite’s reflectivity is a highly reliable indicator of the magnitude of alterations occurring within the georeactor and its immediate vicinity.
Nowak et al. [
113] have investigated changes in the optical properties of coal during gasification in an ex situ reactor (see
Figure 45) under pressures of 10 and 40 bars. Technical oxygen was used as a gasification agent. The optical characteristics of both raw coal and the residues resulting from gasification were examined, encompassing the determination of the average random reflectance of Vitrinite in the raw coal and its transformation products after gasification. Microscopic examinations were performed using an optical light microscope.
As the distance from the reactor chamber inlet increased, it was observed that the true maximum reflectance and bireflectance decreased. Furthermore, the extent to which temperature affected the coal depended on the gasification pressure, with a distance of 60 m for 10 bar and 35 m for 40 bar.
Following coal gasification at 10 bar pressure, transformed coal components were detected within the reactor. These included vitrinite grains exhibiting visible pores, coke grains with varying pore sizes and pronounced relief, and mesophase, leading to significant morphological changes in the liptinite macerals. The rate of morphological changes in coal components decreased with increasing distance from the reactor inlet.
Under a gasification pressure of 40 bar, degassed vitrinite grains exhibited visible pores, while coke grains displayed various pore sizes and high relief. The influence of temperature on the morphology of coal components decreased as the distance from the reactor chamber entrance increased (see
Figure 46).
Similar changes in optical properties and the structure of residues after coal gasification were also observed in previous studies [
114,
115,
116,
117].
The investigation revealed that as the distance (
d) from the reactor inlet increased, the maximum temperature exerted on the coal and the true maximum reflectance declined.
Figure 47 depicts the correlation between the
ratio and the distance from the reactor entrance. Here,
represents the ratio of the true maximum reflectance values between the raw sample and the gasification residue. The ratio exhibited an upward trend as the distance increased. An
value of 1 signifies that the reflectance value of the gasification residue matches that of the raw sample.
9.2. Change in the Petrographic Composition of Coal during Gasification
The impact of the petrographic composition of coal on the production of char was studied in [
118,
119,
120], and the petrographic characteristics of char were studied in [
121,
122]. However, the mentioned papers focus on the products of the surface gasification of coal, while petrographic changes resulting from the UCG have been studied only in one research study. Under the influence of thermal processes, the coal in the reactor is transformed. At the same time, after gasification, it is possible to distinguish the area of ash, coke, dried coal, cracked transversely to stratification, and the dried lignite area in the cavity. Petrographic analysis can help to predict the suitability of a coal seam for UCG. Bielowicz [
123] investigated the change in the petrographic composition of lignite with high moisture content (46.52%) during the ex situ lignite gasification using oxygen. The results showed that the most significant changes in the coal were observed in the cavity and along the gasification channel that was most exposed to the gasification agent. It was found that the sapropelic brown layers were mostly degassed and dried. In addition, the gelation and fusain layers were not observed there. Outside of the cavity, the bituminous lignite was altered to a lesser extent. Its partial drying and degassing were visible. In the case of lignite transformations, strong gelifications and the formation of fusains were most often observed.
9.3. Changes in Heat-Affected Zone from the UCG
Prabu and Jayanti [
124] analyzed heat-affected zones with high ash coals during ex situ gasification. These zones of dry and volatile depleted porous zones create coal to a certain depth, which causes its spalling. Coal samples from different locations of heat-affected zones from experimental coal gasification were analyzed. The extent of change depended on coal type and gasification conditions. These changes in the coal affect its reactivity and the syngas’s composition. The research results showed that in the heat-affected zone, typically, there is a significant reduction of volatile substances over the entire surface of the cavity in the coal, one of the reasons being the loss of reactivity. The reactivity of the coal is mainly lost during the initial heating of the coal and the loss of the surface area of the coal through pyrolysis. The loss of volatile substances and moisture within the heat-affected zone directly impacts the composition of the syngas, while the Boudoard reaction influences the gasification rate. The loss of volatile substances can lead to incomplete utilization of the coal seam as it becomes less reactive. Similar studies simulate the UCG cavity geometries using laboratory-scale bore-hole combustion and gasification experiments on wood and coal [
125,
126]. Moreover, measurements of the Brunauer–Emmett–Teller (BET) surface area of the char prepared at different temperatures [
127] showed a pronounced decrease in the available surface area which was attributed to the loss of reactivity in CO
gasification.
10. Research of Environmental and Health Impacts of Underground Coal Gasification
Environmental control measures, such as gas cleaning and emissions reduction techniques, are crucial to minimize the release of pollutants and ensure compliance with environmental regulations. It is essential to analyze coal residue tar to understand its composition and potential contaminants, to prevent the impact of underground coal gasification (UCG) on the environment and human health. Environmental analysis should regard the relationship between the physicochemical composition of wastewater, coal properties, and gasification pressure. Additionally, predicting the release of pollutants from the residues after UCG is essential, as it helps identify potential contamination risks. The UCG process can be optimized by supplying additional CO, which helps to reduce greenhouse gas emissions and promotes more controlled and efficient gasification to mitigate the environmental impact. In addition, proper control of operating parameters can eliminate the risks associated with gas leakage into the critical area of the UCG. Leakage of produced gas can result in an explosion or the poisoning of people. These topics have also been studied in the research papers that will be discussed next.
10.1. Analysis of Wastewater, Coal Residues, and Tar from UCG
One of the most critical issues during the UCG process is wastewater production and treatment. Many hazardous compounds can contaminate condensed gasification wastewater. In the literature, an evaluation of the biological treatability of wastewater from the UCG pilot installation in the Hanna coal deposit (Wyoming) can be found [
128]. Zhang et al. propose the pretreatment of wastewater generated during coal gasification by acidification demulsion [
129]. Many toxic compounds in UCG wastewater are challenging to decompose if only biological methods are used [
130]. Thomas et al. present the possibility of phenol removal from UCG effluents by using coagulation–flocculation and the H
O
/UV process [
131]. Treatment of coal gasification wastewater by catalytic oxidation with trace ozone is another promising technique [
132]. Recently, Pankiewicz-Sperka et al. [
51] performed a qualitative and quantitative wastewater characterization on various UCG experiments in an ex situ reactor (see
Figure 29 and
Figure 48) with “Six Feet” semi-anthracite and “Wesoła” bituminous at 20 and 40 bars. Oxygen and water vapor were used as gasification agents.
The results showed the relationship between the physicochemical composition of wastewater and the characteristics of coal, including gasification pressure. It was found that coal properties and gasification pressure significantly influence organic pollutants, mainly phenols, BTEX (i.e., benzene, toluene, ethylbenzene, and xylene), and PAHs (i.e., polycyclic aromatic hydrocarbons). Phenols had the highest concentrations in bituminous coal (29.25–49.5 mg/L), while these concentrations were lower in semi-anthracite coal gasification (2.1–29.7 mg/L). The opposite result was recorded in the case of BTEX, where the concentrations were lower (2514.3–1354.4 g/L). There was found a similar relationship in the case of the PAHs’ concentration, with higher concentrations observed during the gasification of semi-anthracite coal (362–1658 g/L), while in the case of gasification of bituminous coal, PAH concentrations in wastewater were lower (407–1090 g/L) (see
Figure 49). Furthermore, the experimental investigation revealed that the concentrations of phenols, BTEX, and PAHs decreased as the pressure increased (see
Figure 50).
Another chemometric investigation of wastewater can be found in [
133]. This research revealed that, apart from phenolics, PAHs were identified as the most widespread organic pollutants which could be formed in the process of UCG. The amount and types of PAHs and their homologs depend on the type of the gasification process. The BTEX group seriously threatens the underground water system for its strong and long-term toxic effects.
Analysis of tar from ex situ coal gasification was recently performed by Wiatowski [
88]. They gasified “Piast” hard coal with a moisture of 4.7%. It was found that the content of BTEX fractions in the tar was 82.6%, while the dominant component was benzene. PAHs had a concentration of 14.7% and phenols 2.7%. The tar yield was determined to be 12.3 kg per ton of coal, corresponding to 1.23% of the total mass of the gasified coal.
Figure 51 showcases the findings concerning the total sum of BTEX, PAHs, phenol concentration, mass flow rate, and proportion of tar groups. The high benzene content stemmed from secondary processes within the tar, such as hydrocracking and steam reforming. The tar yield per ton of coal was 1.8%, approximately three times less than that observed during coking. Moreover, the results indicated that the residence time of tar decreased from 1 s at the beginning of the experiment to 0.35 s after 70 h.
10.2. Pollutants Release from the Residues Remaining after UCG
Groundwater contamination from UCG operations is one of the most critical risks that can occur. This topic is crucial for this process to be carried out on an industrial scale with appropriate environmental safeguards. Strugała-Wilczek et al. [
134] performed laboratory tests of solid residues from ex situ underground gasification of ortho- and meta-lignites. The experiments aimed to determine the effect of brown coal on the composition of residues after gasification and contaminants that can leach into the water environment from the UCG cavity.
The gasification results revealed that the residues from lignite gasification exhibit non-uniform characteristics and show varying levels of transformation, confirming the discrepancies in ash content. The ortho-lignite from Oltenia exhibited higher concentrations of the analyzed elements than the meta-lignite Velenje, especially notable in the case of As, B, Co, Cu, Ni, Al, and Fe. The contents of tested elements in Oltenia lignite were higher compared to the world average trace elements content in coals (coal Clarke values) [
135]. It turned out that, after lignite gasification, no dangerous trace elements such as Cr, Cd, Hg, and Pb were present in the water extracts, which indicates that lignite gasification is safe for the aquatic environment. Despite the elevated metal and metalloid content in Oltenia ortho-lignite, the aqueous extracts derived from Velenje meta-lignite exhibited higher concentrations of dissolved substances than those obtained from Oltenia.
10.3. Prediction of Poisoning and Explosion in the UCG
Laciak et al. [
136] have performed two gasification experiments to investigate gas leaks based on material balance. One on a sizeable ex situ reactor (G1) in the shape of a steel cuboid (see
Figure 11a) and the other on a small reactor (G2) in the form of a truncated cylinder (see
Figure 52). The bed model was prepared in a different way in each reactor.
Figure 53a illustrates a cross-section of the bed model in the first reactor (G1), and
Figure 53b demonstrates the placement of the model in the small reactor (G2). There was gasified lignite with total moisture of 13.8%. The air was used as the primary gasification agent, and oxygen was added as an auxiliary oxidizer in case of decreased calorific value or temperatures.
For each experiment, the material balance was established by applying the principle of mass conservation in ex situ reactors during the experiments and determining the effective gasification time. This balance was subsequently adjusted to consider the conservation of element atoms in chemical reactions. The measured syngas composition was used to determine the mass of individual chemical elements in the syngas.
The findings revealed that the most substantial losses occurred in the pipeline at the entrance to the ex situ reactor. Higher losses were in the first experiment. In both experiments, the most significant losses at the atomic level were found for nitrogen (see
Figure 54 and
Figure 55).
Risk factors must be taken into account when handling syngas and generating syngas. For example, a mixture of air and leaked syngas can be explosive. A high concentration of CO in the operator’s area can cause poisoning. Syngas leakage can occur through various leaks and cracks in the surrounding layers of the UCG zone. In previous research, Laciak et al. [
137] analyzed the impact of the leakage of produced gas from UCG on the vulnerable area from the point of view of CO poisoning and explosion hazard. Four UCG experiments were performed in a small ex situ reactor, the schematic of which is shown in
Figure 52. The bedding of coal blocks in individual experiments is illustrated in
Figure 56. The total moisture of the received coal was 20.4%. The results from the material balance showed that the most considerable syngas losses were in the case of experiment #1 (15.4%) and the smallest in experiment #2 (7.9%).
Using data measurements from ex situ coal gasification, a mathematical model of gas mixing used to predict dangerous concentrations of CO was proposed. This model can calculate the syngas’s composition based on the volume flows of input gasification agents, the volume flow, and the produced syngas. The proposed mixing model has the following form:
where
represents the concentration of the first component of the internal gas element,
represents the concentration of the first component of gasification agent,
represents the concentration of the
n-th component of the internal gas element,
represents the concentration of the
n-th component of inlet gas,
represents the volume flow of the gasification agent,
is the volume flow of the syngas, and
V is the volume of element,
(CO, CH
, H
, CO
, N
, O
).
The specific concentration of CO can be critical in terms of poisoning or explosion. The crucial concentrations of gaseous components that can lead to an explosion were determined as H at 4%, CH at 5%, and CO at 12.5%.
The simulation results with the model showed that the critical value of CO in syngas poisoning was reached at a specific syngas composition. Therefore, it is necessary to eliminate the risk of gas leakage into vulnerable areas of the UCG. The simulations indicated neither experiment reached a concentration level that could trigger an explosion. The third experiment achieved the highest concentration of hazardous gases (refer to
Figure 57a). Even when the volume flow of fresh air was reduced to 1 m
/h, the limits of explosive components did not surpass the critical values (see
Figure 57b).
Figure 58 shows the behavior of the predicted concentration of CO and its critical level for individual experiments.
Moreover, a predictive model was introduced to estimate when CO gas poisoning reaches a critical level. This critical time represents the duration required for the CO gas concentration to reach the critical threshold in a specific area where a syngas leak is expected. The regression model used to compute the critical time of CO poisoning was formulated as follows:
where
(
i = 1, …, 4) are the regression parameters;
is the volume space of regarded vulnerable area;
represents airflow supplied to the space;
represents the amount of leaking syngas as a percentage.
Figure 59 presents the results of the third model’s application. The graph displays the critical time computed using the gas mixing model (GMM) and the critical time obtained from the regression model (StM).
Based on this regression model, supplying fresh air to the critical region of the UCG can be dynamically controlled. The control algorithm can regulate fresh air flow to the area, ensuring that the critical concentration of CO in that space is not surpassed. The algorithm cooperates with the gas mixing model, which calculates the critical time of CO poisoning.
Figure 60 shows the control system simulation according to the proposed scheme for the two considered UCG experiments. The rendering presents the airflow
regulated by the control algorithm to prevent CO gas poisoning in a vulnerable area. In the figure, the critical or limit value of CO is represented by a dashed line.
An assessment of the harmful effects of syngas from UCG was also carried out in [
138]. The analysis and experiments showed that the coal seam’s permeability affects the georeactor’s thermal performance. The cause is gas leakage through the coal layers towards the top surface (i.e., an experiment with crushed coal). To assess the harmful effects of syngas from UCG, a limit value of 10% was considered as the maximum syngas leakage during the experiment, and in the simulations with the gas mixing model, a space of approximately 1600 m
was considered, in which the ex situ reactors were placed. It was found the risk of syngas leakage and CO poisoning can be reduced when an additional ventilation system is installed in a UCG vulnerable zone and the control system performs a regular check of the environment. The research revealed that it is necessary to monitor the gas tightness of the gasification reactor, the concentration of CO in the vulnerable area, and ensure the availability of additional ventilation to prevent poisoning. Predicting syngas composition during various operational interventions will allow us to avoid dangerous situations in UCG.
Unfortunately, there is only low evidence of gas leak monitoring in practice. A comprehensive geochemical survey conducted at the North Knobs Wyoming UCG site [
139] has provided conspicuous evidence regarding the escape of gases produced during in situ coal combustion. These resulting gases migrated predominantly within loosely compacted and fractured sandstone layers above the combusted coal seam. Within 3 to 5 days after ignition of the burns, these leaked gases were detected at the surface. The evidence based on localized high-value “hot spots” indicates that some leaked products have reached the surface via pathways associated with imperfect casing cementing in various wells on the facility. Economically, the loss incurred through such leakage likely falls within acceptable thresholds. Extensive analyses throughout the survey consistently revealed no indications of these hazardous gases approaching noteworthy or dangerous levels.
Consequently, it is believed that minimal quantities of toxic gases generated within a well-structured and correctly managed in situ coal gasification facility would not yield detrimental outcomes from safety or environmental perspectives [
139].
10.4. Gasification with Supplying an Additional CO
UCG generates CO emissions, contributing to climate change and environmental concerns. However, the CO captured can be used as the supporting gasification agent in UCG, preventing it from being released into the atmosphere.
UCG technology holds significant promise in producing environmentally friendly energy by incorporating carbon capture and storage (CCS) techniques [
1,
140]. Multiple investigations have explored the coal gasification process using CO
as a gasification agent. Irfan et al. [
141] performed a concise survey of coal gasification studies conducted within a CO
environment. Duan et al. [
142] introduced a CO
-recycling strategy within UCG, presenting a two-stage approach for optimizing UCG process variables under CO
recycling conditions. Their findings highlighted that introducing CO
as a feed gas reduced reaction temperatures considerably compared to steam. In a pilot-scale UCG experiment spanning 60 days at the Wieczorek mine in Poland, Mocek et al. [
143] employed oxygen, air, and CO
as gasifying agents. Their study indicated the substantial influence of operational pressure on efficient coal gasification in in situ conditions. Investigating bituminous coals across operating pressures from 1 to 3 MPa using a steam and CO
mixture, Konstantinou et al. [
144] observed that elevated UCG operating pressures resulted in increased gasification rates and efficiency. gasification was performed with a H
O/CO
mass ratio of 2:1, resulting in an average syngas calorific value of 7.8 MJ/Nm
.
Gasification with a CO
/O
mixture has been minimally investigated, but recently Kumari and Vairakannu [
145] performed laboratory experiments based on CO
oxy-fuel combustion with a focus on UCG. The experiment revealed that injection of CO
/O
gas can eliminate problems with superheated steam fed into deep coal seams. However, for the needs of UCG control, it is necessary to set the optimal value of CO
/O
because a high concentration of CO
can cause the flame extinguishing of the oxidation zone of the georeactor.
The results showed this gasification technique’s potential for fresh and dry coal. Increasing the CO/O molar ratio (up to 0.6) resulted in a decrease in the CO/H ratio and the content of CO and H in the syngas. Conversely, decreasing the CO/O molar ratio to 0.4 led to an increase in the volume of CO and H, as well as the CO/H ratio (i.e., reaching a value of 1). Therefore, the optimal CO/O molar ratio for efficient CO dry reforming was estimated to be 0.4. The experiment showed that, during gasification with pure oxygen, the highest syngas calorific value was recorded at 298 kJ/mol, which is a similar value to the gasification of fresh coal with the ratio of CO/O agents. Gasification with pure oxygen resulted in a higher methane concentration in syngas (averaging 22.12%), primarily due to the conversion of methane into syngas through the dry reforming reaction.
11. Conclusions
The impact of experimental coal gasification in ex situ reactors on in situ underground gasification (UCG) is significant, as it allows researchers and engineers to gain valuable insights and data that can be applied to improve the technology of UCG. Conducting experimental research in ex situ reactors is generally safer and more cost-effective compared to full-scale in situ UCG operations. It allows researchers to test and optimize gasification conditions without the risks associated with underground operations. The controlled ex situ setting enables researchers to isolate specific variables and systematically explore their effects on the gasification process. Furthermore, the data obtained from these experiments can be used to validate computational models and simulations, enhancing the accuracy of predictive tools for assessing UCG performance and potential environmental impacts. This study reviewed the current trends of UCG laboratory research and the achieved results. In summary, experimental research using ex situ reactors plays an essential role in advancing UCG technology. It provides a platform for understanding the gasification process, optimizing operating conditions, improving safety, and designing environmentally sustainable UCG processes. Considering the achieved results and the potential for further research, it is necessary to continue further ex situ tests. It is important that the knowledge gained from the experimental laboratory research of UCG can be transferred to the practice of in situ gasification. The knowledge gained from such research contributes to the successful implementation and widespread adoption of UCG as a cleaner and more efficient energy production method.


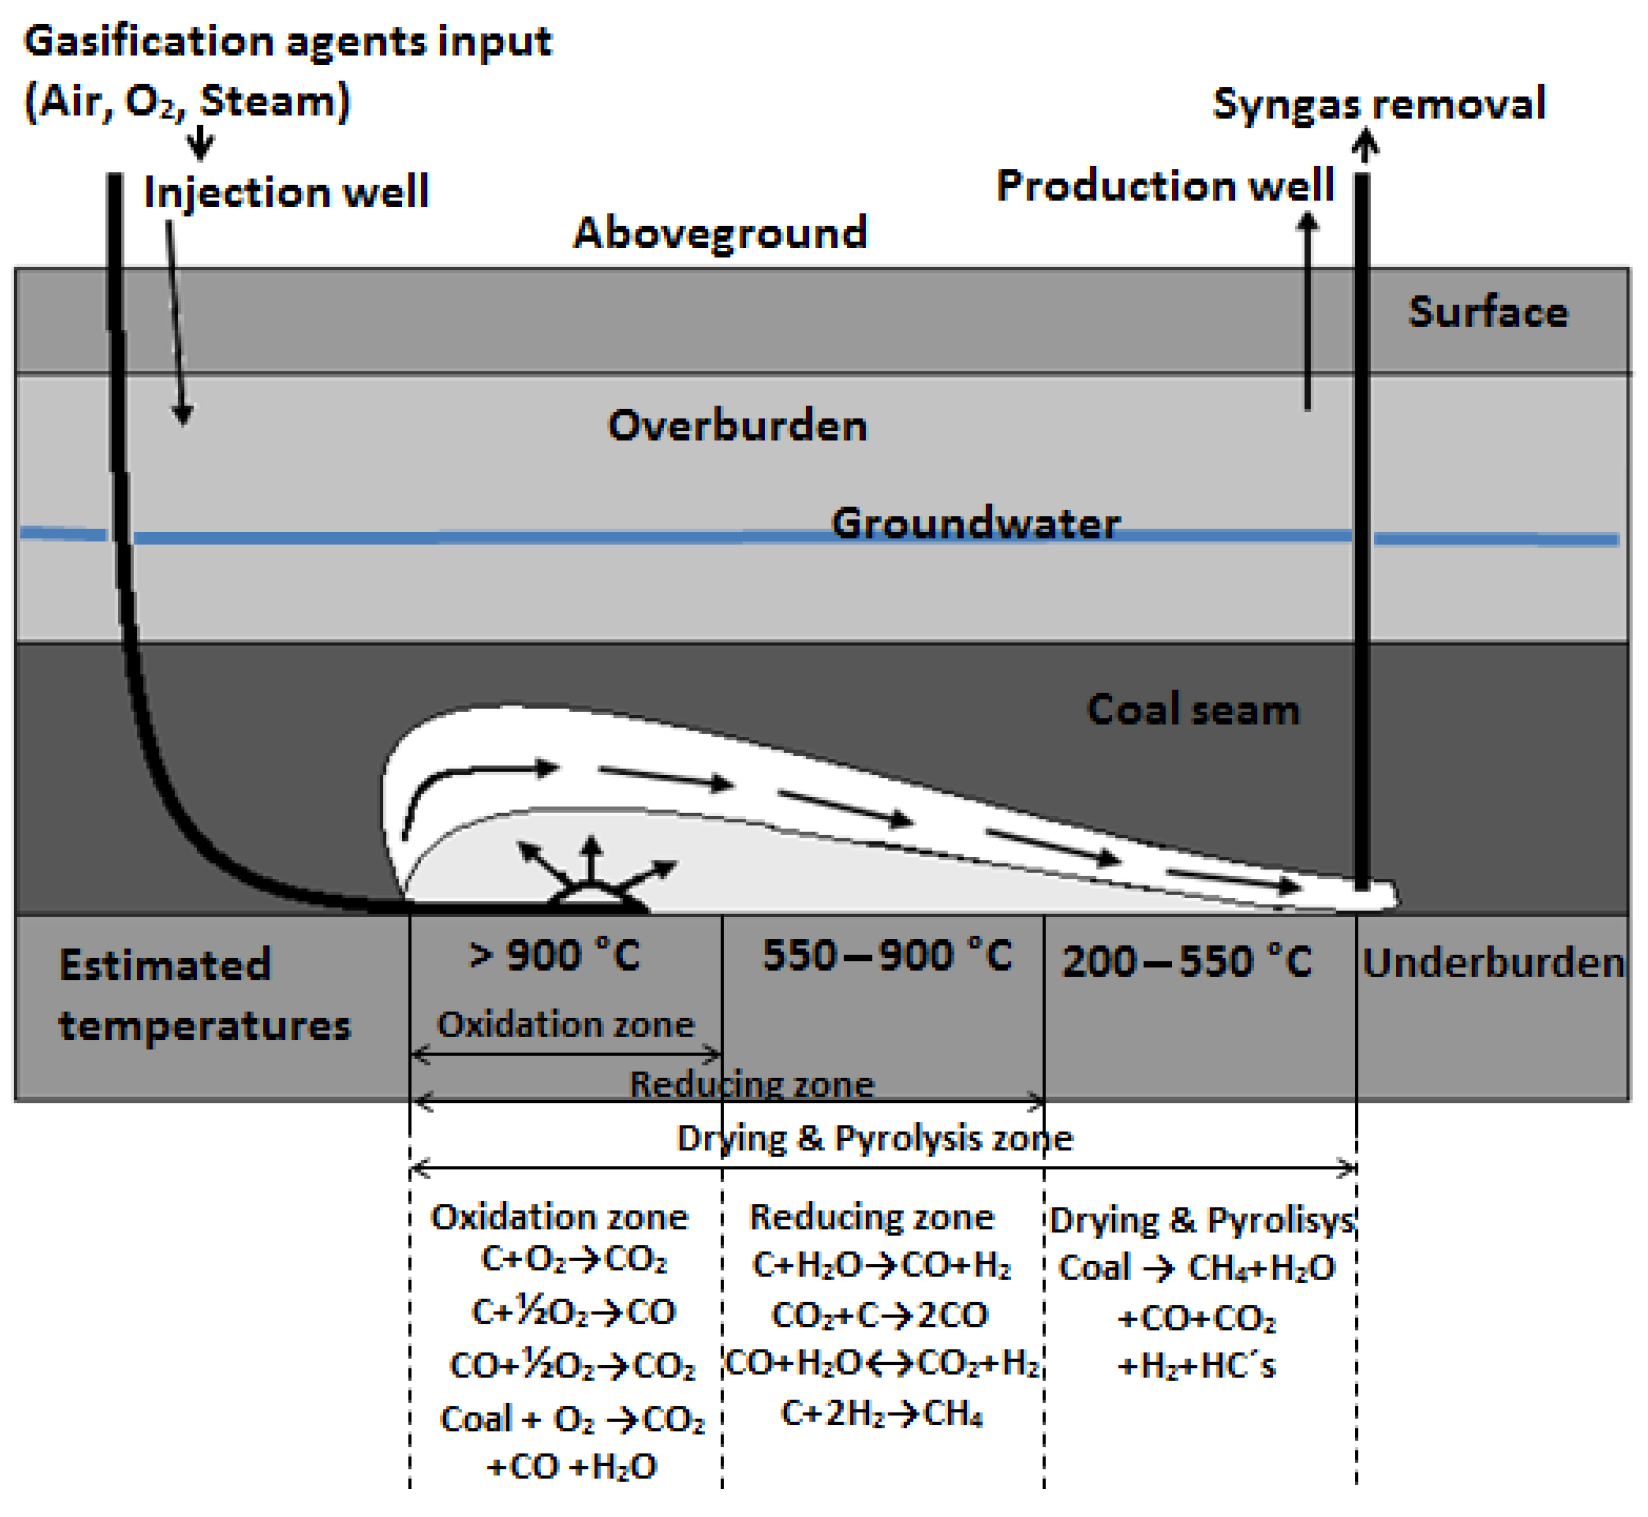
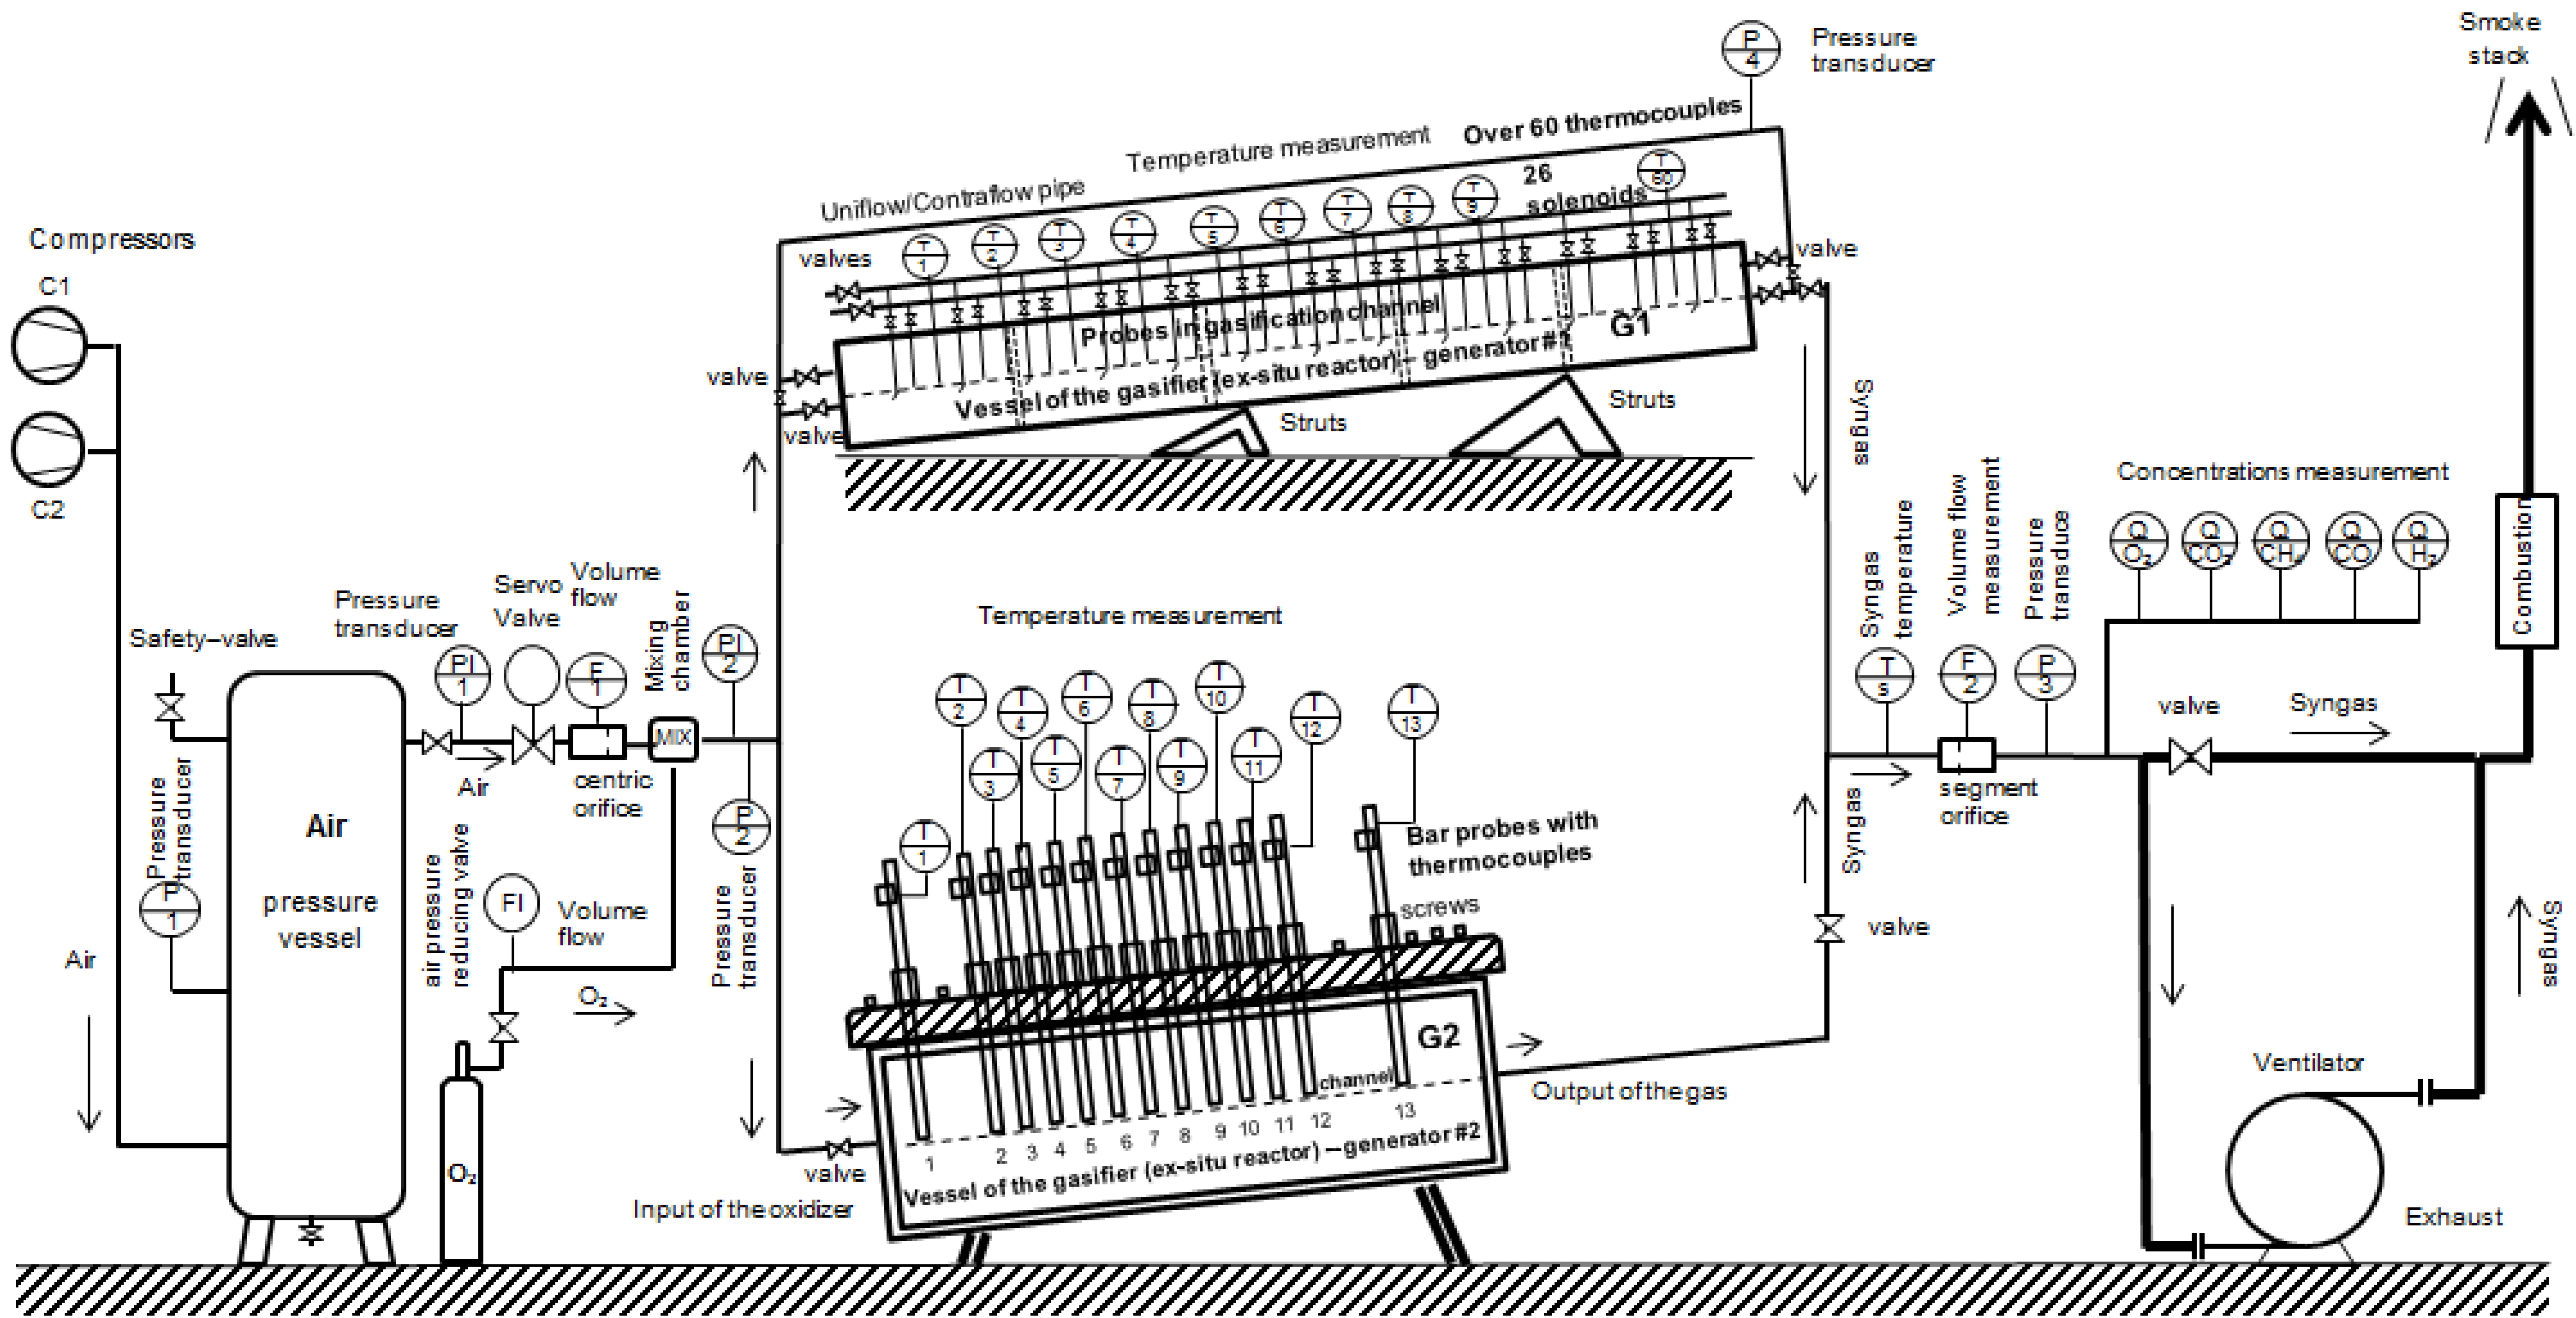
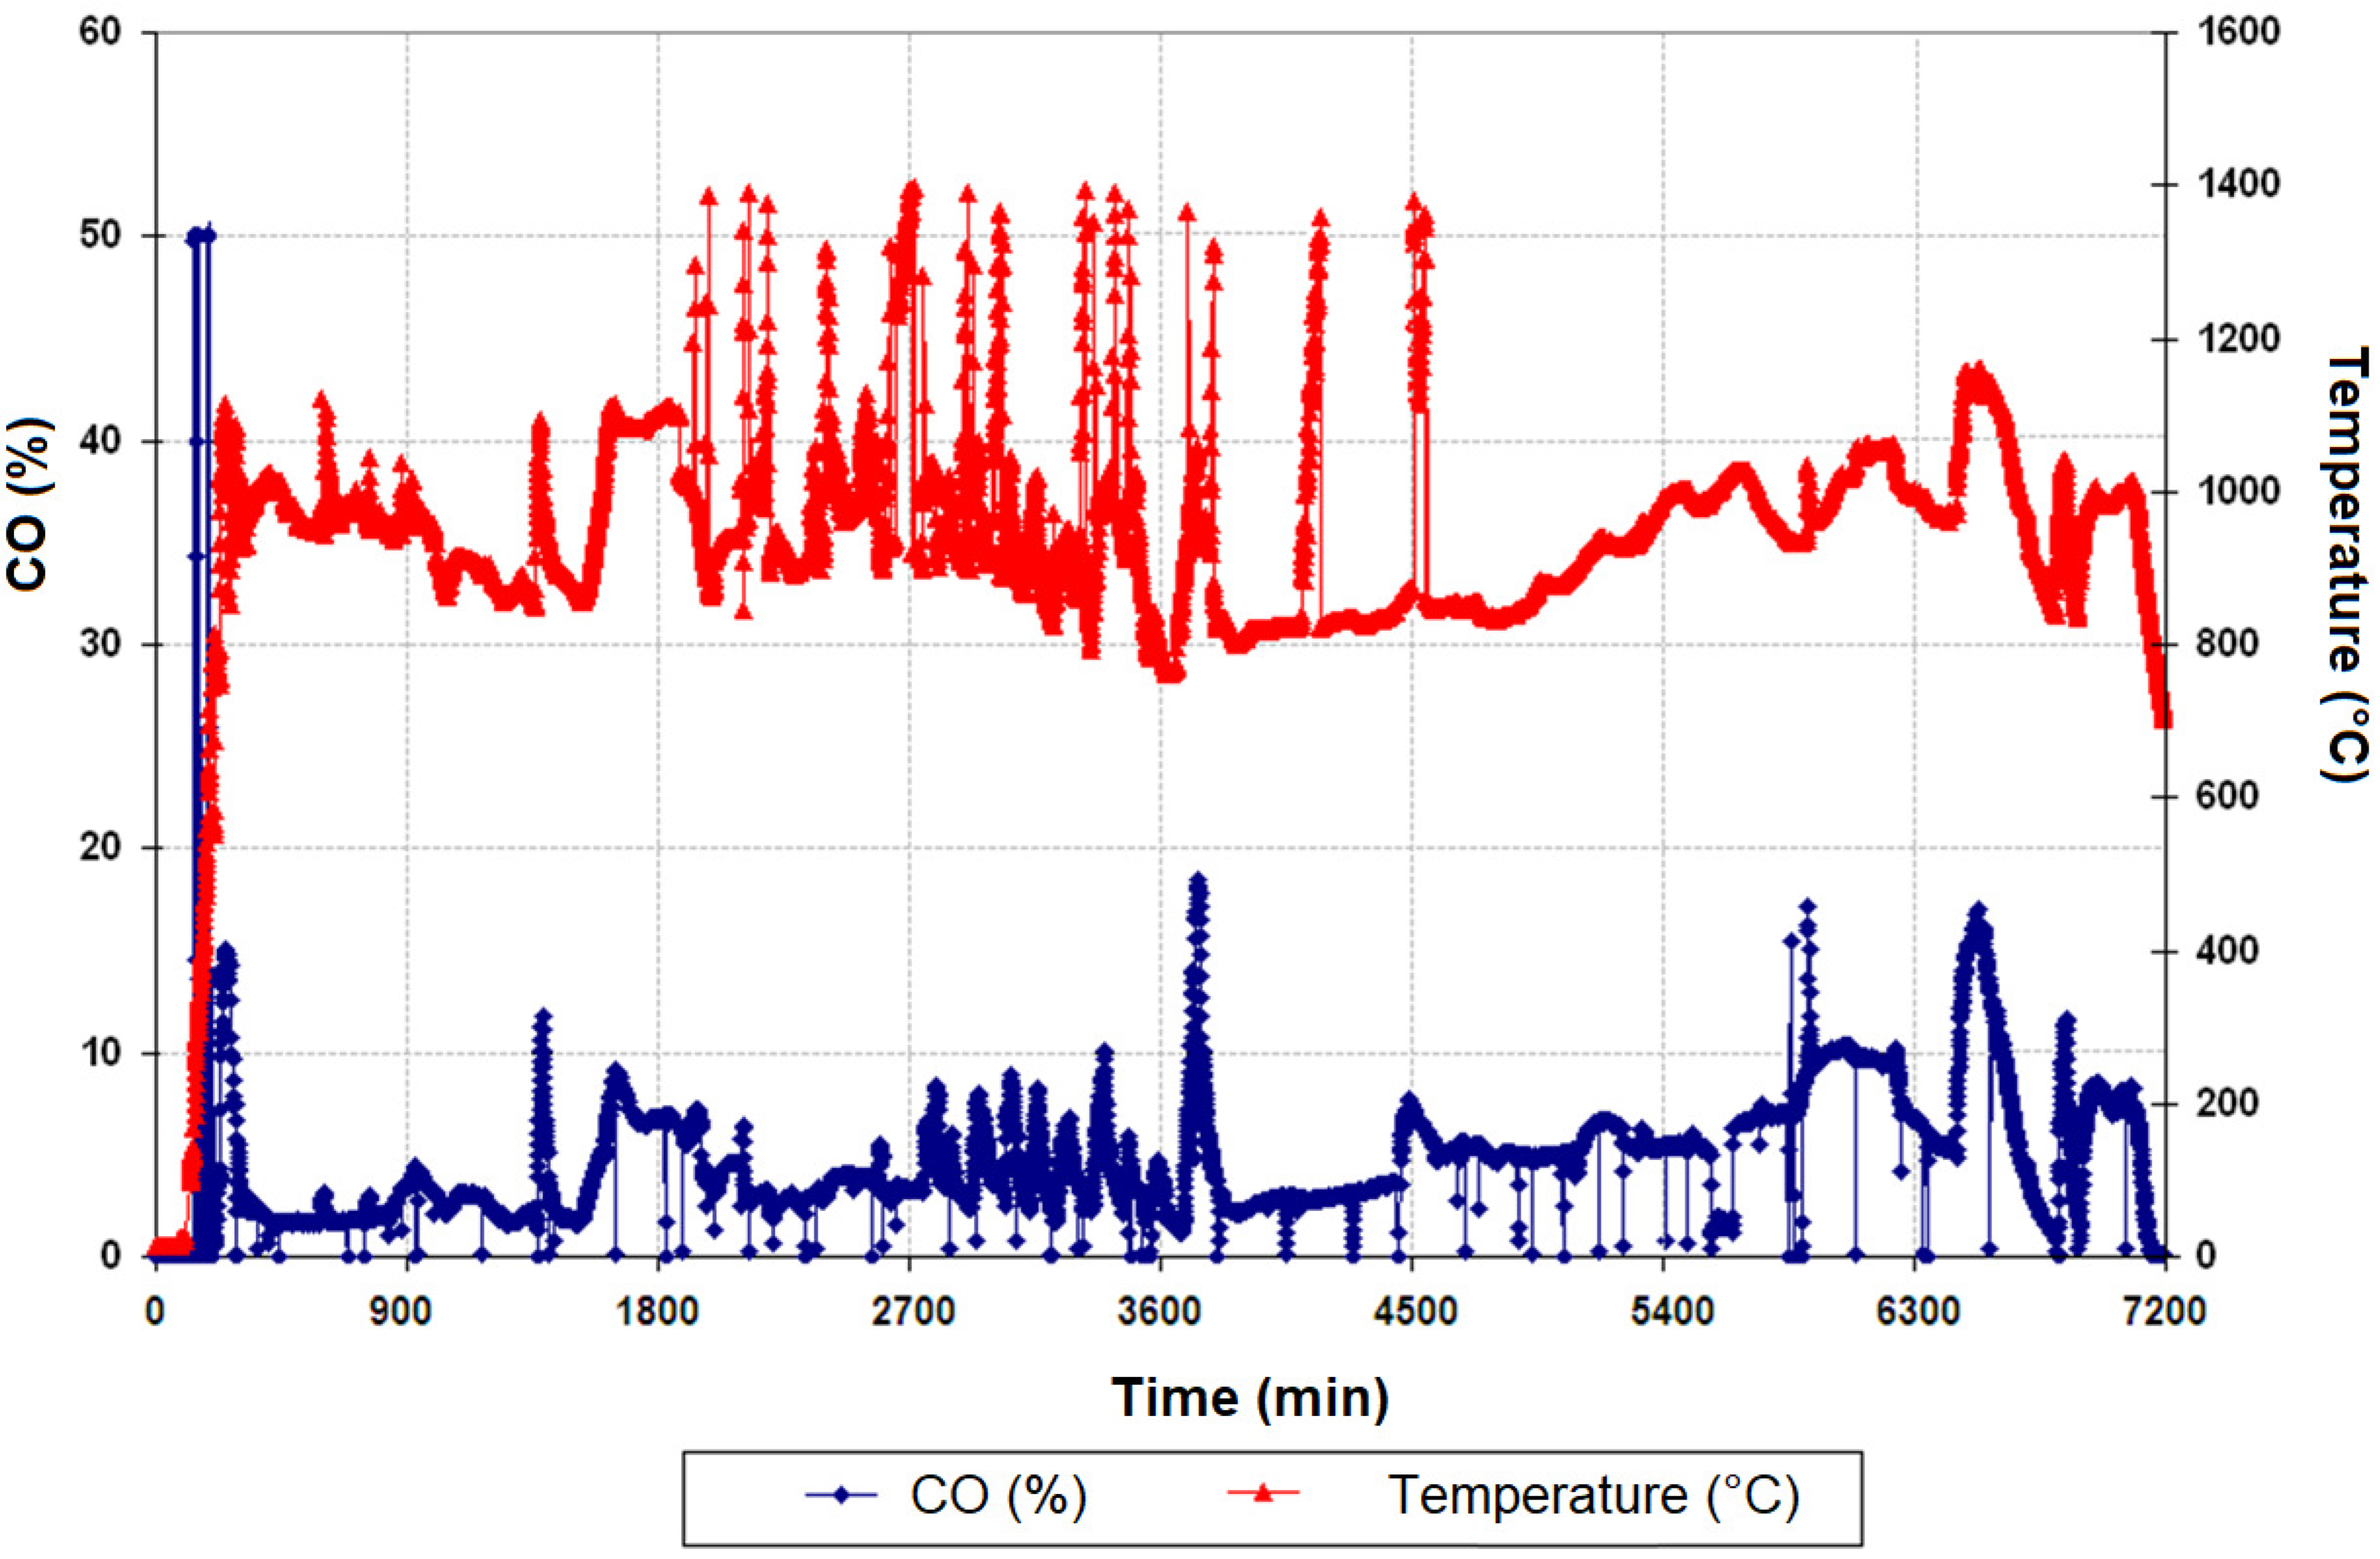
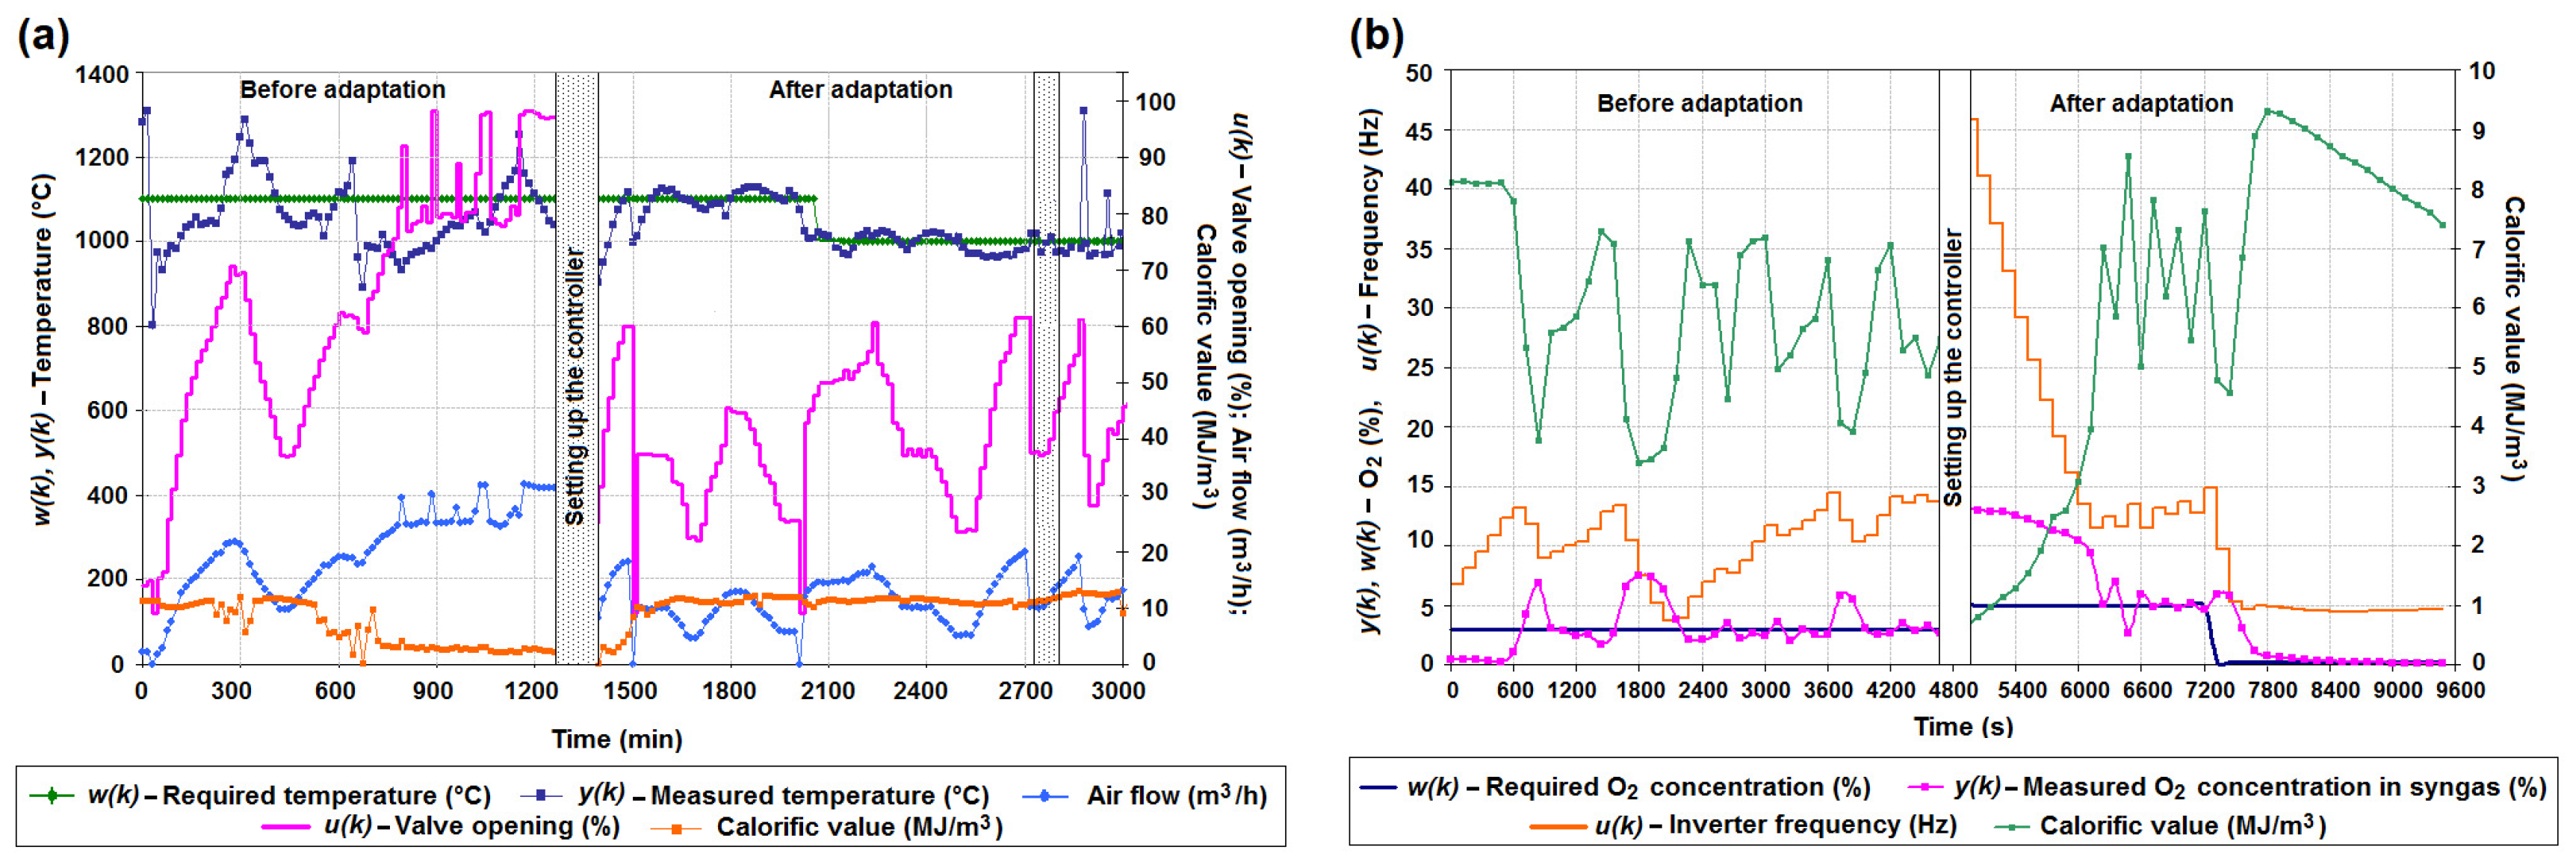
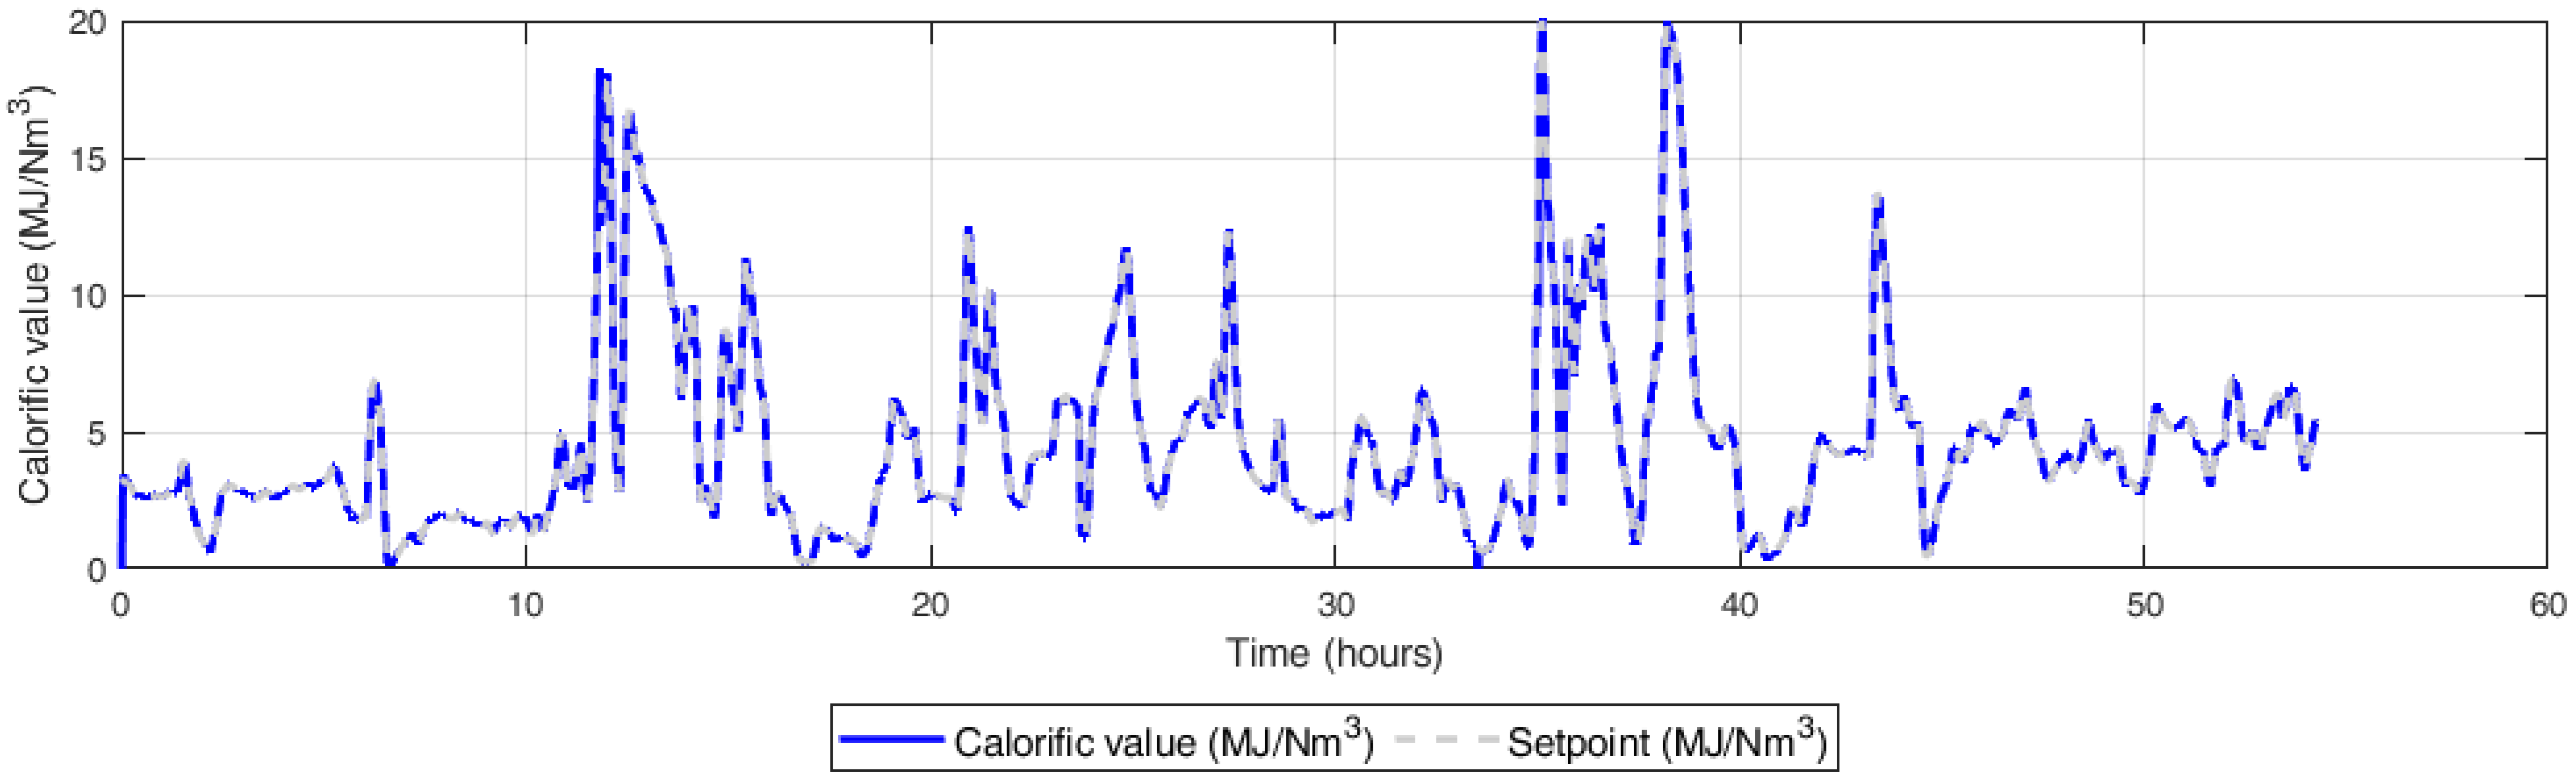
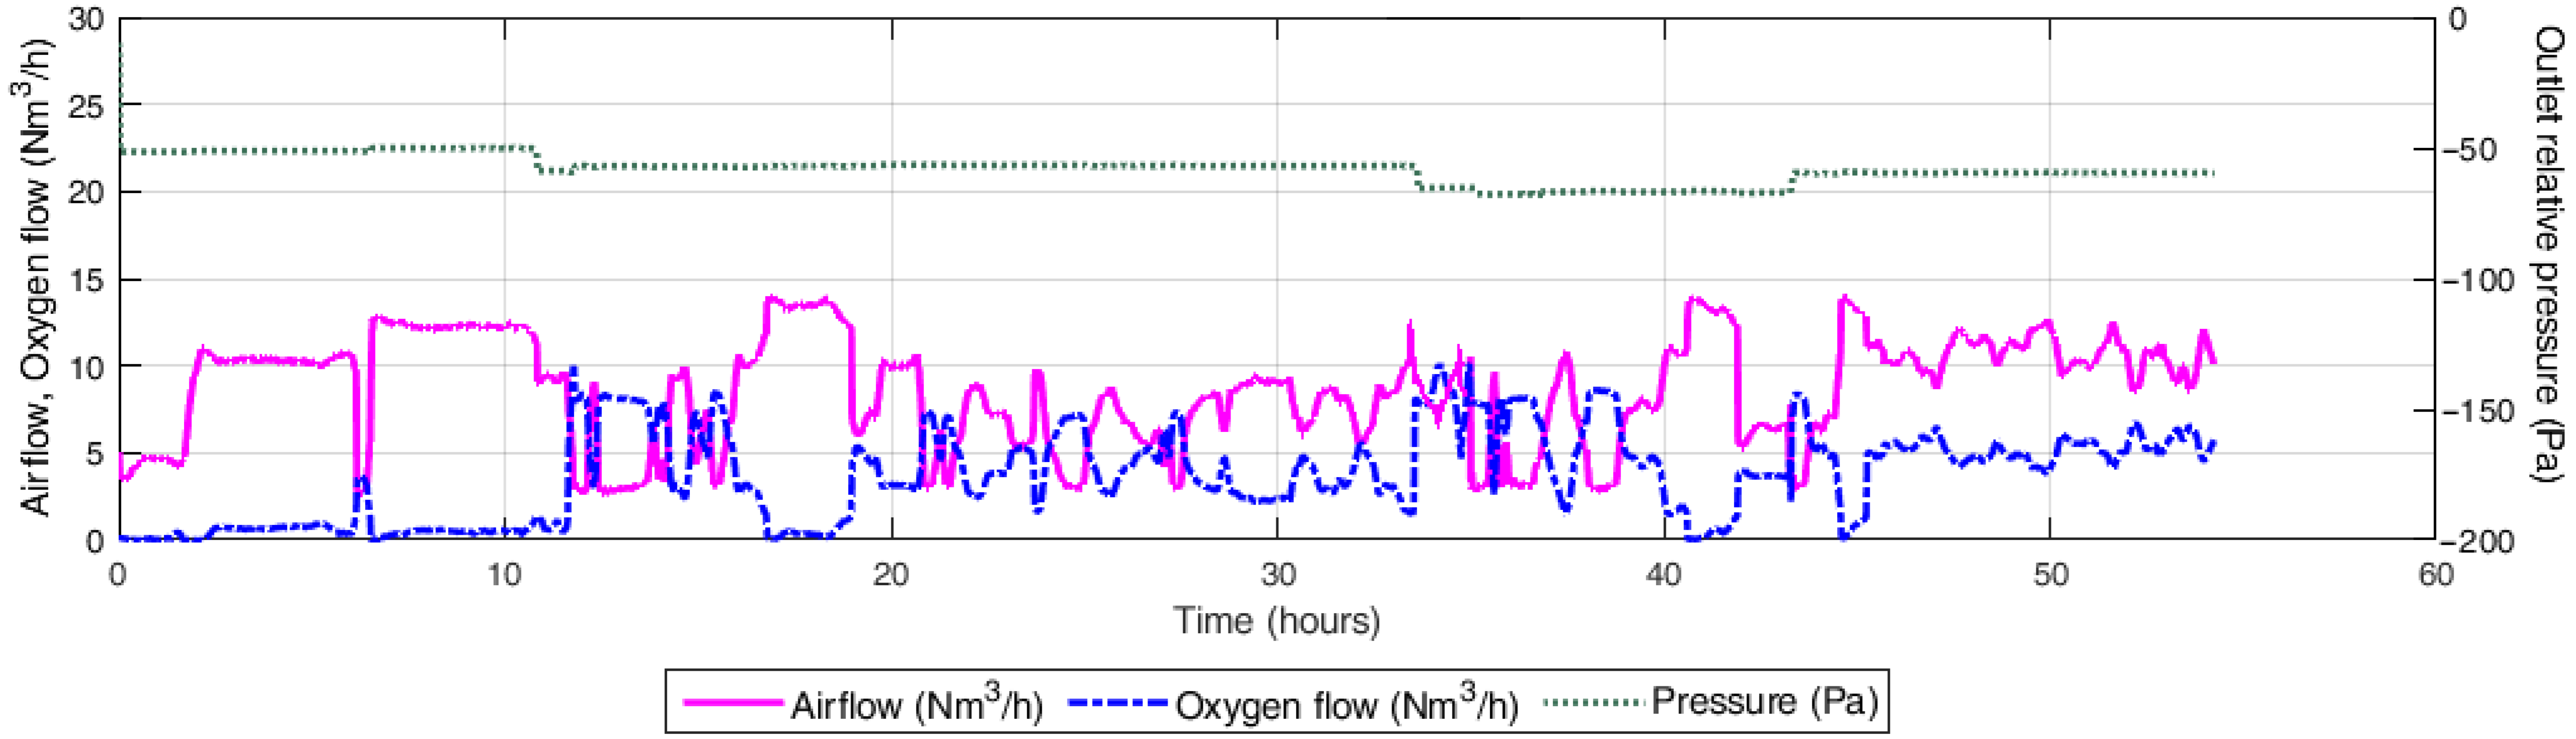
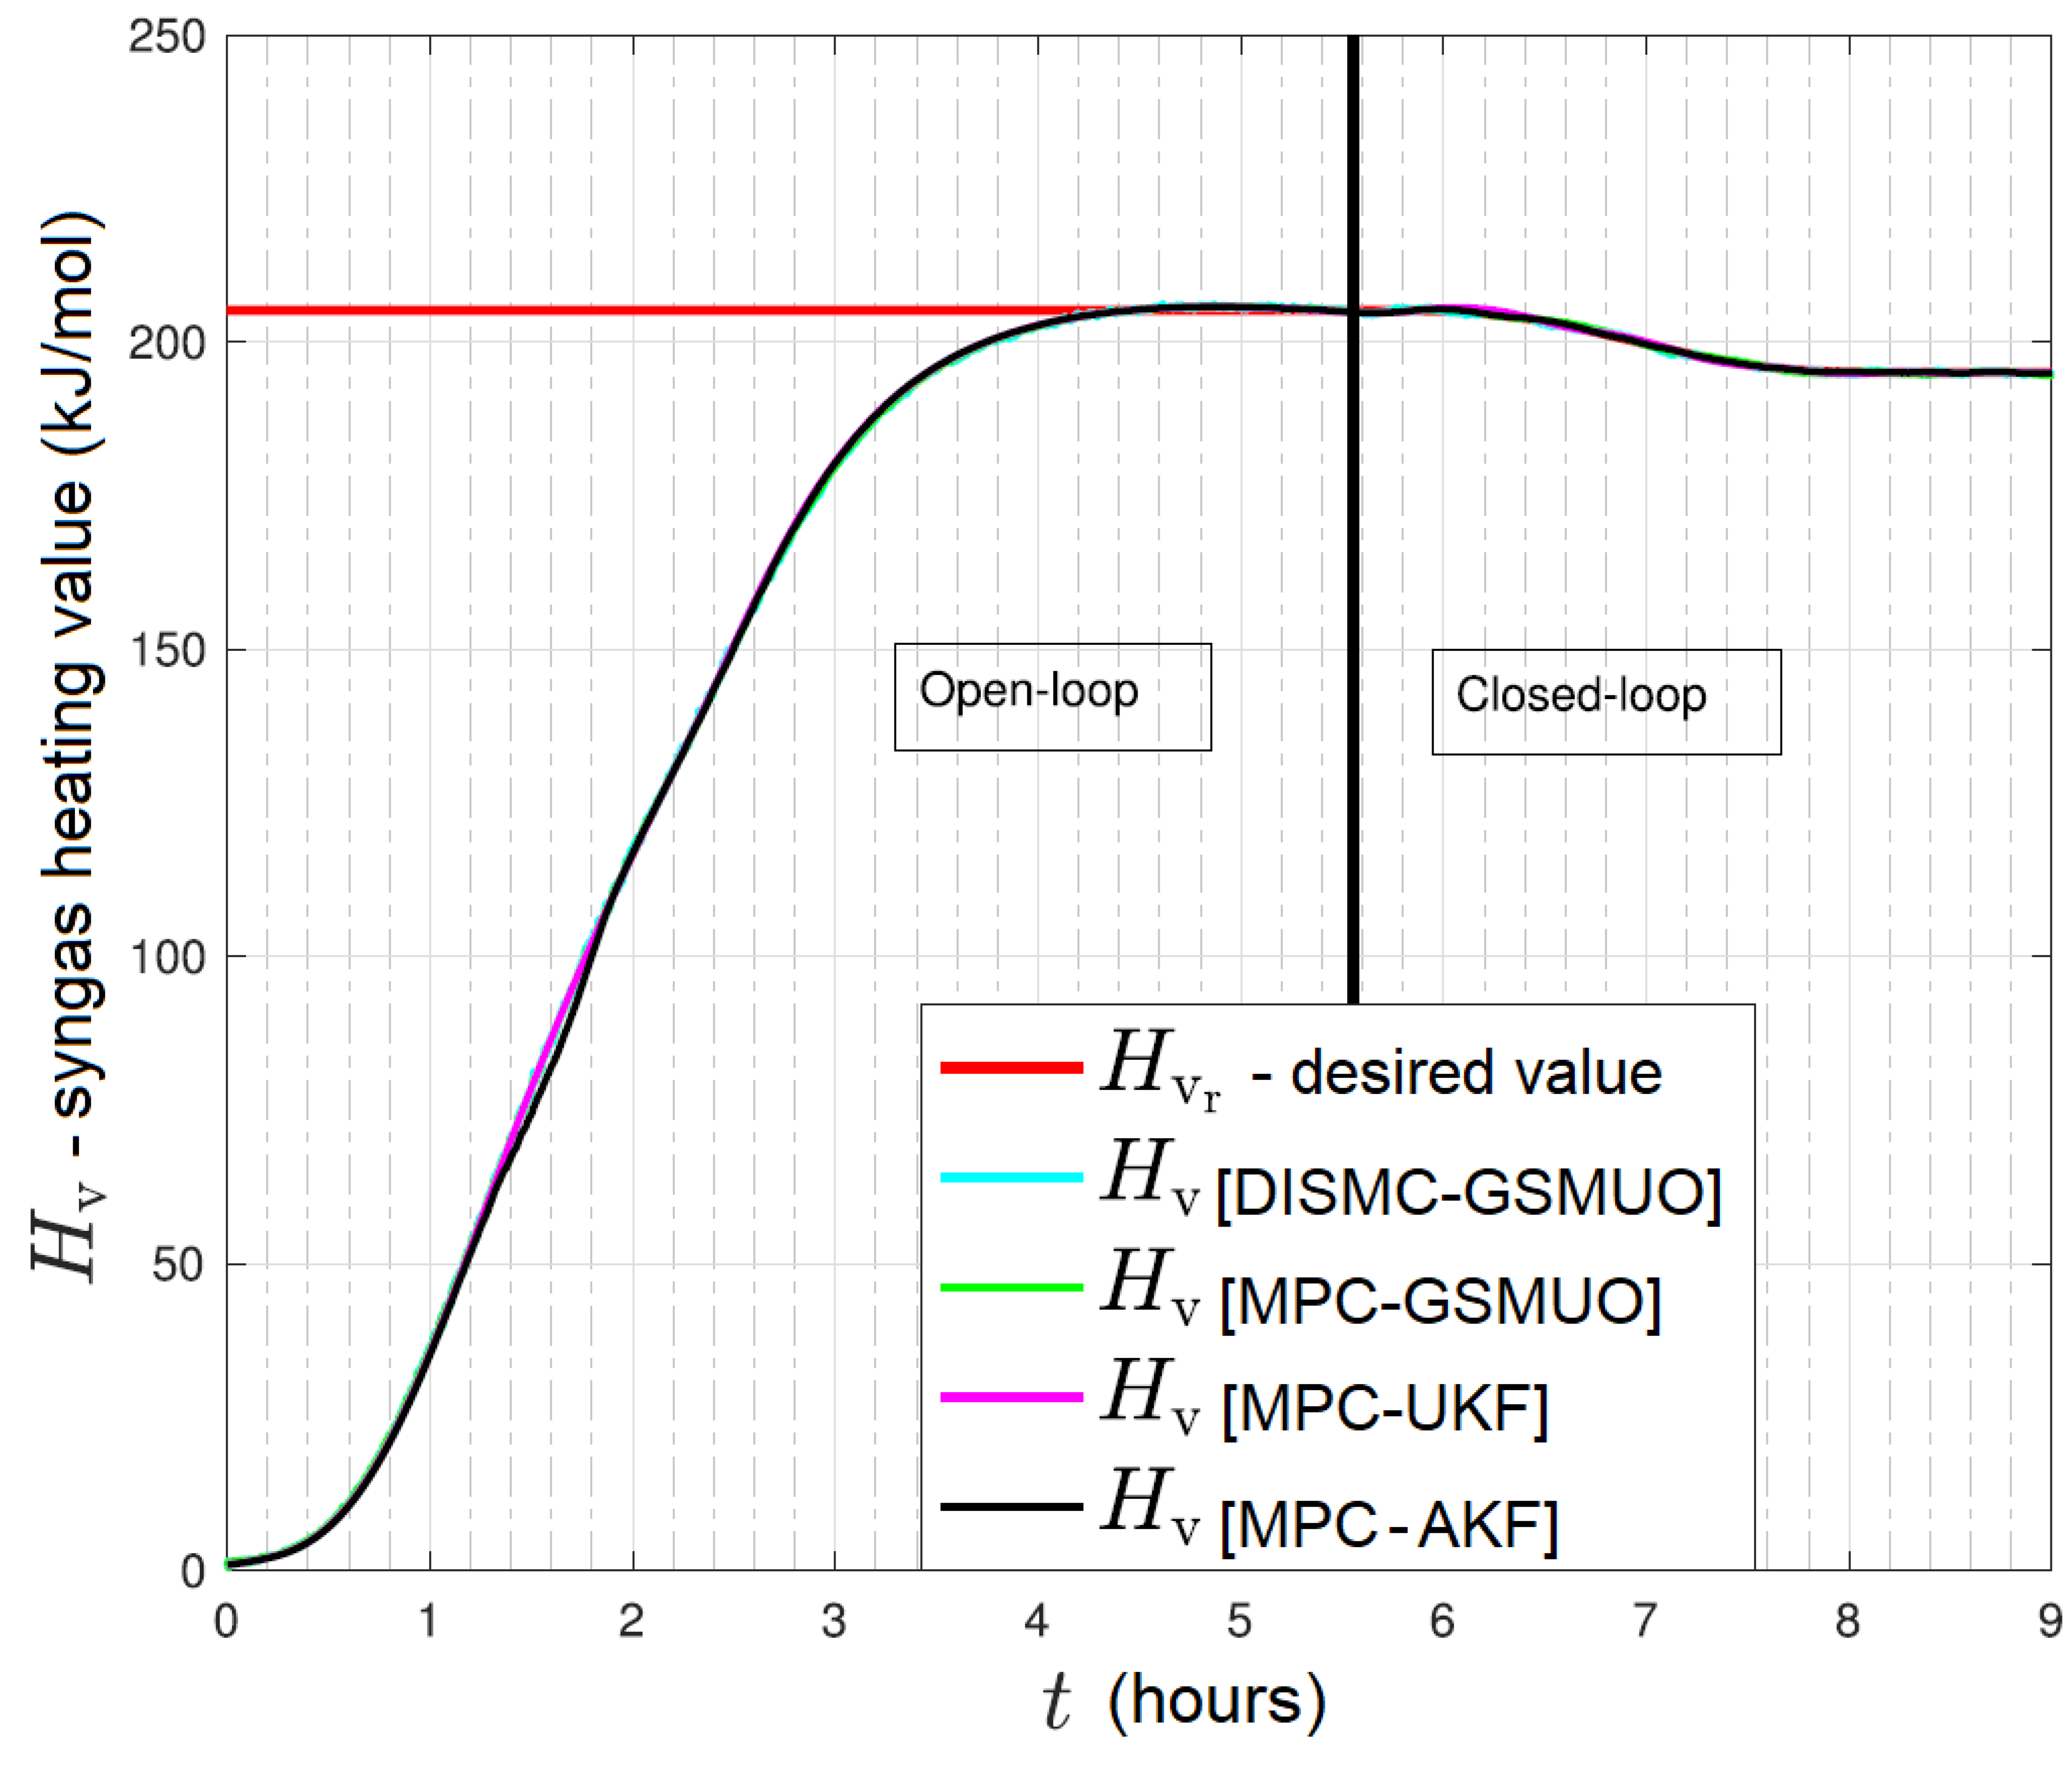
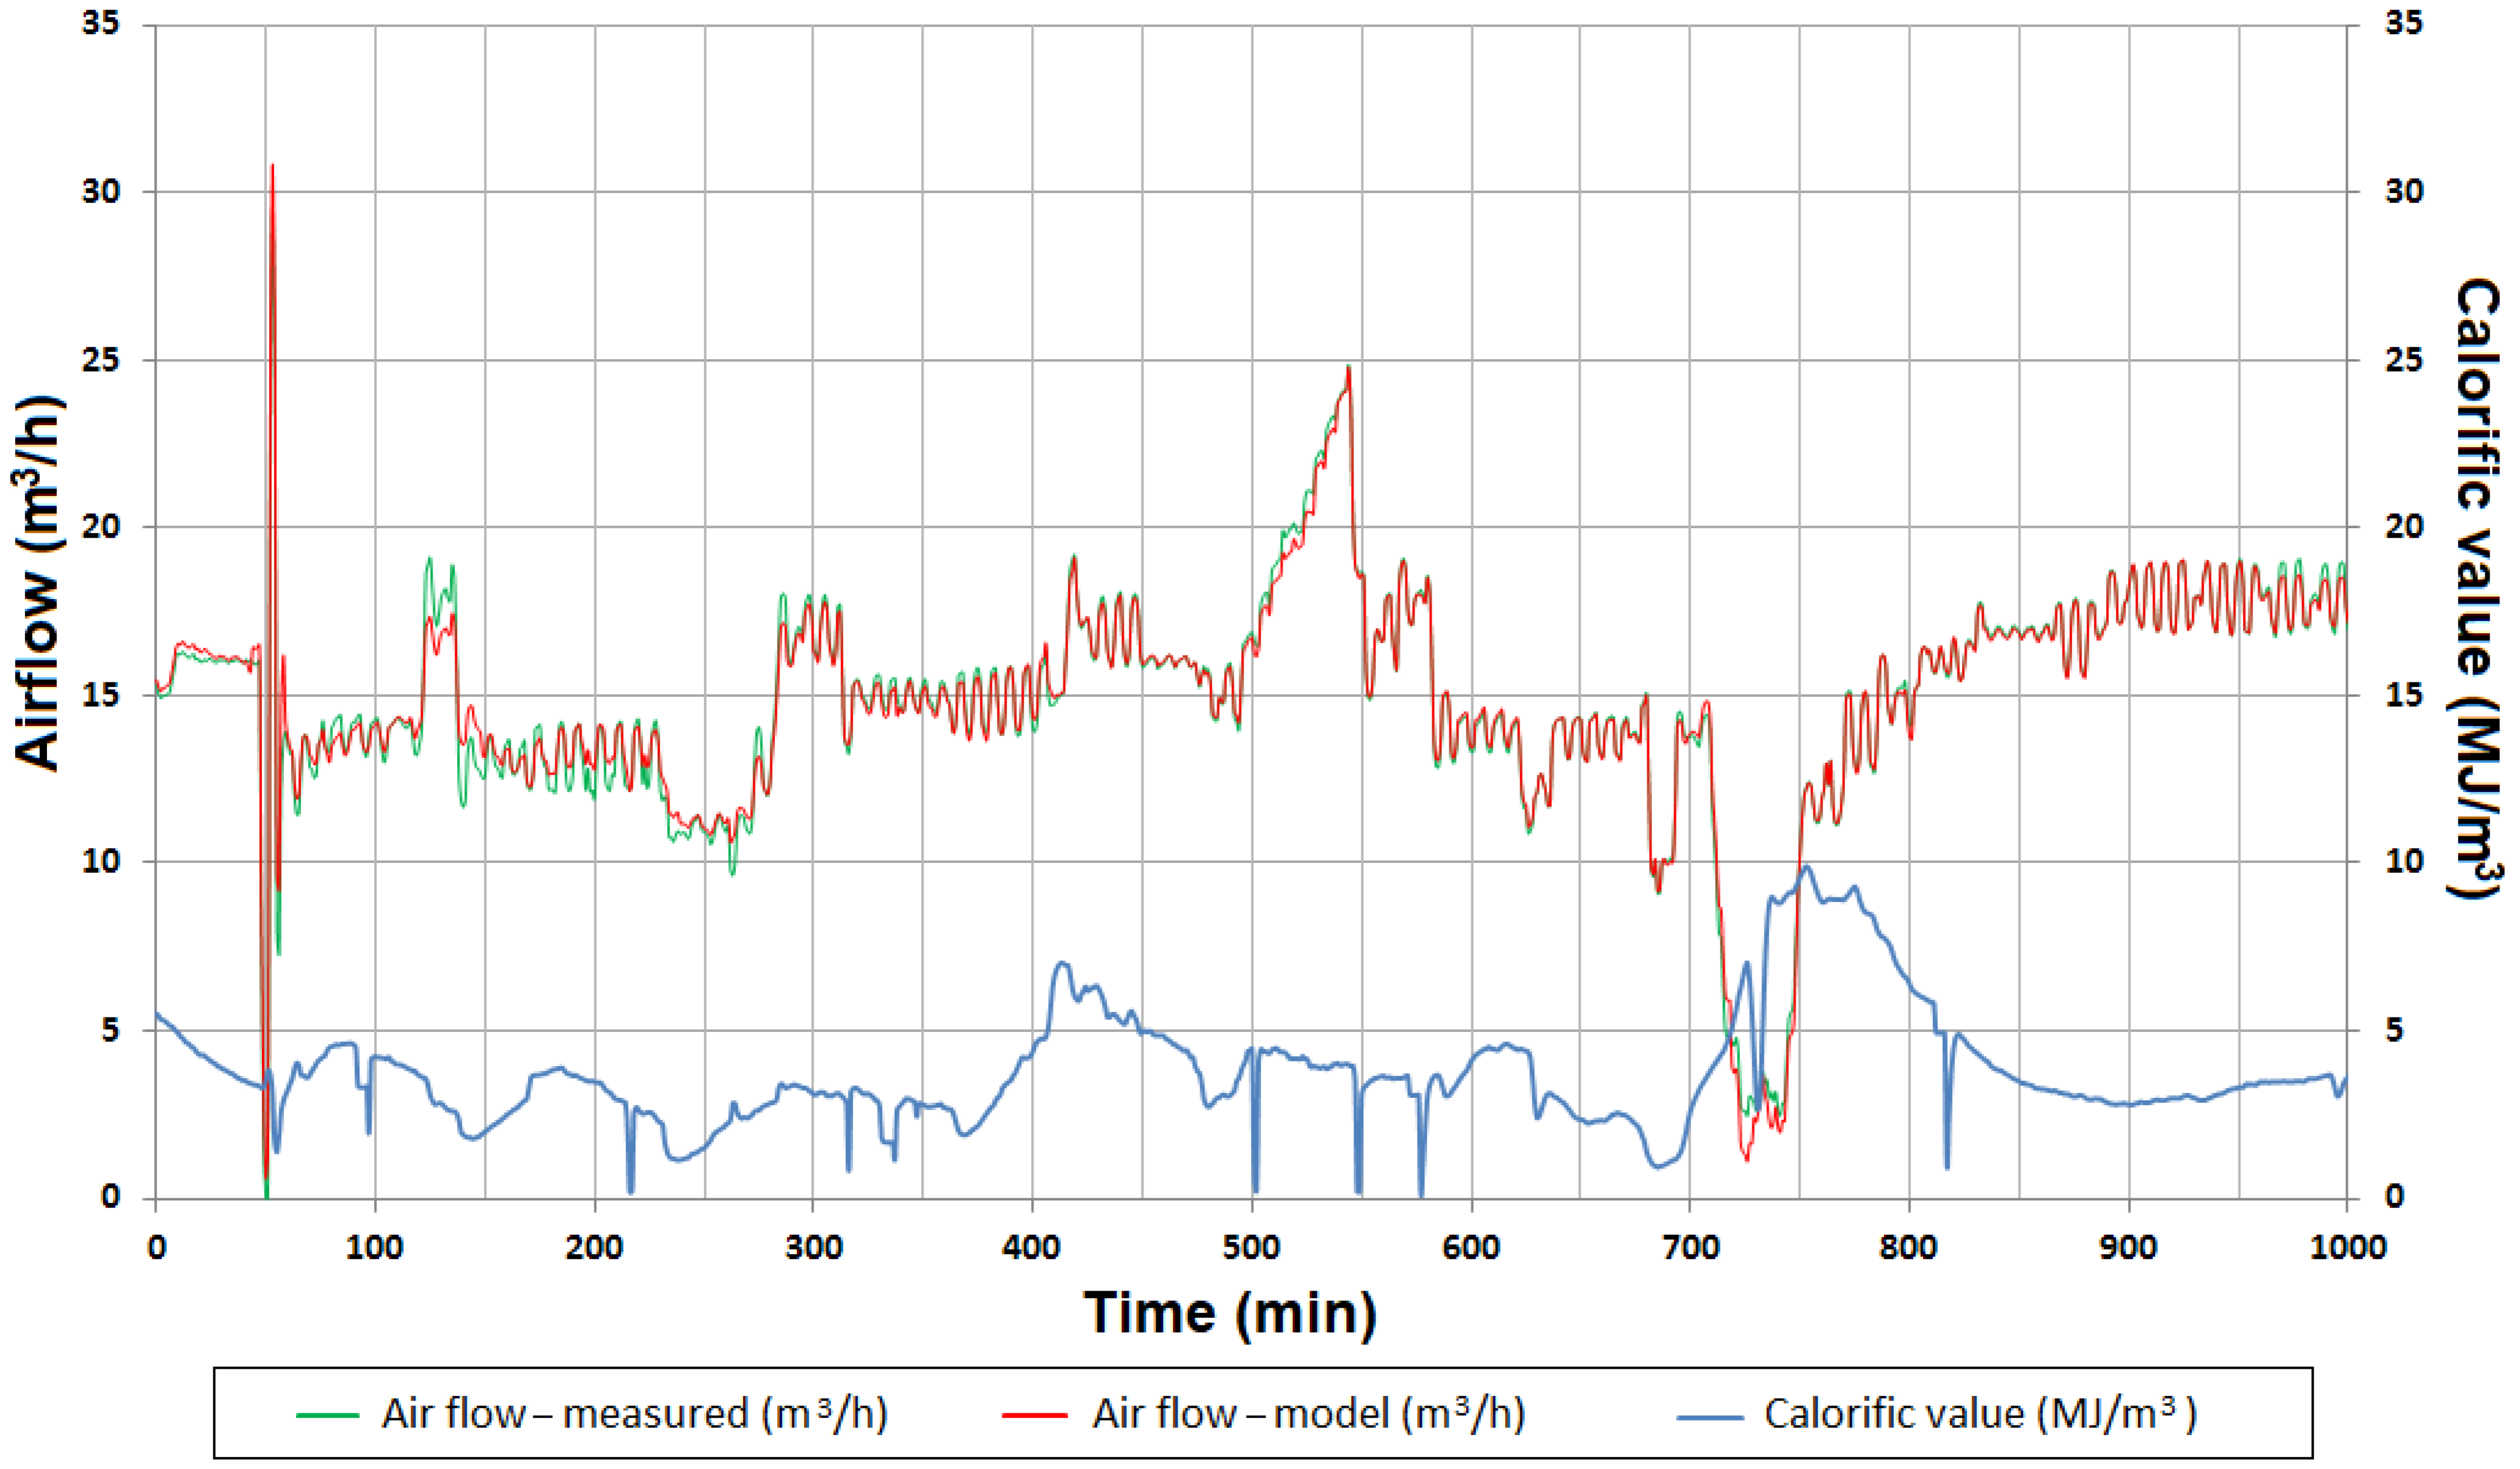
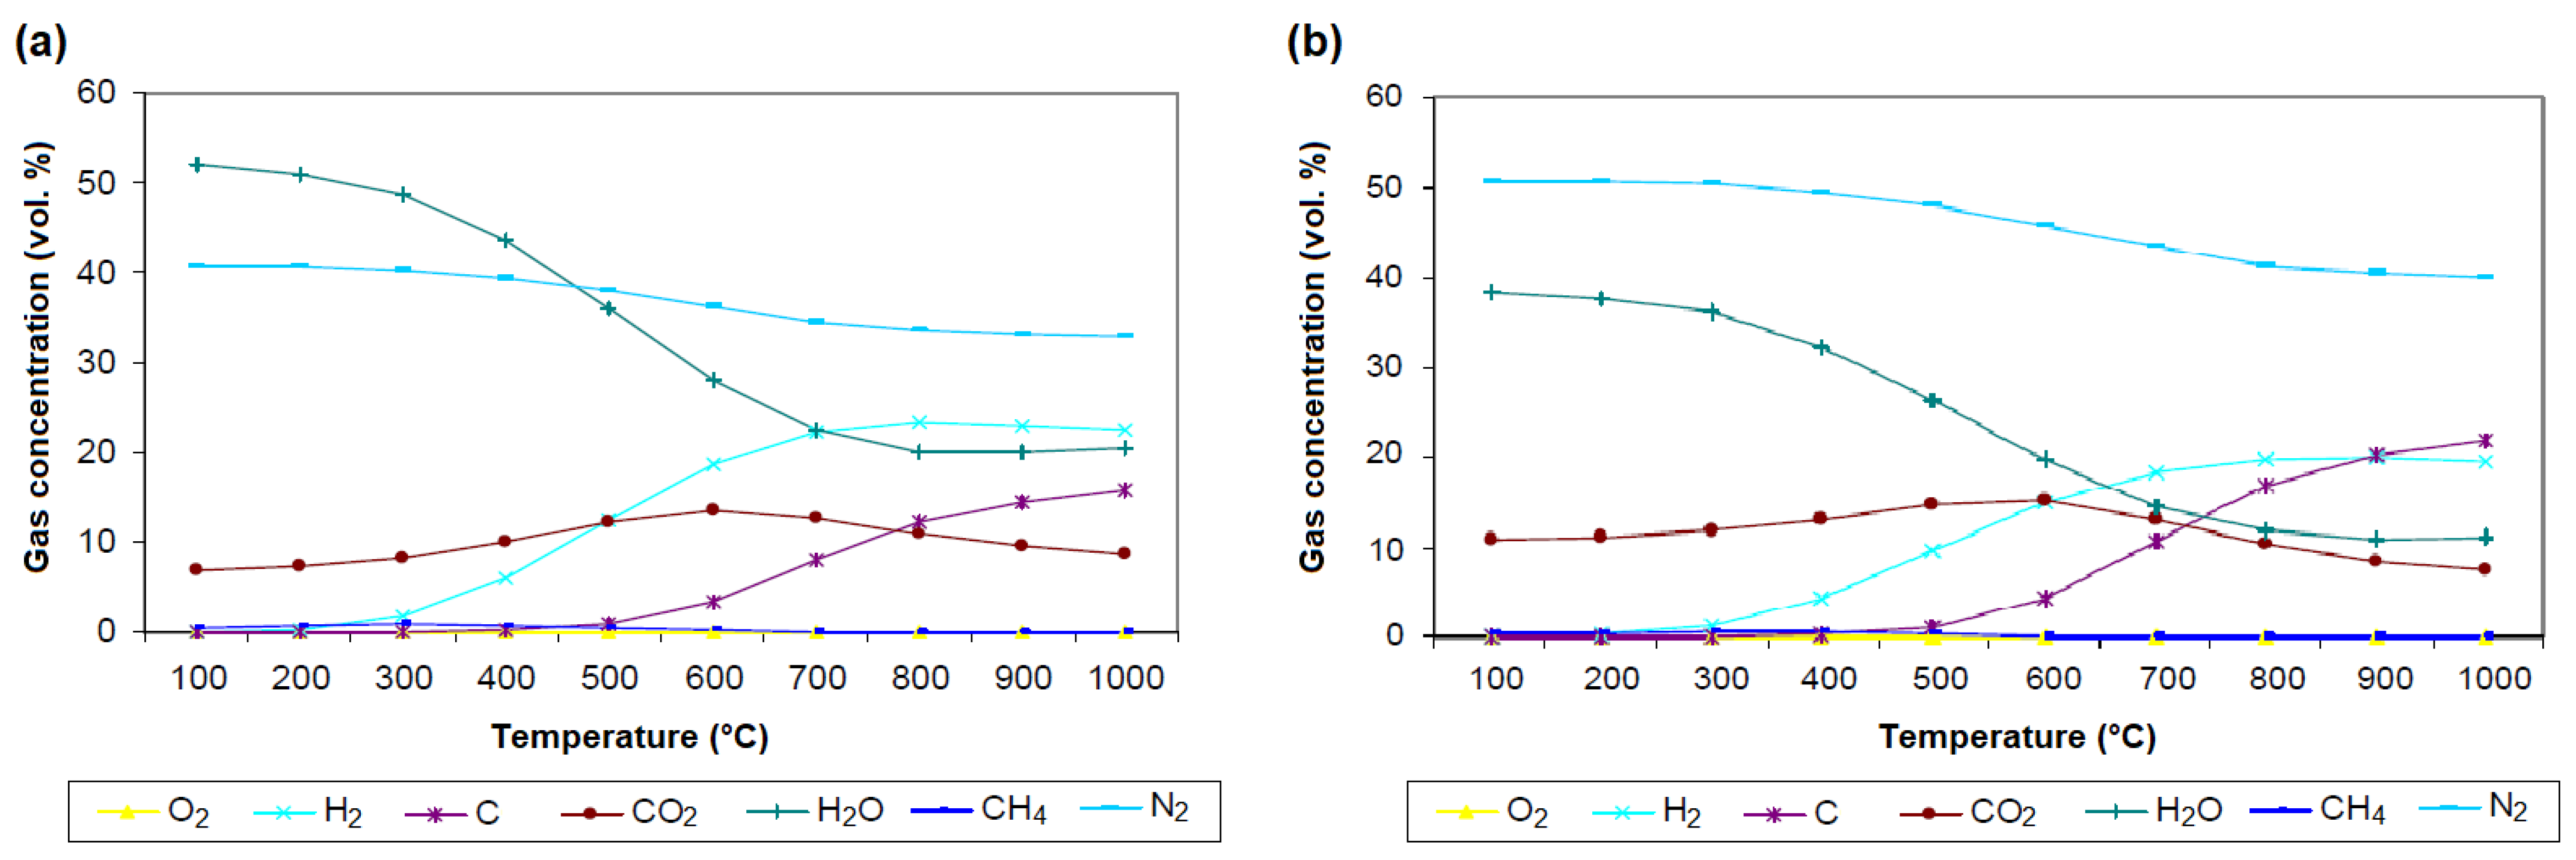
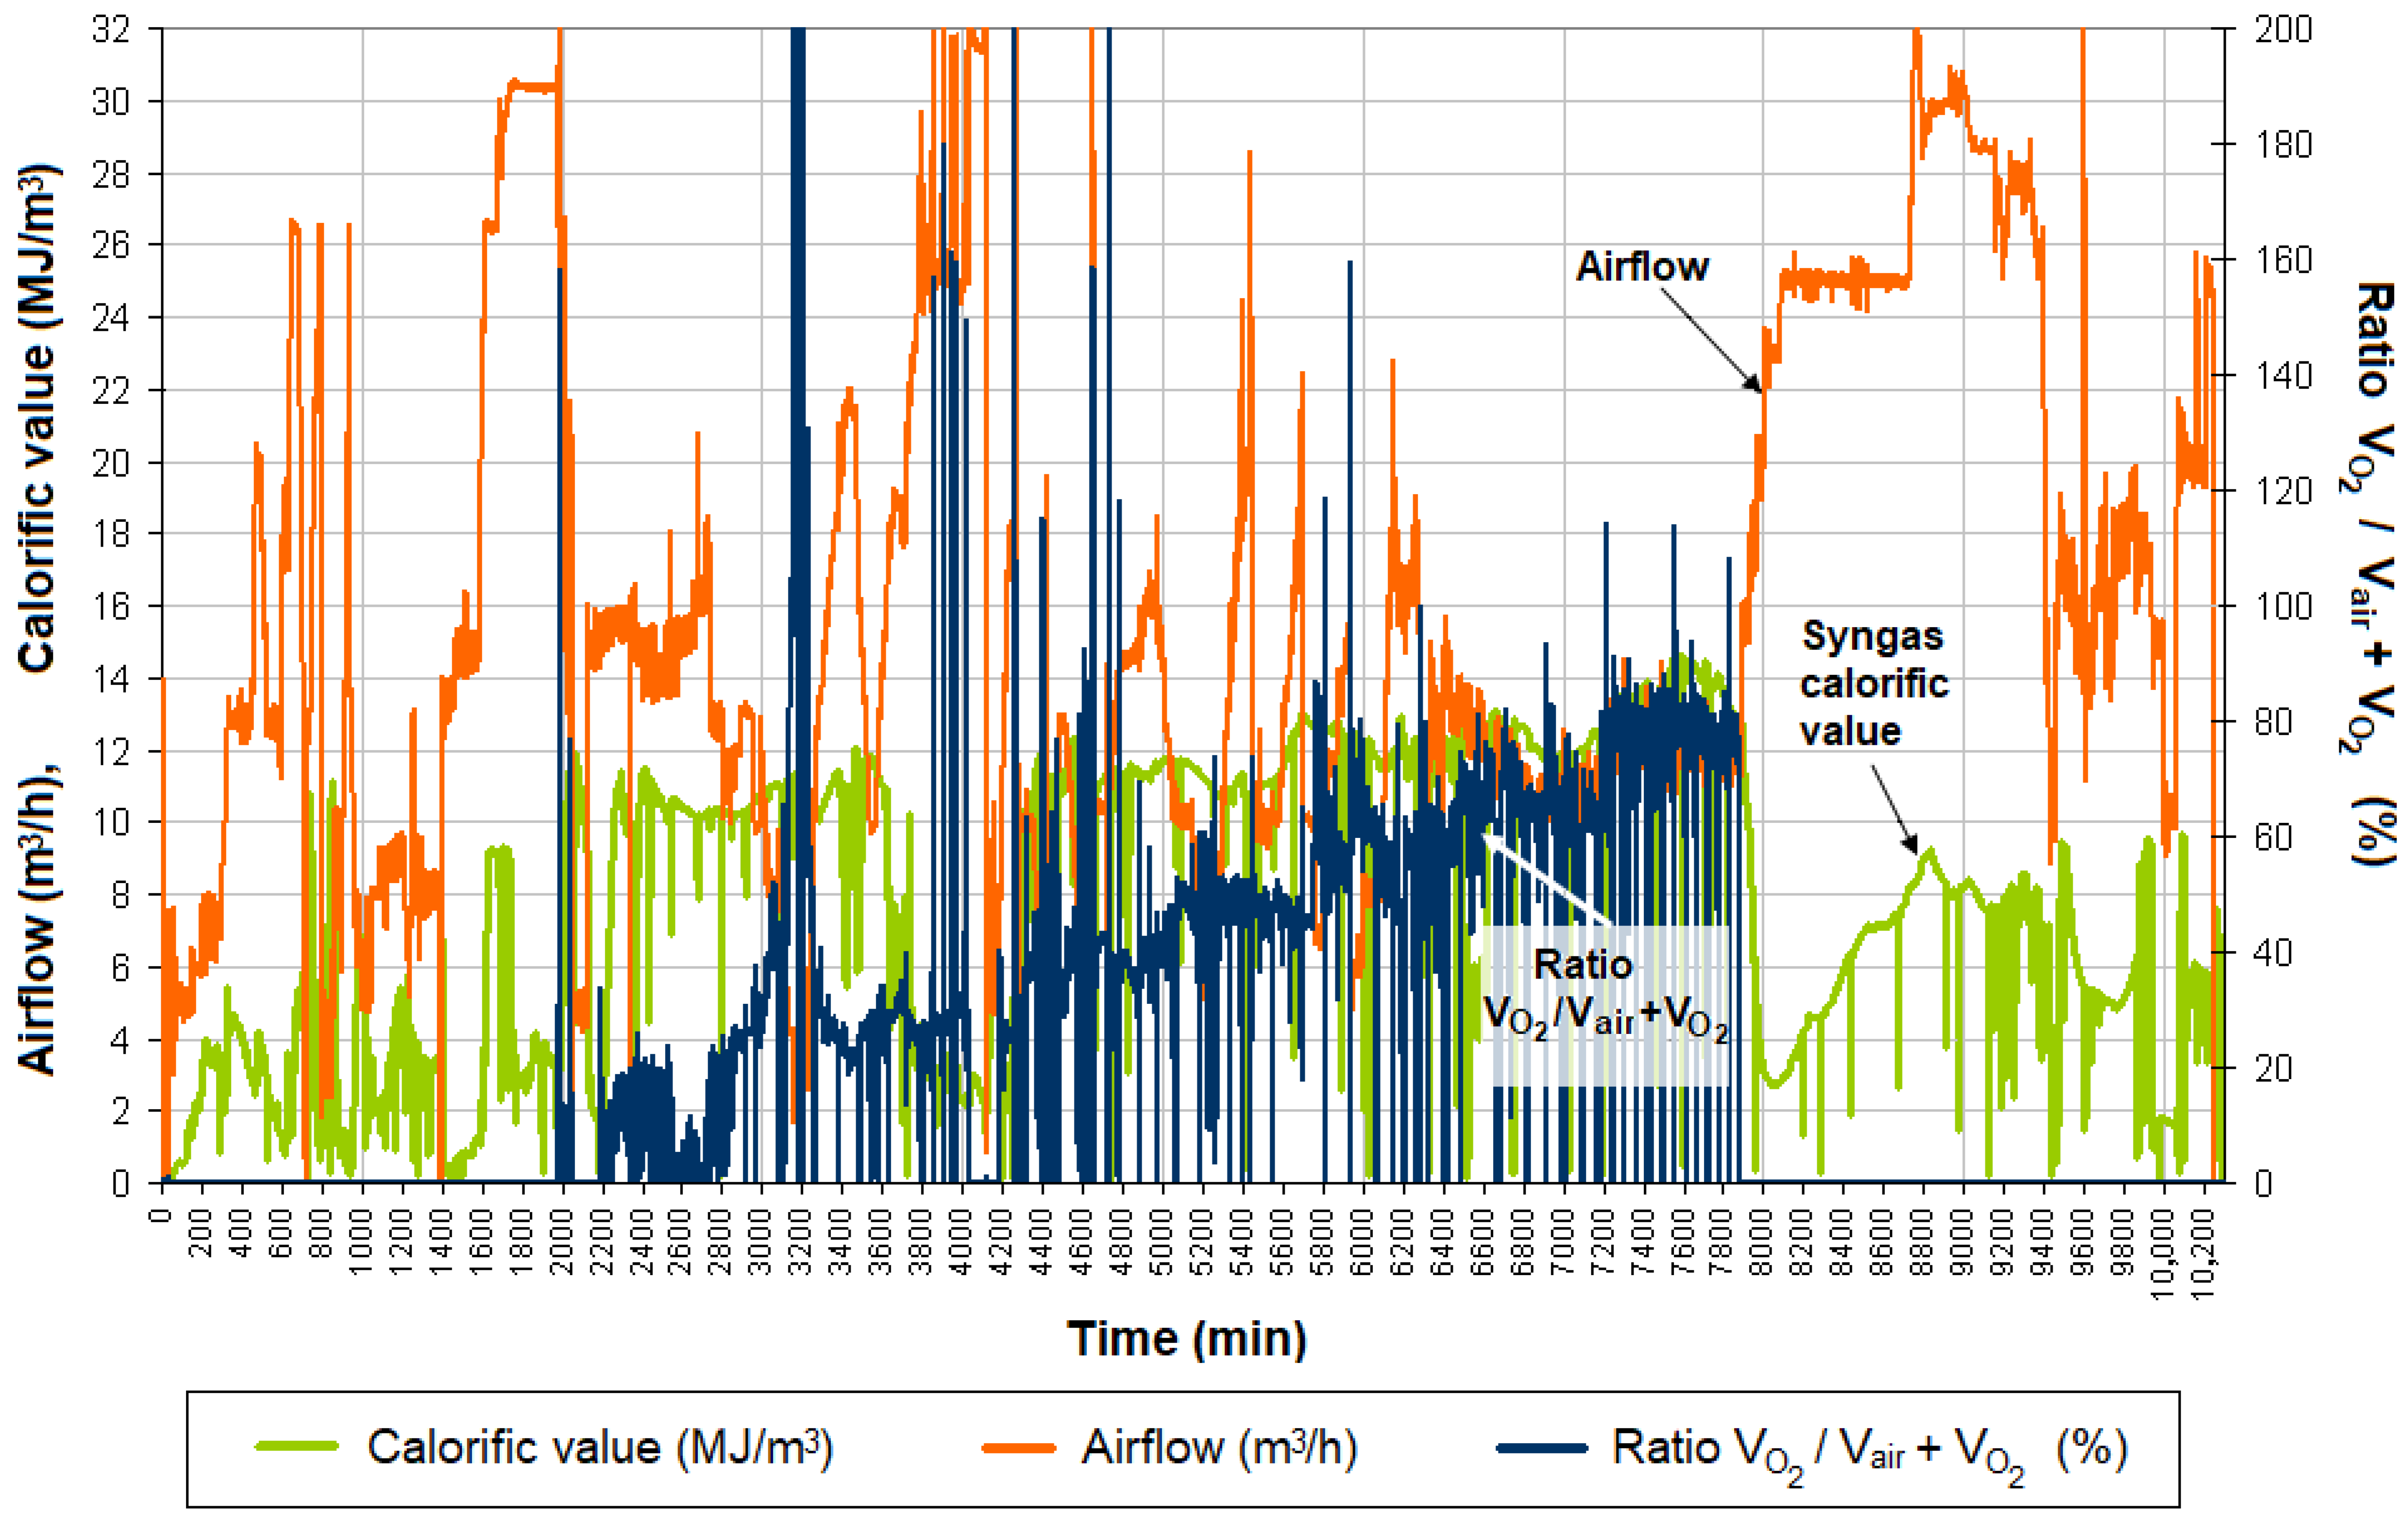
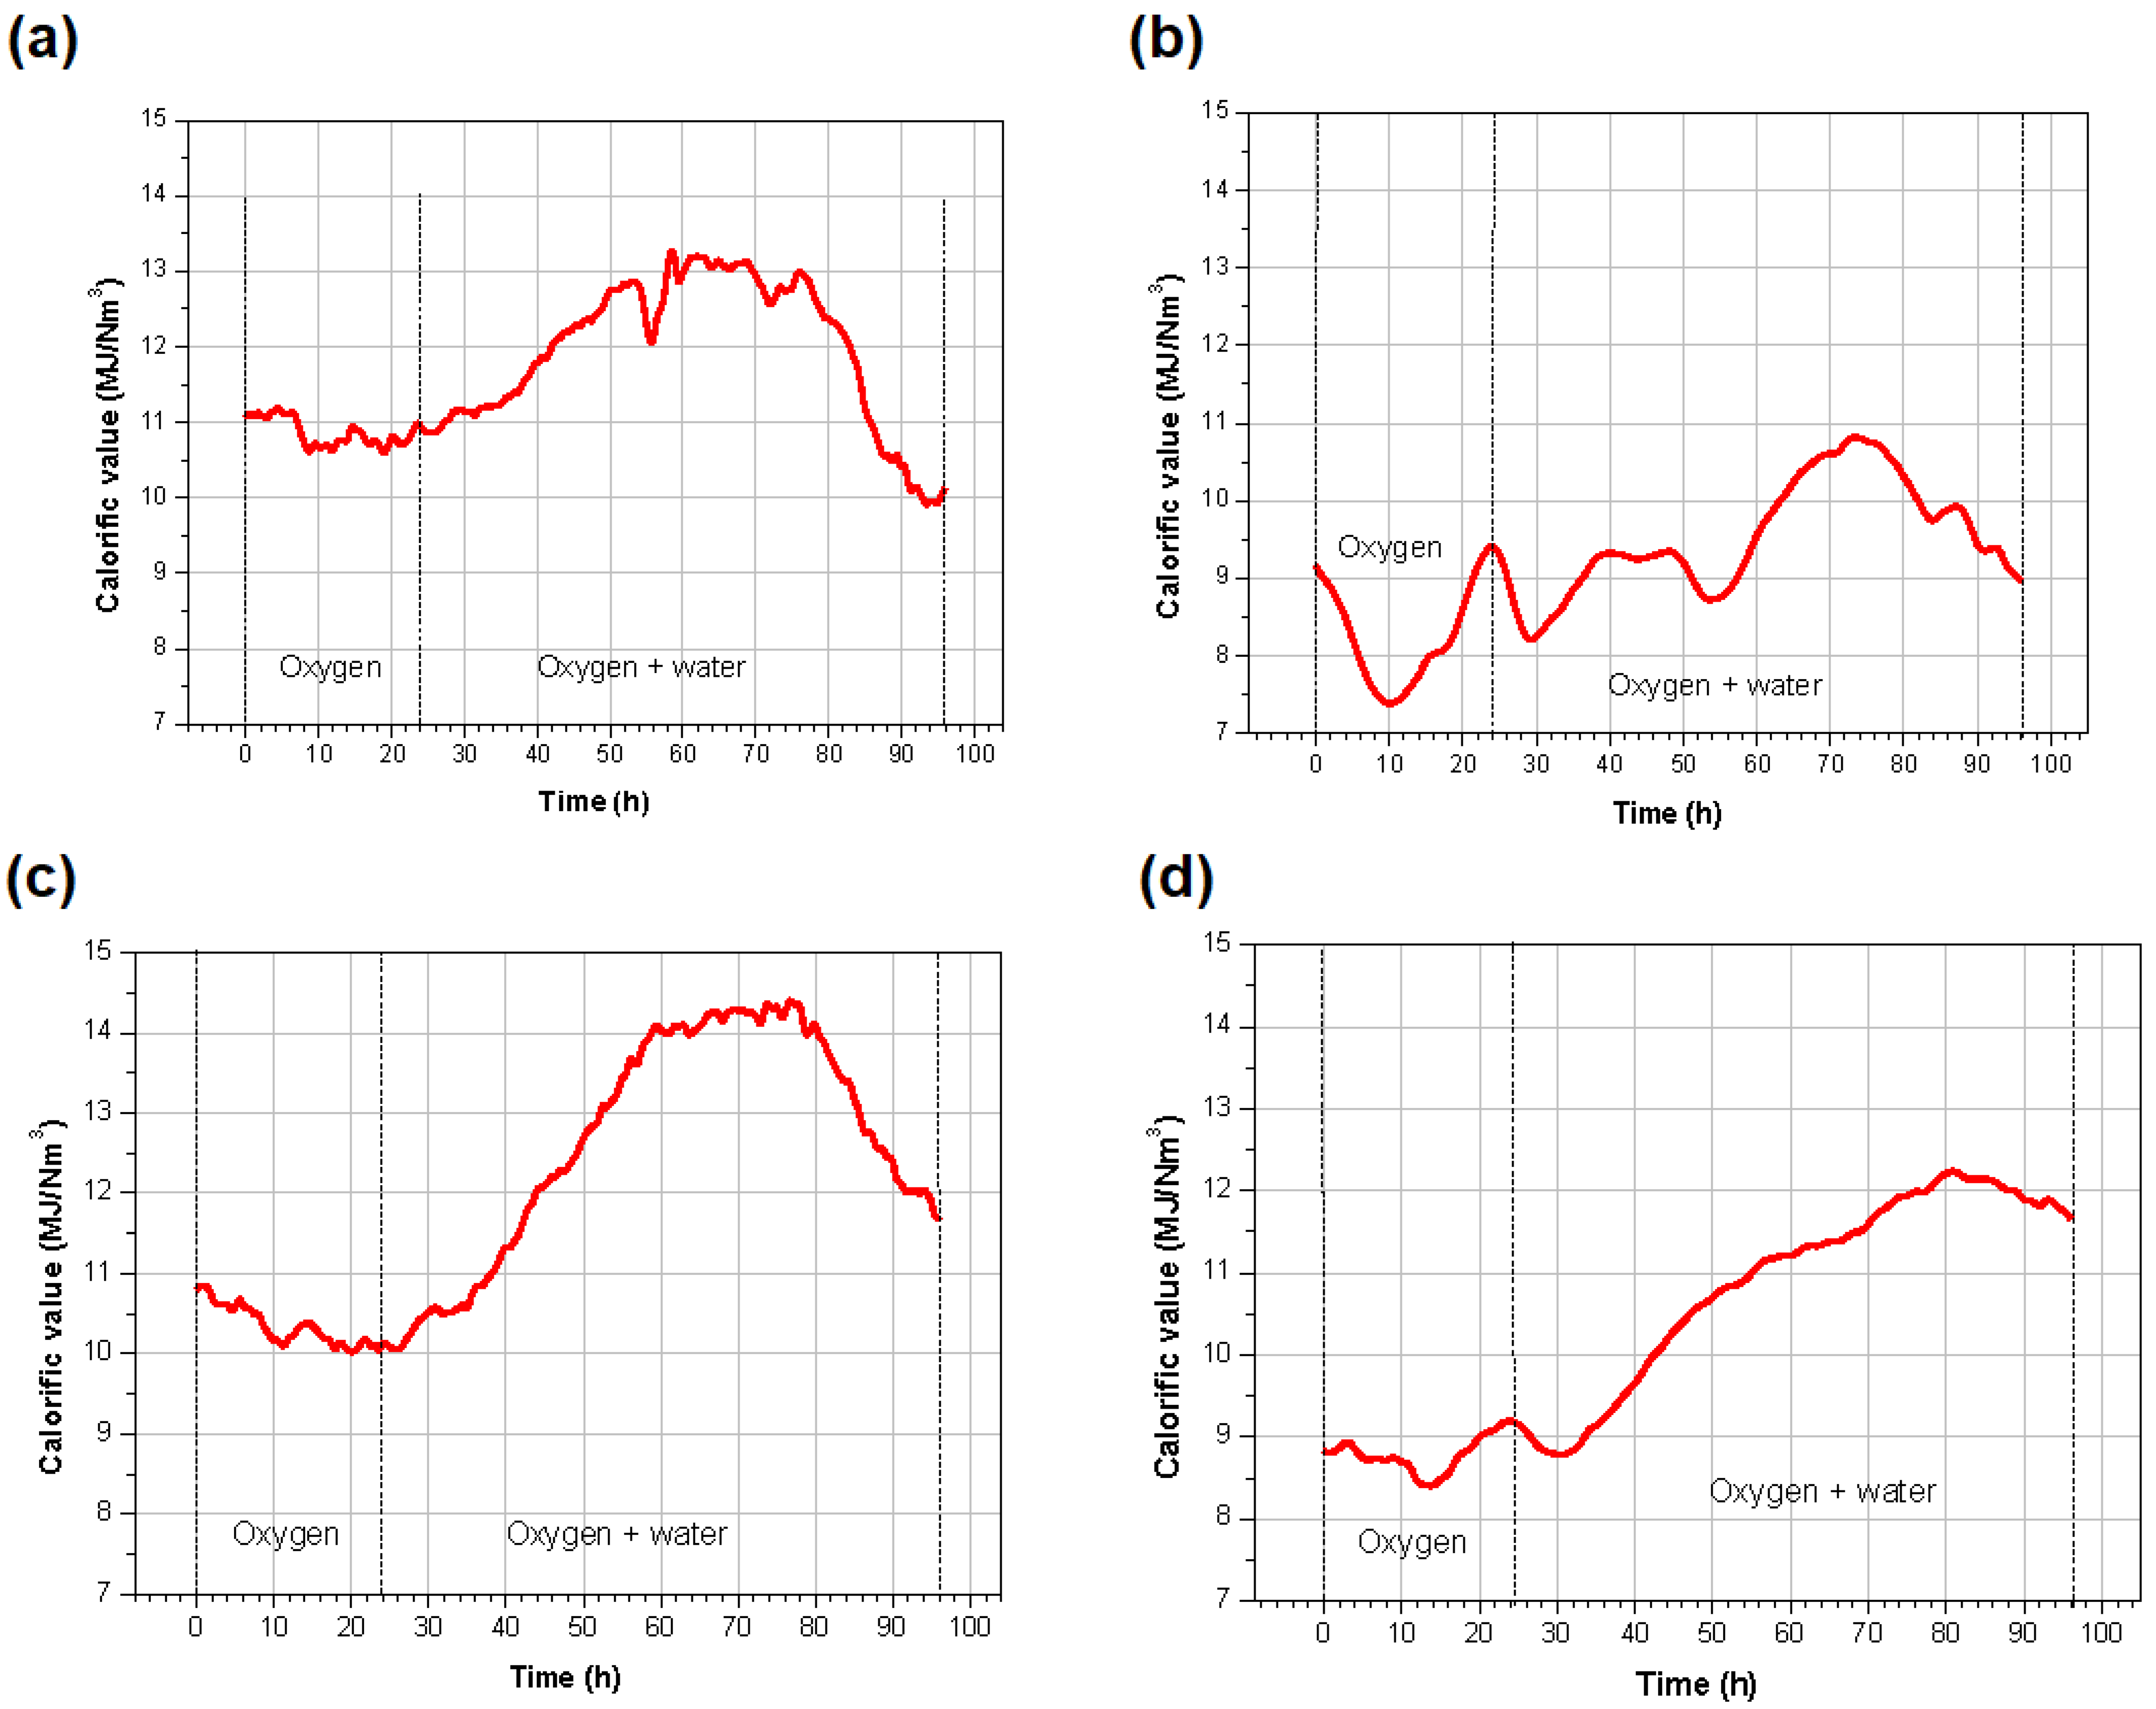
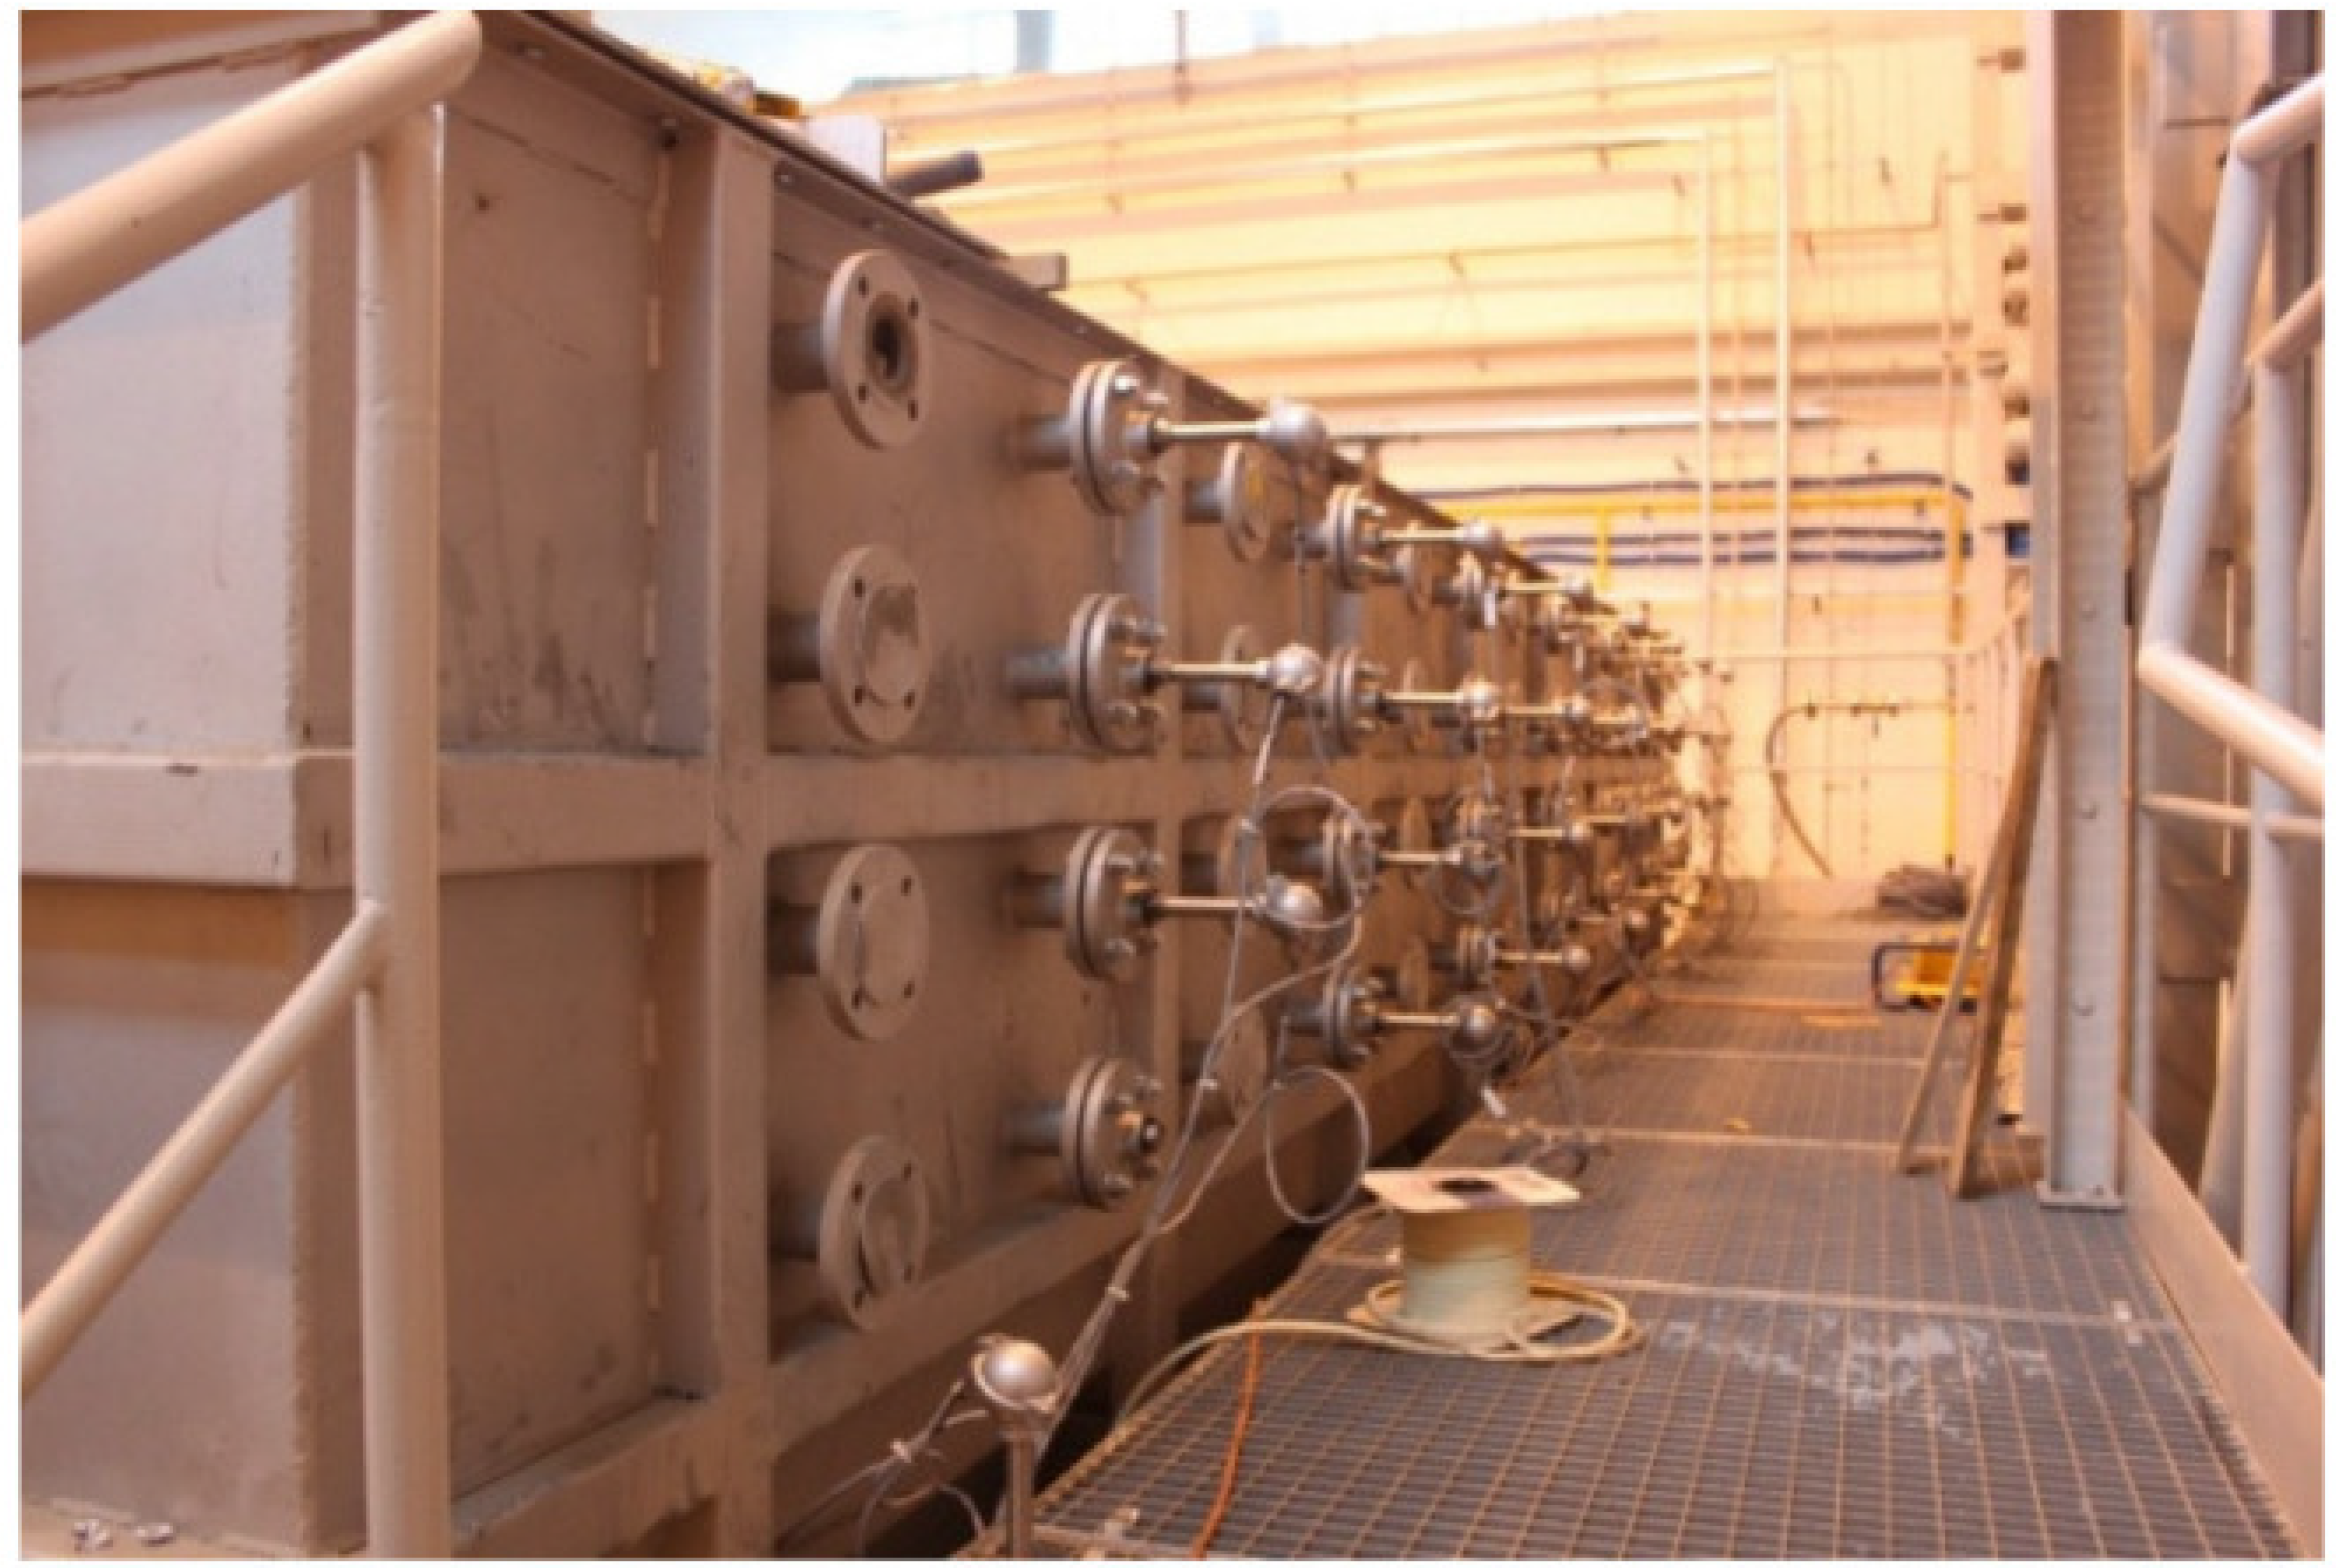
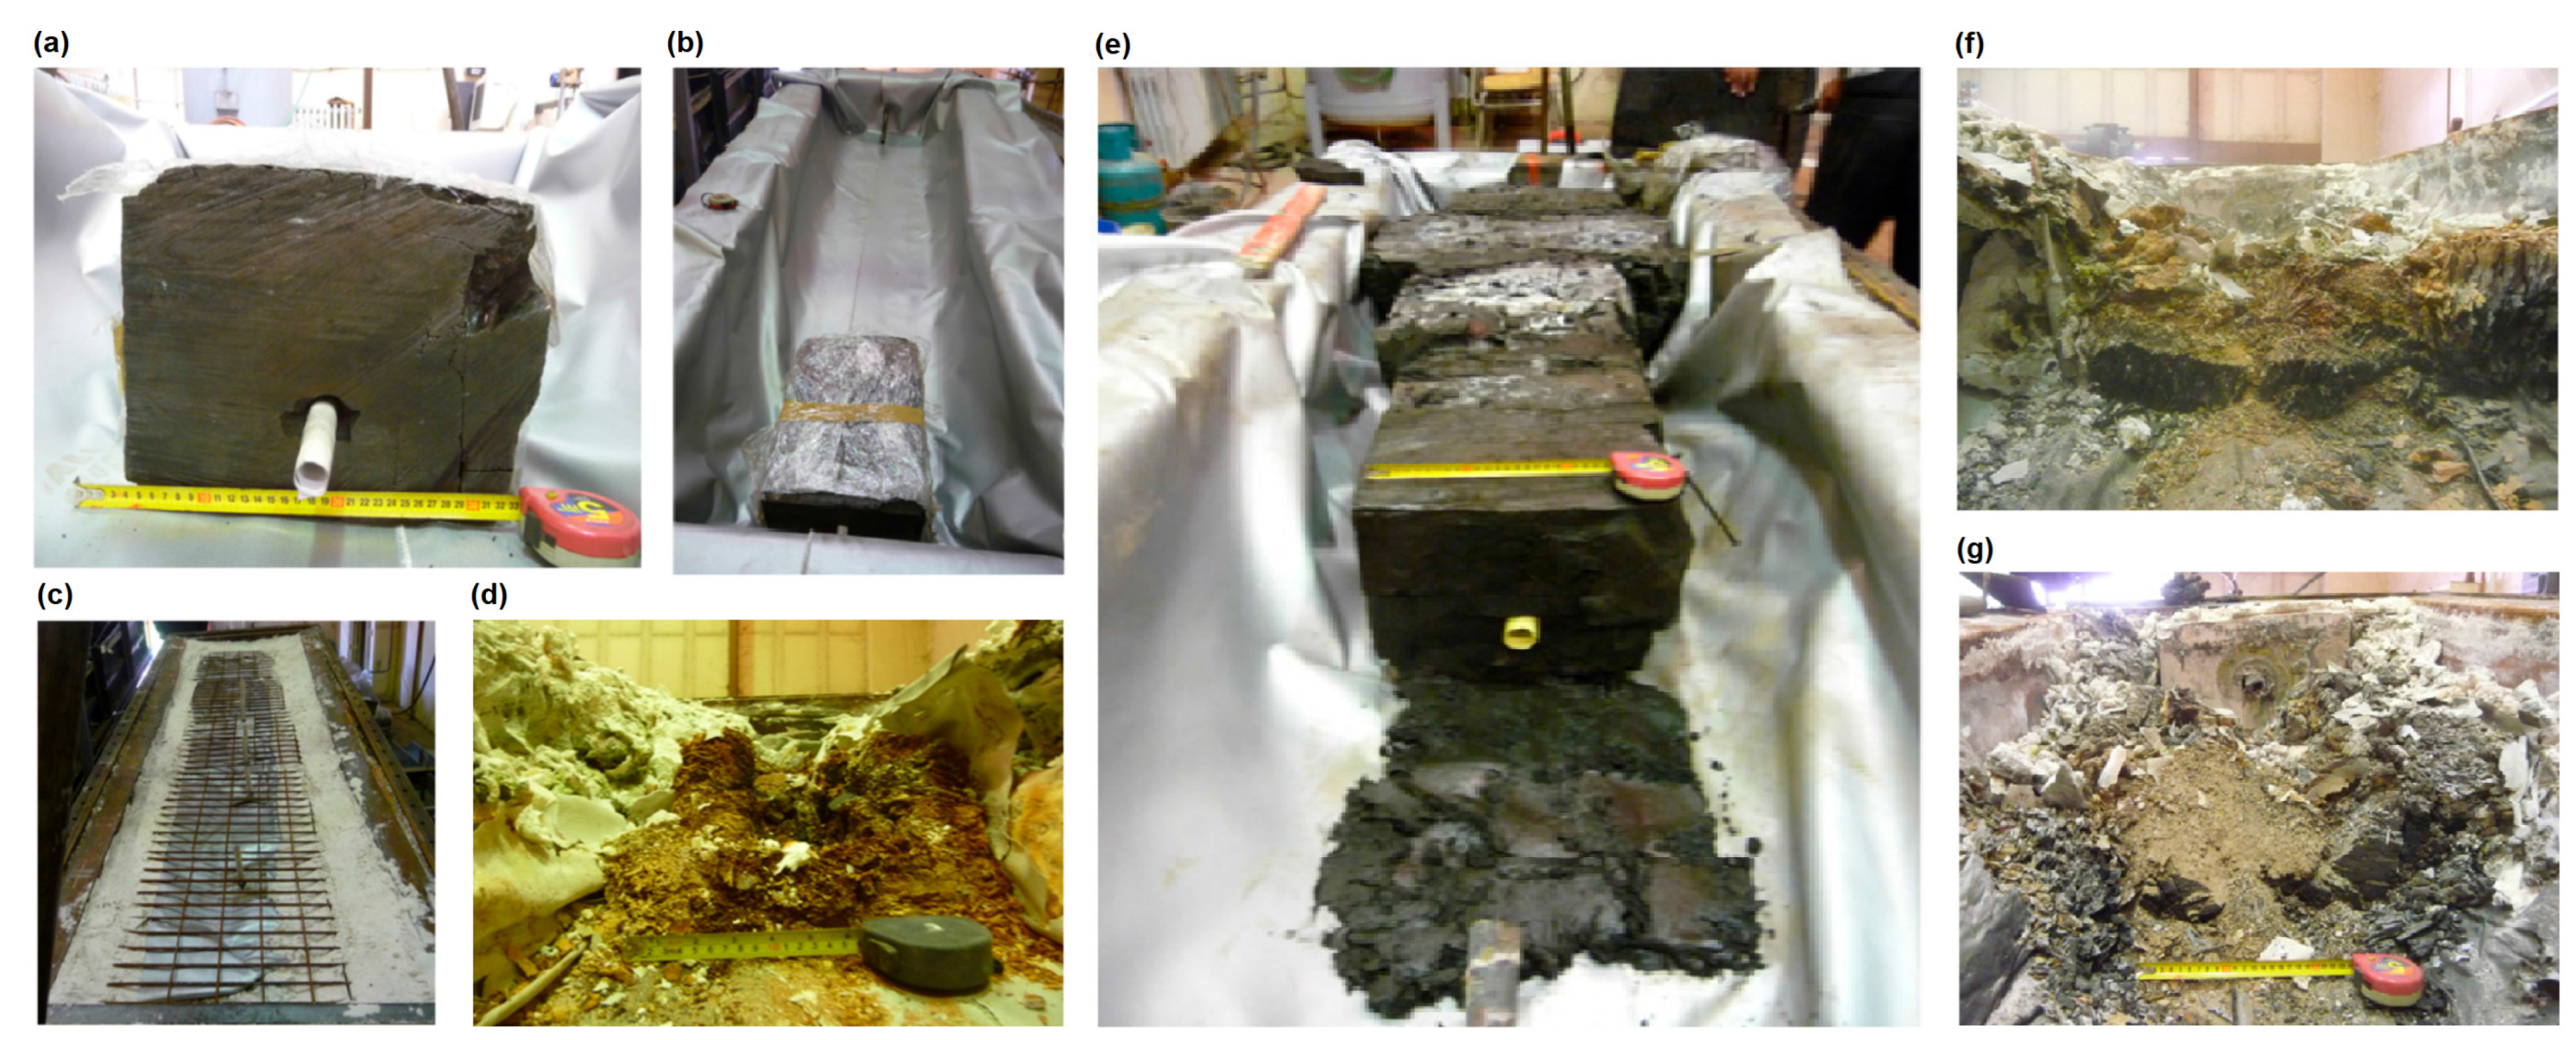
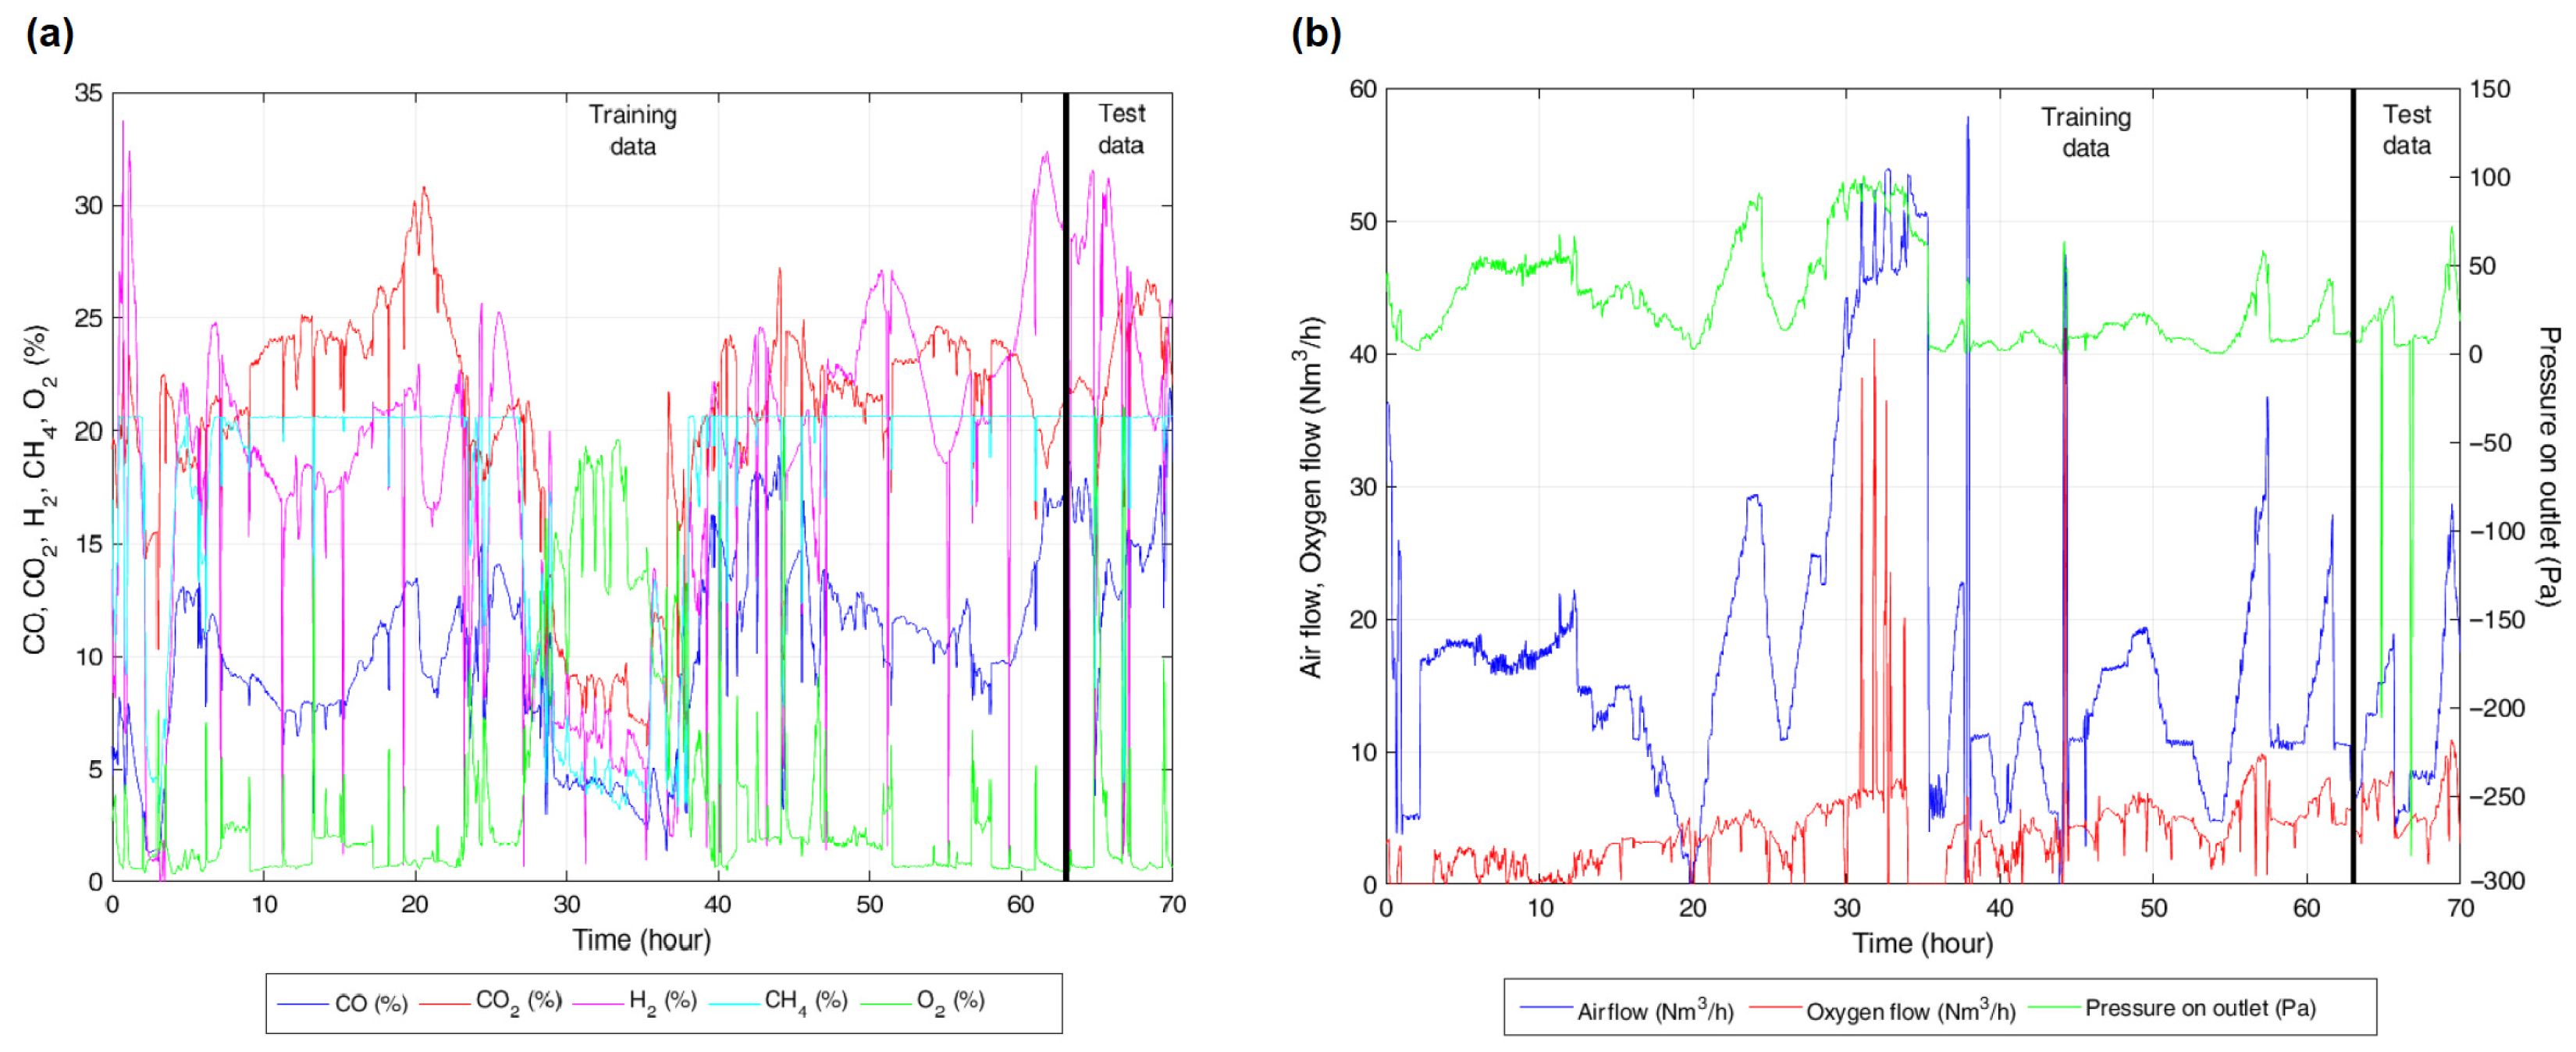
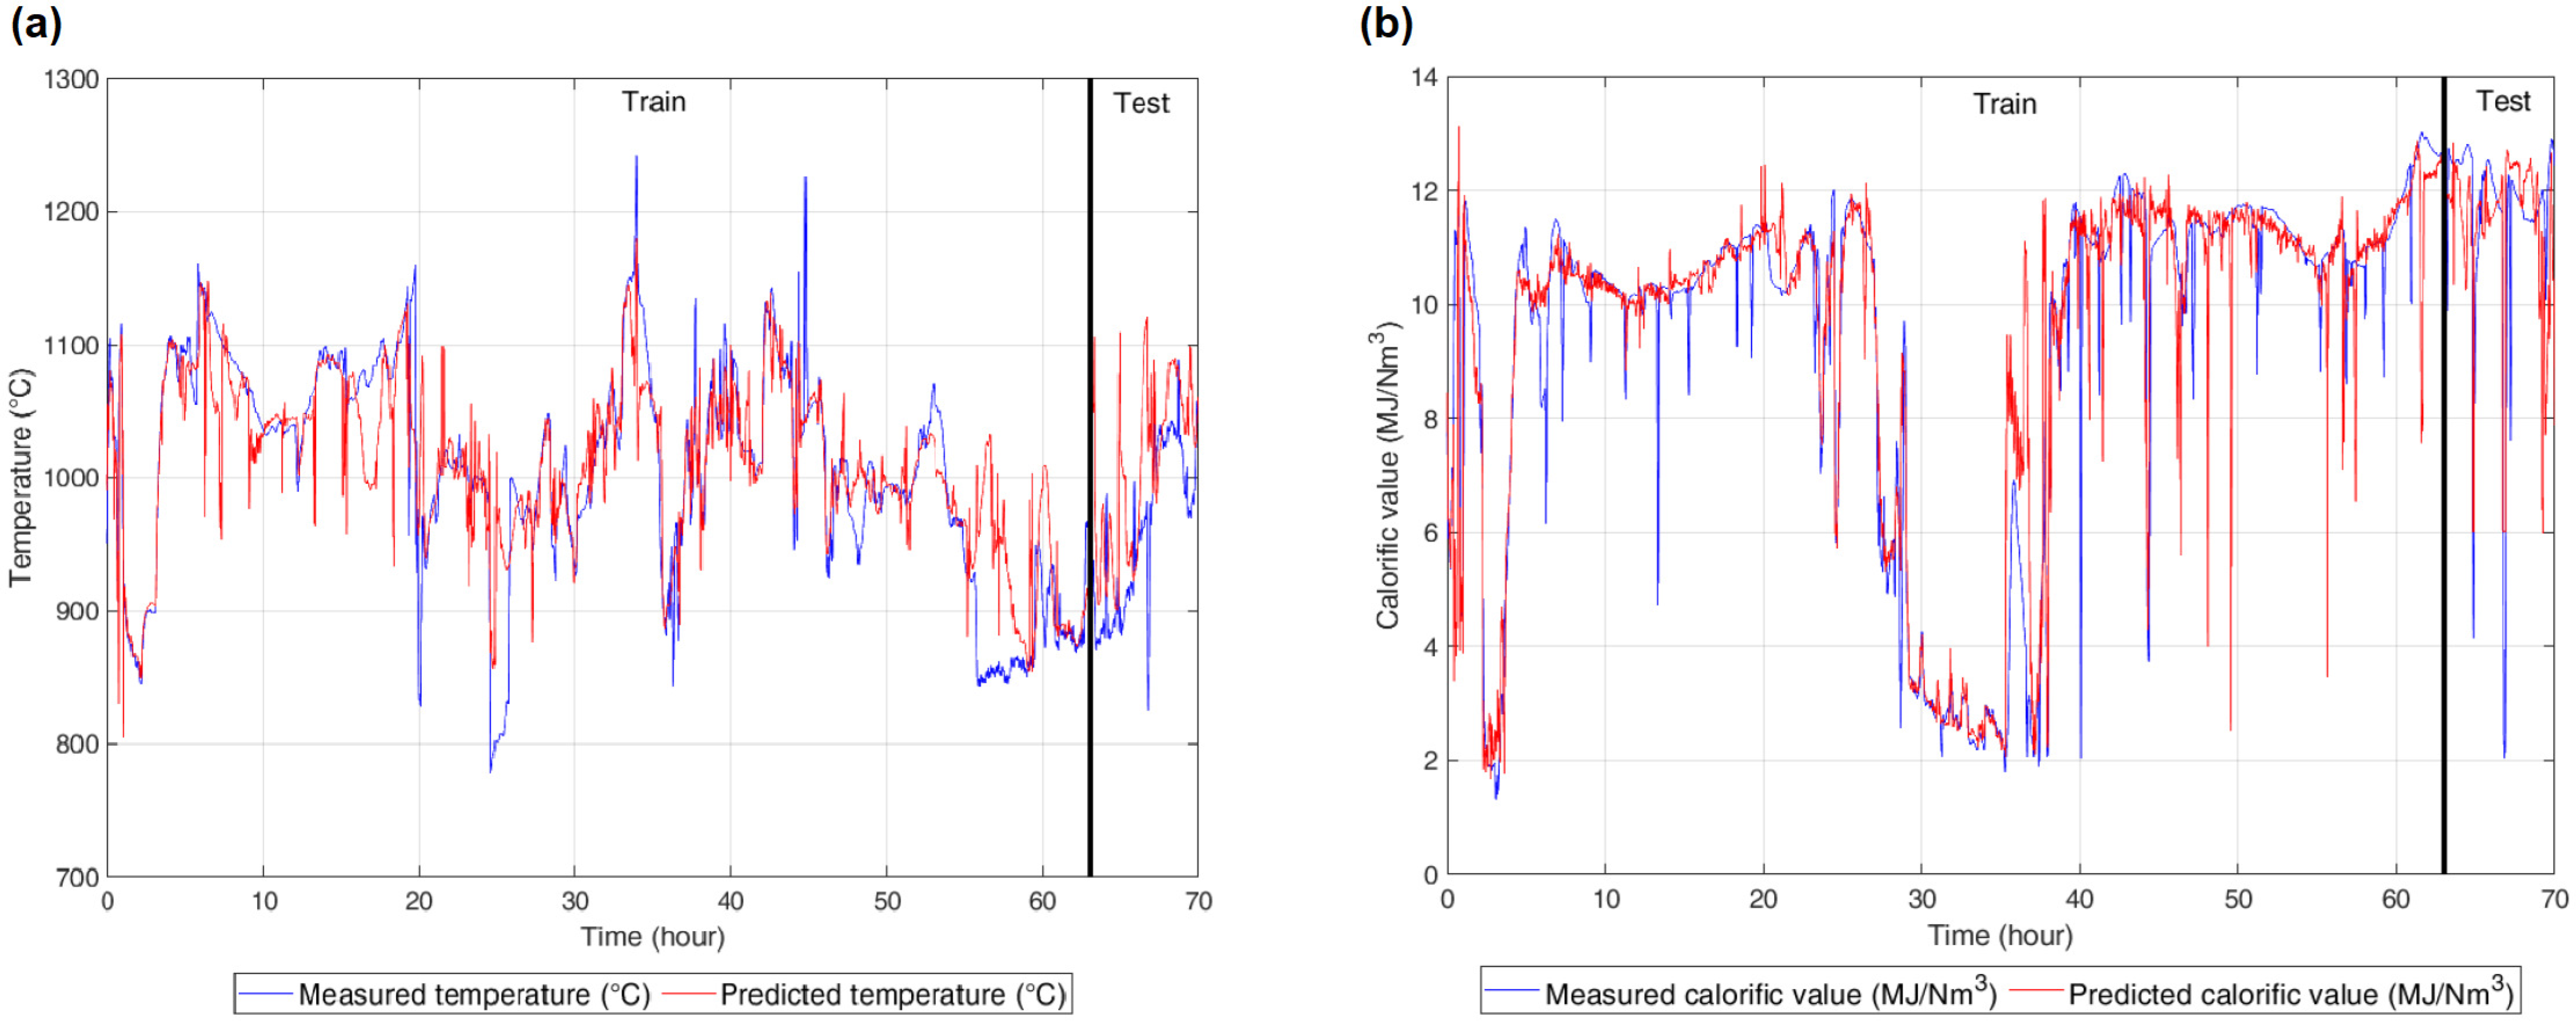
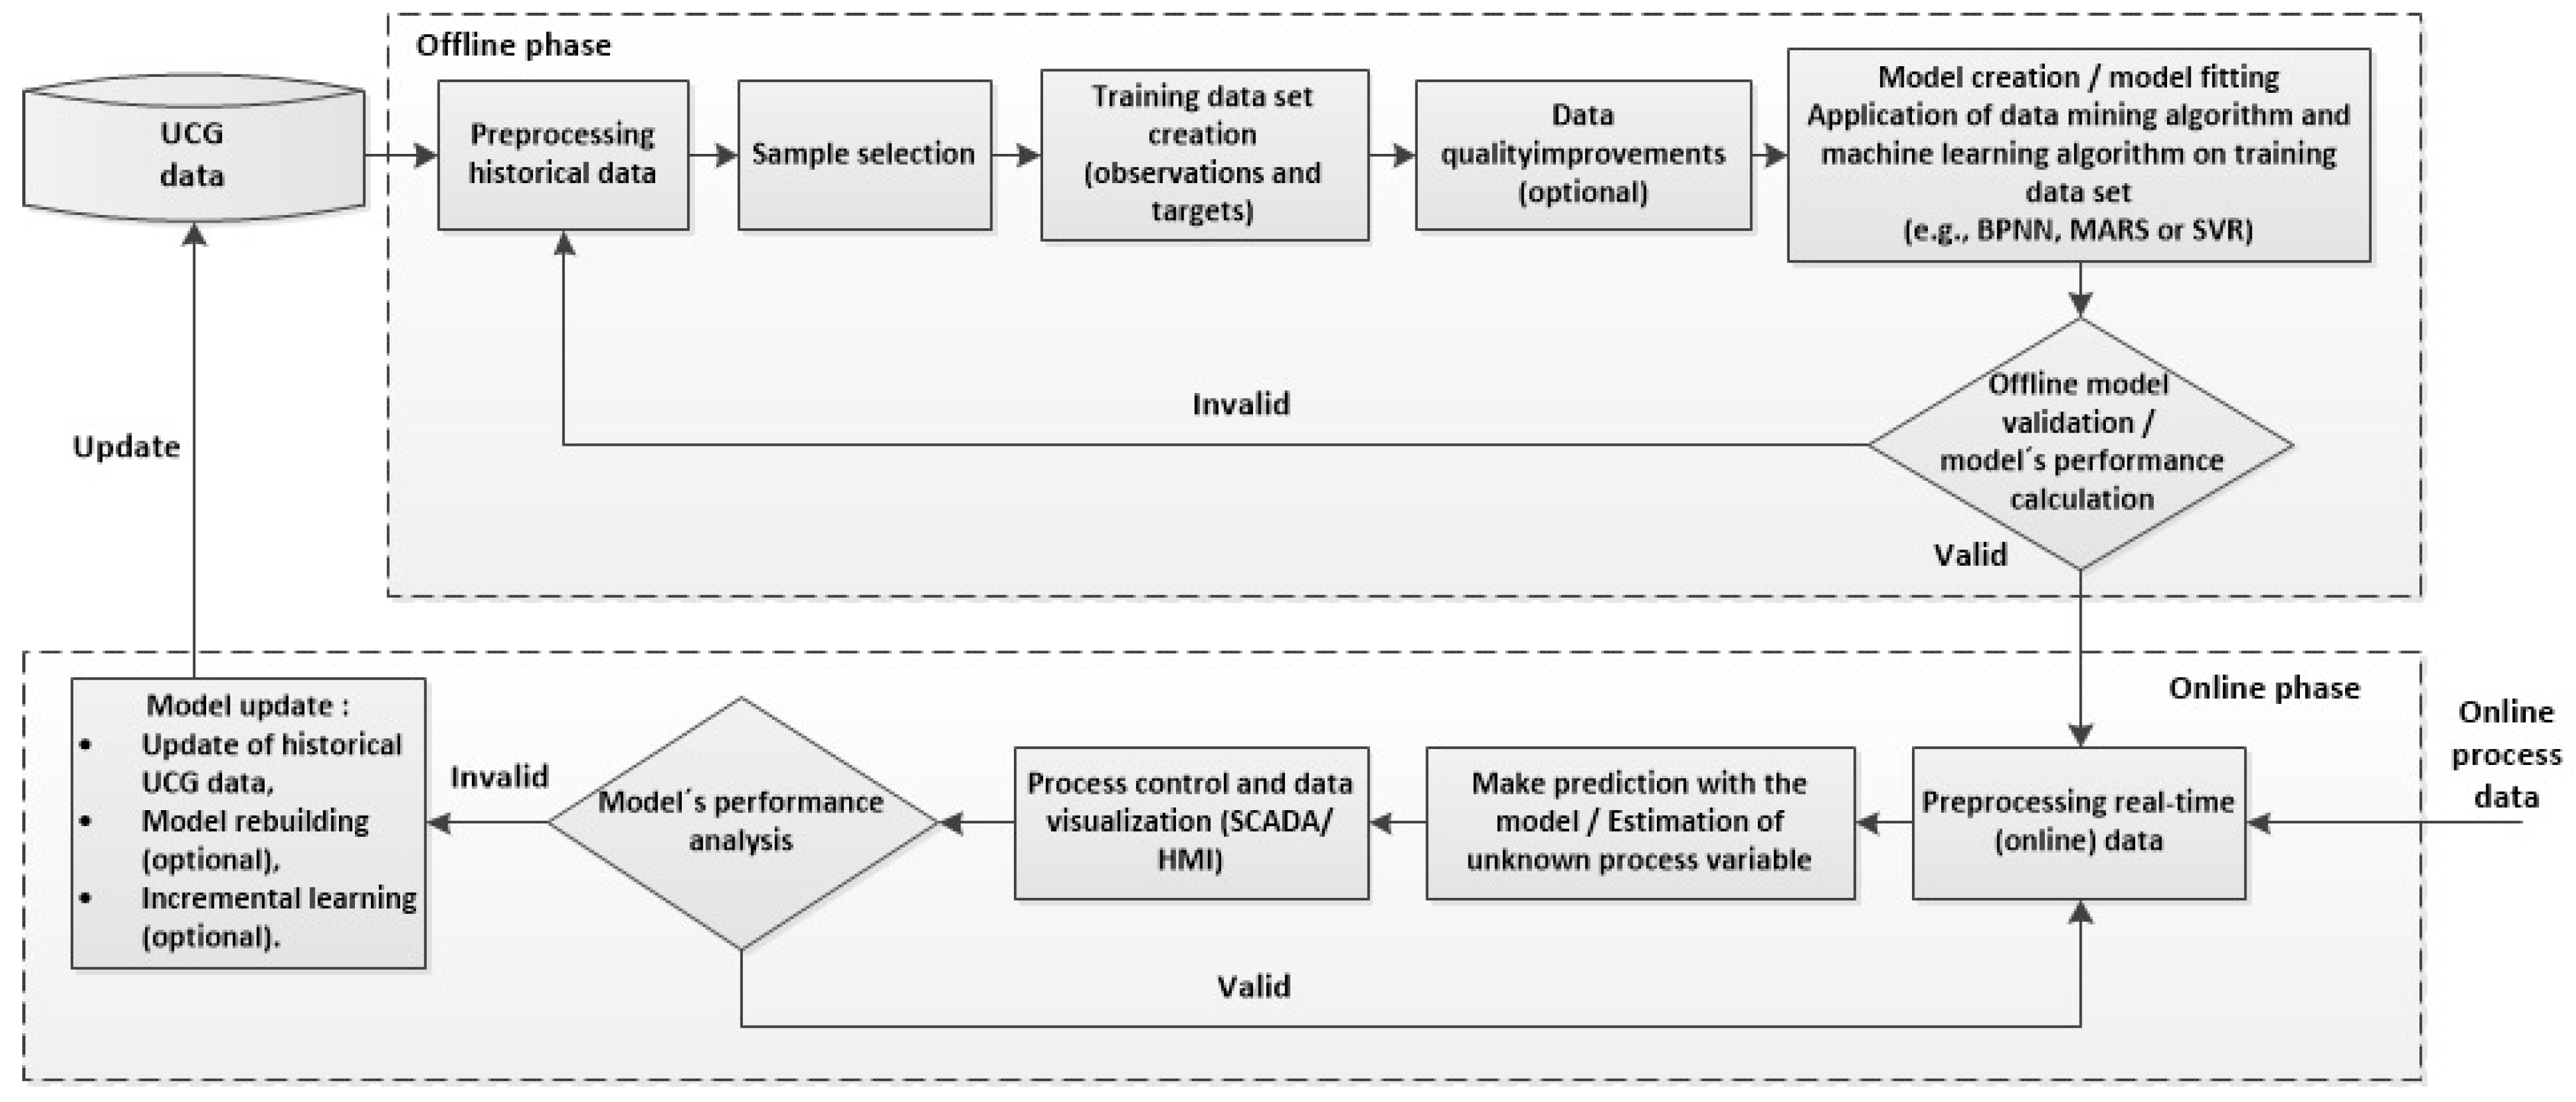
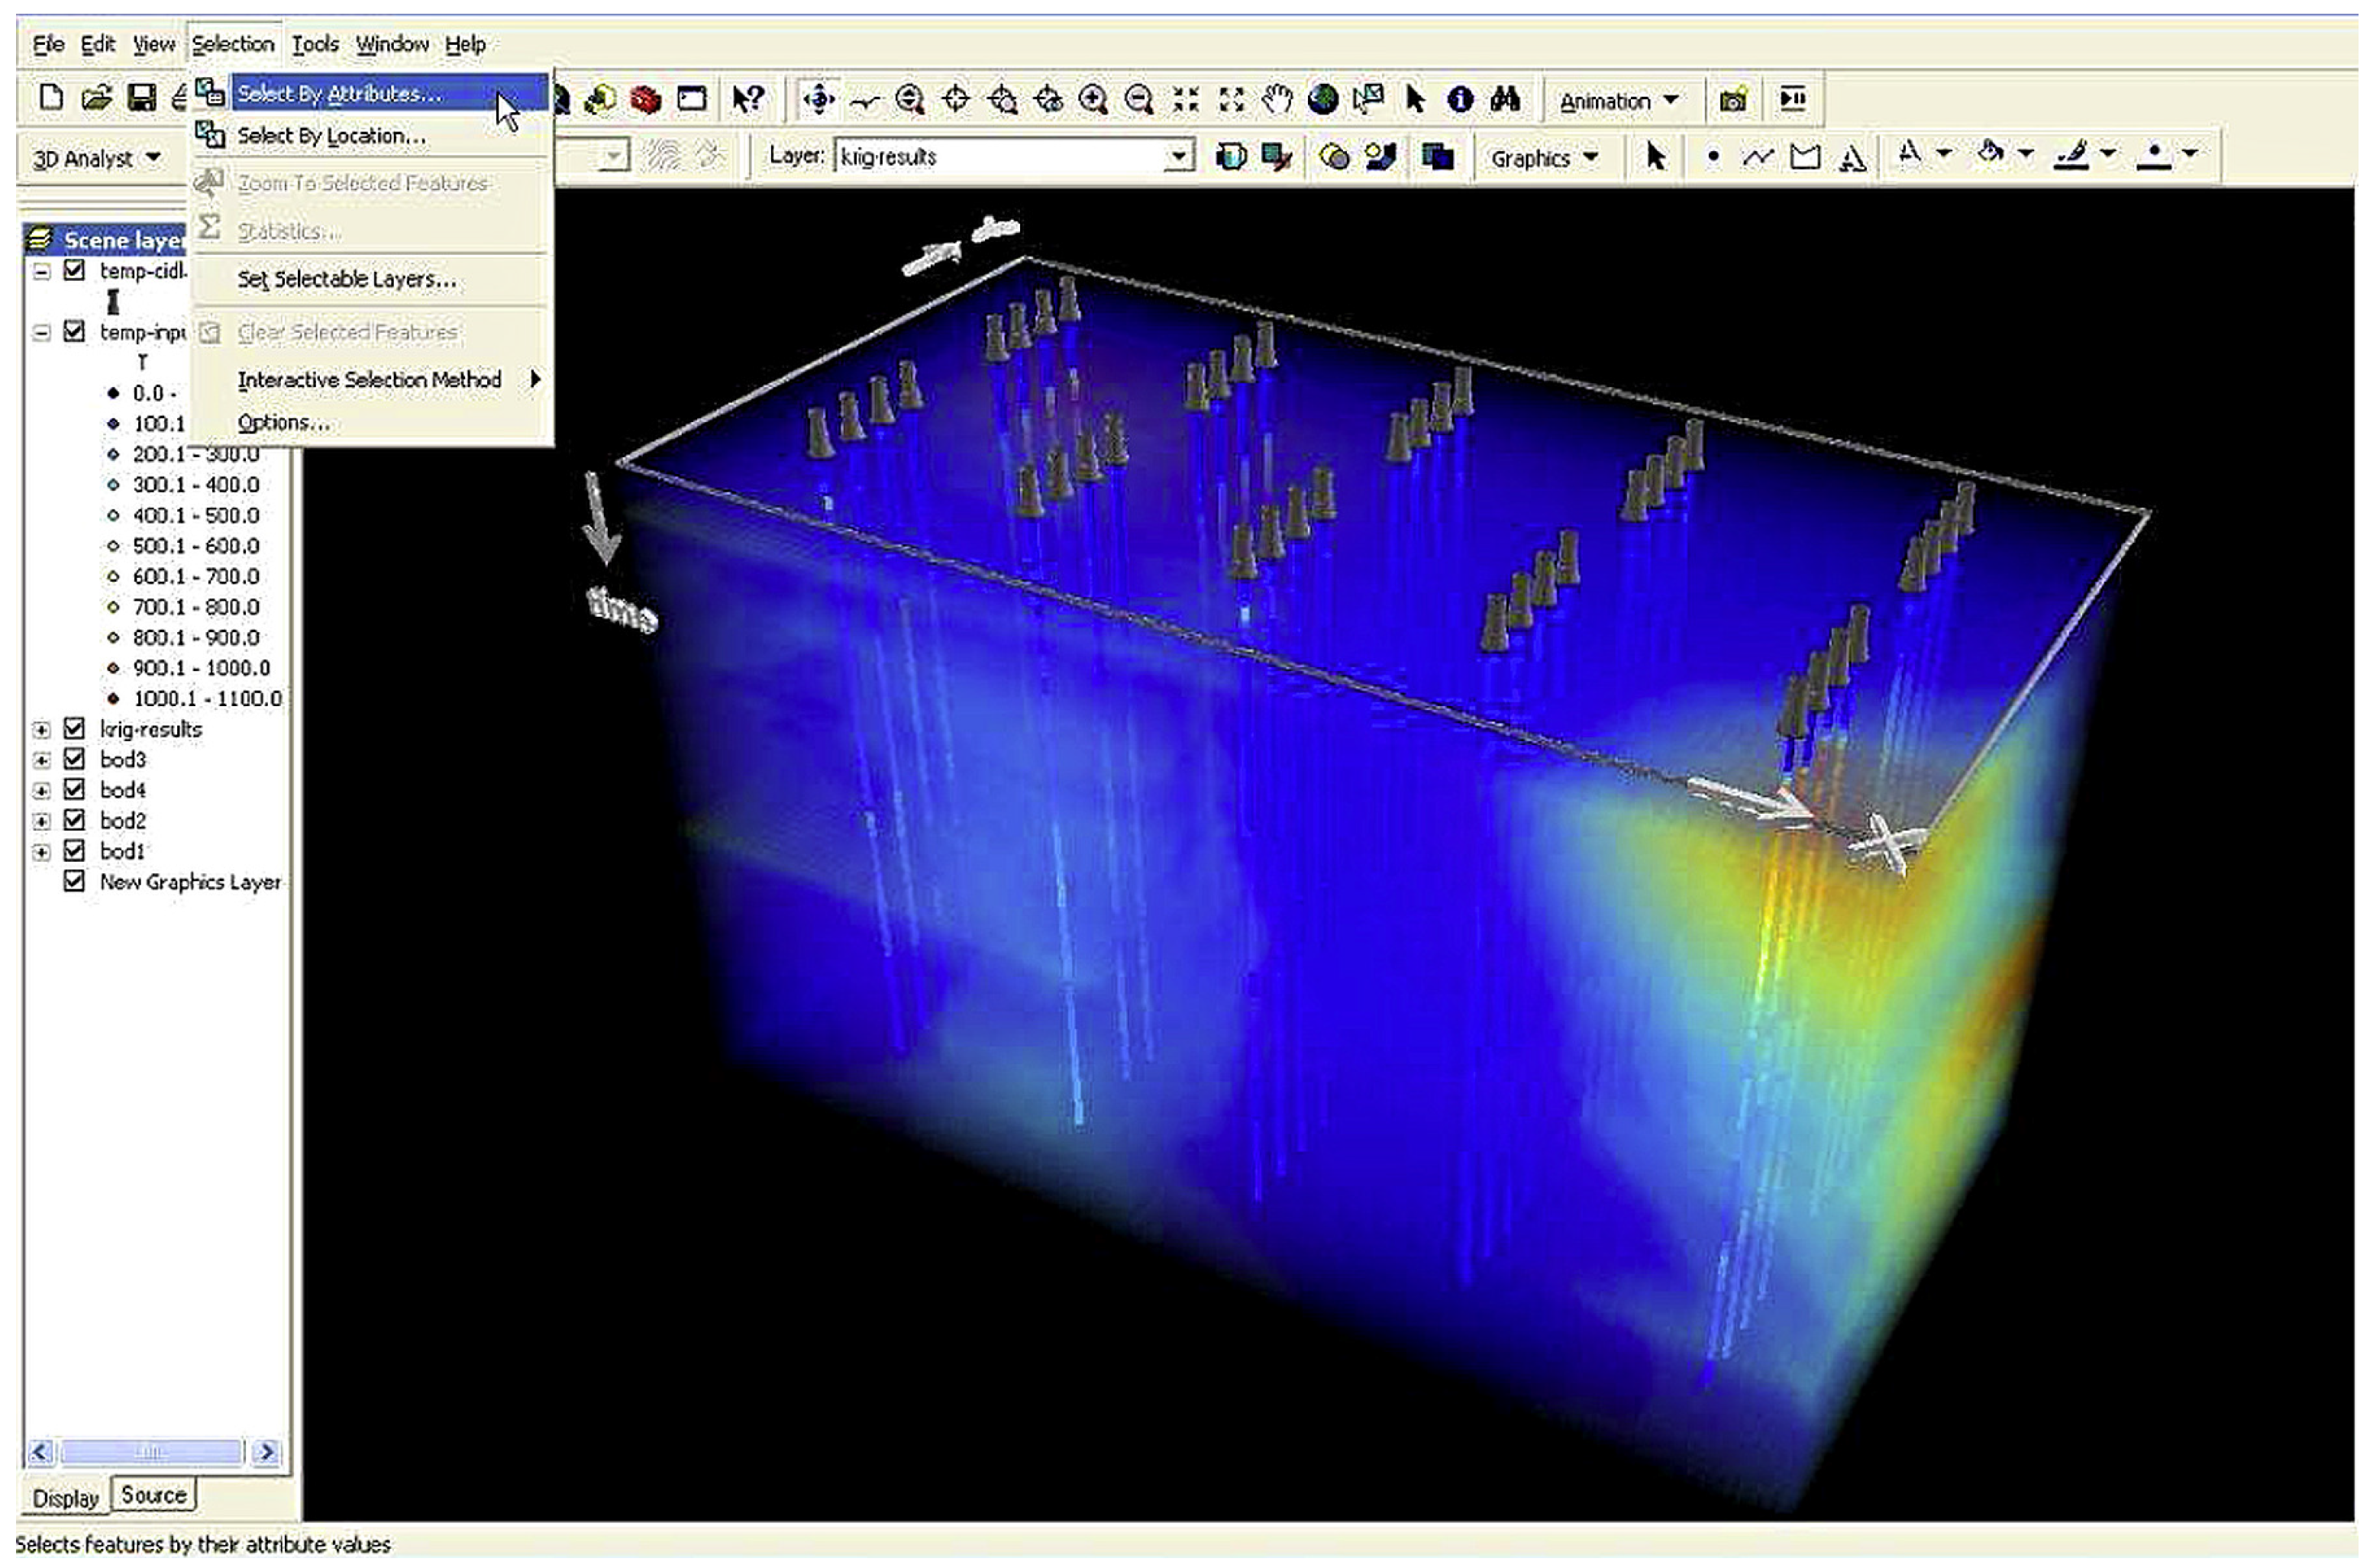
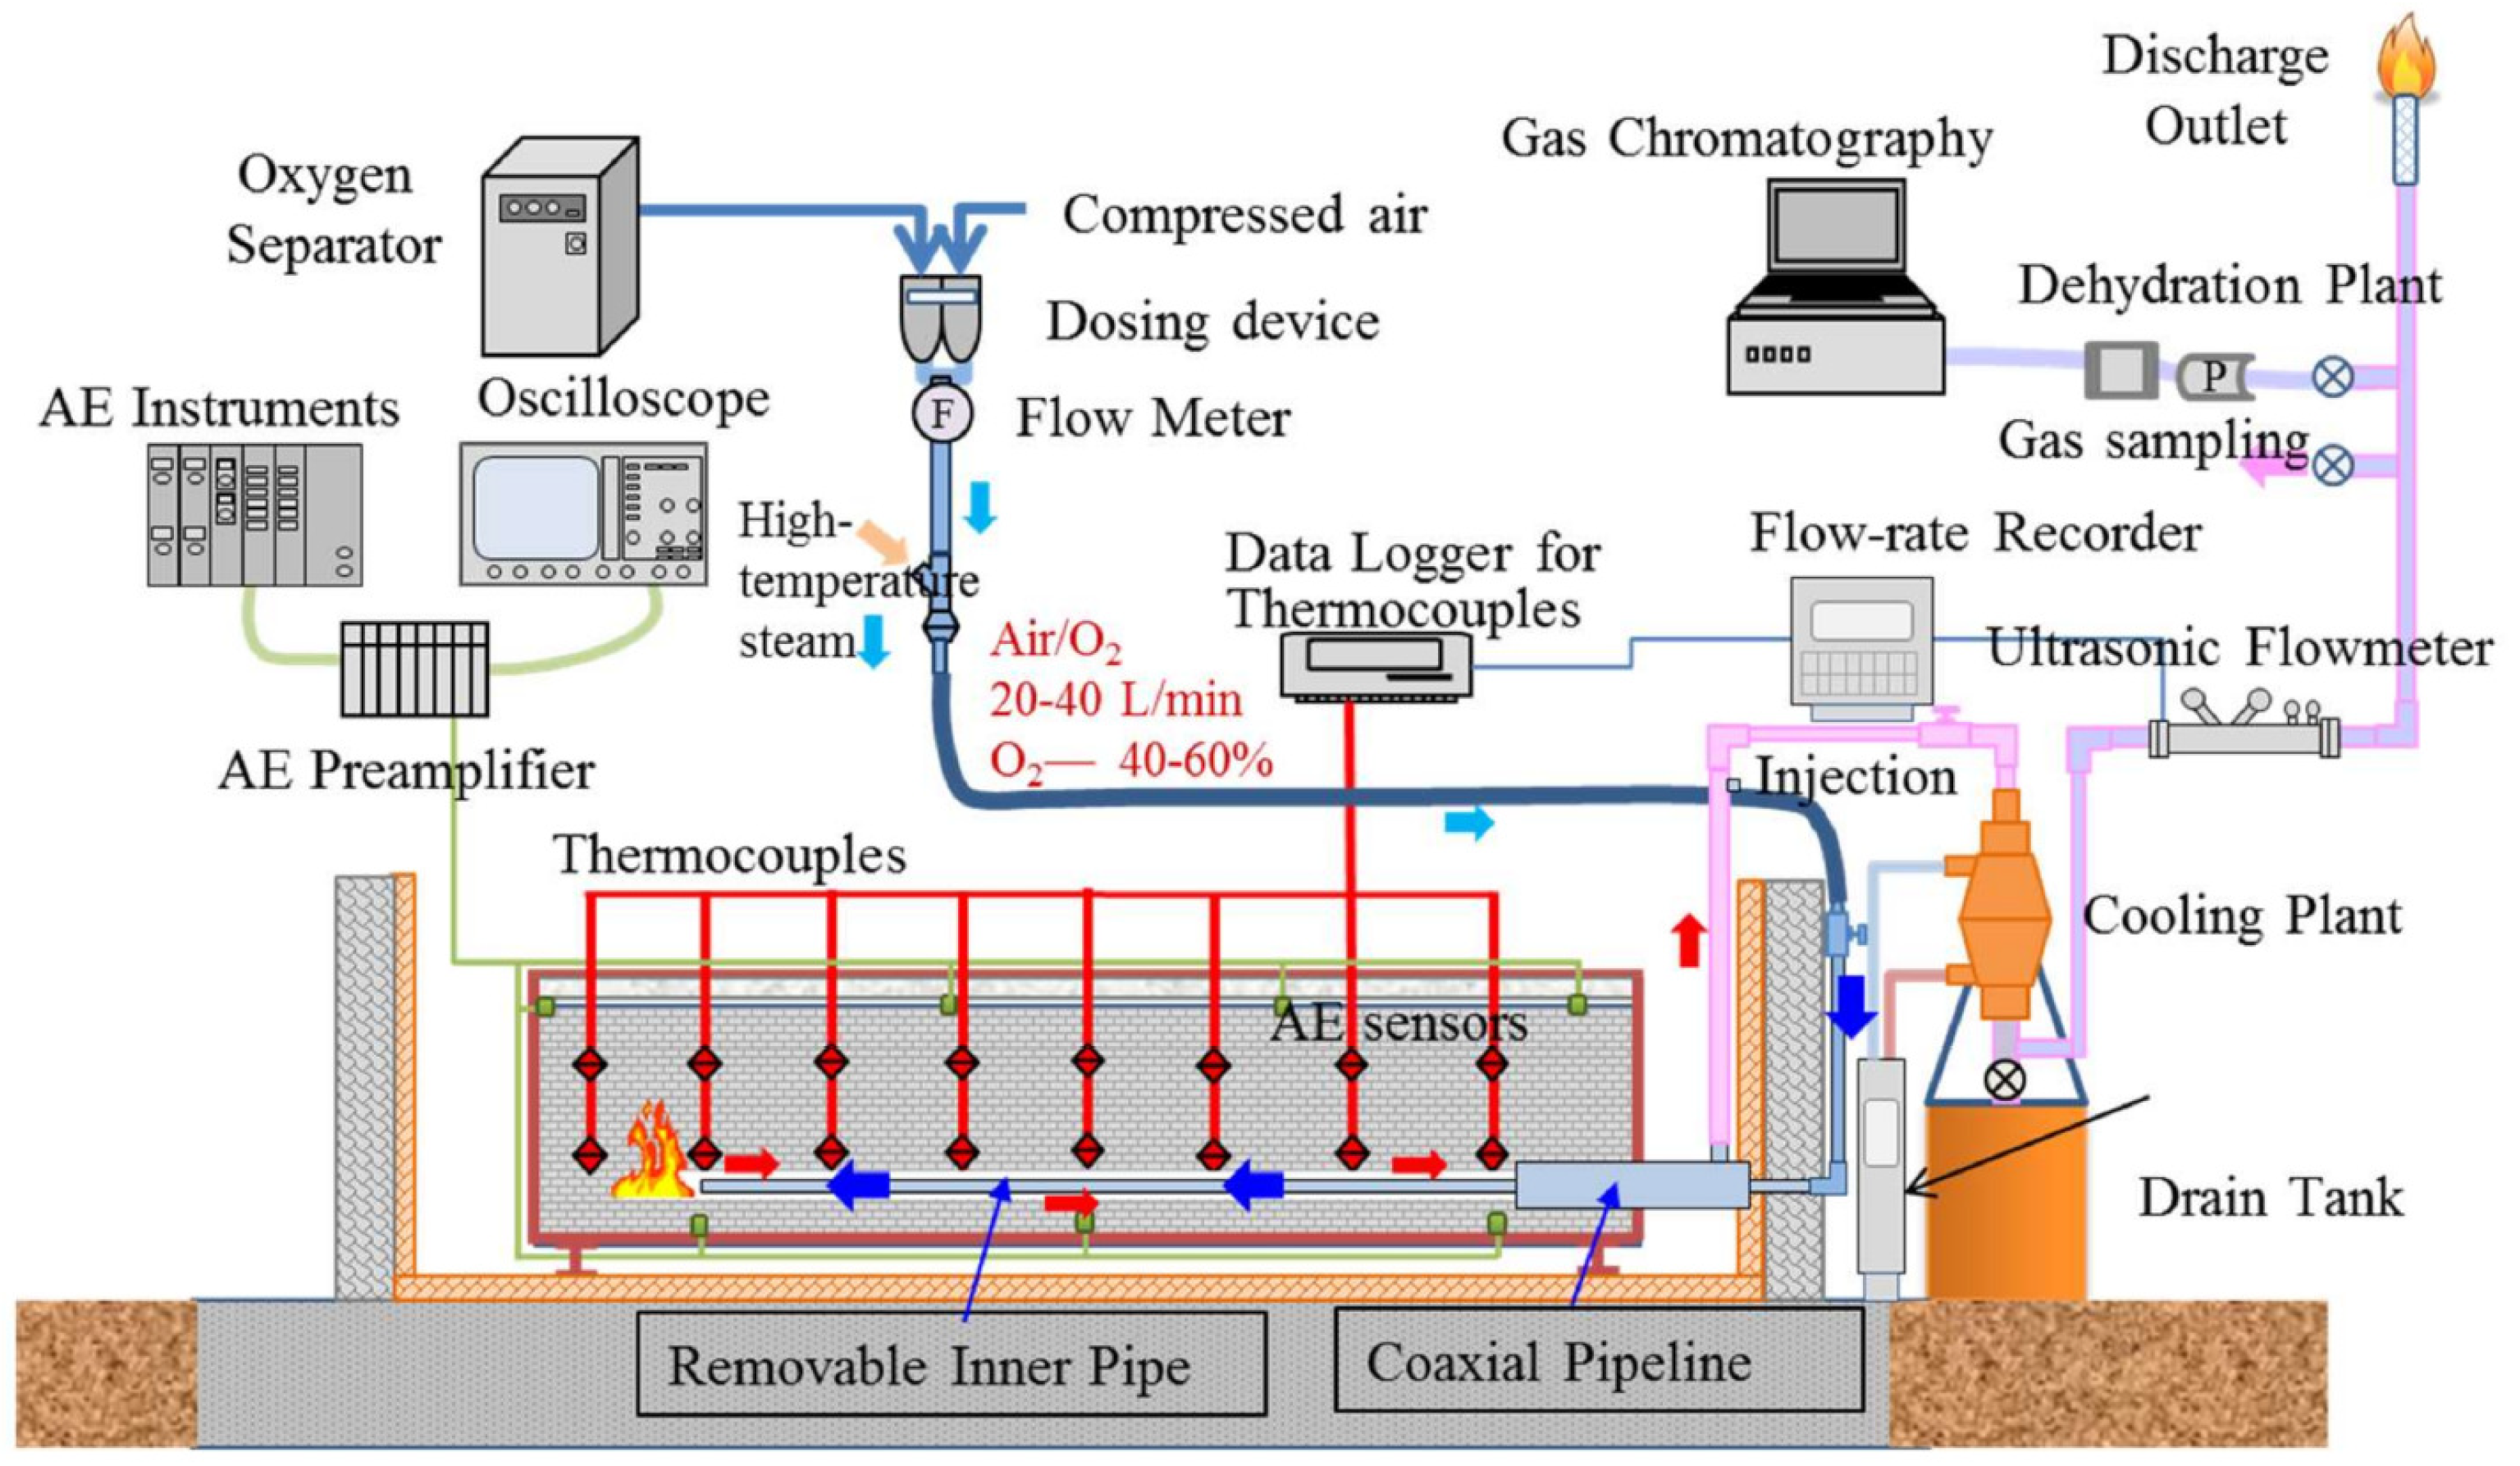
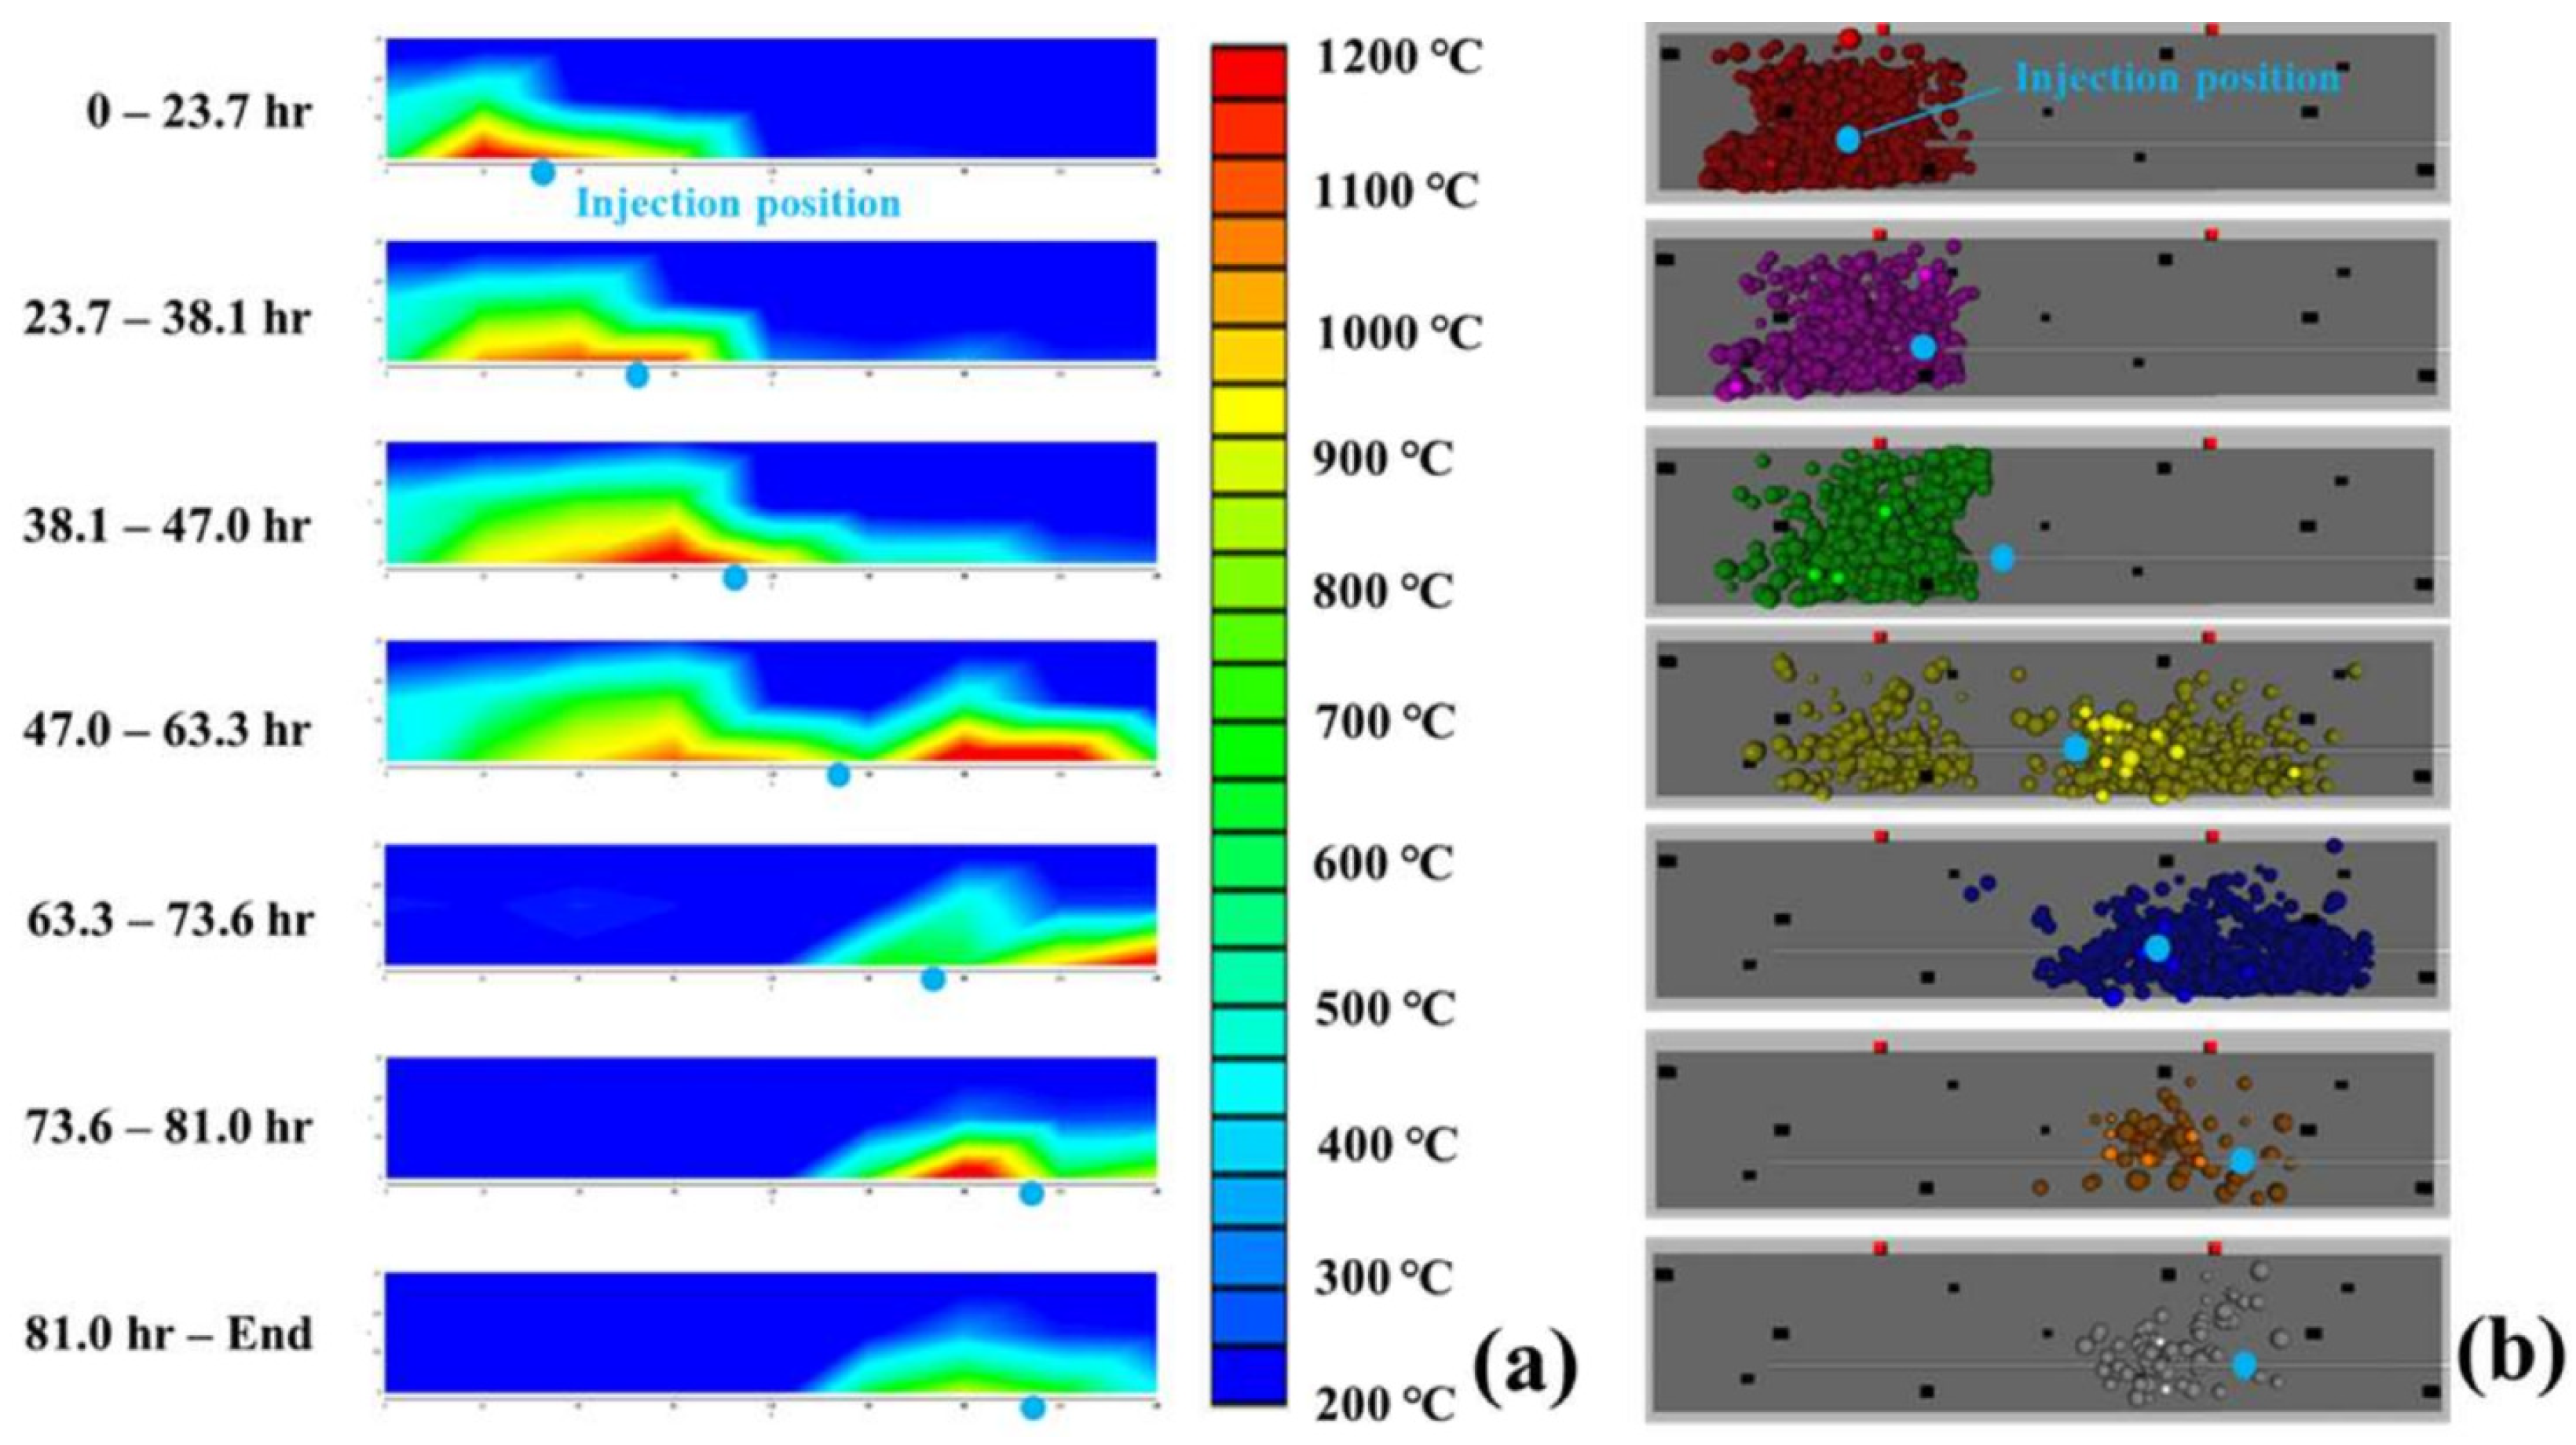
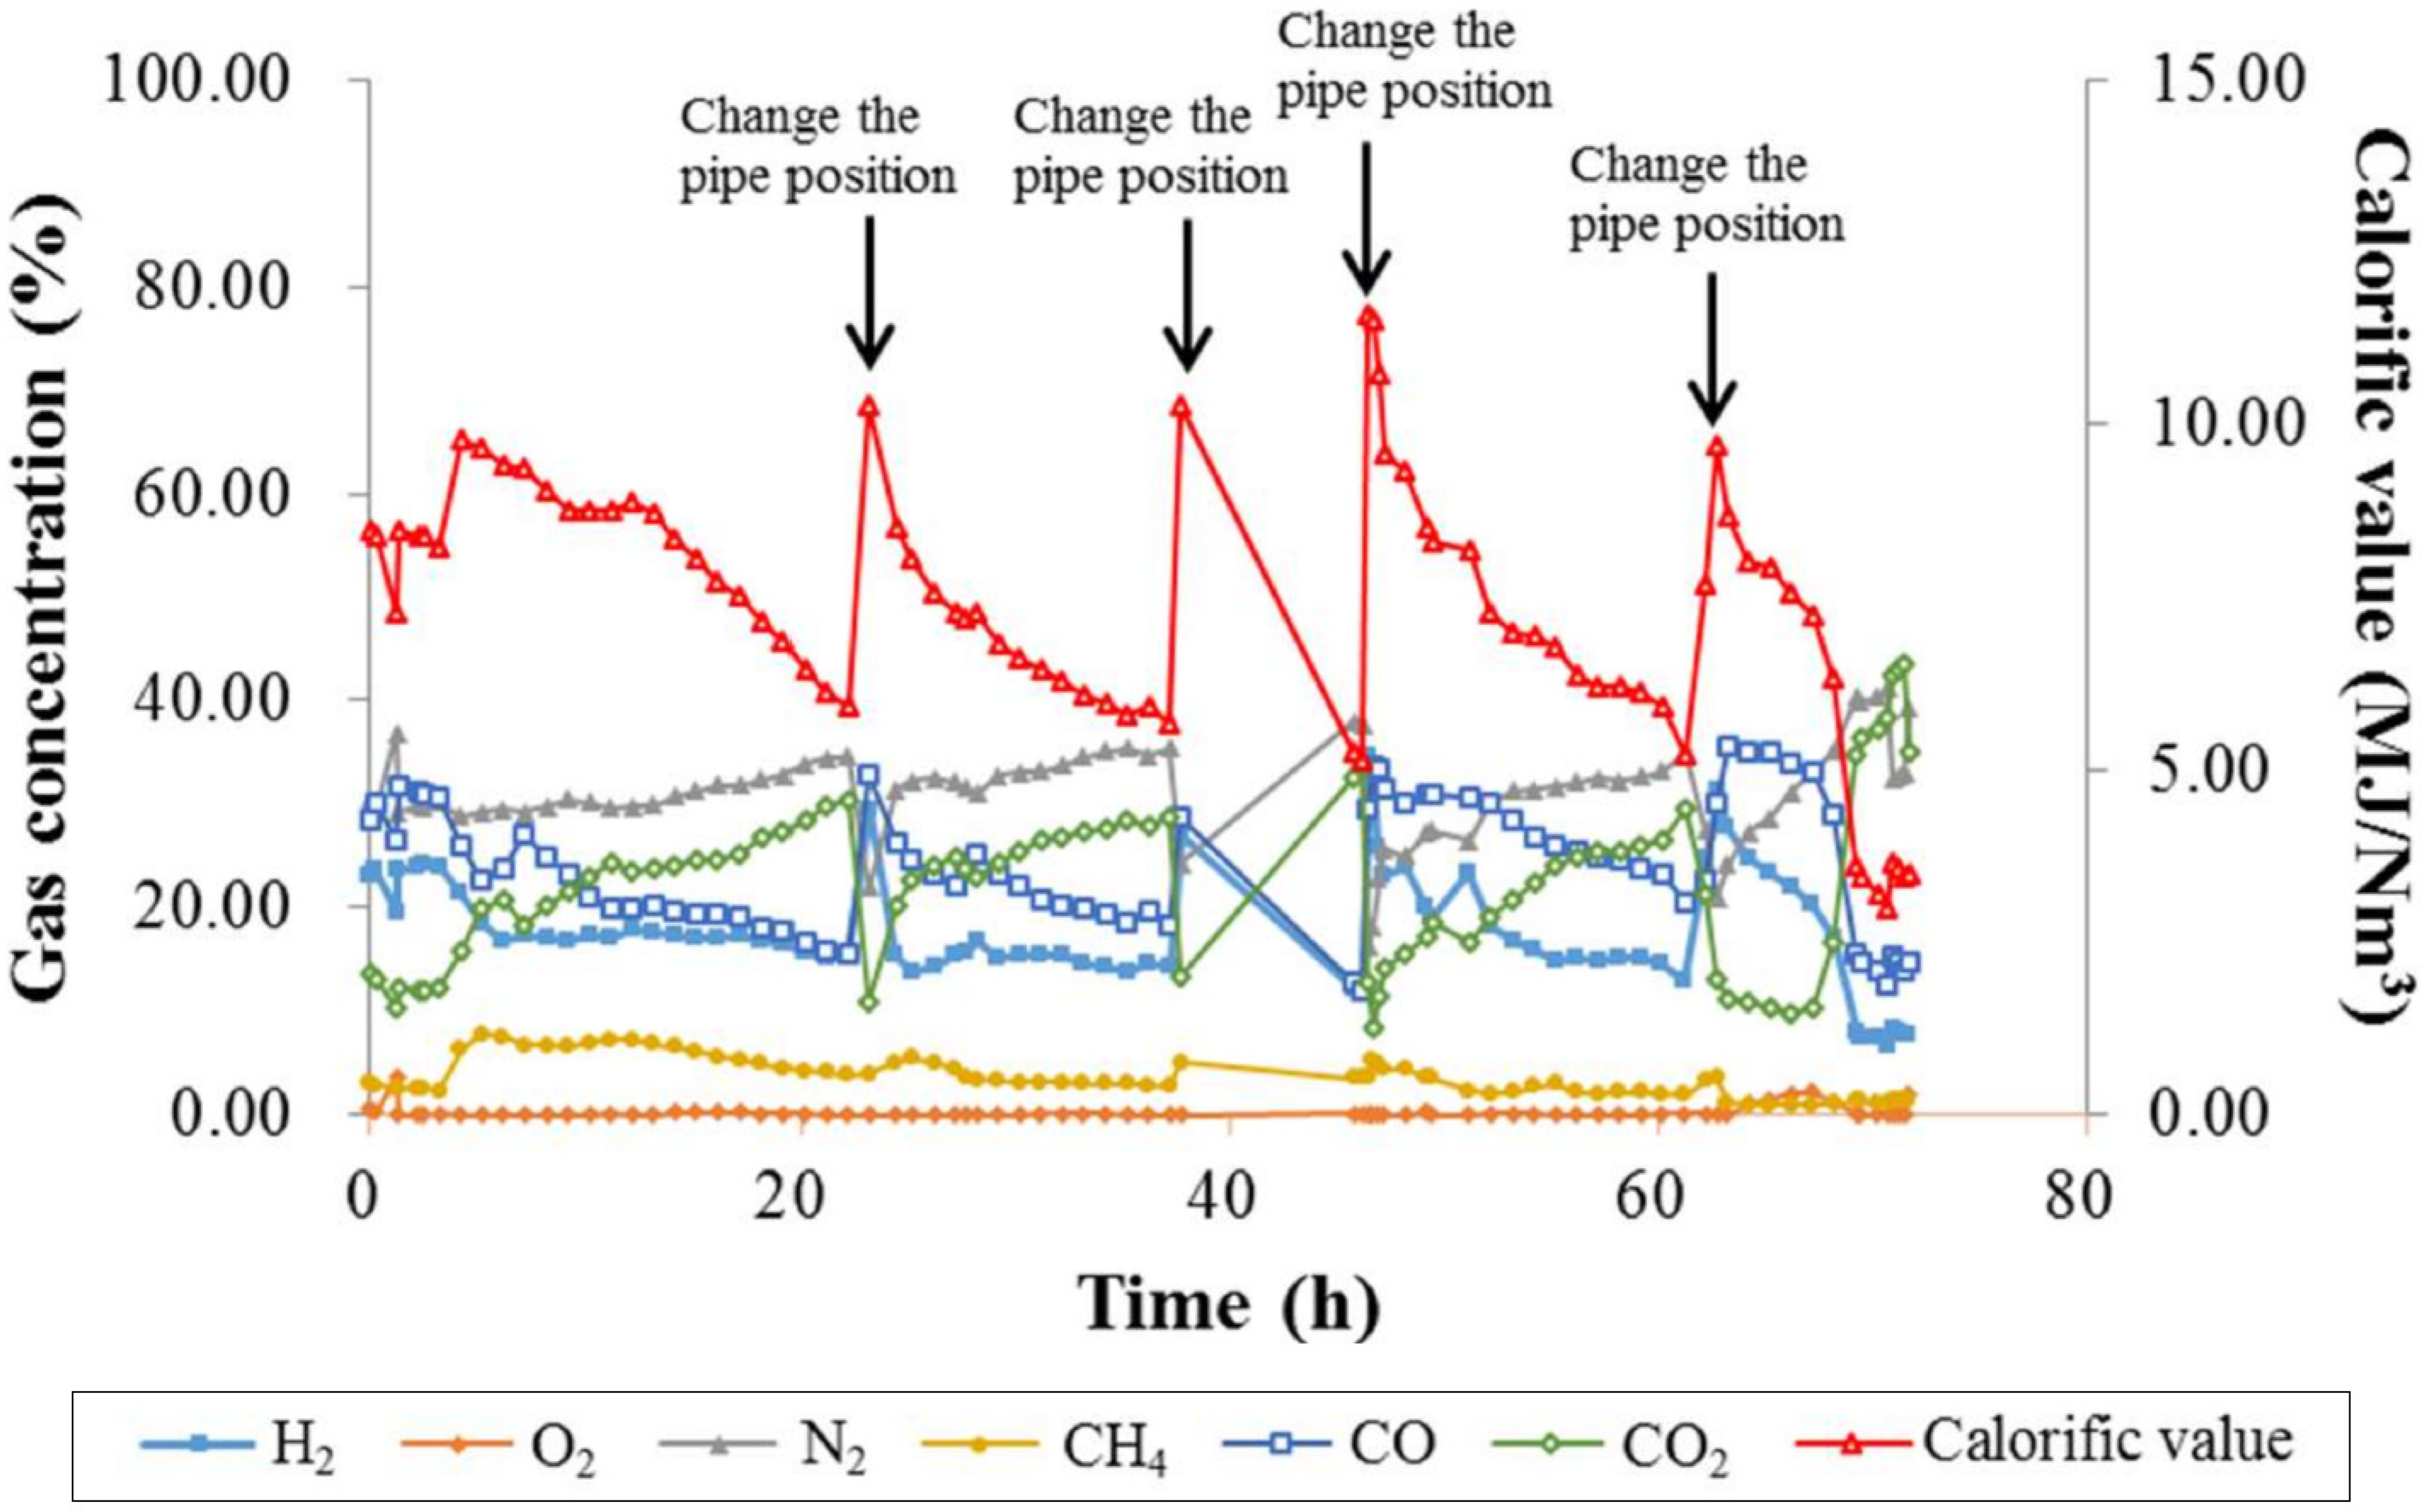
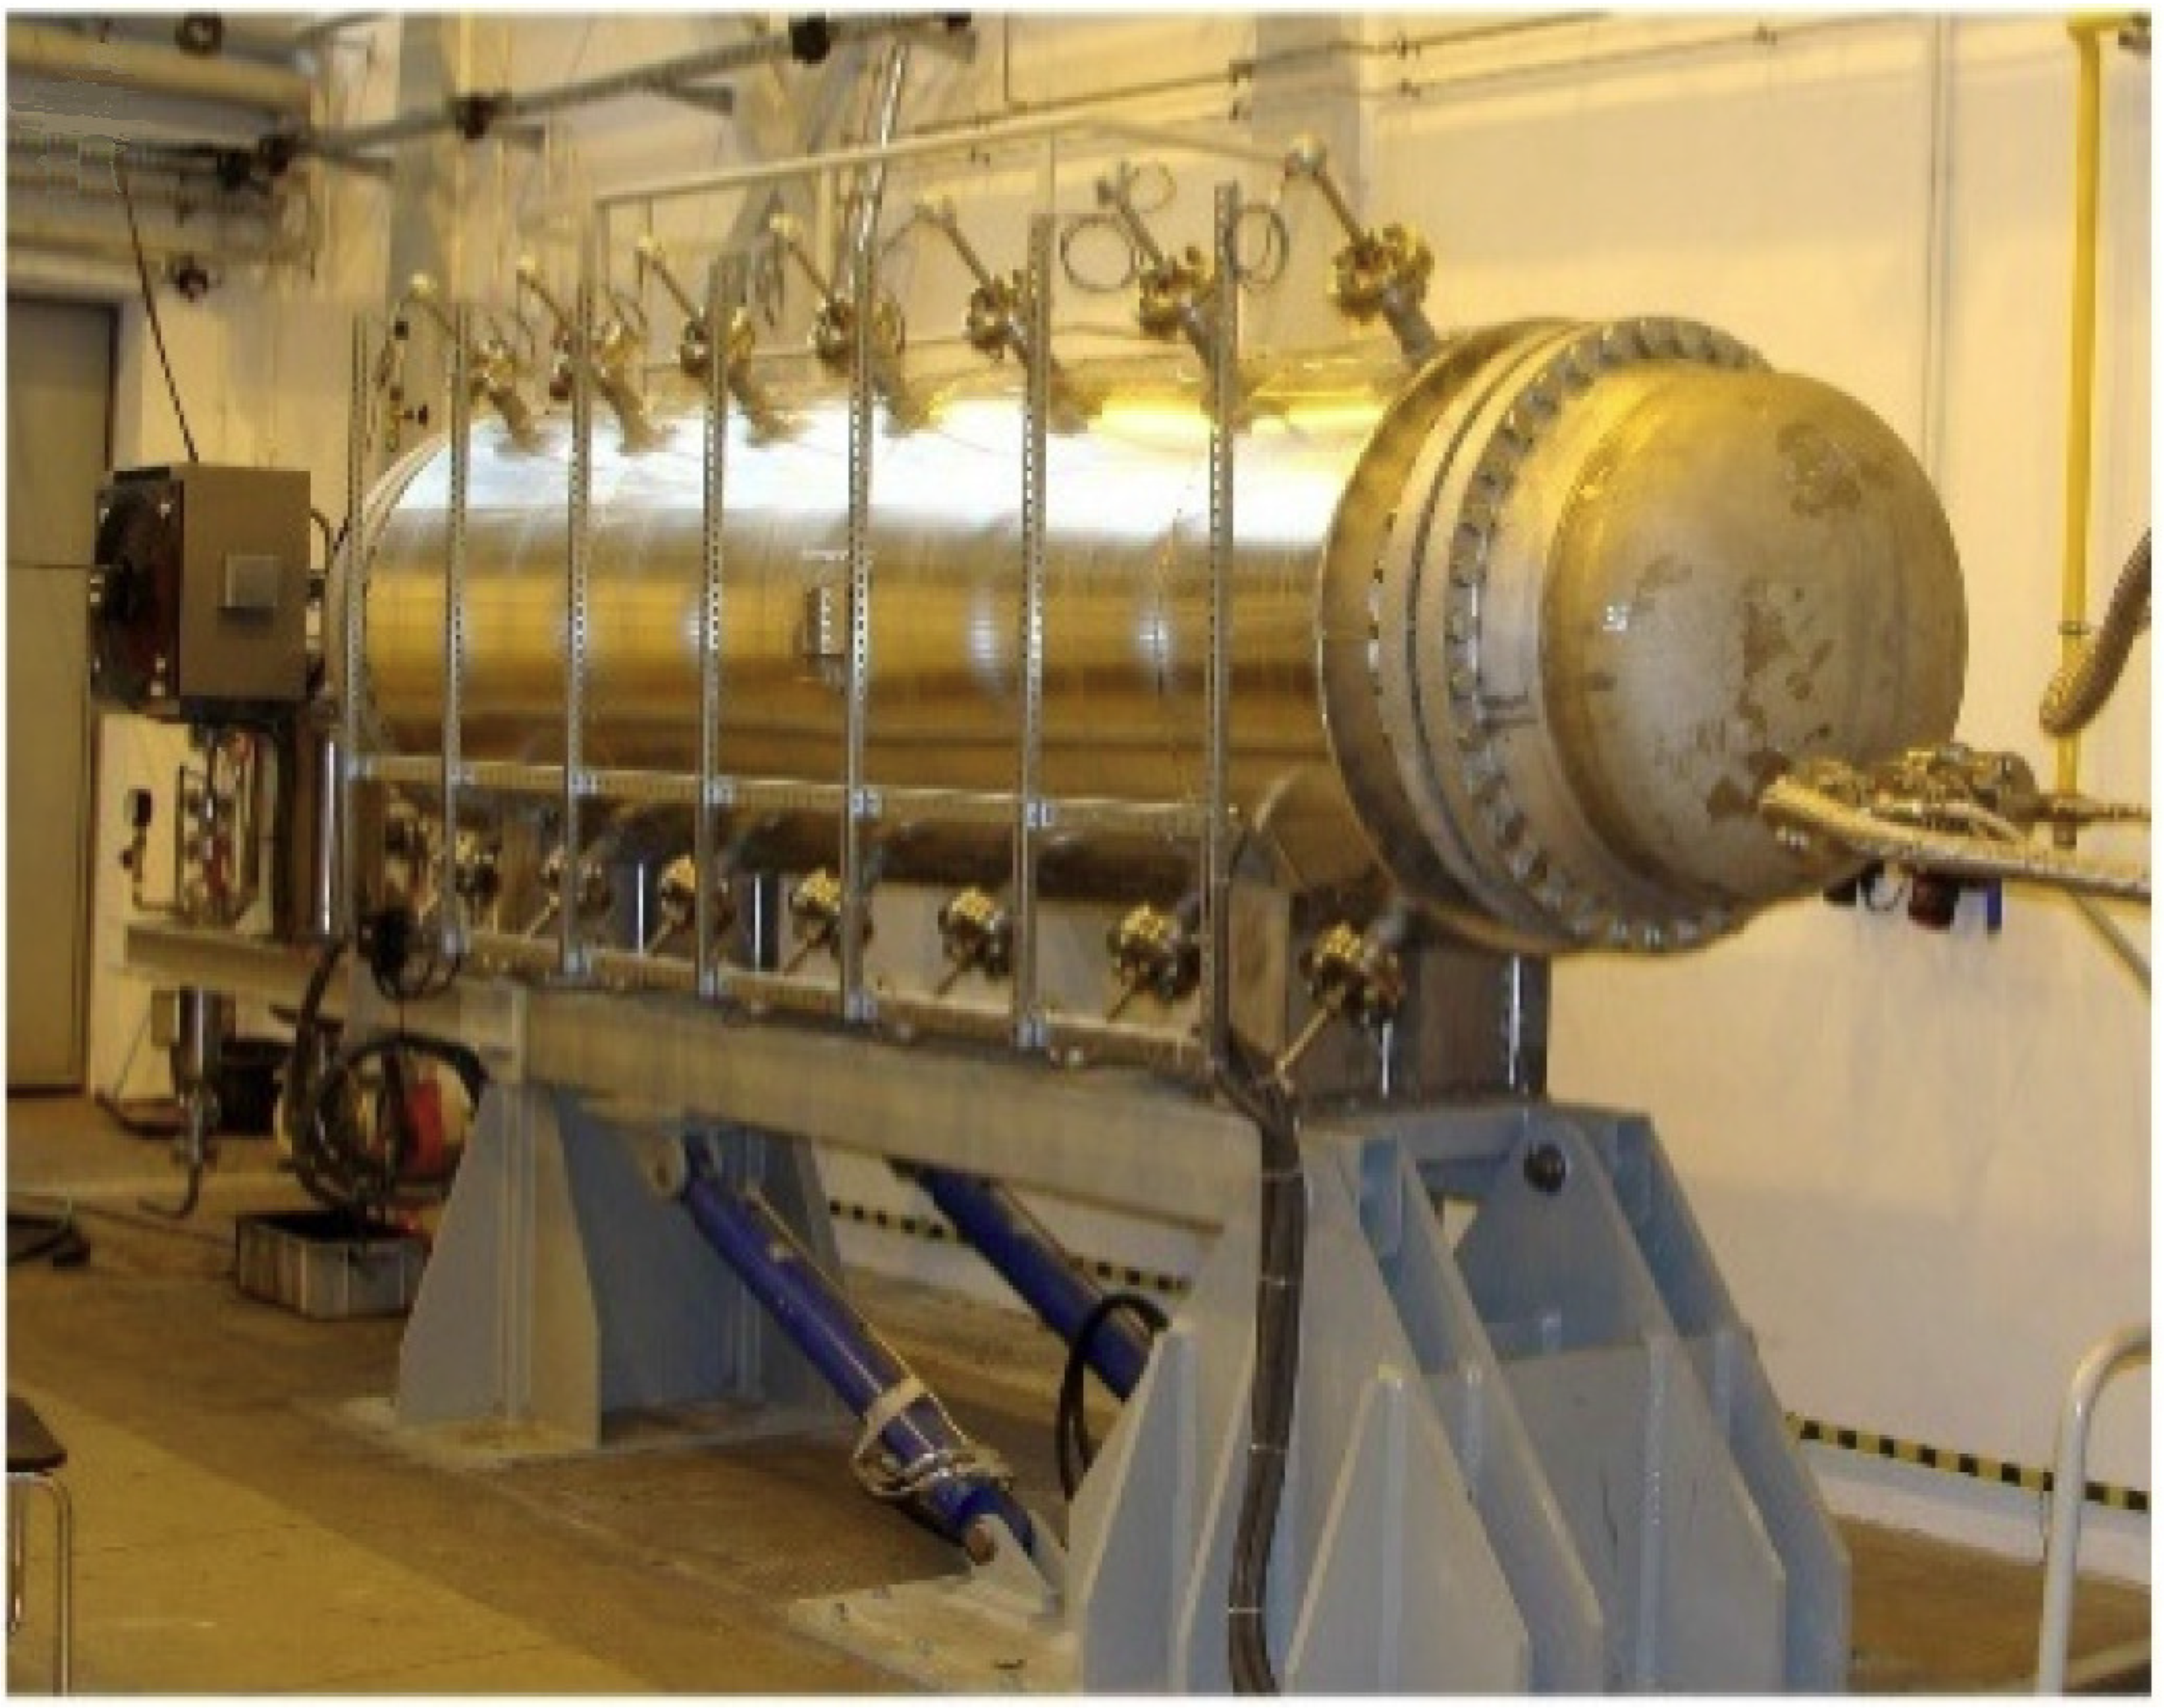
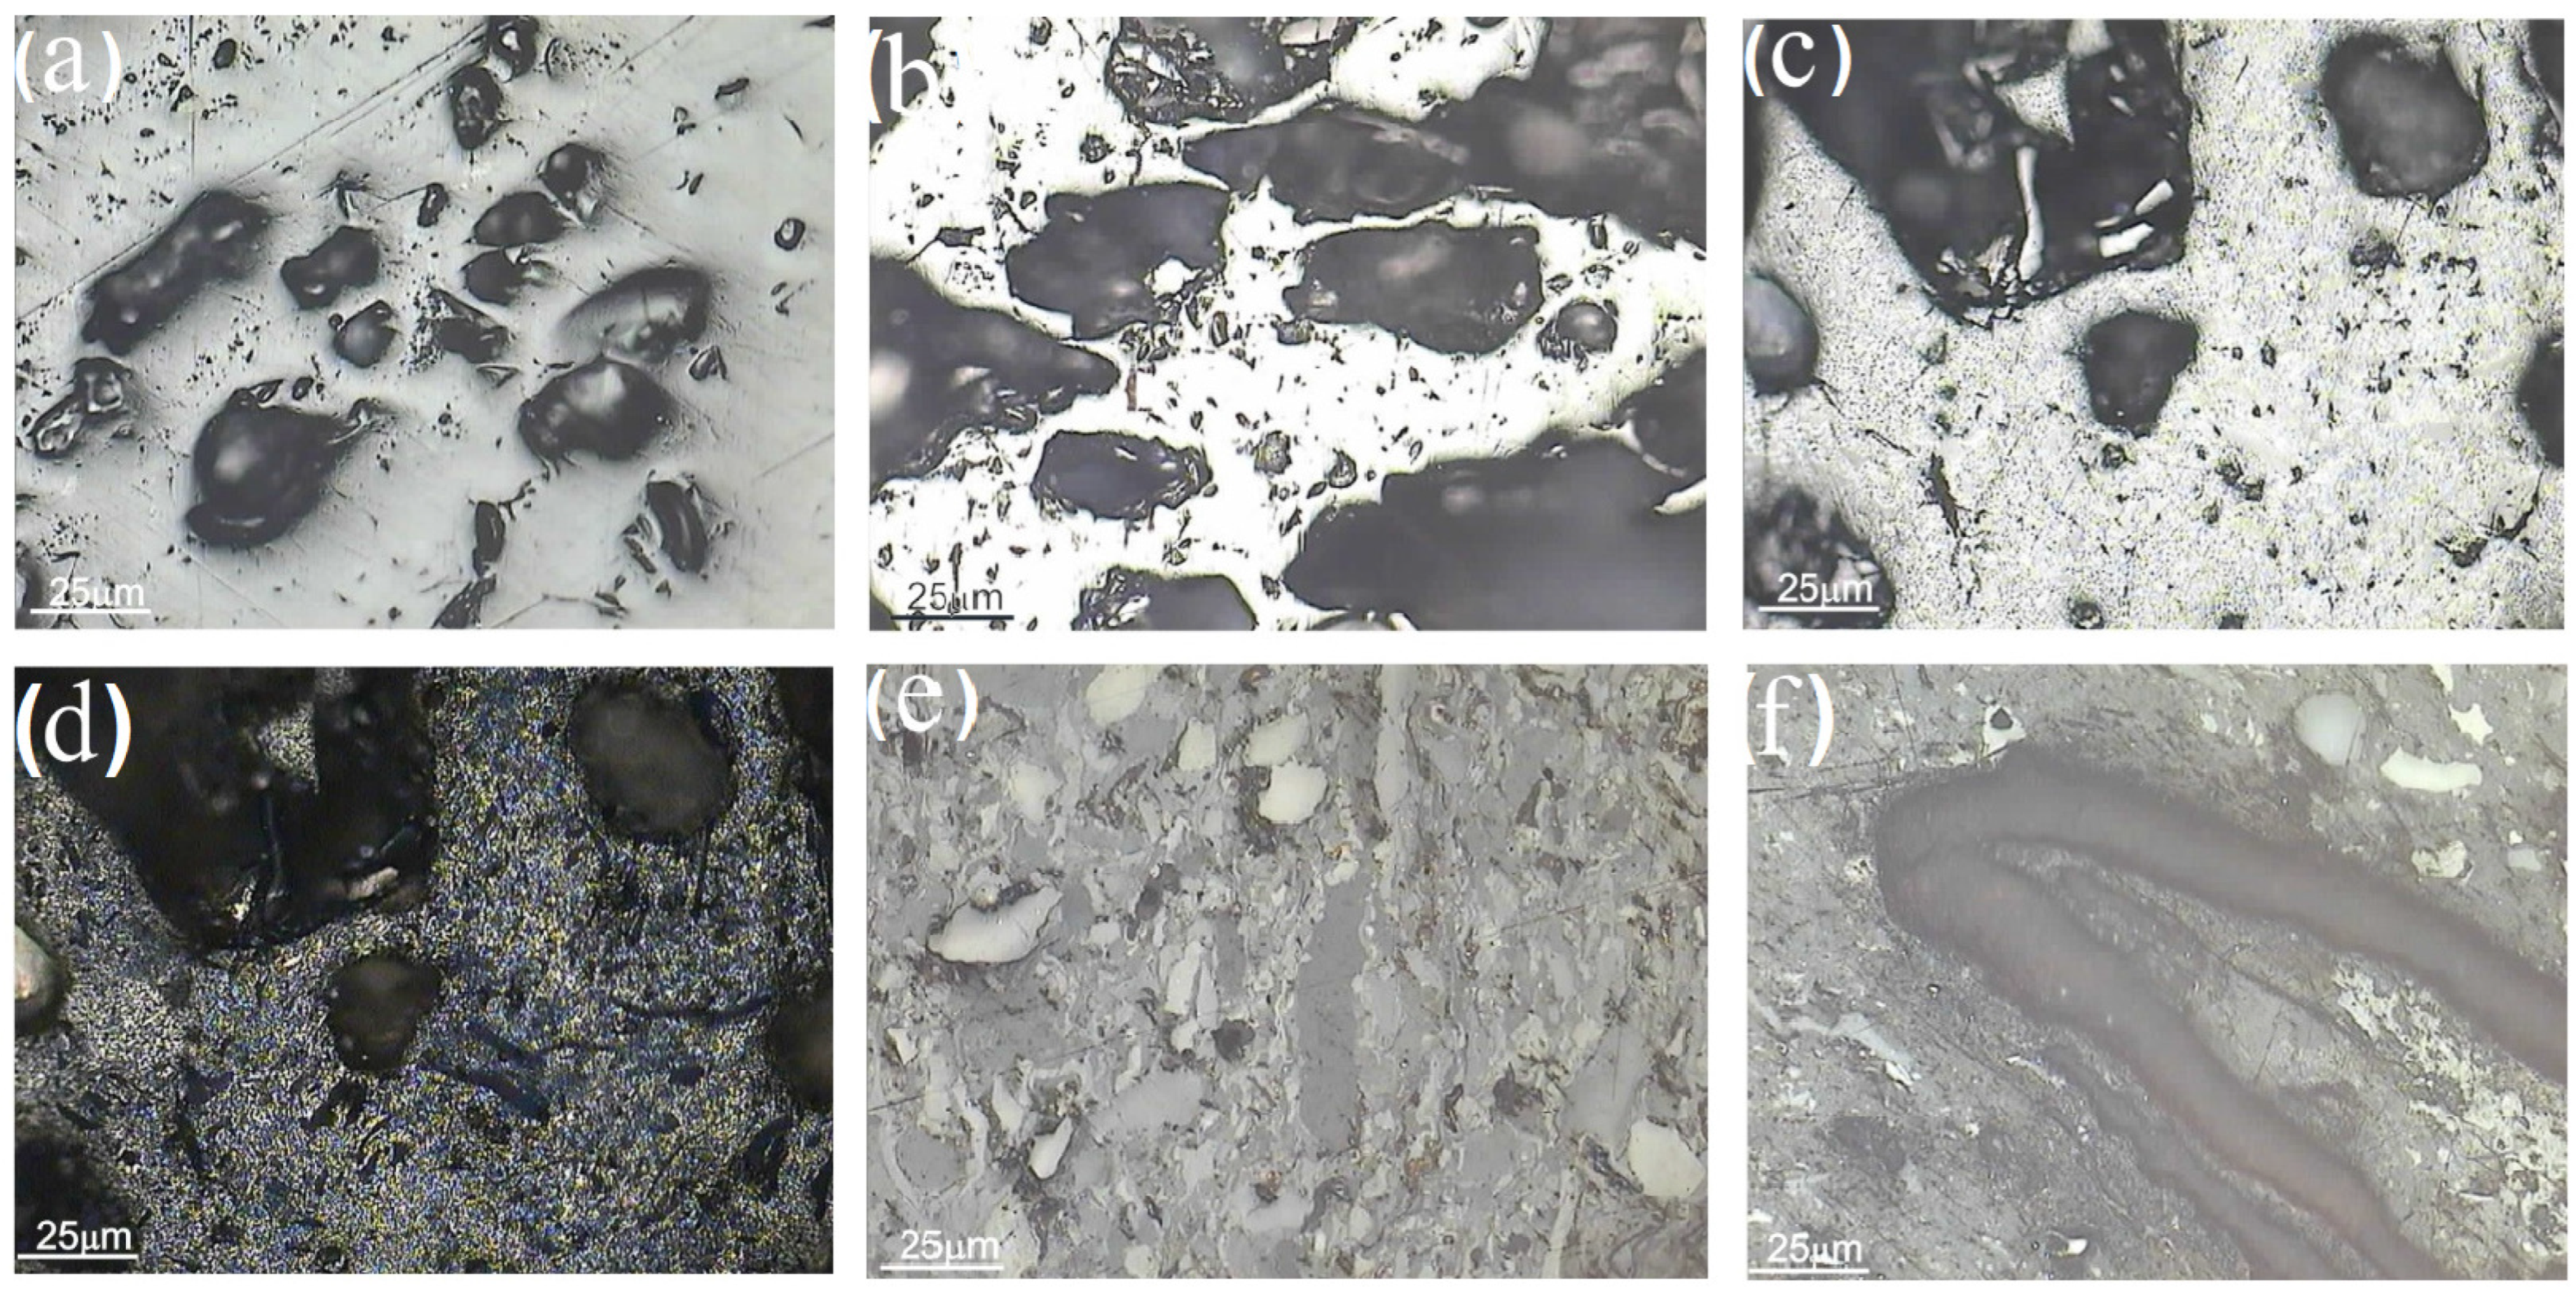
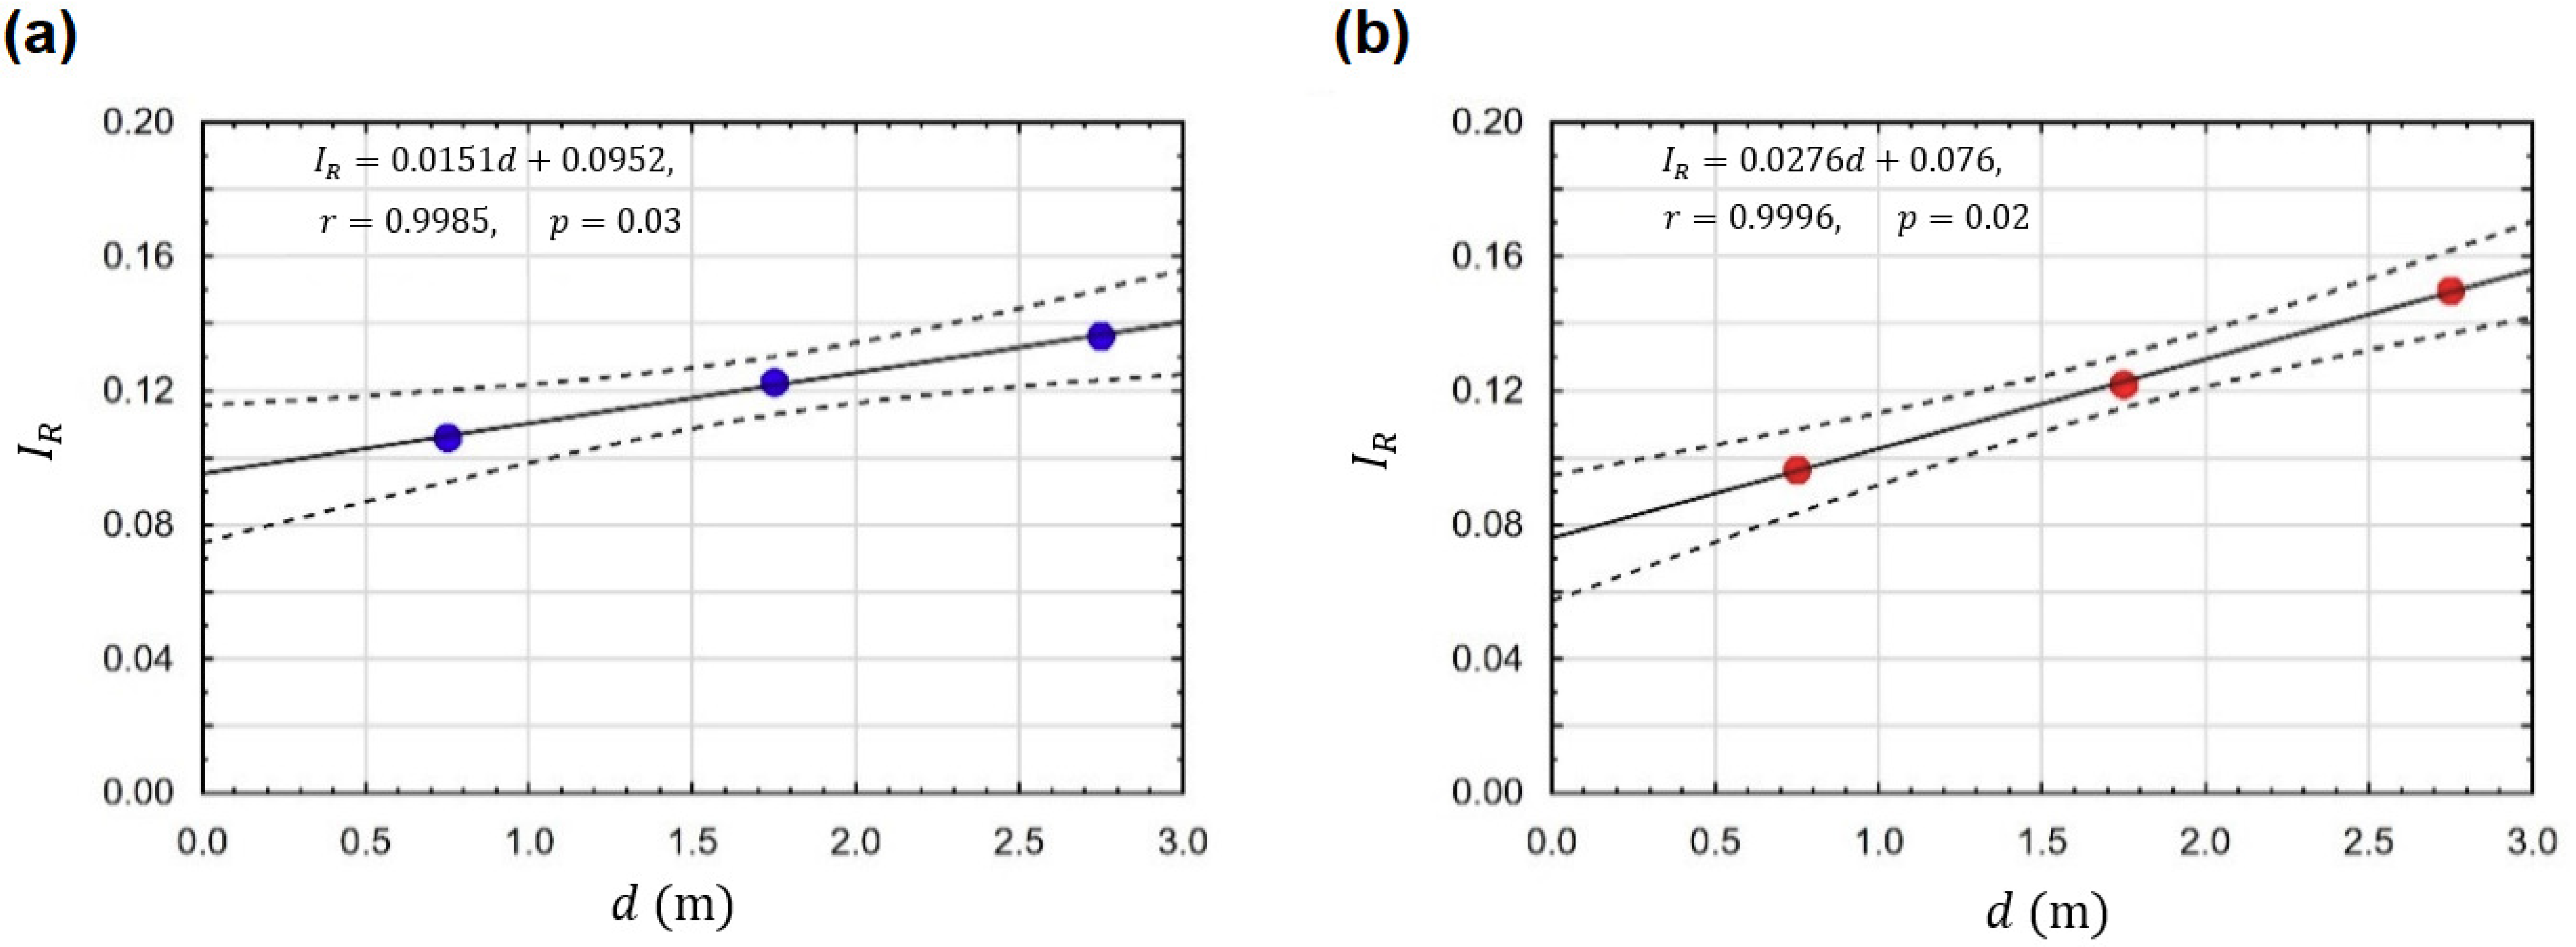
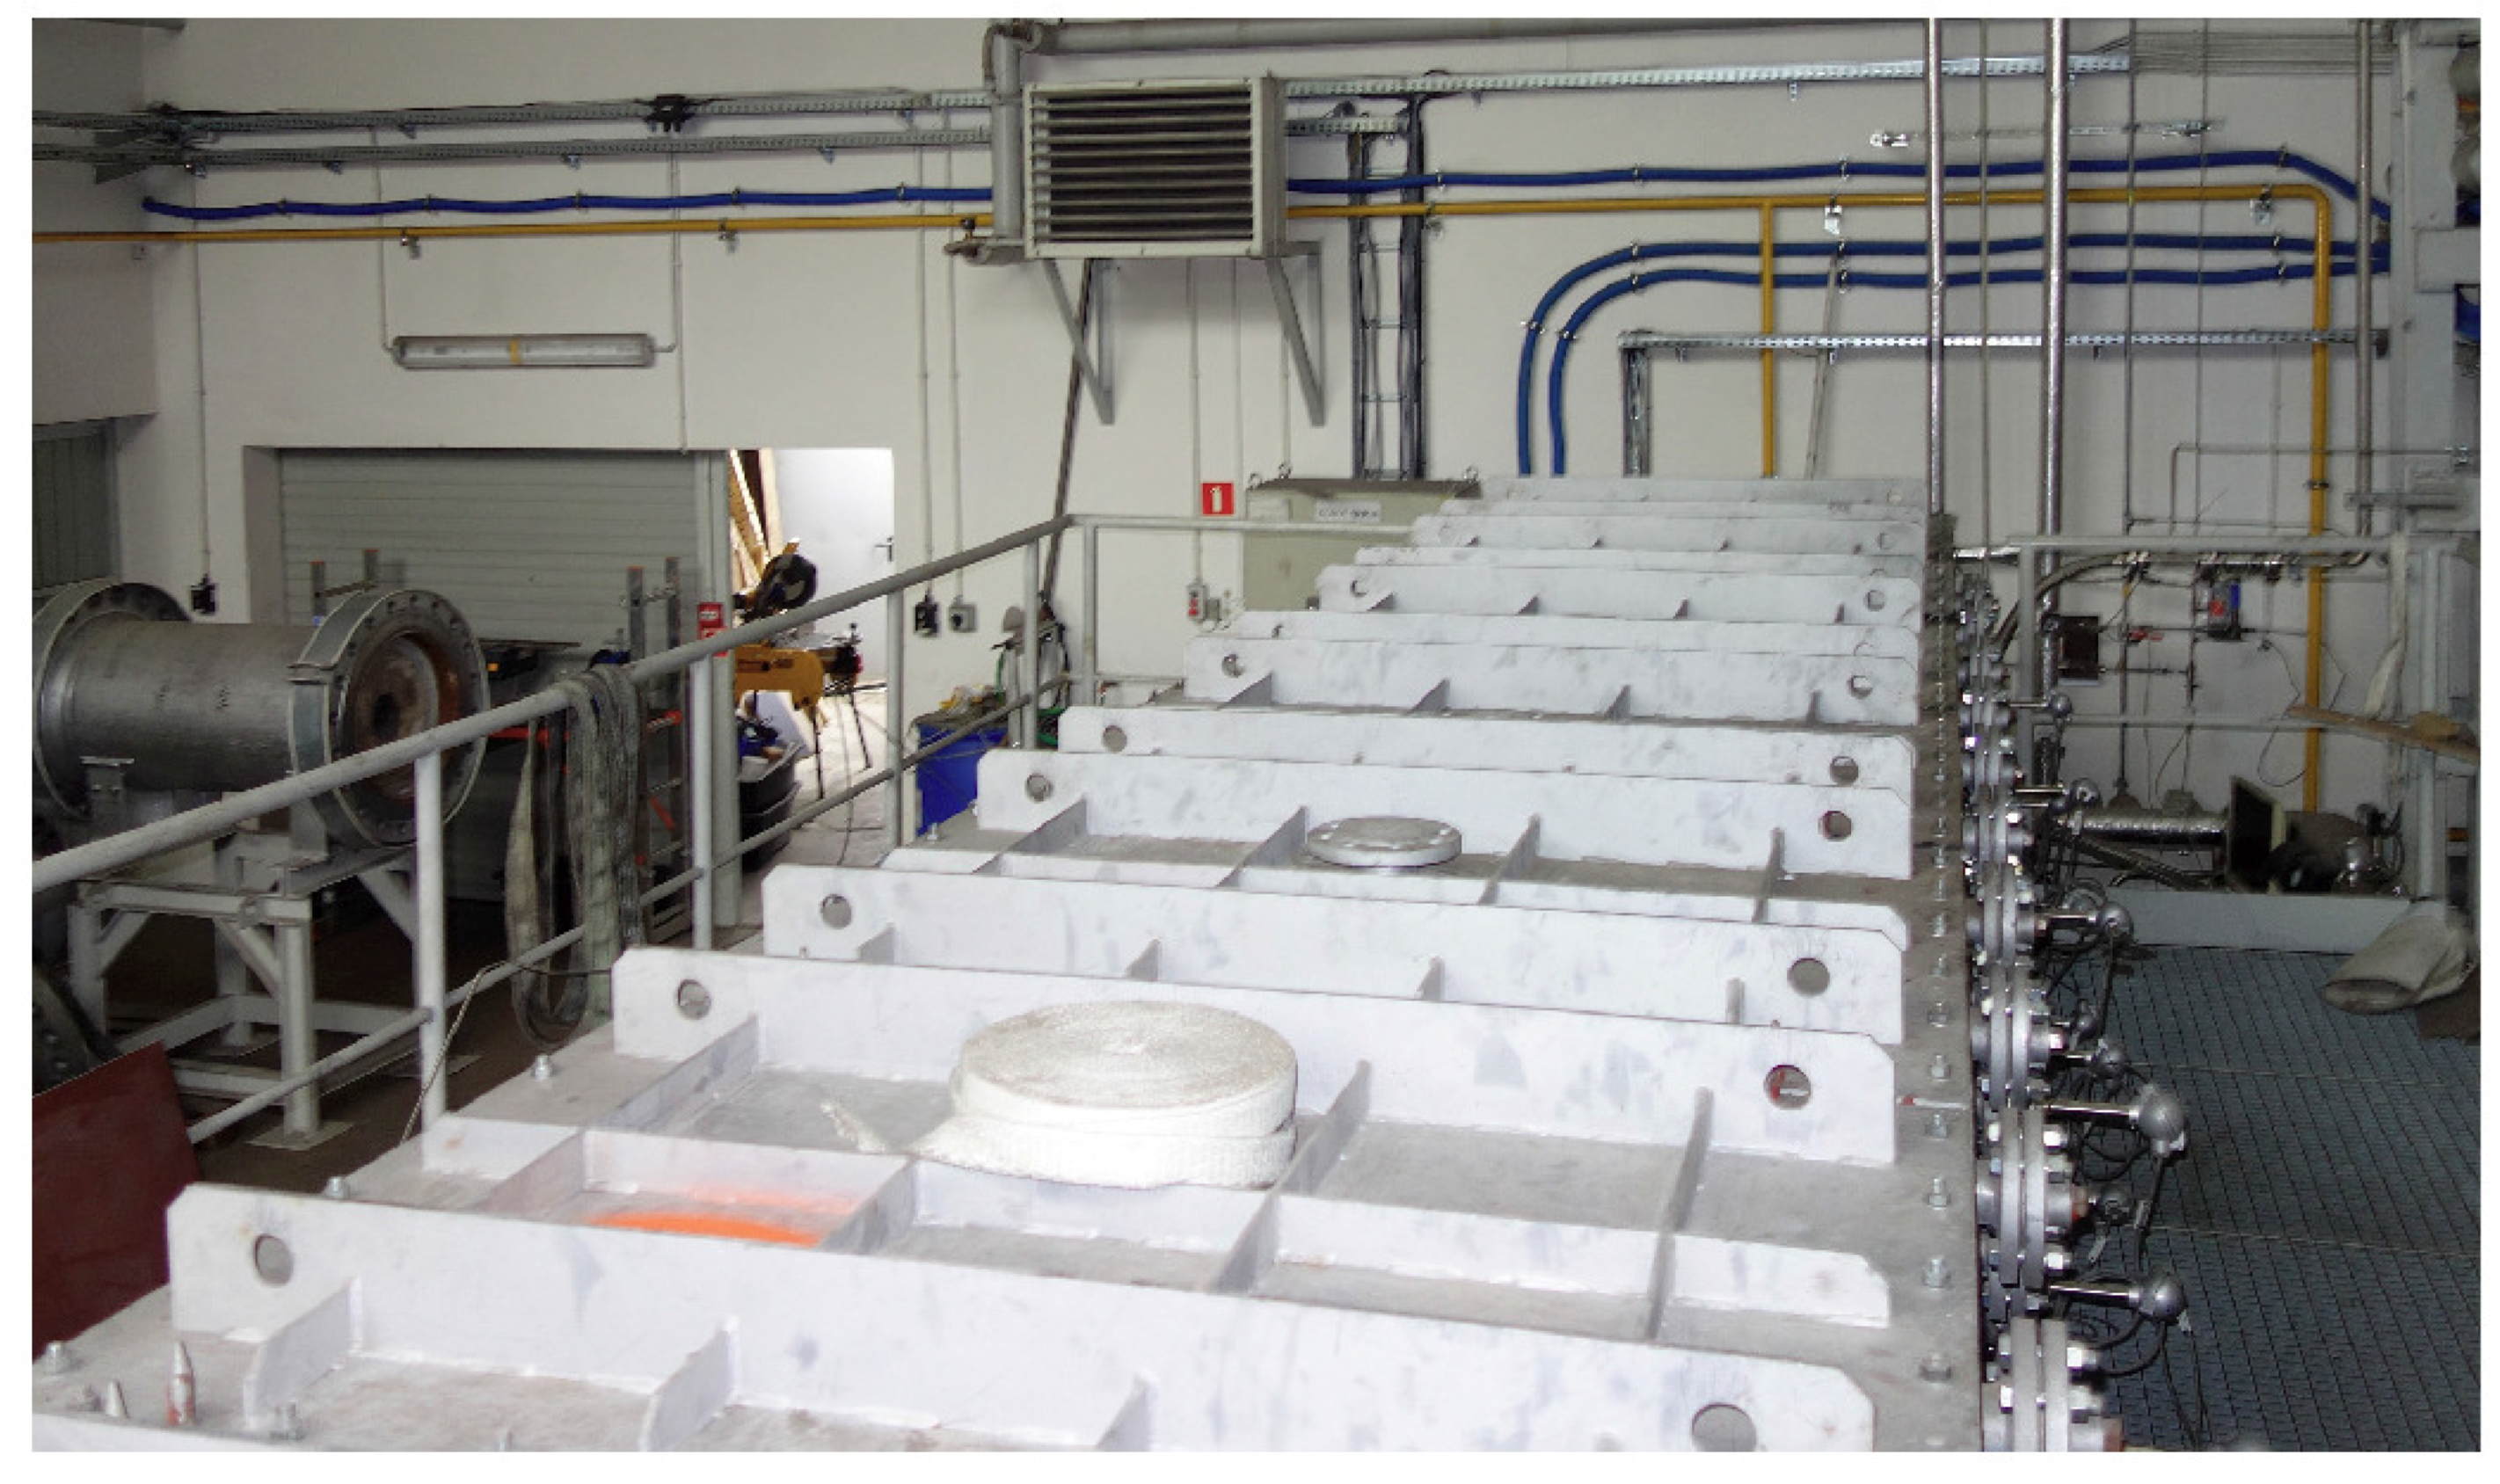
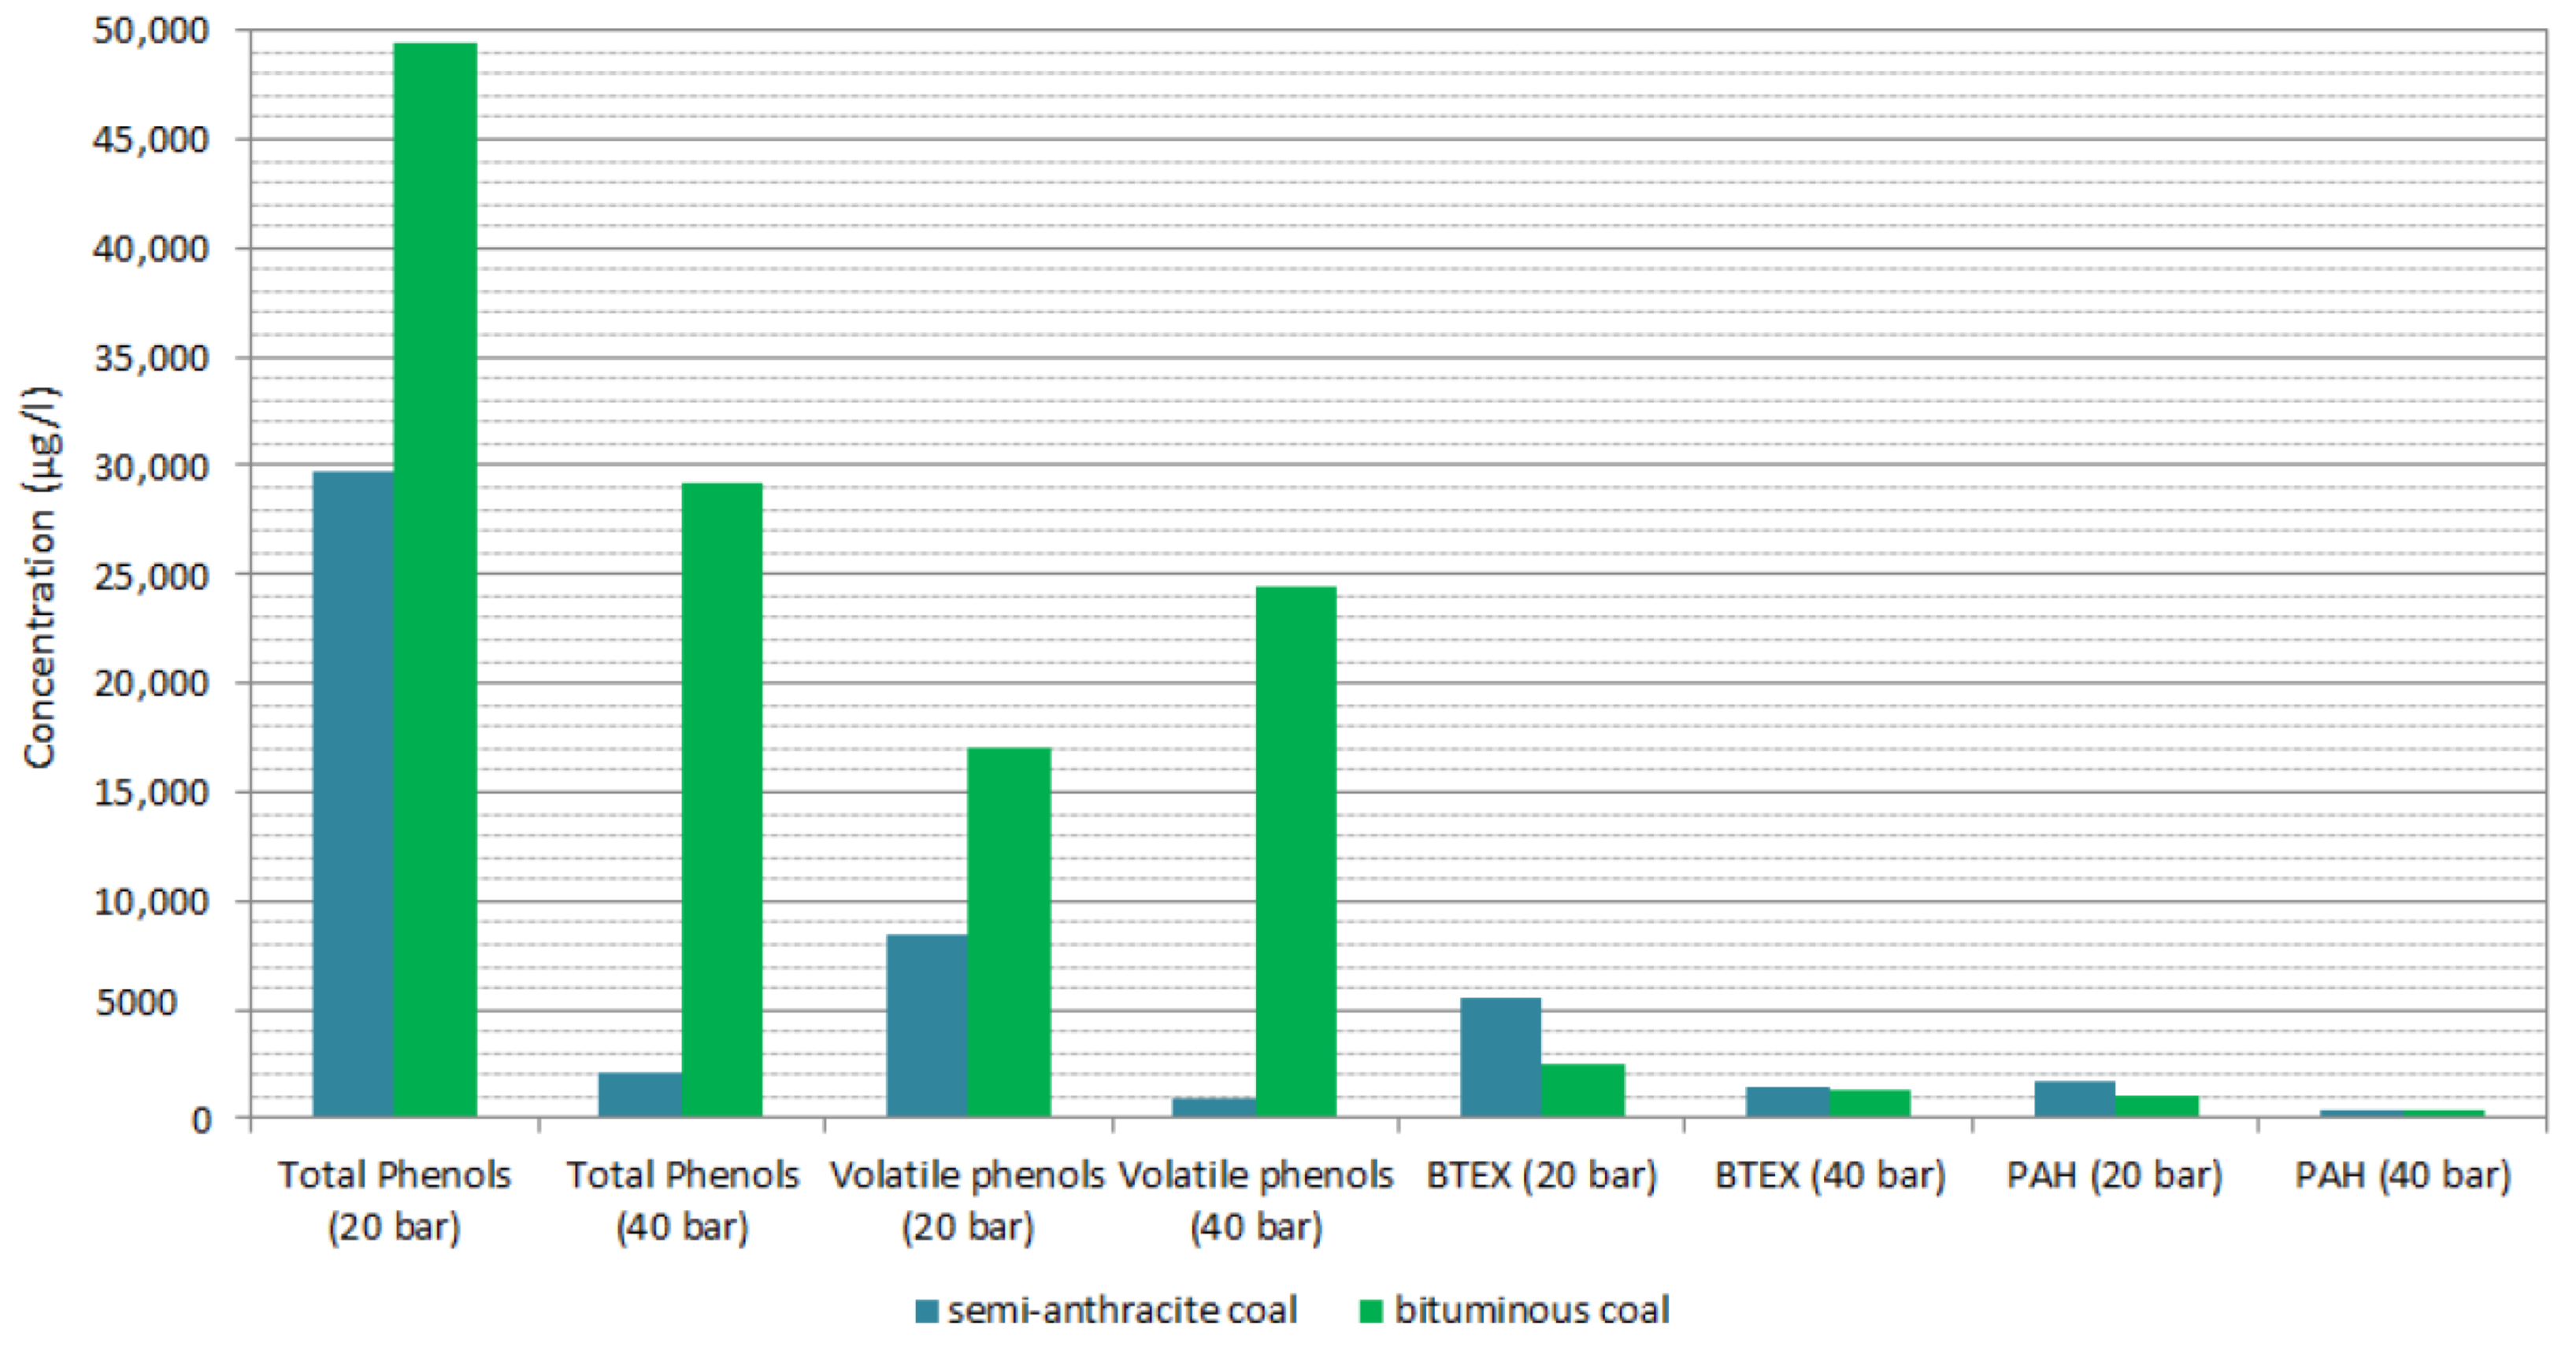
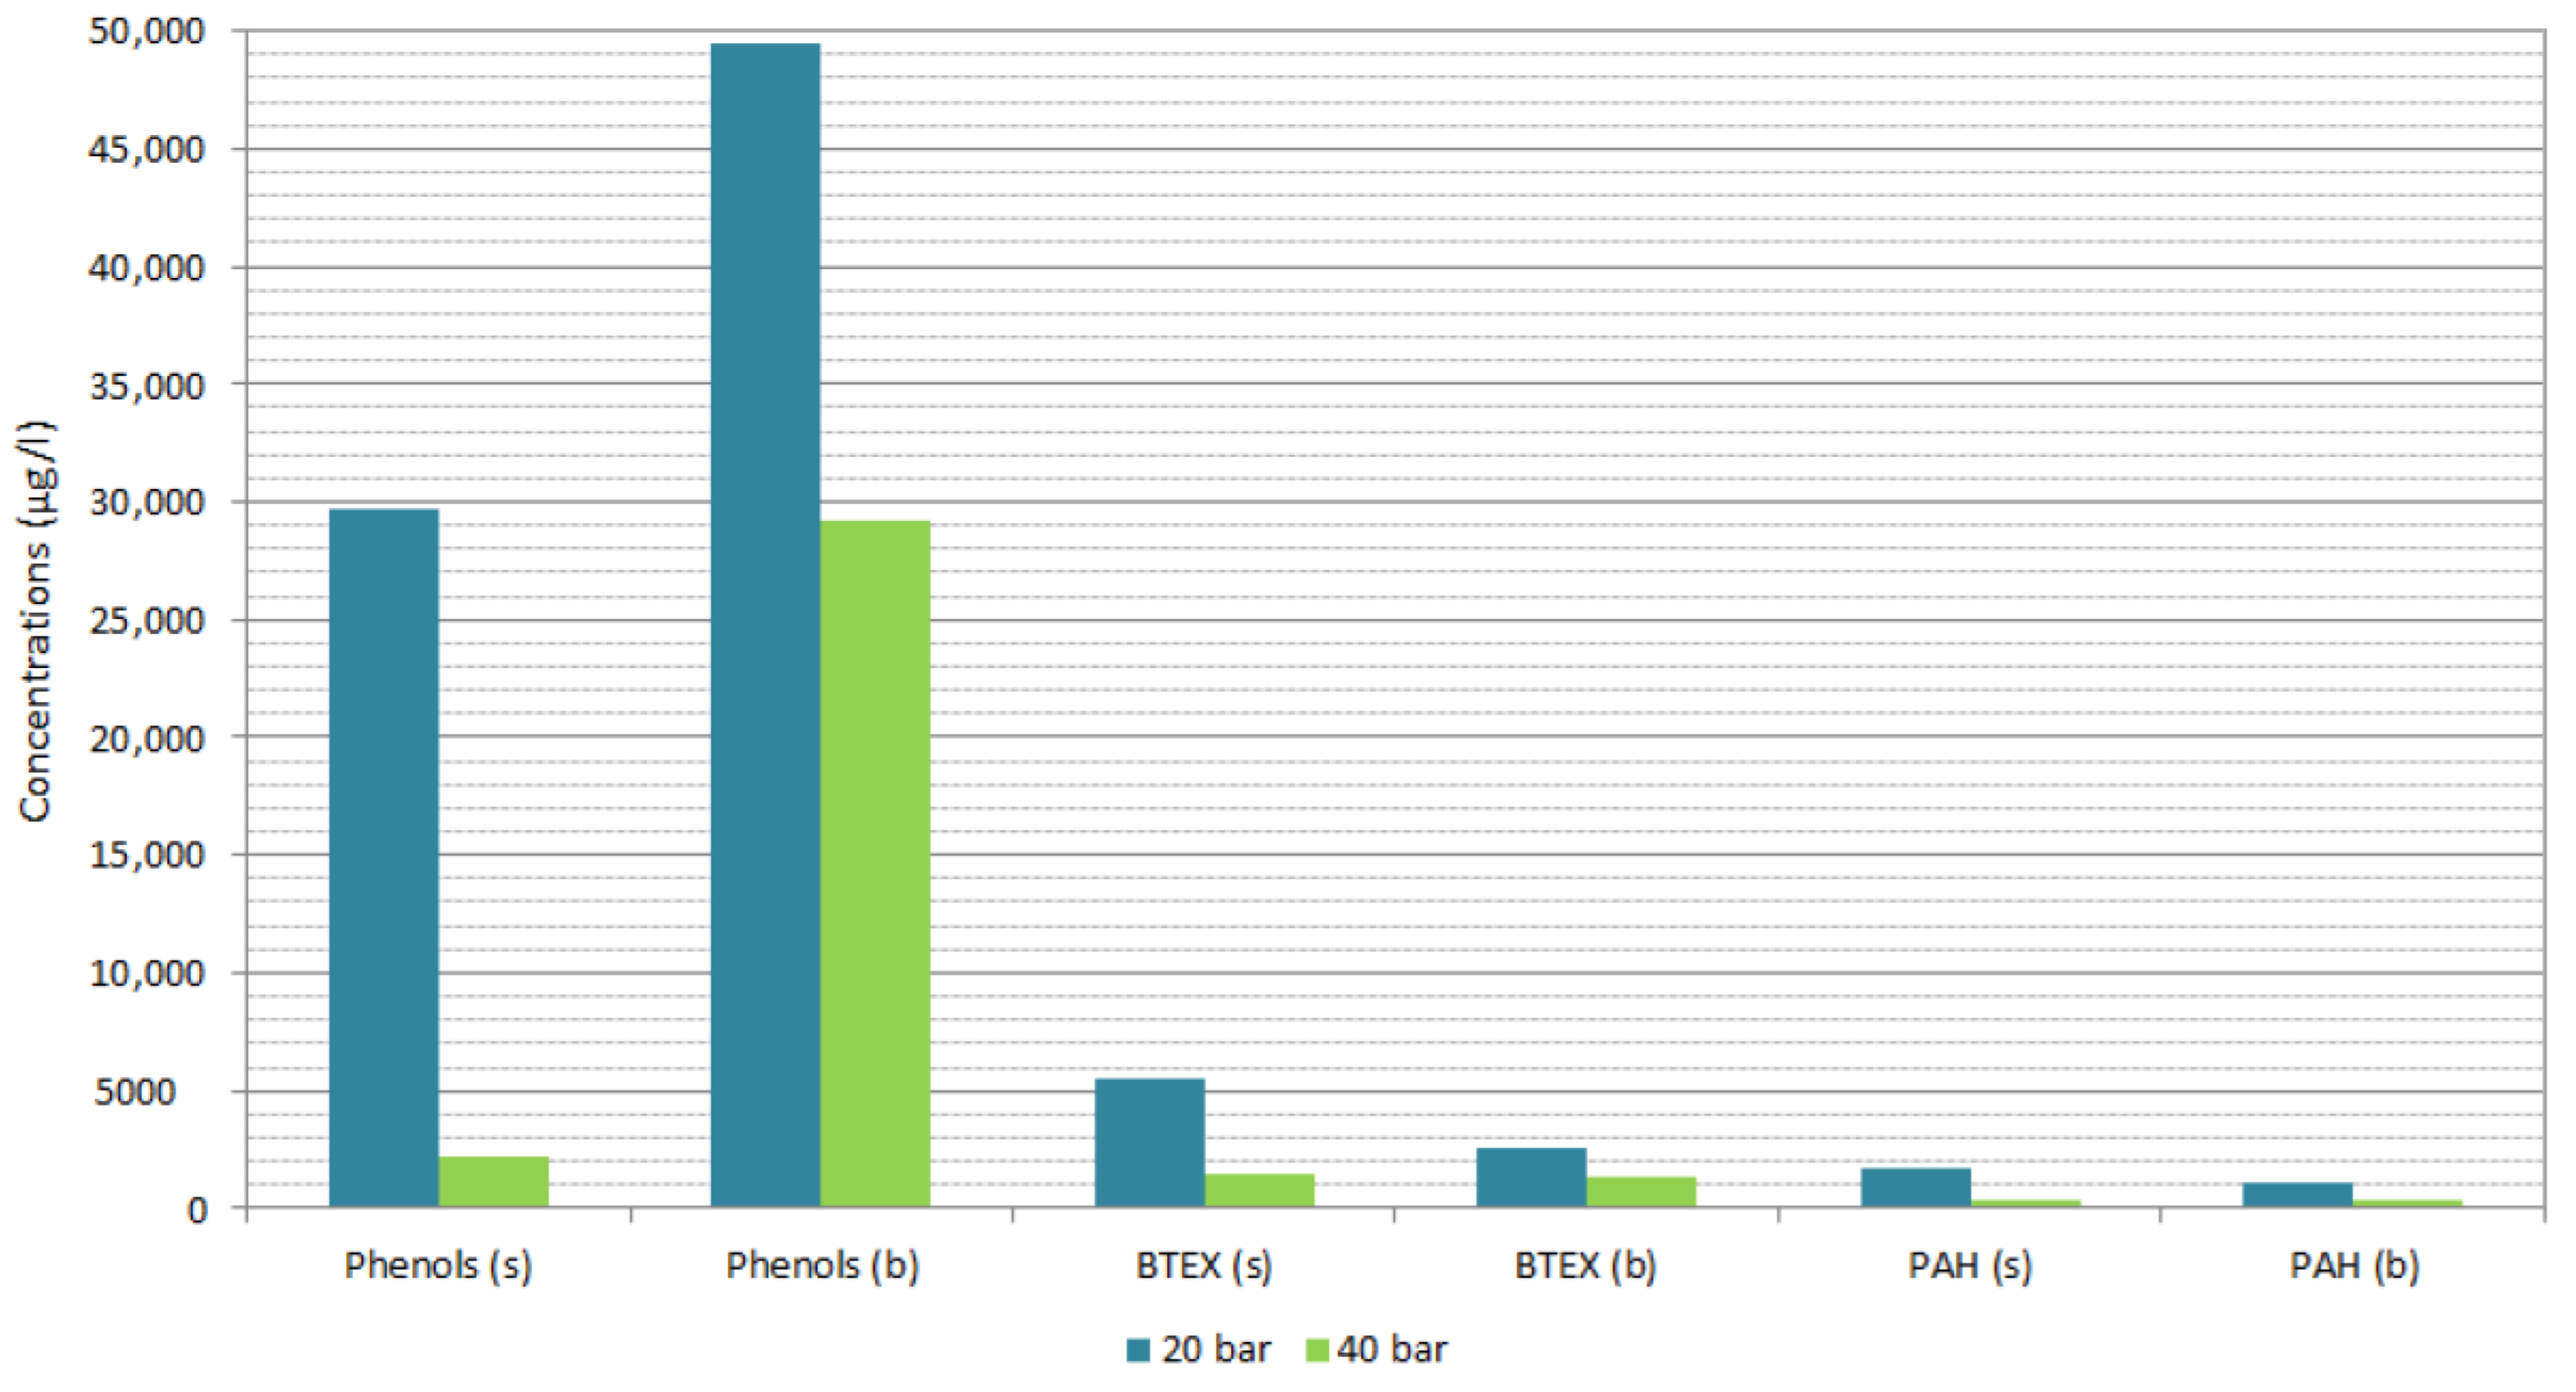
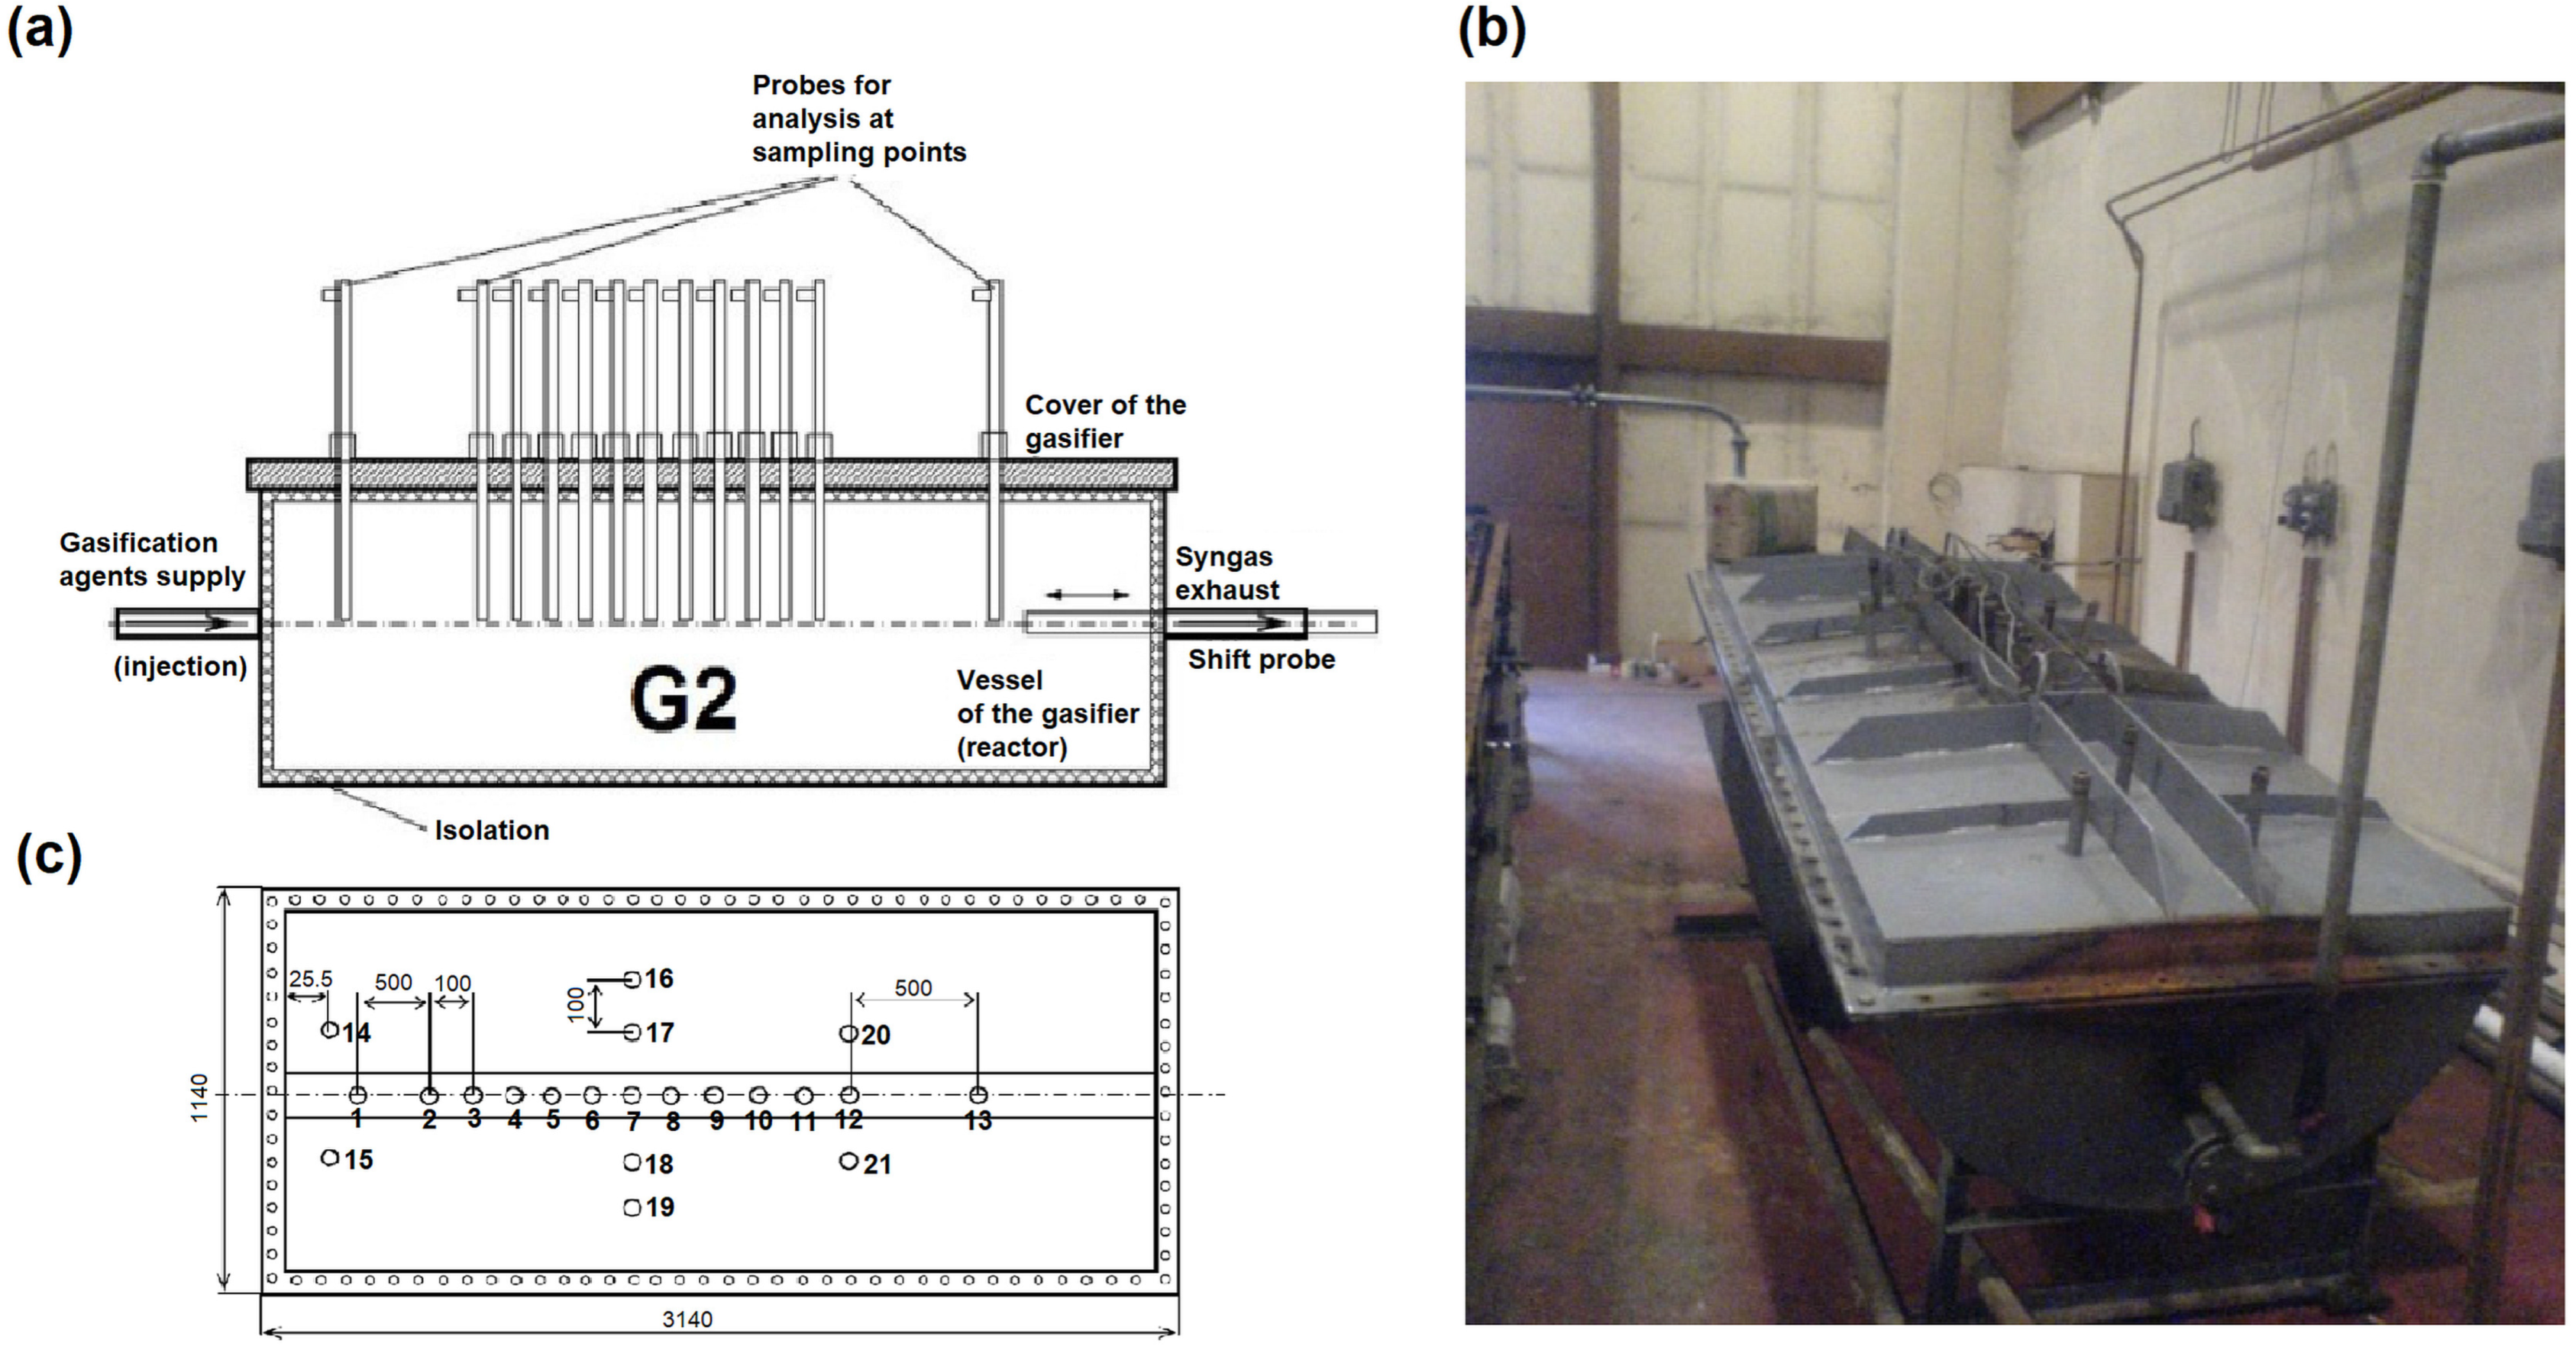
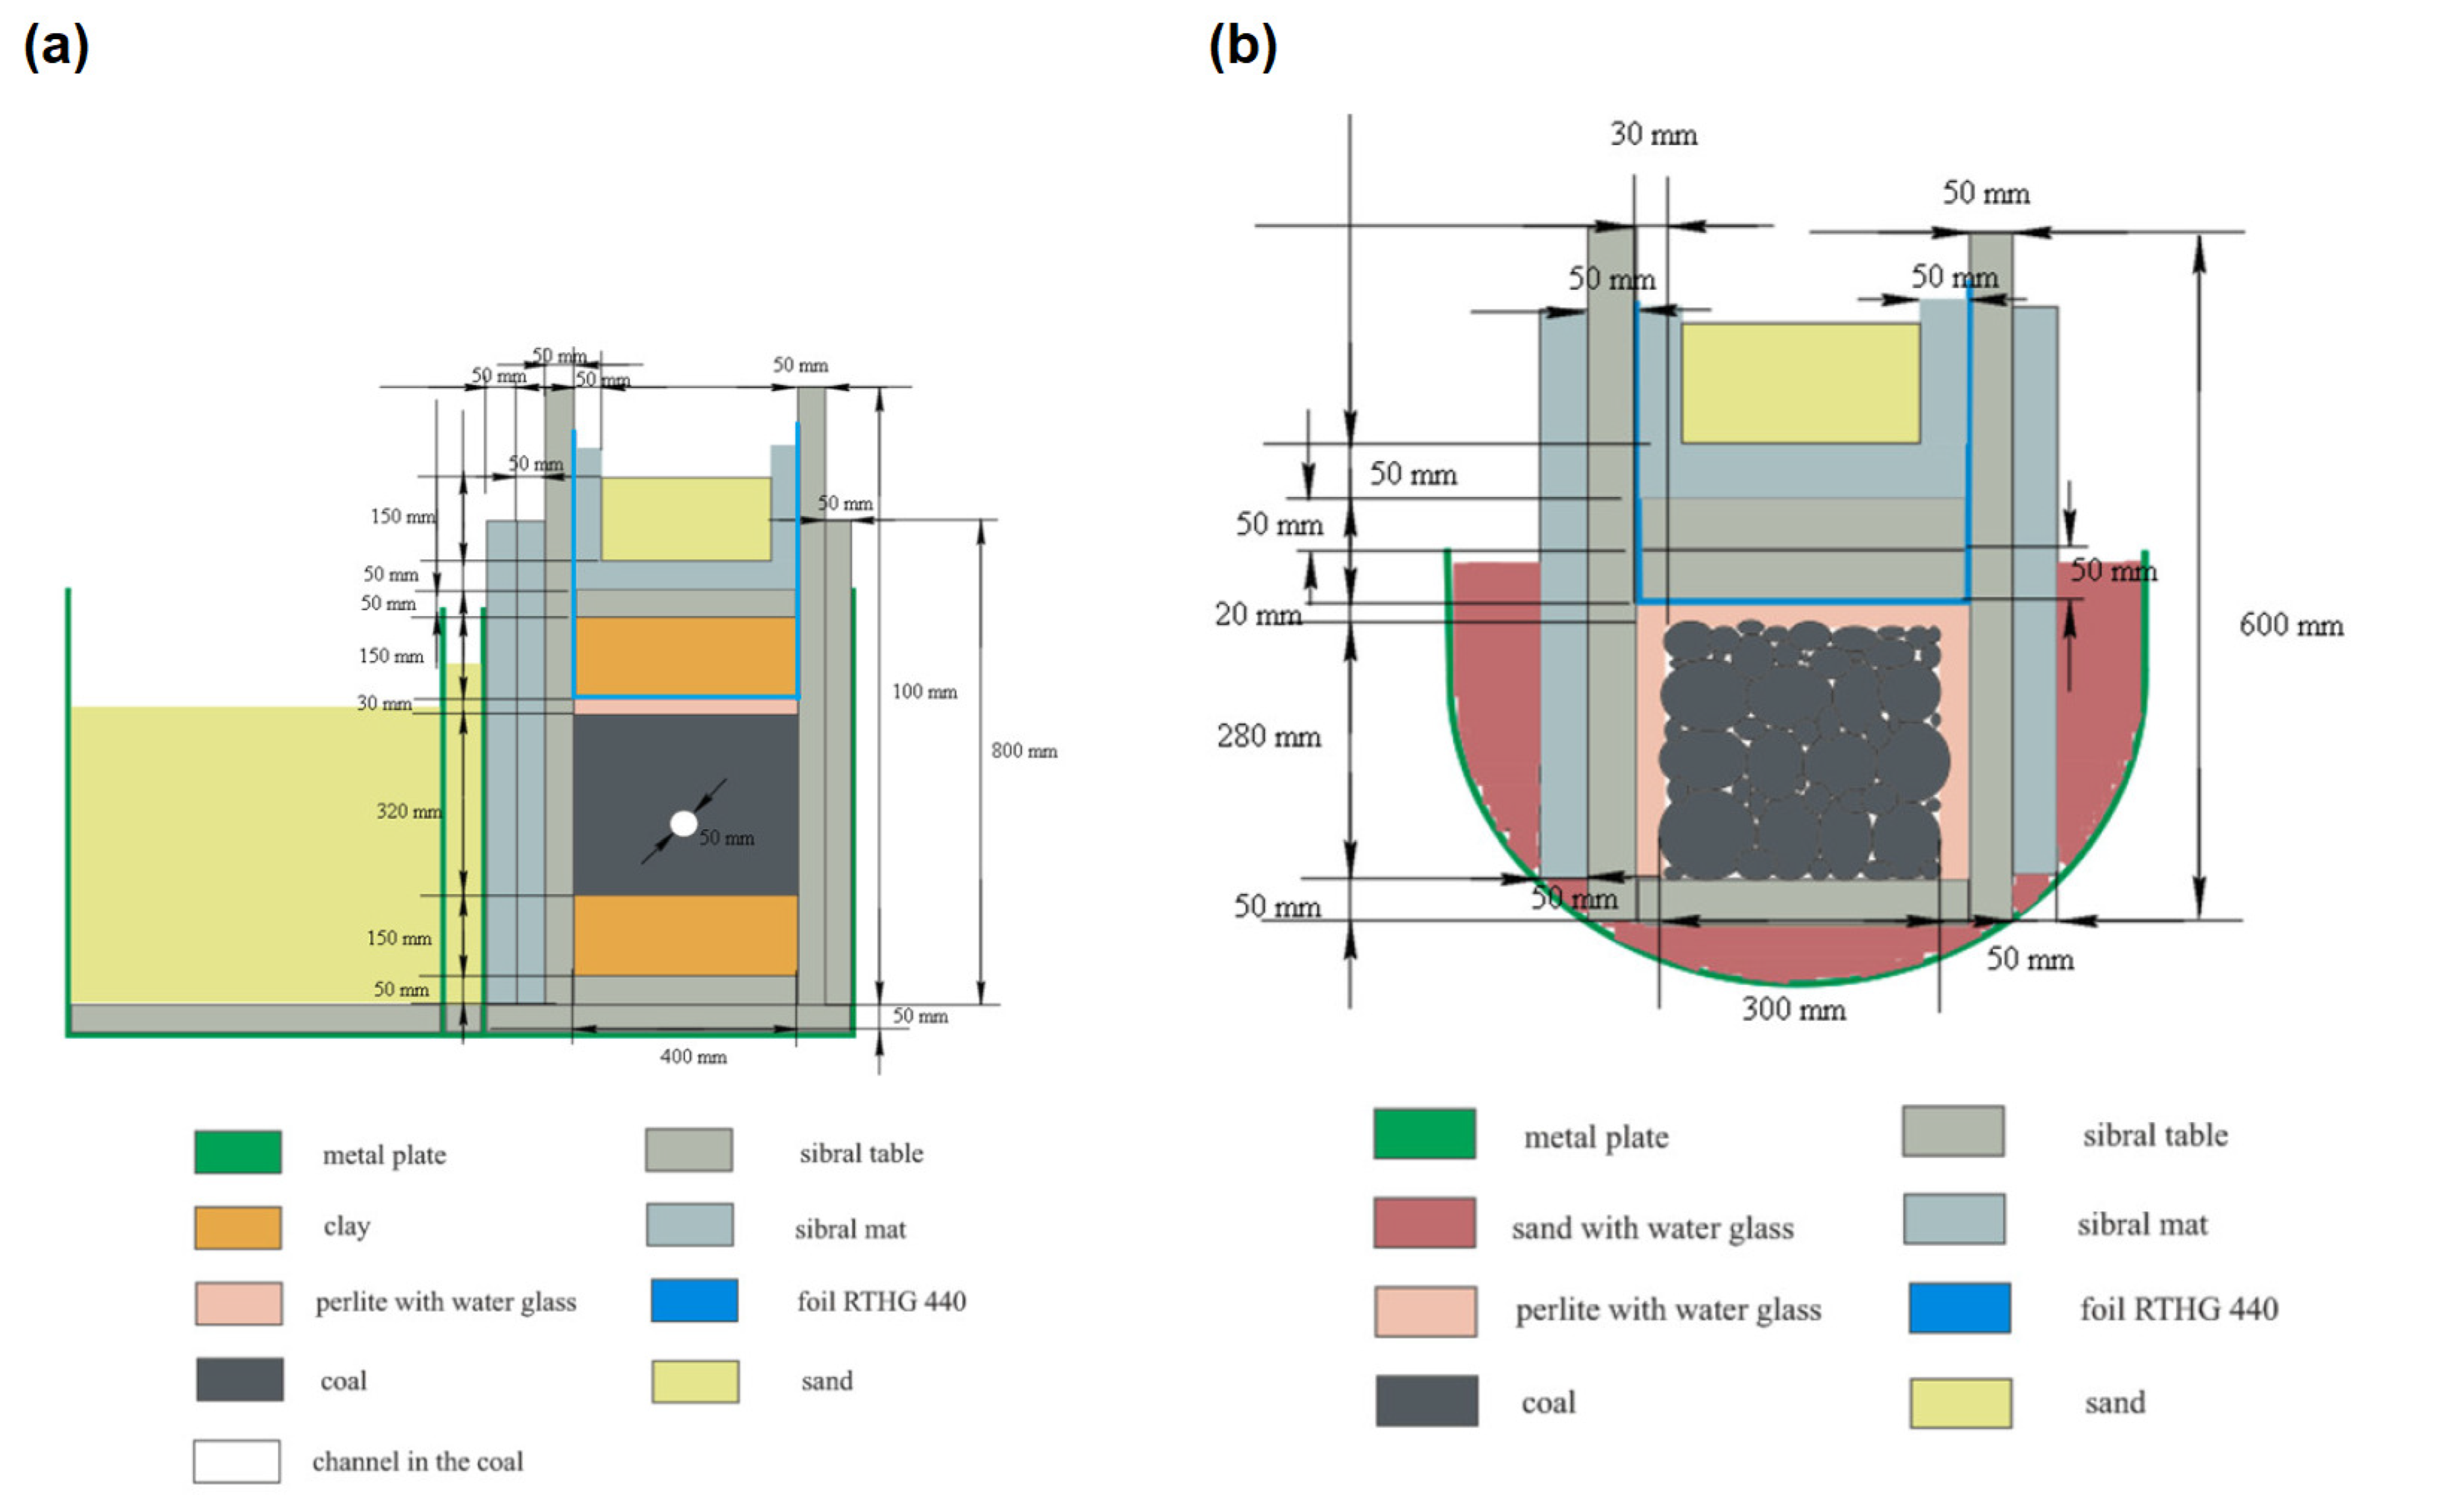
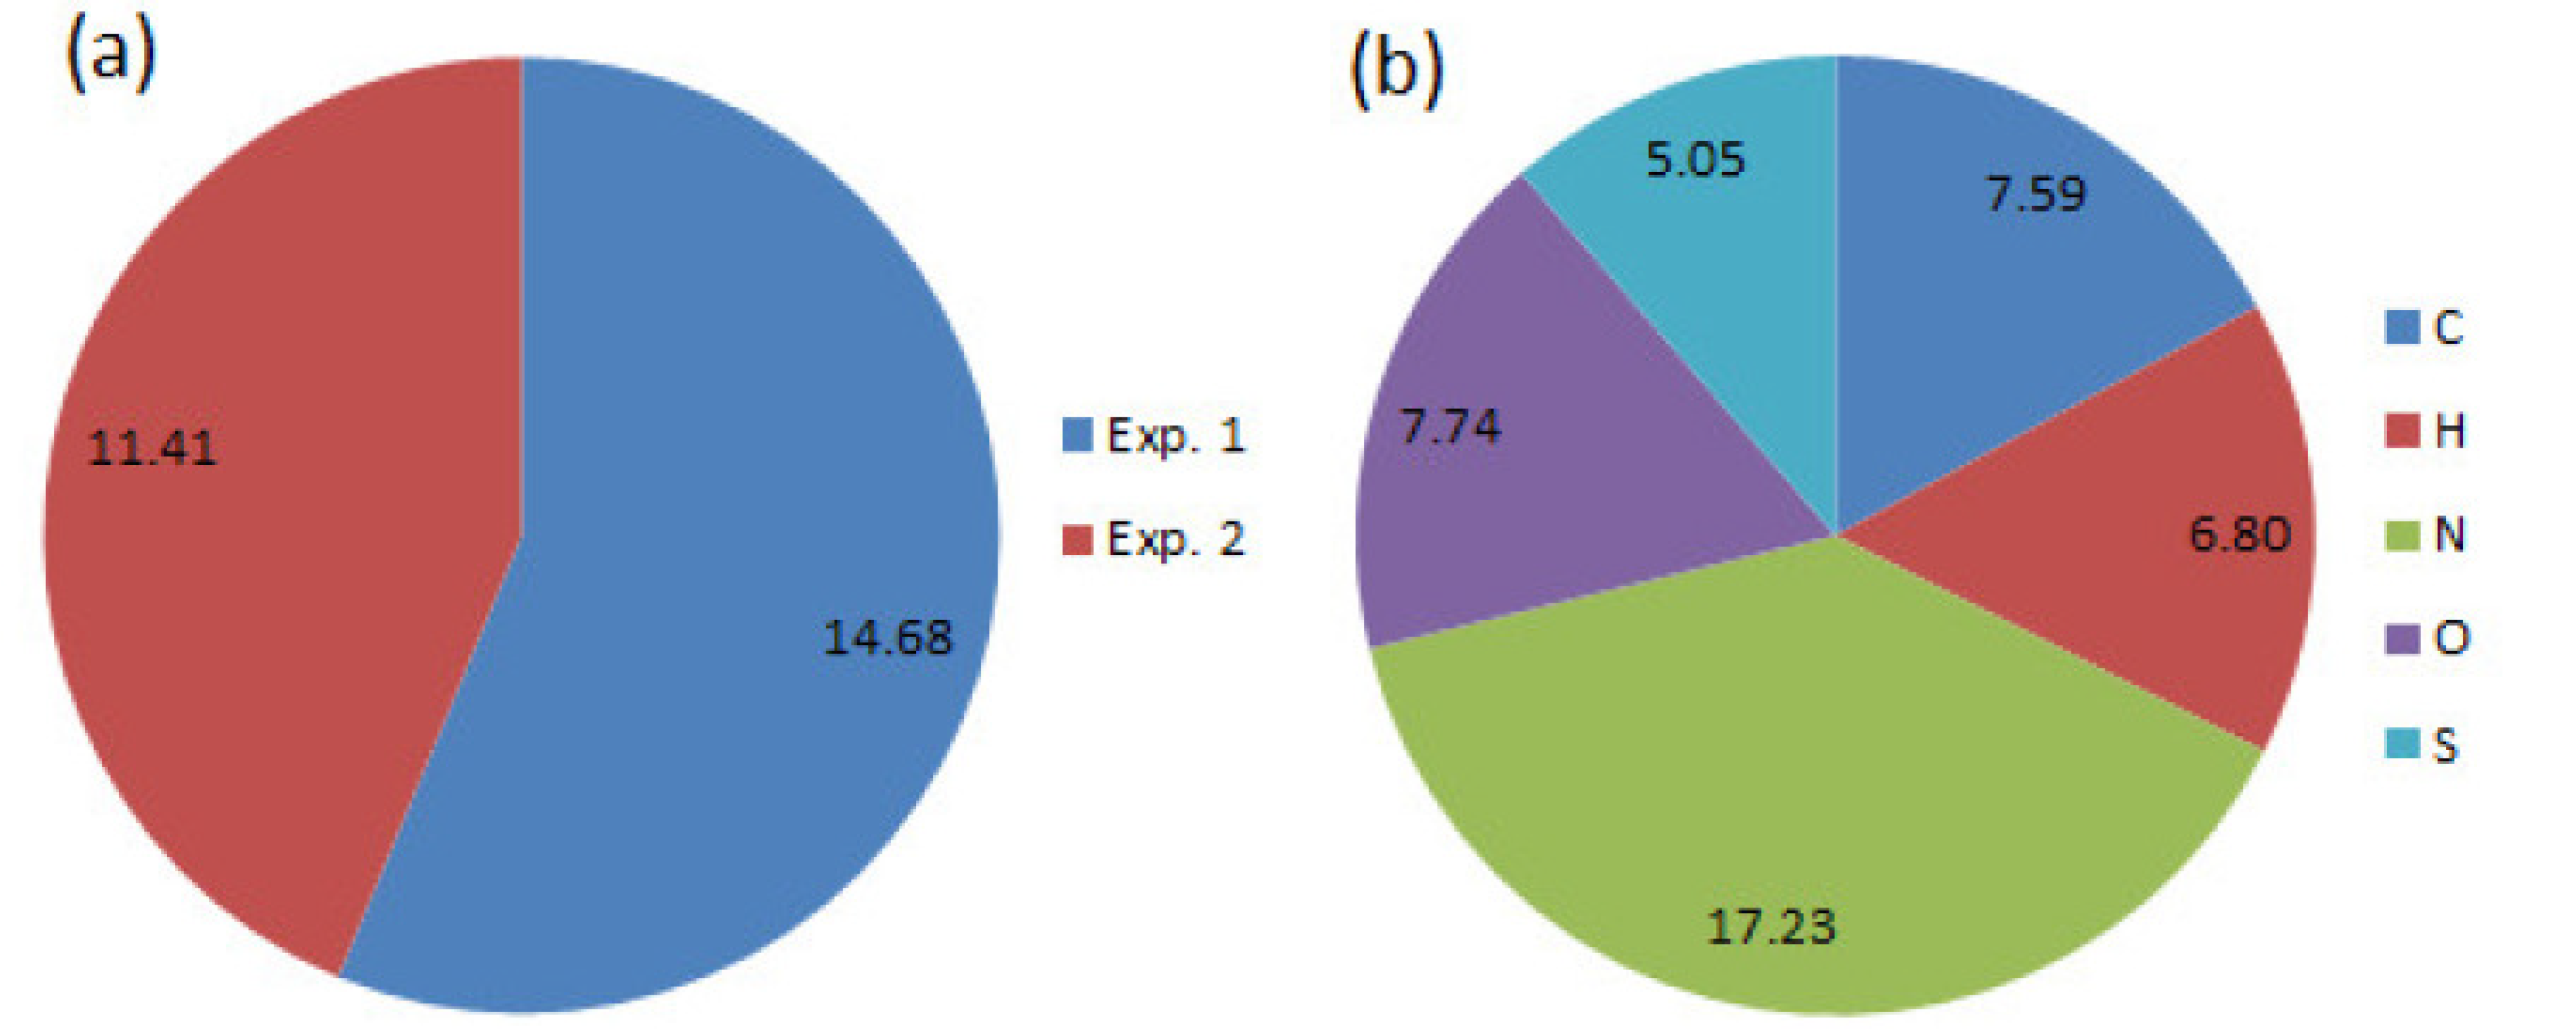
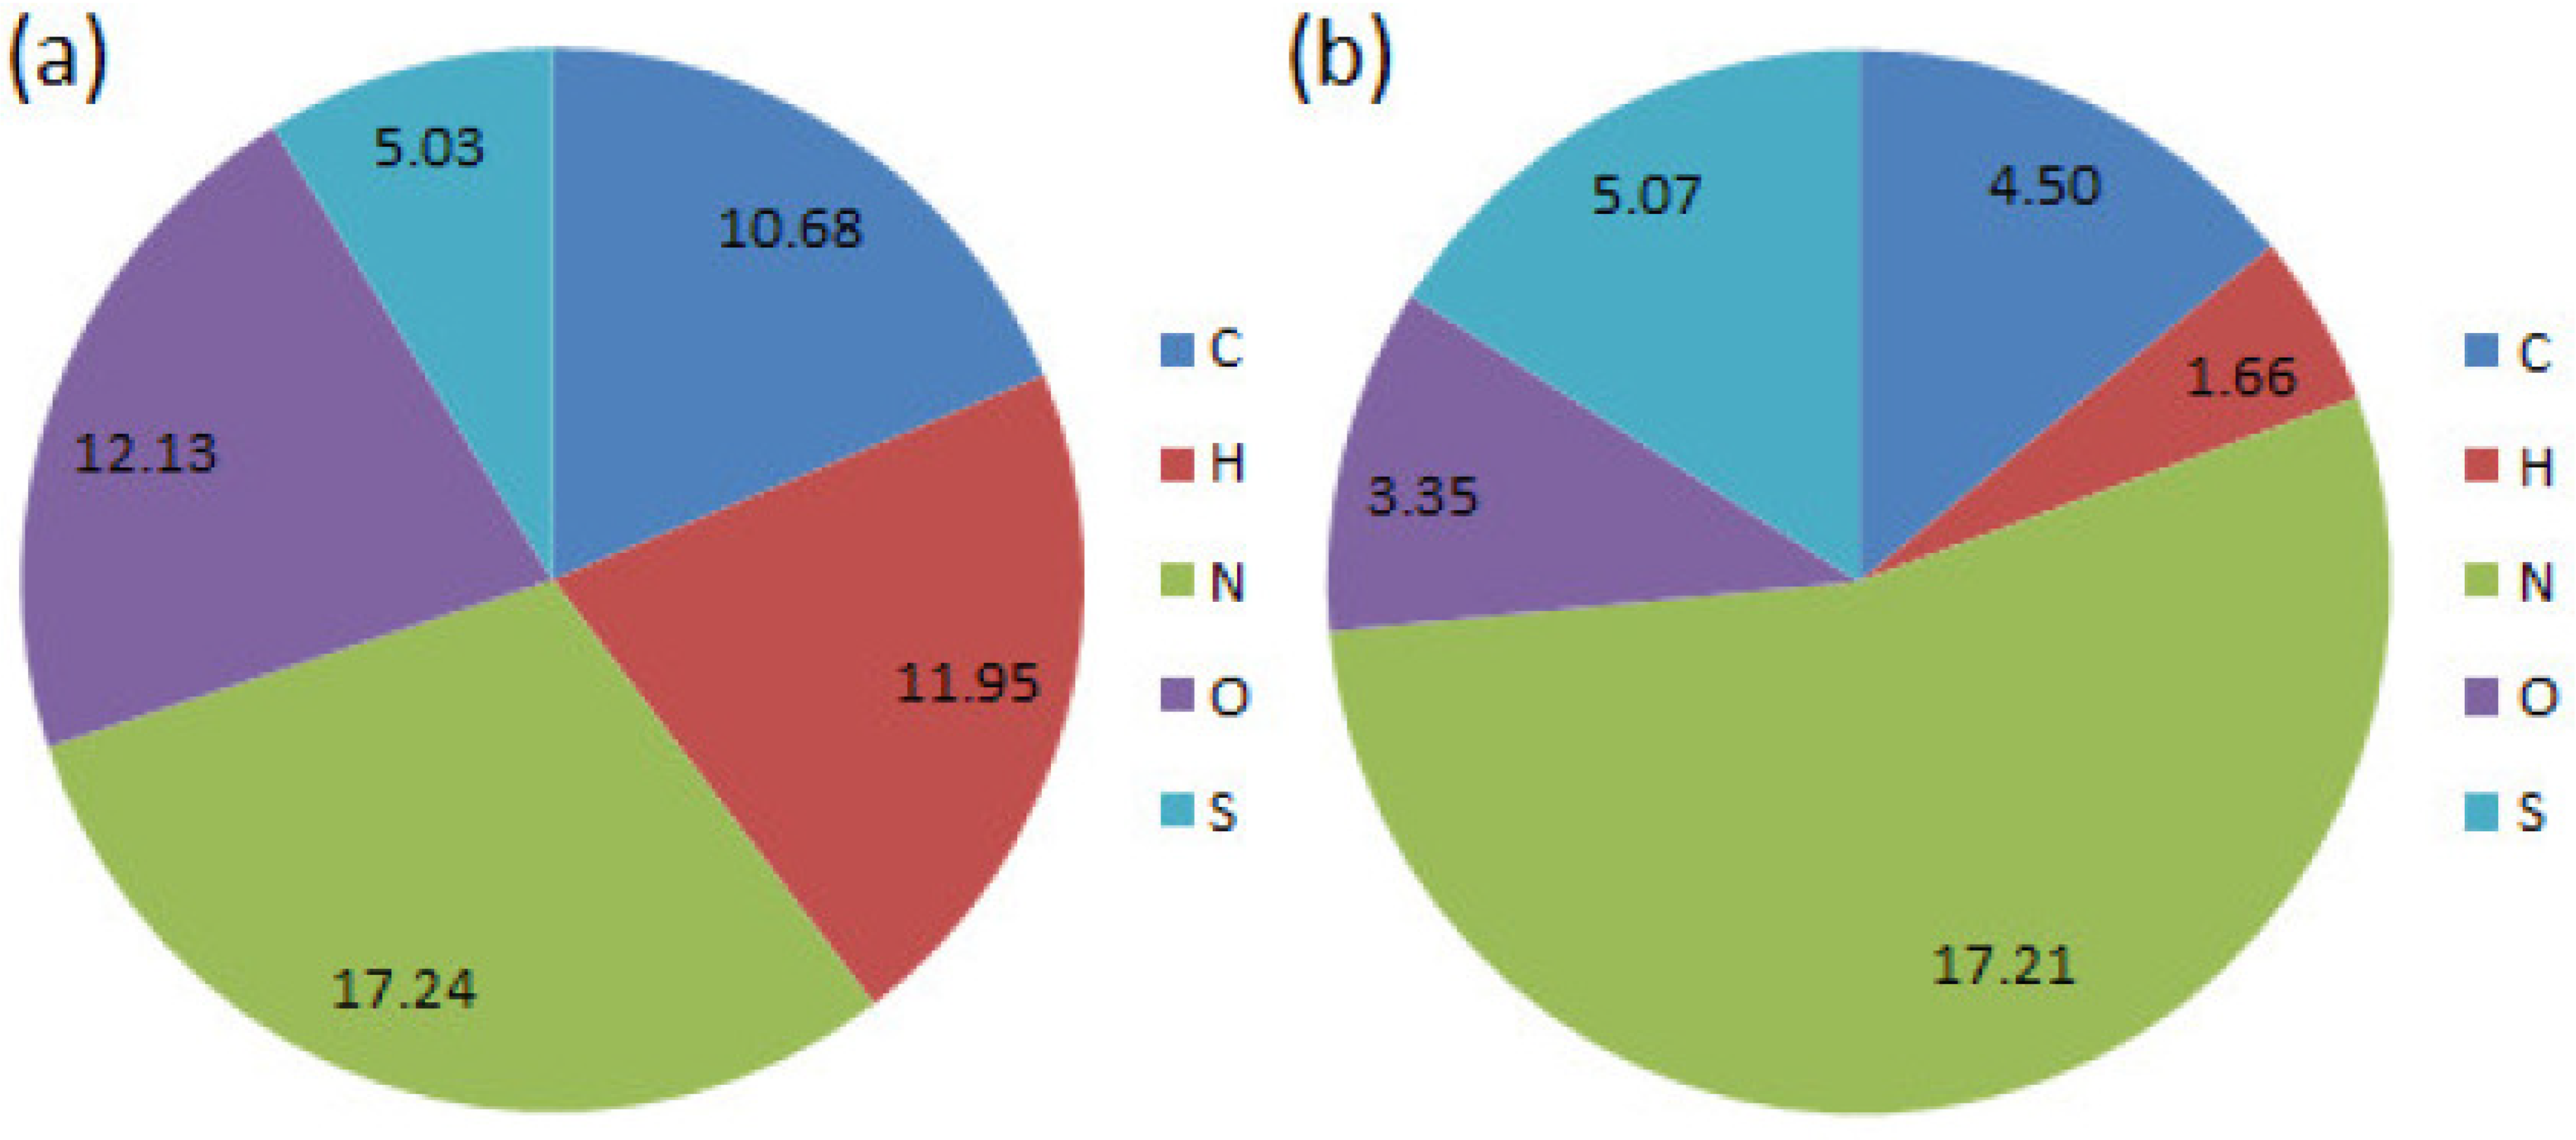
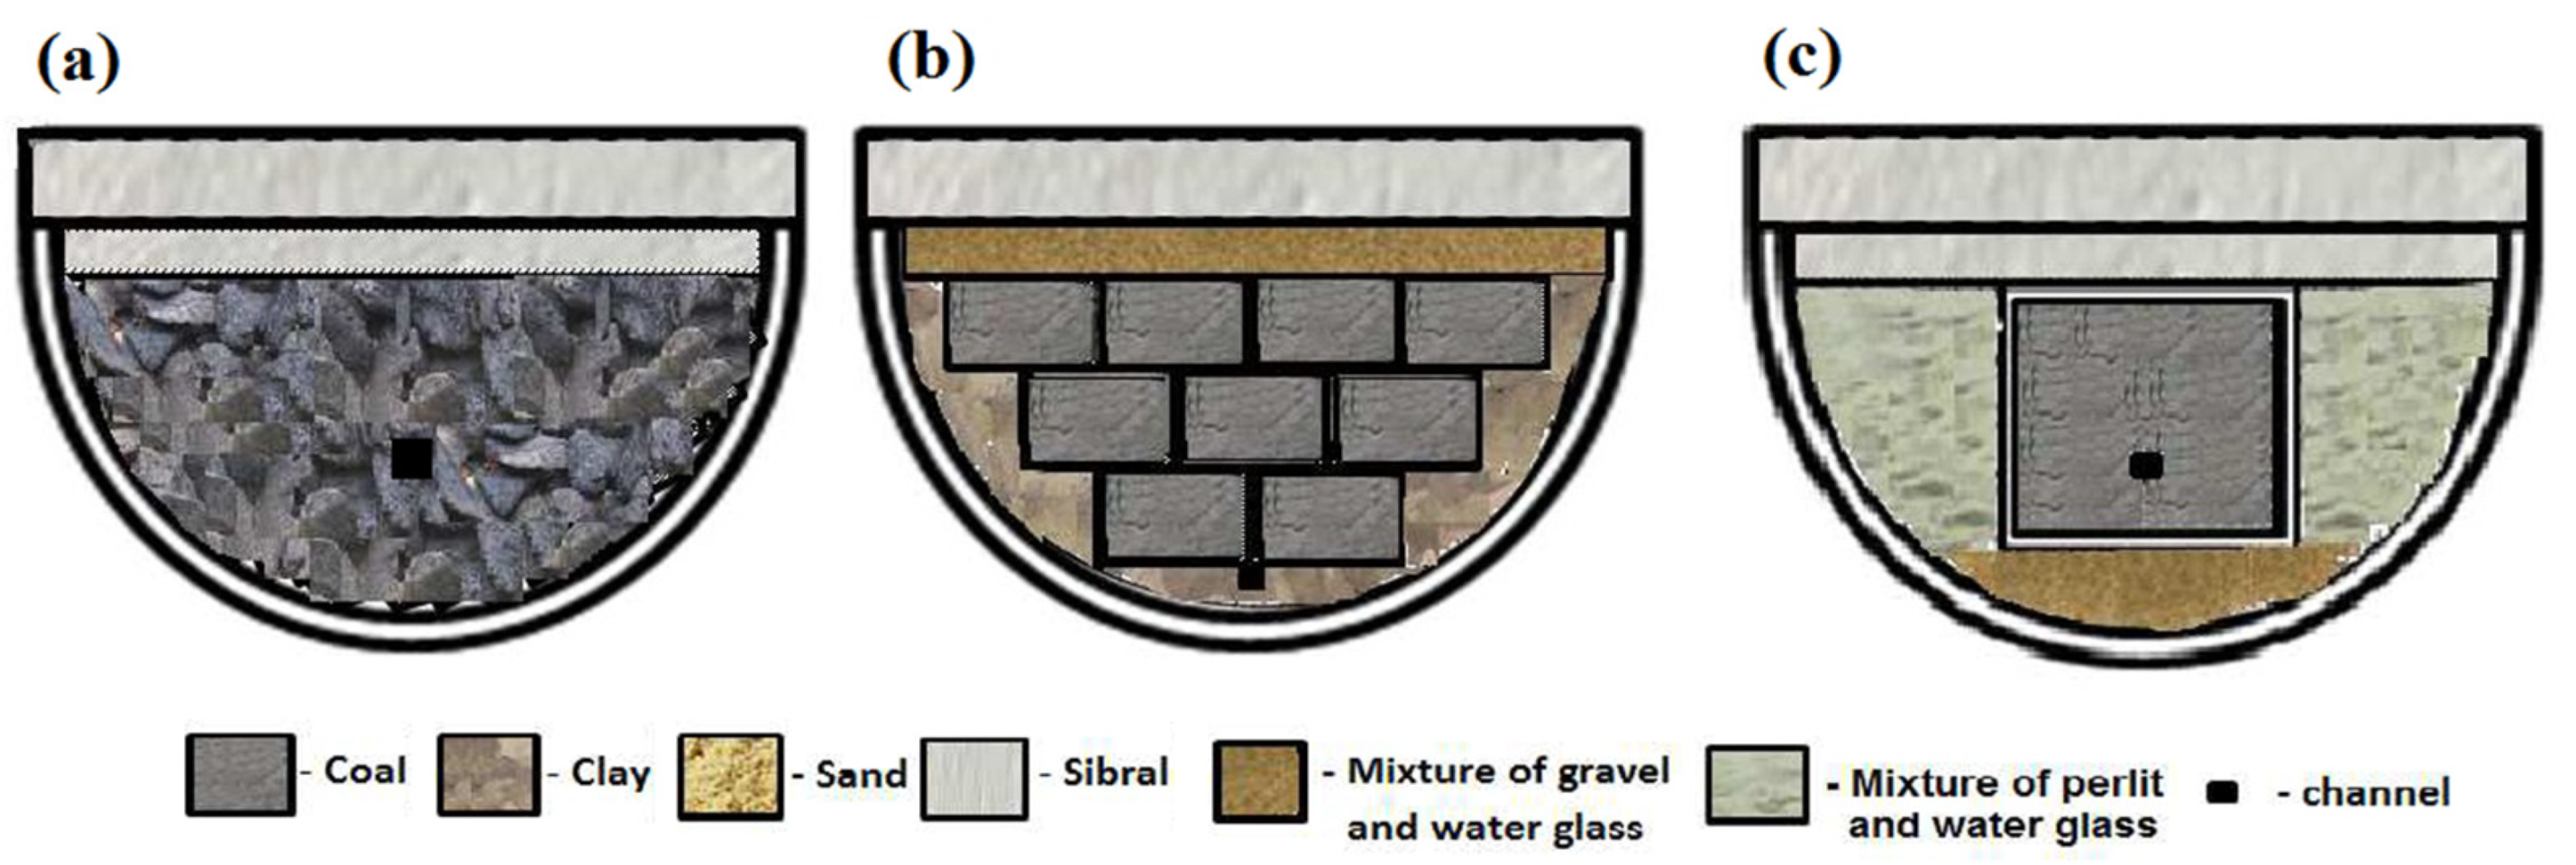
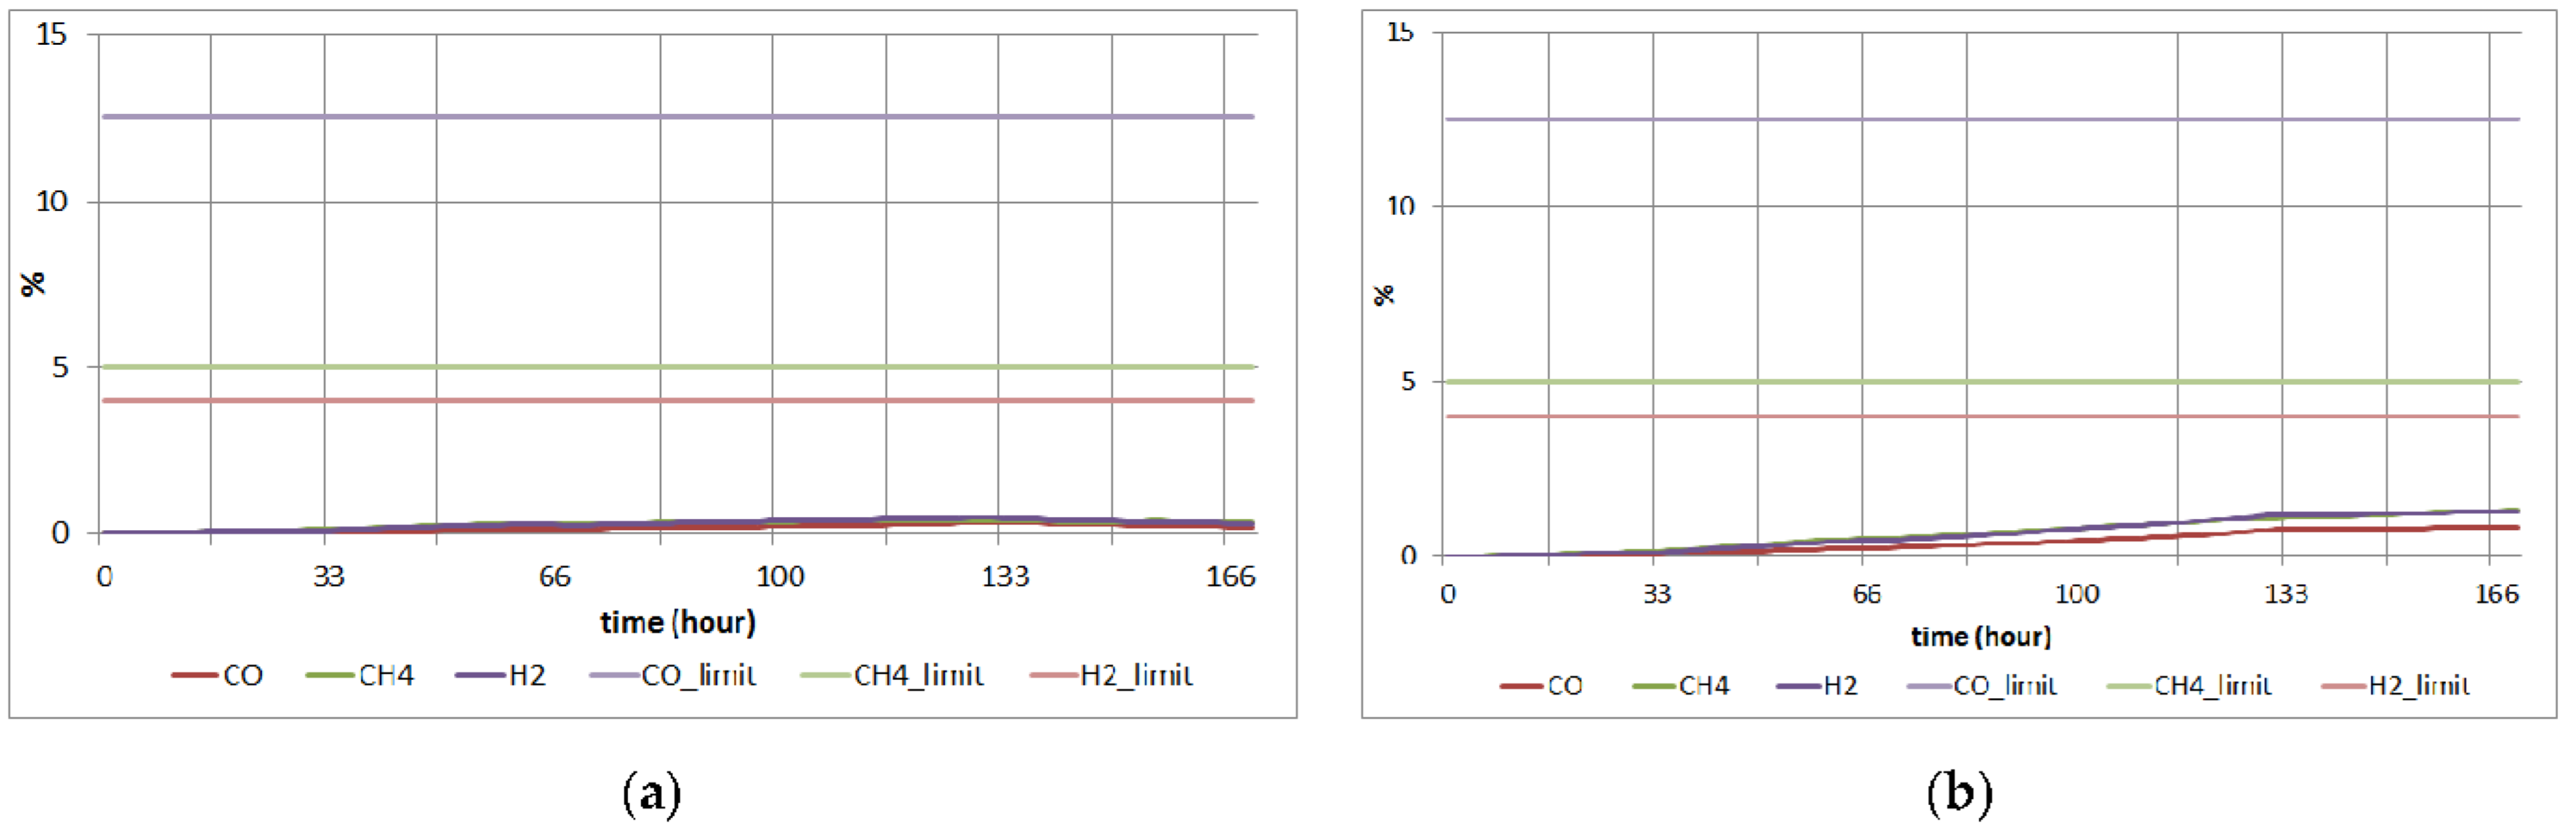
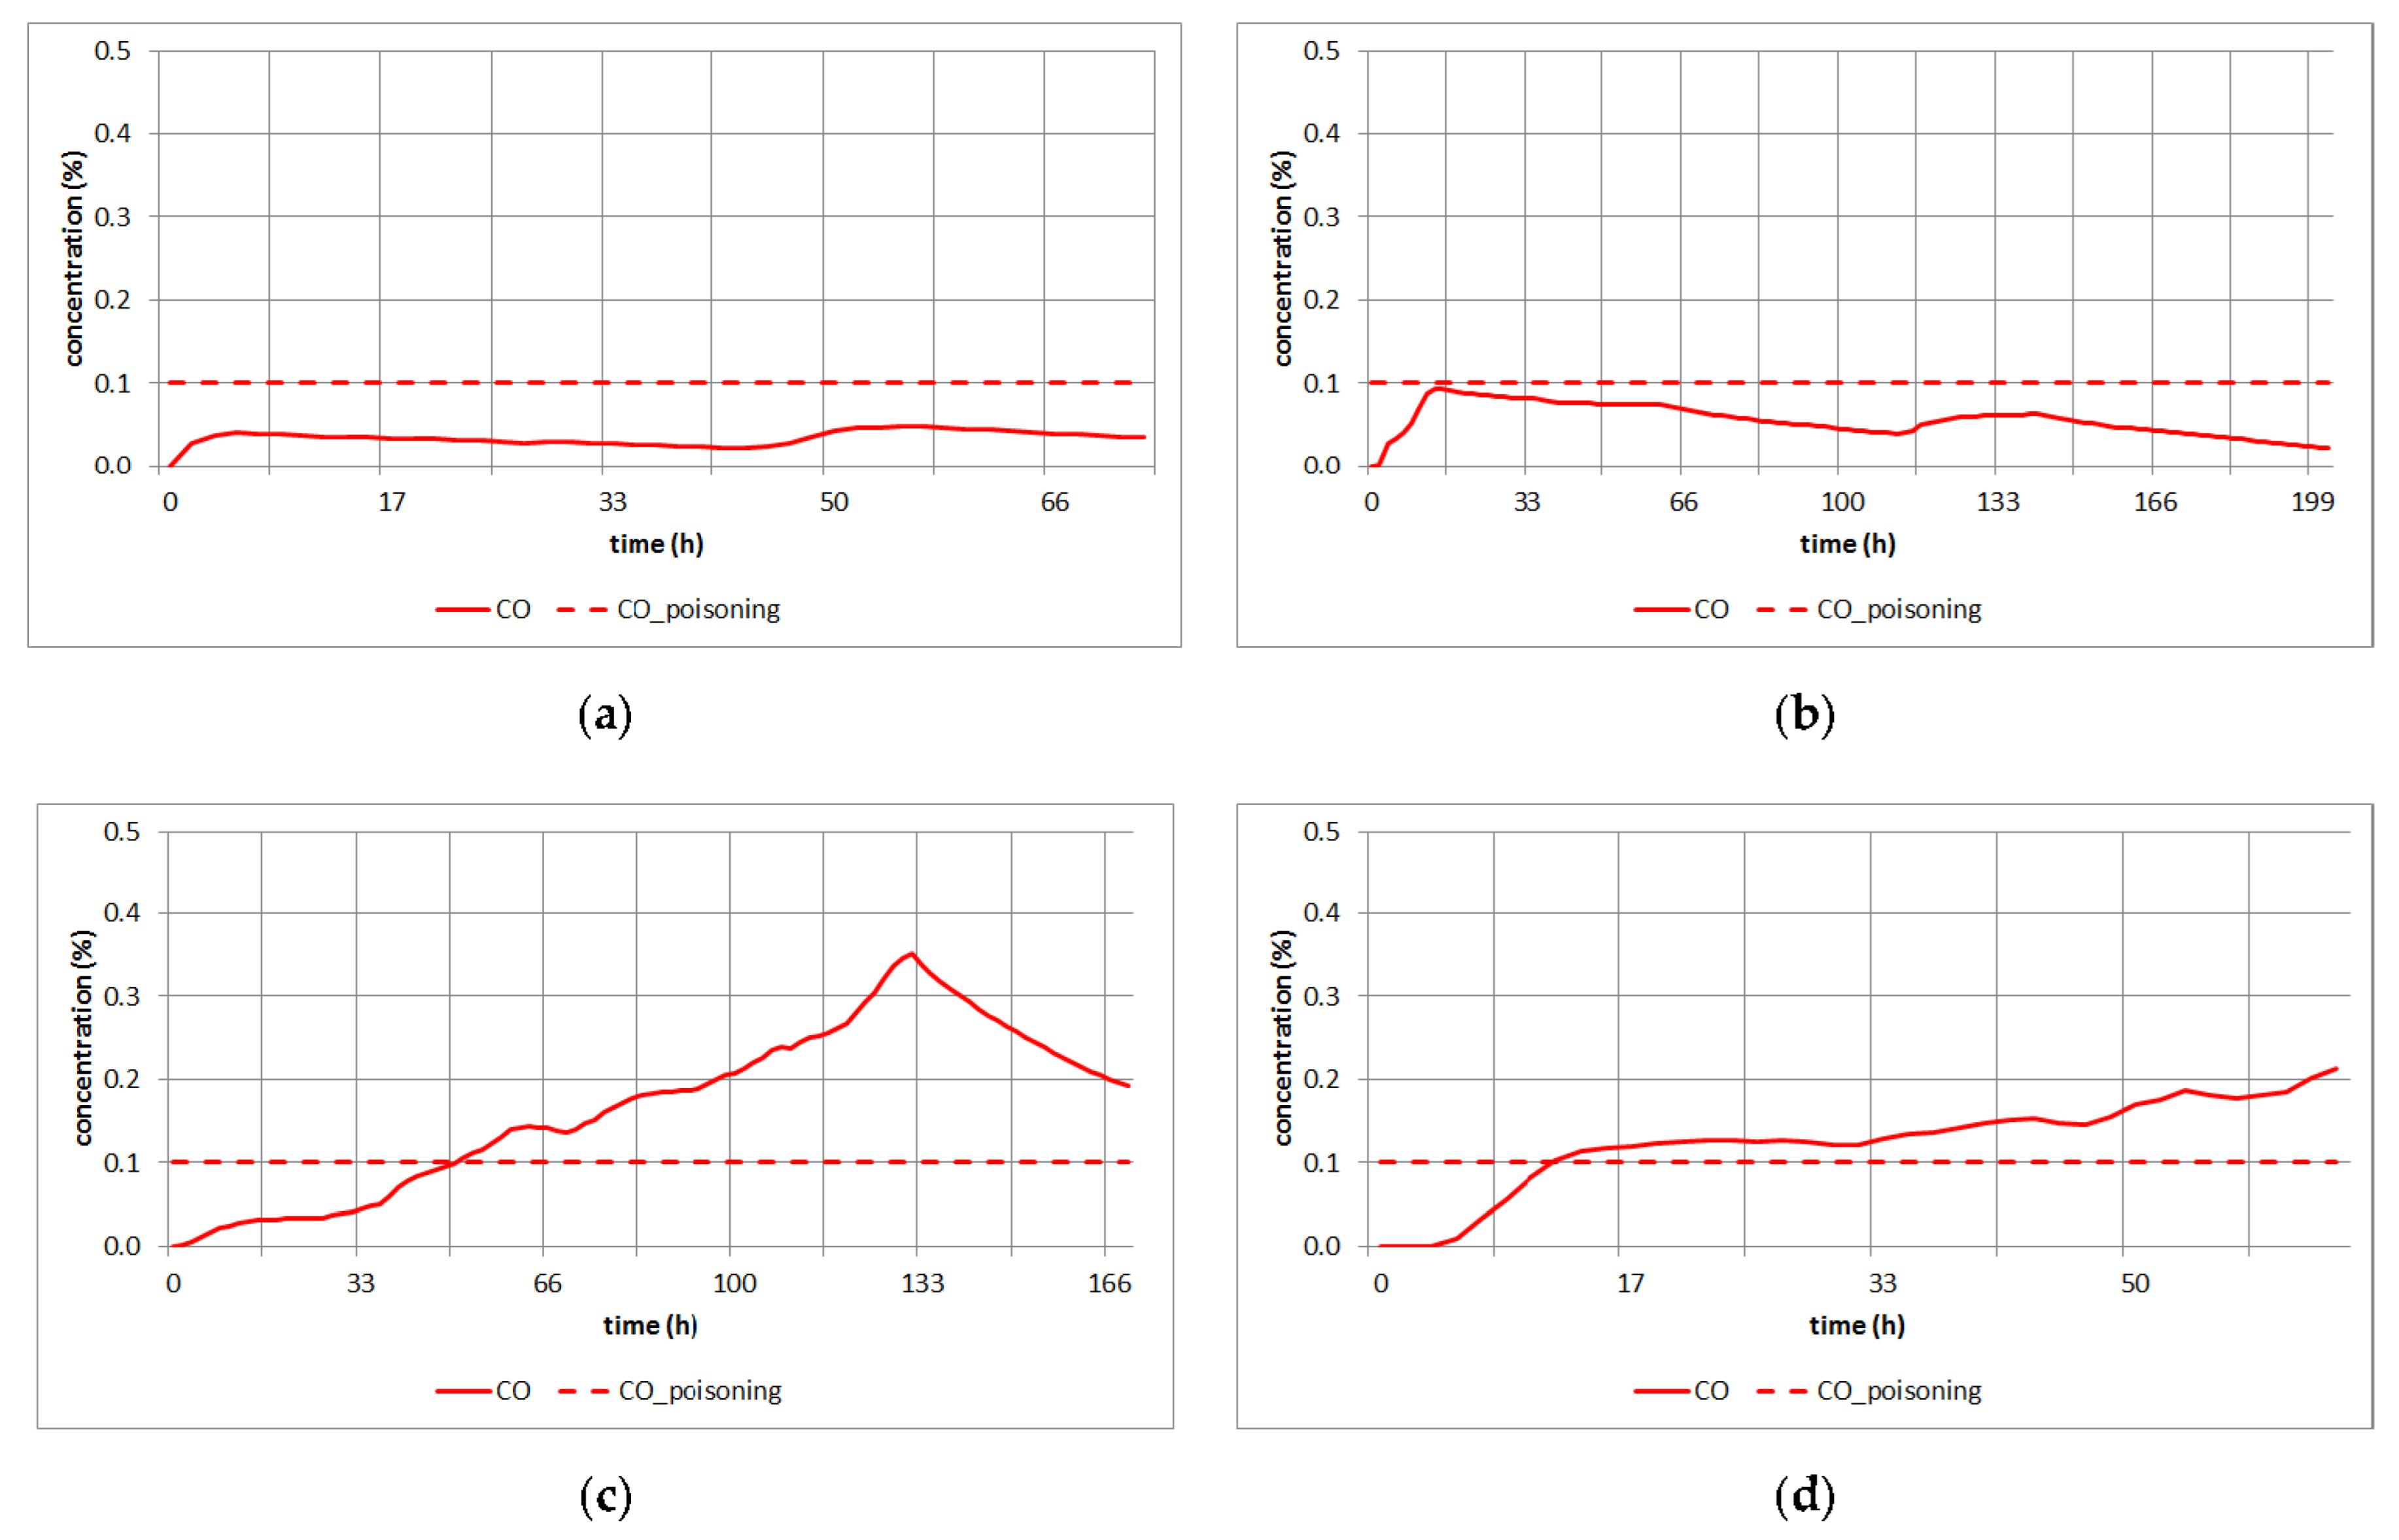
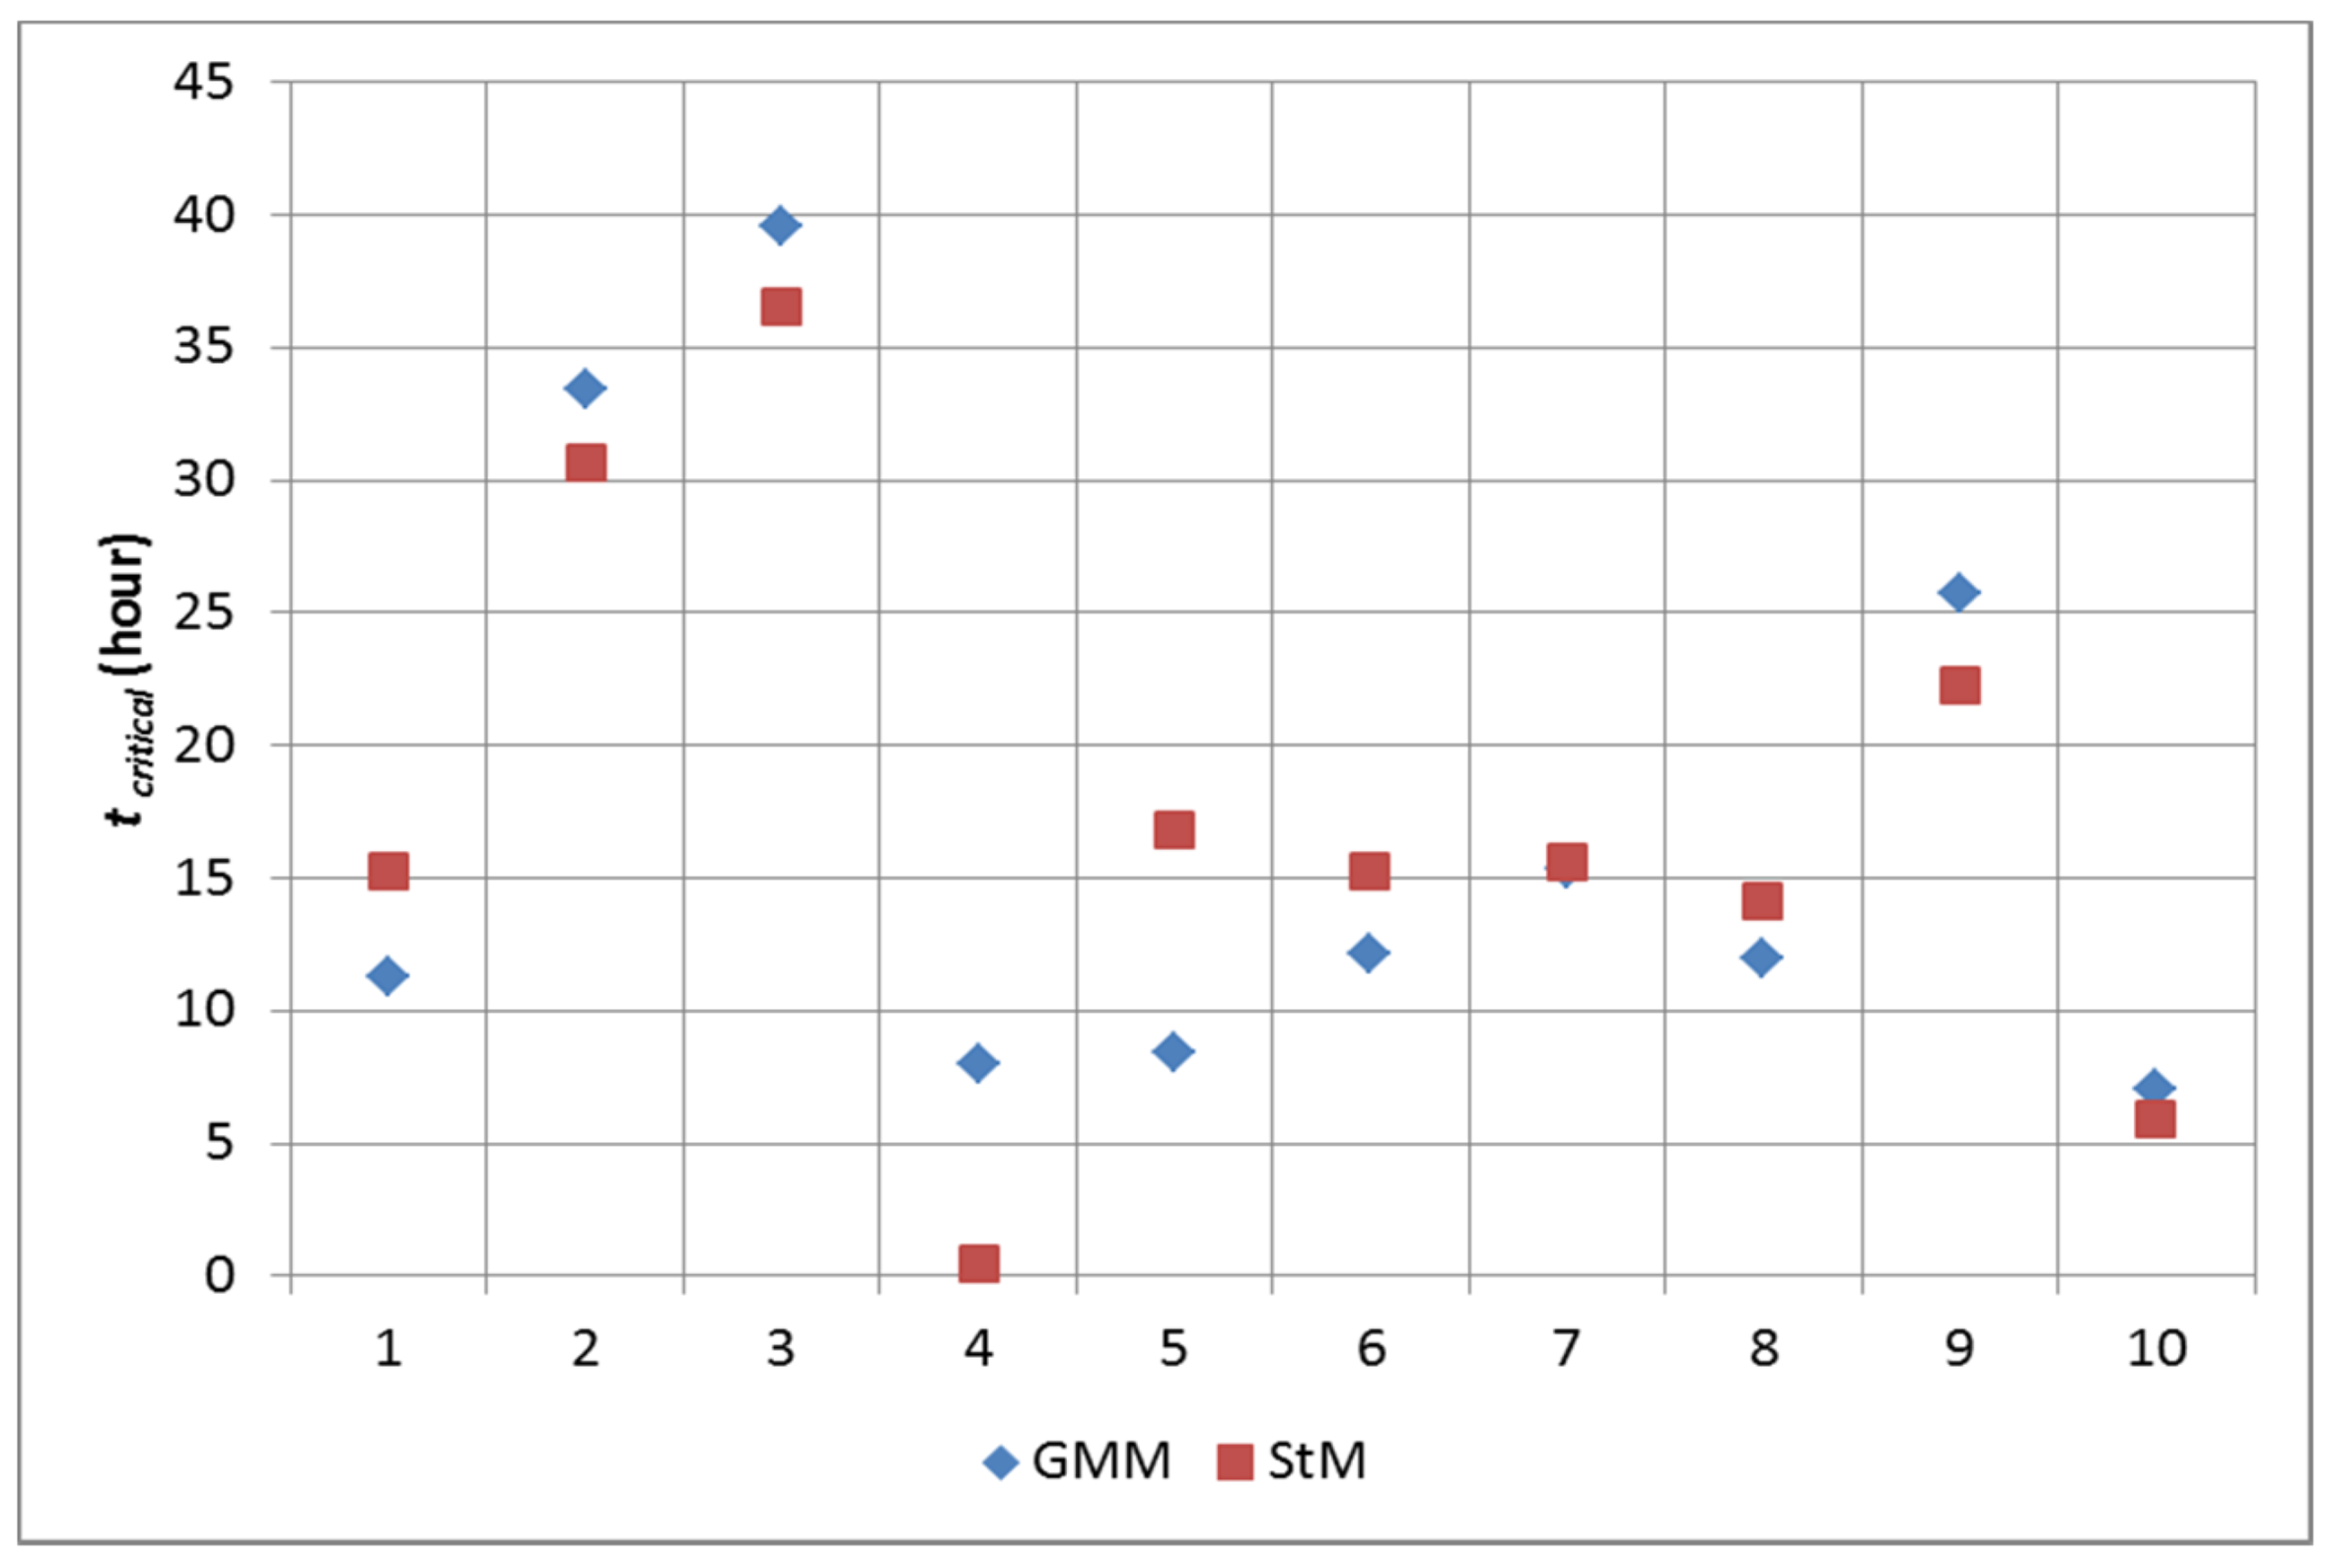
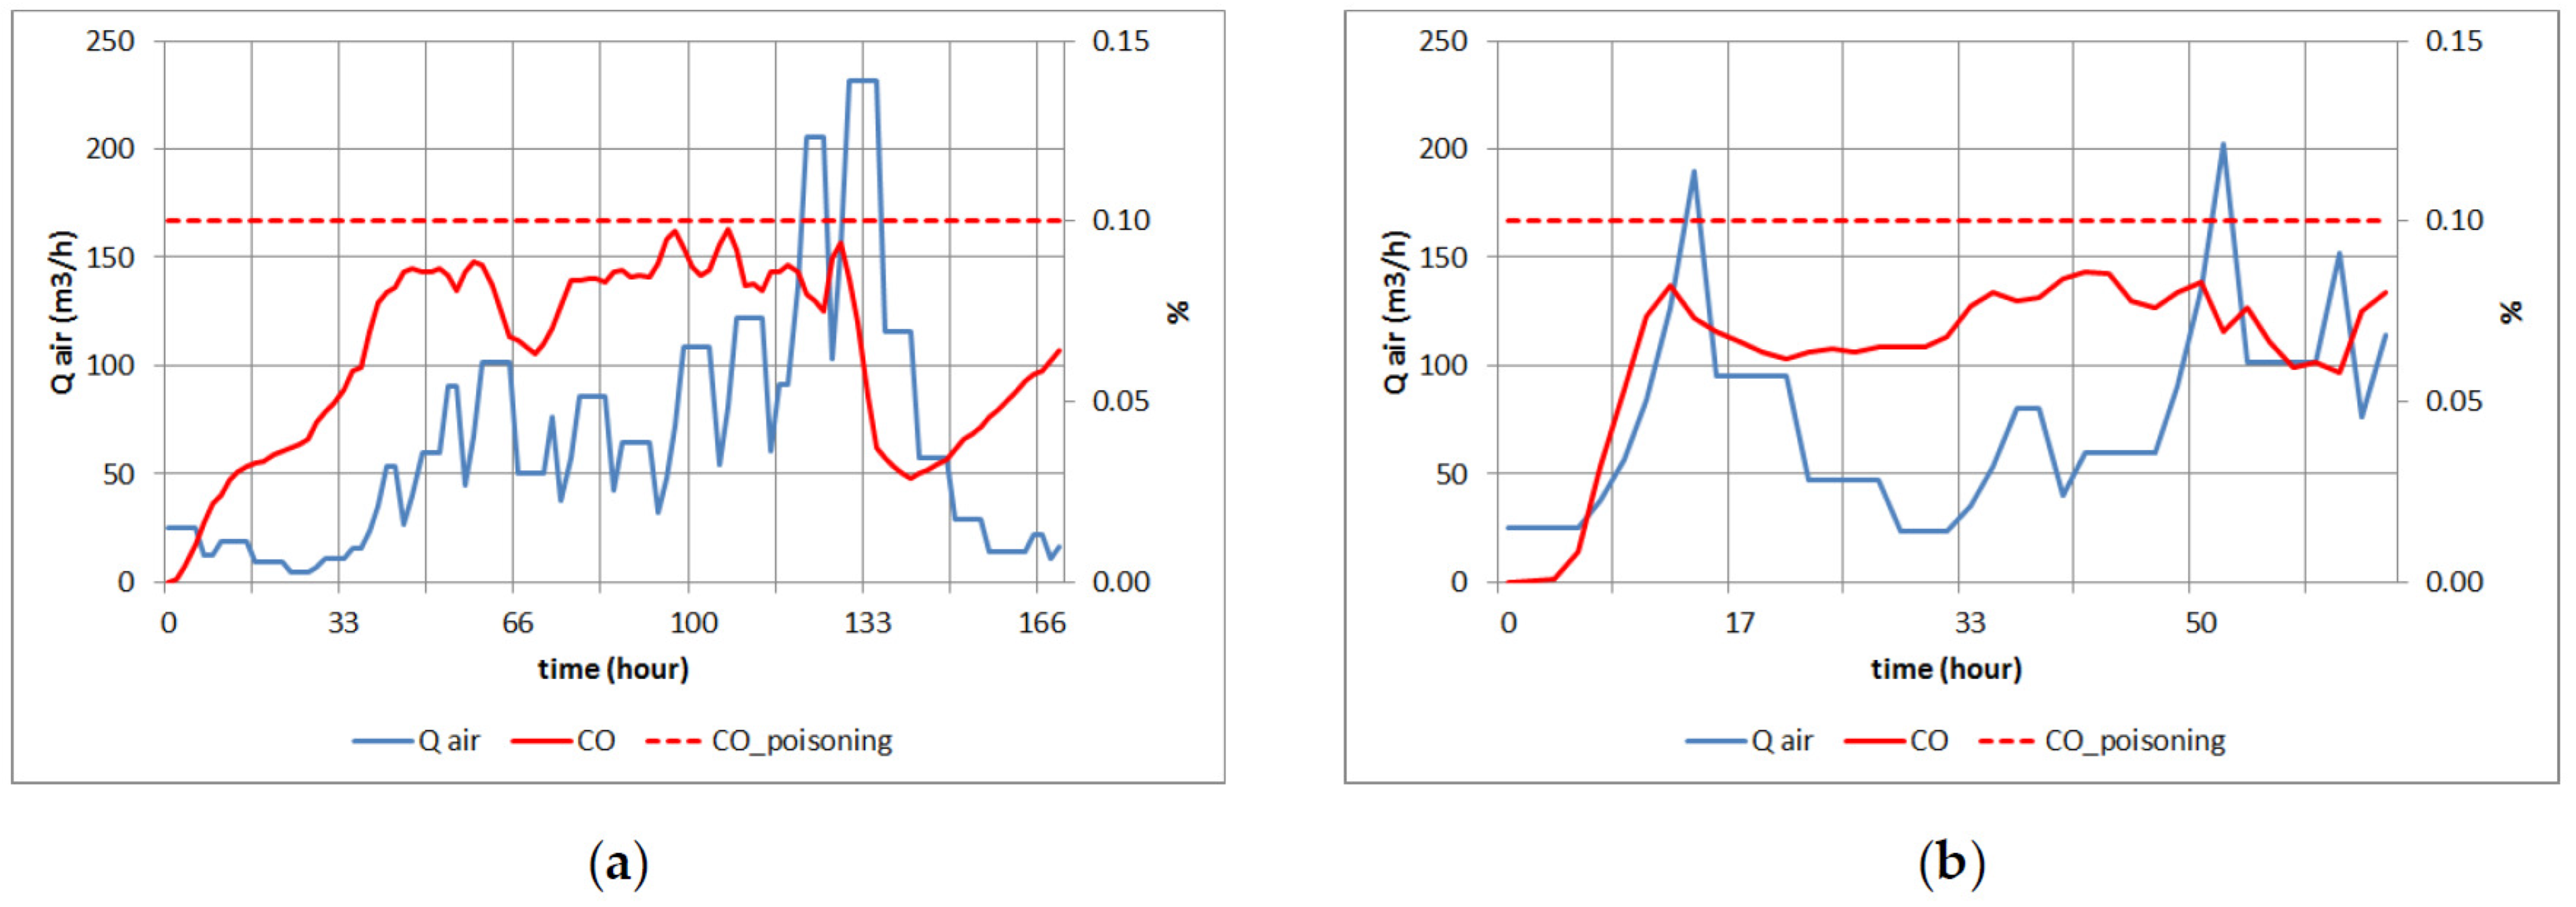


