
Diffusion of Solar PV Energy in Italy: Can Large-Scale PV Installations Trigger the Next Growth Phase?

Abstract
:1. Introduction
2. The PV Energy Market in Italy: A Summary of Incentive Programs
3. Materials and Methods
3.1. Data Description
- ;
- ;
- ;
- .
3.2. Innovation Diffusion Models: The Generalized Bass Model
3.3. Multi-Epoch Innovation Diffusion
3.4. Model Estimation
4. Results
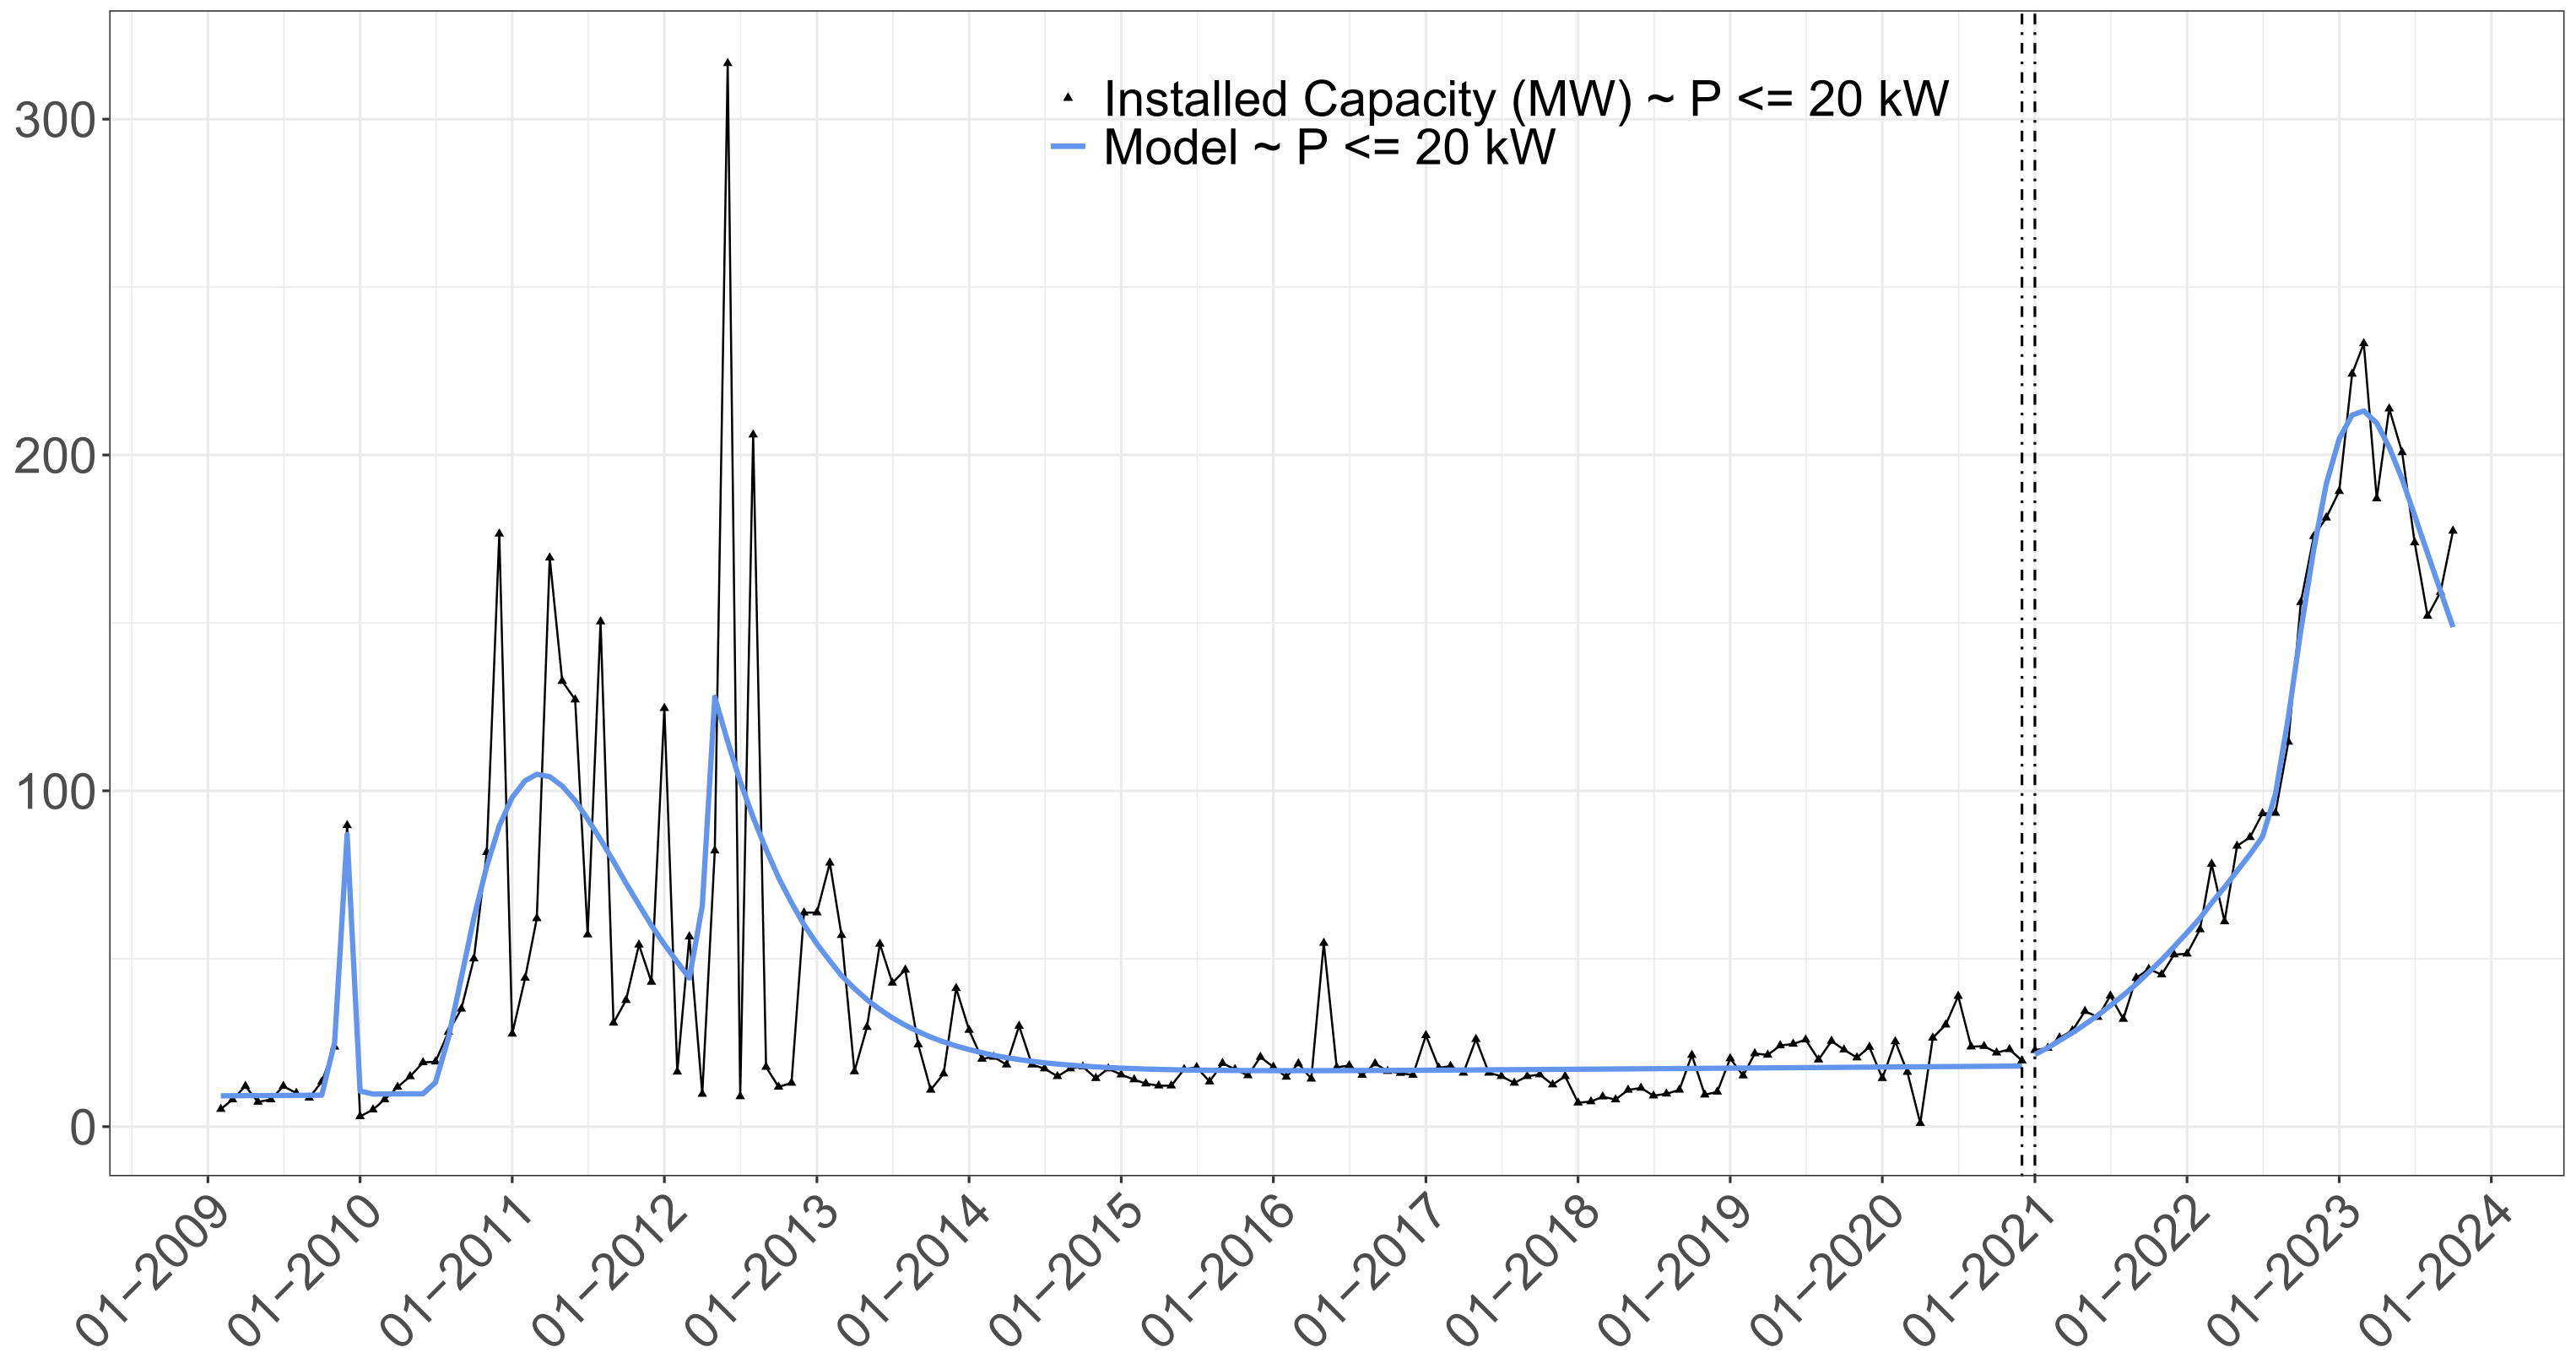
4.1. Small-Scale PV
4.1.1. Single GBM Fit
4.1.2. The Two-Epoch GBM Fit
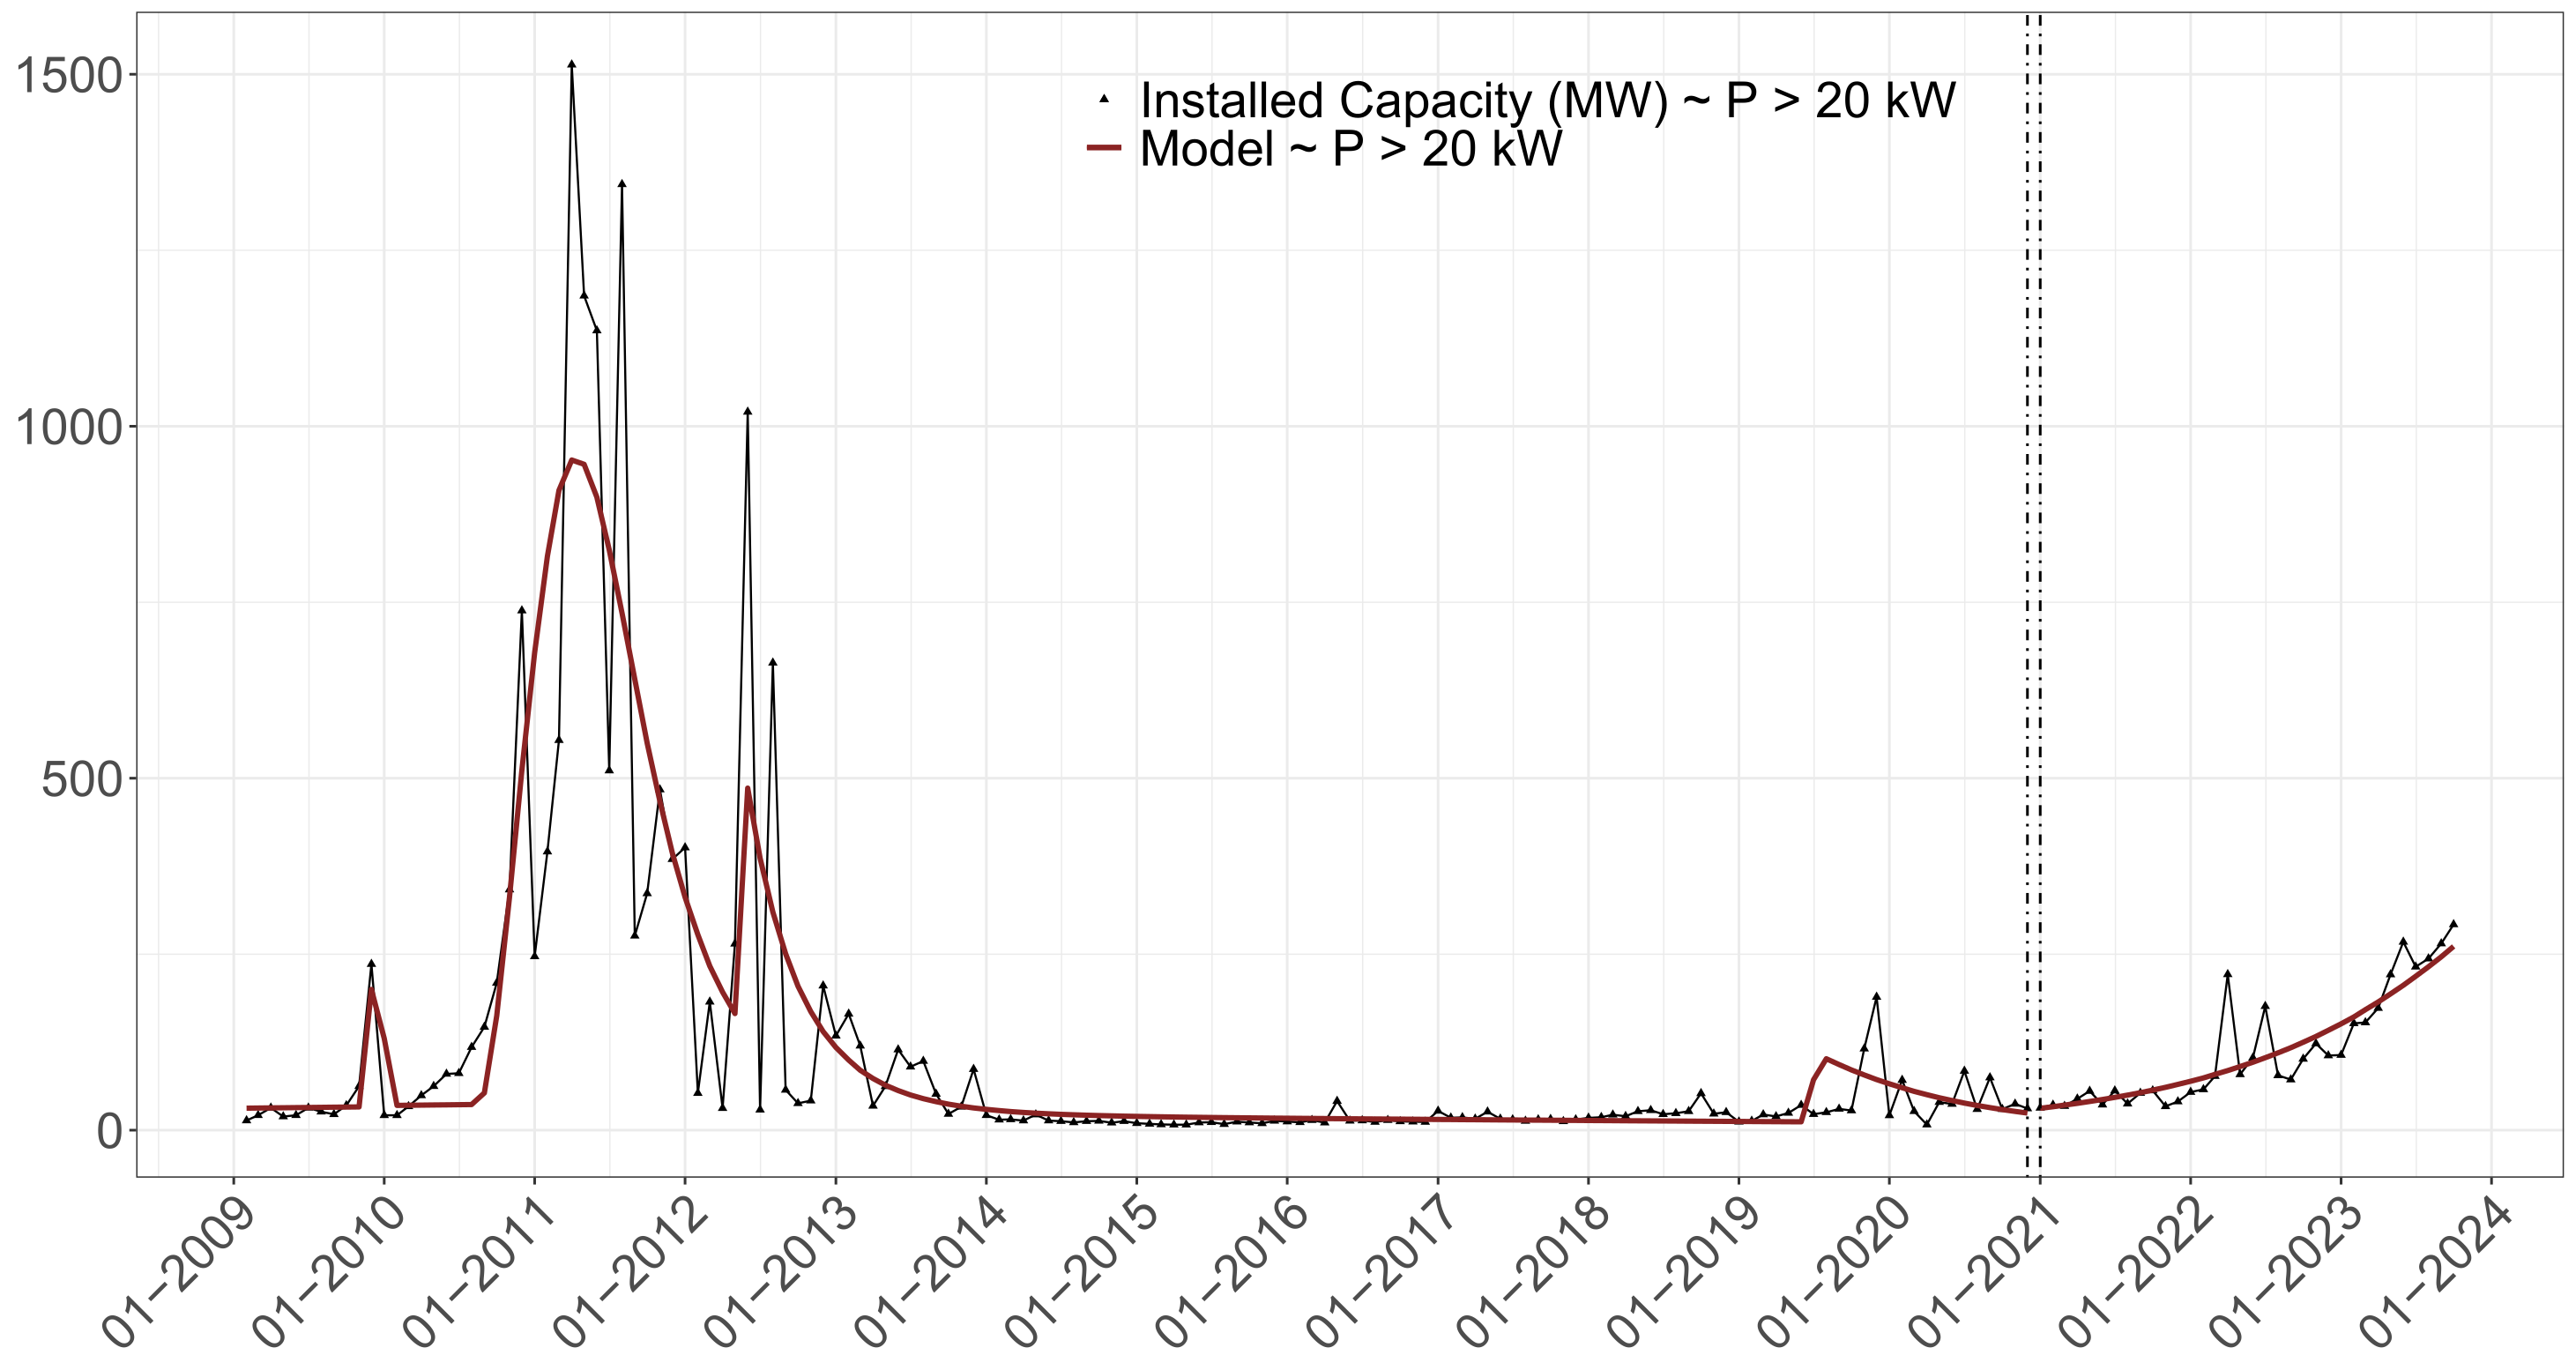
4.2. Large-Scale PV
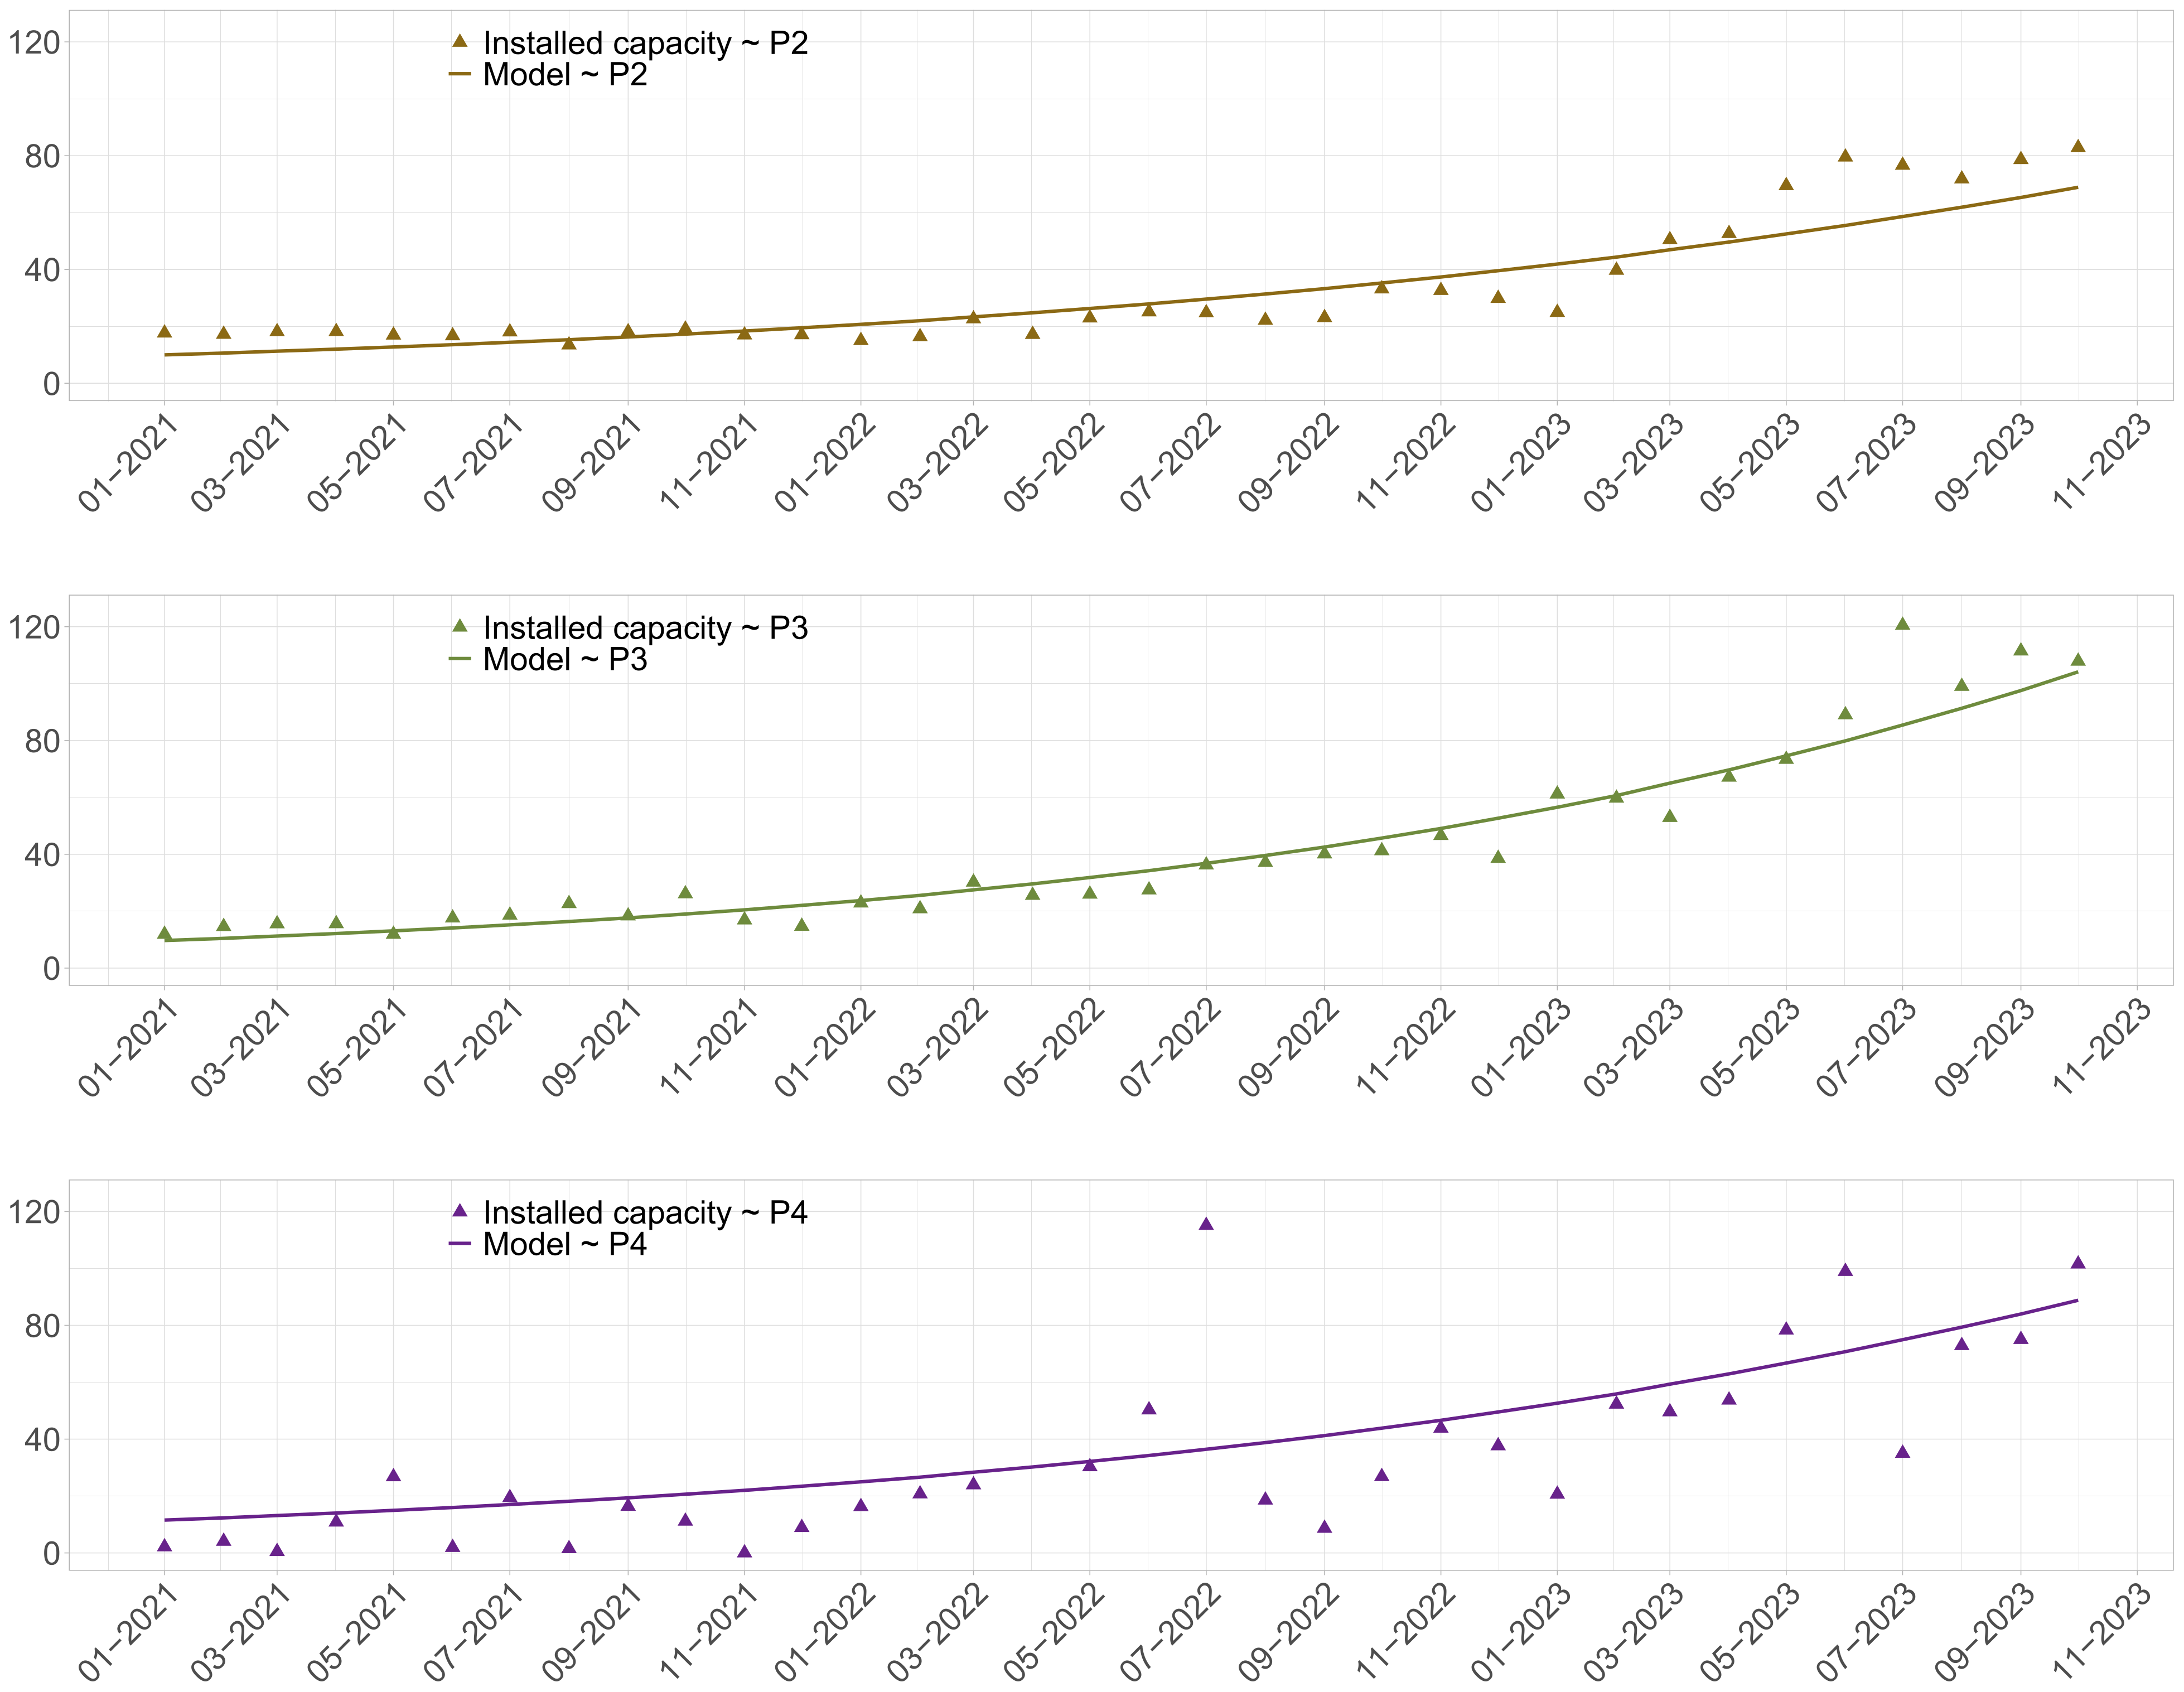
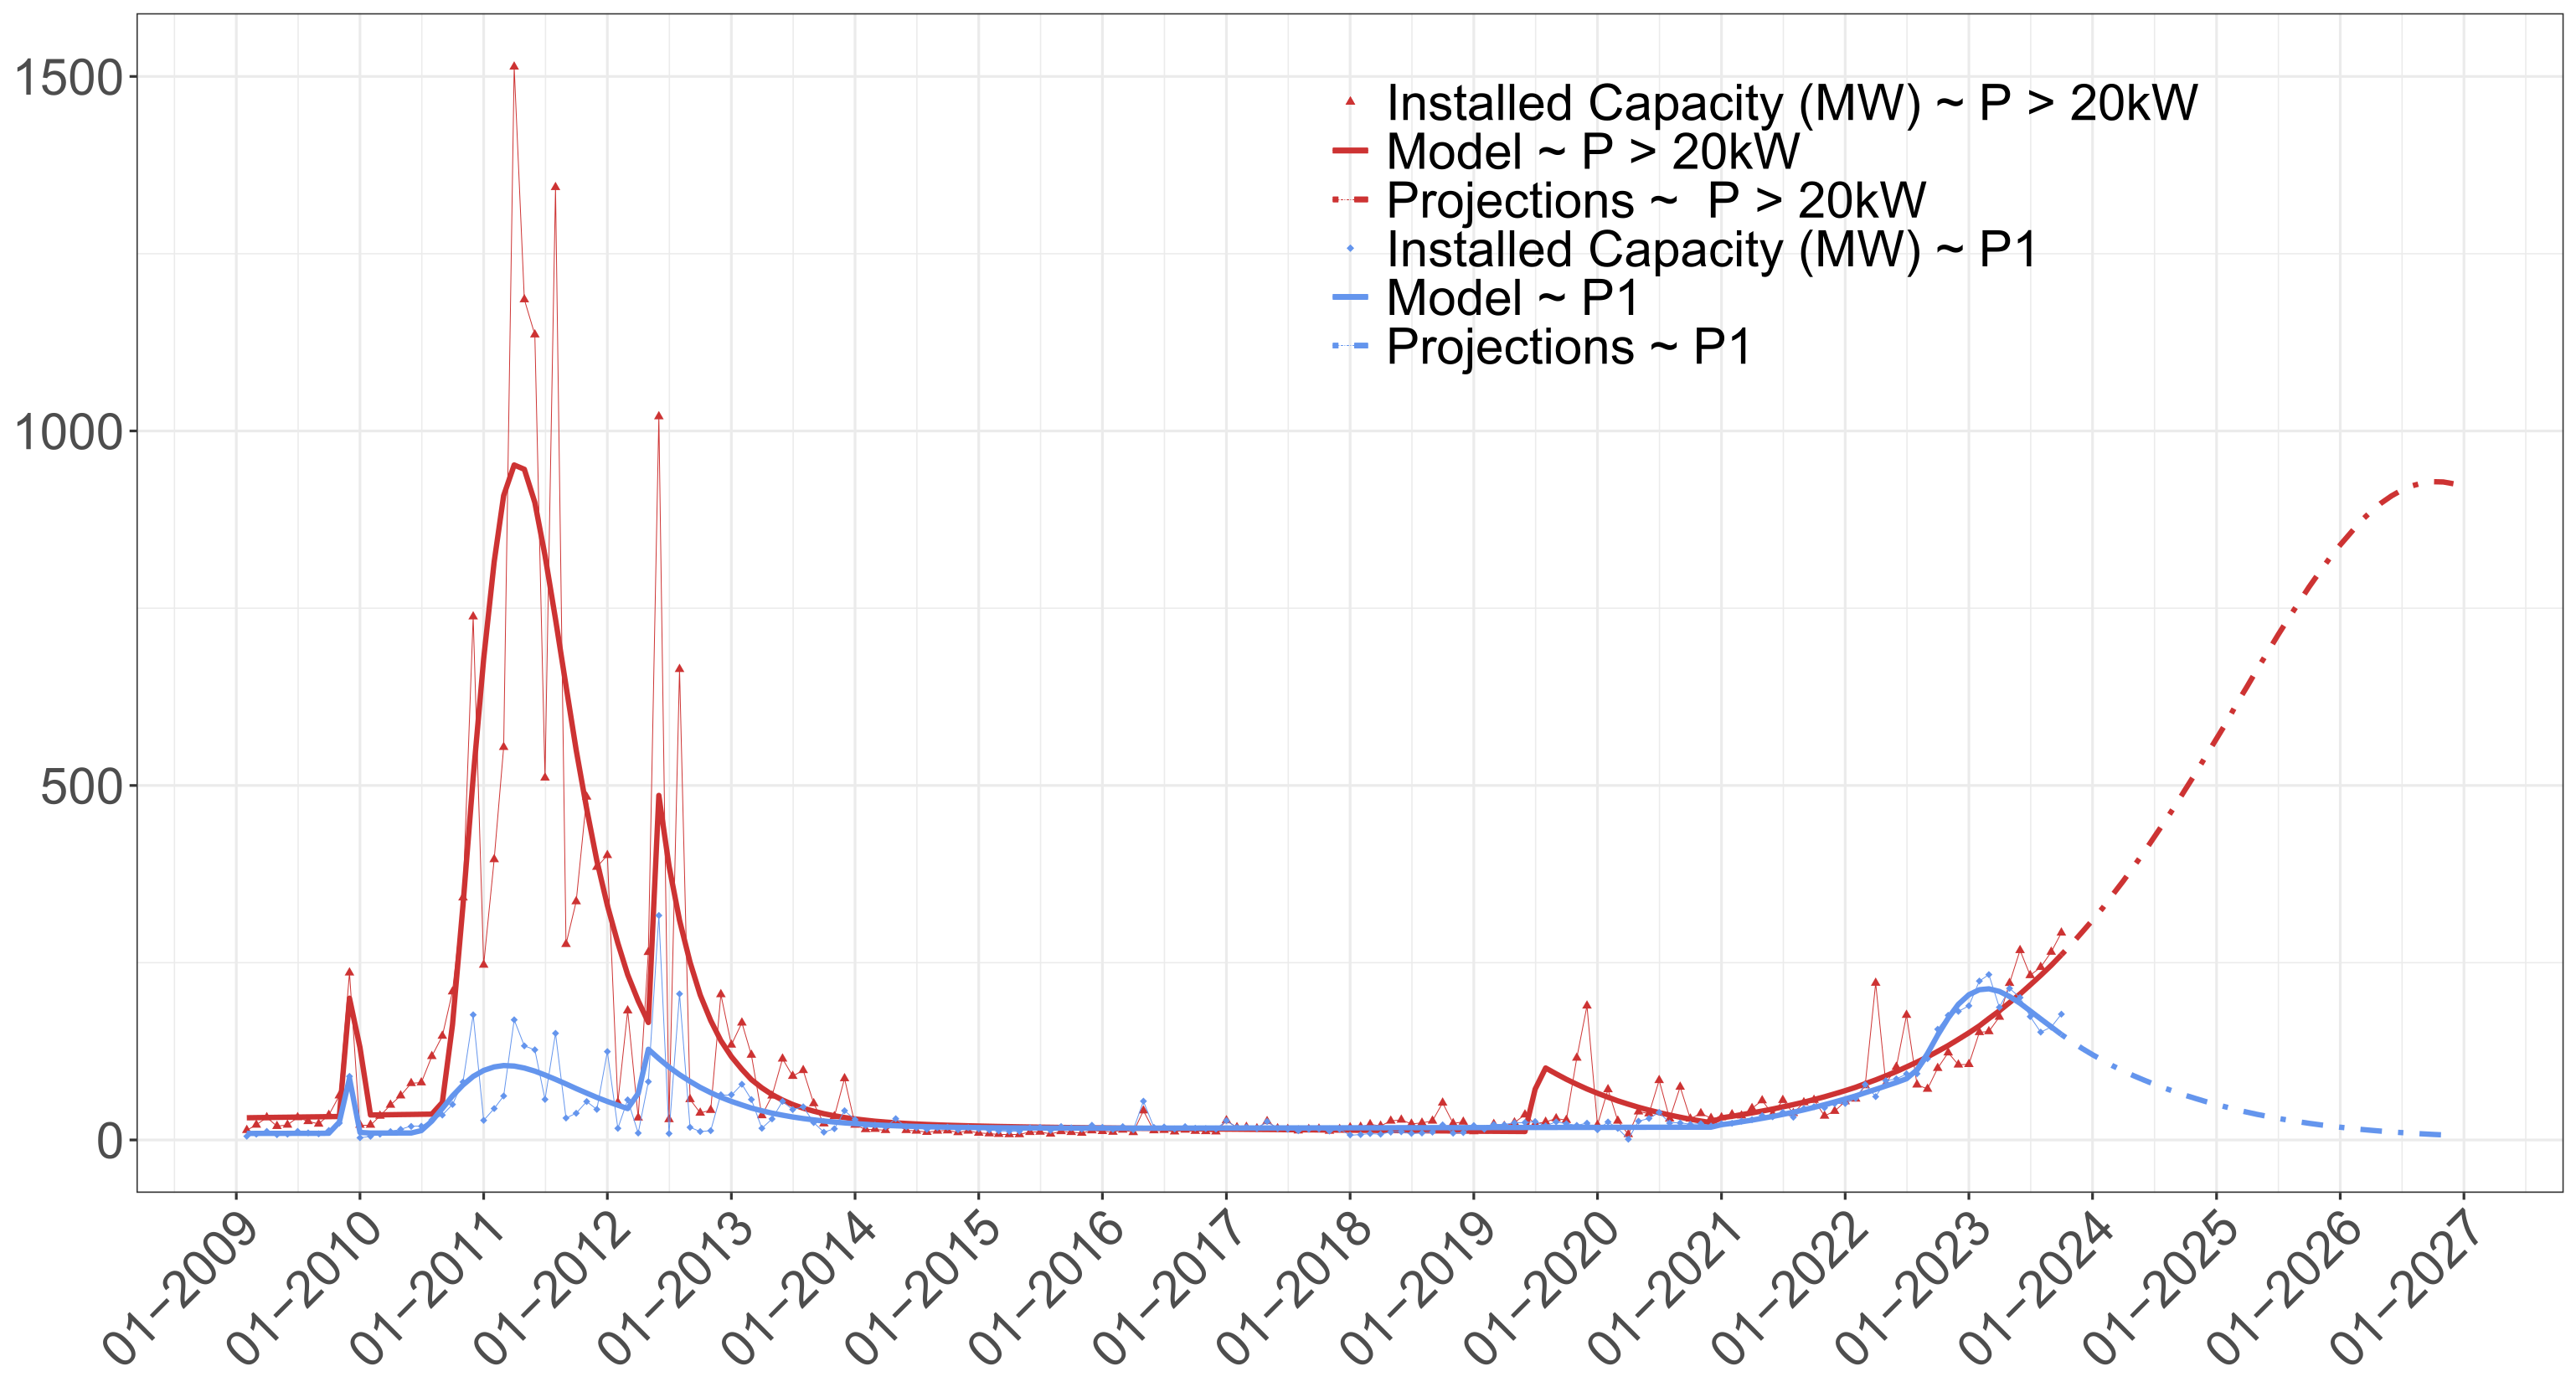
4.3. Scenarios
5. Discussion
6. Conclusions
Author Contributions
Funding
Data Availability Statement
Acknowledgments
Conflicts of Interest
References
- IEA; IRENA; UN. Breakthrough Agenda Report 2023. Available online: https://www.iea.org/reports/breakthrough-agenda-report-2023 (accessed on 10 October 2023).
- Energy Institute. Statistical Review of World Energy 2023. Available online: https://www.energyinst.org/statistical-review (accessed on 1 November 2023).
- International Energy Agency (IEA). World Energy Outlook 2022. Available online: https://www.iea.org/reports/world-energy-outlook-2022 (accessed on 1 October 2023).
- European Commission. The European Green Deal 2019. Available online: https://commission.europa.eu/strategy-and-policy/priorities-2019-2024/european-green-deal_en (accessed on 20 October 2023).
- European Commission. Italy—Draft Updated NECP 2021–2030. Available online: https://commission.europa.eu/publications/italy-draft-updated-necp-2021-2030_en (accessed on 2 November 2023).
- Nijsse, F.J.; Mercure, J.F.; Ameli, N.; Larosa, F.; Kothari, S.; Rickman, J.; Vercoulen, P.; Pollitt, H. The momentum of the solar energy transition. Nat. Commun. 2023, 14, 6542. [Google Scholar] [CrossRef]
- Alipour, M.; Salim, H.; Stewart, R.A.; Sahin, O. Predictors, taxonomy of predictors, and correlations of predictors with the decision behaviour of residential solar photovoltaics adoption: A review. Renew. Sustain. Energy Rev. 2020, 123, 109749. [Google Scholar] [CrossRef]
- Alipour, M.; Salim, H.; Stewart, R.A.; Sahin, O. Residential solar photovoltaic adoption behaviour: End-to-end review of theories, methods and approaches. Renew. Energy 2021, 170, 471–486. [Google Scholar] [CrossRef]
- Baur, L.; Uriona, M. Diffusion of photovoltaic technology in Germany: A sustainable success or an illusion driven by guaranteed feed-in tariffs? Energy 2018, 150, 289–298. [Google Scholar] [CrossRef]
- Mundaca, L.; Samahita, M. What drives home solar PV uptake? Subsidies, peer effects and visibility in Sweden. Energy Res. Soc. Sci. 2020, 60, 101319. [Google Scholar] [CrossRef]
- Colasante, A.; D’Adamo, I.; Morone, P. What drives the solar energy transition? The effect of policies, incentives and behavior in a cross-country comparison. Energy Res. Soc. Sci. 2022, 85, 102405. [Google Scholar] [CrossRef]
- Palm, A. Early adopters and their motives: Differences between earlier and later adopters of residential solar photovoltaics. Renew. Sustain. Energy Rev. 2020, 133, 110142. [Google Scholar] [CrossRef]
- Balta-Ozkan, N.; Yildirim, J.; Connor, P.M.; Truckell, I.; Hart, P. Energy transition at local level: Analyzing the role of peer effects and socio-economic factors on UK solar photovoltaic deployment. Energy Policy 2021, 148, 112004. [Google Scholar] [CrossRef]
- Wierling, A.; Zeiss, J.P.; Lupi, V.; Candelise, C.; Sciullo, A.; Schwanitz, V.J. The contribution of energy communities to the upscaling of photovoltaics in Germany and Italy. Energies 2021, 14, 2258. [Google Scholar] [CrossRef]
- Bianco, V.; Cascetta, F.; Nardini, S. Analysis of technology diffusion policies for renewable energy. The case of the Italian solar photovoltaic sector. Sustain. Energy Technol. Assess. 2021, 46, 101250. [Google Scholar] [CrossRef]
- Daniele, F.; Pasquini, A.; Clò, S.; Maltese, E. Unburdening regulation: The impact of regulatory simplification on photovoltaic adoption in Italy. Energy Econ. 2023, 125, 106844. [Google Scholar] [CrossRef]
- Danielis, R.; Scorrano, M.; Massi Pavan, A.; Blasuttigh, N. Simulating the Diffusion of Residential Rooftop Photovoltaic, Battery Storage Systems and Electric Cars in Italy. An Exploratory Study Combining a Discrete Choice and Agent-Based Modelling Approach. Energies 2023, 16, 557. [Google Scholar] [CrossRef]
- Marchetti, C. Society as a learning system: Discovery, invention, and innovation cycles revisited. Technol. Forecast. Soc. Chang. 1980, 18, 267–282. [Google Scholar] [CrossRef]
- Rogers, E.M. Diffusion of Innovations, 5th ed.; Free Press: New York, NY, USA, 2003. [Google Scholar]
- Bass, F.M. A new product growth for model consumer durables. Manag. Sci. 1969, 15, 215–227. [Google Scholar] [CrossRef]
- Guseo, R.; Dalla Valle, A.; Guidolin, M. World Oil Depletion Models: Price effects compared with strategic or technological interventions. Technol. Forecast. Soc. Chang. 2007, 74, 452–469. [Google Scholar] [CrossRef]
- Islam, T. Household level innovation diffusion model of photo-voltaic (PV) solar cells from stated preference data. Energy Policy 2007, 65, 340–350. [Google Scholar] [CrossRef]
- Da Silva, H.B.; Uturbey, W.; Lopes, B.M. Market diffusion of household PV systems: Insights using the Bass model and solar water heaters market data. Energy Sustain Dev. 2020, 55, 210–220. [Google Scholar] [CrossRef]
- Bass, F.M.; Krishnan, T.V.; Jain, D.C. Why the Bass model fits without decision variables. Mark. Sci. 1994, 13, 203–223. [Google Scholar] [CrossRef]
- Bunea, A.M.; Della Posta, P.; Guidolin, M.; Manfredi, P. What do adoption patterns of solar panels observed so far tell about governments’ incentive? insight from diffusion models. Technol. Forecast. Soc. Chang. 2020, 160, 120240. [Google Scholar] [CrossRef]
- Guseo, R. Interventi Strategici e Aspetti Competitivi Nel Ciclo di Vita di Innovazioni. Strategic Interventions and Competitive Aspects in Innovation Life Cycle; Department of Statistical Sciences University of Padua Working Paper Series No.11; University of Padua: Padova, Italy, 2004; Available online: https://core.ac.uk/download/pdf/31144436.pdf (accessed on 10 October 2023).
- Boeri, T.; Perotti, R. La Grande Abbuffata, 1st ed.; Feltrinelli Editore: Feltrinelli, Italy, 2023. [Google Scholar]
- D.M. 28 July 2005. Italian Ministry for Production Activities. Criteri per l’Incentivazione della Produzione di Energia Elettrica Mediante Conversione Fotovoltaica della Fonte Solare. Available online: https://www.gazzettaufficiale.it/eli/id/2005/08/05/05A07837/sg (accessed on 10 October 2023).
- Council Directive 2010/77/EC on the Promotion of Electricity Produced from Renewable Energy Sources in the Internal Electricity Market. 2001. Official Journal L.283/33. Available online: https://eur-lex.europa.eu/legal-content/EN/TXT/PDF/?uri=CELEX:32010L0031 (accessed on 13 January 2024).
- D.M. 19/02/2007. Italian Ministry for Economic Development. Criteri e Modalita’ per Incentivare la Produzione di Energia Elettrica Mediante Conversione Fotovoltaica della Fonte Solare, in Attuazione dell’Articolo 7 del Decreto Legislativo 29 Dicembre 2003, n. 387. Available online: https://www.gazzettaufficiale.it/eli/id/2007/02/23/07A01710/sg (accessed on 10 October 2023).
- L. 129/2010. Conversione in Legge, Con Modificazioni, del Decreto-Legge 8 Luglio 2010, n. 105, Recante Misure Urgenti in Materia di Energia. Proroga di Termine per l’Esercizio di Delega Legislativa in Materia di Riordino del Sistema Degli Incentivi. Available online: https://www.gazzettaufficiale.it/eli/gu/2010/08/18/192/sg/pdf (accessed on 10 October 2023).
- Kavlak, G.; McNerney, J.; Trancik, J.E. Evaluating the causes of cost reduction in photovoltaic modules. Energy Policy 2018, 123, 700–710. [Google Scholar] [CrossRef]
- D.M. 6/08/2010. Italian Ministry for Economic Development. Incentivazione della Produzione di Energia Elettrica Mediante Conversione Fotovoltaica della Fonte Solare. Available online: https://www.mase.gov.it/normative/decreto-interministeriale-6-agosto-2010-incentivazione-della-produzione-di-energia (accessed on 10 October 2023).
- D.M. 5/05/2011. Italian Ministry for Economic Development. Incentivazione della Produzione di Energia Elettrica da Impianti Solari Fotovoltaici. Available online: www.gazzettaufficiale.it/eli/id/2011/05/12/11A06083/sg (accessed on 10 October 2023).
- D.M. 5/07/2012. Italian Ministry for Economic Development. Attuazione dell’Art. 25 del Decreto Legislativo 3 Marzo 2011, n. 28, Recante Incentivazione della Produzione di Energia Elettrica da Impianti Solari Fotovoltaici (c.d. Quinto Conto Energia). Available online: www.gazzettaufficiale.it/eli/id/2012/07/10/12A07629/sg (accessed on 11 October 2023).
- Campoccia, A.; Dusonchet, L.; Telaretti, E.; Zizzo, G. An analysis of feed-in tariffs for solar PV in six representative countries of the European Union. Sol.Energy 2014, 107, 530–542. [Google Scholar] [CrossRef]
- Di Dio, V.; Favuzza, S.; La Cascia, D.; Massaro, F.; Zizzo, G. Critical assessment of support for the evolution of photovoltaics and feed-in tariff (s) in Italy. Sustain. Energy Technol. Assess. 2015, 9, 95–104. [Google Scholar] [CrossRef]
- Poponi, D.; Basosi, R.; Kurdgelashvili, L. Subsidization cost analysis of renewable energy deployment: A case study on the Italian feed-in tariff programme for photovoltaics. Energy Policy 2021, 154, 112297. [Google Scholar] [CrossRef]
- D.L. 63/2013. Disposizioni Urgenti per il Recepimento della Direttiva 2010/31/UE del Parlamento Europeo e del Consiglio del 19 Maggio 2010, Sulla Prestazione Energetica nell’Edilizia per la Definizione delle Procedure d’Infrazione Avviate Dalla Commissione Europea, Nonche’ Altre Disposizioni in Materia di Coesione Sociale. Available online: www.gazzettaufficiale.it/eli/id/2013/06/05/13G00107/sg (accessed on 12 October 2023).
- Council directive 2010/31/EC on the Energy Performance of Buildings. 2010. Official Journal L.153/13. Available online: https://eur-lex.europa.eu/legal-content/EN/TXT/PDF/?uri=CELEX:32001L0077 (accessed on 13 January 2024).
- D.L. 34/2020. Misure Urgenti in Materia di Salute, Sostegno al Lavoro e all’Economia, Nonche’ di Politiche Sociali Connesse all’Emergenza Epidemiologica da COVID-19. Available online: www.gazzettaufficiale.it/eli/id/2020/05/19/20G00052/sg (accessed on 9 January 2024).
- L. 208/2015. Disposizioni per la Formazione del Bilancio Annuale e Pluriennale dello Stato (Legge di Stabilita’ 2016). Available online: www.gazzettaufficiale.it/eli/id/2015/12/30/15G00222/sg (accessed on 12 October 2023).
- D.M. 4/07/2019. Italian Ministry for Economic Development. Incentivazione dell’Energia Elettrica Prodotta dagli Impianti Eolici on Shore, Solari Fotovoltaici, Idroelettrici e a Gas Residuati dei Processi di Depurazione. Available online: www.gazzettaufficiale.it/eli/id/2019/08/09/19A05099/sg (accessed on 12 October 2023).
- L. 160/2019. Bilancio di Previsione dello Stato per l’Anno Finanziario 2020 e Bilancio Pluriennale per il Triennio 2020–2022. Available online: www.gazzettaufficiale.it/eli/id/2019/12/30/19G00165/sg (accessed on 9 January 2024).
- Gestore Servizi Energetici (GSE). Archivio Rapporti Statistici—Solare Fotovoltaico. Available online: https://www.gse.it/dati-e-scenari/statistiche (accessed on 12 December 2023).
- TERNA. Renewable Sources—Consistenza Fonti Rinnovabili. Available online: https://www.terna.it/it/sistema-elettrico/dispacciamento/fonti-rinnovabili (accessed on 12 December 2023).
- Rao, K.U.; Kishore, V.V.N. A review of technology diffusion models with special reference to renewable energy technologies. Renew. Sustain. Energy Rev. 2010, 14, 1070–1078. [Google Scholar] [CrossRef]
- Petropoulos, F.; Apiletti, D.; Assimakopoulos, V.; Babai, M.Z.; Barrow, D.K.; Taieb, S.B.; Ziel, F. Forecasting: Theory and practice. Int. J. Forecast. 2022, 38, 705–871. [Google Scholar] [CrossRef]
- Guidolin, M.; Manfredi, P. Innovation diffusion processes: Concepts, models, and predictions. Annu. Rev. Stat. Appl. 2023, 10, 451–473. [Google Scholar] [CrossRef]
- Guidolin, M.; Mortarino, C. Cross-country diffusion of photovoltaic systems: Modelling choices and forecasts for national adoption patterns. Technol. Forecast. Soc. Chang. 2010, 77, 279–296. [Google Scholar] [CrossRef]
- Bunea, A.M.; Guidolin, M.; Manfredi, P.; Della Posta, P. Diffusion of solar PV energy in the UK: A comparison of sectoral patterns. Forecasting 2022, 4, 456–476. [Google Scholar] [CrossRef]
- Guidolin, M. Innovation Diffusion Models: Theory and Practice, 1st ed.; John Wiley & Sons: New York, NY, USA, 2023. [Google Scholar]
- Akaike, H. International Encyclopedia of Statistical Science; Springer: Berlin/Heidelberg, Germany, 2011; p. 25. [Google Scholar]
- Gestore Servizi Energetici (GSE). Rapporti delle Attività: Relazione delle Attività 2012 sull’Incentivazione degli Impianti Fotovoltaici. Available online: https://www.gse.it/documenti (accessed on 28 November 2023).
- International Energy Agency (IEA). Renewables 2022. Available online: https://www.iea.org/reports/renewables-2022 (accessed on 10 November 2023).
- Palladino, D.; Calabrese, N. Energy Planning of Renewable Energy Sources in an Italian Context: Energy Forecasting Analysis of Photovoltaic Systems in the Residential Sector. Energies 2023, 16, 3042. [Google Scholar] [CrossRef]
- Jäger-Waldau, A.; Kougias, I.; Taylor, N.; Thiel, C. How photovoltaics can contribute to GHG emission reductions of 55% in the EU by 2030. Renew. Sustain. Energy Rev. 2020, 126, 109836. [Google Scholar] [CrossRef]
- Waldau, J.A. Snapshot of Photovoltaics—May 2023. EPJ Photovoltaics 2023, 14, 23. [Google Scholar] [CrossRef]
- Council Directive 2009/29/EC Amending Directive 2003/87/EC So as to Improve and Extend the Greenhouse Gas Emission Allowance Trading Scheme of the Community. 2009. Official Journal L.140/63. Available online: https://eur-lex.europa.eu/legal-content/EN/TXT/PDF/?uri=CELEX:32009L0029 (accessed on 14 January 2024).
- Council Directive 2023/2413 Amending Directive (EU) 2018/2001, Regulation (EU) 2018/1999 and Directive 98/70/EC as Regards the Promotion of Energy from Renewable Sources, and Repealing Council Directive (EU) 2015/652. Available online: https://eur-lex.europa.eu/legal-content/EN/TXT/PDF/?uri=OJ:L_202302413 (accessed on 14 January 2024).
- Biondi, T.; Moretto, M. Solar Grid Parity dynamics in Italy: A real option approach. Energy 2015, 80, 293–302. [Google Scholar] [CrossRef]


| Policy | Epoch | Target | Key Features |
|---|---|---|---|
|
Energy Bill 1 Gov. Decree Jul. 2005 [28] | 2005–2007 |
|
|
|
Energy Bill 2 Gov. Decree Feb. 2007 [30] | 2007–2009 |
| |
|
Salva Alcoa Act Gov. Decree Sept. 2010 [31] | 2010–2011 |
| |
| Energy Bill 3 Gov. Decree Oct. 2010 [33] | 2010–2011 |
| |
|
Energy Bill 4 Gov. Decree Jul. 2011 [34] | 2011–2012 |
| |
|
Energy Bill 5 Gov. Decree Sept. 2012 [35] | 2012–2013 |
| |
|
Ecobonus Gov. Decree Aug. 2013 [39] | 2013–2024 * |
|
|
|
Super Depreciation Gov. Decree Dec. 2015 [42] | 2016–2019 |
|
|
|
FER 1 Gov. Decree Sept. 2019 [43] | 2019–2022 |
|
|
|
New Tax Credit Gov. Decree Dec. 2019 [44] | 2020–2024 * |
|
|
|
Nuova Sabatini Gov. Decree Dec. 2019 [44] | 2020–2024 * |
|
|
|
Superbonus 110% Gov. Decree Jul. 2020 [41] | 2020–2024 * |
|
|
| GBM (five shocks: F2 + F4 + F2 + F4 + F3) | MSE = 806 | AIC = 1221 | = 0.9998 | ||
| Parameter | Estimate | Std. Error | Lower C.I. | Upper C.I. | p-value |
| m | 9773 | 1426 | 6979 | 12,568 | <0.001 *** |
| p | 0.0012 | 0.0002 | 0.0007 | 0.0016 | <0.001 *** |
| q | 0.0042 | 0.0008 | 0.0026 | 0.0058 | <0.001 *** |
| 10.0 | 27.4 | −43.7 | 63.8 | 0.715 | |
| 2.480 | 70.356 | −135.416 | 140.376 | 0.972 | |
| 12.734 | 359.325 | −691.530 | 716.998 | 0.972 | |
| 17.2 | 0.5 | 16.2 | 18.2 | <0.001 *** | |
| 0.256 | 0.017 | 0.222 | 0.290 | <0.001 *** | |
| 0.821 | 0.162 | 0.504 | 1.137 | <0.001 *** | |
| 38.8 | 0.273 | 38.3 | 39.4 | <0.001 *** | |
| 0.143 | 0.009 | 0.126 | 0.160 | <0.001 *** | |
| 6.767 | 0.554 | 5.681 | 7.854 | <0.001 *** | |
| 127.6 | 0.9 | 125.8 | 129.4 | <0.001 *** | |
| 0.0002 | 0.00001 | 0.00018 | 0.00022 | <0.001 *** | |
| 0.0031 | 0.0002 | 0.0027 | 0.0035 | <0.001 *** | |
| 161.2 | 0.8 | 159.7 | 162.7 | <0.001 *** | |
| 0.074 | 0.078 | −0.067 | 0.215 | 0.304 | |
| 2.260 | 0.728 | 0.834 | 3.687 | 0.002 ** | |
| GBM (four shocks: F2 + F4 + F2) | MSE = 1137 | AIC = 1030 | = 0.9994 | ||
| Parameter | Estimate | Std. Error | Lower C.I. | Upper C.I. | p-value |
| m | 7087 | 709 | 5696 | 8477 | <0.001 *** |
| p | 0.0015 | 0.0003 | 0.0010 | 0.0020 | <0.001 *** |
| q | 0.0068 | 0.0013 | 0.0042 | 0.0094 | <0.001 *** |
| 10.0 | 43.0 | −74.3 | 94.0 | 0.817 | |
| 2.636 | 113.894 | −220.592 | 225.864 | 0.982 | |
| 14.644 | 630.434 | −1220.985 | 1250.272 | 0.982 | |
| 16.9 | 0.6 | 15.7 | 18.2 | <0.001 *** | |
| 0.255 | 0.021 | 0.215 | 0.296 | <0.001 *** | |
| 0.748 | 0.172 | 0.410 | 1.085 | <0.001 *** | |
| 39.0 | 0.308 | 38.4 | 39.6 | <0.001 *** | |
| 0.167 | 0.015 | 0.137 | 0.196 | <0.001 *** | |
| 6.469 | 0.621 | 5.251 | 7.687 | <0.001 *** | |
| GBM (one shock: F4) | MSE = 63 | AIC = 153 | = 0.9999 | ||
| Parameter | Estimate | Std. Error | Lower C.I. | Upper C.I. | p-value |
| 5425 | 278 | 4880 | 5970 | <0.001 *** | |
| 0.0038 | 0.0002 | 0.0034 | 0.0042 | <0.001 *** | |
| 0.0929 | 0.0022 | 0.0886 | 0.0972 | <0.001 *** | |
| 18.6 | 0.4 | 17.8 | 19.4 | <0.001 *** | |
| 0.332 | 0.043 | 0.248 | 0.417 | <0.001 *** | |
| 0.132 | 0.029 | 0.074 | 0.191 | <0.001 *** | |
| GBM (four shocks: F2 + F4 + F2 + F2) | MSE = 18,283 | AIC = 1443 | = 0.9994 | ||
| Parameter | Estimate | Std. Error | Lower C.I. | Upper C.I. | p-value |
| m | 17,012 | 885 | 15,278 | 18,745 | <0.001 *** |
| p | 0.0018 | 0.0004 | 0.0010 | 0.0026 | <0.001 *** |
| q | 0.0082 | 0.0048 | −0.0012 | 0.0176 | 0.090 · |
| 10.0 | 2446 | −4784 | 4806 | 0.996 | |
| 23.897 | 1,363,722 | −2,672,822 | 2,672,870 | 0.999 | |
| 183 | 10,473,319 | −20,527,144 | 20,527,512 | 0.999 | |
| 19.2 | 0.4 | 18.4 | 19.9 | <0.001 *** | |
| 0.287 | 0.014 | 0.260 | 0.314 | <0.001 *** | |
| 2.726 | 0.795 | 1.167 | 4.284 | <0.001 *** | |
| 40.0 | 0.4 | 39.3 | 40.7 | <0.001 *** | |
| 0.169 | 0.025 | 0.120 | 0.219 | <0.001 *** | |
| 10.267 | 2.686 | 5.003 | 15.531 | <0.001 *** | |
| 125.4 | 1.5 | 122.4 | 128.4 | <0.001 *** | |
| 0.0001 | 0.166 | −0.326 | 0.326 | 0.999 | |
| 8.456 | 4.143 | 0.335 | 16.577 | 0.043 ** | |
| BM | MSE = 2804 | AIC = 300 | = 0.9977 | ||
| Parameter | Estimate | Std. Error | Lower C.I. | Upper C.I. | p-value |
| 0.00056 | 0.00002 | 0.00053 | 0.00060 | <0.001 *** | |
| 0.0682 | 0.0015 | 0.0654 | 0.0711 | <0.001 *** | |
| BM (P2) | MSE = 932 | AIC = 236 | = 0.9896 | ||
| Parameter | Estimate | Std. Error | Lower C.I. | Upper C.I. | p-value |
| 0.00064 | 0.00003 | 0.00057 | 0.00070 | <0.001 *** | |
| 0.062 | 0.0029 | 0.056 | 0.068 | <0.001 *** | |
| BM (P3) | MSE = 432 | AIC = 210 | = 0.9973 | ||
| Parameter | Estimate | Std. Error | Lower C.I. | Upper C.I. | p-value |
| 0.00048 | 0.00002 | 0.00045 | 0.00051 | <0.001 *** | |
| 0.076 | 0.002 | 0.073 | 0.079 | <0.001 *** | |
| BM (P4) | MSE = 3360 | AIC = 280 | = 0.9793 | ||
| Parameter | Estimate | Std. Error | Lower C.I. | Upper C.I. | p-value |
| 0.00063 | 0.00005 | 0.00052 | 0.00073 | <0.001 *** | |
| 0.066 | 0.005 | 0.057 | 0.075 | <0.001 *** |
Disclaimer/Publisher’s Note: The statements, opinions and data contained in all publications are solely those of the individual author(s) and contributor(s) and not of MDPI and/or the editor(s). MDPI and/or the editor(s) disclaim responsibility for any injury to people or property resulting from any ideas, methods, instructions or products referred to in the content. |
© 2024 by the authors. Licensee MDPI, Basel, Switzerland. This article is an open access article distributed under the terms and conditions of the Creative Commons Attribution (CC BY) license (https://creativecommons.org/licenses/by/4.0/).
Share and Cite
Bessi, A.; Guidolin, M.; Manfredi, P. Diffusion of Solar PV Energy in Italy: Can Large-Scale PV Installations Trigger the Next Growth Phase? Energies 2024, 17, 726. https://doi.org/10.3390/en17030726
Bessi A, Guidolin M, Manfredi P. Diffusion of Solar PV Energy in Italy: Can Large-Scale PV Installations Trigger the Next Growth Phase? Energies. 2024; 17(3):726. https://doi.org/10.3390/en17030726
Chicago/Turabian StyleBessi, Alessandro, Mariangela Guidolin, and Piero Manfredi. 2024. "Diffusion of Solar PV Energy in Italy: Can Large-Scale PV Installations Trigger the Next Growth Phase?" Energies 17, no. 3: 726. https://doi.org/10.3390/en17030726