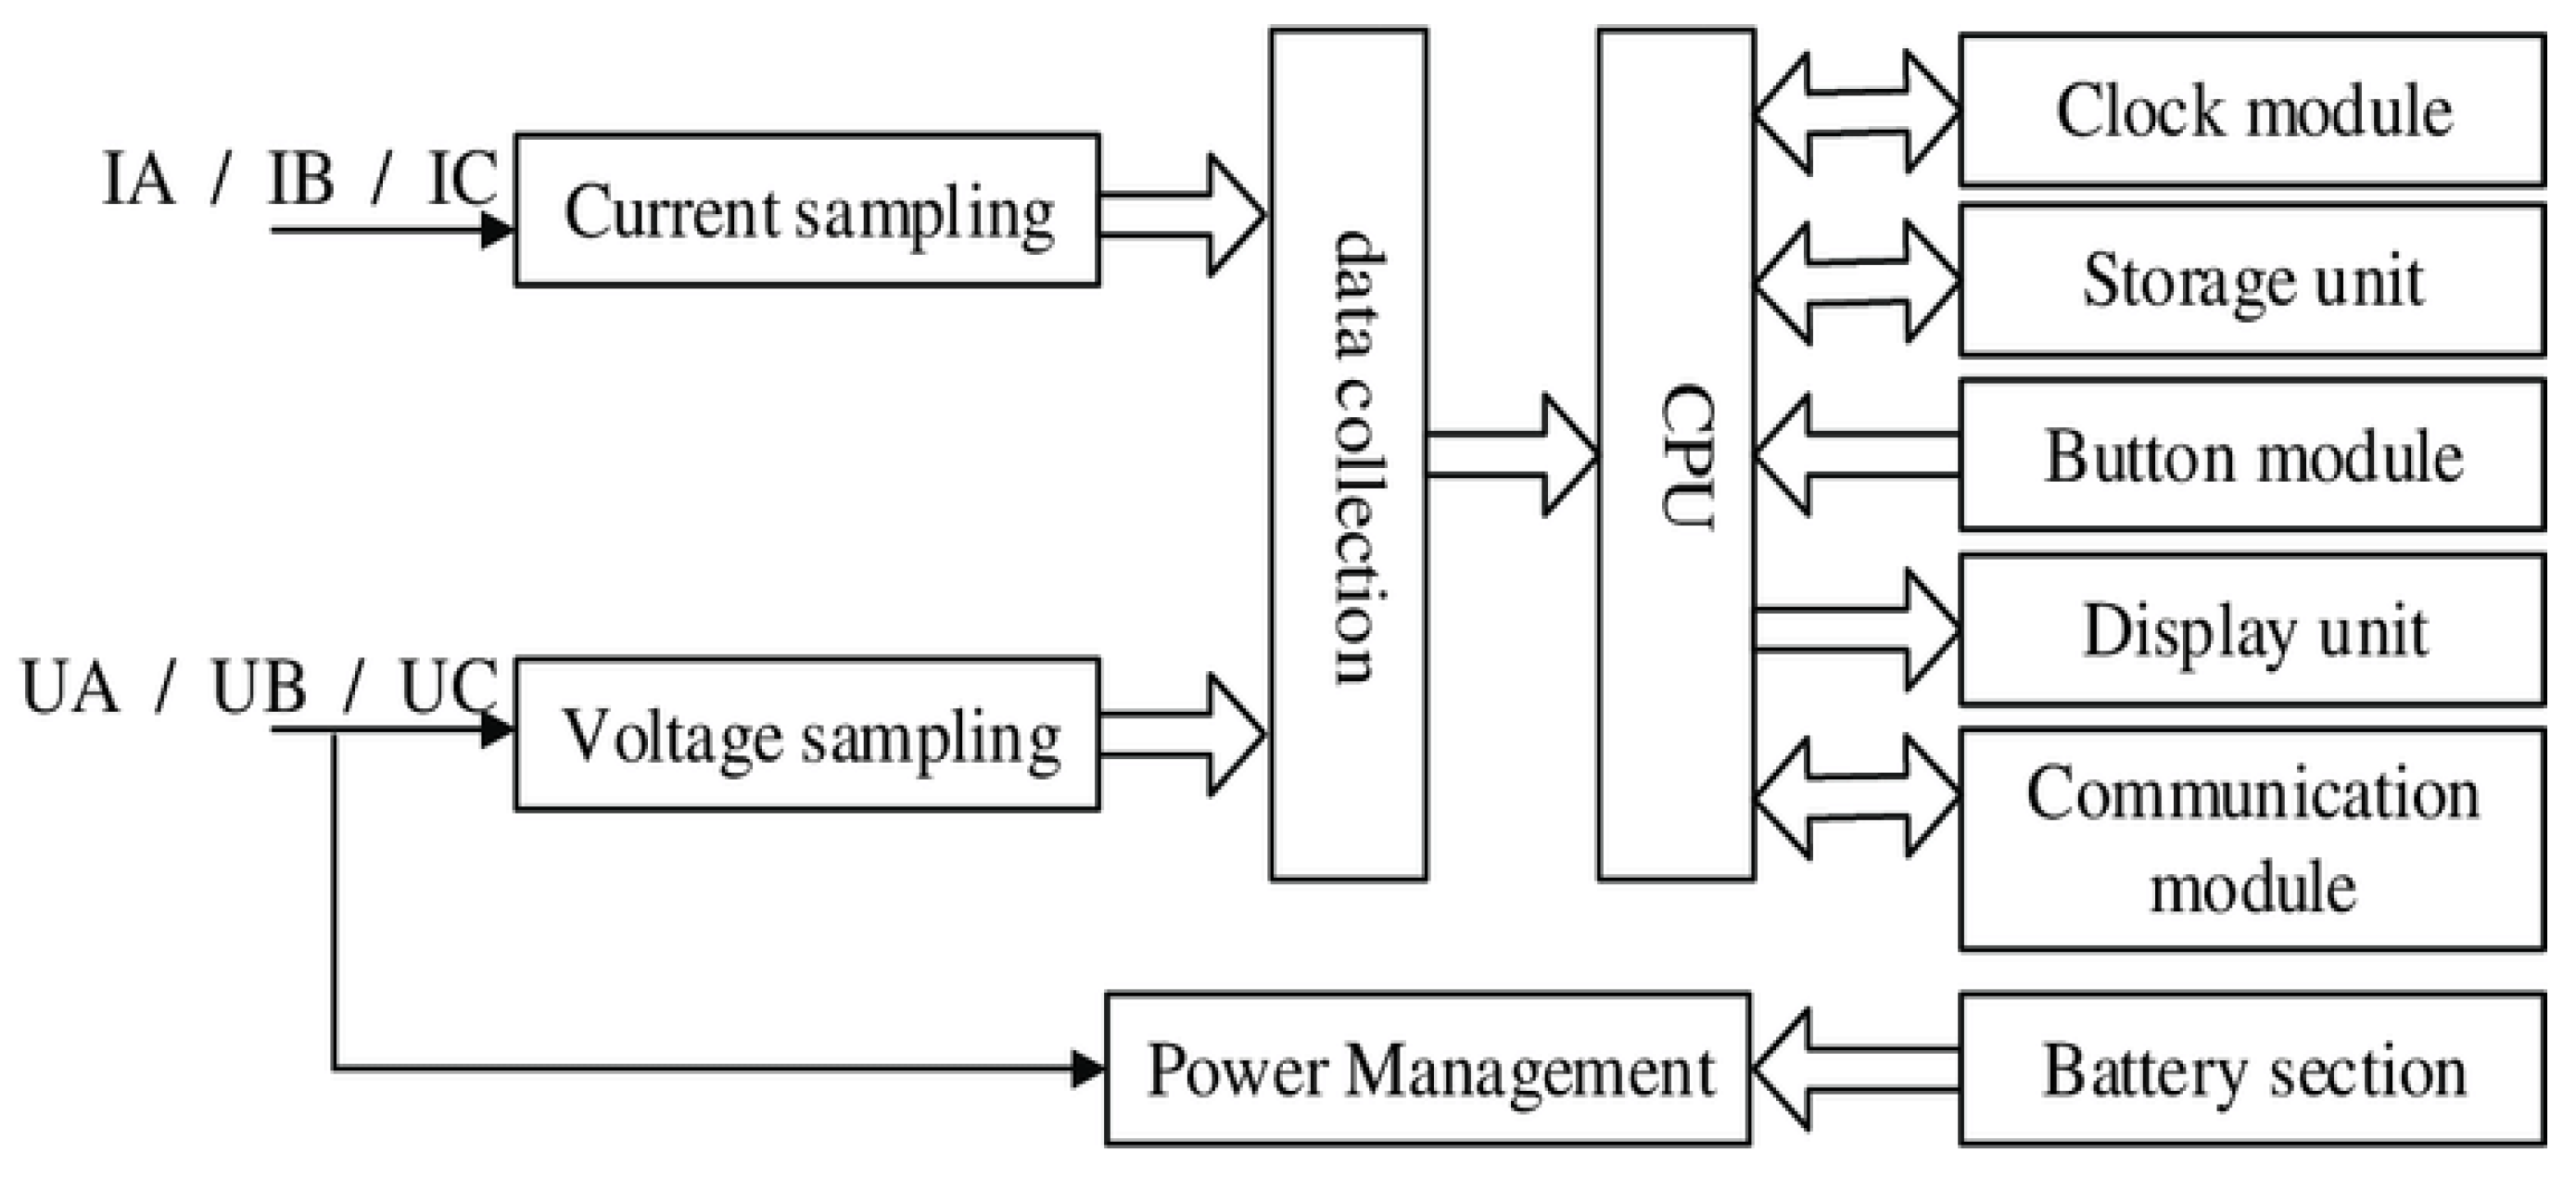
Figure 1.
Block schematic diagram of a typical electronic energy meter.
Figure 1.
Block schematic diagram of a typical electronic energy meter.
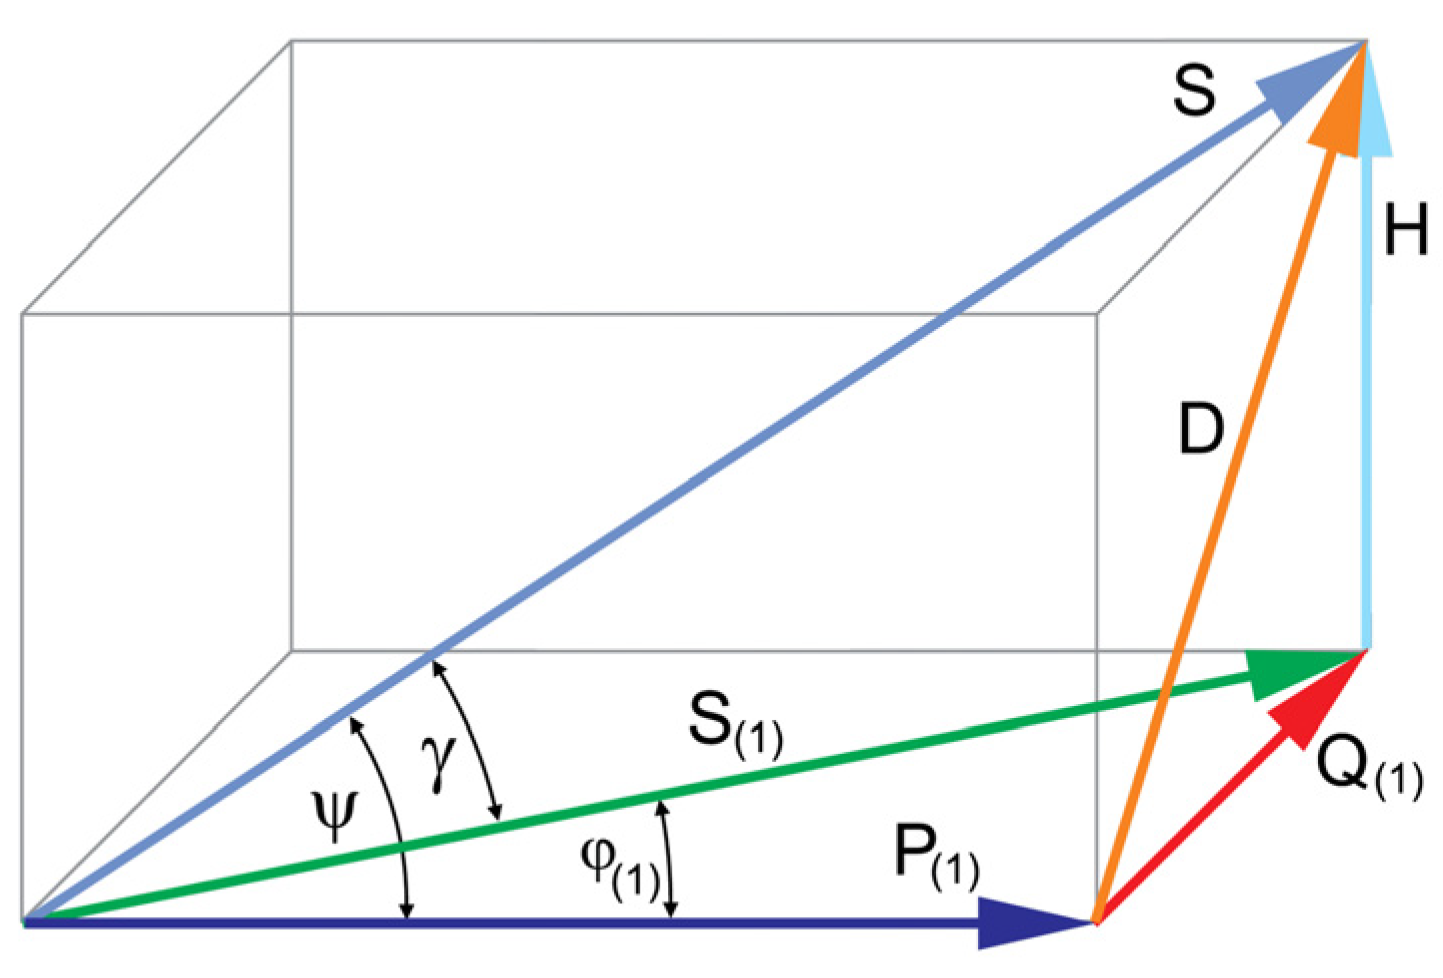
Figure 2.
Geometric relation between power component vectors.
Figure 2.
Geometric relation between power component vectors.
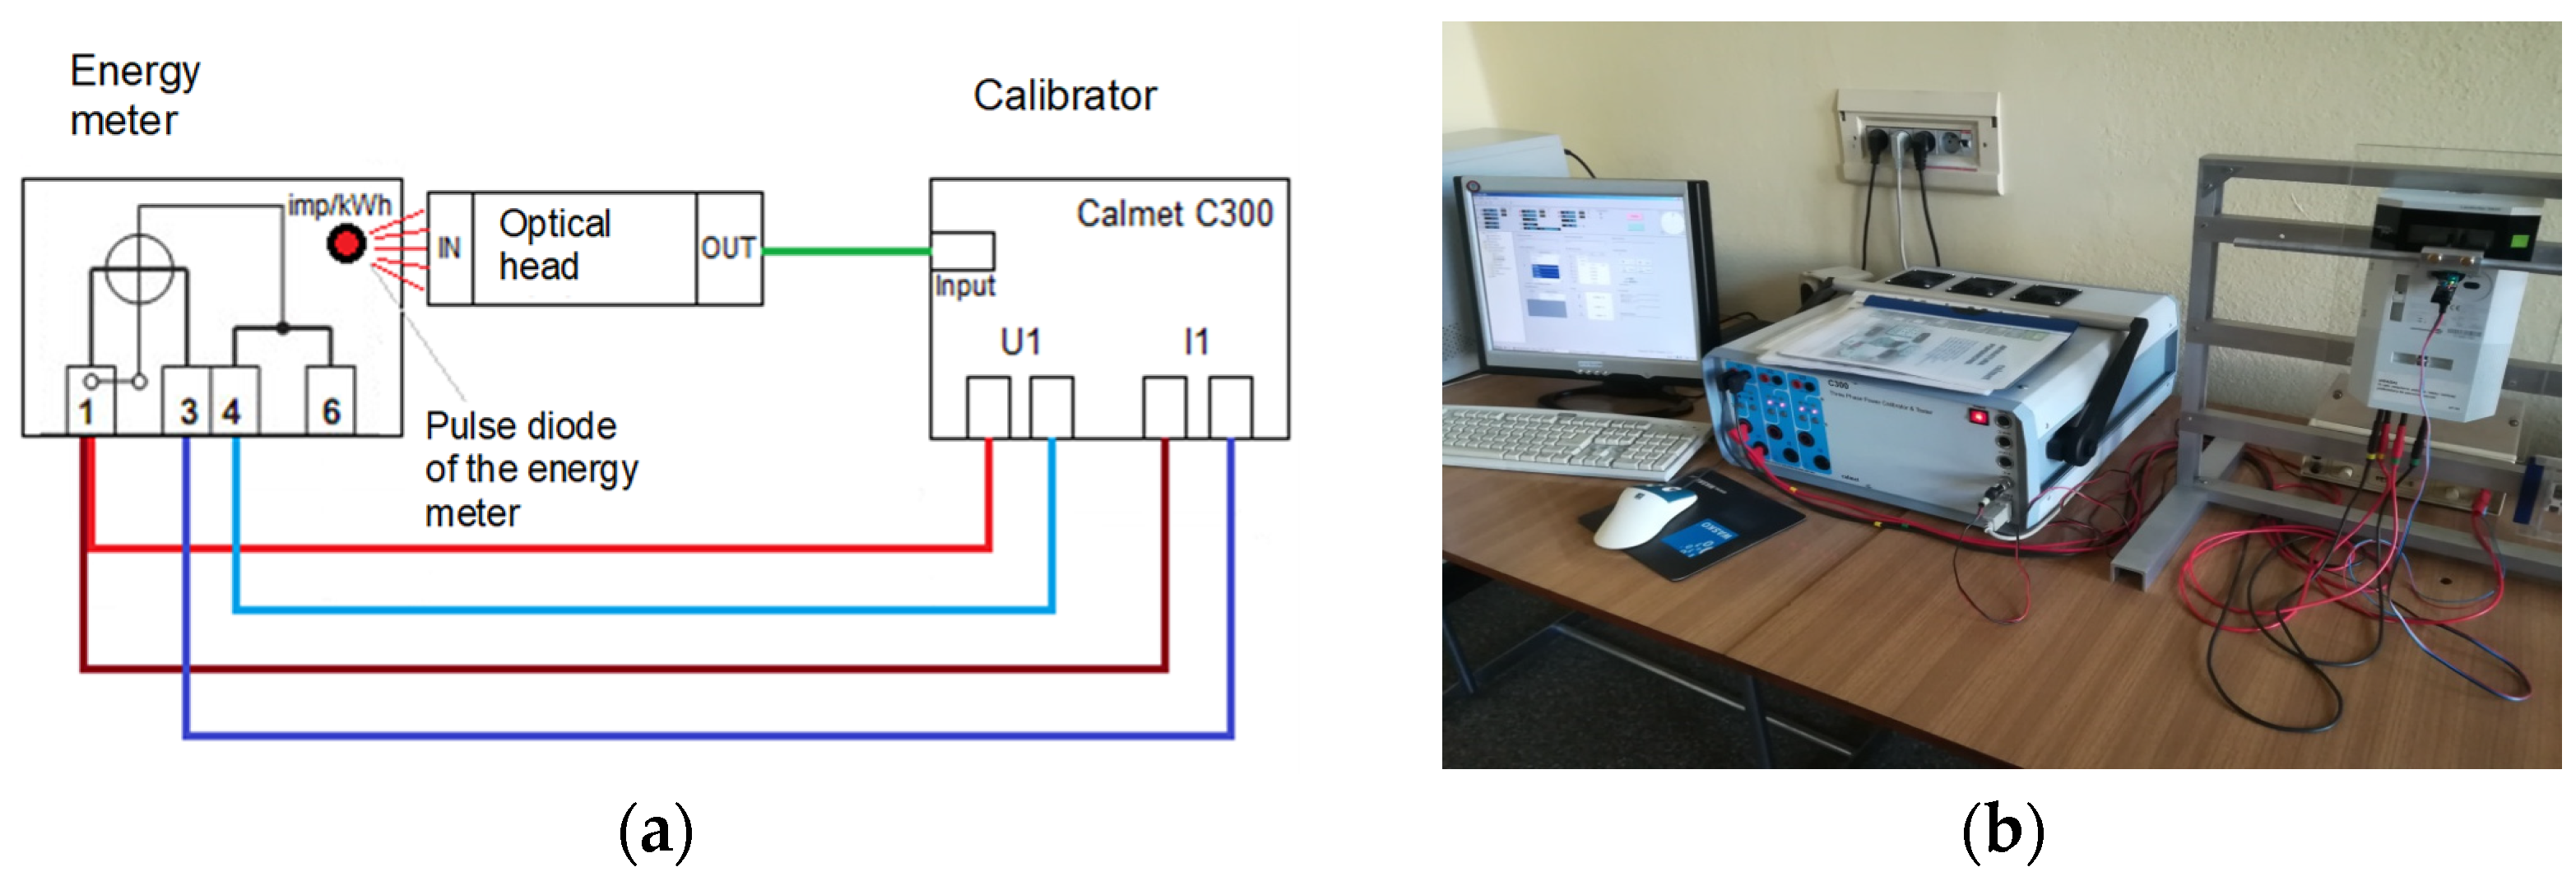
Figure 3.
System for measuring errors of electronic energy meters: (a) block diagram of the system and (b) photo showing the system configuration.
Figure 3.
System for measuring errors of electronic energy meters: (a) block diagram of the system and (b) photo showing the system configuration.
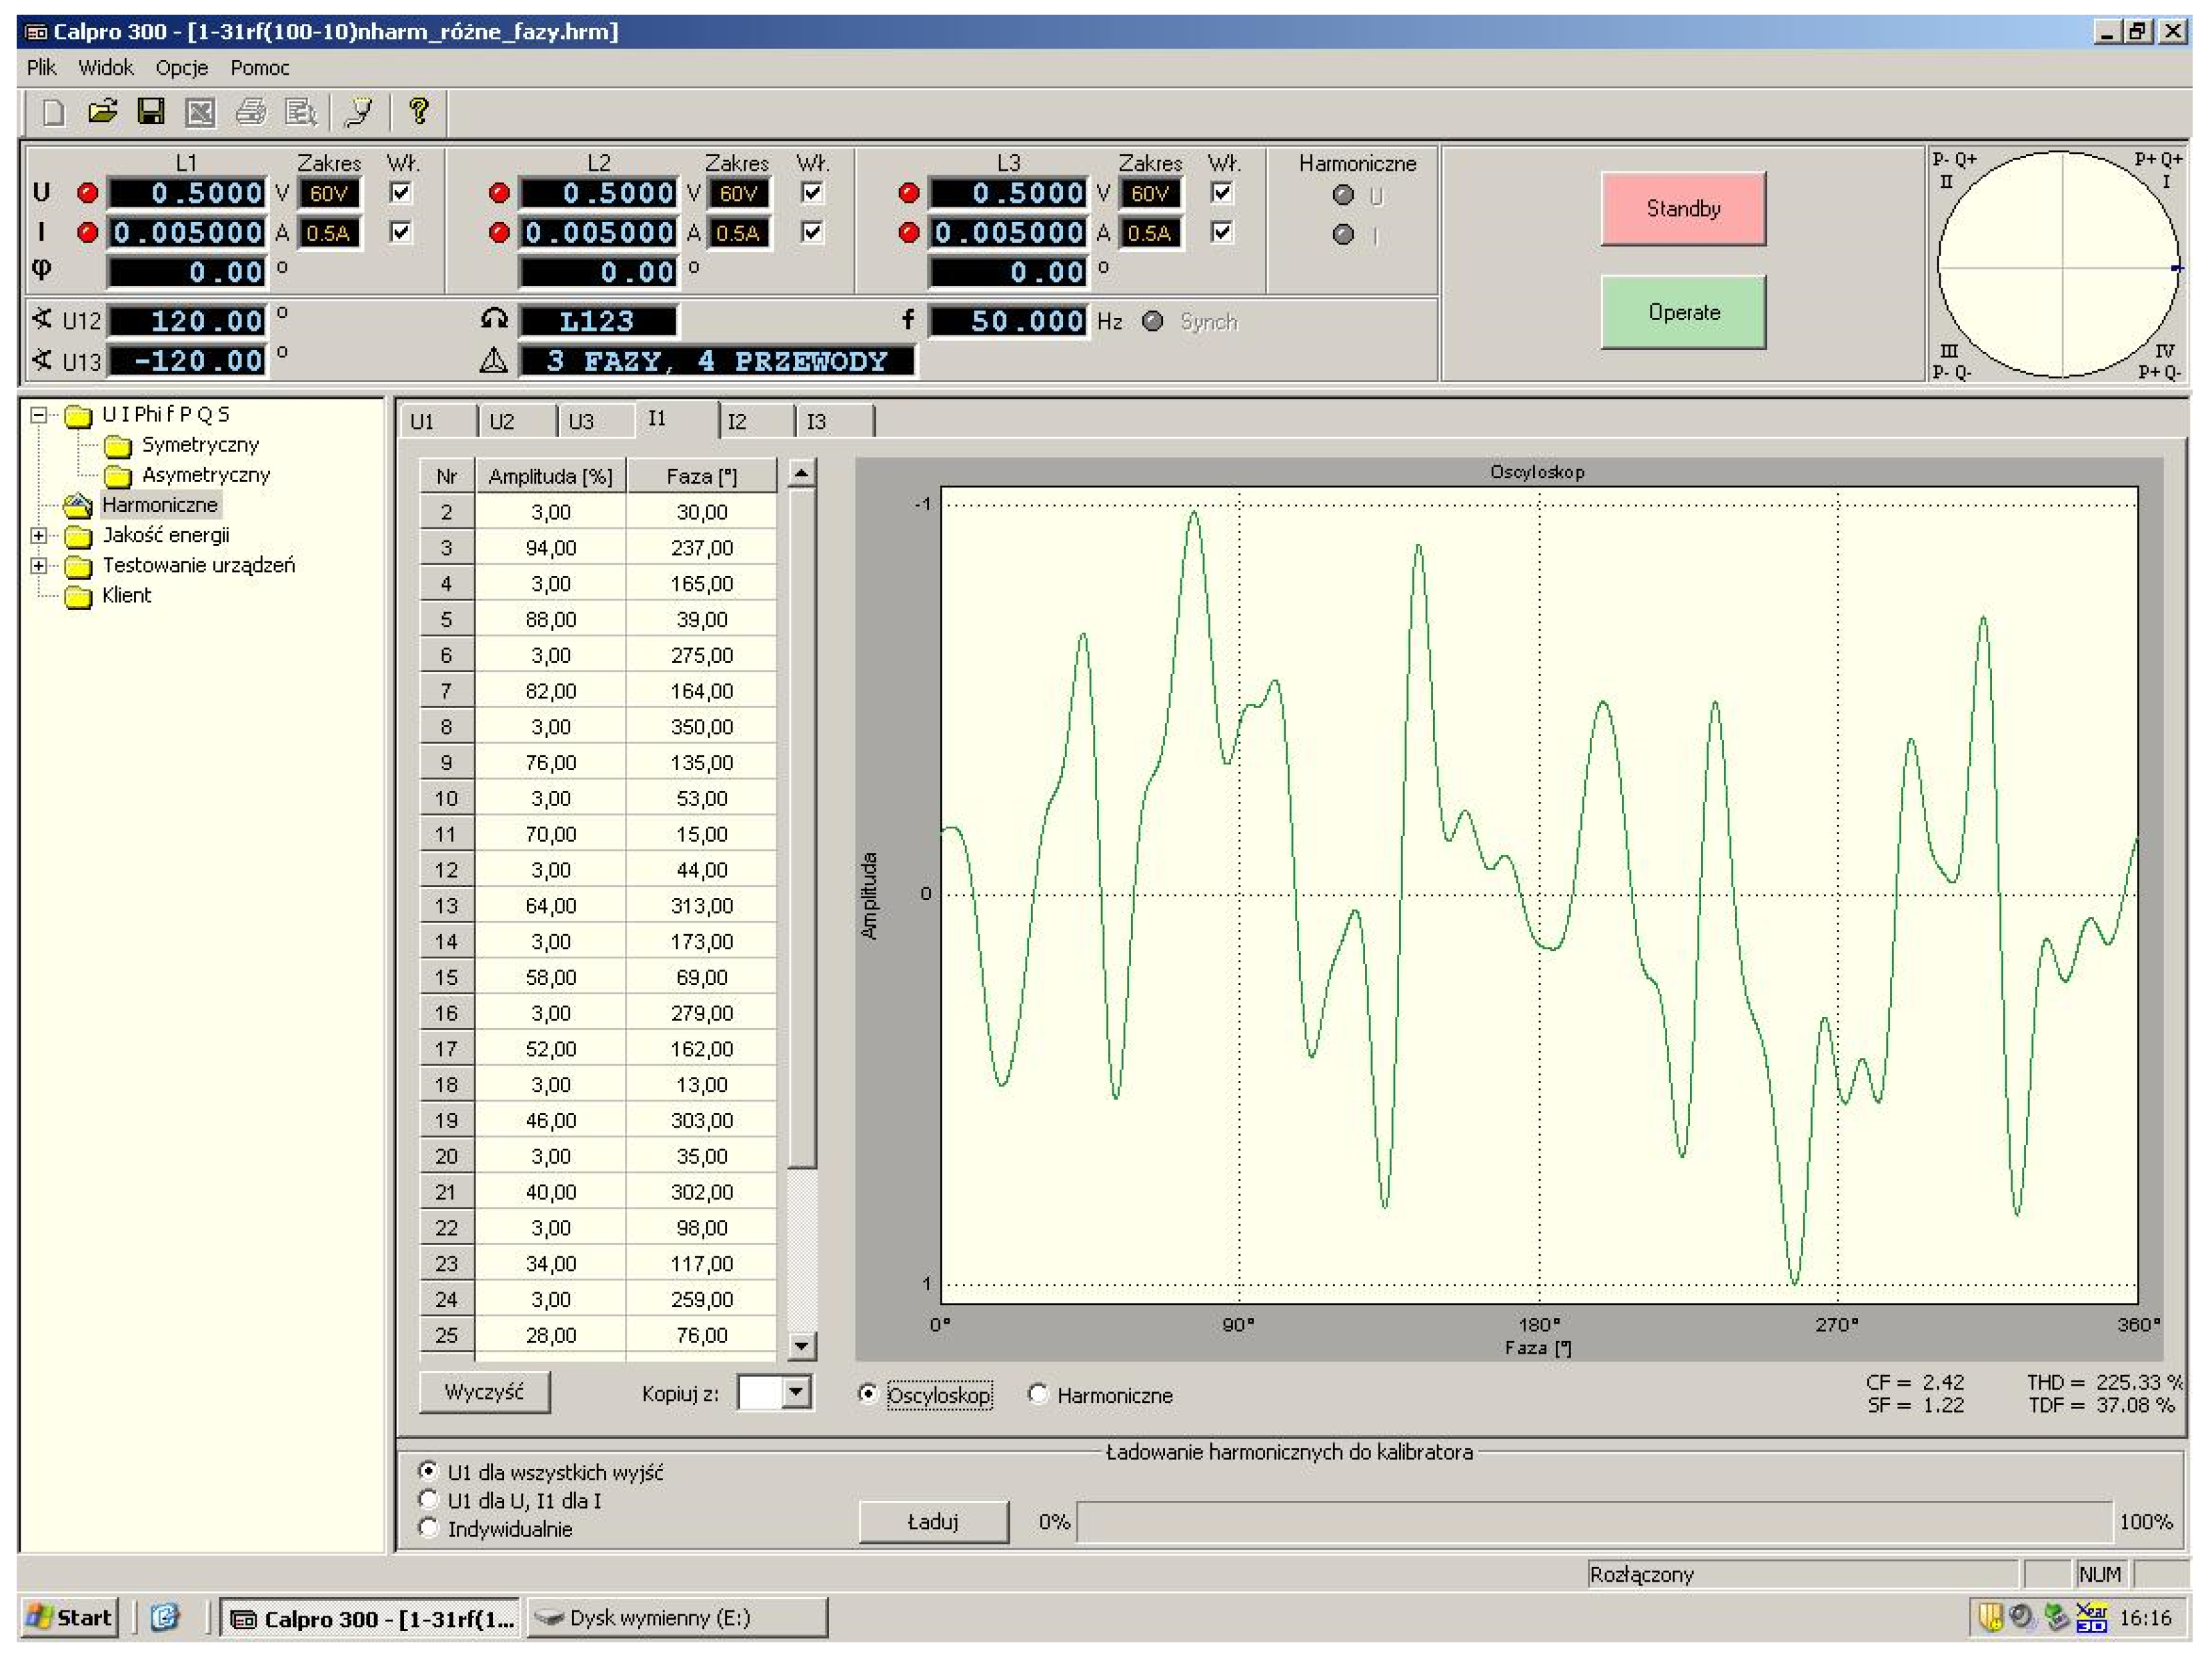
Figure 4.
Screenshot of the CALPRO 300 program with an example graph of the generated distorted current.
Figure 4.
Screenshot of the CALPRO 300 program with an example graph of the generated distorted current.
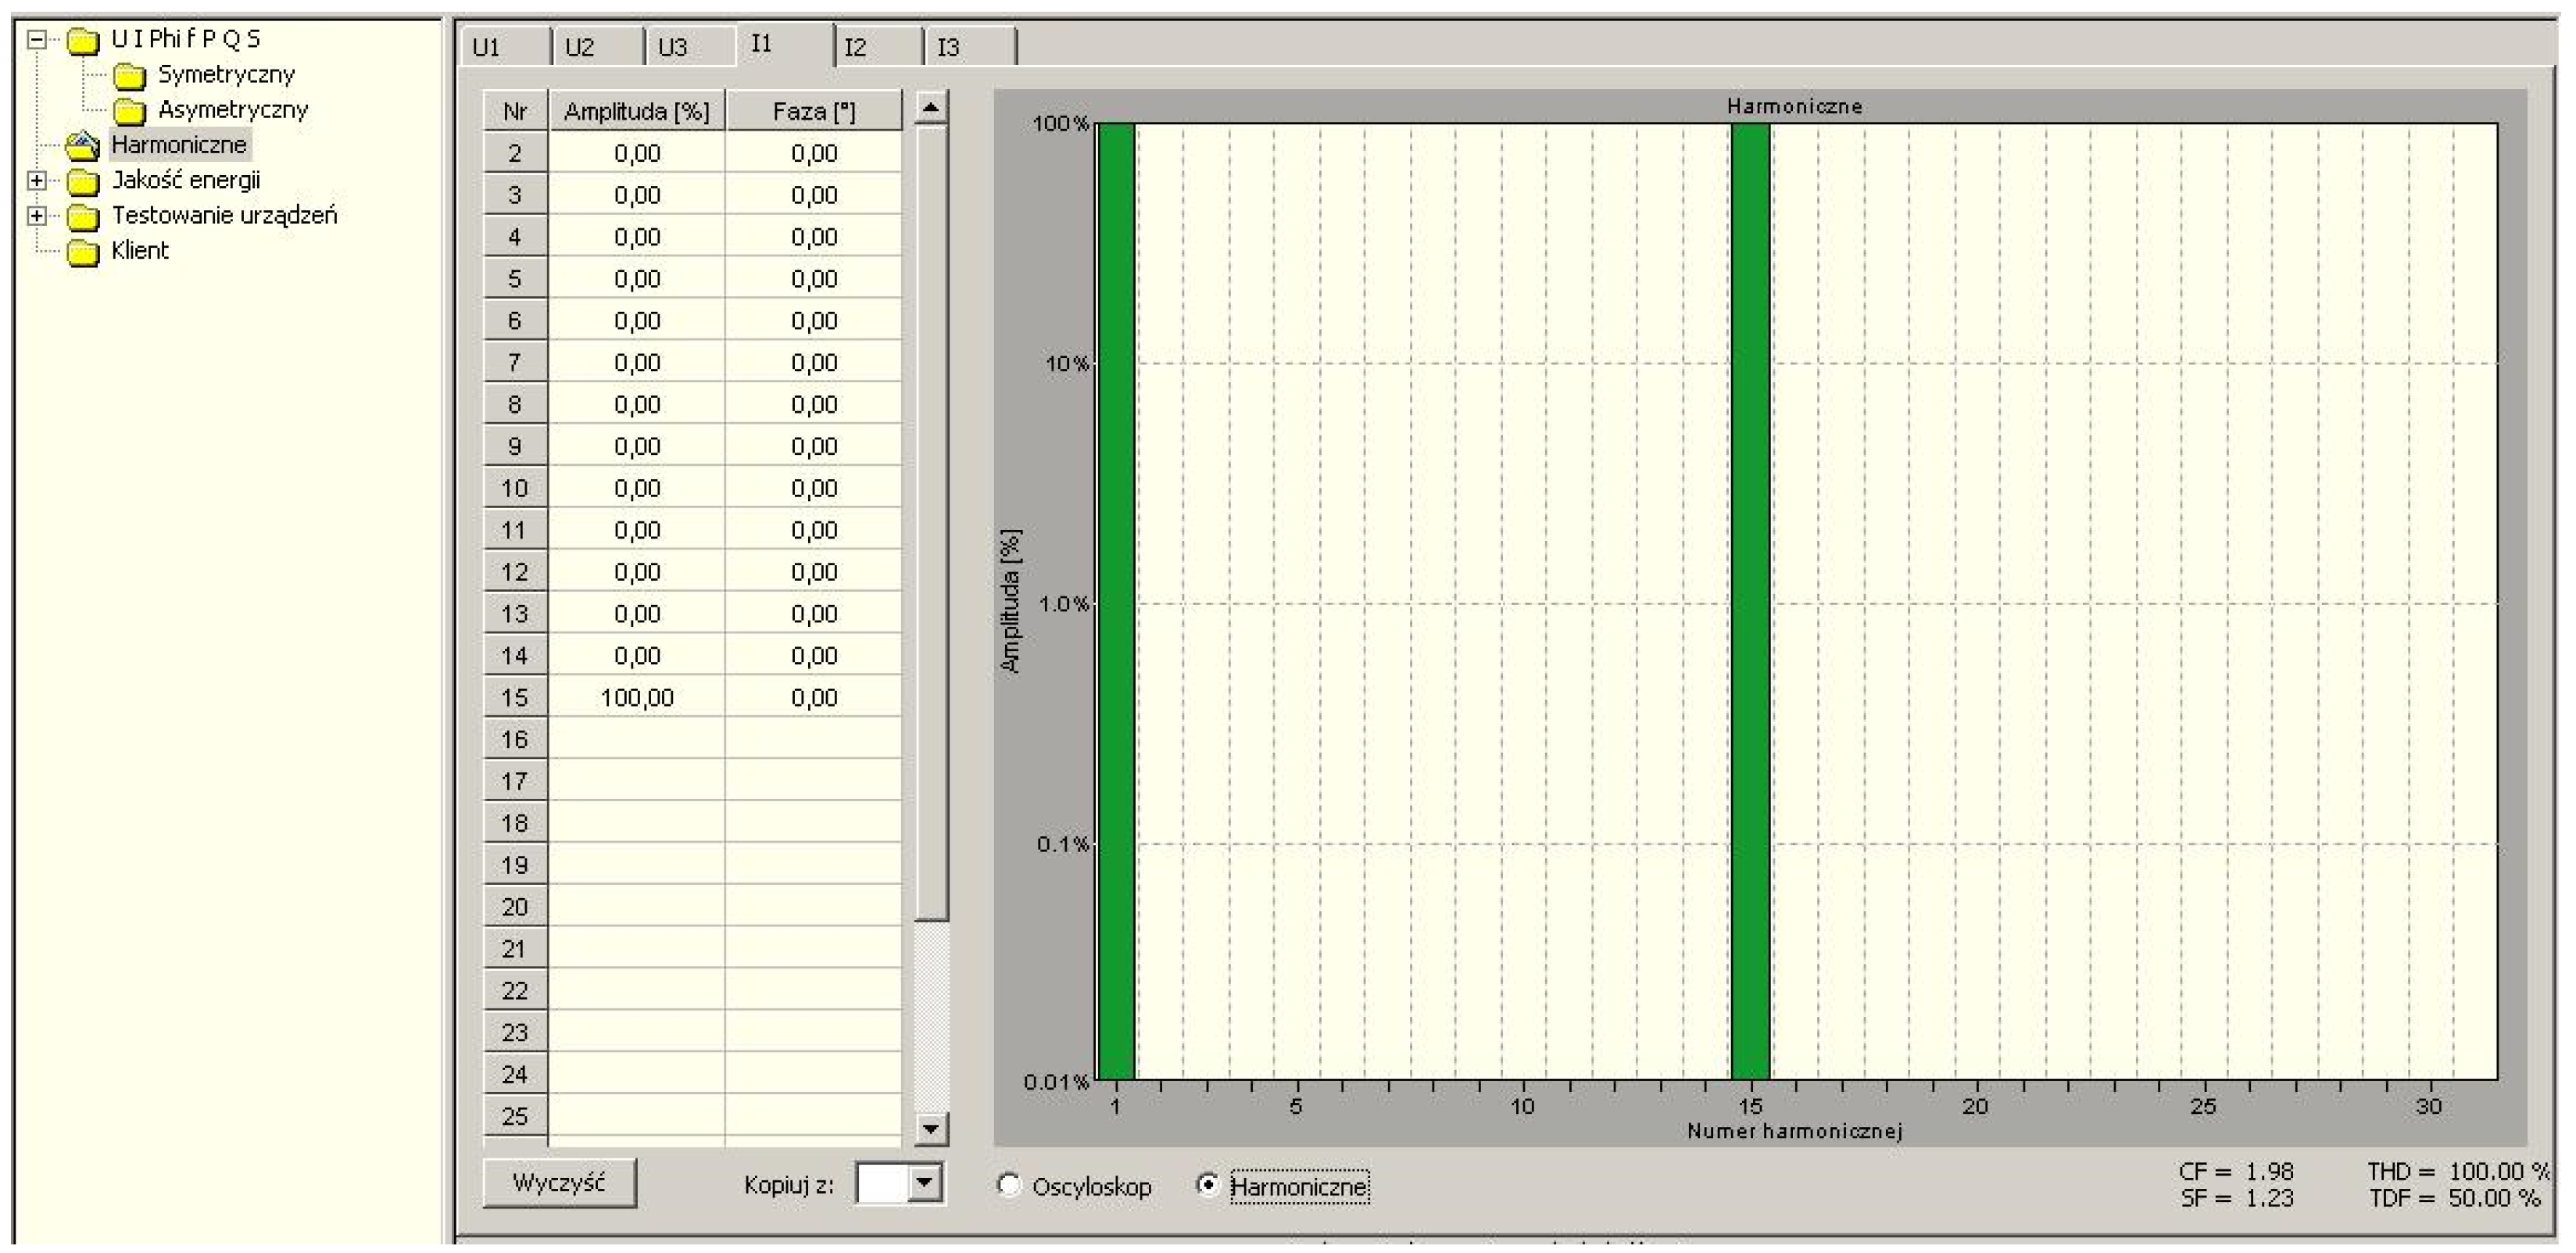
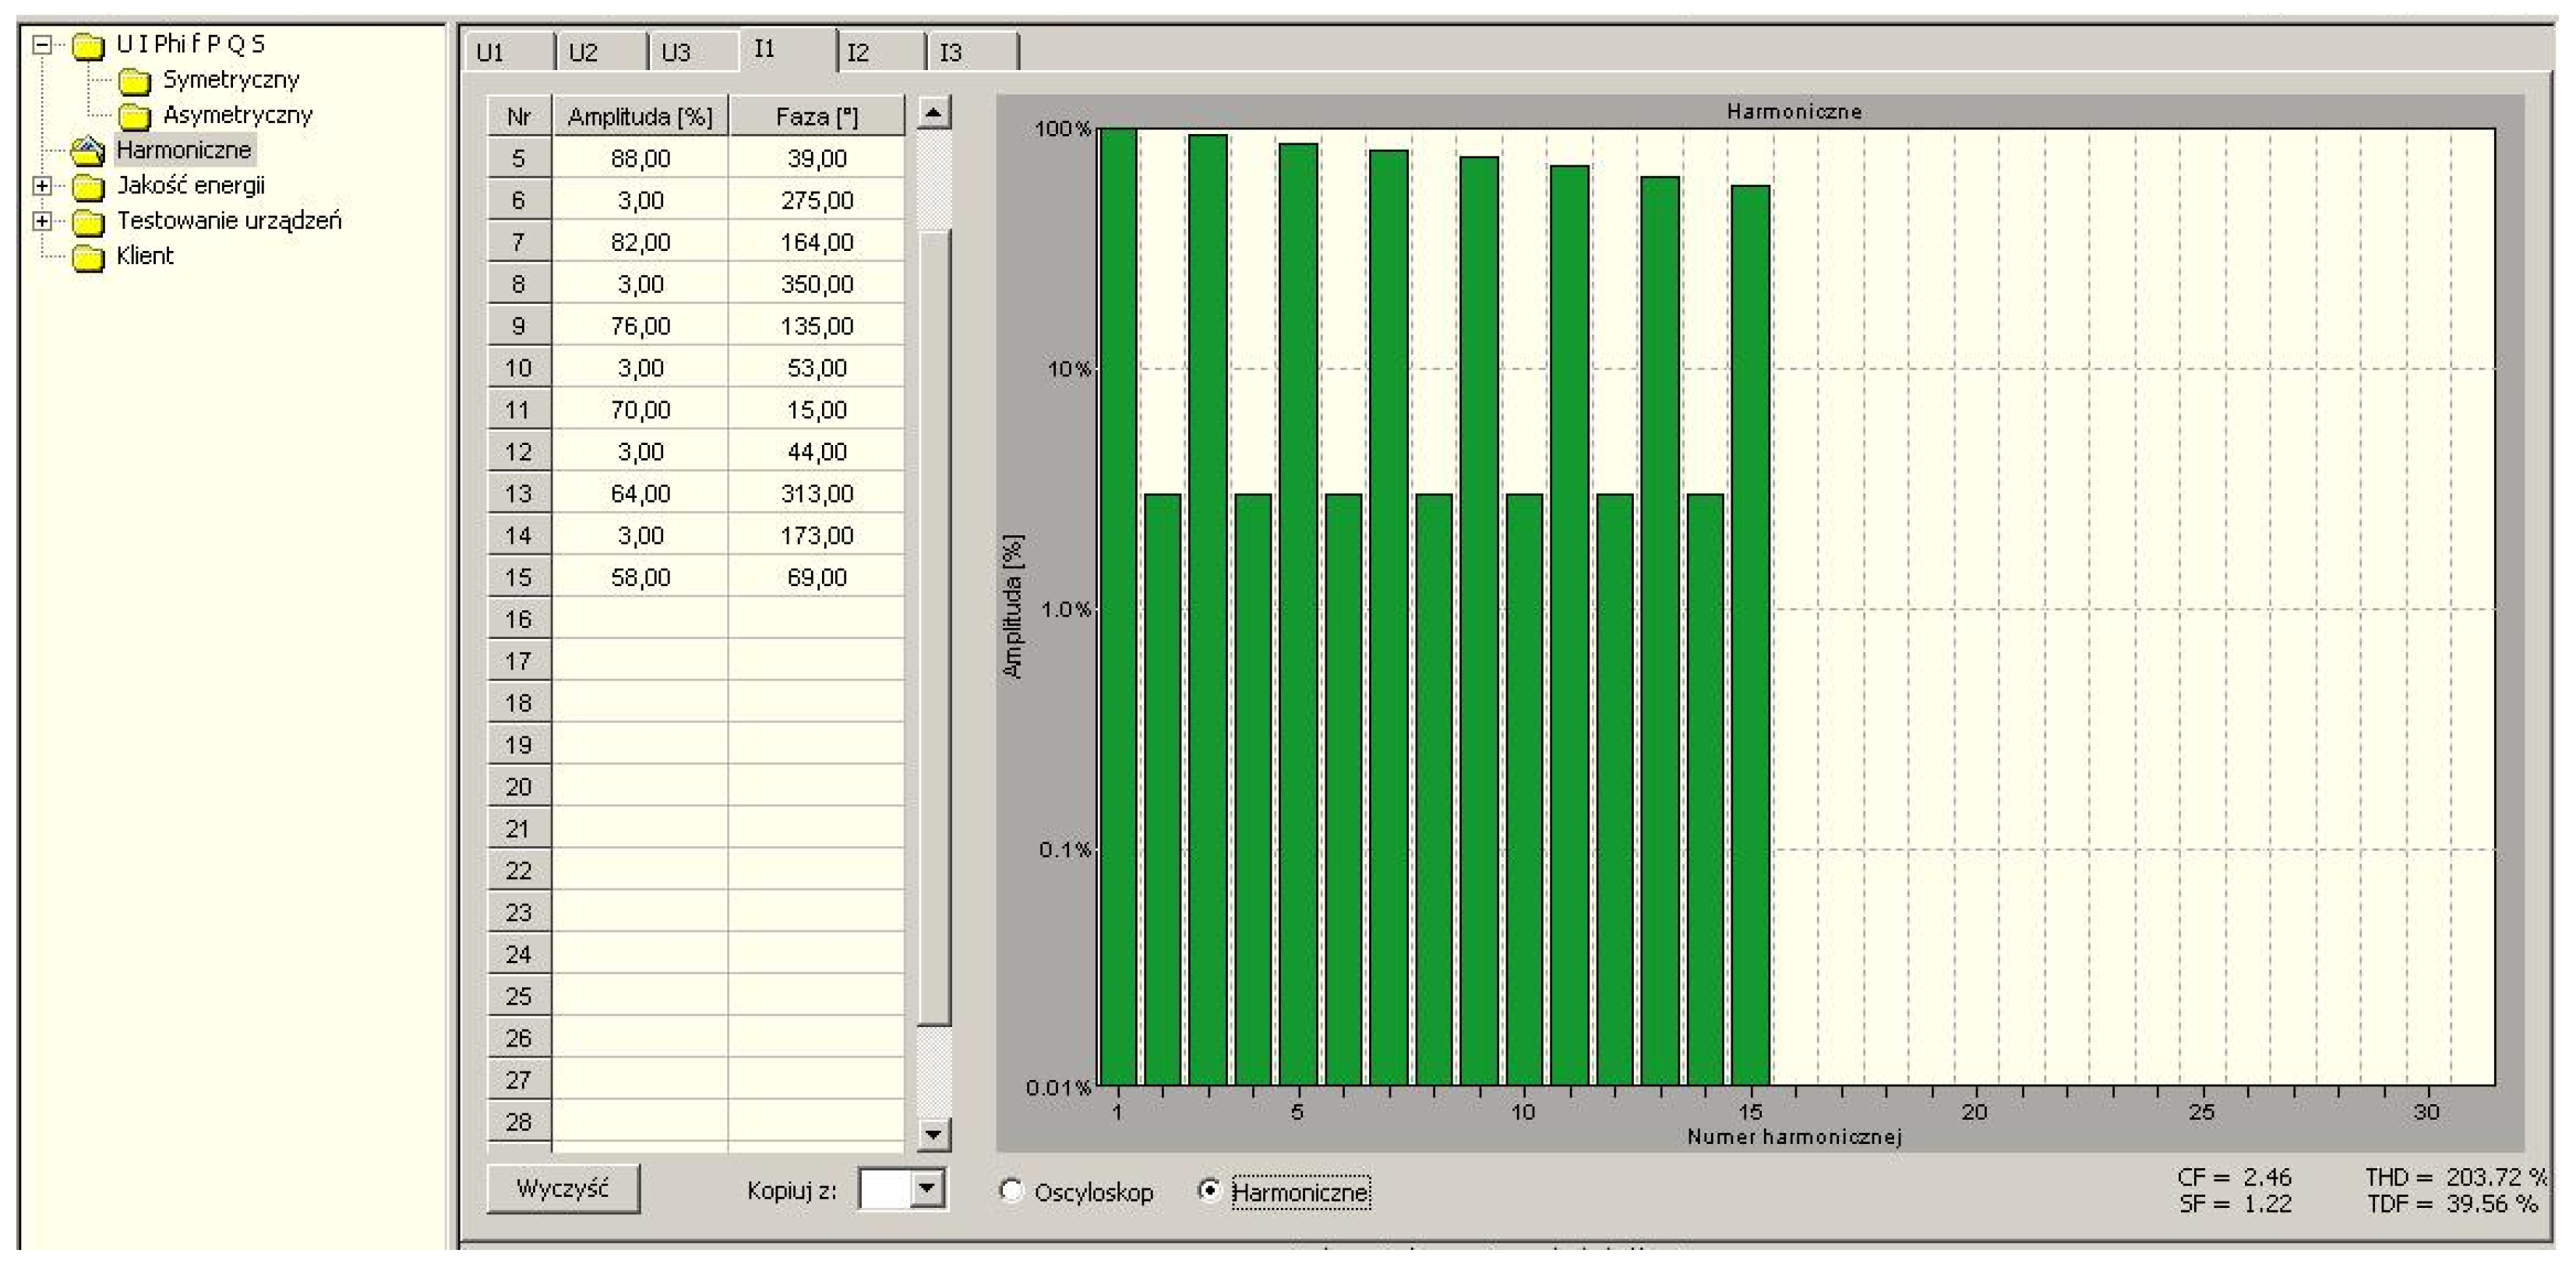
Figure 5.
Screenshot of the CALPRO 300 shows load current spectrum with the selectively introduced 15th harmonic (n = 15).
Figure 5.
Screenshot of the CALPRO 300 shows load current spectrum with the selectively introduced 15th harmonic (n = 15).
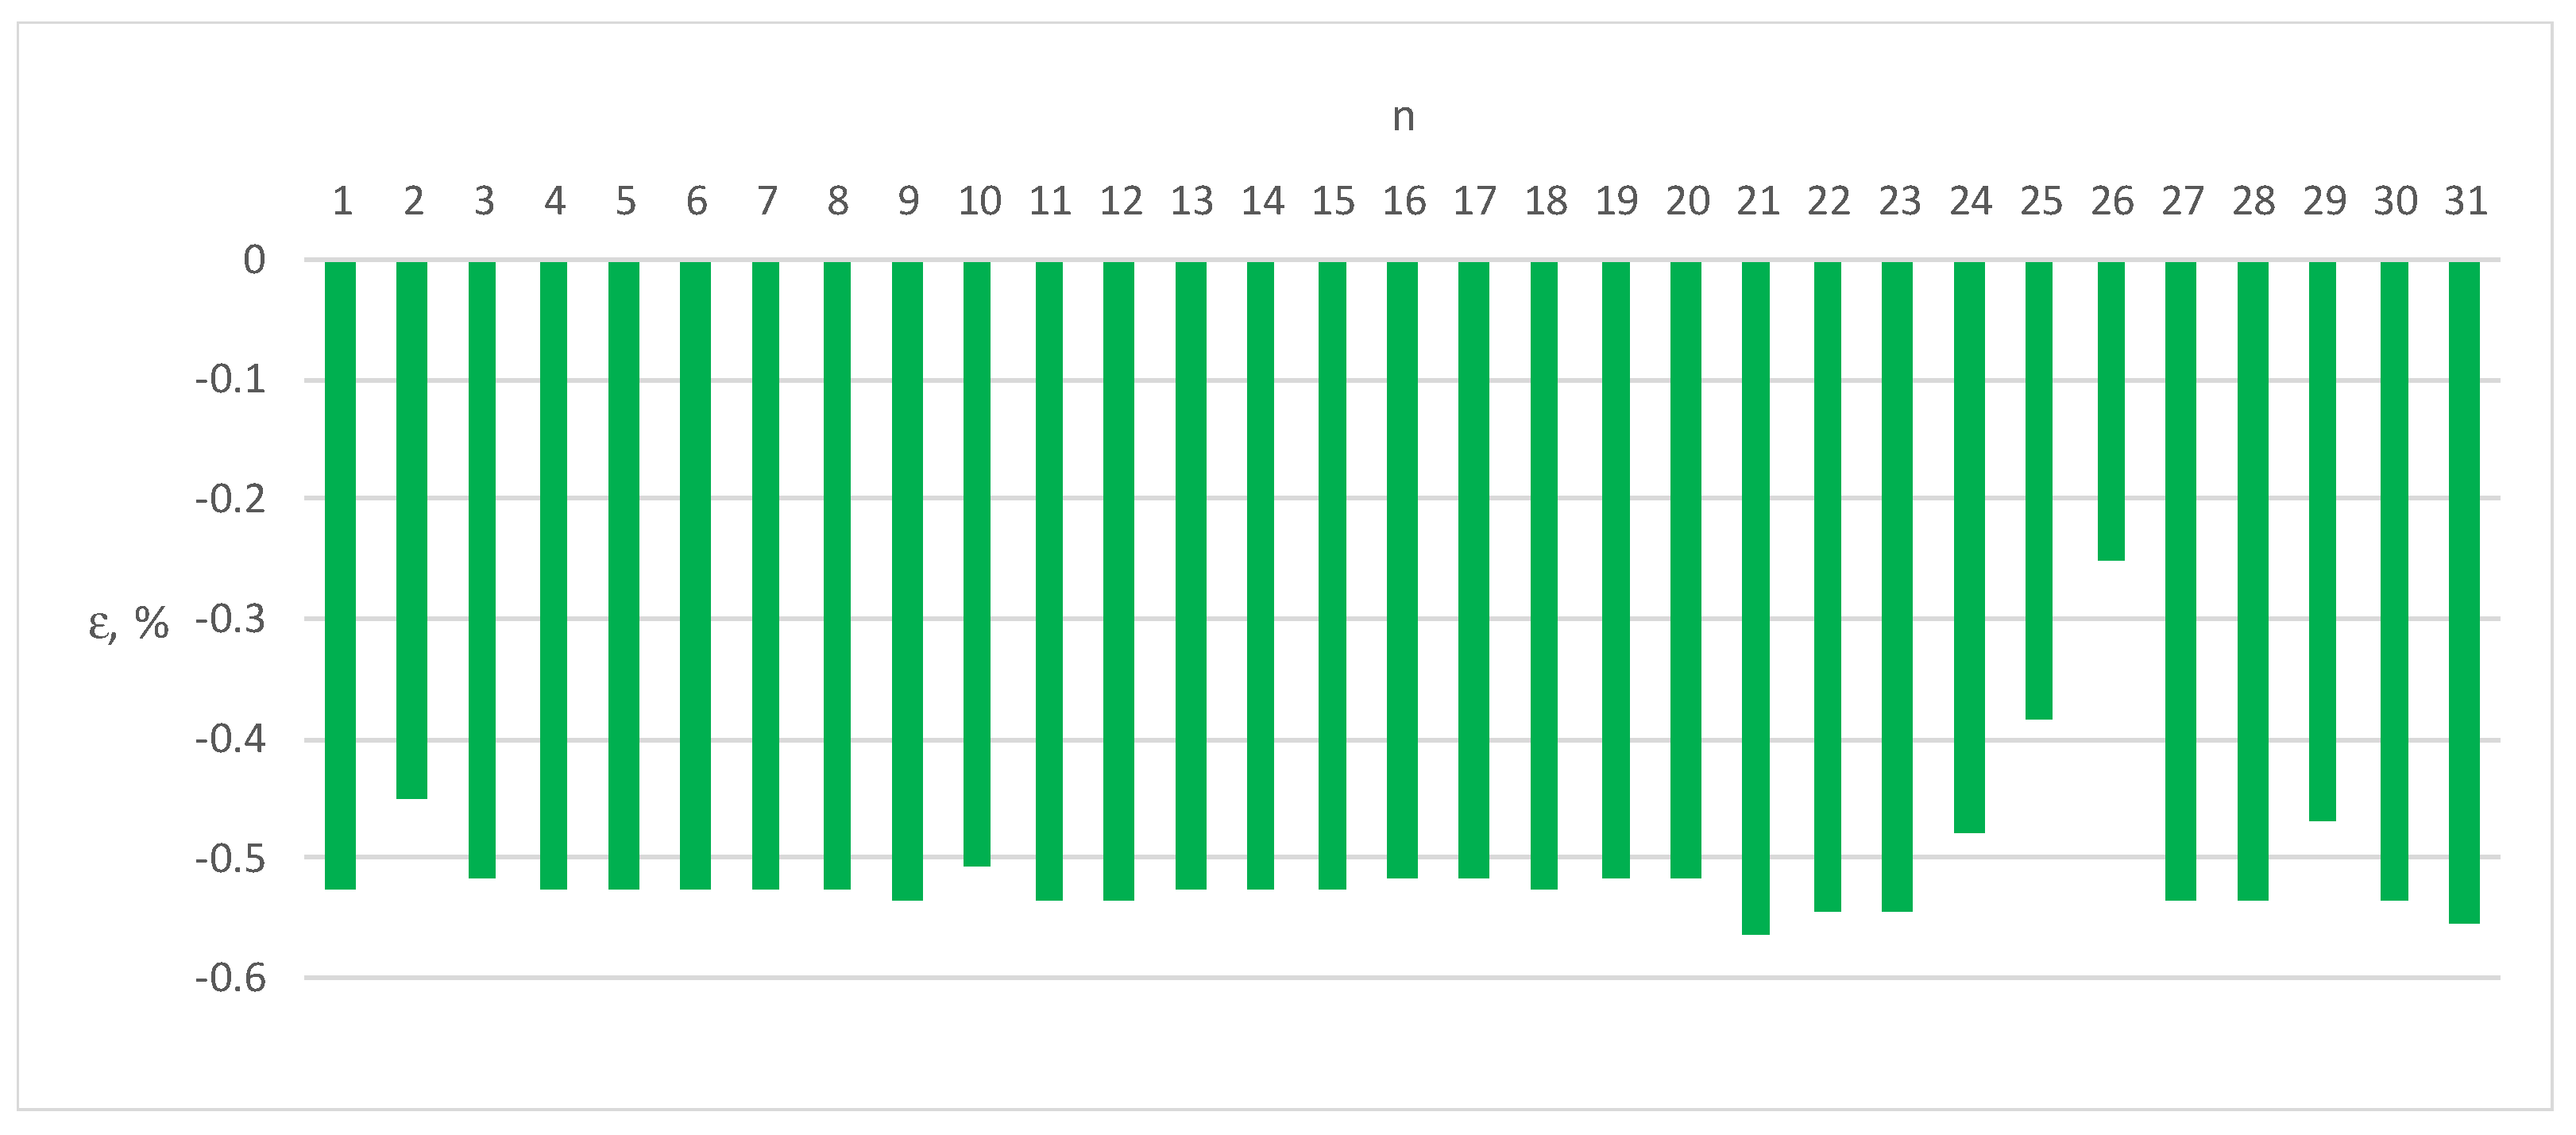
Figure 6.
Errors ε of Energy Meter 1 for load current distorted by individual harmonics n = 1–31 (100% of the base current Ib, cosφ = 1).
Figure 6.
Errors ε of Energy Meter 1 for load current distorted by individual harmonics n = 1–31 (100% of the base current Ib, cosφ = 1).
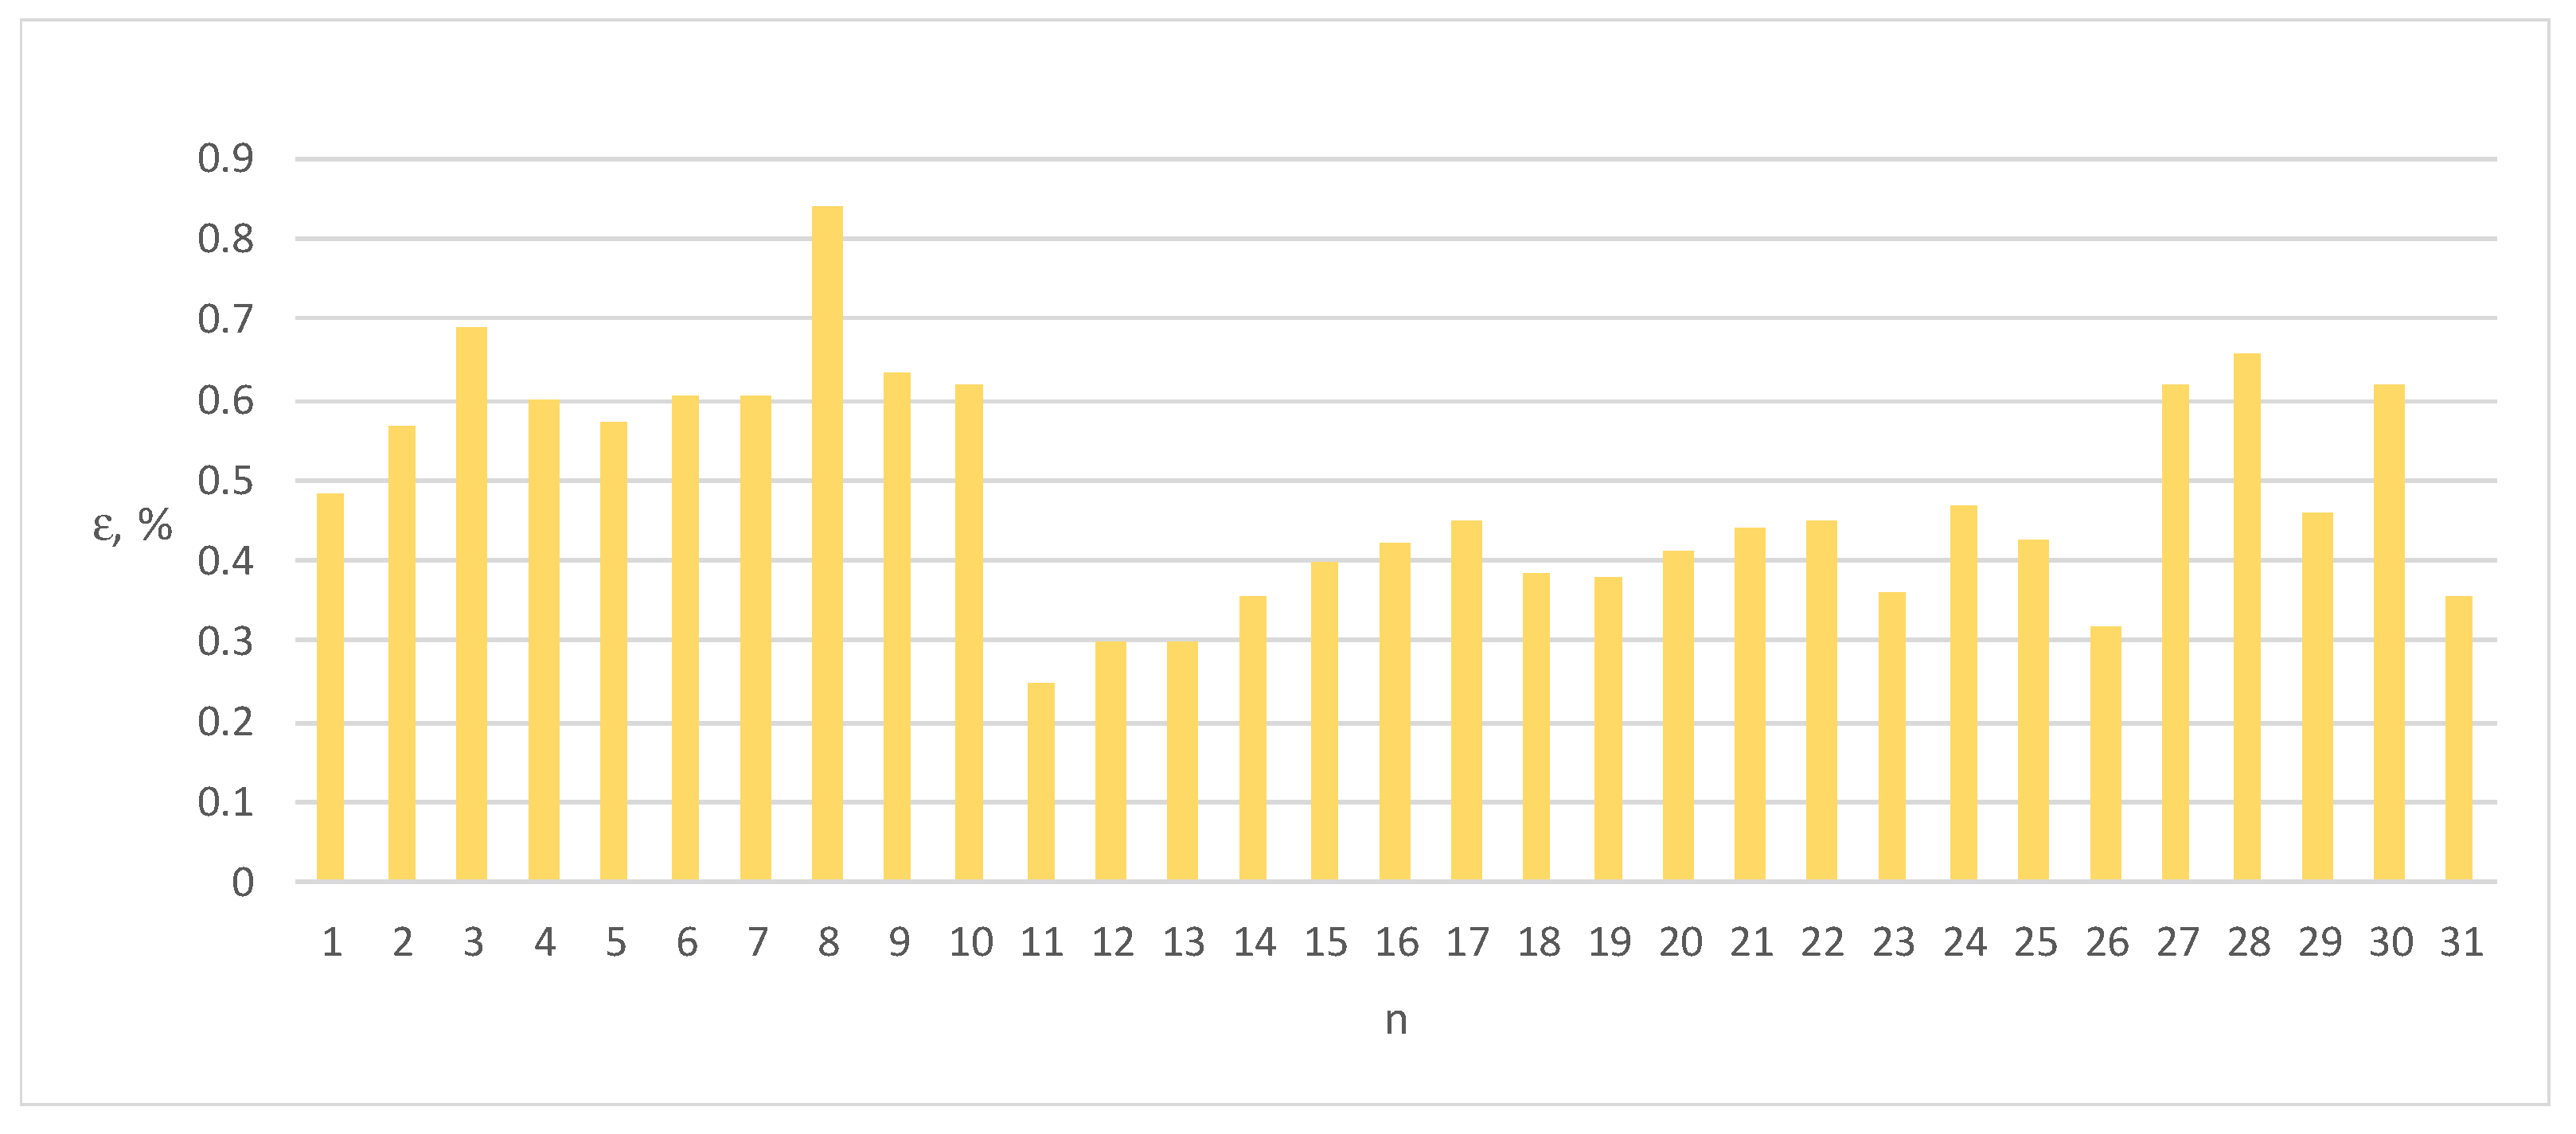
Figure 7.
Errors ε of Energy Meter 2 for load current distorted by individual harmonics n = 1–31 (100% of the base current Ib, cosφ = 1).
Figure 7.
Errors ε of Energy Meter 2 for load current distorted by individual harmonics n = 1–31 (100% of the base current Ib, cosφ = 1).
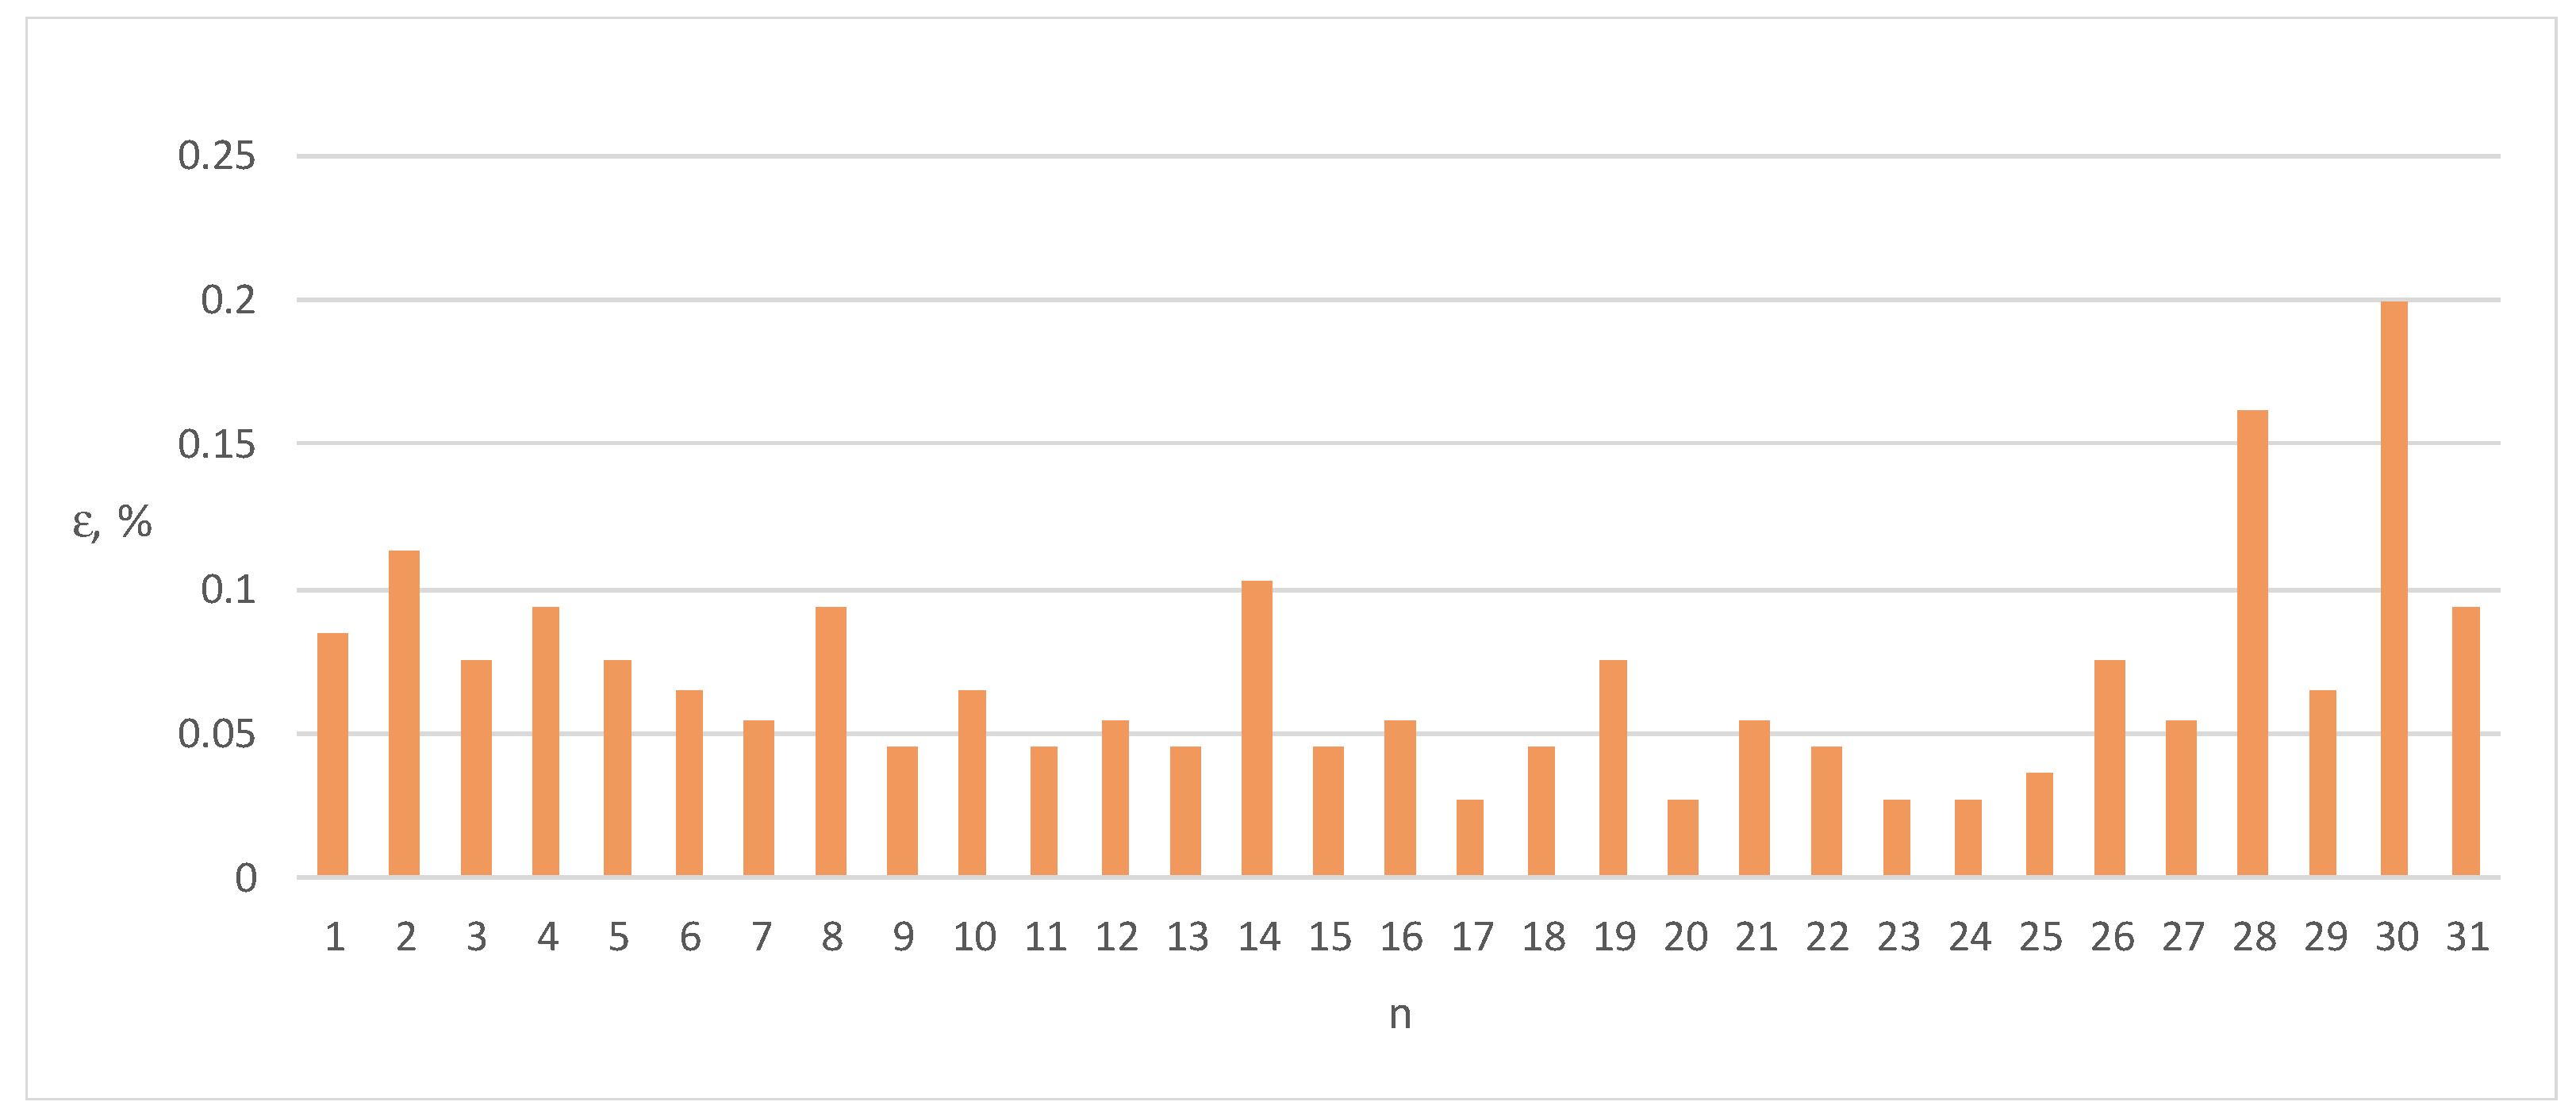
Figure 8.
Errors ε of Energy Meter 3 for load current distorted by individual harmonics n = 1–31 (100% of the base current Ib, cosφ = 1).
Figure 8.
Errors ε of Energy Meter 3 for load current distorted by individual harmonics n = 1–31 (100% of the base current Ib, cosφ = 1).
Figure 9.
Errors ε of Energy Meter 1 for load current distorted by individual harmonics n = 1–31 (100% of the base current Ib, cosφ = 0.5).
Figure 9.
Errors ε of Energy Meter 1 for load current distorted by individual harmonics n = 1–31 (100% of the base current Ib, cosφ = 0.5).
Figure 10.
Errors ε of Energy Meter 2 for load current distorted by individual harmonics n = 1–31 (100% of the base current Ib, cosφ = 0.5).
Figure 10.
Errors ε of Energy Meter 2 for load current distorted by individual harmonics n = 1–31 (100% of the base current Ib, cosφ = 0.5).
Figure 11.
Errors ε of Energy Meter 3 for load current distorted by individual harmonics n = 1–31 (100% of the base current Ib, cosφ = 0.5).
Figure 11.
Errors ε of Energy Meter 3 for load current distorted by individual harmonics n = 1–31 (100% of the base current Ib, cosφ = 0.5).
Figure 12.
Screenshot of the CALPRO 300 shows load current spectrum containing a sequence of 15 harmonics (k = 15).
Figure 12.
Screenshot of the CALPRO 300 shows load current spectrum containing a sequence of 15 harmonics (k = 15).
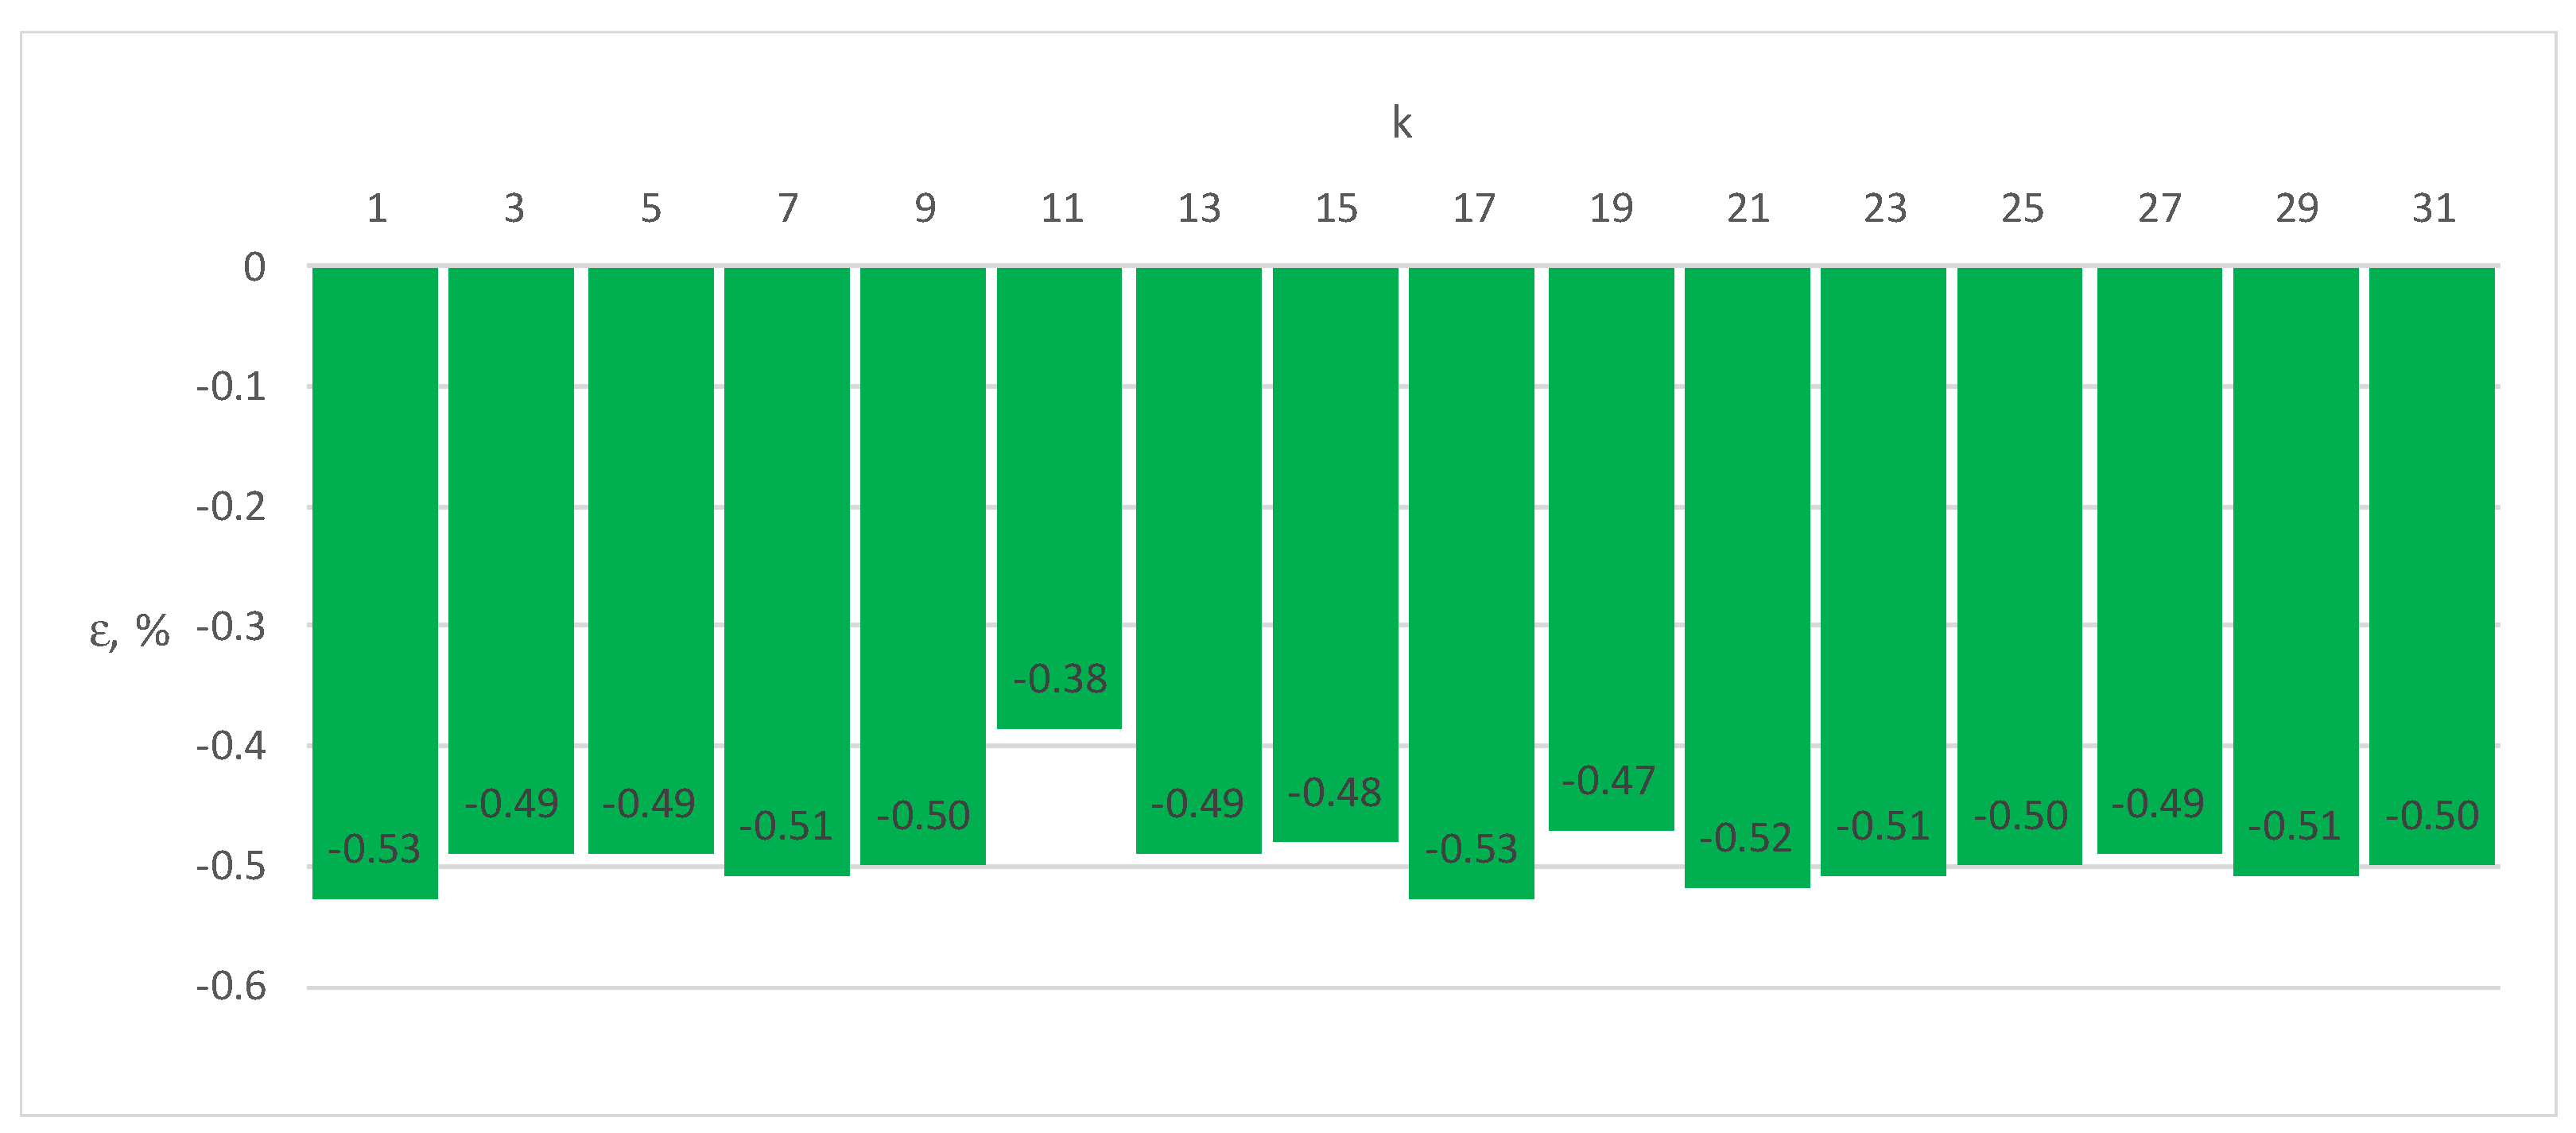
Figure 13.
Errors ε of Energy Meter 1 for load current distorted by sequence of harmonics k = 1, 3, 5, ... 31 (100% of the base current Ib, cosφ = 1).
Figure 13.
Errors ε of Energy Meter 1 for load current distorted by sequence of harmonics k = 1, 3, 5, ... 31 (100% of the base current Ib, cosφ = 1).
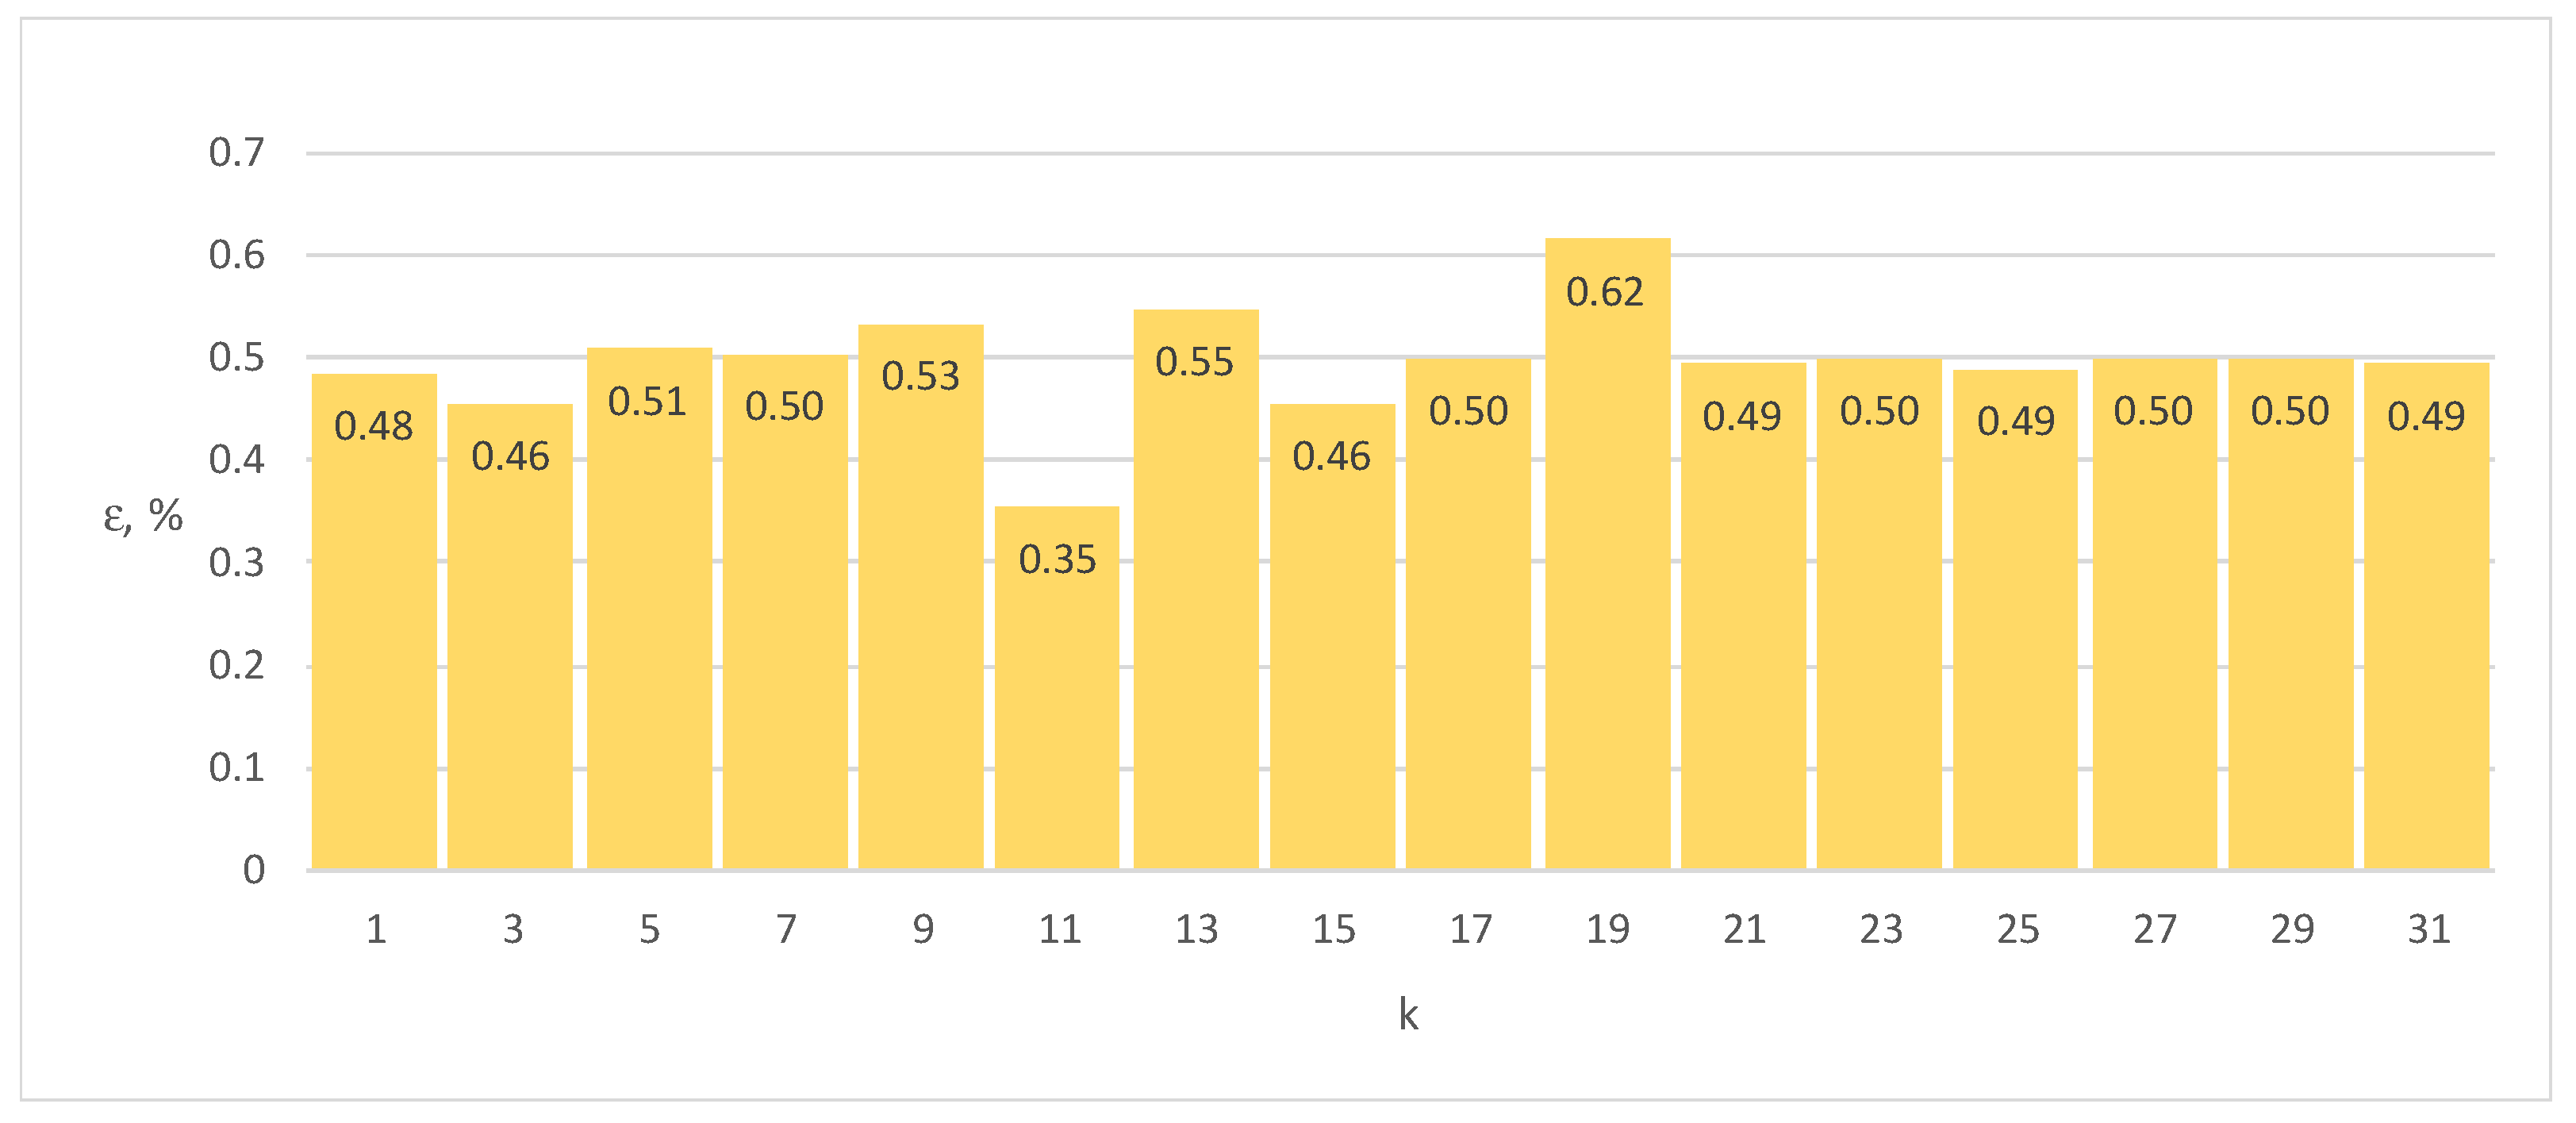
Figure 14.
Errors ε of Energy Meter 2 for load current distorted by sequence of harmonics k = 1, 3, 5, ... 31 (100% of the base current Ib, cosφ = 1).
Figure 14.
Errors ε of Energy Meter 2 for load current distorted by sequence of harmonics k = 1, 3, 5, ... 31 (100% of the base current Ib, cosφ = 1).
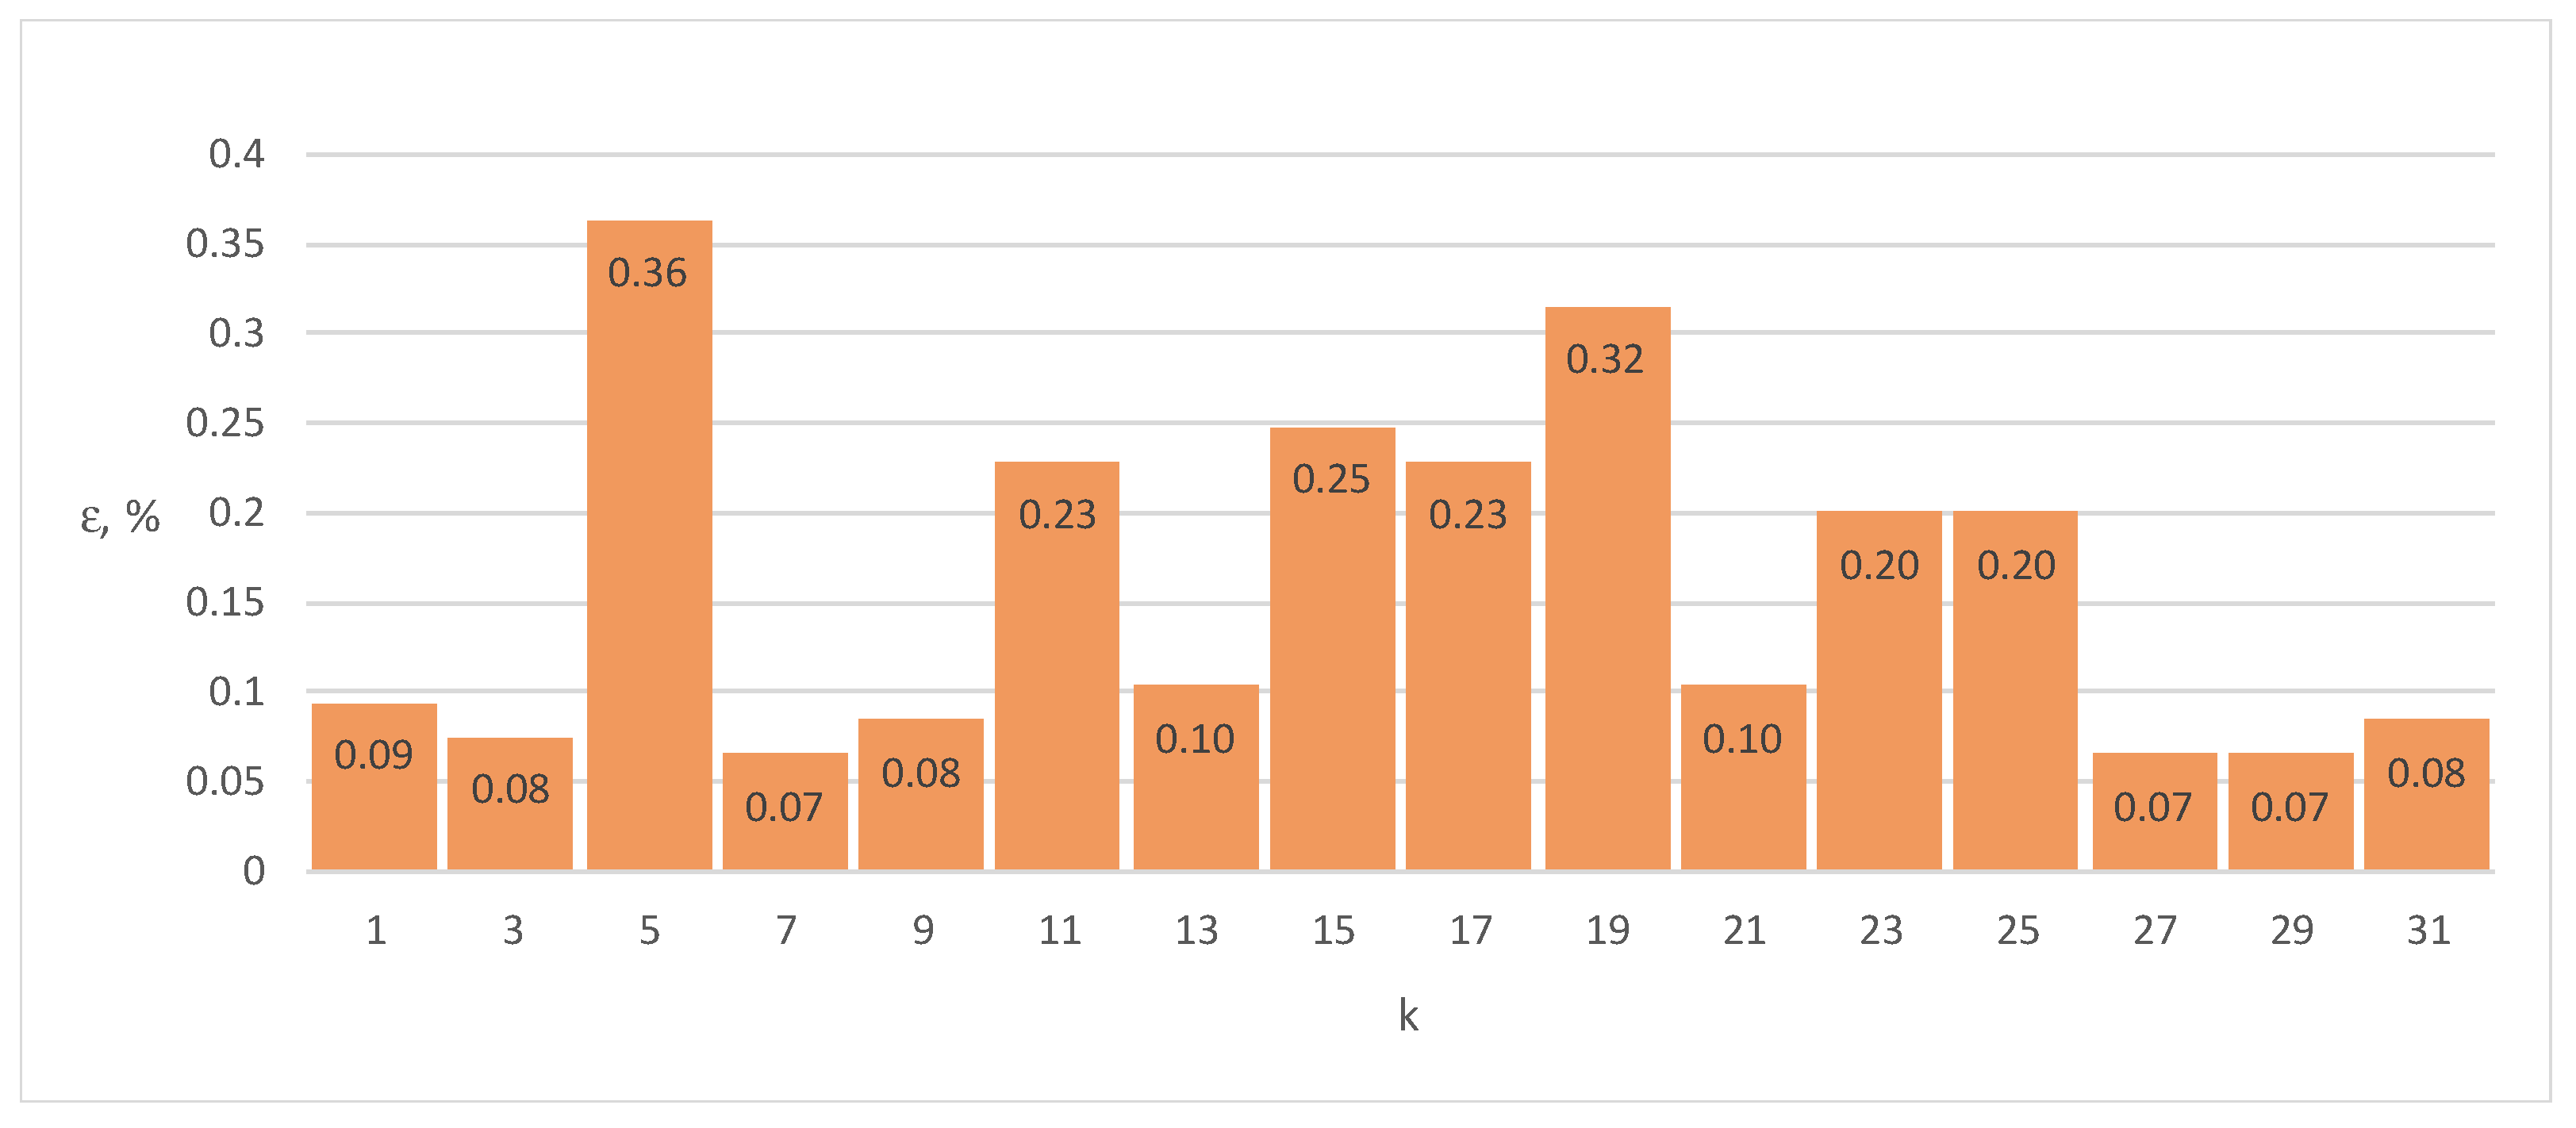
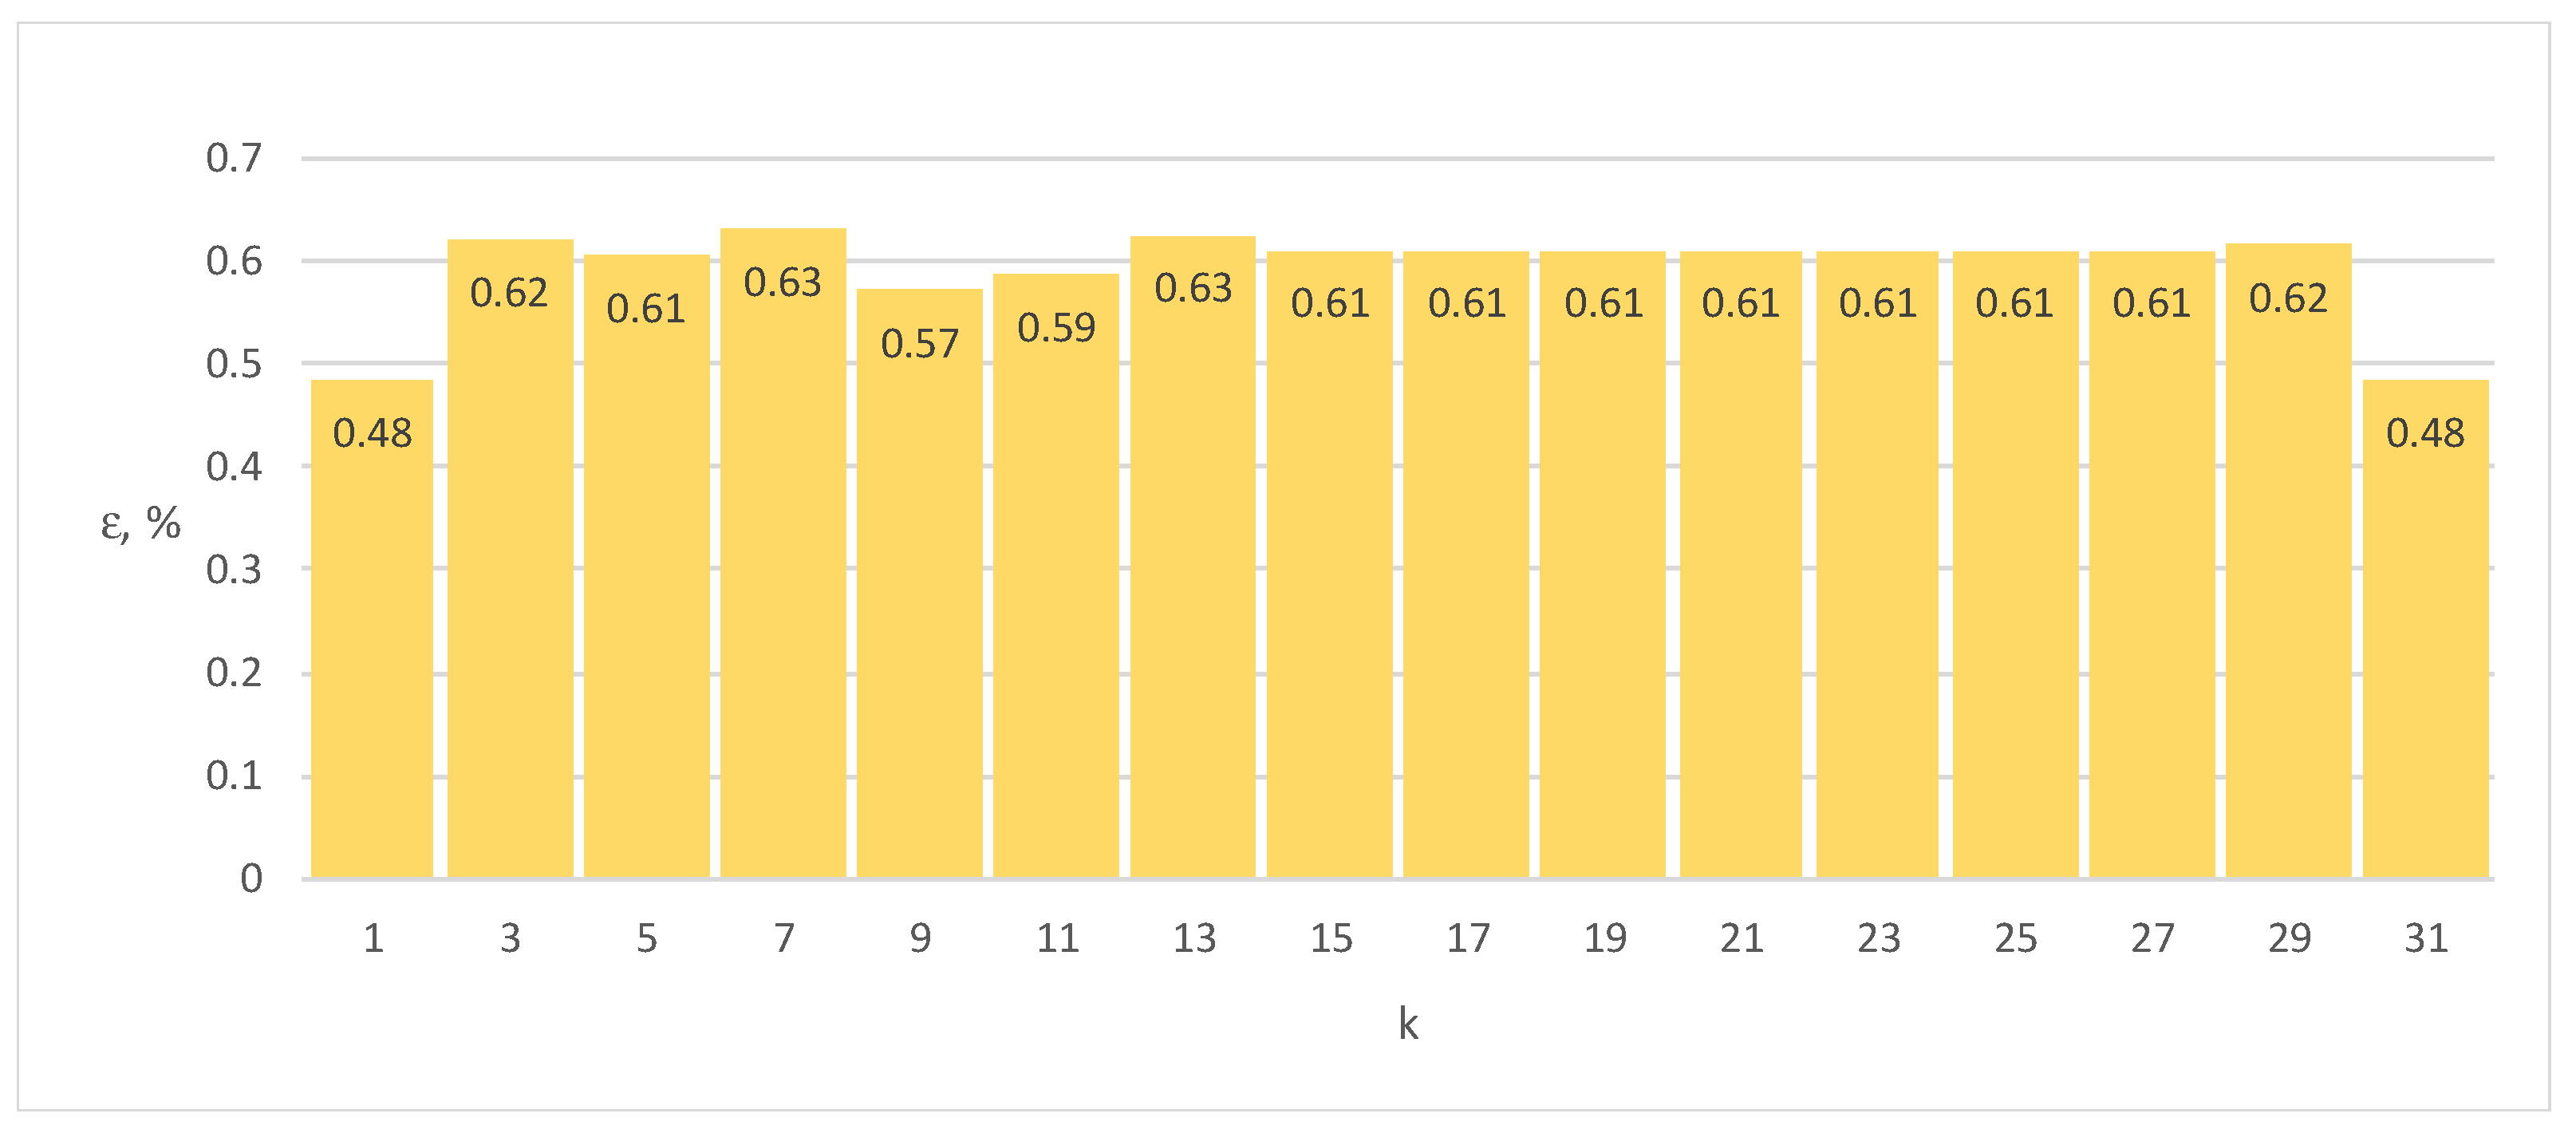
Figure 15.
Errors ε of Energy Meter 3 for load current distorted by sequence of harmonics k = 1, 3, 5, ... 31 (100% of the base current Ib, cosφ = 1).
Figure 15.
Errors ε of Energy Meter 3 for load current distorted by sequence of harmonics k = 1, 3, 5, ... 31 (100% of the base current Ib, cosφ = 1).
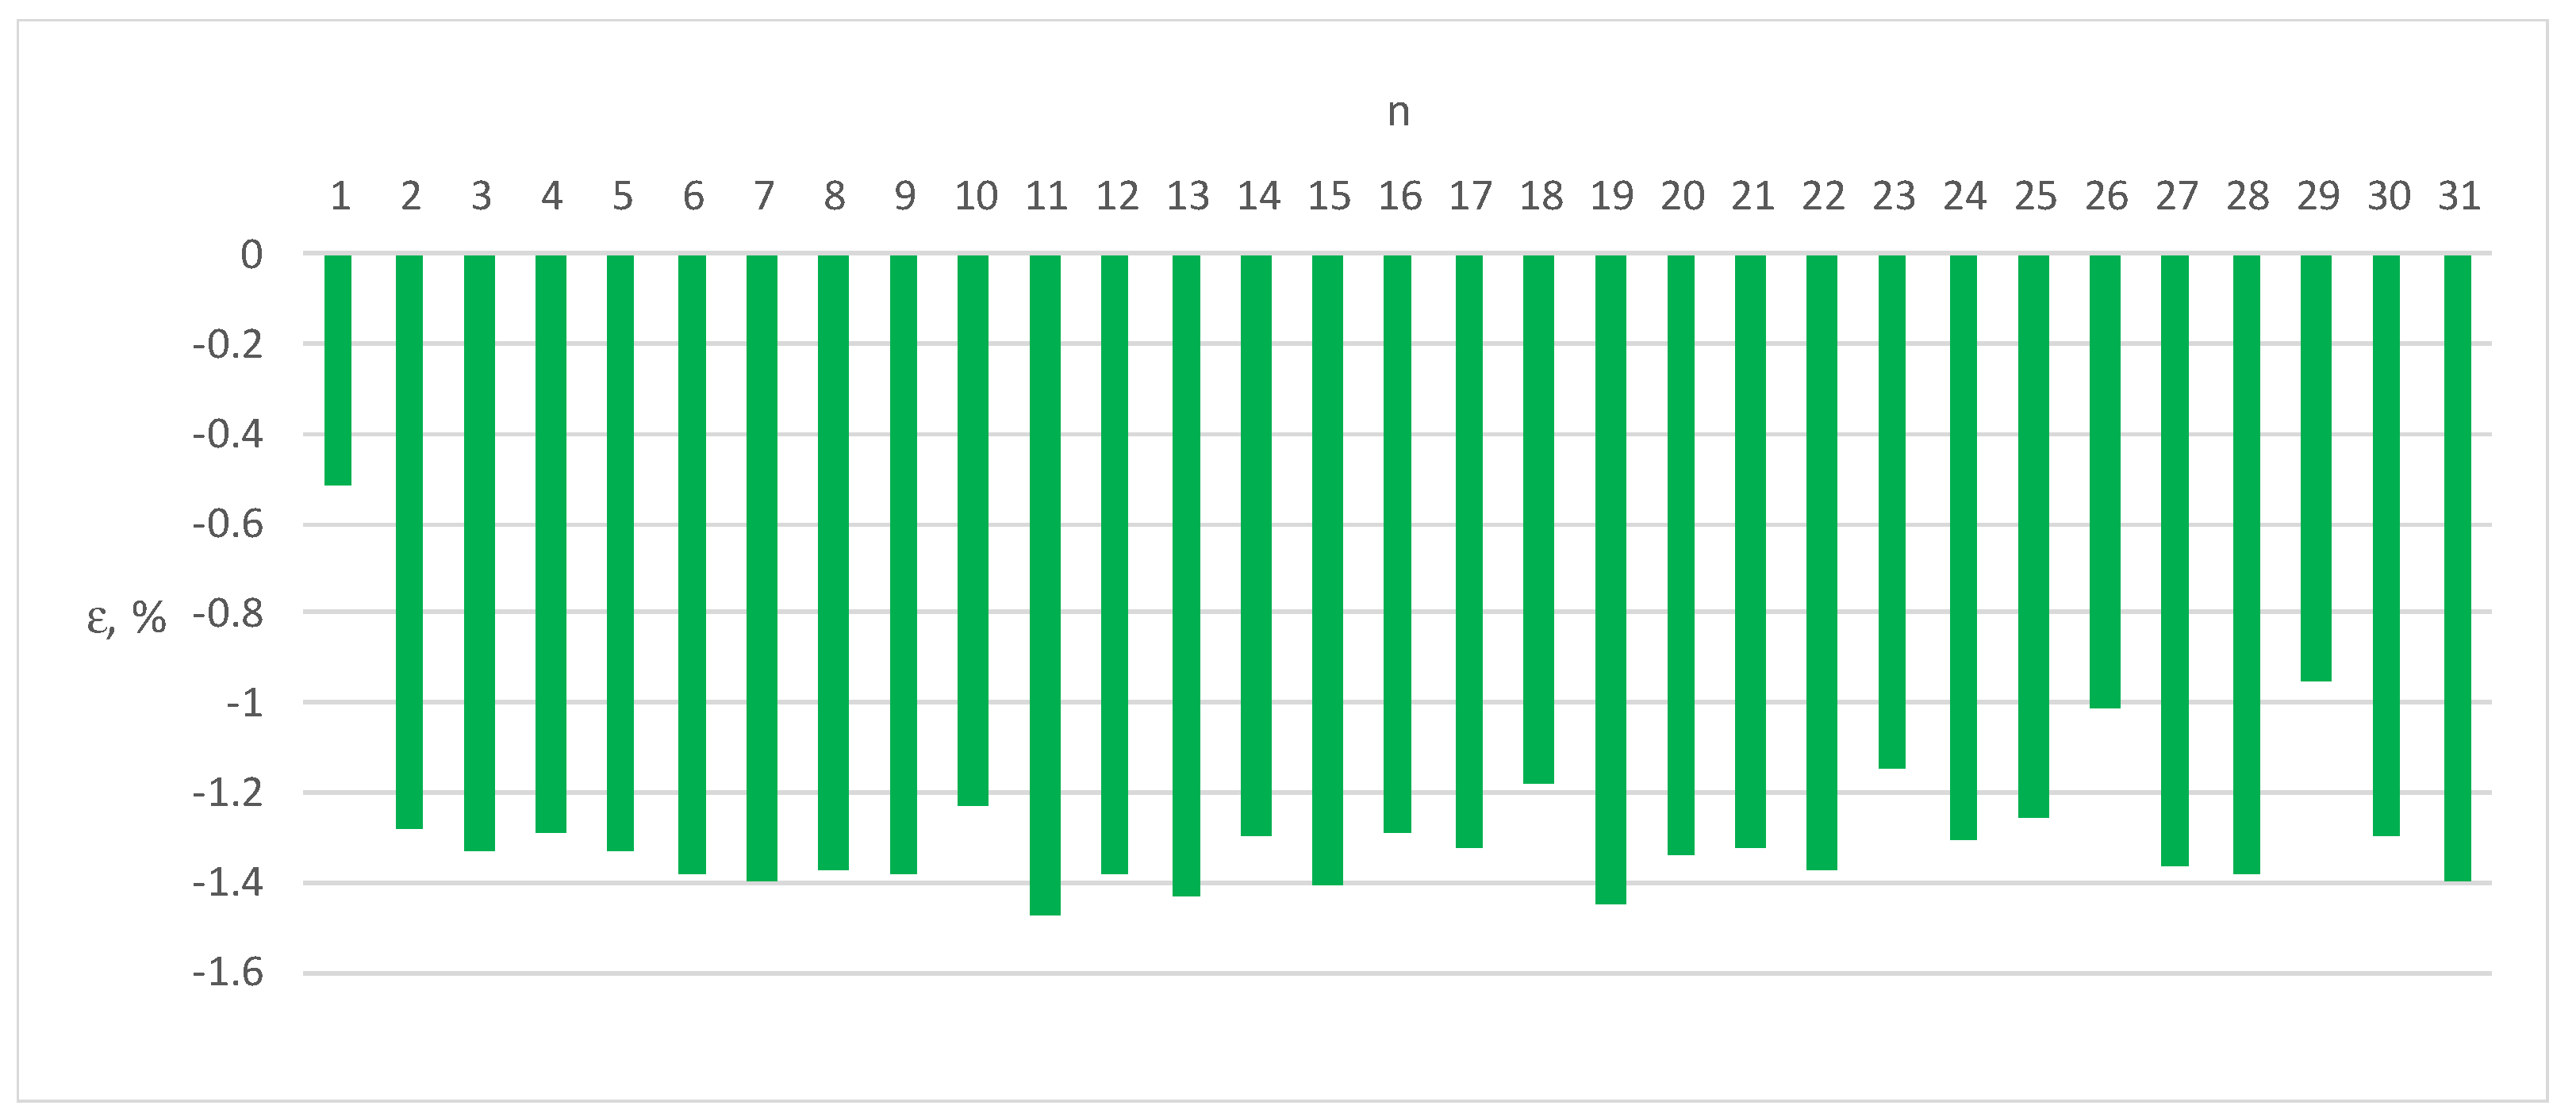
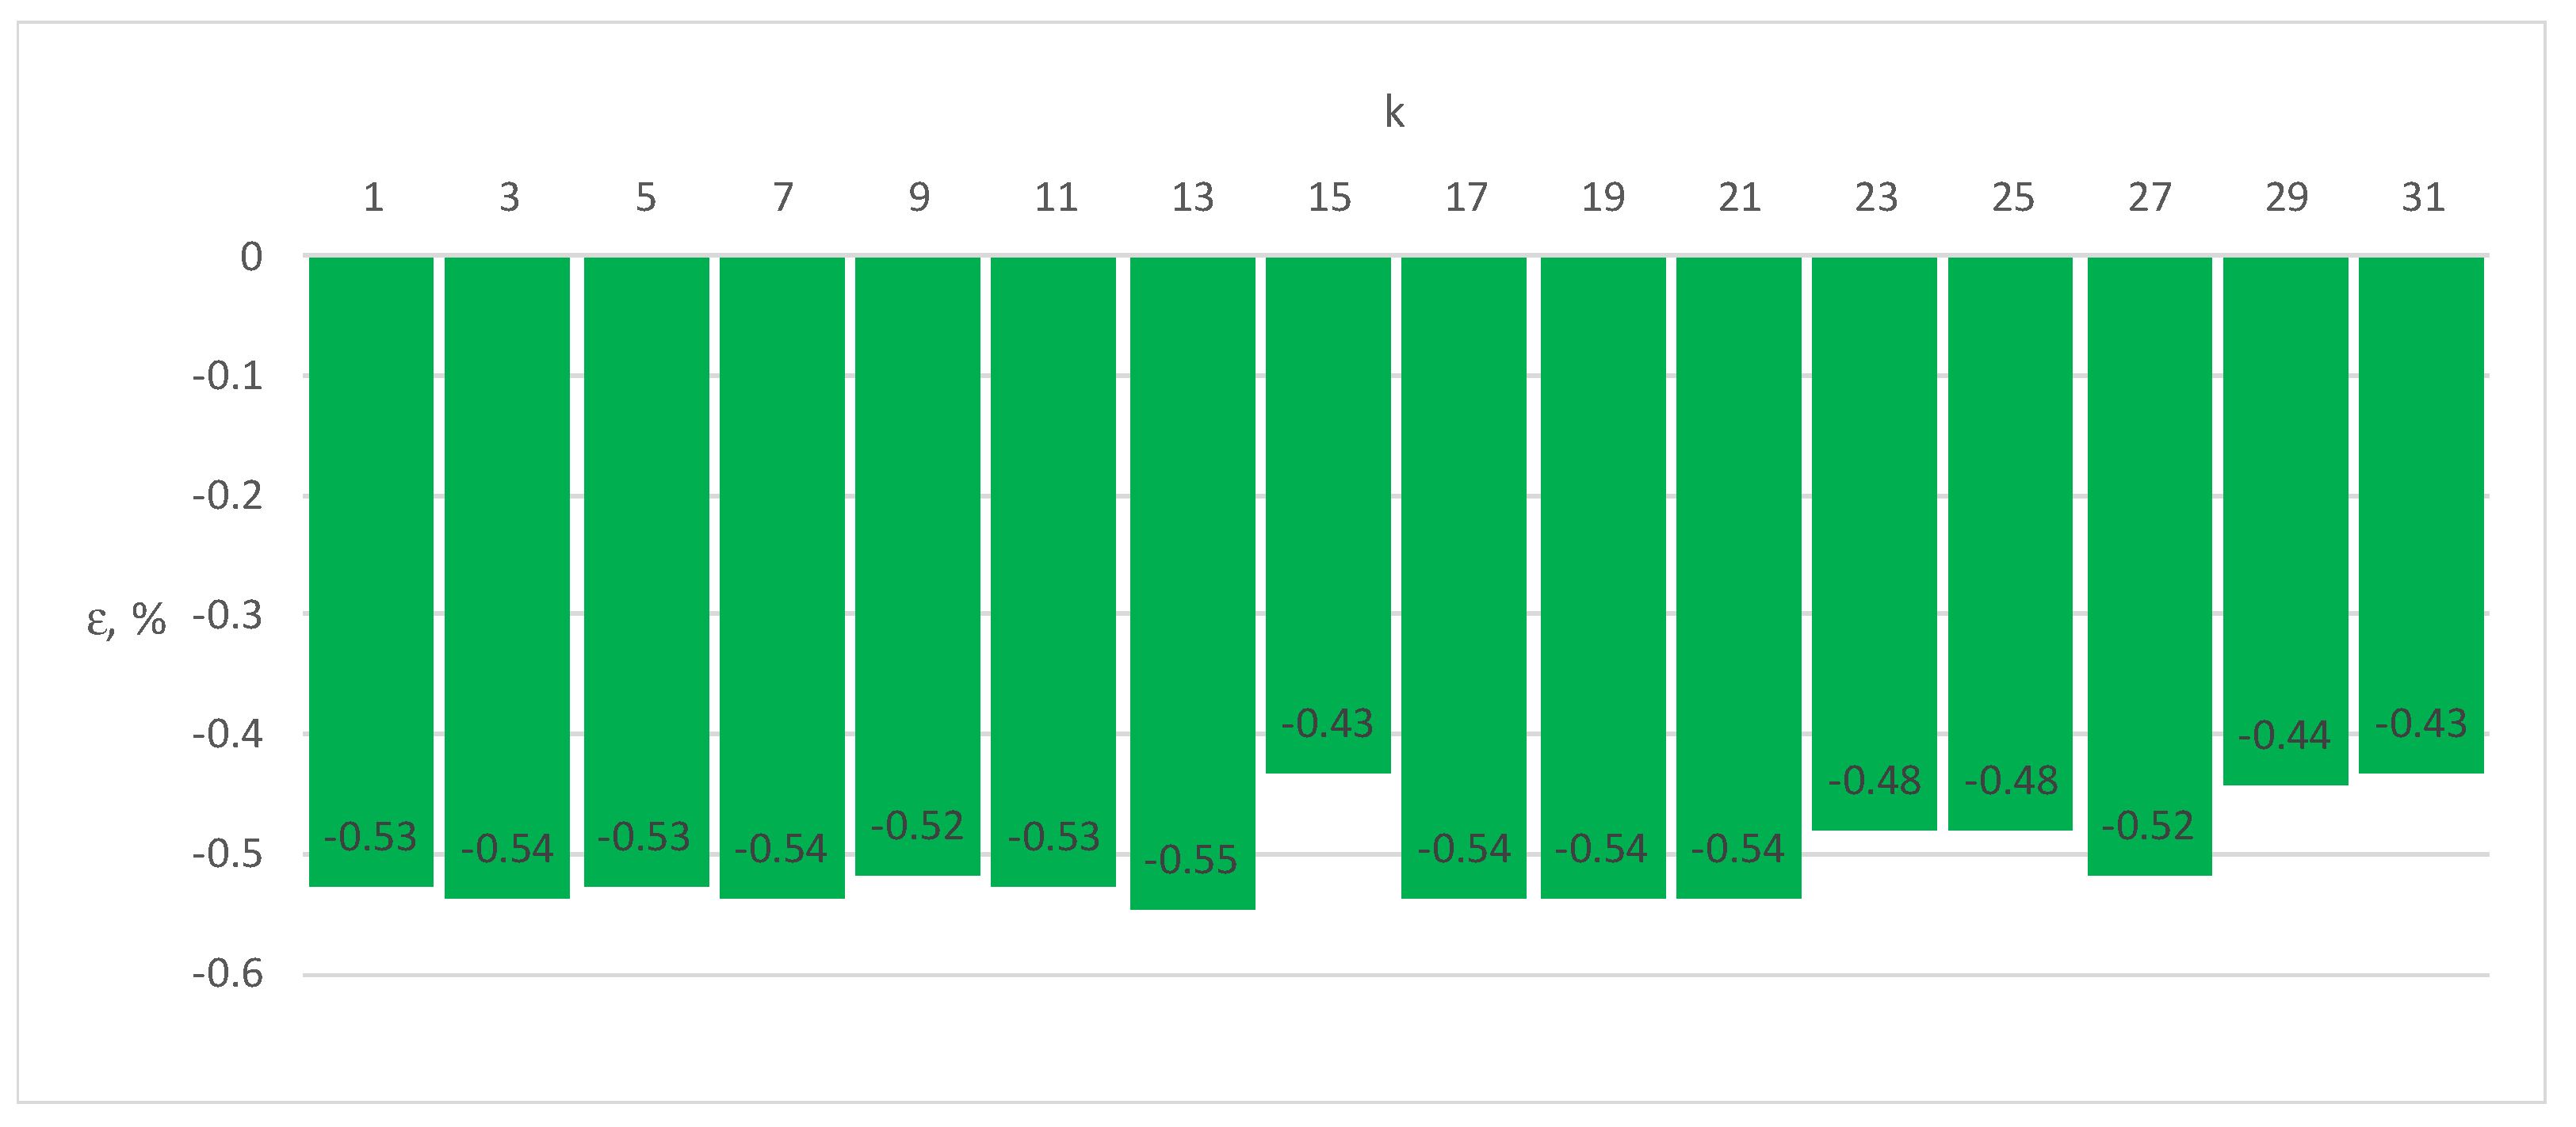
Figure 16.
Errors ε of Energy Meter 1 for load current distorted by sequence of harmonics k = 1, 3, 5, ... 31 with variable phase shifts of individual harmonics (100% of the base current Ib, cosφ = 1).
Figure 16.
Errors ε of Energy Meter 1 for load current distorted by sequence of harmonics k = 1, 3, 5, ... 31 with variable phase shifts of individual harmonics (100% of the base current Ib, cosφ = 1).
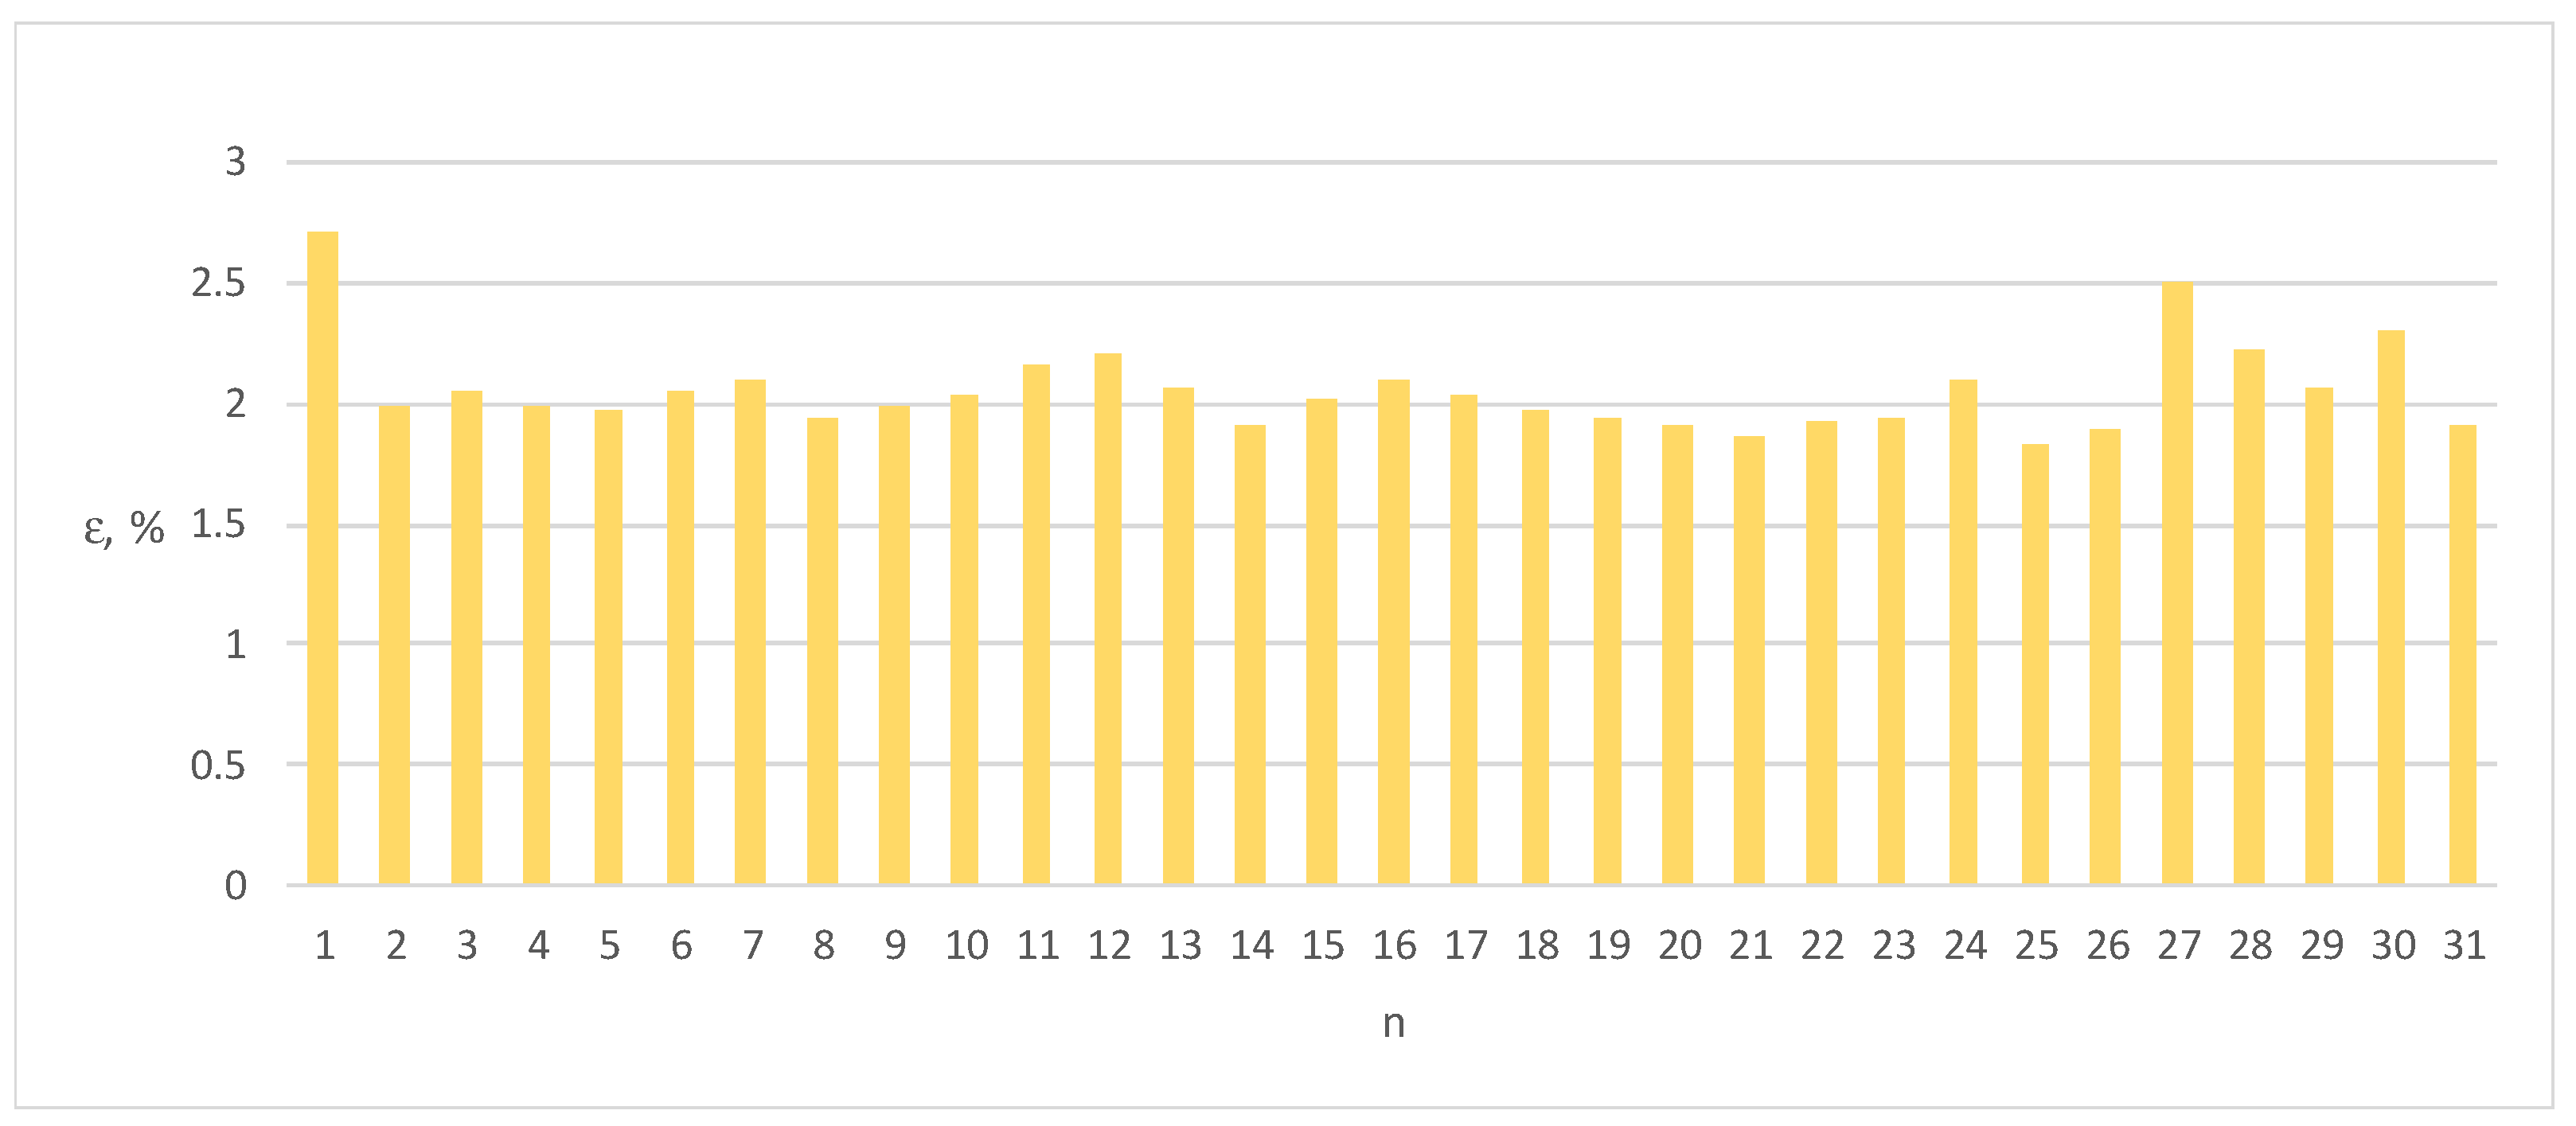
Figure 17.
Errors ε of Energy Meter 2 for load current distorted by sequence of harmonics k = 1, 3, 5, ... 31 with variable phase shifts of individual harmonics (100% of the base current Ib, cosφ = 1).
Figure 17.
Errors ε of Energy Meter 2 for load current distorted by sequence of harmonics k = 1, 3, 5, ... 31 with variable phase shifts of individual harmonics (100% of the base current Ib, cosφ = 1).
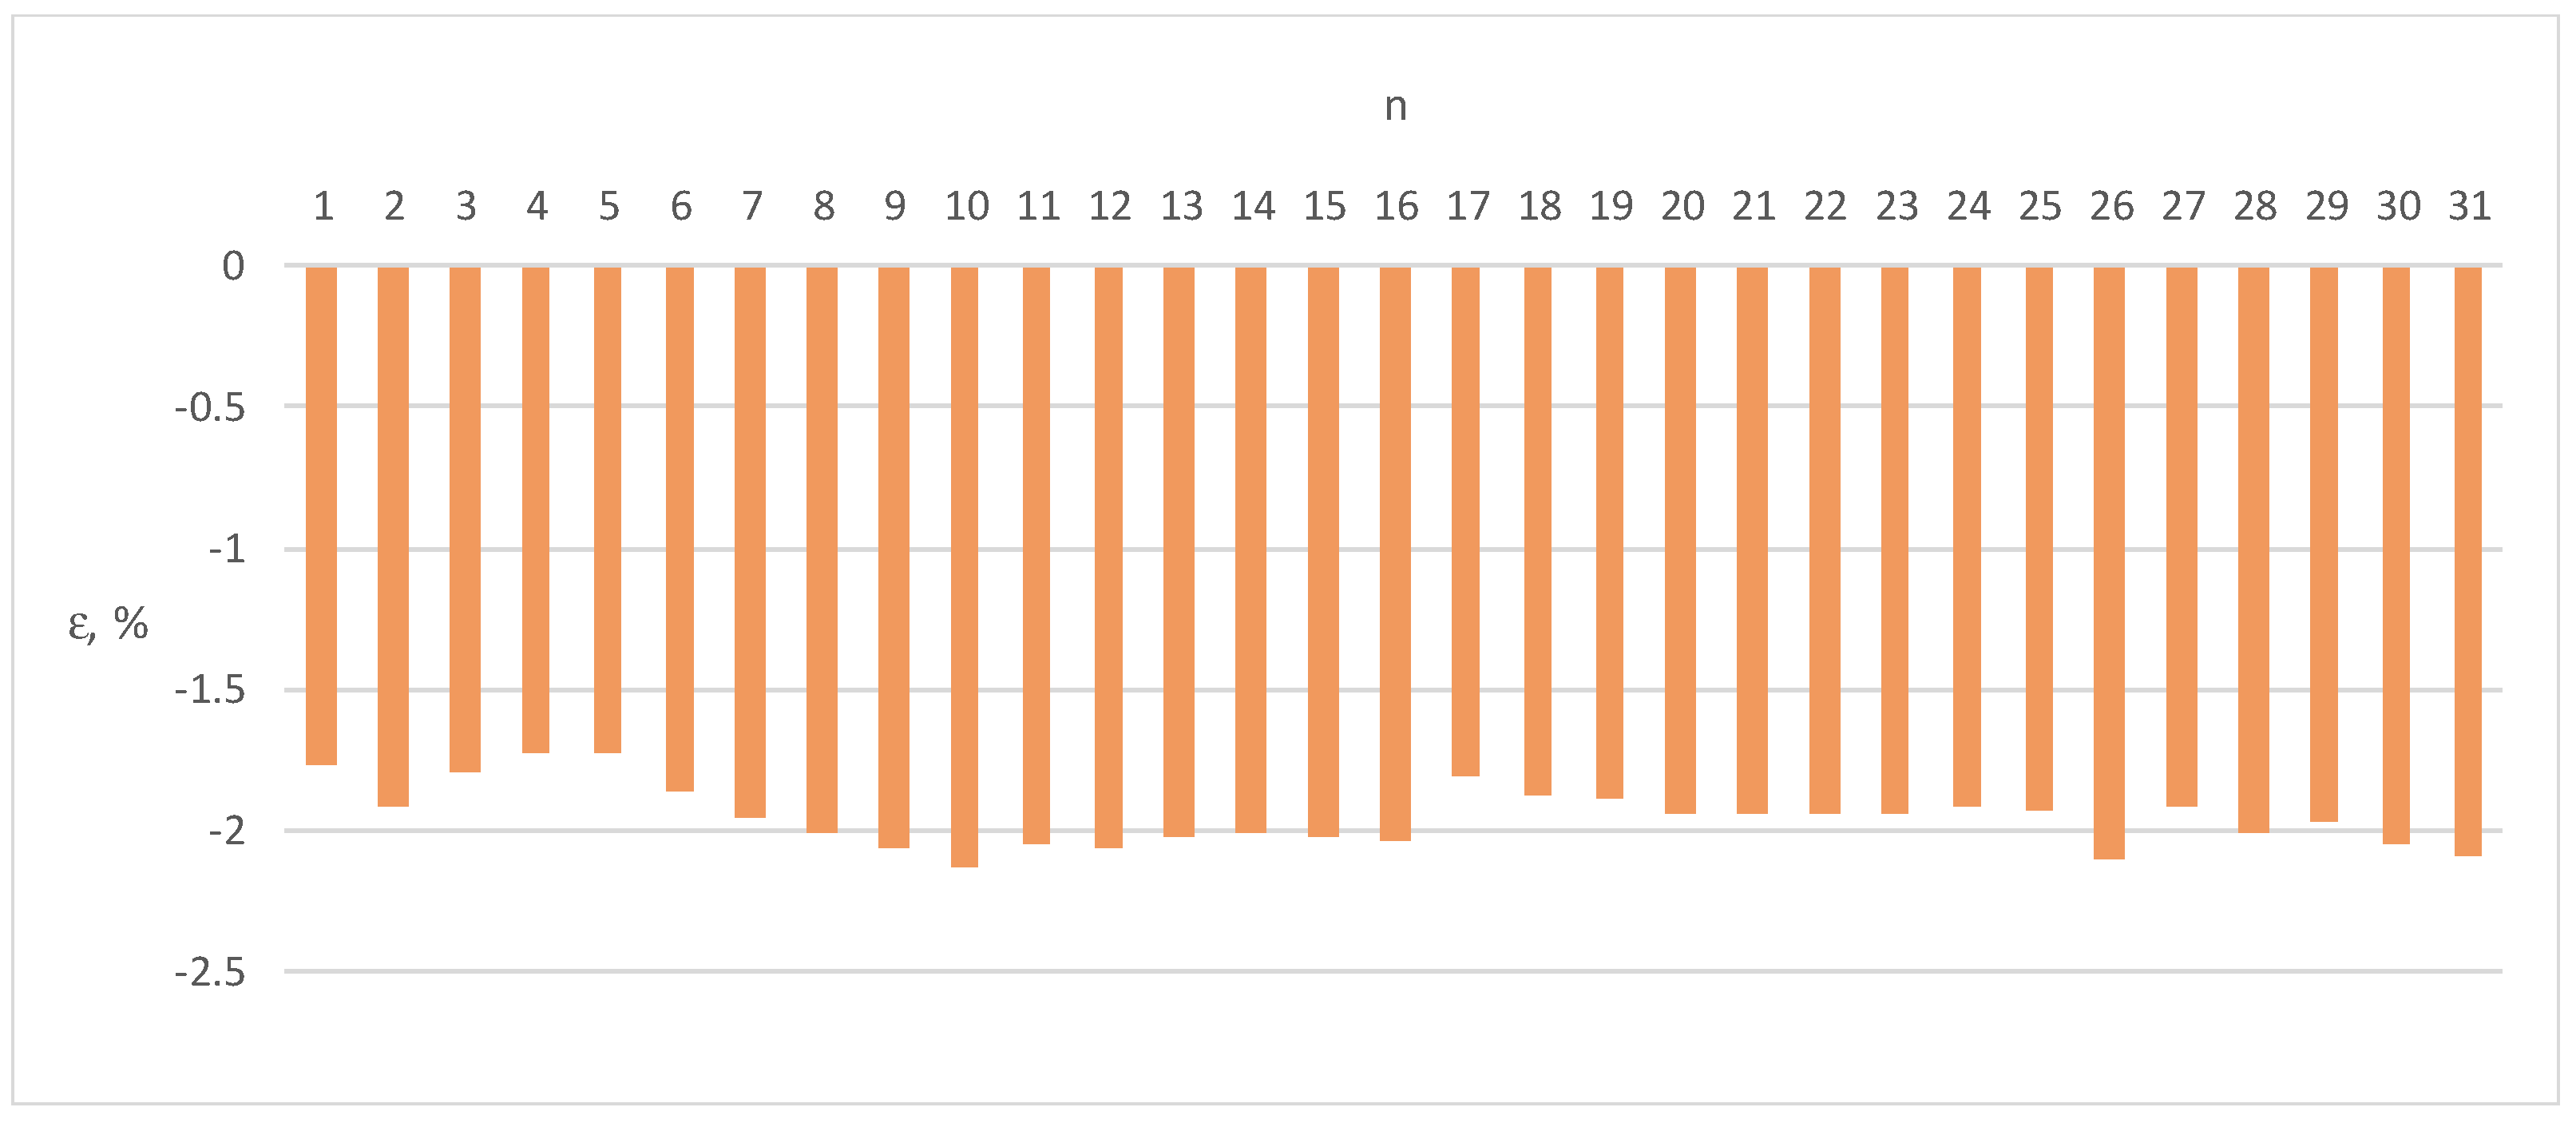
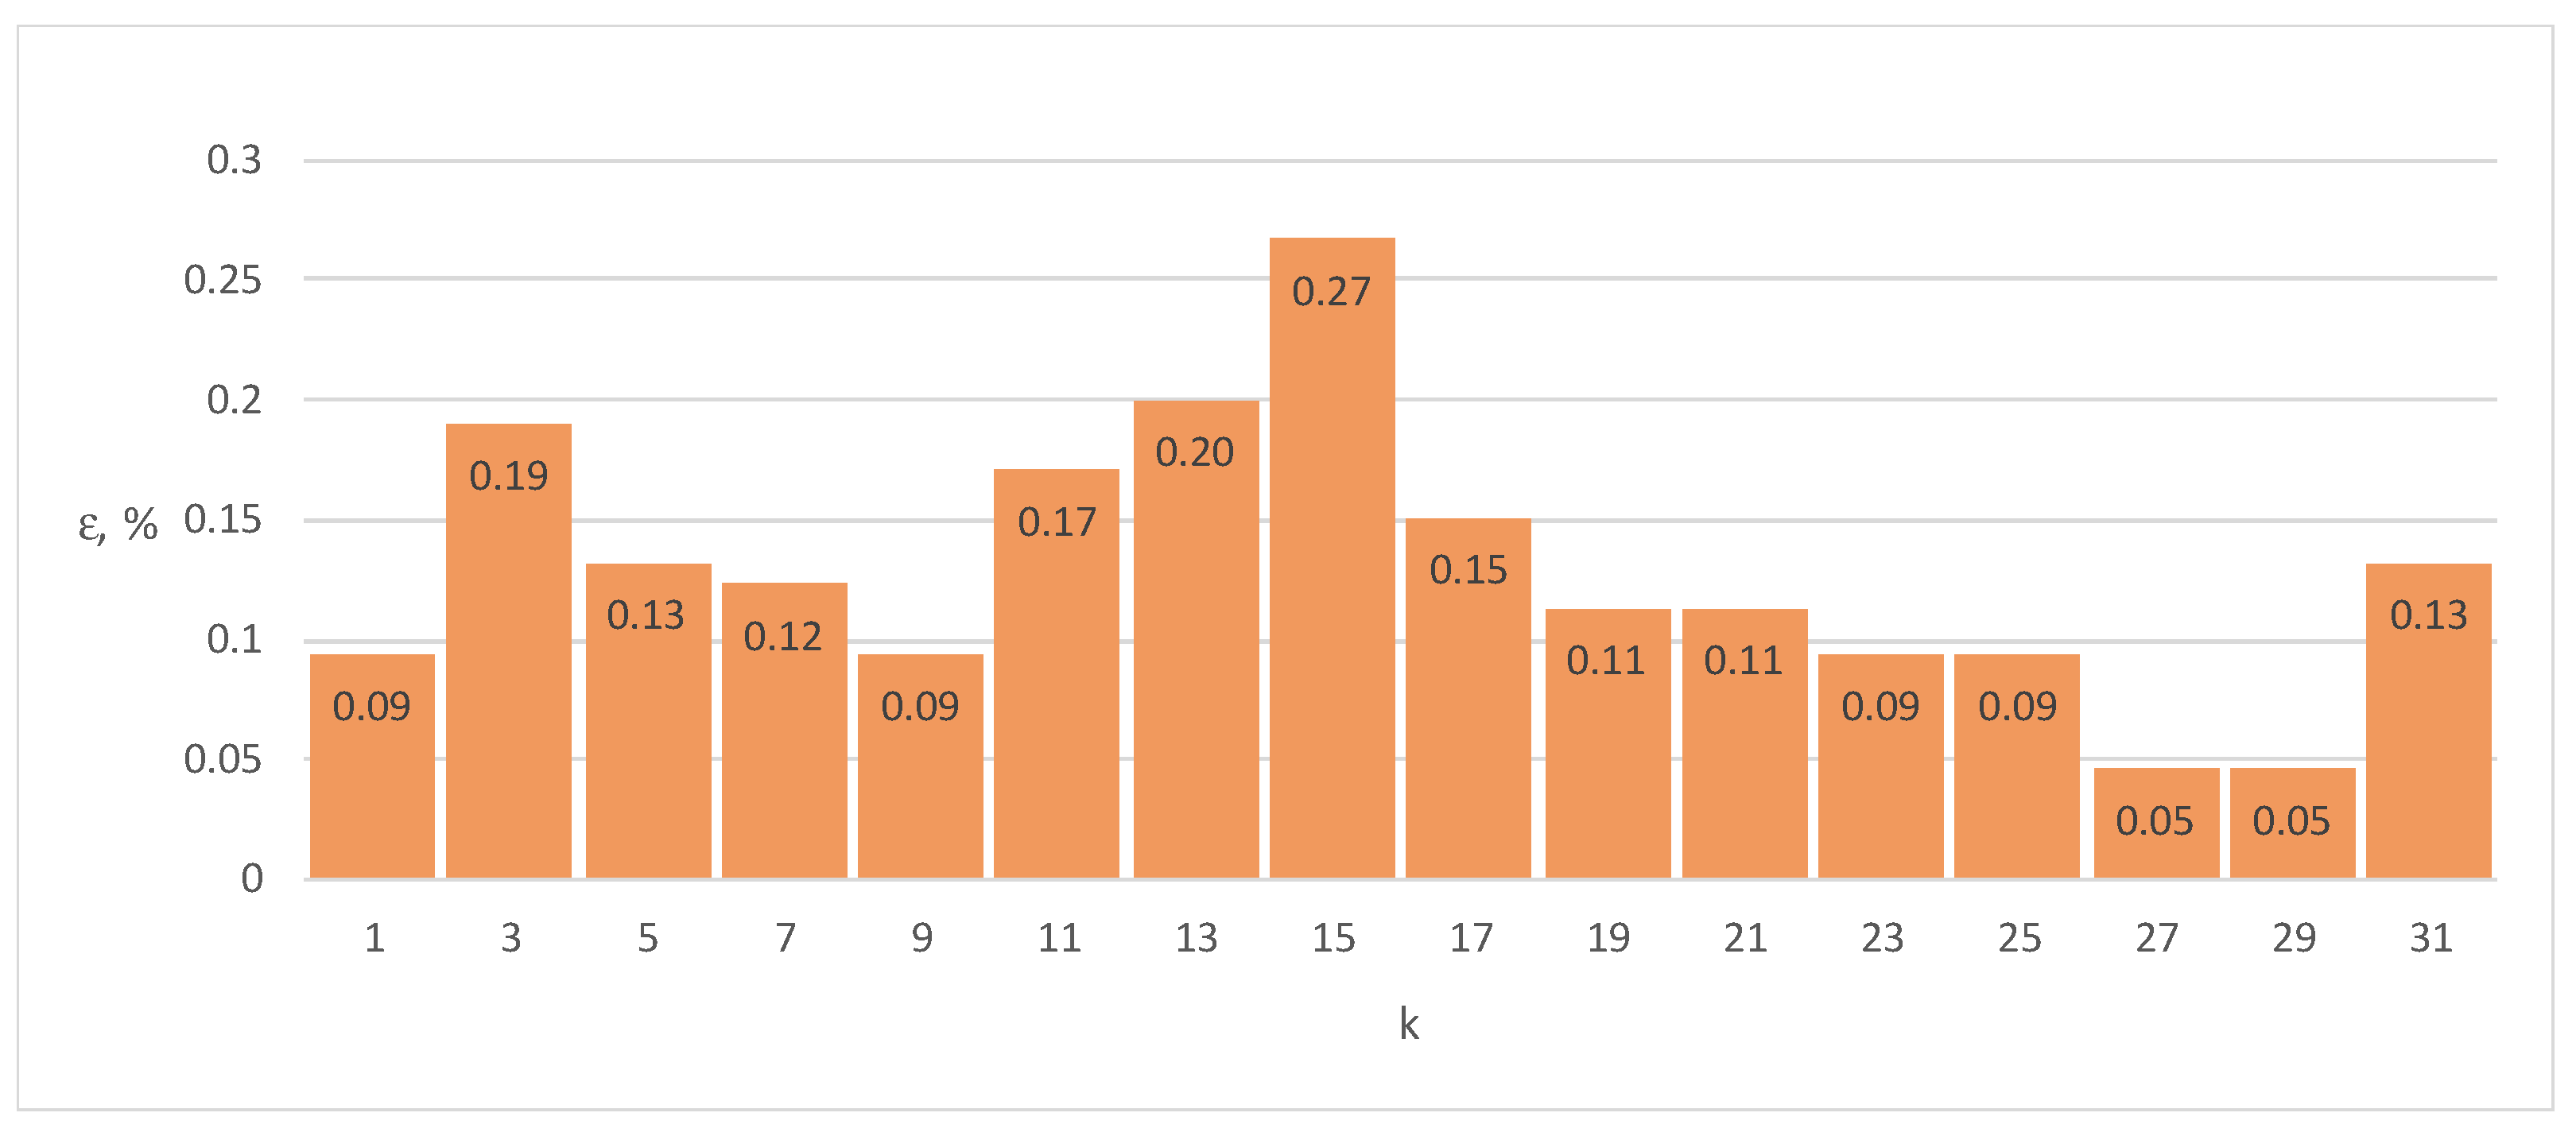
Figure 18.
Errors ε of Energy Meter 3 for load current distorted by sequence of harmonics k = 1, 3, 5, ... 31 with variable phase shifts of individual harmonics (100% of the base current Ib, cosφ = 1).
Figure 18.
Errors ε of Energy Meter 3 for load current distorted by sequence of harmonics k = 1, 3, 5, ... 31 with variable phase shifts of individual harmonics (100% of the base current Ib, cosφ = 1).
Table 1.
Summary of energy meters errors for sinusoidal load currents.
Table 1.
Summary of energy meters errors for sinusoidal load currents.
| | Energy Meter 1 | Energy Meter 2 | Energy Meter 3 |
|---|
| ε1, % | ε2, % | ε3, % | ε1, % | ε2, % | ε3, % | ε1, % | ε2, % | ε3, % |
|---|
| 0.1 Ib, cosφ = 1 | −0.675 | −0.703 | −0.684 | 0.683 | 0.683 | 0.702 | 0.489 | 0.489 | 0.489 |
| 1 Ib, cosφ = 1 | −0.526 | −0.526 | −0.526 | 0.484 | 0.484 | 0.484 | 0.084 | 0.094 | 0.103 |
| 1 Ib, cosφ = 0.5 | −0.232 | −0.512 | −0.593 | 2.705 | 2.712 | 2.732 | −1.758 | −1.721 | −1.684 |
| 4 Ib, cosφ = 1 | −0.583 | −0.583 | −0.583 | 0.345 | 0.346 | 0.353 | −0.412 | −0.450 | −0.334 |
Table 2.
Summary of energy meters errors for distorted load currents (100% of the second harmonic).
Table 2.
Summary of energy meters errors for distorted load currents (100% of the second harmonic).
| | Energy Meter 1 | Energy Meter 2 | Energy Meter 3 |
|---|
| ε1, % | ε2, % | ε3, % | ε1, % | ε2, % | ε3, % | ε1, % | ε2, % | ε3, % |
|---|
| 0.1 Ib, cosφ = 1 | −0.769 | −0.735 | −0.719 | 0.761 | 0.741 | 0.741 | 0.489 | 0.450 | 0.450 |
| 1 Ib, cosφ = 1 | −0.431 | −0.450 | −0.460 | 0.562 | 0.567 | 0.571 | 0.508 | 0.770 | 0.113 |
| 1 Ib, cosφ = 0.5 | −1.265 | −1.279 | −1.256 | 2.002 | 1.982 | 1.935 | −1.933 | −1.906 | −1.920 |
| 4 Ib, cosφ = 1 | −0.355 | −0.355 | −0.431 | 0.404 | 0.399 | 0.400 | −0.593 | −0.562 | −0.504 |
Table 3.
Summary of energy meters errors for distorted load currents (100% of the third harmonic).
Table 3.
Summary of energy meters errors for distorted load currents (100% of the third harmonic).
| | Energy Meter 1 | Energy Meter 2 | Energy Meter 3 |
|---|
| ε1, % | ε2, % | ε3, % | ε1, % | ε2, % | ε3, % | ε1, % | ε2, % | ε3, % |
|---|
| 0.1 Ib, cosφ = 1 | −0.719 | −0.719 | −0.700 | 0.761 | 0.761 | 0.761 | 0.567 | 0.528 | 0.567 |
| 1 Ib, cosφ = 1 | −0.545 | −0.517 | −0.536 | 0.678 | 0.688 | 0.678 | 0.075 | 0.075 | 0.065 |
| 1 Ib, cosφ = 0.5 | −1.284 | −1.331 | −1.391 | 2.084 | 2.044 | 2.014 | −1.800 | −1.786 | −1.772 |
| 4 Ib, cosφ = 1 | −0.393 | −0.431 | −0.469 | 0.431 | 0.417 | 0.416 | −0.563 | −0.637 | −0.609 |
Table 4.
Summary of energy meters errors for distorted load currents (100% of the 30th harmonic).
Table 4.
Summary of energy meters errors for distorted load currents (100% of the 30th harmonic).
| | Energy Meter 1 | Energy Meter 2 | Energy Meter 3 |
|---|
| ε1, % | ε2, % | ε3, % | ε1, % | ε2, % | ε3, % | ε1, % | ε2, % | ε3, % |
|---|
| 0.1 Ib, cosφ = 1 | −0.574 | −0.656 | −0.668 | 0.722 | 0.722 | 0.741 | 0.644 | 0.605 | 0.605 |
| 1 Ib, cosφ = 1 | −0.536 | −0.536 | −0.536 | 0.610 | 0.620 | 0.673 | 0.200 | 0.200 | 0.151 |
| 1 Ib, cosφ = 0.5 | −1.284 | −1.298 | −1.326 | 2.269 | 2.297 | 2.239 | −1.998 | −2.044 | −2.021 |
| 4 Ib, cosφ = 1 | −0.621 | −0.583 | −0.583 | 0.301 | 0.267 | 0.256 | −0.373 | −0.572 | −0.535 |
Table 5.
Summary of energy meters errors for distorted load currents (100% of the 31st harmonic).
Table 5.
Summary of energy meters errors for distorted load currents (100% of the 31st harmonic).
| | Energy Meter 1 | Energy Meter 2 | Energy Meter 3 |
|---|
| ε1, % | ε2, % | ε3, % | ε1, % | ε2, % | ε3, % | ε1, % | ε2, % | ε3, % |
|---|
| 0.1 Ib, cosφ = 1 | −0.775 | −0.769 | −0.744 | 0.567 | 0.586 | 0.586 | 0.296 | 0.296 | 0.257 |
| 1 Ib, cosφ = 1 | −0.545 | −0.555 | −0.564 | 0.349 | 0.354 | 0.354 | 0.123 | 0.094 | 0.103 |
| 1 Ib, cosφ = 0.5 | −1.410 | −1.401 | −1.438 | 1.957 | 1.905 | 1.877 | −2.007 | −2.081 | −2.159 |
| 4 Ib, cosφ = 1 | −0.469 | −0.507 | −0.545 | 0.189 | 0.190 | 0.199 | −0.569 | −0.557 | −0.540 |
Table 6.
Summary of energy meters errors for distorted load currents (100% 1st, 3% 2nd, 94% 3rd harmonic k = 3).
Table 6.
Summary of energy meters errors for distorted load currents (100% 1st, 3% 2nd, 94% 3rd harmonic k = 3).
| | Energy Meter 1 | Energy Meter 2 | Energy Meter 3 |
|---|
| ε1, % | ε2, % | ε3, % | ε1, % | ε2, % | ε3, % | ε1, % | ε2, % | ε3, % |
|---|
| 0.1 Ib, cosφ = 1 | −0.583 | −0.507 | −0.545 | 0.547 | 0.547 | 0.547 | 0.296 | 0.296 | 0.296 |
| 1 Ib, cosφ = 1 | −0.498 | −0.488 | −0.488 | 0.301 | 0.301 | 0.306 | 0.084 | 0.075 | 0.113 |
| 1 Ib, cosφ = 0.5 | −2.806 | −2.806 | −2.801 | 2.009 | 1.937 | 1.932 | −1.924 | −1.873 | −1.920 |
| 4 Ib, cosφ = 1 | −0.587 | −0.665 | −0.681 | 0.148 | 0.465 | 0.353 | −0.580 | −0.607 | −0.556 |
Table 7.
Summary of energy meters errors for distorted load currents (100% 1st, 3% 2nd, 94% 3rd, 3% 4th, 88% 5th harmonic k = 5).
Table 7.
Summary of energy meters errors for distorted load currents (100% 1st, 3% 2nd, 94% 3rd, 3% 4th, 88% 5th harmonic k = 5).
| | Energy Meter 1 | Energy Meter 2 | Energy Meter 3 |
|---|
| ε1, % | ε2, % | ε3, % | ε1, % | ε2, % | ε3, % | ε1, % | ε2, % | ε3, % |
|---|
| 0.1 Ib, cosφ = 1 | −0.507 | −0.545 | −0.545 | 0.702 | 0.702 | 0.702 | 0.528 | 0.567 | 0.567 |
| 1 Ib, cosφ = 1 | −0.479 | −0.488 | −0.488 | 0.426 | 0.426 | 0.426 | 0.354 | 0.363 | 0.373 |
| 1 Ib, cosφ = 0.5 | −2.788 | −2.842 | −2.896 | 2.282 | 2.287 | 2.292 | −1.549 | −1.480 | −1.549 |
| 4 Ib, cosφ = 1 | −0.693 | −0.724 | −0.684 | 0.288 | 0.258 | 0.268 | −0.514 | −0.563 | −0.574 |
Table 8.
Summary of energy meters errors for distorted load currents (100% 1st, 3% 2nd, 94% 3rd, 3% 4th, 88% 5th … 3% 28th, 16% 29th harmonic k = 29).
Table 8.
Summary of energy meters errors for distorted load currents (100% 1st, 3% 2nd, 94% 3rd, 3% 4th, 88% 5th … 3% 28th, 16% 29th harmonic k = 29).
| | Energy Meter 1 | Energy Meter 2 | Energy Meter 3 |
|---|
| ε1, % | ε2, % | ε3, % | ε1, % | ε2, % | ε3, % | ε1, % | ε2, % | ε3, % |
|---|
| 0.1 Ib, cosφ = 1 | −0.583 | −0.545 | −0.507 | 0.741 | 0.741 | 0.741 | 0.257 | 0.257 | 0.296 |
| 1 Ib, cosφ = 1 | −0.498 | −0.507 | −0.498 | 0.499 | 0.494 | 0.494 | 0.055 | 0.065 | 0.075 |
| 1 Ib, cosφ = 0.5 | −2.864 | −2.855 | −2.860 | 2.089 | 2.094 | 2.104 | −2.090 | −2.071 | −2.071 |
| 4 Ib, cosφ = 1 | −0.670 | −0.677 | −0.663 | 0.289 | 0.267 | 0.260 | −0.552 | −0.616 | −0.665 |
Table 9.
Summary of energy meters errors for distorted load currents (100% 1st, 3% 2nd, 94% 3rd, 3% 4th, 88% 5th … 3% 30th, 10% 31st harmonic k = 31).
Table 9.
Summary of energy meters errors for distorted load currents (100% 1st, 3% 2nd, 94% 3rd, 3% 4th, 88% 5th … 3% 30th, 10% 31st harmonic k = 31).
| | Energy Meter 1 | Energy Meter 2 | Energy Meter 3 |
|---|
| ε1, % | ε2, % | ε3, % | ε1, % | ε2, % | ε3, % | ε1, % | ε2, % | ε3, % |
|---|
| 0.1 Ib, cosφ = 1 | −0.583 | −0.545 | −0.583 | 0.741 | 0.741 | 0.761 | 0.296 | 0.257 | 0.257 |
| 1 Ib, cosφ = 1 | −0.498 | −0.498 | −0.507 | 0.504 | 0.504 | 0.504 | 0.094 | 0.084 | 0.075 |
| 1 Ib, cosφ = 0.5 | −2.896 | −2.892 | −2.864 | 2.064 | 2.069 | 2.082 | −1.878 | −1.836 | −1.892 |
| 4 Ib, cosφ = 1 | −0.658 | −0.661 | −0.668 | 0.292 | 0.268 | 0.255 | −0.491 | −0.550 | −0.605 |
Table 10.
Summary of energy meters errors for distorted load currents with variable phase shifts of individual harmonics (100% 1st, 3% 2nd, 94% 3rd harmonic k = 3).
Table 10.
Summary of energy meters errors for distorted load currents with variable phase shifts of individual harmonics (100% 1st, 3% 2nd, 94% 3rd harmonic k = 3).
| | Energy Meter 1 | Energy Meter 2 | Energy Meter 3 |
|---|
| ε1, % | ε2, % | ε3, % | ε1, % | ε2, % | ε3, % | ε1, % | ε2, % | ε3, % |
|---|
| 0.1 Ib, cosφ = 1 | −0.583 | −0.545 | −0.583 | 0.858 | 0.858 | 0.858 | 0.296 | 0.257 | 0.296 |
| 1 Ib, cosφ = 1 | −0.526 | −0.536 | −0.536 | 0.620 | 0.620 | 0.615 | 0.248 | 0.190 | 0.209 |
| 1 Ib, cosφ = 0.5 | −1.247 | −1.247 | −1.242 | 2.237 | 2.212 | 2.217 | −2.007 | −1.943 | −1.956 |
| 4 Ib, cosφ = 1 | −0.687 | −0.697 | −0.722 | 0.385 | 0.371 | 0.365 | −0.567 | −0.618 | −0.569 |
Table 11.
Summary of energy meters errors for distorted load currents with variable phase shifts of individual harmonics (100% 1st, 3% 2nd, 94% 3rd, 3% 4th, 88% 5th harmonic n = 5).
Table 11.
Summary of energy meters errors for distorted load currents with variable phase shifts of individual harmonics (100% 1st, 3% 2nd, 94% 3rd, 3% 4th, 88% 5th harmonic n = 5).
| | Energy Meter 1 | Energy Meter 2 | Energy Meter 3 |
|---|
| ε1, % | ε2, % | ε3, % | ε1, % | ε2, % | ε3, % | ε1, % | ε2, % | ε3, % |
|---|
| 0.1 Ib, cosφ = 1 | −0.545 | −0.583 | −0.583 | 0.839 | 0.839 | 0.839 | 0.412 | 0.450 | 0.450 |
| 1 Ib, cosφ = 1 | −0.517 | −0.526 | −0.526 | 0.600 | 0.605 | 0.600 | 0.094 | 0.132 | 0.094 |
| 1 Ib, cosφ = 0.5 | −1.176 | −1.172 | −1.158 | 2.217 | 2.214 | 2.222 | −1.947 | −1.979 | −1.952 |
| 4 Ib, cosφ = 1 | −0.703 | −0.679 | −0.681 | 0.668 | 0.575 | 0.562 | −0.469 | −0.496 | −0.599 |
Table 12.
Summary of energy meters errors for distorted load currents with variable phase shifts of individual harmonics (100% 1st, 3% 2nd, 94% 3rd, 3% 4th, 88% 5th … 3% 28th, 16% 29th harmonic k = 29).
Table 12.
Summary of energy meters errors for distorted load currents with variable phase shifts of individual harmonics (100% 1st, 3% 2nd, 94% 3rd, 3% 4th, 88% 5th … 3% 28th, 16% 29th harmonic k = 29).
| | Energy Meter 1 | Energy Meter 2 | Energy Meter 3 |
|---|
| ε1, % | ε2, % | ε3, % | ε1, % | ε2, % | ε3, % | ε1, % | ε2, % | ε3, % |
|---|
| 0.1 Ib, cosφ = 1 | 0.450 | 0.489 | 0.412 | 0.839 | 0.858 | 0.858 | 0.334 | 0.296 | 0.296 |
| 1 Ib, cosφ = 1 | −0.279 | −0.441 | −0.441 | 0.615 | 0.615 | 0.610 | 0.075 | 0.084 | 0.084 |
| 1 Ib, cosφ = 0.5 | −1.345 | −1.382 | −1.456 | 2.134 | 2.134 | 2.144 | −1.869 | −1.883 | −1.832 |
| 4 Ib, cosφ = 1 | −0.362 | −0.673 | −0.694 | 0.417 | 0.391 | 0.384 | −0.630 | −0.604 | −0.537 |
Table 13.
Summary of energy meters errors for distorted load currents with variable phase shifts of individual harmonics (100% 1st, 3% 2nd, 94% 3rd, 3% 4th, 88% 5th … 3% 30th, 10% 31st harmonic k = 31).
Table 13.
Summary of energy meters errors for distorted load currents with variable phase shifts of individual harmonics (100% 1st, 3% 2nd, 94% 3rd, 3% 4th, 88% 5th … 3% 30th, 10% 31st harmonic k = 31).
| | Energy meter 1 | Energy meter 2 | Energy meter 3 |
|---|
| ε1, % | ε2, % | ε3, % | ε1, % | ε2, % | ε3, % | ε1, % | ε2, % | ε3, % |
|---|
| 0.1 Ib, cosφ = 1 | −0.583 | −0.583 | −0.583 | 0.702 | 0.702 | 0.702 | 0.334 | 0.296 | 0.334 |
| 1 Ib, cosφ = 1 | 0.722 | −0.431 | −0.507 | 0.489 | 0.484 | 0.489 | 0.113 | 0.132 | 0.065 |
| 1 Ib, cosφ = 0.5 | −1.256 | −1.251 | −1.247 | 2.102 | 1.967 | 1.855 | −1.855 | −1.855 | −1.827 |
| 4 Ib, cosφ = 1 | −0.177 | −0.694 | −0.169 | 0.354 | 0.399 | 0.369 | −0.506 | −0.461 | −0.535 |


