Article

Prediction Model of Electric Power Carbon Emissions Based on Extended System Dynamics

1
Faculty of Modern Agricultural Engineering, Kunming University of Science and Technology, Kunming 650500, China
2
Yunnan Provincial Field Scientific Observation and Research Station on Water-Soil-Crop System in Seasonal Arid Region, Kunming University of Science and Technology, Kunming 650500, China
3
Yunnan Provincial Key Laboratory of High-Efficiency Water Use and Green Production of Characteristic Crops in Universities, Kunming University of Science and Technology, Kunming 650500, China
4
College of Electrical Engineering and Automation, Shandong University of Science and Technology, Qingdao 266590, China
*
Authors to whom correspondence should be addressed.
Energies 2024, 17(2), 472; https://doi.org/10.3390/en17020472
Submission received: 15 December 2023 / Revised: 10 January 2024 / Accepted: 12 January 2024 / Published: 18 January 2024
(This article belongs to the Special Issue Data-Driven Large-Scale Power System Operations)

Abstract

:
In response to global climate change, China has committed to peaking carbon emissions by 2030 and achieving carbon neutrality by 2060, commonly known as the “30–60 Dual Carbon”. Under the background of “30–60 Dual Carbon”, this article takes the electric power industry, which is the main industry contributing to China’s carbon emission, as the research object, explores the time and peak value of the carbon peak of the electric power industry, and analyzes whether carbon neutrality can be realized under the peak method, so as to get the carbon neutrality path of the electric power industry and serve as the theoretical basis for the formulation of relevant policies. The Environmental Kuznets Curve inspection and the relationship analysis are carried out, then the system dynamics model is constructed, the carbon emissions from 2020 to 2040 are simulated, and the peak time is predicted. Three different scenarios are set to explore the path of electricity carbon neutralization under the premise of a fixed peak. It is shown that Gross Domestic Product per capita index factors have the largest positive contribution, and thermal power share index factors have the largest negative contribution to electricity carbon emissions. Based on the current efforts of the new policy, carbon emissions can achieve the peak carbon emissions’ target before 2030, and it is expected to peak in 2029, with a peak range of about 4.95 billion tons. After the power industry peaks in 2029, i.e., Scenario 3, from coal 44%, gas 9% (2029) to coal 15%, gas 7% (2060), where the CCUS technology is widely used, this scenario can achieve carbon neutrality in electricity by 2060. Adjusting the power supply structure, strictly controlling the proportion of thermal power, optimizing the industrial structure, and popularization of carbon capture, utilization, and storage technology will all contribute to the “dual carbon” target of the power sector.

1. Introduction

The dominance of coal-fired power generation continues to characterize the Chinese power industry, with carbon emissions consistently representing a substantial portion of the total emissions. Consequently, achieving the ‘dual carbon’ goals within the power sector holds significant importance in advancing the national carbon reduction strategy. Accurately forecasting electricity-related carbon emissions stands as a fundamental prerequisite for effective electricity energy planning and the attainment of carbon neutrality objectives.
In recent years, scholars have measured and analyzed China’s carbon emissions. A study [1] had constructed a system dynamics model for forecasting carbon emissions within the power sector. It conducted simulations and analyses on carbon emissions, emission coefficients, and emission intensity under three distinct scenarios spanning from 2005 to 2030. However, the identified policies in China are no longer aligned with the current trajectory of rapid social development. Reference [2] had constructed the IPAT model and used the scenario combination analysis method to predict and evaluate the medium- and long-term energy carbon emissions and peak years in Shanxi Province. Reference [3] used a combination of the scalable stochastic environmental impact assessment model and scenario analysis to predict the emission peak of the whole industry and indicated that China’s industrial sector can reach the emission peak in 2030 and suggested that carbon peak management in this field. References [1,4] simulated the future carbon emissions of the power sector. However, none of the methods used clearly analyzed the impact boundary of the carbon emissions of the power sector, and the prediction time was only up to about 2030 or only the time when the emission peak appeared, but no research on the path of carbon neutrality in the next step was carried out.
In addition, clarifying the impact factors of electricity carbon emissions is an important basis for research on the peak carbon emissions of electricity. The current analysis methods for carbon emission impact factors mainly include the general divisia index method (GDIM) [5], logarithmic mean divisia index (LMDI) [6], structural decomposition analysis (SDA) [7], Stochastic Impacts by Regression on Population, Affluence, and Technology (STIRPAT) model [8], and geographically and temporally weighted regression (GTWR) [9]. Ding et al. constructed a hierarchical LMDI model and discovered that GDP per capita exerted the most significant influence on electricity carbon emissions. Additionally, the structure of electricity production emerged as a crucial factor in mitigating carbon emissions within the electricity sector [10]. Youhua Kong et al. employed the STIRPAT model to examine the influencing factors of industrial carbon emissions in Lanzhou. Their findings revealed that labor productivity, total population, industrial energy intensity, energy structure, and enterprise size positively contributed to carbon emissions, whereas the level of technological development played an inhibitory role [11,12]. These suggest that the energy mix has a non-negligible role to play in both the industrial and electrical sectors and overall carbon emissions.
There are roughly three types of prediction models for carbon emissions, namely, traditional multiple linear models [13], simple intelligent prediction models, and combined prediction models [14,15]. Traditional prediction models and single intelligent prediction models require a large amount of data for training. When the training data are limited, the fitting and prediction performance of the model will deteriorate [16]. Due to the limited training data on carbon emissions, most scholars have adopted a combination of intelligent prediction models for predicting carbon emissions. Reference [17] used an improved particle swarm optimization algorithm to optimize the BP neural network for carbon emissions’ prediction, and the improved particle swarm algorithm improved the accuracy of the neural network model. Grey prediction methods [18] and support vector machines [19] are very common in prediction models, but the above problems still exist. Therefore, many articles use improved optimization algorithms to increase the accuracy of the model. Reference [20] proposed an improved grey model to predict China’s carbon emissions. Compared with linear models and ordinary grey models, the improved model showed better simulation and prediction performance. However, the inner workings of combinatorial optimization algorithms can be difficult to understand, and it is difficult to make predictions about long-term electricity carbon emissions.
In opting for a system dynamics model over other models in predicting carbon emissions, our decision is grounded in a thorough consideration of key factors, ensuring both accuracy and applicability. Firstly, system dynamics models offer distinct advantages in addressing dynamic changes within complex systems. Unlike static models, system dynamics models adeptly capture intricate relationships among carbon emissions and various influencing factors, encompassing feedback loops and dynamic shifts. This model structure enables a more precise representation of the inherent complexity of the system, facilitating effective consideration of both spatial and temporal evolution of carbon emissions. Moreover, system dynamics models excel in modeling causality. The model’s structure enables precise modeling of intricate causal relationships between carbon emissions and individual factors, enhancing our understanding of feedback mechanisms within the system. This not only contributes to scientific research, but also provides robust support for the formulation of strategic policies.
Existing system dynamics models face two primary challenges in predicting carbon emissions: fuzzy modeling boundaries and unclear positioning. Furthermore, their predictive timeframes often extend only until around 2030 or focus solely on the period when carbon emissions peak, without conducting further research on the trajectory towards carbon emission neutrality. This paper uses system dynamics modeling and combines the analysis results of the influencing factors of the extended STIRPAT model to determine the system boundary of carbon emissions in the power industry. When discussing the peak issue of carbon emissions in the power industry, the time boundary of the model is 2020~2040, and carbon neutralization is carried out with path research.
Although there have been many articles on China’s carbon emissions that have studied its influencing factors and their carbon emission predictions, most specific carbon emission predictions are limited to traditional models, such as the BP neural network or STIRPAT model, with large prediction errors. In addition, most of the existing studies are unilateral analysis of influencing factors or carbon emission prediction and do not combine the results of factor analysis with carbon emission prediction.
In order to achieve the goal of carbon neutrality, it is urgent to identify the peak of carbon emissions and its timing as a theoretical basis for formulating relevant policies. This work uses the Environmental Kuznets Curve (EKC) to analyze the relationship between the economy and carbon emissions from electricity. Taking the core decision variables such as economic scale and thermal power ratio (power structure) as controllable variables and incorporating other factors such as industrial structure, urbanization rate, carbon capture, utilization and storage (CCUS) technology scale, etc., the carbon emissions of the power sector are predicted and the carbon peak time of electricity is given, and then based on three scenarios, a clear path to China’s carbon neutrality is given.

2. Factor Decomposition and EKC Analysis of Carbon Emissions of Power Sector Based on Extended STIRPAT Model

2.1. Analysis of the Impact of Carbon Emission Changes in China’s Power Sector
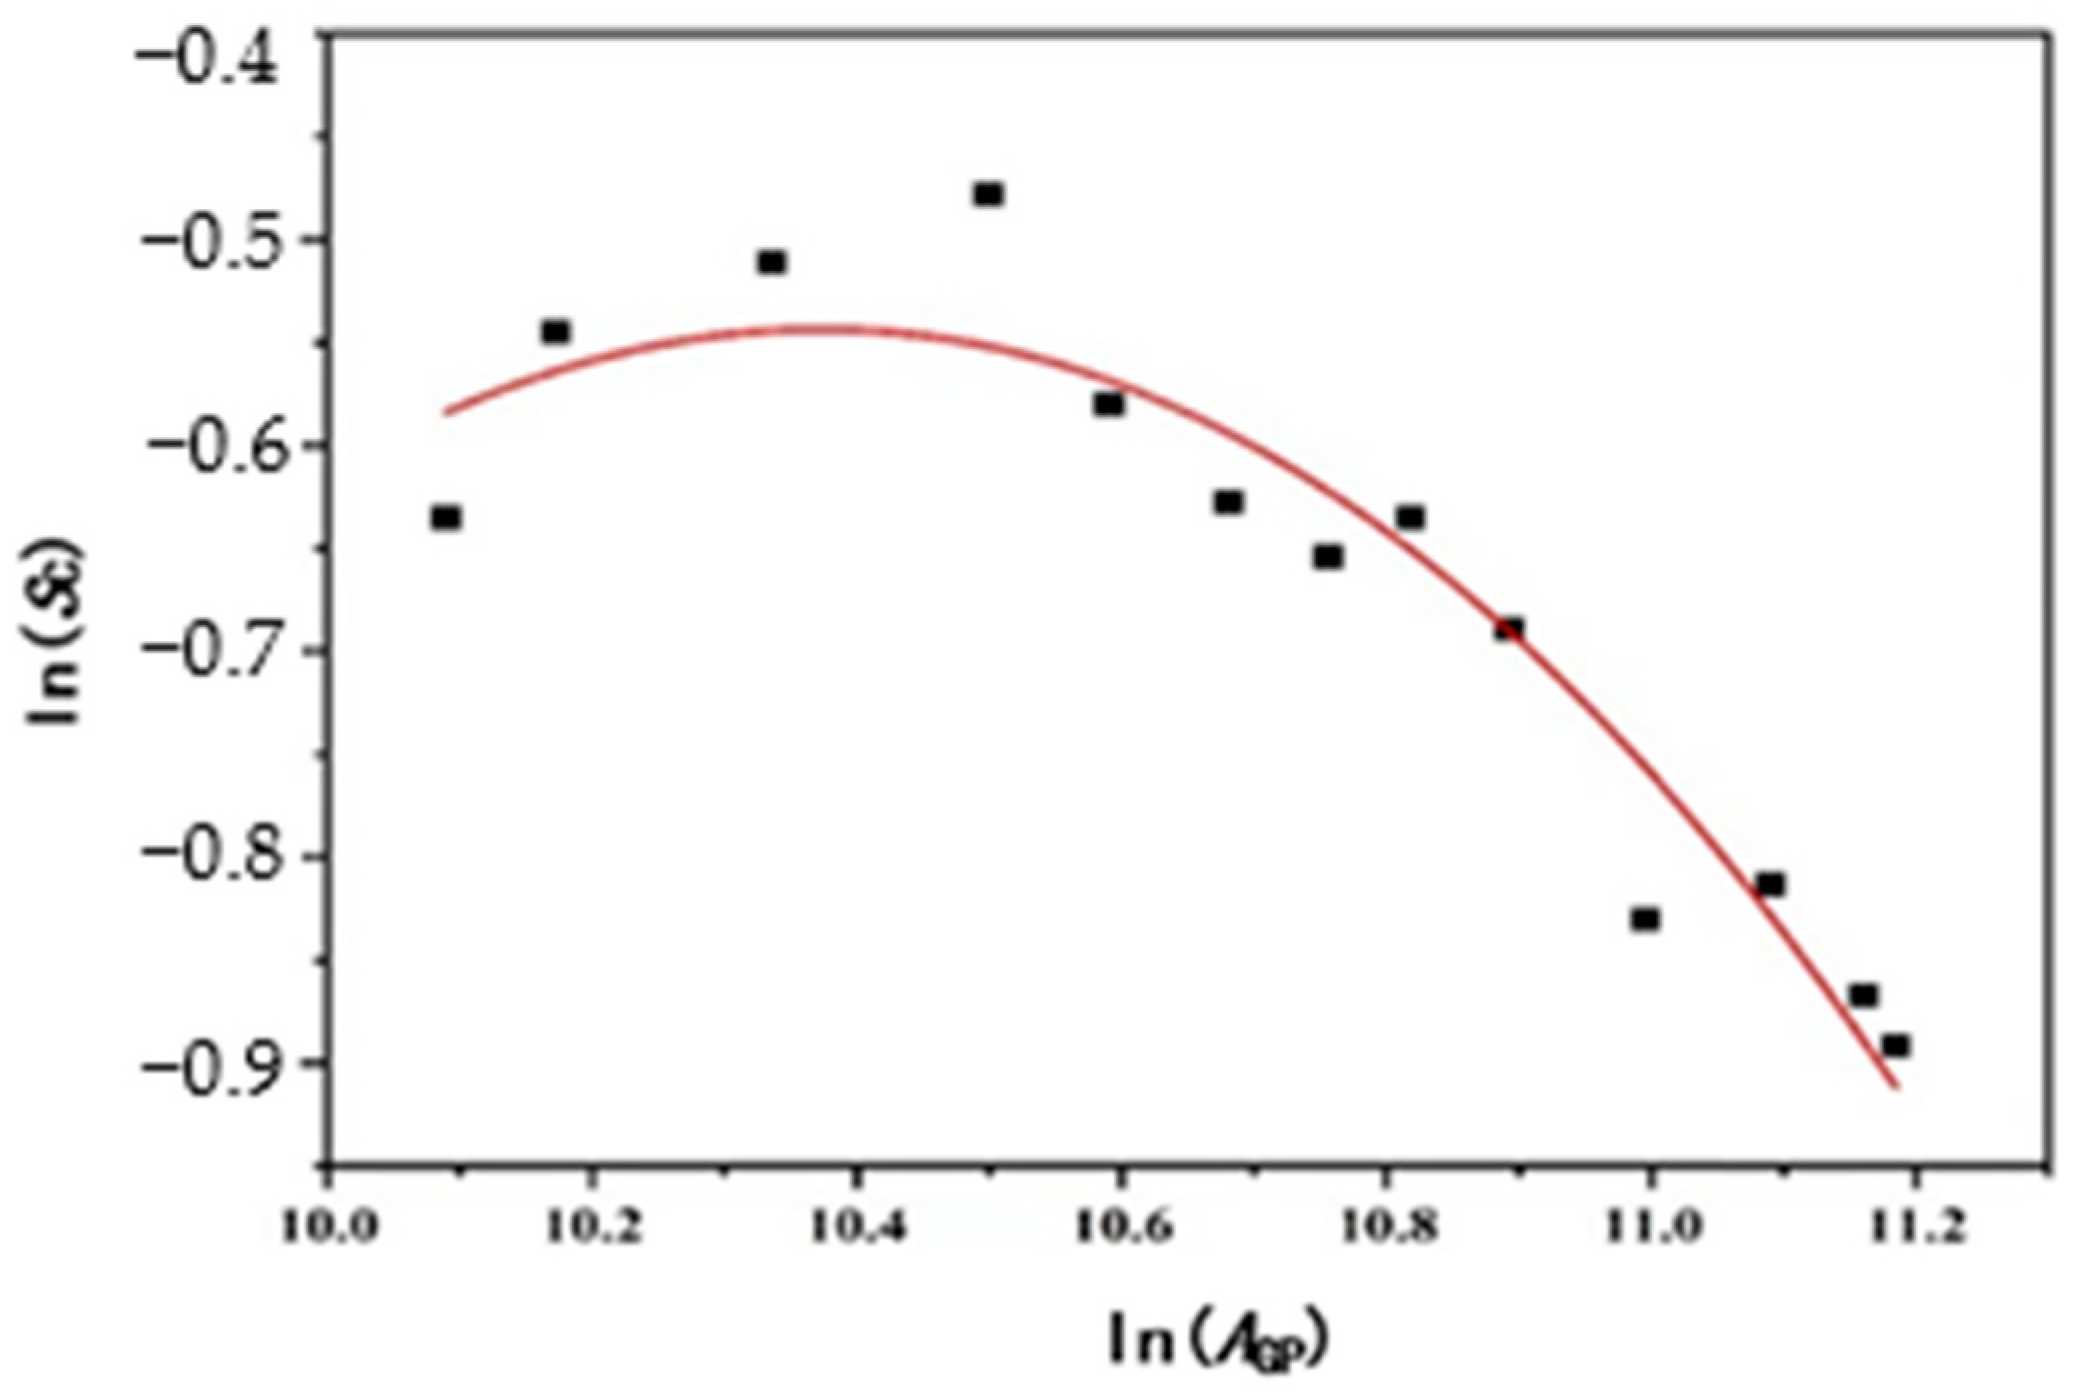
York [21] reconstructed the IPAT model into a STIRPAT model, which can be represented as I = aPbAcTde, by analyzing the random effects of the regression of the population number P, wealth status A, and technical level T. The logarithm of this model can be derived using Formula (1).
ln I = ln a + b ln P + c ln A + d ln T + ln σ
where parameters a, b, and c in Equation (1) are model coefficients, and σ is the residual, considering the non-linear and multi-feedback complex relationship between various influencing factors of electricity carbon emissions and the actual situation that China’s urbanization rate and the electrification rate in production and life are gradually increasing. Based on Formula (1), this work considers the secondary and tertiary industries’ shares Ain(2) and Ain(3) in GDP and adds the urbanization rate indicator Ru when considering the population factor. Meanwhile, given the characteristics of the power sector itself, the dominance of coal-fired power generation in China, and the differences in the carbon emission intensity of different energy sources, the power energy structure is represented by the proportion of coal-fired power generation consumption Te, which is related to the coal consumption of power supply Tf, electrification rate Re, and other factors that are incorporated into the decomposition formula together to obtain the extended STIRPAT model as shown in Formula (2).
ln C = ln a + b 1 ln P p + b 2 ln R u + c 1 ln A Gp + c 2 ln A in ( 2 ) + c 3 ln A in ( 3 ) + c 4 ln R e + t 1 ln T e + t 2 ln T f + e
In Formula (2), C is the carbon emission of electricity, 100 million tons; Pp is the population, ten thousand people; Ru is the urbanization rate, %; AGp is the GDP per capita; Tf is the coal consumption of electricity, g/kWh; e is the random error term; b1~b2, c1~c4, and t1~t2 are the coefficients.
In addition, this work adopts the multiple linear regression method to test the multicollinearity of the model (2) based on AGp, Pp, and other related data from 2005 to 2019 [22,23]. At the same time, this paper uses the variance inflation factor (VIF) as the multicollinearity assessment index, such as VIF > 10, which indicates that there is multicollinearity among the independent variables; otherwise, there is no multicollinearity. The relevant data in model (2) were first logarithmized, and then regression analysis was performed using the Statistical Product Service Solutions (SPSS) software, version 26.0. The results of the analysis are shown in Table 1, and the adjusted R2 is 0.939 (Table 2).
It can be seen from Table 1 that the VIF value of each factor is greater than 10, indicating that there is multicollinearity among them. Therefore, in order to avoid spurious regression, this paper uses the ridge regression method to analyze the variables. It is found that when the ridge parameter k = 0.10, the coefficient of the independent variable begins to stabilize, and the corresponding standardized ridge regression equation is shown by Formula (3).
ln C D = 0.366 ln P p + 0.418 ln R u + 0.520 ln A G p + 0.0521 ln A i n ( 2 ) + 0.064 ln A i n ( 3 ) + 0.368 ln R e + 0.403 ln T e 0.207 ln T f
From Equation (3), it can be seen that the contribution of seven factors, including Pp, Ru, AGp, Ain(2), Ain(3), Re, and Te, are all positive; so, they are positively correlated with the carbon emissions of electricity, and Tf has a negative effect on the carbon emissions of electricity. Among the positive correlation factors, the contribution of AGp is the largest, reaching 0.520. Therefore, economic size is the most influential factor in promoting the increase in electricity carbon emissions, indicating that China’s electricity carbon emissions are closely related to economic and social development. Furthermore, the contribution of Te is 0.403, which means that every 1% increase in the share of coal consumption in power energy consumption will increase the carbon emissions of the power sector by 0.403%. Therefore, the power sector should adjust the power structure and reduce the proportion of coal-fired power plants and increase the development and use of clean energy such as wind, solar, and biomass energy. In addition, the coal consumption of the power supply is negatively correlated with the carbon emissions of the power supply, and its contribution is 0.207, which shows that technological progress can effectively reduce the carbon emissions of the power supply.

2.2. EKC Analysis

The Environmental Kuznets Curve (EKC) is a theoretical model that describes the relationship between economic development and environmental impacts. The EKC assumes that in the initial stages of a country’s economy, environmental damage will increase as incomes grow, but that when the economy reaches a certain level of development, the environmental damage will begin to slow down and gradually diminish. The EKC also assumes that the environmental impacts of a country’s economy will increase as incomes grow.
From the above contents, it is well known that analyzing the relationship between economic scale and energy carbon emissions has practical significance in the whole concept of sustainable development for planning economic development in the future while taking carbon emissions into consideration. China is the second largest economy and the largest carbon emitter in the world [24], but there is no coupling relationship between economic development and changes in carbon emissions. Therefore, Environmental Kuznitz (EKC) can be used to analyze the relationship between economic development and carbon emissions [25]. The EKC theory teaches that the EKC curve shows an “inverted U-shaped” relationship between economic growth and the environment. In recent years, international scholars have verified the existence and universal applicability of the EKC through quantitative and theoretical analysis methods [26]. When a country’s level of economic development is low, its carbon emissions are also low; with the increase in AGp, economic growth leads to an increase in carbon emissions. After economic development reaches a certain level, the increase in carbon emissions gradually slows down. Hence, the association between economic development and carbon emissions aligns with the Environmental Kuznets Curve (EKC) theory. Building upon the preceding analysis, this paper validates the EKC’s consistency through both data and model examination. Subsequently, the EKC is employed to scrutinize the interplay between economic development and carbon emissions in the electricity sector.
Drawing on the literature [27], this study compares the goodness of fit between the cubic function and cubic logarithmic function. The model demonstrating a higher degree of fitting is chosen as the EKC function model, confirming the EKC relationship between economic growth and electricity carbon emissions. Here, China’s AGp from 2008 to 2020 is used as a representative of the economic growth variables in the EKC model. Electricity carbon emission intensity SC is the rate of change of electricity carbon emissions relative to GDP. Referring to the EKC model between economy and environment, the three times AGp and SC that are the functional and cubic logarithmic functional analytical models can be expressed as Equations (4) and (5), respectively.
S c = β 1 A G p + β 2 A G p 2 + β 3 A G p 3 + ε
ln ( S c ) = β 1 ln ( A G p ) + β 2 ln 2 ( A G p ) + β 3 ln 3 ( A G p ) + ε
In the formula, SC is the carbon emission intensity of electricity, ton/10,000 yuan; β1, β2, and β3 are the model parameters; ε is the random error term.
In order to avoid possible situations that do not conform to the basic form of the EKC, this paper further conducts an EKC conformity test on the data required by the model to select the model with the highest degree of fitting and perform a fitting test. The data are shown in Table 3.
It can be seen from Table 3 that Equation (5) fits the best fitting index between power carbon emission intensity and per capita GDP, and R2 is 0.91734.
From the data in Table 4, the curve between SC and AGp shown in Figure 1 is also obtained. It can be seen from Figure 1 that the EKC fitting curves of AGp and SC are “inverted U-shaped”, and the period from 2010 to 2011 can be obtained from 2010 to 2011 as the inflection point. In 2010 and 2011, AGp is 30,808 yuan and 36,277 yuan, respectively. After 2011, Sc decreases with the increase in AGp, and it is on the right side of the inflection point since 2011, indicating that the low-carbon policies adopted by the state in the power industry in recent years are more effective.
In conclusion, the EKC theory has guiding significance for the high-quality low-carbon development of the power sector, and it can help the government to formulate appropriate emission reduction policies. Although the carbon emission of the power sector has improved and the carbon emission intensity has reduced year after year, it is still necessary to further control the carbon emission of the power sector in order to achieve the “30–60 dual carbon” target on schedule.

2.3. Dynamics Modeling of Electricity Carbon Emissions

System dynamics (SD) models are widely used to study the influence mechanism of complex relational network problems and deepen the problem analysis. SD modeling must first determine the boundary of the system and then divide the system into parts to study the causal relationship between them and then conduct an in-depth analysis of the system. In this paper, based on the analysis results of the influencing factors of the extended STIRPAT model in Section 2.1, the system boundary of carbon emissions in the power sector is determined. The calculation step is 1 year. In order to establish the SD model of carbon emissions in the electricity sector, the system flow diagram and the stock flow diagram are constructed as follows.

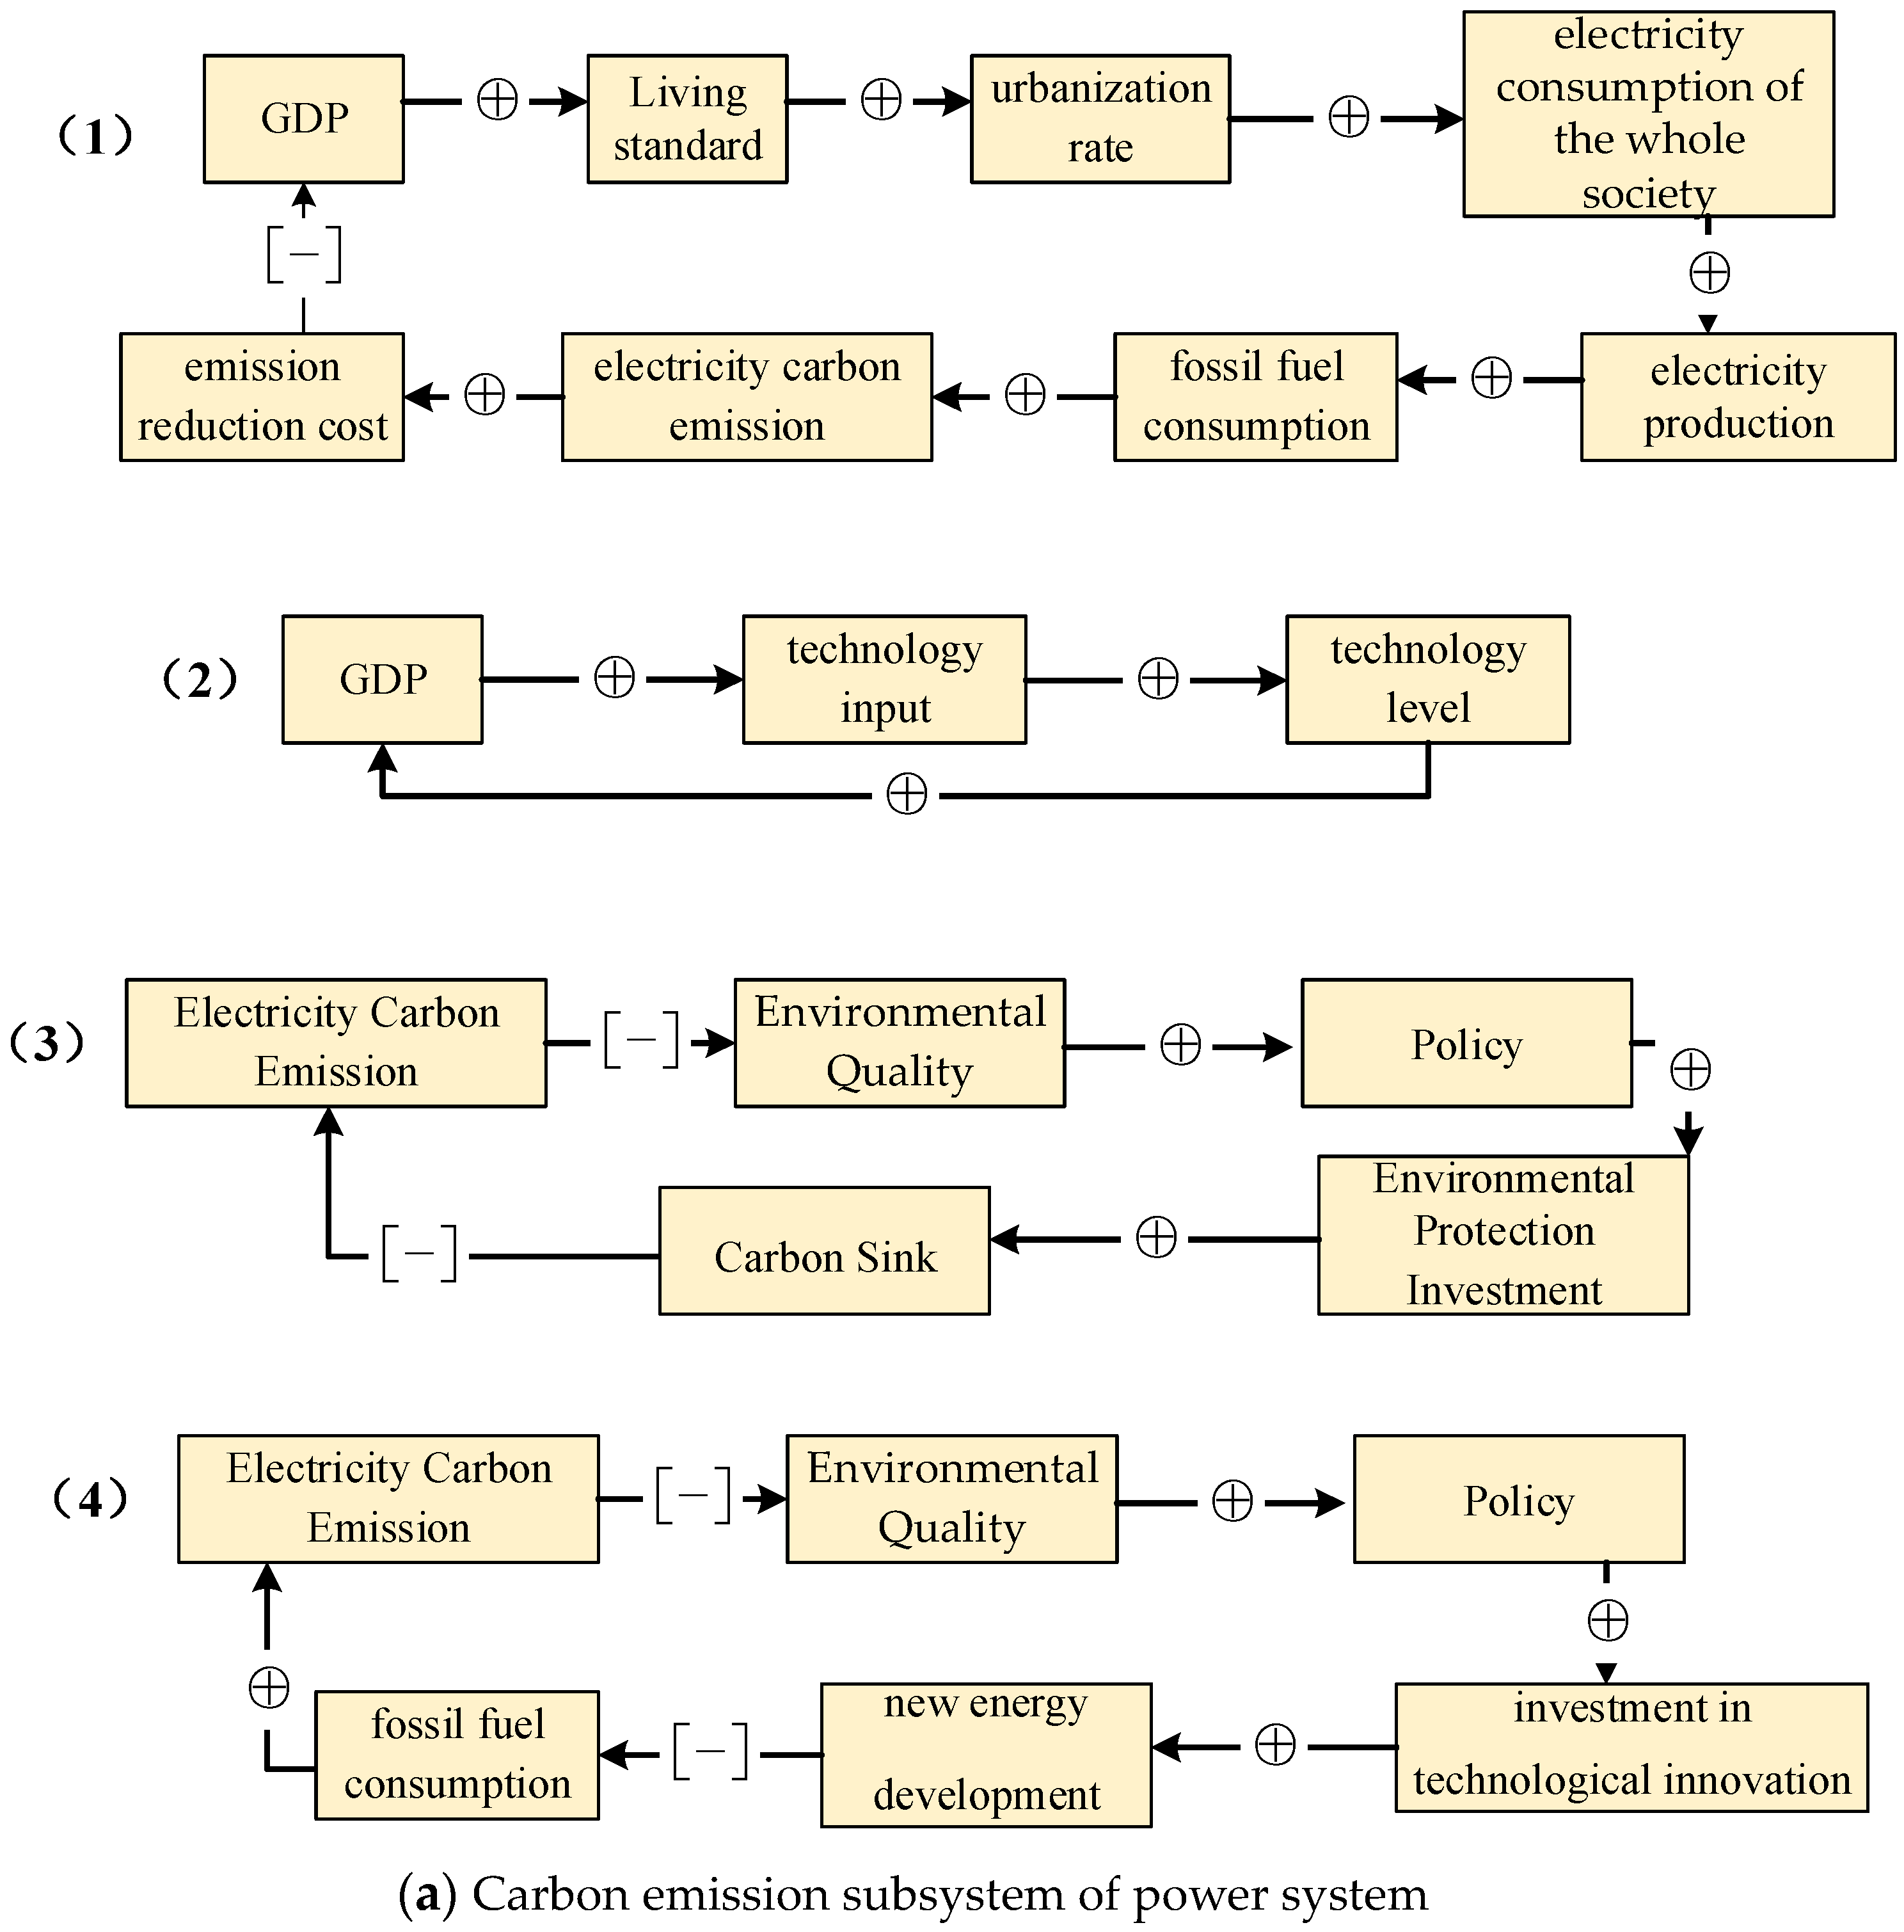
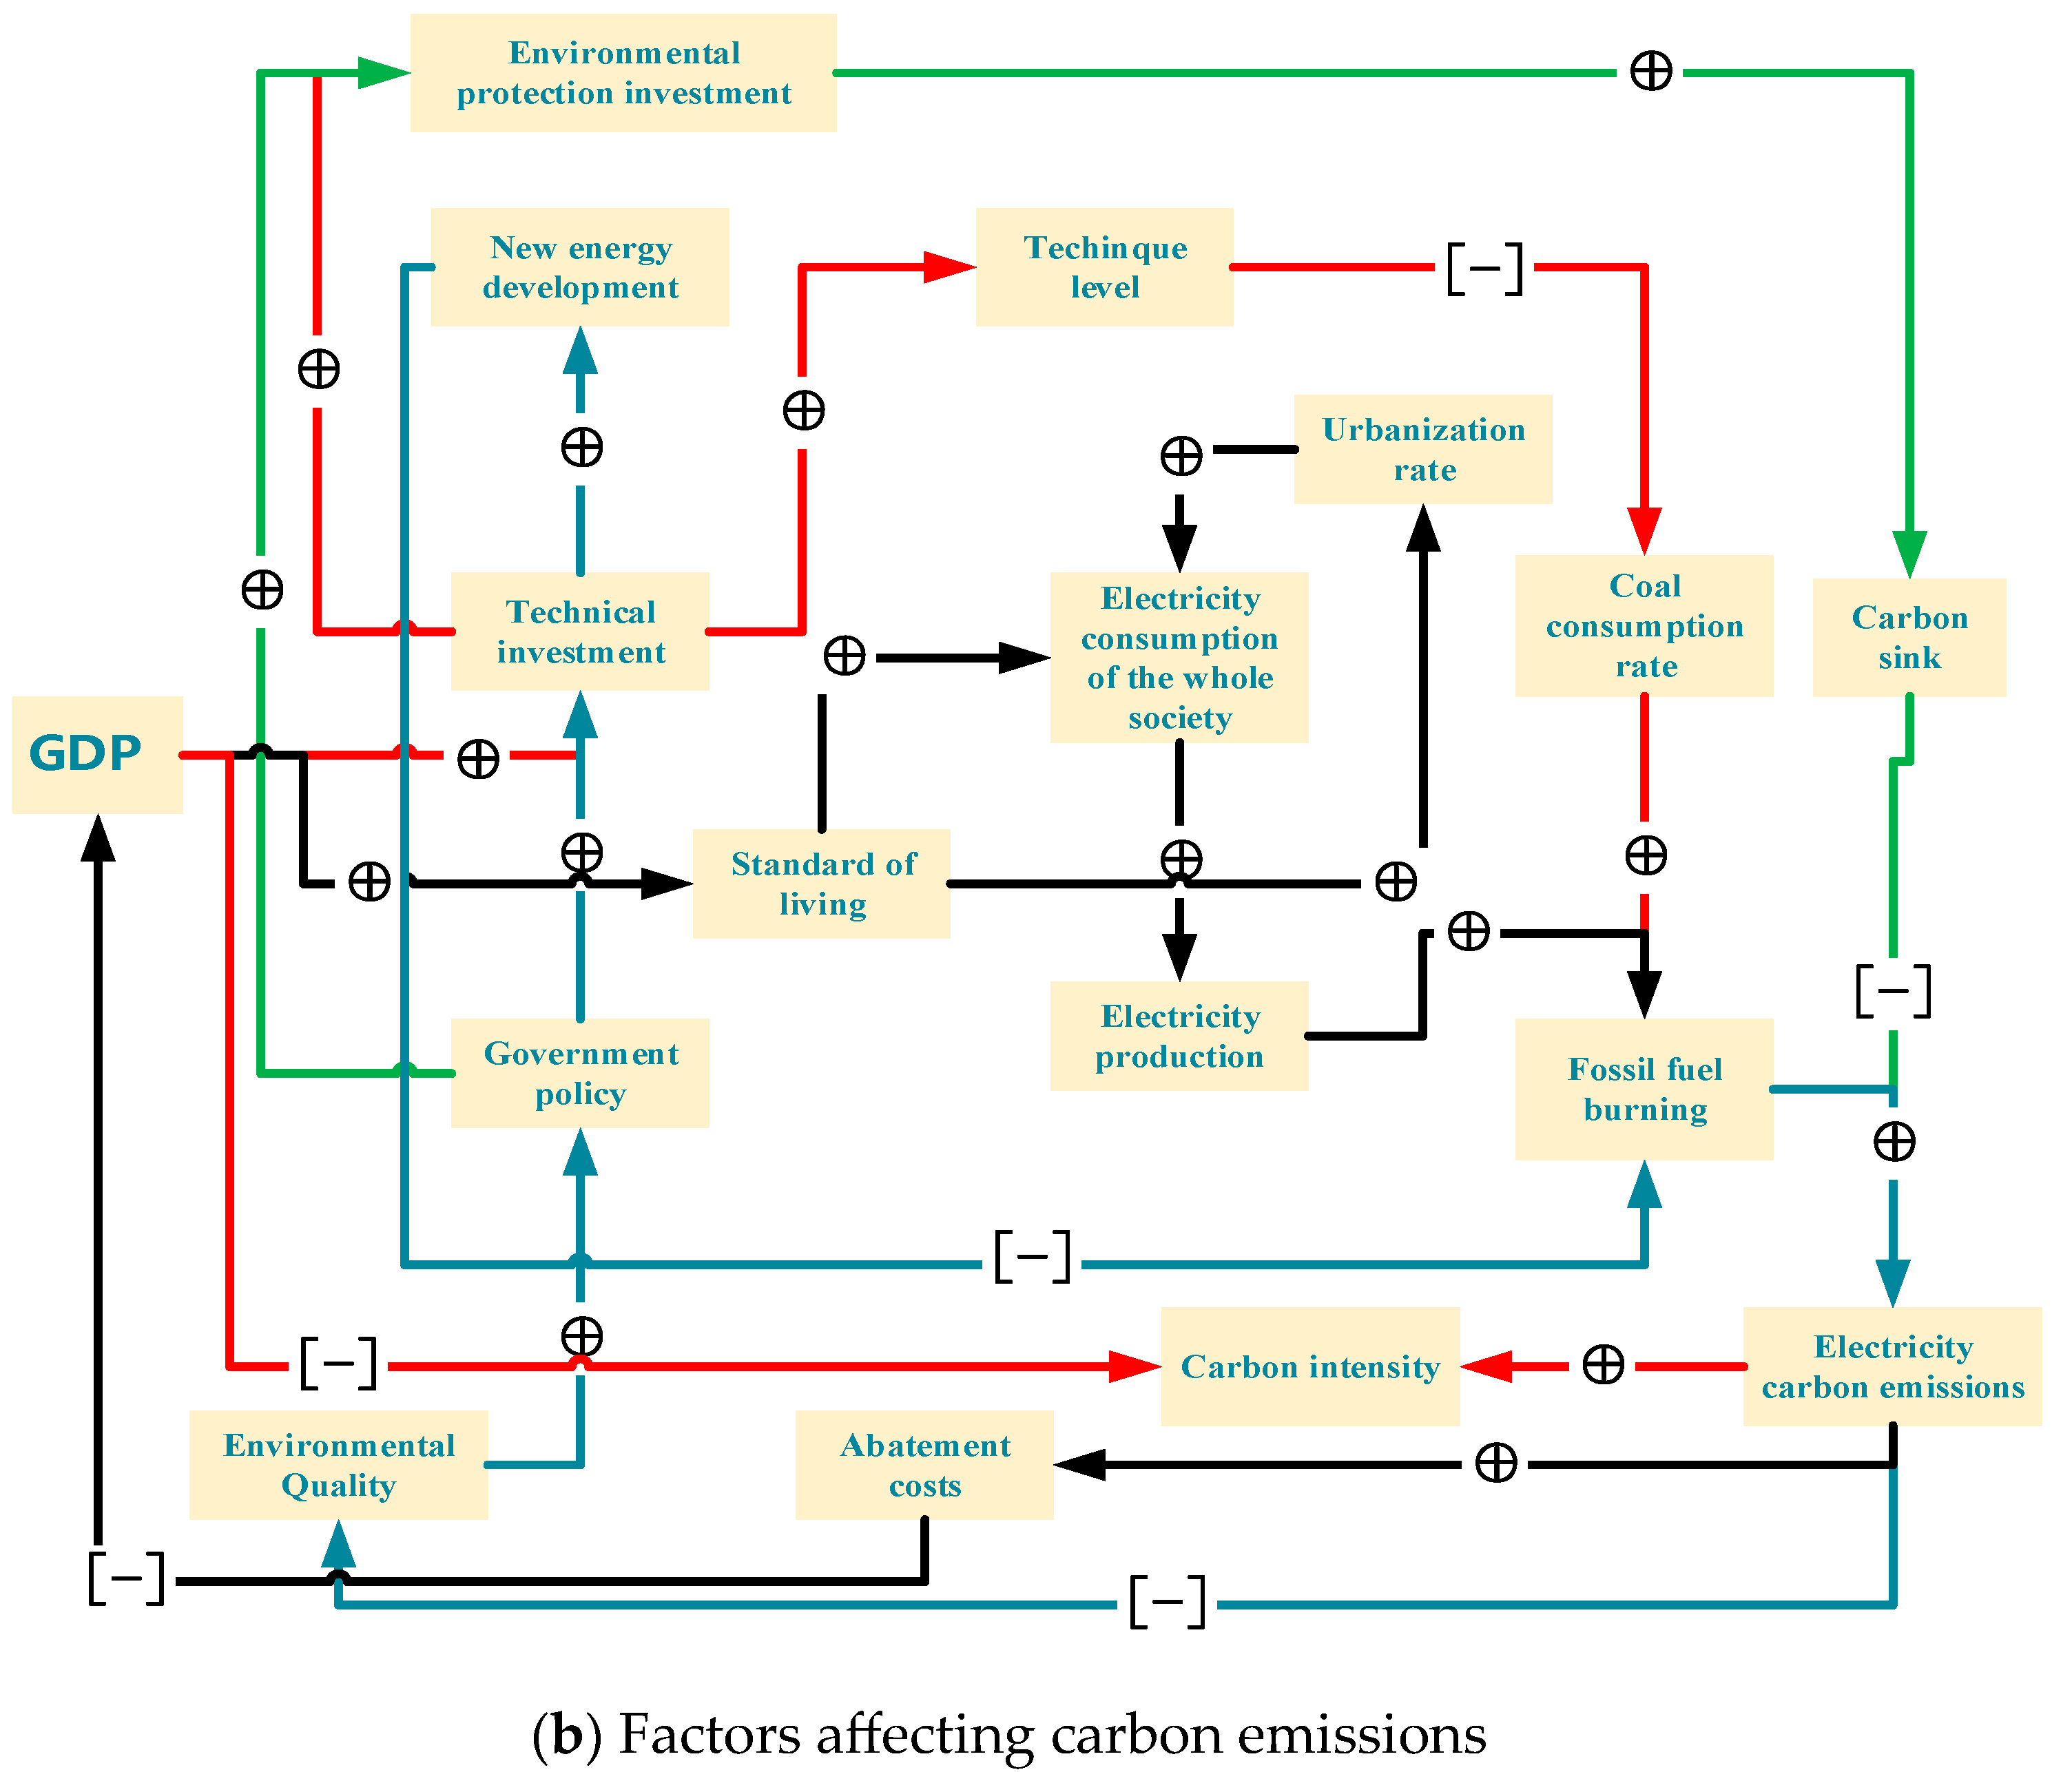
2.3.1. Diagram of Electricity Carbon Emission System

The electricity carbon emission system is a relational complex system and is influenced by various elements within the system. The system can be divided into macro-environments, such as the economy and population, and sub-environments, such as the share of thermal power and coal consumption for power generation and other power sector-specific environmental parameters. The causal relationship between the main influencing parameters is shown in Figure 2. A” “ indicates a positive correlation effect on the parameter, and a “ [−]” indicates a negative correlation effect on the parameter.
As shown in Figure 2, the main feedback loops of the electricity carbon emission system are as follows. (1) GDP→ living standard→ urbanization rate→ electricity consumption of the whole society→ electricity production→ fossil fuel consumption → electricity carbon emission→ emission reduction cost→[−] GDP; (2) GDP→ technology input→ technology level→ GDP; (3) electricity carbon emission→− environmental quality→ policy→+ environmental protection investment→ carbon sink→[−] electricity carbon emission; (4) electricity carbon emissions→[−] environmental quality→ policy→ investment in technological innovation→ new energy development→[−] fossil fuel consumption→ carbon emissions from electricity.

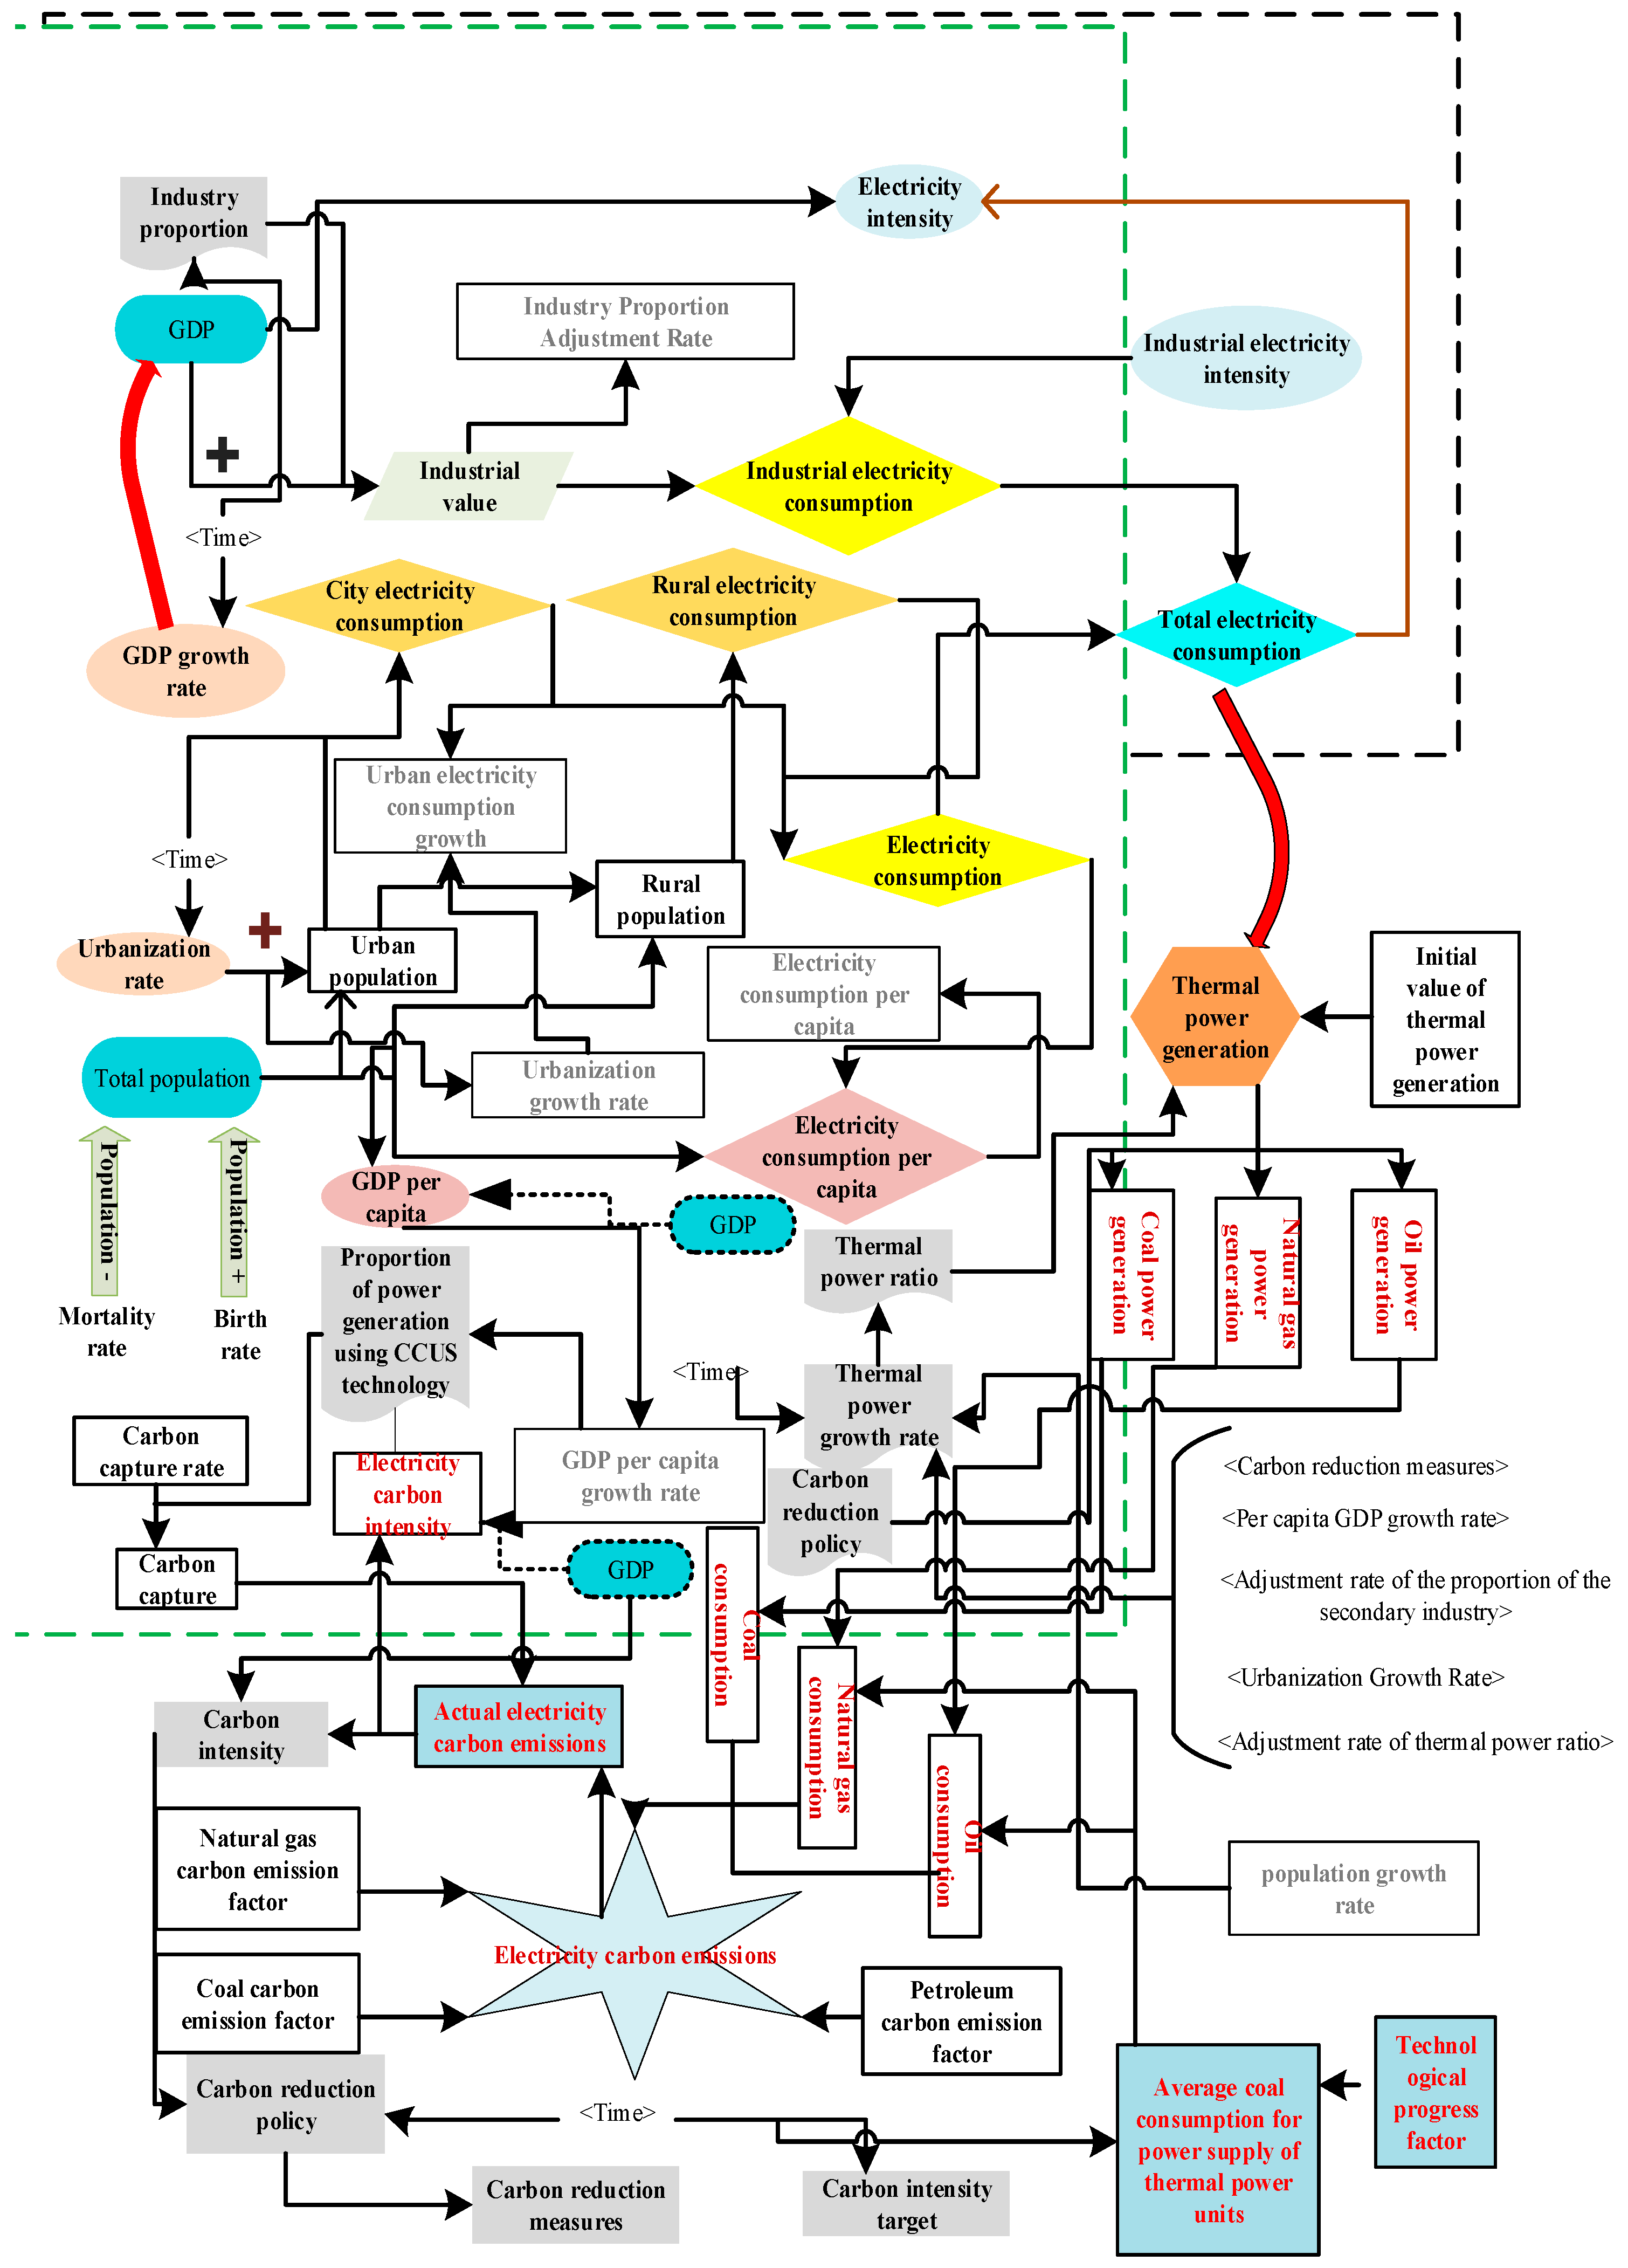
2.3.2. Stock-Flow Diagram of Electricity Carbon Emission System

The system stock-flow diagram consists of rate variables (representing the rate of stock change), auxiliary variables (intermediate variables that describe the information transfer and conversion process between state variables and rate variables), state variables (accumulation, representing the state of the system), and constants (amount that does not change with time). This work selects 50 variables, including 2 rate variables named as net population growth (population increase—population decrease) and GDP increase; 2 state variables named as GDP and total population; 4 constants such as coal carbon emission coefficient, oil carbon emission coefficient, natural gas carbon emission coefficient, and carbon capture rate; the rest are auxiliary variables. Figure 3 shows a schematic diagram of the electricity carbon emission stock flow.
The main variables in the SD model include GDP, electricity carbon emissions, total electricity consumption, total population, thermal power ratio (power structure), electricity carbon emission intensity, coal consumption for power supply, and so on. Notably, electricity carbon emissions are directly influenced by the consumption of fossil fuels, including coal, oil, and natural gas, as well as the carbon emission coefficient in electricity generation.
In addition, the Carbon Capture, Utilization and Storage (CCUS) technology in the “carbon sink” will also directly affect the total carbon emissions of electricity, while other influencing factors, such as GDP per capita, the proportion of various industries, urban thermal power generation rate, power consumption intensity, etc., are promoted by increasing the demand for electricity, which affects the power generation of thermal power (without considering the line loss) and ultimately affects the carbon emissions of electricity. The average standard coal consumption of the power supply of thermal power units in cooperation with the technological progress factor, by controlling the standard coal consumption of coal, oil, and natural gas in kilowatt-hour power generation, ultimately contributes to the carbon emission of power. Obviously, the system stock-flow diagram links many influencing factors through equations that can more intuitively reflect the changes in electricity carbon emissions.
Indeed, it is important to discuss the limitations of the model. Firstly, one of the limitations of the model is related to the availability and quality of data. Despite our best efforts to use reliable data, data related to carbon emissions from the power system may be limited or not precise enough in certain regions or specific time periods, which may affect the accuracy of the model to some extent. Secondly, the model may have some simplifications in considering external factors. For example, factors such as policies and technological advances have complex and varied impacts on power system carbon emissions, and our model may not adequately capture the complexity of these external influences.

2.3.3. Model Equation of Electricity Carbon Emissions

Historical data such as birth and death rates, GDP growth rate, urbanization rate, and industrial share in Figure 3 are mainly obtained from the National Bureau of Statistics, and industrial electricity consumption intensity and thermal power share are mainly obtained from the National Energy Administration. The carbon emission coefficients of coal, oil, and natural gas refer to the carbon emission coefficients published by the Intergovernmental Panel on Climate Change (IPCC). The main model equations used in this paper are shown in Table 5, and the time-related functions such as birth rate, death rate, GDP growth rate, and thermal power growth rate are represented by tabular functions.
In Table 5, AG0 is the initial GDP, trillion USD; rGDP is the GDP growth rate; In(2) and Sein(2) are the value of the secondary industry and the electricity intensity of the secondary industry, respectively; Pp0 is the initial value of the population, 100 million people; rb and rd are the birth rate and death rate, respectively; Ru is the urbanization rate; Pu is the urban population, 100 million people; Ue is the urban electricity consumption, 100 million kWh; Urural is the rural electricity consumption, 100 million kWh; Ggas is the natural gas power generation; Tf is the average standard coal consumption for power supply of thermal power units; Goil is the oil power generation; Gcoal is the coal power generation; tfire is the proportion of thermal power; fgas, foil, and fcoal are the carbon emission coefficients of natural gas, oil, and coal, respectively; α is the ratio of power generation using the CCUS technology; β is the carbon capture and storage rate; Cit is the carbon intensity target; DELAY1I is the first-order delay function; INTEG is the integral function.
In addition, when conducting the historical test of the power carbon emission index parameters, it is necessary to first calculate the power carbon emission, obtain the actual value, and compare it with the simulated value. In this paper, the emission coefficient method [28] in the IPCC compilation guidelines is used, and its calculation formula is shown in Formula (6).
C = i = 1 n E i × c i × f
Among them, C is the sum of CO2 emissions from different energy consumption; Ei is the final consumption of the i-th energy; ci is the coefficient of conversion of the i-th energy into standard coal; fi is the carbon emission coefficient of the i-th energy.

2.4. Scenario Analysis of Electricity Carbon Emissions Based on SD Model

To achieve the strategic goal of carbon neutrality on schedule, this paper uses the proportion of primary, secondary, and tertiary industries (industrial structure), GDP growth rate rGDP, urbanization rate Ru, technological progress impact factor Tt, thermal power growth rate ΔFg, and thermal power units. Average standard coal consumption ΔTf and other indicators are used as control variables for parameter setting [29]. Among them, the proportion of primary, secondary, and tertiary industries and rGDP directly drive the growth of social electricity demand. In addition, China’s urbanization rate Ru will be as high as 63.89% in 2021, and it will continue to increase, so Ru has also become an important factor in increasing electricity demand [30]. At the same time, in order to promote the process of carbon peaking, carbon emission constraints and electricity demand should be met simultaneously, and “high electrification” will become a development trend. In summary, this paper sets the parameters of each index under the premise of “high electrification”.
According to the strategic goals for economic development set by the state, China’s GDP growth rate will be maintained at around 7%. In recent years, the proportion of electricity consumption in the tertiary industry and residents’ living has continued to increase, especially the growth rate of electricity consumption in the tertiary industry is relatively high. In the future, China will continue to optimize the industrial structure and increase the proportion of the tertiary industry [31]. The “Thirteenth Five-Year Plan for Electric Power Development” proposes that “by 2020, the installed capacity of coal-fired power in the country will be controlled within 1.1 billion kW, and the proportion of coal-fired power will decrease to about 55%” and “by 2030, the proportion of non-fossil energy in primary energy consumption will increase to 20%”.
“China’s “14th Five-Year” Electric Power Development Planning Research” pointed out that coal is the main source of carbon emissions, and the future energy development should reduce the proportion of fossil energy such as coal and increase the proportion of non-fossil energy. Based on this, this work fine-tunes the power sector in the scenario analysis, wherein the proportion of coal consumption is reduced by 1.7 percentage points, the proportion of natural gas is increased by 0.7 percentage points, and the proportion of oil consumption is set to remain unchanged. According to the “Implementation Plan for the Transformation and Upgrading of National Coal-fired Power Units”, the national average coal consumption for thermal power supply will fall below 300 g standard coal/kWh by 2025. According to data released by the National Energy Administration, in 2019, the standard coal consumption of thermal power units nationwide was 307 g/kWh, down 0.7 g/kWh year on year. Compared with 333 g/kWh in 2010, the standard coal consumption for power supply decreased by 26 g/kWh, showing a significant downward trend. With the advancement of low-carbon technology, coal consumption will be further reduced. According to the above different scenarios, this paper sets different average coal consumption reduction rates for thermal power units, as shown in Table 6.

3. Results and Discussion

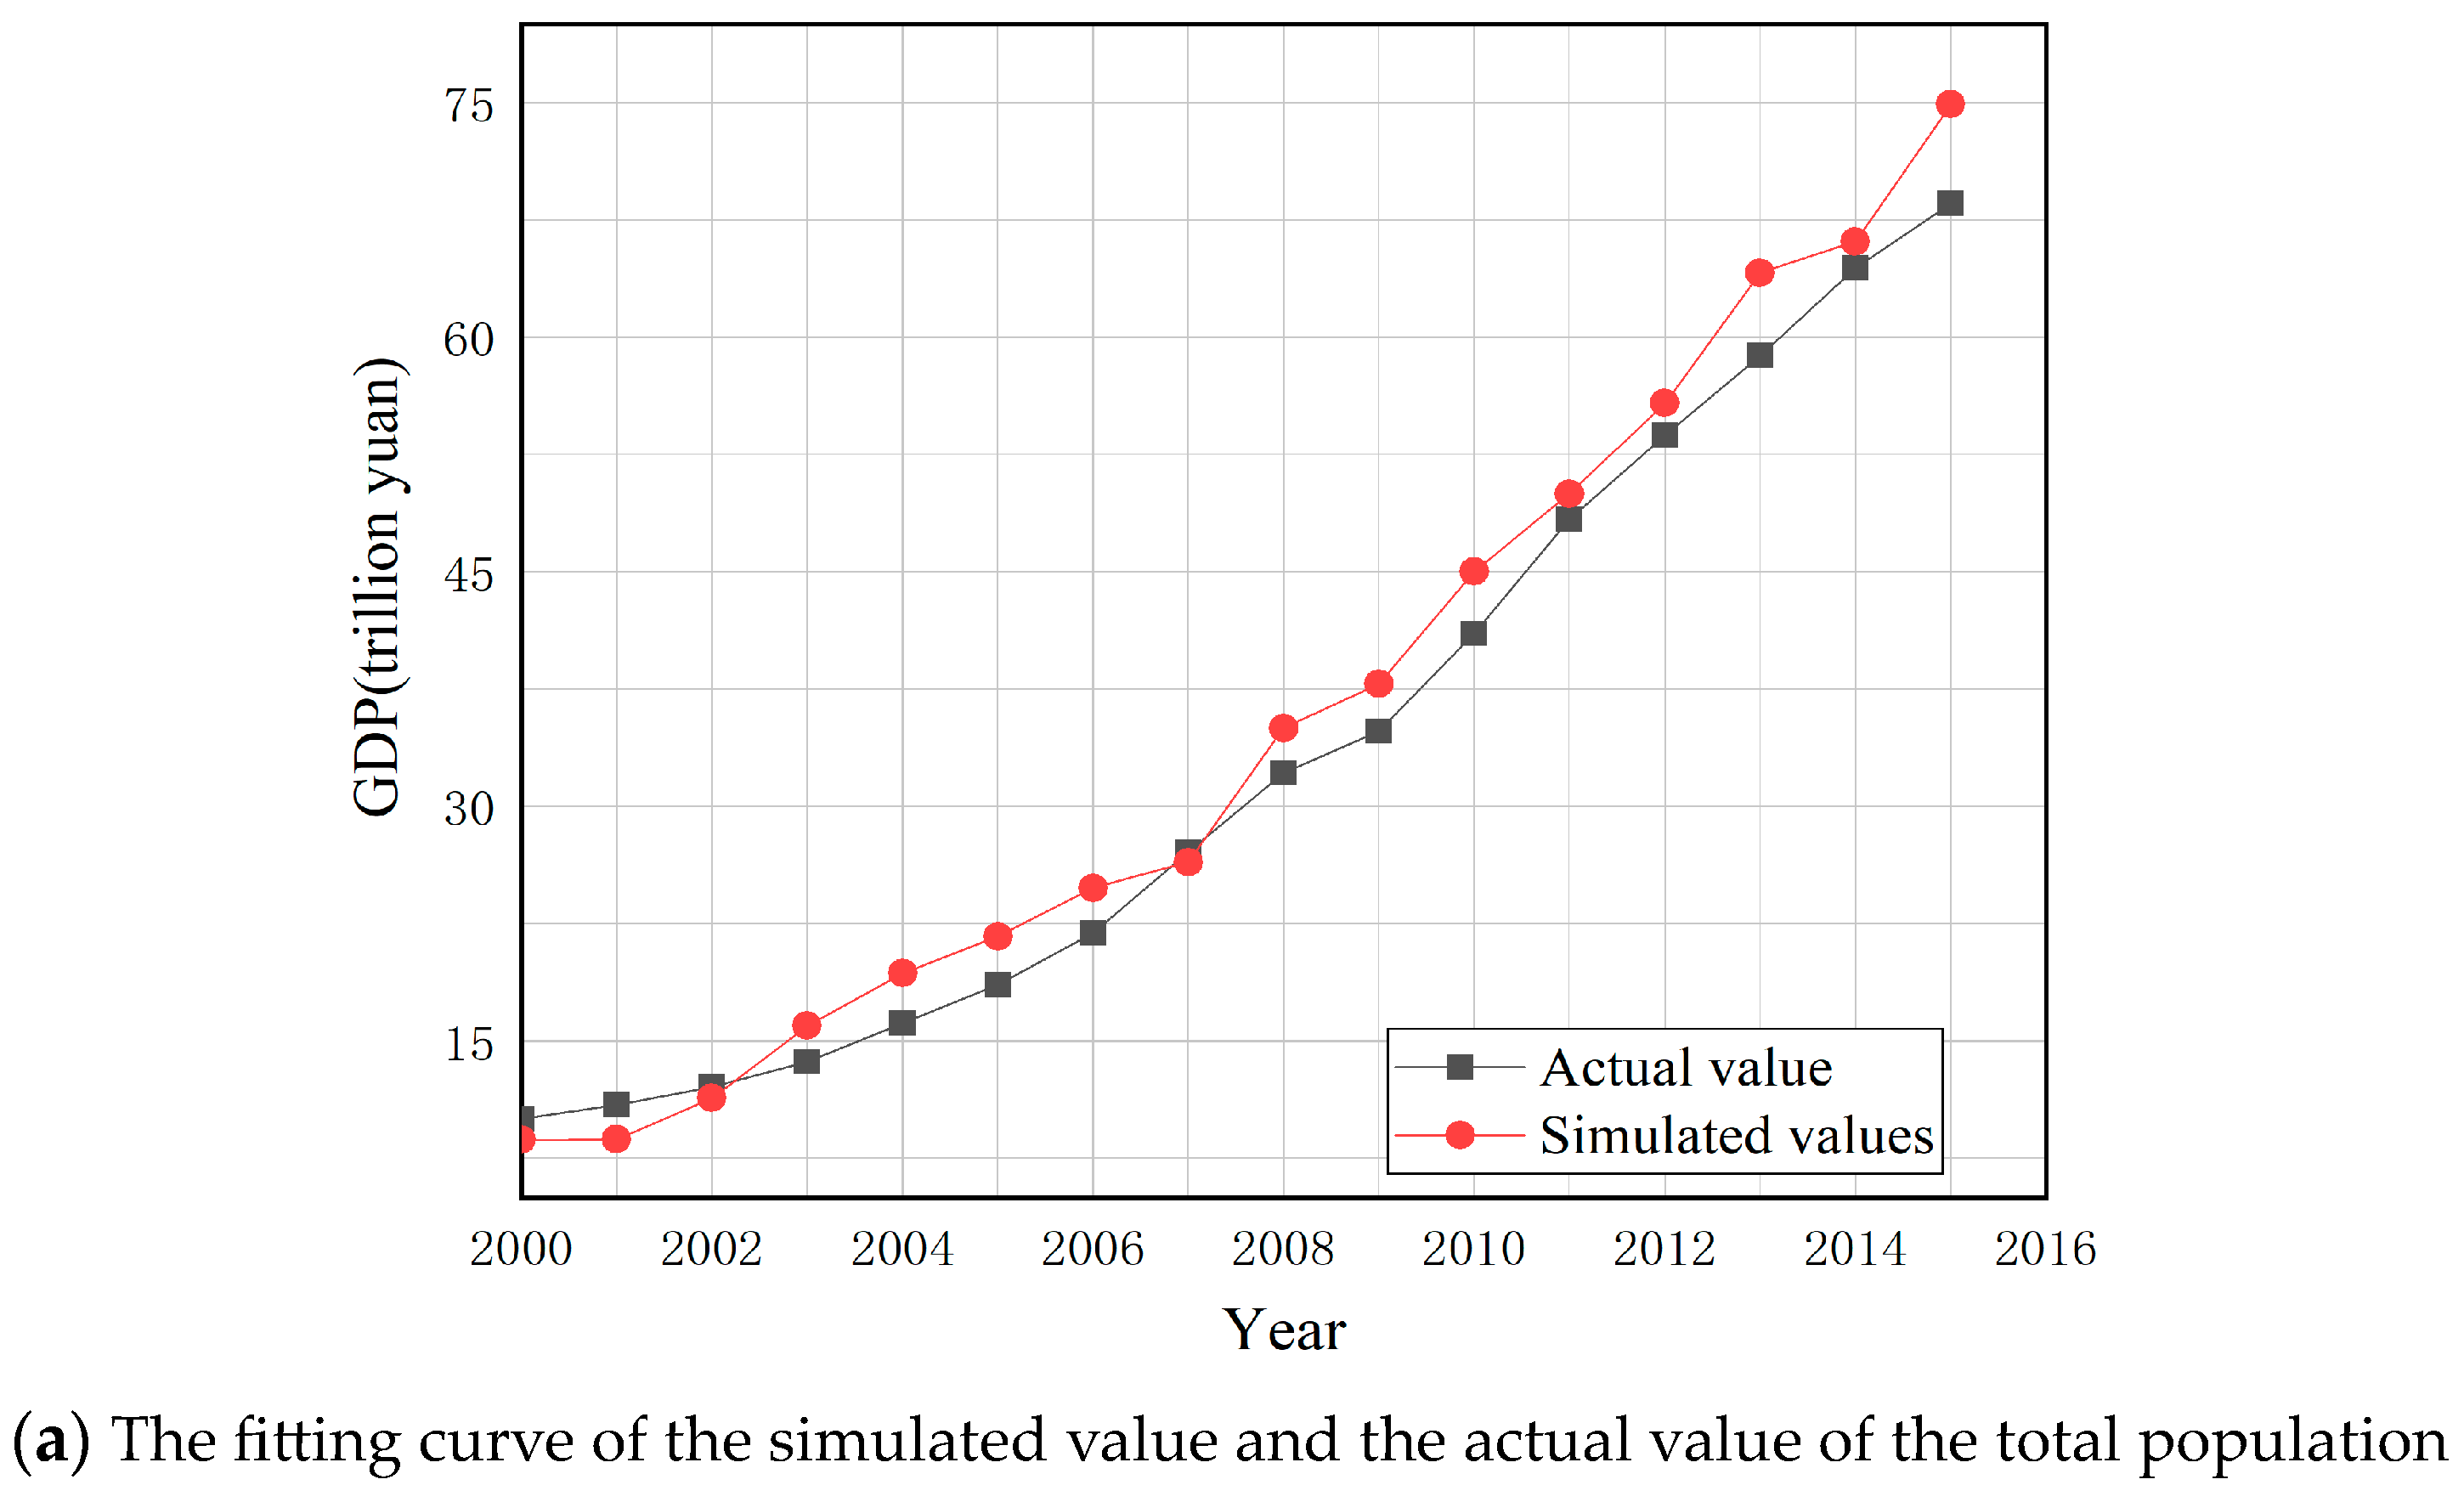
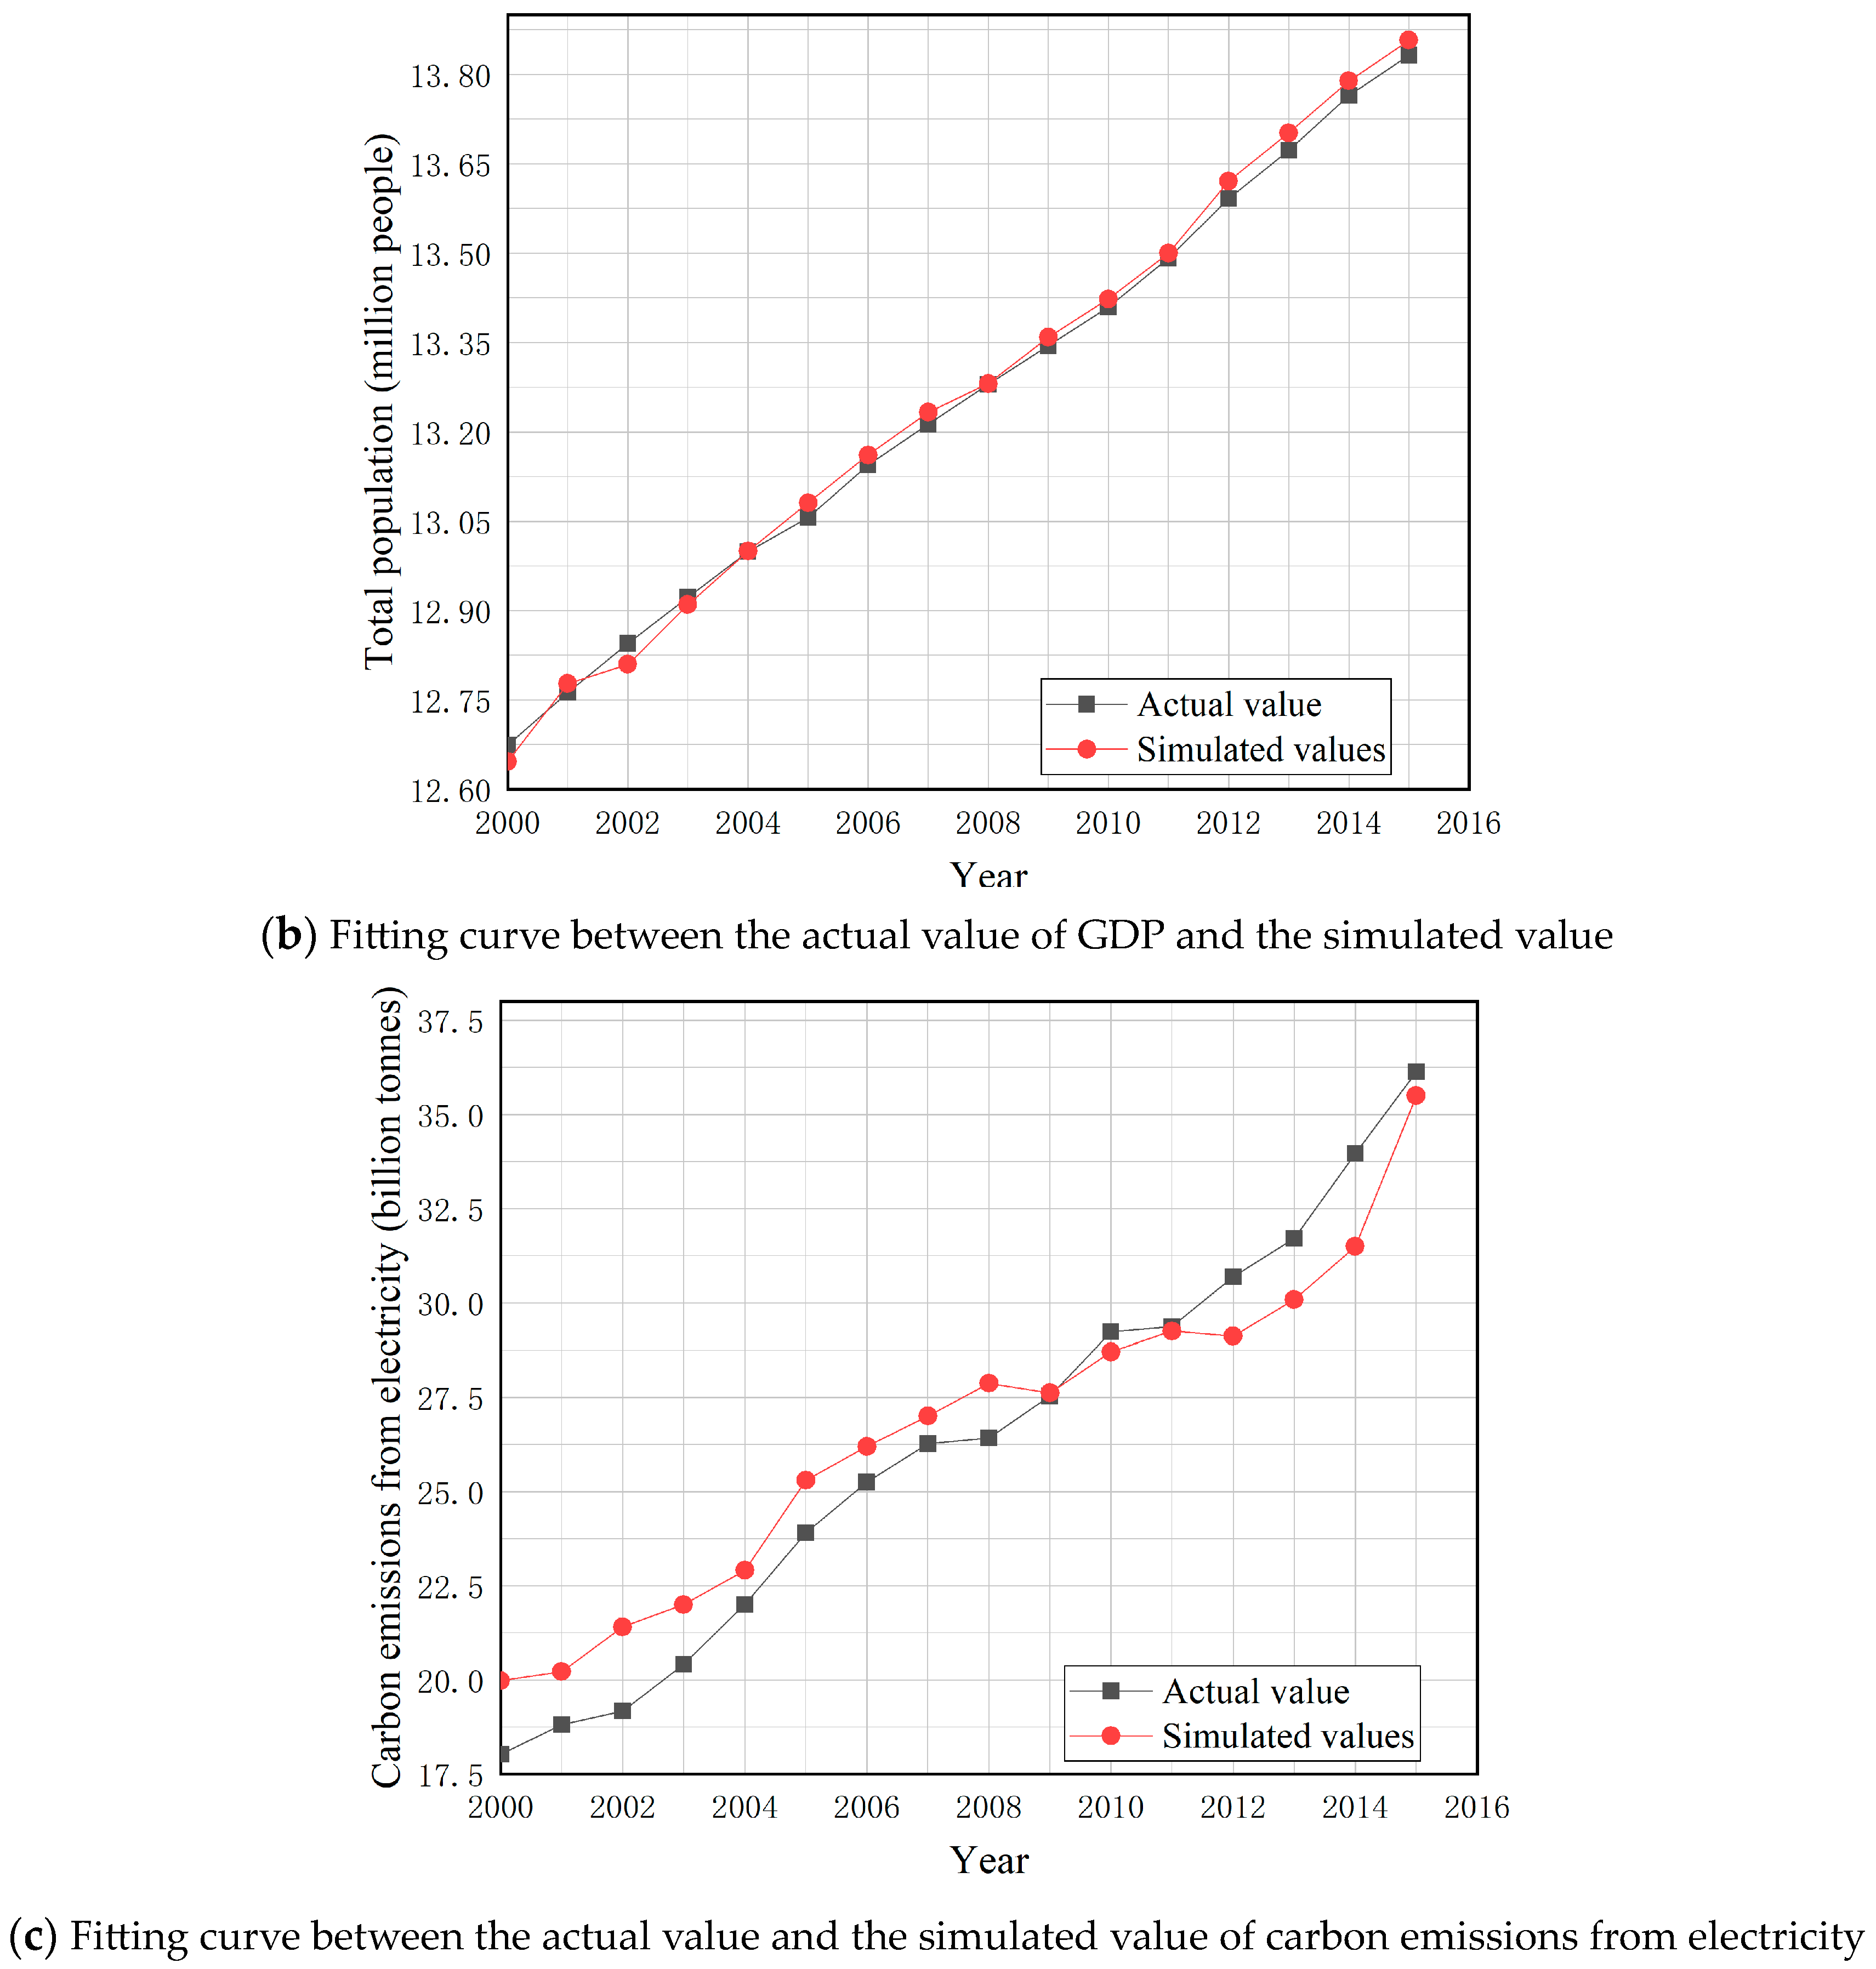
3.1. Model Validity Test

In this paper, the schematic diagram of the flow stock of the system in Figure 3 and the relevant model formulas are used to simulate GDP, total population, and electricity carbon emissions, and the validity of the model simulation results is tested by the method of historical verification. The simulation time of the system is set to 2000~2019, and some initial values of the starting time are in 2000. The model training period is selected from 2000~2015. The results of the training adjustment are shown in Figure 4.
Furthermore, we set 2016 to 2019 as the years to be tested and selected four index parameters such as GDP, population, total electricity consumption, and electricity carbon emissions in the model as test variables to analyze the simulated and actual values and calculate the corresponding the errors, which are listed in Table 7 and Table 8, respectively.
Table 7 and Table 8 reveal that the largest absolute error between the simulated and actual values occurs in GDP for the year 2018, amounting to 7.27%. In contrast, the smallest absolute error is found in the population for 2019, registering at only 0.52%. The errors for the remaining parameters are all below 7%, well within the acceptable margin, given the SD model’s allowable error of approximately 15%. These results underscore the high reliability of the model. Hence, the system stock-flow map developed in this paper can be effectively utilized for carbon emissions’ prediction.

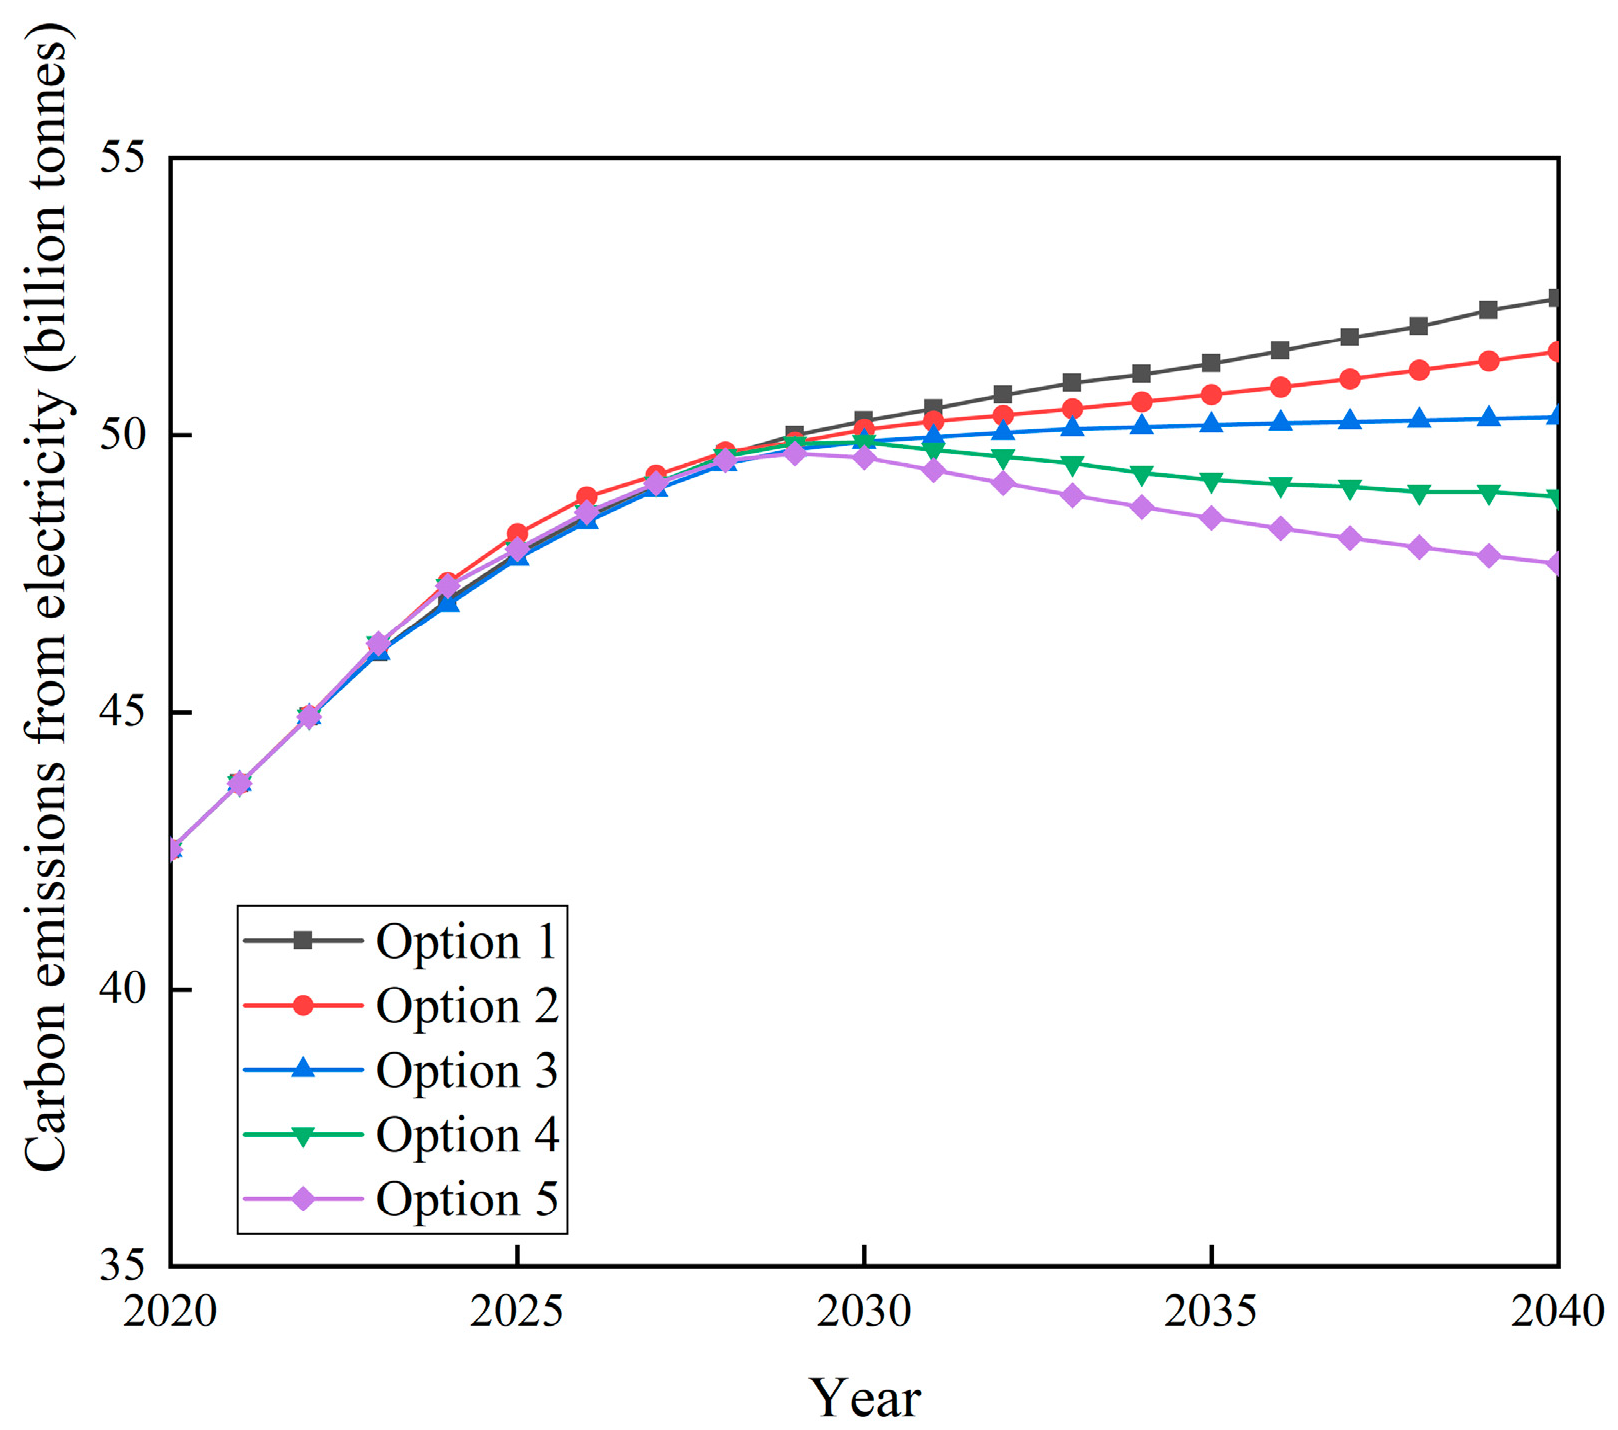
3.2. Prediction of Carbon Peaking

Predicting the carbon peak encompasses forecasting both the peak year and peak level. Clearly, both the peak year and peak level will significantly influence the duration and complexity of achieving carbon neutrality. Leveraging the established carbon emission SD model, this paper predicts carbon emissions from 2021 to 2030, with the results presented in Table 9. Simultaneously, Table 9 also displays pertinent parameters, such as GDP per capita, corresponding to each year.
It can be seen from Table 9 that although the predicted value of electricity carbon emissions from 2021 to 2030 has increased year after year, the carbon emission increment has decreased year after year by 0.4587, 0.2593, and 0.1411 million tons. According to this trend, it can be seen that there will be a turning point in the carbon emission peak after 2030. Although the carbon emission forecast value from 2021 to 2030 can show the effectiveness of all the current carbon emission reduction policies in our country, it still does not meet the expectation of achieving carbon peaking before 2030. Therefore, further efforts should be made to reduce carbon emissions and strengthen measures related to carbon sinks.

3.3. Predicted Carbon Emissions

The simulation forecast in Section 3.2 of this paper is used as the benchmark scenario in the scenario simulation, i.e., Option 3. Based on Option 3, four different scenarios were set up as comparison schemes. The parameters of Ru, rGDP, ΔFg, ΔTf, and other parameters were adjusted respectively to explore the peak conditions under different scenarios.
Based on the five development scenarios in Table 6, the carbon emissions of electricity under the five scenarios are projected and the corresponding carbon emissions’ projections from 2020 to 2040 are obtained, as shown in Figure 5.
Figure 5 shows that electricity carbon emissions peak in Options 3, 4, and 5, while the carbon emissions from the other two systems increase. For baseline Scenario 3, carbon emissions from electricity peak in 2035 at 5.01857 billion tons, later than the expected 2030. Options 4 and 5 reach carbon peaks in 2030 and 2029, respectively, with peaks of 4.98786 and 4.95774 billion tons. Further analysis shows that there is little difference between the peaks of Option 4 and Option 5, but the peak time of Option 5 is earlier compared to Option 4. It shows that if the economic GDP growth rate is controlled below 7%, by controlling the proportion of thermal power generation, adjusting the energy power generation structure, and using low-carbon energy-saving technologies to reduce coal consumption for power supply under scientific and technological progress and innovation, the power sector can achieve “30–60 dual carbon emissions”.
As for Option 5, the GDP growth rate should be controlled to slow down, but it will basically remain above 5% before the completion of the “30 peak” task, and the proportion of power generation from various energy sources will be further adjusted reasonably, so that the peak target can be achieved in 2029, and the total peak carbon emissions will be 4.95774 billion tons. Compared to the report “China Carbon Peak Carbon Neutral Strategy and Path” by the Chinese Academy of Engineering, the total peak carbon emissions of the power sector in 2031 would be 5.06 billion tons. The peak time is earlier, and the predicted peak carbon emissions are compared with the decrease of 0.10226 billion tons. Compared to the 4.7 billion tons of peak carbon emissions in the power sector in 2028 proposed by the China Electricity Council in the paper “Research on the Development Path of Carbon Neutralization in the Electric Power Industry”, this paper predicts that the peak carbon emissions will increase by 0.258 billion tons. Compared to the 4.64 billion tons of peak carbon emissions in the power sector in 2025 proposed by the Energy Research Institute of Peking University in the paper “Research on the Path and Policy of Carbon Emissions in the Electric Power Sector”, this paper predicts that the peak carbon emissions will increase by 0.318 billion tons. To sum up, the carbon peak years predicted in this paper are not much different from the existing prediction results, and the carbon peak can be achieved around 2030, and the error between the carbon peak prediction results and the prediction results of the authoritative research center can be kept below 7%; it further proves that the prediction results in this paper are correct to a certain extent, and the model built in this paper has a certain practicability for predicting the peak of carbon emissions in the power sector.

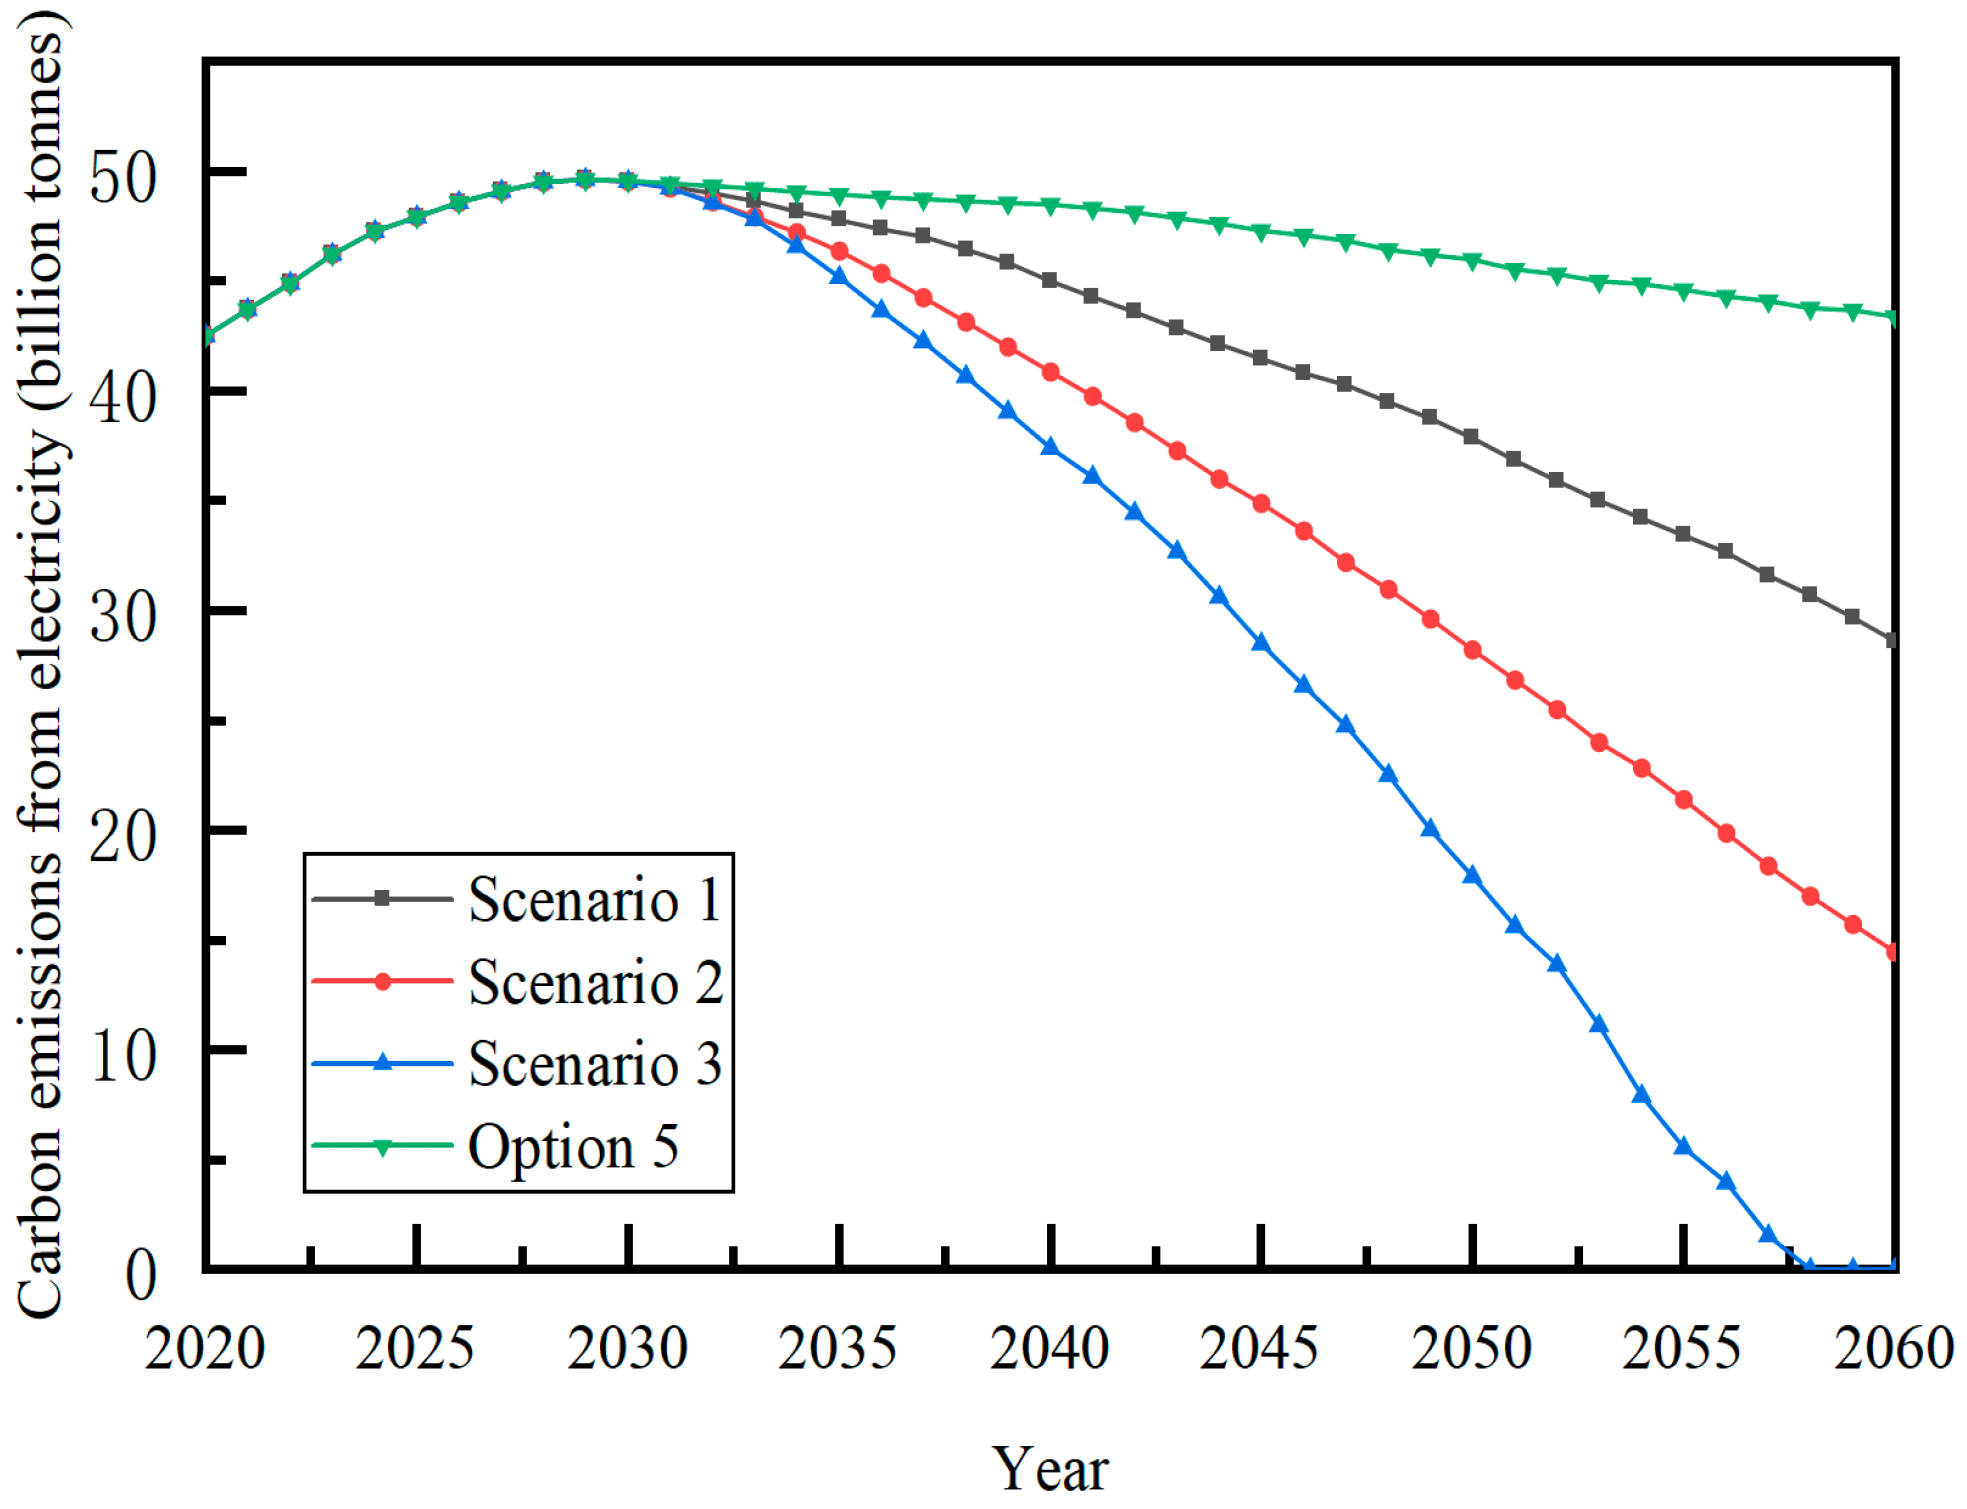
3.4. Scenario Simulation of Electricity Carbon Neutrality Target

In order to further explore the path to carbon neutrality in the electricity sector, this paper selects Option 5 as the baseline scenario for the next simulation stage. The model time boundary is from 2029 to 2060, with 2029 as the starting year, and the simulated values of each parameter (see Table 10) when Option 5 reaches its peak are the initial parameter values of the second simulation stage.
Scenario projections are made on the premise of setting the peak carbon emissions of electricity to assess whether the power sector can achieve the 2060 carbon neutrality target. According to the above calculations, the carbon peak year is set at 2029, and the proportion of coal power generation is 44% and the proportion of natural gas power generation is 9% as the basis for formulating and adjusting the power energy structure. Reference [32] analyzed the changes in China’s energy structure over the years and the proportion of coal power in the energy structure and then proposed the proportion of coal power in the power structure under the background of specific carbon emissions. Based on Option 5, this paper refers to the gradual targets of low-carbon transformation of the power system mentioned in the special report of academician Shu Yinbiao on the technical path of carbon peaking and carbon neutralization [33] and adjusts the proportion of fossil energy in thermal power in the power sector and applies the CCUS technology (see Table 11), setting up the following three scenarios. Among them, in Scenario 1, the proportion of natural gas power generation (gas power) remains unchanged at 9%, only the proportion of coal-fired power is reduced to 26%, and CCUS technology is not applied; the proportion is reduced to 7%, and about 50% of coal-fired power units use CCUS technology; based on Scenario 2, Scenario 3 keeps the proportion of gas power unchanged, further reduces the proportion of coal-fired power to 15%, and all use CCUS technology.
Based on the above three scenarios, the carbon emissions from electricity from 2029 to 2060 are predicted, and the carbon emission trend chart is shown in Figure 6.
It can be seen from Figure 6 that, according to the Scenario 3 model, the electricity industry can not only achieve carbon neutrality in 2060, but also achieve the carbon neutrality target three years earlier, i.e., carbon emissions from electricity will reach “zero carbon” around 2057, and the “carbon negative” of the electricity industry is also expected to be achieved by 2060. Scenarios 1 and 2 require delays of 20 and 10 years, respectively, to achieve carbon neutrality in electricity. At the same time, it can be seen from Table 11 that the continued maturity of the CCUS technology has made a major contribution to the carbon reduction target of the power sector in the later stage, which can enable the power sector to retain a certain proportion of thermal power and mitigate the future high penetration rate of renewable power generation. However, it can achieve “zero carbon” or even “negative carbon”.

4. Conclusions

Based on system dynamics and scenario analysis, this paper divides the carbon emissions of the power industry into two parts: peak carbon emissions and carbon neutrality. The following conclusions are drawn:
(1)
The established extended system dynamics carbon emission forecasting model has high forecasting accuracy. Calculations show that China’s economic development and carbon emissions show an “inverted U-shaped” curve relationship, and the curve inflection point appeared in 2011, indicating that the relevant policies implemented in China after 2011 are conducive to reducing carbon emissions, but it is still unable to achieve the 2030 goal of carbon peaking.
(2)
From now until 2029 is the critical period for China’s carbon peak. If the economic growth rate is maintained at about 6.0%, the average decline of thermal power is maintained at 1.3~1.6 per year, and the growth rate of urbanization is controlled at 2%, it will enable China’s power sector. The carbon peak will be reached in 2029, corresponding to a peak value of about 5 billion tons. The peak time of electricity carbon in this article is in line with the government’s goal of carbon peak. Due to the government’s lack of clear indication of peak carbon emissions, this article compares it with the peak carbon emissions from reference [33]. Shu et al. predicted a carbon peak of 4.5 billion tons in the zero carbon scenario, which is similar to the carbon peak predicted in this article. Reference [34] used a grey neural network model to predict carbon emissions in the United States, and it is expected that the country’s carbon emissions will also peak before 2030. The estimated carbon emissions of the United States in the next 30 years show a trend of first increasing and then gradually decreasing year after year, with a clear inverted U-shaped curve, which is consistent with some conclusions in this article. These indicate that the variable parameters for carbon peak in this article are reasonably set, providing a theoretical basis for the peak path. Furthermore, the carbon emissions from electricity before reaching the peak can serve as a constraint for optimizing the configuration of power sources before reaching the peak, providing a basis for optimizing the configuration of power sources.
(3)
The period from 2030 to 2060 is the deep low-carbon stage of the power sector. The use of CCUS and other related carbon sink technologies can enable the power sector to achieve carbon neutrality in 2057, assuming that 15% of coal-fired power is maintained. If all coal-fired power plants use the CCUS technology, the corresponding carbon emissions can be reduced by about 1.275 billion tons compared to a 50% penetration rate.
Forecasting carbon emissions from electricity is crucial for sustainable energy planning and environmental policy formulation. System dynamics model, as a method widely used in complex system modeling, is used to try to predict the future development trend of electricity carbon emissions. However, when applying system dynamics models for electricity carbon emission predictions, we must be aware of some inherent limitations that may affect the accuracy and applicability of the models.
Uncertainty about future government environmental policies is an important limitation of system dynamics models. Models often assume government policies will remain stable in the future, but in reality, policy changes can have profound effects on electricity carbon emissions. The government may adjust carbon emission quotas, tax policies, etc., and these changes will directly affect the carbon emission level of the power industry.
The model’s performance in technological innovation is also limited. Although we can expect that the introduction of new technologies may change the landscape of the energy industry, the specific speed and impact of technological innovation are difficult to determine in advance. Rapid advances in renewable energy technologies may exceed model predictions, leading to inaccurate estimates of future electricity carbon emissions.
The instability of external factors also brings challenges to the construction of system dynamics models. Fluctuations in global energy markets, such as changes in international coal prices, may significantly affect carbon emissions from domestic power systems. Fluctuations in such external factors can be difficult to accurately model in models, leading to forecast uncertainty.
Therefore, we must handle these limitations carefully when using system dynamics models for electricity carbon emission predictions.

5. Policy Recommendation

5.1. Synergistic Use of Power and Energy to Build a New Power System

Today, the power industry accounts for up to 70% of fossil energy production. The contradiction between China’s huge coal power system and the scarce flexible resource system is prominent, which directly leads to contradictory issues such as power abandonment. Therefore, the key point of the transformation is to implement gradual power layout measures to accommodate the development of new energy power, integrate current technology, resources, and system urgency. Taking differentiated measures to deepen the flexibility of coal-fired power is the most important breakthrough in the transition to a new power system in the medium term. In the process of achieving the “dual carbon” target, the installed scale of coal power should be strictly controlled, and the transformation of existing coal-fired power units to save coal and reduce consumption and flexibility should be accelerated. We should also enhance the flexible regulation capacity of coal-fired power and coordinate the development of coal-fired power with the preservation of supply security and peak load regulation; increase the proportion of coal power units with high parameters, low pollution, and large capacity in the installed coal-fired power capacity; play a role in underwriting and peak regulation capacity through the implementation of coal power unit flexibility transformation.

5.2. Promote Low-Carbon Technology Innovation to Provide Multiple Options for Carbon Neutrality

From the perspective of technical feasibility, high renewable energy development and fossil energy decarburization are the main low-carbon transition concepts and optional strategies to achieve low-carbon transition of electricity in China in the future. Breakthroughs in large-scale energy storage technology should be applied to support a new form of renewable energy-driven power system. Breakthroughs in the development of carbon sink technology can eliminate the high carbon attributes of fossil energy and establish an energy system dominated by both traditional and clean energy sources. Therefore, government departments, research institutes, and power companies need to be encouraged to grasp the scale and timing of technology incentives to drive technological progress in related fields and achieve future breakthroughs in the integration of key revolutionary technologies in carbon neutrality.

5.3. Playing the Coordinating Role of Market Mechanisms

Deepen the reform of the electricity system mechanism and promote the construction of a national unified electricity market. Establish standardized and unified electricity market trading rules and technical standards, and improve the mechanism for new energy to participate in the market. Do a good job of implementing the market-based consumption of new energy from the market mechanism and policy system. In the process of building a national unified electricity market, it is necessary to give full play to the role of the market mechanism in optimizing the allocation of resources, but also to prevent market failures. Reduce the negative impact of the polarization effect of the regional economy and realize the smooth progress of economic transformation work.

5.4. Encourage Various Social Entities to Participate in the Investment and Construction of Low-Carbon Electricity Transformation

Carbon neutrality is a long-term strategic transformation work that requires the participation of the whole society and requires the mobilization of enthusiastic contributions from all segments of the power body and the promotion of the synergistic construction of the power system. The role of small distributed systems and energy storage facilities is being fully exploited. For example, the current investment and construction of electricity facilities for urban customers has taken shape in distributed energy, electric vehicle charging stations, and smart home appliances. The concept of green, low-carbon living is also being promoted. However, rural areas are still more traditional in terms of infrastructure and energy use and have great potential to reduce emissions. Social capital can be encouraged to invest in the construction of new rural energy infrastructure through national financial subsidies, tax incentives, financing support, and market economic incentives. Building an energy supply system with decentralized new energy, biomass, gas, and other low-carbon energy sources is useful.

5.5. How These Policy Recommendations Might Be Effectively Implemented

To ensure that the policy recommendations effectively contribute to the carbon neutrality goal, the article proposes the following implementation and monitoring mechanisms.
First, the government and relevant stakeholders should formulate a clear and specific policy framework that specifies the carbon neutrality target and details the implementation path and timetable. At the same time, we suggest deploying an advanced monitoring system to track key indicators such as energy production and consumption, carbon emissions, and environmental benefits in real time. Such a system will help identify problems quickly and make timely policy adjustments. At the same time, incentives, such as carbon markets, carbon taxes, or other market mechanisms, should be set up to encourage enterprises and individuals to adopt low-carbon behaviors. This will increase the speed at which carbon neutral targets can be achieved and incentivize more innovation and investment. Through these instruments, a robust policy implementation and monitoring system can be established to ensure that policies substantially contribute to the achievement of carbon neutrality goals.
Second, to further promote the achievement of the carbon neutrality goal, we recommend that the government actively promote technological innovation and support the research and development and adoption of cleaner technologies to reduce carbon emissions. The government should monitor the adoption of innovations and adjust support policies according to the actual results. Promoting international cooperation is also important. The government should actively participate in international cooperation mechanisms to share best practices, experiences, and technologies to promote the realization of the global carbon neutrality goal. Transparency is also key to successful implementation. Governments and enterprises should develop transparent reporting standards to ensure clear and accurate reporting to the public on the progress of achieving carbon neutrality. Finally, social participation and publicity and education are factors that cannot be ignored. Stimulating public participation and raising social awareness of the carbon neutrality target will help to create widespread support for and adoption of low-carbon lifestyles.
The combined implementation of the above measures will ensure that the policy proposals are not only technically feasible, but also have sustainable and comprehensive impacts at the social and economic levels, contributing to the realization of the carbon neutrality target.

Author Contributions

Conceptualization, Z.W. (Zhenfen Wu), Z.W. (Zhe Wang), Q.Y. and C.L.; methodology, Z.W. (Zhenfen Wu), Z.W. (Zhe Wang) and C.L.; software, Z.W. (Zhe Wang); validation, Z.W. (Zhenfen Wu), Z.W. (Zhe Wang), Q.Y. and C.L.; formal analysis, Z.W. (Zhenfen Wu), Z.W. (Zhe Wang), Q.Y. and C.L.; investigation, Z.W. (Zhenfen Wu), Z.W. (Zhe Wang), C.L. and Q.Y.; data curation, Z.W. (Zhenfen Wu), Z.W. (Zhe Wang), Q.Y., and C.L.; writing—original draft preparation, Z.W. (Zhenfen Wu), Z.W. (Zhe Wang) and C.L.; writing—review and editing, Z.W. (Zhenfen Wu), Z.W. (Zhe Wang) and C.L.; visualization, Z.W. (Zhe Wang); supervision, Q.Y., Z.W. (Zhenfen Wu), Z.W. (Zhe Wang) and C.L. All authors have read and agreed to the published version of the manuscript.

Funding

This study was supported by a grant from the Applied Basic Research Key Project of Yunnan (No. 202201AS070034), Yunnan Science and Technology Talent and Platform Program (No. 202305AM070006), Yunnan Fundamental Research Projects (No. 202301AU070061), and the Yunnan Technology Innovation Center of Phosphorus Resource (No. 202305AK340002).

Data Availability Statement

The data presented in this study are available on request from the corresponding author.

Conflicts of Interest

The authors declare no conflicts of interest.

References

  1. Wang, X.P.; Wang, Y.Y. Power Industry Carbon Emissions Prediction Based on System Dynamics. Smart Power 2016, 44, 29–32+58. [Google Scholar]
  2. Zhu, Y.E.; Li, L.F.; He, S.S.; Li, H.; Wang, Y. Peak year prediction of Shanxi province’s carbon emission based on IPAT model and scenario analysis. Resour. Sci. 2016, 38, 2316–2325. [Google Scholar]
  3. Wang, Y.; Bi, Y.; Wang, E.D. Scenario prediction and emission reduction potential assessment of China’s industrial carbon emissions peaking. China Population, Resources and Environment. China Popul. Resour. Environ. 2017, 27, 131–140. [Google Scholar]
  4. Fu, J.Y.; Xu, S.H.; Dai, Y.T. Carbon emissions and its peak prediction of thermal power industry in Guangdong province. Energy China 2016, 38, 41–47. [Google Scholar]
  5. Zhang, N.; Lv, L.H.; Zhao, M.X.; Xiang, M.Y.; Bai, Z.H.; Luo, H. A comparative study of stage characteristics and factorial decomposition of CO2 emissions between China and the USA. Environ. Sci. Pollut. Res. 2022, 29, 48769–48783. [Google Scholar] [CrossRef]
  6. Wang, Q.; Song, X.X. How UK farewell to coal–Insight from multi-regional input-output and logarithmic mean divisia index analysis. Energy 2021, 229, 120655. [Google Scholar] [CrossRef]
  7. Deng, Z.C.; Kang, P.; Wang, Z.; Zhang, X.L.; Li, W.J.; Lei, Y.; Dang, Y.; Deng, Z.R. The impact of urbanization and consumption patterns on China’s black carbon emissions based on input-output analysis and structural decomposition analysis. Environ. Sci. Pollut. Res. 2021, 28, 2914–2922. [Google Scholar] [CrossRef]
  8. Wu, R.; Wang, J.Y.; Wang, S.J.; Feng, K.S. The drivers of declining CO2 emissions trends in developed nations using an extended STIRPAT model: A historical and prospective analysis. Renew. Sustain. Energy Rev. 2021, 149, 111328. [Google Scholar] [CrossRef]
  9. Li, W.Y.; Ji, Z.S.; Dong, F.G. Spatio-temporal evolution relationships between provincial CO2emissions and driving factors using geographically and temporally weighted regression model. Sustain. Cities Soc. 2022, 81, 103836. [Google Scholar] [CrossRef]
  10. Ding, T.T. Peak Forecast of Carbon Emissions in the Power Industry from the Perspective of Economic Growth and Emission Reduction. Sci. Technol. Manag. Res. 2019, 39, 246–253. [Google Scholar]
  11. Hou, J.C.; Shi, D. Research on the driving factors of carbon emission changes in China’s power industry. China Ind. Econ. 2014, 6, 44–56. [Google Scholar]
  12. Kong, Y.H. Research on Influencing Factors and Peak Prediction of Industrial Carbon Emissions in Lanzhou. Master’s Thesis, Lanzhou University, Lanzhou, China, 2018. [Google Scholar]
  13. Xu, G.Y.; Schwarz, P.; Yang, H.L. Determining China’s CO2 emissions peak with a dynamic nonlinear artificial neural network approach and scenario analysis. Energy Policy 2019, 128, 752–762. [Google Scholar] [CrossRef]
  14. Hamrani, A.; Akbarzadeh, A.; Madramootoo, C.A. Machine learning for predicting greenhouse gas emissions from agricultural soils. Sci. Total Environ. 2020, 741, 140338. [Google Scholar] [CrossRef]
  15. Xu, N.; Ding, S.; Gong, Y.D.; Bai, J. Forecasting Chinese greenhouse gas emissions from energy consumption using a novel grey rolling model. Energy 2019, 175, 218–227. [Google Scholar] [CrossRef]
  16. Pan, M.Z.; Li, C.; Gao, R.; Huang, Y.T.; You, H.; Gu, T.S.; Qin, F.R. Photovoltaic power forecasting based on a support vector machine with improved ant colony optimization. J. Clean. Prod. 2020, 277, 123948. [Google Scholar] [CrossRef]
  17. Ye, F.; Fang, X.L.; Li, L.X.; Li, Y.N.; Chang, C.T. Allocation of carbon dioxide emission quotas based on the energy-economy-environment perspective: Evidence from Guangdong Province. Autom. Electr. Power Syst. 2019, 669, 657–667. [Google Scholar] [CrossRef] [PubMed]
  18. AlKheder, S.; Almusalam, A. Forecasting of carbon dioxide emissions from power plants in Kuwait using United States Environmental Protection Agency, Intergovernmental panel on climate change, and machine learning methods. Renew. Energy 2022, 191, 819–827. [Google Scholar] [CrossRef]
  19. Sun, W.; Huang, C.C. Predictions of carbon emission intensity based on factor analysis and an improved extreme learning machine from the perspective of carbon emission efficiency. J. Clean. Prod. 2022, 338, 130414. [Google Scholar] [CrossRef]
  20. Zhou, W.H.; Zeng, B.; Wang, J.Z.; Luo, X.S.; Liu, X.Z. Forecasting Chinese carbon emissions using a novel grey rolling prediction model. Chaos Solitons Fractals 2021, 147, 110968. [Google Scholar] [CrossRef]
  21. York, R.; Rosa, E.A.; Dietz, T. STIRPAT, IPAT and ImPACT: Analytic tools for unpacking the driving forces of environmental impacts. Ecol. Econ. 2003, 46, 351–365. [Google Scholar] [CrossRef]
  22. National Bureau of Statistics of China. China Statistical Yearbook. 2019. Available online: https://www.stats.gov.cn/sj/ndsj/2019/indexch.htm (accessed on 9 January 2024).
  23. Wang, Y.Y. Research on Carbon Emission Prediction of Electric Power Industry Based on System Dynamics. Master’s Thesis, North China Electric Power University, Beijing, China, 2018. [Google Scholar]
  24. Meng, M.; Jing, K.Q.; Mander, S. Scenario analysis of CO2, emissions from China’s electric power industry. J. Clean. Prod. 2017, 142, 3101–3108. [Google Scholar] [CrossRef]
  25. Jiang, Q.Q.; Khattak, S.I.; Rahman, Z.U. Measuring the simultaneous effects of electricity consumption and production on carbon dioxide emissions (CO2e) in China: New evidence from an EKC-based assessment. Energy 2021, 229, 120616. [Google Scholar] [CrossRef]
  26. Thio, E.; Tan, M.X.; Li, L.; Salman, M.; Long, X.L.; Sun, H.P.; Zhu, B.Z. Correction to: The estimation of influencing factors for carbon emissions based on EKC hypothesis and STIRPAT model: Evidence from top 10 countries. Environ. Dev. Sustain. 2023, 25, 995–996. [Google Scholar] [CrossRef]
  27. Cao, L.; Liu, S.; Dong, X.L.; Liao, L.; Li, X.N. Research on the relationship between environment and economy based on EKC conformance test. Environ. Sci. Manag. 2021, 46, 149–154. [Google Scholar]
  28. IPCC. 2006 IPCC National Greenhouse Gas Emission Guidelines. Available online: https://wenku.baidu.com/view/0bb71a8ef624ccbff121dd36a32d7375a417c686.html?wkts_=1699257935424&bdQuery=IPCC2006 (accessed on 5 November 2023).
  29. Liu, J.J.; Li, S.L.; Fan, H.J.; Lin, Q. Energy Demand and Carbon Emissions Forecasting by the Method of Scenario Analysis. Energy Conserv. Technol. 2012, 30, 70–75. [Google Scholar]
  30. Institute of World Economics and Politics Chinese Academy of Social Sciences. World energy China outlook (2014–2015). Available online: http://iwep.cssn.cn/xscg/xscg_zzjyz/201502/t20150225_1902895.shtml. (accessed on 9 January 2024).
  31. Liu, Q.L.; Lei, Q.; Xu, H.M.; Yuan, J.H. China’s energy revolution strategy into 2030. Resour. Conserv. Recycl. 2018, 128, 78–89. [Google Scholar] [CrossRef]
  32. Zhao, Y.T. Carbon Dioxide Emission of Coal-Fired Power Industry Prediction Research Based on System Dynamics. Master’s Thesis, Xinjiang University, Urumqi, China, 2019. [Google Scholar]
  33. Shu, Y.B.; Zhang, L.Y.; Zhang, Y.Z.; Wang, Y.H.; Lu, G.; Yuan, B.; Xia, P. Carbon Peak and Carbon Neutrality for China’s Power Industry. Strateg. Study CAE 2021, 23, 1–14. [Google Scholar] [CrossRef]
  34. Wang, Y.; Wang, P.Y.; Chen, X. Carbon emission prediction in the United States based on grey neural network model. Sci. Technol. Inf. 2019, 14, 202. [Google Scholar]
Figure 1. Fitting analysis curve of electricity carbon emission intensity and GDP per capita.
Energies 17 00472 g001
Figure 2. Causal diagram of electric power carbon emission system.
Energies 17 00472 g002aEnergies 17 00472 g002b
Figure 3. The current inventory of the electricity carbon emission system.
Energies 17 00472 g003
Figure 4. Fitting curve of actual value and simulated value.
Energies 17 00472 g004aEnergies 17 00472 g004b
Figure 5. Trends of carbon emission forecasts in the power sector under different scenarios.
Energies 17 00472 g005
Figure 6. The forecast trend of carbon emissions in the power sector under different scenarios.
Energies 17 00472 g006
Table 1. Testing for multiple cointegration among factors influencing carbon emissions from electricity, 2005–2019.
Unstandardized CoefficientsStandard CoefficienttSig.Collinearity Statistics
BStandard ErrorBetaToleranceVIF
Constant−120.00226.309 −4.5610.070
lnPp9.1392.1101.296−0.040.9120.004117.213
lnRu0.8600.4830.5257.4460.8740.005124.361
lnAGp−0.1470.166−0.5225.6220.0000.003312.102
lnAin(2)0.8140.4100.350−0.4050.2270.02137.634
lnAin(3)0.7570.4160.4070.5260.5450.01644.312
lnAe0.0510.1040.0901.3760.0000.005127.075
lnTe0.1850.136−0.0990.4160.8910.03798.716
lnTf1.2270.4970.438−0.2100.6140.02258.448
Table 2. Summary of regression analysis models.
RR2Adjust R2Standard Estimate Error
0.9750.9560.9390.0514
Table 3. Summary of regression analysis models.
Model ParametersCubic Functionlog Cubic Function
β14.22825 × 10⁵ ± 1.67644 × 10−65.52732 ± 1.1411
β2−9.4007 × 10¹⁰ ± 6.63015 × 10−11.05056 ± 0.21418
β36.01733 × 10 −15 ± 6.24555 × 10⁻¹−0.0504 ± 0.01004
R20.802410.91734
Whether it is “inverted U”YesYes
Table 4. Summary of regression analysis models.
Time/YearGDP Per Capita/YuanElectricity Carbon Intensity
200824,1000.830
200926,1800.790
201030,8080.600
201136,2770.620
201239,7710.560
201343,4970.534
201446,9120.520
201549,9220.530
201653,7830.502
201755920.436
201865,5340.443
201970,3280.420
202072,0000.410
Table 5. Model equations.
VariableShorthandOperation Formula
GDP/trillion USDAG(111,398/12) + INTEG(rGDP × 0.14 × 111,398/12)
GDP increment/trillion USDΔAGCAG × rGDP
Adjustment rate of the proportion of the secondary industry/Dmnlrin(2)(Ain(2) − DELAY1L(Ain(2), 1, 0.454))/DELAY1L(Ain(2), 1, 0.454)
Electricity consumption of secondary industry/100 million kWhUin(2)In(1) × Sein(2)
Industrial electricity consumption/100 million kWhUinUin(1) + Uin(2) + Uin(3)
Total population/billion peoplePpINTEG(−ΔPpi + ΔPpc, Pp0)
Population growth/100 million peopleΔPpcPp × rb
Population reduction/100 million peopleΔPpiPp × rd
Population growth rate/100 million peoplerpoprbrd
GDP per capita/person/10,000 USDAGpAG/Pp
GDP growth rate per capita/DmnlrA(AGp(2) − DELAY1L(AGp, 1, 0.71412))/DELAY1L(AGp, 1, 0.71412)
Urbanization Growth Rate/Dmnlrgu(Ru − DELAY1L(Ru, 1, 0.3671))/DELAY1L(Ru, 1, 0.3671)
Urban electricity consumption increase/DmnlΔUur(2)Ue × rge
Urban electricity consumption growth rate/Dmnlrge0.156941 + rpop × 36.6383 + rgu × 5.6793 + rin(2) × 1.68273 + rA × 0.76914
Domestic electricity consumption/100 million kWhUlifeUe+ Urural
Total electricity consumption/100 million kWhUzUlife+ Uin
Electricity intensity/(kWh/10,000 USD)SueUz/AG
Thermal power generation/100 million kWhGfireUz × tfire
Thermal power speed increase/DmnlFg0.009597 + rpop × 0.16537 + rgu × 0.014037 + rin(2) × 0.0197714 + rA × 0.0164598 − rfg × 0.0231657 − Tn × 0.3
Thermal power ratio adjustment rate/Dmnlrfg(tfire − DELAY1L(tfire, 1, 0.726))/DELAY1L(tfire, 1, 0.726)
Natural gas consumption/100 million tons of standard coalDgasGgas × Tf
Oil consumption/100 million tons of standard coalDoilGoil × Tf
Coal consumption/100 million tons of standard coalDcoalGcoal × Tf
Technological progress impact factor/DmnlTt0.99
Electricity carbon emissions/100 million tonsCDgas × fgas + Doil × foil + Dcoal × fcoal
Carbon capture/gigatonCCGfire × α × β
Actual electricity carbon emissions/100 million tonsCrCCC
Electricity carbon emission intensity/ton/10,000 USDSCCr/AG
Carbon reduction policy/DmnlNIF THEN ELSE(Time > 2015:AND:(SCCit) > 0, 1, 0)
Carbon reduction measures/DmnlTnN × 0.01
Note: Dmnl stands for dimensionless in system dynamics, and all subsequent texts have the same meaning.
Table 6. Main parameters in each scheme.
ProgramYearsrGDPFgTfTtRu
12020–2025
2026–2030
2031–2035
2036–2040
7.3%
6.8%
6.5%
6.0%
−0.19
−0.55
−0.85
−1.18
−0.4
−0.5
−0.6
−0.7
+0.2%+2.5%
22020–2025
2026–2030
2031–2035
2036–2040
7.1%
6.5%
6.3%
5.8%
−0.19
−0.55
−0.85
−1.18
−0.55
−0.6
−0.65
−0.75
+0.25%+2.5%
32020–2025
2026–2030
2031–2035
2036–2040
7.0%
6.3%
5.8%
5.5%
−1.0
−1.14
−1.52
−1.97
−0.7
−0.9
−1.0
−1.2
+0.3%+2.3%
42020–2025
2026–2030
2031–2035
2036–2040
6.8%
6.2%
5.5%
5.0%
−1.21
−1.4
−1.92
−2.2
−0.7
−1.0
−1.2
−1.3
+0.35%+2%
52020–2025
2026–2030
2031–2035
2036–2040
6.5%
6.0%
5.0%
4.5%
−1.55
−1.76
−2.26
−2.55
−0.8
−1.1
−1.3
−1.4
+0.5%+2%
Note: Δ is the variation of each variable.
Table 7. Error analysis of GDP and total population.
YearGDP (Trillion USD)Population (100 Million People)
Actual ValueSimulated ValuesError %Actual ValueSimulated ValuesError %
201610.50910.6361.2013.96413.810−1.1
201711.71511.299−3.5414.00113.902−0.7
201812.94312.001−7.2714.05413.958−0.68
201913.89013.147−5.3514.10014.027−0.52
Table 8. Error analysis of total electricity consumption and electricity carbon emissions.
YearTotal Electricity Consumption (100 Million kWh)Electricity Carbon Emissions (100 Million tons)
Actual ValueSimulated ValuesError %Actual ValueSimulated ValuesError %
201659,16861,2033.4437.3361,2035.57
201763,07767,3506.7738.9167,3504.62
201868,44972,1145.3540.7572,1143.09
201972,25576,7266.1941.4576,7262.79
Table 9. Main parameter variables in the 2021~2030 model.
VariableYears
2021202220232024202520262027202820292030
AG/trillion USD15.57316.80118.00718.81719.45520.16721.11422.32423.54824.358
AGp/USD11,000.7911,817.6312,625.8213,143.1613,549.8114,009.9114,623.8615,461.8316,270.4116,812.73
In(2)/trillion USD4.90835.32665.47365.49855.65016.01586.43426.58116.60616.7577
Uin(2)/100 million kWh55,343.758,399.7159,846.6161,45064,492.067,548.068,994.970,598.373,640.376,696.3
Sein(2)/kWh/USD1.127181.0960121.093031.1119151.1410251.1224941.0719431.0723691.11441.134564
Uin/100 million kWh67,701.571,919.376,896.182,544.188,957.595,434.1102,463110,084119,031129,323
Sue/kWh/USD0.43460.42790.42690.43850.45710.47310.48510.49260.50530.5307
Uz/100 million kWh79,598.784,596.590,173.696,411.7103,404110,461118,144126,474136,046147,046
Ulife/100 million kWh11,897.212,677.213,277.513,867.614,447.315,027.515,680.716,389.817,015.617,723.4
Urural/100 million kWh9980.3710,122.8410,457.7710,743.910,955.211,097.711,432.611,718.811,930.112,072.6
Ru/%0.6280.6510.6740.6970.7130.7360.7590.7820.8050.828
Pp/100 million people14.156014.21714.26214.31714.35814.39514.43814.45014.47314.488
rb/%0.00760.00760.00760.00760.00760.00760.00760.00760.00760.0076
rd/%0.007180.007180.007180.007180.007180.007180.007180.007180.007180.00718
tfire/%676665646361.8660.7259.5858.4457.3
Gfire/100 million kWh53,331.1355,833.6958,612.8461,703.4965,145.0268,331.5571,737.4075,353.5779,505.6384,257.70
Fg−1.0−1.0−1.0−1.0−1.0−1.14−1.14−1.14−1.14−1.14
Tf /g/kWh305.3304.6303.9303.2302.5301.6300.7299.8298.9298
SC/ton/10,000 USD2.81 × 10−42.67 × 10−42.56 × 10−42.49 × 10−42.46 × 10−42.4 × 10−42.32 × 10−42.21 × 10−42.11 × 10−42.05 × 10⁻⁴
C/100 million tons43.723344.920246.075646.958747.788548.446549.0349.488749.74849.8891
Table 10. Simulated values of key parameters of electricity carbon emissions at peak in 2029 under Option 5.
Stock Map ParametersParameter ValueStock Map ParametersParameter Value
GDP18,648.8 hundred million dollarsThermal power ratio55%
GDP growth rate0.0411 DmnlProportion of natural gas power generation9%
Proportion of primary industry5%Proportion of oil power generation2%
The proportion of secondary industry26%Proportion of coal power generation44%
The proportion of tertiary industry69%Average standard coal consumption for power supply of thermal power units2.8 Dmnl
Industrial electricity consumption12.9675 trillion kWhResidential electricity consumption1.8525 trillion kWh
Total population1.4468 billion peopleTotal electricity consumption14.82 trillion kWh
Urban population1.017 billion peopleElectricity carbon intensity0.053 tons/10,000 USD
Urbanization rate70.3%Electricity carbon emissions4.95774 billion tons
Table 11. Main parameter settings of electricity carbon emissions in different scenarios.
SceneThermal Power RatioCCUS Technical Scale
1From 44% coal, 9% gas (2029) to 26% coal, 9% gas (2060)No CCUS technology
2From 44% coal, 9% gas (2029) to 19% coal, 7% gas (2060)Partly using CCUS technology
3From 44% coal, 9% gas (2029) to 15% coal, 7% gas (2060)CCUS technology is widely used
Disclaimer/Publisher’s Note: The statements, opinions and data contained in all publications are solely those of the individual author(s) and contributor(s) and not of MDPI and/or the editor(s). MDPI and/or the editor(s) disclaim responsibility for any injury to people or property resulting from any ideas, methods, instructions or products referred to in the content.

