Article

Characterization and Analysis of Mechanical Vibrations in Photovoltaic Modules Transported by Road in Spain

by
Jose Cuenca
,
M. Carmen Alonso-Garcia
* and
Jose Lorenzo Balenzategui
CIEMAT, Departamento de Energía, Unidad de Energía Solar Fotovoltaica, Avenida Complutenes 40, 28040 Madrid, Spain
*
Author to whom correspondence should be addressed.
Energies 2024, 17(1), 145; https://doi.org/10.3390/en17010145
Submission received: 28 November 2023 / Revised: 21 December 2023 / Accepted: 22 December 2023 / Published: 27 December 2023
(This article belongs to the Special Issue Advances in Photovoltaic Solar Energy)

Abstract

:
Large deployment of photovoltaic (PV) installation worldwide demands reliability assurance of the systems to maintain the confidence in the markets. With the diversity of PV applications, it is essential the detection of circumstances that can be the root of failure mechanisms, such as transportation and installation of the modules. They are one of the main sources of induced vibrations, which, in its turn, can provoke defects and damages in the PV modules. In this work, we have measured and analyzed tri-axial accelerations and mechanical vibration that photovoltaic crystalline modules withstand during transportation by road, including loading and unloading operations. We have also analyzed the natural oscillation frequencies, the resonance phenomena and the highest impacts. It is concluded that a proper fastening of the load inside the truck is necessary and that high impacts during loading and unloading should be avoided. Packing the modules to reduce vibrations is also recommendable. Several solutions to perform this are proposed.

1. Introduction

Photovoltaic solar energy is one of the most reliable and cheap renewable energy sources, which has substantially increased its installed capacity worldwide over the years [1]. Currently, the ambitions of countries to achieve the decarbonization of their economies and the reduction in greenhouse gasses foresees a large worldwide growth in installed PV capacity to 2030 and 2050 [1,2]. Spain is aligned with this decarbonization objective, which is reflected in the evolution of PV capacity. In the last years, cumulative installed PV capacity has shown an exponential increase with more than 15 GW cumulative capacity in 2021 [3]. This trend is expected to continue in the following years in order to achieve the targets stablished in the Spanish National Energy and Climate Plan [4], that is, 39.181 GW in 2030 [5] and climatic neutrality in 2050.
Photovoltaic applications are characterized nowadays for their variety, diversity of applications, new module designs and installation in a variety of climatological conditions [6]. In this context, the assurance of the reliability of the systems is crucial to maintain confidence in their markets. An intense international activity has been developed to define testing methods and procedures to detect failure mechanisms occurring in the plants with a relatively short time of operation [7,8], in order to prevent them before their appearance. One of the topics that has caught the attention of laboratories and researchers is the analysis and prevention of cracks and microcracks appearing in the cells of the modules, as they can have influence in the long-term operation. While there are a number of studies focused on the characterization of cracks and microcracks [9,10,11], its influence on power degradation [12,13,14,15,16] and the characterization in the field [17,18,19,20], few of them have focused on preventing some of their causes, as the vibrations that the modules have to endure during their lifetime. Cracks can originate due to mechanical loads of the module during its handling in the factory, packaging, loading and unloading, transportation, storage in the plants and installation. The characterization of the type of vibration originated during these operations is important to avoid those more prone to produce module failures. Resonance oscillations seems to have a high impact in module integrity, with power losses up to 8% and multiple cracks [21]. Inappropriate handling, especially in the situations in which the force acts perpendicular to the surface of the modules, cause damage in the module cell structure that can be significant [22]. Some authors [23] have characterized PV modules before and after a standard transportation, showing 2% evolved cracks that can cause power losses from 0.53% to 1.42% and hot spots after 6 months of operation. Once the modules are installed in the plant, they are subjected also to mechanical fatigue originated by wind, rain and snow loads, and by day–night thermal cycles [6,24] that generate vibrations which may damage the modules. Some cleaning operations in the plants use mechanical vibrations [25] that might have an impact in the long term. Among the different sources of induced vibrations in the PV modules, transportation and installation are one of the main causes. Usually, modules have to be moved from their manufacturing location in the factory to the installation site, sometimes with intermediate temporal storage. The transportation can be completed either by plane, boat, train or truck, road transportation being the most common (at least for a part of the displacements). Recent studies have shown that logistic processes have a considerable impact in the implementation of PV installation, as transportation damage can affect the entire investment [26]. It is also documented that transportation and installation can cause vibrations in the modules [27,28] and the development of cracks that can evolve into hot spots and increase potential induced degradation occurrence when the modules are in operation [22].
In this work, we have focused on the measurement and analysis of the vibrations on c-Si PV modules, particularly the ones that modules have to withstand during transportation by road. The characteristics of mechanical vibration during road transportation depends on several factors, such as the structure and shape of packaging, the position of the module, the type of truck, the characteristics of the wheels and suspensions or the roughness of the road [29]. We have designed three transportation experiments for PV modules inside a truck across Spanish roads. In Spain, PV facilities are installed all around its geography, and PV modules have usually to be moved large distances by truck. The experiments here designed take into account loading and unloading operations and consider two different positions of the modules inside the truck. To quantify the vibrations, tri-axial accelerometers have been used to quickly record acceleration values, which subsequently have been analyzed. The analysis has been performed during the transportation trips and the truck loading and unloading operations by means of the statistical analysis of acceleration values, the evaluation of the severity by the overall acceleration parameter [30], and the study of the natural oscillations frequency of the PV modules and resonance phenomena, as it could considerably increase the mechanical fatigue.

2. Materials and Methods

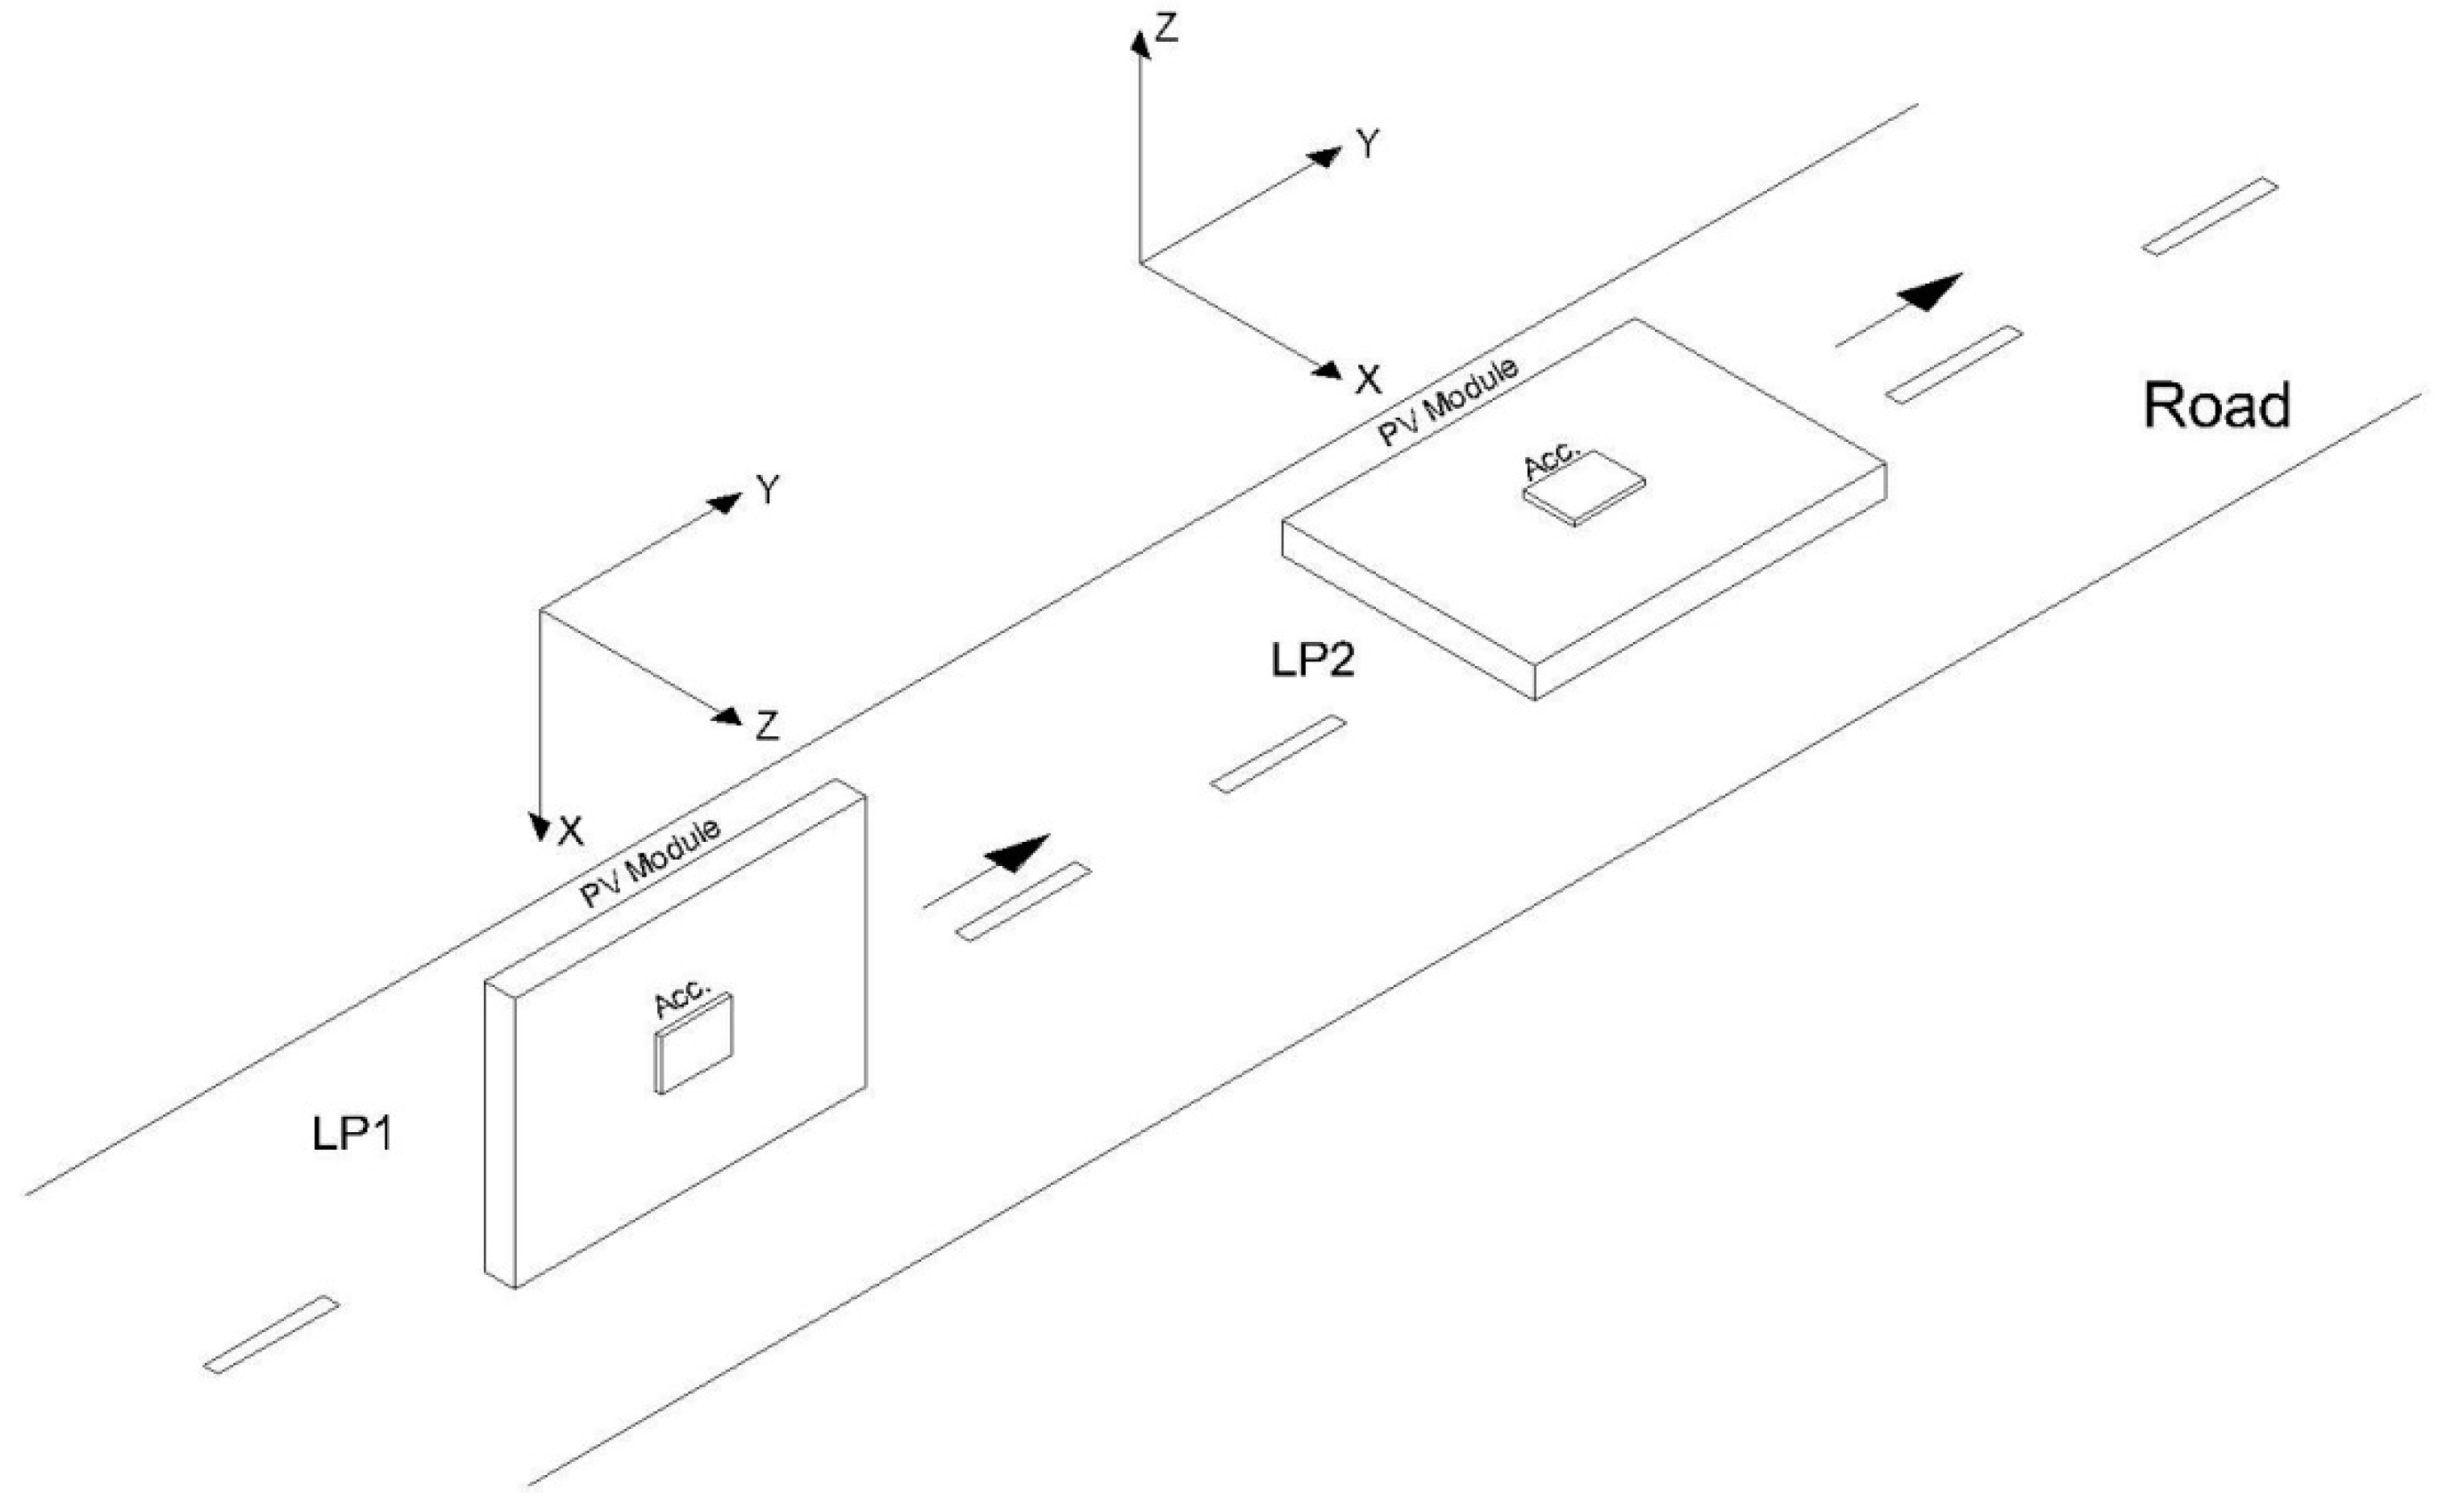
2.1. Description of Logistic Processes Applied

To evaluate the mechanical vibrations supported by PV modules during their transportation by Spanish roads, two real logistic processes in different conditions, named LP1 and LP2, have been monitored. Tri-axial acceleration loggers models MSR145 and MSR165 manufacured by MSR Electronics GmbH (Seuzach, Switzerland) with sampling rates up to 400 S/s have been used for the measurement of the vibrations. High sampling rates allows for avoiding the aliasing phenomena originating because road transportation vibration frequencies are under 200 Hz [31]. The weights of these accelerometers are only 30 g and 70 g, respectively, so their influence in the measurements is considered as negligible. Accelerometers were attached on the center rear side of the module using ultra-resistant double-sided adhesive tape, before the transportation LP1 and LP2 processes. Data registered allow the analysis of the rest and moving periods of the truck, including the loading and unloading operations.

2.1.1. Logistic Process 1, LP1

Two packages of PV modules were sent by truck through 400 km of a Spanish highway, here named as ‘A’, with a duration of 5 days. The truck was formed by a head tractor and a trailer with double shaft, pneumatic suspension with leaf springs. It departed from the PV factory towards our laboratory in Madrid with two wooden pallets using the conventional packaging procedure used by the manufacturer: PV modules placed in vertical long side position (this is, supported by their long side), all of them with the same orientation of the glass and connection boxes, and packaged in a cardboard box fixed to the pallet. The pallets were not fastened to the truck. PV modules inside the boxes were 60 cells mono-Si and multi-Si modules, with aluminum frame, 3.2 or 4 mm thickness glass front cover, and two types of back sheets and encapsulant materials. Main features of each box and their content (number and characteristics of PV modules) are collected in Table 1.
One 3.2 mm and one 4 mm glass PV modules, named M3 and M4, one in every box, were randomly chosen to carry a MSR165 accelerometer each one. The accelerometers’ sampling rates were 200 S/s (samples/second) for M3 and 400 S/s for M4. A slower sampling rate allows for longer recording periods because of lower memory and battery requirements, while a larger rate implies better resolution, so both strategies were checked in this run. The X axis of accelerometers records vertical movements, the Y axis the longitudinal (road direction) and the Z axis the lateral (which corresponds to the bending movement of the glass of the modules, see Figure 1).

2.1.2. Logistic Process 2, LP2

In this case, four PV modules available at our laboratory with several years of operation were manually packaged in one box and transported in a 600 + 600 km round trip from the testing laboratory at Ciemat-Madrid through a different Spanish highway, here named as ‘B’. The transportation was performed by a commercial courier company, and at least two different vehicles were used and several loading and unloading operations were performed. In the box, two modules were placed horizontally and two vertically supported on their long side. An MSR145 accelerometer was attached in one of the horizontal modules, referred to as M2. Details about these modules are also included in Table 1. In this case, the sampling rate was only 20 S/s (maximum sampling rate for MSR145 model). The accelerometer X-axis recorded the lateral movements, the Y-axis the longitudinal (road direction) and the Z-axis the vertical oscillations, which corresponds to the bending movement of the PV module glass (see Figure 1).

2.2. Evaluation of the Severity by Means of the Overall Acceleration gRMS Parameter

The severity of a vibration can be quantified through a parameter called overall acceleration gRMS [29], calculated following Equation (1):
g R M S a t = f 1 f 2 P S D a t d f
where PSD is the Power Spectral Density function of the acceleration function a(t), being f1 and f2 the frequency bounds for integration. The PSD function is calculated as the Fourier Transform of the autocorrelation function of a(t). However, for a set of acceleration values (this is, an a[n] function discretized in m-samples) distributed according to a Gaussian probability distribution, the overall acceleration gRMS is given by:
g R M S a n n = 1 n = m ( a [ n ] a ¯ ) 2 m 1 = σ
where a ¯ is the mean value of a[n]. We consider a ¯ μ . Therefore, in the case of acceleration values showing normal-like distributions, the overall acceleration gRMS is equivalent to the standard deviation σ.
The overall acceleration parameter is used in the international standard IEC 62759-1:2015 [32] as a test condition. This standard arose as complementary to preceding PV modules type approval standards such as IEC 61215 [33] and IEC 61646 [34], that did not consider mechanical stresses that may occur during transportation up to the PV installation site. IEC 62759-1 standard only applies to flat plate PV modules and describes methods for the simulation of transportation of complete package units of PV modules. The standard defines different tests to be carried out. Pertinent to this work is, for example, a ‘shock testing’ procedure to simulate stresses that might be caused by bumps, forklifts, sudden decelerations of the braking or sideward accelerations of the curves. It also defines a ‘random vibration test’ to simulate the transportation vibrations, based on a random vibration applied to the module with these characteristics: vertical excitation for at least 3 h, at frequencies in the range 5 to 200 Hz and a vibration severity of gRMS ≥ 0.49 g. The IEC standard includes four vibration PSD test profiles from other international standards as ISTA 3E [35] and stablishes the ASTM D4169-2008 [36] ‘truck Assurance Level II’ PSD as the main reference. Figure 2 shows the power spectral densities defined in IEC 62759-1 (ASTM D4169-2008) and ASTM D4169-2016. The last version of ASTM D4169-2016 [37] significantly redefines the ‘truck random vibration test’ by adopting the ISTA 3E ‘steel spring truck‘ PSD (with modified vibration levels at frequencies below 6 Hz) and by defining three test levels (low, medium, high) with increasing severities gRMS (0.4 g, 0.54 g, 0.7 g) and respective decreasing test times (40 min, 15 min, 5 min). The ISTA 3E PSD is closer to real transportation PSDs than ASTM D4169-2008 because it properly shapes the three main vibration frequencies generated by trucks.

2.3. Natural Oscillation Frequencies of PV Modules and Resonance Phenomena

Every photovoltaic module has its own natural oscillation frequencies, which are given by their physical dimensions and the mechanical properties of their constituents, mainly the glass type and thickness. During transport by road, a PV module is shaken by the excitatory vibrations generated by the roughness of the road, the components of the truck and those derived from driving events (accelerating, braking, curves, etc). The position, orientation and fixing method of the module in the truck could cause some of these contributions to become more relevant. As a consequence, the global oscillation of a module is composed of its own natural frequency (and some of its harmonics) and the frequencies induced by these excitations. Singh et al. [38] have measured vibrations on different kinds of trucks, roads and load levels, obtaining that the main sources of perturbation originated by the truck components are: the suspension system (frequencies around 4.5 Hz), the tires (from 15 to 20 Hz) and the truck frame or chassis (from 40 to 55 Hz). The amplitude of the suspension oscillations is of the order of decimeters, the tires promote perturbations of some centimeters, and the chassis induced vibrations around millimeters. With reference to the contributions of amplitude and frequency to the acceleration a(t) of vibration, it is interesting to remember that acceleration is directly proportional to the amplitude of the oscillation A and to the square of the frequency f: a t = A 2 π f 2 sin ( 2 π f t ). Thereby, the acceleration forces on the PV module due to a truck suspension oscillating at 4 Hz with an amplitude of 10 cm, will be approximately the same as those generated by tires vibrating 15 times per second 7 mm wide, and will be approximately the same as those due to chassis vibrations 1 mm deep at 40 Hz. But most importantly, if some of the natural oscillation frequencies of the PV module, mainly the fundamental one, are close to some of these frequencies, the amplitude of the oscillation could be dangerously increased due to resonance phenomena.
These real oscillations can be analyzed as a sum of damped harmonic oscillations as [39]:
a ( t ) = i = 1 n A i e δ i t sin ( 2 π f i t + φ i )
being a(t) the instantaneous acceleration, and Ai the amplitude, fi the frequency, δi the damping coefficient, φi the phase of the ith harmonic. The frequency of the ith harmonic corresponds with the ith normal mode of oscillation (the ith natural oscillation frequency) of the PV modules.

3. Results and Discussion

This section presents the description of the experimental results, the analysis and interpretation and the discussions and conclusion inferred for the improvement of logistic processes.

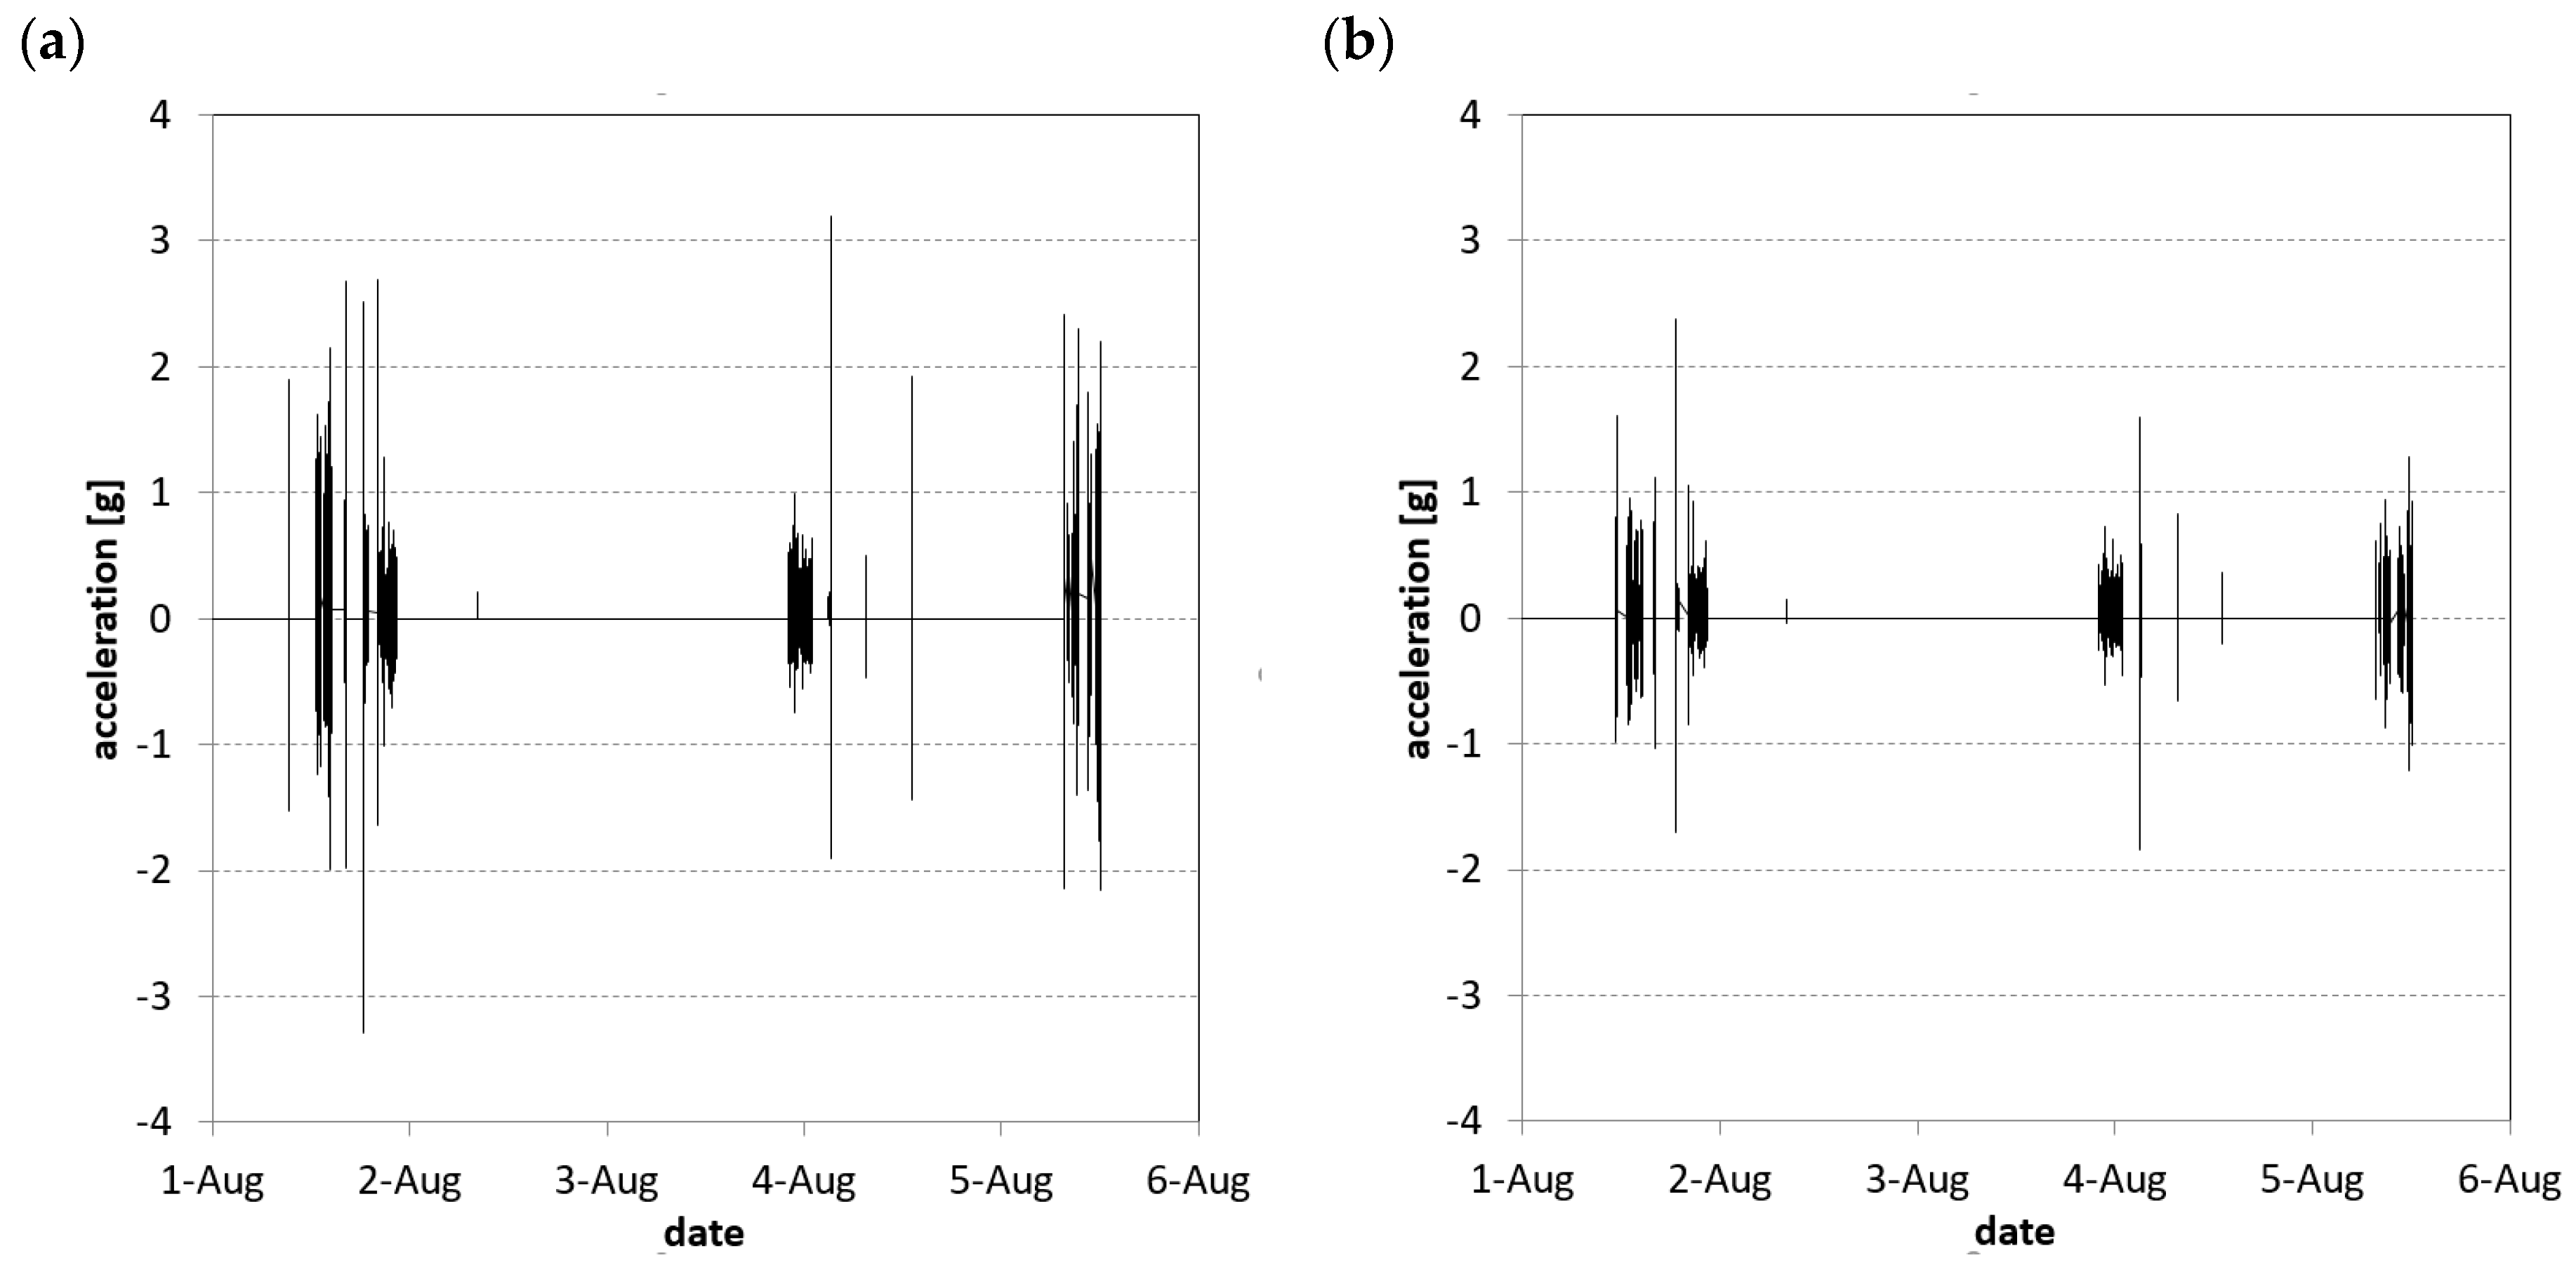
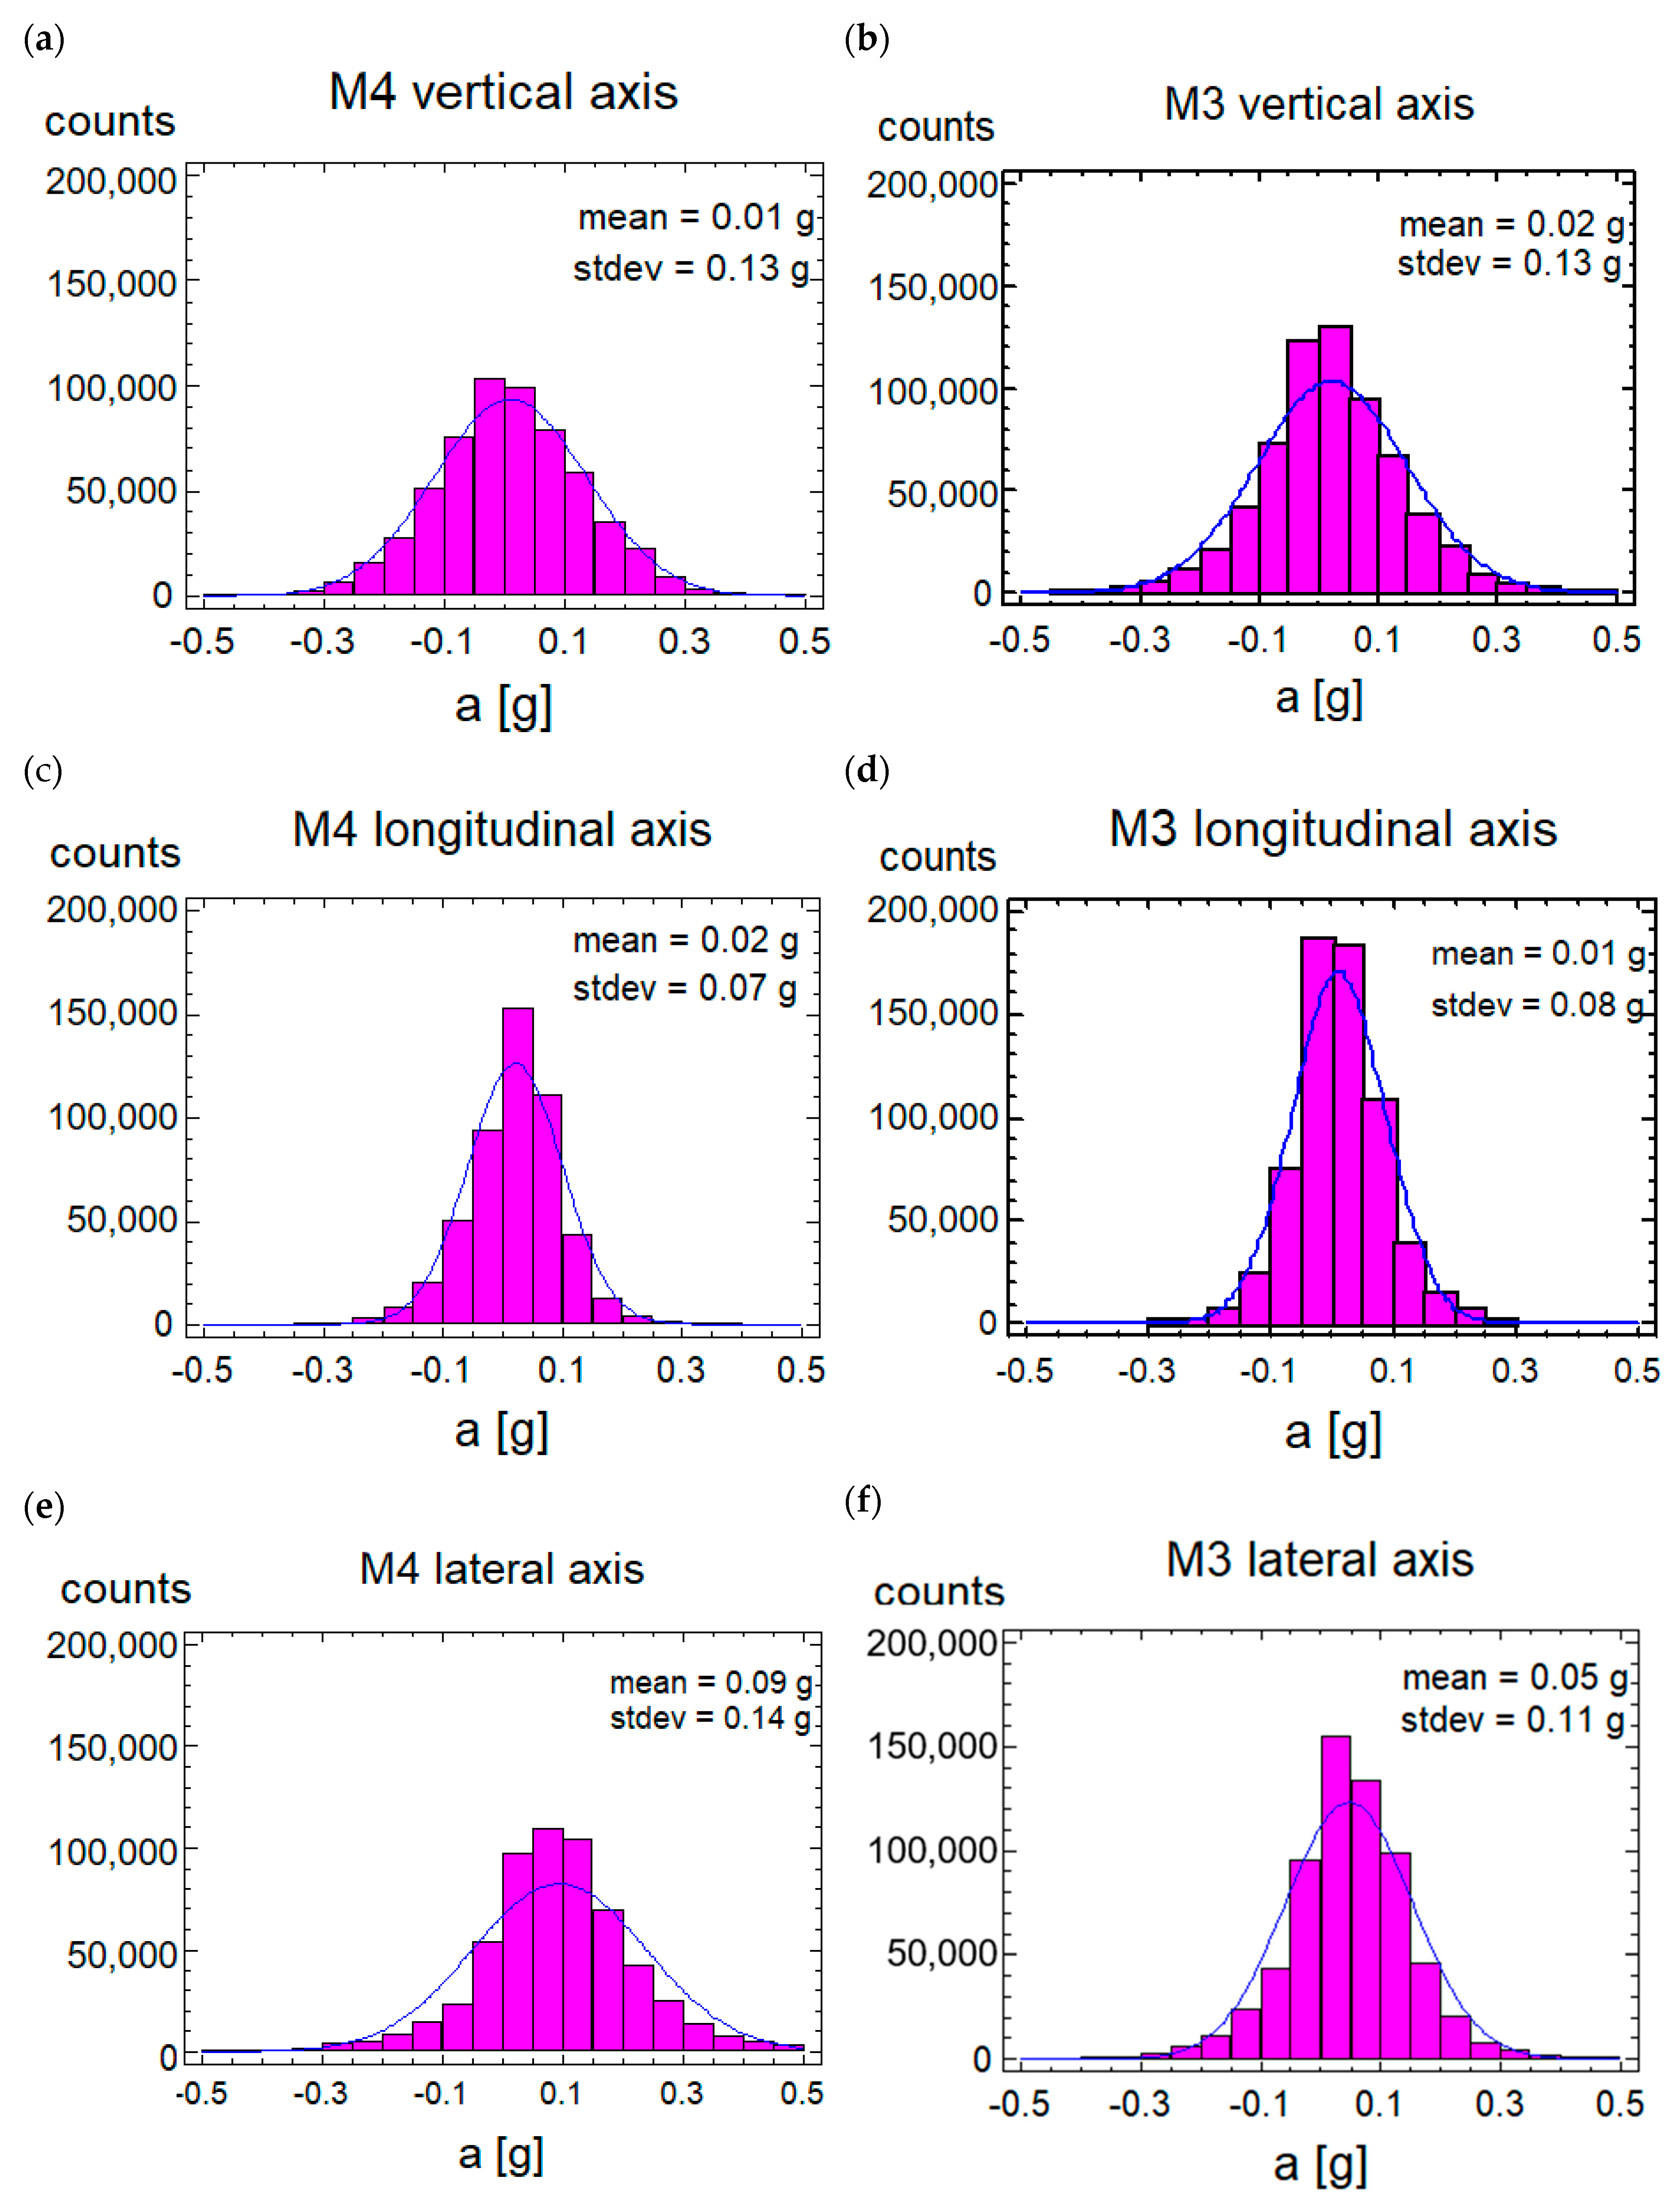
3.1. Acceleration Values and Statistical Analysis

The duration of LP1 was 5 days, but the total time in motion was only 5 h. In these 5 h, M4 accelerometer recorded 596,024 data samples and M3 recorded 674,865. Figure 3 shows the accelerations supported by M3 and M4 PV modules on Z axis (glass bending direction). Showed acceleration values do not include the contribution of gn, the standard acceleration of Earth (gn = 9.81 m/s2 = 1 g). The units of acceleration are in terms of g.
Maximum values registered along vertical axis (X axis), once the standard acceleration of gravity gn (gn ≡ 9.81 m/s2 = 1 g) is subtracted, have been +3.48 g for module M4 and +2.12 g for M3 module. This difference may be due to the different number of modules and weight in each box: module M3 is packed with other 11 PV modules, with a total weight of 270 kg and M4 is packed with 25 PV modules, with a total weight of 580 kg. Probably, as a higher mass promotes higher inertia and linear momentum, equivalent impulses applied to both boxes result in different acceleration values. As it can be observed in Figure 3, response of M3 module in terms of acceleration values was lower than those of M4 for the same perturbation events during the trip.
On the other hand, LP2 lasted 29 days, with 16 h in motion, distributed along 6 routes, as can be seen in Figure 4a. For LP2, the gn value was correspondingly subtracted in the Z axis. Some sudden events were recorded for M2 module: on 3 January at 06:14 h, a high impact of +15.3 g in the vertical axis (Z) was registered (probably due to a pothole), another event of −7.9 g at 06:38 h, and at 10:08 h another one between −7.8 g and +4.7 g; on January the 16th, at 11:30 h, during unloading, an impact of +15.9 g was registered in the Z axis, and at 11:36 h another one of +10.2 g in Z axis and −16.5 g in lateral X axis (Figure 4c,d). The maximum value for longitudinal axis (Y) was +6.6 g. Notice again how a PV module in a smaller mass box experienced larger acceleration values, when compared to those of boxes containing M3 and M4 modules. Table 2 summarizes the maximum acceleration values for both LP1 and LP2.
In addition to maximum acceleration values, which give information about the peak efforts that the PV modules endure, a more general statistical analysis of the acceleration values recorded during transportation tests is worthwhile. To this respect, when analyzing their data, Otari and Odof [40], and Ruillard [14,41] use non-Gaussian, non-stationary and leptokurtic random variables modelled by Rayleigh or Weibull probability distributions, with modified or added parameters. However, based on the histograms obtained from our measurements (see Figure 5) using the Distribution Fitting (Uncensored Data) procedure with the Maximum Likelihood Estimation (MLE) method in Statgraphics, it has been considered that the acceleration values recorded approximate reasonably well in our case to a normal distribution, in which standard deviation σ gives information about the dispersion of the acceleration values around the average. The use of a normal distribution simplifies some calculations (see Section 2.2.).
The Figure 5 shows the statistical distribution of accelerations for M3 and M4 modules. As can be seen, the behavior of accelerations is, in general, analogous for both modules in all directions. Notice that, in order to be consistent in the analysis among the three axes, the value of the standard acceleration of gravity gn has been subtracted to data recorded on the X axes. For this reason, the mean value μ of X axes is approximately zero (and not 1 g). Mean values µ for all the axes, after the correction for the X ones, are near zero, as expected, because oscillations are usually produced in both directions for a given axis. The standard deviation for vertical and longitudinal acceleration values recorded were similar, but lateral acceleration values (due to glass oscillations, Z axis) were slightly higher on M4 with σ = 0.14 than on M3 with σ = 0.11 (Figure 5e,f). Then, not only the maximum values previously shown, but also the standard deviation, reflect a higher influence of well the structural module properties, well the package characteristics (structure, weight size), in the transmission of the vibrations to the module.

3.2. Evaluation of Severity Based on gRMS

The overall acceleration gRMS figures for the logistic processes LP1 and LP2 have been calculated by using the Equation (2) for the three axes. The values obtained for Z axes (normal to PV modules planes) are shown in the Table 3. Notice how gRMS values are the same as σ obtained from the statistical analysis of Figure 5. The fourth column shows the transportation hardness as the product of severity and vibration duration. The last column shows the relative values of these products with respect to the test conditions of the IEC standard. The corresponding values relative to the ASTM D4169:2016 test conditions are quite similar, even though the PSD vibration profile is different, and are not included in the table.
The vibration severities for modules M3 and M4 in LP1 were smaller than those required in IEC standard. The hardness was less than a half of the corresponding IEC value. However, the vibration severity for M2 in LP2 exceeded the IEC value and the hardness was nine times higher. A comparison between LP1 and LP2 shows that photovoltaic modules transported in the horizontal position suffered a vibration severity gRMS normal to the PV modules planes 6.6 times higher than those in vertical position. The comparison between the test conditions of the IEC standard for complete package units of PV modules and the real transportation measurements that we have performed on individual PV modules shows that sometimes real working conditions are harder than estimated.
To this respect, Köntges et al. [42] have measured severity mean values of 0.13 g for vertical placed PV modules and 0.36 g for horizontal placed ones in transportation tests in real conditions over several kinds of German roads. On the other hand, in simulated transportation tests based on the IEC 62759-1 standard, they found that ASTM D4169-2009 Truck Assurance Level II defines a well fitted PSD function (the same PSD as in IEC standard) to simulate the vibrations of PV modules in road transportation. They also suggest that a vibration severity gRMS = 0.4 g would be a more suitable value for simulation purposes than those defined in the IEC standard, because their tests with gRMS = 0.3 g resulted in very few PV modules having cell cracks but in those with gRMS = 0.5 g, they found unrealistic high levels of cell cracks for all tested PV module types.

3.3. Analysis of Natural Frequencies of PV Modules

As commented in Section 2.3, it is possible to obtain the mentioned characteristic frequencies of the PV module by analyzing the response of the glass vibration to a sudden excitation (e.g., an impact). As an example, Figure 6 corresponds to glass vibrations of the LP1 modules as a response to a high impact, as recorded during transportation. Table 4 shows the frequencies of the first and second harmonics of these LP1 modules (M3 and M4) measured in this way by using Equation (4).
For comparison purposes, Assmus et al. [43] have tested several PV modules (with similar sizes and glass thickness as those used in our tests) horizontally placed and forced to vibrate by an acoustic induction system. Table 4 also includes the characteristics and natural oscillation frequencies of these modules tested by Assmus. It is noticeable that the frequencies for M3 and Assmus’ 4 modules (referred to as A4 in Table 4) are similar despite that the glass thickness in these modules are different (3.2 mm and 4 mm). The same occurs with M4 and Assmus’ 1 module (named A1 in Table 4). Then, it seems that not only thickness, but also the size or the ratio between module sides, have something to do in terms of determining these natural frequencies.
The frequency of the first harmonic of M4, f1 = 17.5 Hz, is inside of the range of natural oscillation frequencies of truck tires (15 to 20 Hz). In this way, the vibrations of the tires would produce high amplitude oscillations of the glass of the M4 module due to resonance. The first and second harmonic of the M3 module are outside of the natural oscillation frequency ranges of the truck so no resonance phenomena should occur. Notice that both modules were vertically placed and, therefore, the transmission of energy through vibration from the tires to the module plane could be more difficult than being in a horizontal position. Li-Wei et al. [44] have monitored real PV module transportations, finding that low frequency vibrations in vertically placed PV modules have lower amplitudes than those horizontally placed and the generation of microcracks is also reduced.

3.4. Proposal to Reduce the Vibration Levels in PV Module Transportation

In order to eliminate, or at least reduce the vibrations on the PV modules, several strategies can be adopted. A first option could be to reduce the vibration transmission between truck structure and PV modules through the packaging. It could be more interesting to decouple PV modules natural oscillation frequencies and truck ones (frequency separation). Depending on the solution adopted, different elements have to be modified or added. All of these strategies are summarized below in three practical proposals:
(a)
Enhanced packages with high vibration attenuation capacity for low frequencies (below 100 Hz). The new packages should be able to significantly attenuate the main frequency ranges originated by trucks along the road transportation: 3–6 Hz, 15–20 Hz and 40–55 Hz.
(b)
PV module structure and/or materials modification. In order to shift the natural oscillation frequencies of the PV modules outside the excitatory frequency ranges of the truck, the stiffness of PV modules could be modified. A higher stiffness would increase the natural oscillation frequencies of the PV modules. As an example, our 4 mm thick M4 module glass should be modified to have a first natural oscillation frequency above 20 Hz (and below 40 Hz). Probably, more than increasing the glass thickness, the modification of the properties of the back sheet (polyolefin, polyphenylene, etc.) would be easier: by increasing its thickness or by increasing its tensile strength (maximum values for these parameters are currently around 700 μm and 350 MPa, respectively [45]). The relationship between thickness and the ratio of lateral lengths of the module glass could also be analyzed.
(c)
New inner protective elements to block the glass of the PV modules during their transportation. The lock of the glass could be partial or complete (that is, the glass would be unable to vibrate). This solution could be implemented by putting a thick layer of soft material (expanded polystyrene, polyethylene foam, etc.) covering the rear side of PV modules completely when packed (Figure 7a). On the other side, partial block, as well as method b), would shift the natural oscillation frequencies of the PV modules to higher frequencies. A convenient solution for partial lock up could be to put a soft crosstree fit to the rear side of the PV module (Figure 7b). In this way, the PV module will have four independent areas subjected to vibrations with halved dimensions respective of the PV module. The natural oscillation frequency of every area will be the double than that for the PV module. It is not mandatory for the crosstree to be symmetric. Care should be taken to avoid the shift of the natural oscillation frequency from a resonance range to the upper one.

4. Conclusions

Two logistics processes by road of different photovoltaic modules have been monitored to assess the harshness of the mechanical vibrations they are subjected to, including loading and unloading operations. Modules of different models and c-Si technologies, transported through different paths and packaged in different positions were tested.
According to our results, PV modules transported in vertical position supported 25% of the vibration severity defined in IEC 62759-1 and the hardness of the vertical transportation was 42%, figures that could be considered as reasonable or within tolerable bounds. However, horizontally transported PV module supported 169% of the vibration severity defined in that standard and the hardness of this transportation was nine times higher and, in relative terms, vibration severity was around seven times lower for vertically transported PV modules than for horizontally ones. This suggests that a first way to reduce impact of transportation stress would be to use the vertical arrangement inside the package, instead of horizontal position, for all the PV modules.
The effect of the load and unload operations can increase the mechanical stress in PV modules even more. Higher accelerations were detected during unloading from the truck for PV modules in horizontal position (both in transversal and lateral directions) but it was not clear this was a consequence of their horizontal position or of an aggressive or careless handling of the package.
Natural oscillation frequencies of photovoltaic modules with 3.2 mm and 4 mm-thick glass have been determined from recorded accelerations. Resonance phenomena affecting the 4 mm glass photovoltaic module has been detected. The natural oscillation frequencies of this PV module and those for the truck tires are close to each other, so considerable vibrations (larger than expected) in the PV module were generated during transport.
In addition to the suggested change in position from horizontal to vertical, three methods to reduce the vibration in PV modules transported by road have been proposed: (a) enhanced packages focused on the attenuation of vibrations originated by the trucks; (b) PV module materials modification looking to modify their stiffness and therefore their natural oscillation frequencies; and (c) lock up the back side of the PV modules using a properly sized soft material crosstree. By using some of these methods, the mechanical stress and their possible effects on the reliability and power degradation of the photovoltaic modules will be reduced.
Mechanical stress detected along the logistic processes in this work, as well as the solutions suggested, can be of greater importance regarding the new designs of PV modules with output powers up to 700 W that are currently being manufactured, with increased areas and dimensions. The impact that this transportation stress could have in the generation and propagation of microcracks on PV cells would require further research and attention by the manufacturers in order to guarantee long-life and endurance in these larger modules. Determination of natural vibration frequencies for particular module designs and the possible re-sizing of lateral dimensions for avoiding resonance phenomena could be worth researching at factory level for preventing these issues. Another case of study for further analysis would be the possible convenience of using half-cut cells instead of full sized wafers to reduce impact of the mechanical stress.

Author Contributions

Conceptualization, M.C.A.-G., J.C. and J.L.B.; methodology, M.C.A.-G. and J.C.; validation, M.C.A.-G. and J.C.; formal analysis, J.C. and J.L.B.; investigation, J.C. and M.C.A.-G.; data curation, J.C.; writing—original draft preparation, J.C., M.C.A.-G. and J.L.B.; writing—review and editing, J.C., M.C.A.-G. and J.L.B.; supervision, M.C.A.-G.; project administration, M.C.A.-G.; funding acquisition, M.C.A.-G. All authors have read and agreed to the published version of the manuscript.

Funding

This research was partially funded by Spanish Ministry of Economy and Competitiveness (MINECO) under the Plan Nacional de I+D+i, Project CONFIANZA-FV (Ref.: ENE2012-38632-C02-01).

Institutional Review Board Statement

Not applicable.

Data Availability Statement

Data are contained within the article.

Acknowledgments

Authors wish to thank Faustino Chenlo his support in the realization of the experiments, Irene Olivares her support with the accelerometers measurements and to Francisco Ibañez of CIEMAT his contributions on CAD drawings.

Conflicts of Interest

The authors declare no conflict of interest.

References

  1. SolarPower Europe. Global Market Outlook for Solar Power 2022–2026; SolarPower Europe: Brussels, Belgium, 2022. [Google Scholar]
  2. IRENA. Future of Solar Photovoltaic: Deployment, Investment, Technology, Grid Integration and Socio-Economic Aspects (A Global Energy Transformation: Paper); International Renewable Energy Agency: Abu Dhabi, United Arab Emirates, 2019. [Google Scholar]
  3. Red Eléctrica de España. Avance del Informe del Sistema Eléctrico Español. 2021. Available online: https://www.ree.es/es/sala-de-prensa/actualidad/nota-de-prensa/2022/03/potencia-instalada-solar-fotovoltaica-en-espana-aumenta-casi-un-30-por-ciento-en-2021 (accessed on 31 October 2023).
  4. Disposición 5106 del BOE núm 77 de 2021. Resolución de 25 de Marzo de 2021, Conjunta de la Dirección General de Política Energética y Minas y de la Oficina Española de Cambio Climático, por la que se Publica el Acuerdo del Consejo de Ministros de 16 de Marzo de 2021, por el que se Adopta la Versión Final del Plan Nacional Integrado de Energía y Clima 2021–2030. Available online: https://www.boe.es/boe/dias/2021/03/31/pdfs/BOE-A-2021-5106.pdf (accessed on 27 November 2023).
  5. A Review of the Spanish NECP Was Recently Subjected to Consultation, with a New Target for PV Capacity in 2030 of 76.387 GW. Available online: https://energia.gob.es/es-es/Participacion/Paginas/DetalleParticipacionPublica.aspx?k=607 (accessed on 27 November 2023).
  6. Trends in Photovoltaic Applications 2021. Report IEA-PVPS T1-41:2021. Available online: https://iea-pvps.org/trends_reports/trends-in-pv-applications-2021/ (accessed on 27 November 2023).
  7. Review of Failures of Photovoltaic Modules. Report IEA-PVPS T13-01:2014. Available online: https://iea-pvps.org/wp-content/uploads/2020/01/IEA-PVPS_T13-01_2014_Review_of_Failures_of_Photovoltaic_Modules_Final.pdf (accessed on 27 November 2023).
  8. Munoz, M.A.; Alonso-García, M.C.; Vela, N.; Chenlo, F. Early degradation of silicon pv modules and guaranty conditions. Sol. Energy 2011, 85, 2264–2274. [Google Scholar] [CrossRef]
  9. Parikh, H.R.; Buratti, Y.; Spataru, S.; Villebro, F.; Reis Benatto, G.A.D.; Poulsen, P.B.; Wendlandt, S.; Kerekes, T.; Sera, D.; Hameiri, Z. Solar Cell Cracks and Finger Failure Detection Using Statistical Parameters of Electroluminescence Images and Machine Learning. Appl. Sci. 2020, 10, 8834. [Google Scholar] [CrossRef]
  10. Goudelis, G.; Lazaridis, P.I.; Dhimish, M. A Review of Models for Photovoltaic Crack and Hotspot Prediction. Energies 2022, 15, 4303. [Google Scholar] [CrossRef]
  11. Amina, E.; Pierre-Olivier, L.; Mourad, B.; Durastanti, J.; Idir, B. Cracks in silicon photovoltaic modules: A review. J. Optoelectron. Adv. Mater. 2019, 21, 74–92. [Google Scholar]
  12. Kontges, M.; Kunze, I.; Kajari-Schroder, S.; Breitenmoser, X.; Bjørneklett, B. The risk of power loss in crystalline silicon based photovoltaic modules due to micro-cracks. Sol. Energy Mater. Sol. Cells 2011, 95, 1131–1137. [Google Scholar] [CrossRef]
  13. Dhimish, M.; Holmes, V.; Mehrdadi, B.; Dales, M. The impact of cracks on photovoltaic power performance. J. Sci. Adv. Mater. Devices 2017, 2, 199–209. [Google Scholar] [CrossRef]
  14. Bdour, M.; Dalala, Z.; Al-Addous, M.; Radaideh, A.; Al-Sadi, A. A Comprehensive Evaluation on Types of Microcracks and Possible Effects on Power Degradation in Photovoltaic Solar Panels. Sustainability 2020, 12, 6416. [Google Scholar] [CrossRef]
  15. Dhimish, M.; Hu, Y. Rapid testing on the effect of cracks on solar cells output power performance and thermal operation. Sci. Rep. 2022, 12, 12168. [Google Scholar] [CrossRef]
  16. Gallardo-Saavedra, S.; Hernández-Callejo, L.; Alonso-García, M.C.; Santos, J.D.; Morales-Aragonés, J.I.; Alonso-Gómez, V.; Moretón-Fernández, A.; González-Rebollo, M.A.; Martínez-Sacristán, O. Nondestructive characterization of solar PV cells defects by means of electroluminescence, infrared thermography, I–V curves and visual tests: Experimental study and comparison. Energy 2020, 205, 117930. [Google Scholar] [CrossRef]
  17. Köntges, M.; Oreski, G.; Jahn, U.; Herz, M.; Hacke, P.; Weiss, K.-A. Assessment of Photovoltaic Module Failures in the Field; IEA PVPS Task 13, Subtask 3, Report IEA-PVPS T13-09:2017. Available online: https://iea-pvps.org/wp-content/uploads/2017/09/170515_IEA-PVPS-report_T13-09-2017_Internetversion_2.pdf (accessed on 27 November 2023).
  18. Jahn, U.; Herz, M.; Köntges, M.; Parlevliet, D.; Paggi, M.; Tsanakas, I.; Stein, J.S.; Berger, K.A.; Ranta, S.; French, R.H.; et al. Review on Infrared and Electroluminescence Imaging for PV Field Applications. IEA PVPS Task 13, Subtask 3.3 Report IEA-PVPS T13-10:2018, March 2018. Available online: https://iea-pvps.org/key-topics/review-on-ir-and-el-imaging-for-pv-field-applications/ (accessed on 27 November 2023).
  19. Kölblin, P.; Bartler, A.; Füller, M. Image Preprocessing for Outdoor Luminescence Inspection of Large Photovoltaic Parks. Energies 2021, 14, 2508. [Google Scholar] [CrossRef]
  20. Herrmann, W.; Jahn, U. Qualification of Photovoltaic (PV) Power Plants Using Mobile Test Equipment; Report IEA-PVPS T13-24:2021; April 2021. Available online: https://iea-pvps.org/wp-content/uploads/2021/04/IEA-PVPS-T13-24_2021_Qualification-of-PV-Power-Plants_report.pdf (accessed on 27 November 2023).
  21. Reil, F.; Althaus, J.; Vaaßen, W.; Herrmann, W.; Strohkendl, K. The effect of transportation impacts and dynamic load tests on the mechanical and electrical behavior of crystalline PV modules. In Proceedings of the 25th European Photovoltaic Solar Energy Conference and Exhibition, Valencia, Spain, 6–10 September 2010; pp. 3989–3992. [Google Scholar]
  22. Olschok, C.; Schmid, M.; Haas, R.; Becker, G. Innapropiate exposure to PV modules: Description and effects of handling defaults. In Proceedings of the 28th European Photovoltaic Solar Energy Conference and Exhibition, Paris, France, 30 September–4 October 2013; pp. 3138–3141. [Google Scholar]
  23. Dhimish, M.; Ahmad, A.; Tyrrell, A.M. Inequalities in photovoltaics modules reliability: From packaging to PV installation site. Renew. Energy 2022, 192, 805–814. [Google Scholar] [CrossRef]
  24. Gul, R.M.; Kamran, M.A.; Zafar, F.U.; Noman, M. The impact of static wind load on the mechanical integrity of different commercially available mono-crystalline photovoltaic modules. Eng. Rep. 2020, 2, e12276. [Google Scholar] [CrossRef]
  25. Alghamdi, A.; Bahaj, A.S.; Blunden, L.S.; Wu, Y. Dust Removal from Solar PV Modules by Automated Cleaning Systems. Energies 2019, 12, 2923. [Google Scholar] [CrossRef]
  26. Kulińska, E.; Dendera-Gruszka, M. New Perspectives for Logistics Processes in the Energy Sector. Energies 2022, 15, 5708. [Google Scholar] [CrossRef]
  27. Chen, C.-W.; Lin, I.; Liao, J.-Y.; Li, U.-T.; Wu, H.-S.; Wu, T.-C.; Lee, K.-T. Power degradation of crystalline silicon PV module in transporting environment. In Proceedings of the 26th European Photovoltaic Solar Energy Conference and Exhibition, Hamburg, Germany, 5–9 September 2011; pp. 3550–3552. [Google Scholar]
  28. Desai, U.; Vasudevan, D.P.; Kottantharayil, A.; Singh, A. Prediction of vibration induced damage in photovoltaic modules during transportation: Finite element model and field study. Eng. Res. Express 2021, 3, 045045. [Google Scholar] [CrossRef]
  29. Garcia-Romeu-Martínez, M.A.; Singh, S.P.; Cloquell-Ballester, V.A. Measurement an Analysis of vibration levels for truck transport in Spain as a function of payload, suspension and speed. Packag. Technol. Sci. 2008, 21, 439–451. [Google Scholar] [CrossRef]
  30. Lalanne, C. Mechanical Vibration and Shock Analysis; ISTE Ltd.: London, UK, 2009; ISBN 978-1-84821-121-6. [Google Scholar]
  31. Joneson, E. D4169 Revision—Random Vibration Update. ASTM Committee D10 on Packaging. Available online: https://www.astm.org/COMMIT/presentation-files/JonesonPresentationD4169Revision.pdf (accessed on 22 June 2016).
  32. IEC 62759-1: 2015; Photovoltaic (PV) Modules—Transportation Testing—Part 1: Transportation and Shipping of Module Package Units. International Electrotechnical Commission: Geneva, Switzerland, 2015.
  33. IEC 61215-1:2016; Terrestrial Photovoltaic (PV) Modules—Design Qualification and Type Approval—Part 1: Test Requirements. International Electrotechnical Commission: Geneva, Switzerland, 2016.
  34. IEC 61646:2008; Thin-Film Terrestrial Photovoltaic (PV) Modules—Design Qualification and Type Approval. International Electrotechnical Commission: Geneva, Switzerland, 2008.
  35. ISTA 3E 2009; Unitized Loads of Same Product. International Safe Transit Association: East Lansing, MI, USA, 2009. Available online: https://ista.org/ (accessed on 27 November 2023).
  36. ASTM D4169-08; Standard Practice for Performance Testing of Shipping Containers and Systems. ASTM International: West Conshohocken, PA, USA, 2010. [CrossRef]
  37. ASTM D4169-16; Standard Practice for Performance Testing of Shipping Containers and Systems. ASTM International: West Conshohocken, PA, USA, 2022. [CrossRef]
  38. Singh, S.P. Measurement and Analysis of Truck and Rail Shipping Environment in India. Packag. Technol. Sci. 2007, 20, 381–392. [Google Scholar] [CrossRef]
  39. Alonso, M.; Finn, E.J. Fundamental University Physics, Mechanics, Ed.; Addison-Wesley: Reading, MA, USA, 1967; Volume I, ISBN 0-201-00227-2. [Google Scholar]
  40. Otari, S.; Odof, S. Statistical characterization of acceleration levels of random vibrations during transport. Packag. Technol. Sci. 2011, 24, 177–188. [Google Scholar] [CrossRef]
  41. Rouillard, V. Statistical models for nonstationary and non-Gaussian road vehicle vibrations. Eng. Lett. 2009, 17, 4. [Google Scholar]
  42. Köntges, M.; Siebert, M.; Morlier, A.; Illing, R.; Bessing, N.; Wegert, F. Impact of Transportation on Silicon Wafer-Based PV Modules. Prog. Photovolt. 2016, 24, 1085–1095. [Google Scholar] [CrossRef]
  43. Assmus, M.; Jack, S.; Weiss, K.; Koehl, M. Measurement and simulation of vibrations of PV-modules induced by dynamic mechanical loads. Prog. Photovolt. 2011, 19, 688–694. [Google Scholar] [CrossRef]
  44. Li, W.; Le, H. Three-Dimensional Vibration Simulation and Statistical Distribution of Cracks on PV-Module Shipping Units in Transportation Environment. In Proceedings of the 29th European Photovoltaic Solar Energy Conference and Exhibition, Amsterdam, The Netherlands, 22–26 September 2014. [Google Scholar]
  45. ENF Directory of Solar Companies and Products. ENF Ltd. Available online: http://www.enfsolar.com (accessed on 27 November 2023).
Figure 1. PV modules and accelerometers axes orientation for logistic processes LP1 and LP2.
Energies 17 00145 g001
Figure 2. ‘Truck medium level’ PSD test profiles from ASTM D4169:2014 (IEC 62759-1:2015) and D4169:2016 (IEC 62759-1:2022) standards.
Energies 17 00145 g002
Figure 3. Lateral acceleration (normal to module plane) of the PV modules vertically packaged registered along LP1. (a) Module M4, (b) Module M3.
Energies 17 00145 g003
Figure 4. Vibrations on PV module horizontally placed at LP2. (a) Three axis complete tour; (b) vertical axis along 8 h highway trip (31 December); (c) vertical axis along urban trip and when unloading (16 January); (d) lateral axis when unloading (16 January).
Energies 17 00145 g004
Figure 5. Histograms and approximate probability density functions of the recorded acceleration values on the 3 axes for M4 (left) and M3 (right) PV modules of LP1.
Energies 17 00145 g005
Figure 6. Lateral accelerations (PV glasses bending) due to high impacts detected in. (a) M4 module, (b) M3 module.
Energies 17 00145 g006
Figure 7. New inner protective elements proposed, (a) full covering back cover, (b) crosstree.
Energies 17 00145 g007
Table 1. Main characteristics of the PV modules in the two logistic processes and those selected to record the vibrations. PO = Poly-Olefin; PPE = Poly-Phenylene Ether; EVA = Ethylene Vinyl Acetate; N.P = Not Provided.
Logistic ProcessBoxCell TypeModule Size
(mm)
Glass Thickness
(mm)
Back SheetEncapsulantNr. of ModulesTotal ModulesBox Weight
(kg)
Module with Accelerometer
LP11Mono-Si1650 × 10004.0PPEPO311270M3
Multi-Si8
2Multi-Si1650 × 10004.0PPEEVA1125580M4
Mono-Si3
Multi-Si3.2PPE3
4.0PP8
LP20Multi-Si1660 × 9903.2N.P.N.P.44139M2
Table 2. Maximum acceleration values for both logistic processes, LP1 and LP2.
Logistic ProcessPV ModuleVertical Axis (g)Longitudinal Axis (g)Lateral Axis (g)
LP1M3+2.12−4.18+2.37
M4+3.48+2.39−3.29
LP2M2−15.9+6.62−16.5
Table 3. Comparison of vibration severity (normal to PV modules planes) and transportation hardness between IEC 62759-1 standard and the logistic processes LP1 and LP2. The IEC values (test duration of 3 h with a severity gRMS ≥ 0.49 g according to D4169:2014 PSD ‘truck medium’ profile) are taken as reference.
ProcessVibration
Severity gRMS (g)
Duration Time (h)Transportation Hardness gRMS × t (gh)Comparison to IEC 627591-1 (%)
IEC62759-10.4931.47100
LP1M30.1150.5537
M40.1450.7048
LP2M20.831613.3903
Table 4. Natural oscillation frequencies of several PV modules: M3 and M4 are modules tested in this work; A1 and A4 are modules tested by Assmus et al. [42].
ProcessM3M4A1A2
Size (mm)1650 × 10001650 × 10001620 × 8101620 × 810
Thickness (mm)3.243.24
f1 (Hz)25.717.51525
f2 (Hz)55.338.13459
f2/f12.152.182.42.4
Disclaimer/Publisher’s Note: The statements, opinions and data contained in all publications are solely those of the individual author(s) and contributor(s) and not of MDPI and/or the editor(s). MDPI and/or the editor(s) disclaim responsibility for any injury to people or property resulting from any ideas, methods, instructions or products referred to in the content.

