Article

Investigating the Effect of Albedo in Simulation-Based Floating Photovoltaic System: 1 MW Bifacial Floating Photovoltaic System Design

Software Engineering Department, The Faculty of Engineering, Aksaray University, Aksaray 68300, Turkey
*
Author to whom correspondence should be addressed.
Energies 2024, 17(4), 959; https://doi.org/10.3390/en17040959
Submission received: 9 September 2023 / Revised: 30 September 2023 / Accepted: 25 October 2023 / Published: 19 February 2024
(This article belongs to the Special Issue Advances in Photovoltaic Solar Energy)

Abstract

:
Photovoltaic (PV) modules have emerged as a promising technology in the realm of sustainable energy solutions, specifically in the harnessing of solar energy. Photovoltaic modules, which use solar energy to generate electricity, are often used on terrestrial platforms. In recent years, there has been an increasing inclination towards the installation of photovoltaic (PV) modules over water surfaces, including lakes, reservoirs, and even oceans. The novel methodology introduces distinct benefits and complexities, specifically pertaining to the thermal characteristics of the modules. In order to accomplish this objective, a photovoltaic (PV) module system with a capacity of 1 MW was developed as a scenario in the PVsyst Program. The scenario simulation was conducted on the Mamasın Dam, situated in the Gökçe village within the Aksaray province. To conduct the efficiency analysis, a comparative evaluation was conducted between bifacial and monofacial modules, which were installed from above the water at 1 m. The comparison was made considering two different types of modules. Additionally, the albedo effect, water saving amount, and CO2 emissions of the system were also investigated. Albedo measurements were made in summer when the PV power plant will operate most efficiently. As a result of the simulations, it was found that bifacial modules produce 12.4% more energy annually than monofacial modules due to the albedo effect. It is estimated that PV power plant installation will save 19,562.695 and 17,253.475 tons of CO2 emissions in bifacial and monofacial systems, respectively.

1. Introduction

The COVID-19 epidemic, extreme weather conditions, and regional conflicts of recent years have all demonstrated how crucial it is for nations to utilize their energy resources efficiently. Reducing greenhouse gas emissions and utilizing more renewable, low-carbon energy sources are essential for mitigating climate change. Renewable energy sources, which are widely accessible and primarily produced from sunlight, are continuously produced by nature and do not release any greenhouse gases or air pollution. Developments in the field of renewable energy have accelerated in order to meet the rapidly increasing energy demand brought about by the increase in the global population, to contribute to sustainable development, and to achieve the carbon-neutral economy targets of countries [1,2,3]. One of the most important renewable energy sources, solar photovoltaic (PV) energy, is used extensively to produce electricity all over the world. The expansion of installed photovoltaic (PV) capacity is anticipated to persist in the forthcoming decades. According to the latest IEA PVPS document, in the future five-year period it is anticipated that the cumulative installed photovoltaic (PV) power on a global scale will witness a significant rise, and the cumulative capacity of solar photovoltaic will reach almost 1500 GW over the period. This growth is anticipated to surpass that of natural gas by the year 2026 and coal by the year 2027 [4]. However, despite the advancements in the efficiency of photovoltaic (PV) cells, the electrical power generated per unit area remains lower compared to that of a thermal power plant [5,6]. The issue of land requirements poses a significant challenge for the installation of photovoltaic (PV) plants, particularly in countries with limited land capacity [7]. Many countries suffer from insufficient land, particularly islands, such as Japan, Singapore, Korea, the Philippines, and various others, which set up PV modules. When considering solar modules with varying power and efficiency, it is necessary to allocate a land area ranging from 10,000 m2 to 20,000 m2 for the establishment of a 1 MWp power plant [8,9]. The spatial demand becomes substantial when solar modules are inclined to prevent shading, as opposed to being installed in a horizontal orientation. For this reason, the substantial land requirement poses a significant constraint for the land-based photovoltaic (LPV) system [9]. The utilization of a water body has emerged as a viable alternative to the installation of a photovoltaic (PV) system. These systems are called floating PV (FPV) or water-based PV (WPV) systems. And these alternatives are PV modules that are installed above bodies of water. Floating platforms, which are securely fastened to the bed of a water body, such as a lake, pond, reservoir, or sea, serve as the foundation for their installation. The presence of water serves as a natural cooling mechanism for the photovoltaic (PV) modules, thereby enhancing their overall efficiency. Additionally, the utilization of floating platforms offers a stable and adaptable infrastructure for the PV system. floating photovoltaic (FPV) modules, installed on water surfaces, can reduce land use and offer higher operating efficiencies than ground-based (GPV) modules. However, they require approximately 10% higher capital costs compared to land-based systems, with bifacial modules and a tracker system potentially increasing costs by up to 3% [10]. The inaugural solar FPV facility, boasting a capacity of 20 kW, was constructed by the National Institute of Advanced Industrial Science and Technology (AIST) in Japan. This installation took place in Aichi, Japan, in 2007, and it was primarily intended for research studies [10]. Based on a report published by the World Bank, the total installed capacity of FPV plants worldwide reached 1.1 GW by the conclusion of September 2018. According to the IRENA 2021 report, as of 2021, the global installed capacity of FPV systems has amounted to approximately 3.8 GW [11]. Moreover, according to recent projections, it is anticipated that the floating photovoltaic (FPV) capacity will reach 13 GW by the year 2025, thereby potentially contributing up to 2% of the total global electricity production by the year 2030 [12,13]. In addition, FPV systems have gained significant traction in various countries, including the United States, Australia, Brazil, India, and several others. There is a high probability that this demand will experience growth and become pervasive on a global scale [14]. Due to its present expansion, numerous researchers have commenced investigations and produced compelling reviews and research articles. When looking at Science Direct—an article searching platform—there has been a linear increment in the number of studies that include water-based or FPV system terms in the last ten years, and this is shown in Figure 1. The chosen keywords were floating PV and water-based PV. Although there are many studies in the literature, some of the notable studies are listed below.
Hamza N. et al. investigated the thermal and electrical performance of FPV systems compared to land-based systems in a study. The floating structure employed for the installation of PV panels was specifically designed to allow for adjustable tilt angles from 0°, 15°, and 30°. The results show that FPV systems reduce water evaporation by 17% when partially covered and 28% when fully covered. Water bodies provide adequate cooling, and FPV modules have lower front and back temperatures compared to land-based PV modules. The study also found that FPV systems produce the most energy when installed at the optimal tilt angle of 30°, suggesting that modules should be adjusted accordingly [15].
Aboubakr El H. et al. presented a study paper that reviews the advancements in solar power generation, focusing on PV power optimization using solar tracking and FPV systems. Their study provides a comprehensive review of these technologies and their concepts, benefits, and drawbacks, as well as a summary of the literature on these topics [16].
Another study realized by Maarten D. et al. compared FPV systems in the Netherlands and Singapore in two different climate zones. The FPV systems have the highest performance demonstrated at lower temperatures of 3.2 °C in the Netherlands and 14.5 °C in Singapore, in comparison to their respective benchmarks. Also, annual specific yields show a gain in the energy yield from the cooling effect of up to 3% in the Netherlands and 6% in Singapore [17].
In India, Shyam, B. and Kanakasabapathy, P. explored the integration of small-scale FPV with Pumped Storage Hydroelectric (PSH) systems in India, using a subsidized Time-of-Day tariff. The study focused on finding new reservoirs and water bodies for electrical energy storage and renewable energy integration. The results of the study indicate that floating solar photovoltaic (PV) systems generated an additional 2.2% of energy when compared to their terrestrial counterparts [18].
Sampurna P. conducted a comprehensive overview study about FPV systems for producing electricity, comparing their features and components. It is shown that floating solar modules produce 11% more energy than ground-based ones. Also, the researcher claims that the floating photovoltaic technology (FPVT) is predicted to contribute to a 7.38% increase in solar technology, equivalent to 485.4 GW of additional installed electricity [19].
Another study by Aboubakr El H. et al. presented an experimental investigation of a (~22 watt) small-scale floating photovoltaic system (FPVS) under Moroccan operating conditions. The goal of the study is to compare the electrical and thermal performances of FPVs with an overland PV system (OPVS). The test results show that FPVS modules have lower average temperatures and higher efficiency, generating up to 2.33% more daily energy than land-based PV (LPV) systems. The study also compares energy production under different tilt angles, confirming that FPVS produces the highest energy when installed at the optimal tilt angle [20].
In addition, another study realized by Samer S. et al. assessed the impact of FPV systems on system adequacy in the Amazon basin. It evaluated the current dam production and FPV system capacities, considering environmental and social concerns. Results show that FPV systems improve system reliability, minimize load curtailment, and offer more flexibility for hydropower plant dispatch during peak demands [21].
In another study, Pietro Elia C. et al. demonstrated that FPV systems significantly reduce evaporation losses and are an important solution in reducing environmental impacts in shrimp farming. Despite higher investment costs, motion tracking systems have been found to demonstrate comparable competitiveness in reliability of up to 45% [22].
Bayu et al. tried different designs in FPVs and made an efficiency analysis with a focus on developing FPV systems using a thermosiphon passive cooling method. This experimental analysis shows that this method increases the electrical power output by 4.52% compared to ground installations and 7.86% compared to floating modules. Numerical investigation reveals that the thermosiphon cooling system effectively dissipates heat from PVs to the environment, increasing the electrical energy of FPV units without external energy requirements [23].
Similarly, in a study published in 2020, it was discovered that a 5% increase in energy output driven by cooling mechanisms could potentially render floating photovoltaic (FPV) systems cost-competitive with LPV systems in Brazil [24].
In addition, the study conducted by Tina M.G. et al. evaluated the economic competitiveness of ground-based photovoltaic (GPV) and FPV systems in terms of energy performance and total costs. It considers revenues from reduced evaporations and the potential for active cooling systems. A sensitivity analysis of LCOE was conducted on a Southern Italian water basin, showing that reducing FPV capital costs (CAPEX) by 30% can result in a 20% reduction in power generation costs (LCOE) compared to the reference GPV system [25].
In the Egyptian North Lakes, another study shows that a partially floating modular PV system supplies green electricity to rural areas around there. The system is integrated with a hybrid compressed air energy storage system and uses a smart energy management strategy for continuous operation [26].
In the study conducted by Tamara Bajc et al., they explored the implementation of FPVSs on the six largest Serbian lakes, analyzing their impact on energy output. In their study, it was found that FPVSs can produce up to 8959 kWh/year of energy and save 164 × 106 m3/year of water from evaporation. Additionally, they showed that with FPVSs carbon dioxide emissions can be reduced by up to 6.34 tons per year, with the potential for carbon credits of up to EUR 9741 over 20 years [27].
Another study uses 40 years of wind speed and wave height data to identify potential solar photovoltaic (PV) sites in calm tropical sea regions. It was observed that the most suitable locations were the Indonesian archipelago and the Gulf of Guinea locations (30.000 km2), which can produce approximately one million terawatt hours of energy per year. This highlights the potential of offshore FPV systems in the global energy transition [28].
A study by Sylvain Delacroix described the experimental study of a 1:1 scale float system in A Centrale Nantes’ ocean wave tank, revealing a first-order pitch resonant mode and a shadowing effect for small wavelengths, despite the narrow wave spectrum achievable [29].
The study by Imamul Islam et al. sets out the Malaysian government’s 2025 energy and carbon emission target. They mentioned that, to achieve this, the government has developed a 10 MW FPV system at UMP Lake. Also, they claim that the system, which used PVsyst 7.3 software, is expected to produce 17,960 MWh of energy annually, reducing carbon emissions by 11,135.2 tons annually. In addition, the capital costs will be expected to be recovered within 9.5 years [30].
In a study realized by Pianco F. et al., a hybrid design combining a hydropower plant (HPP) in Brazil, Santa Branca, and a simulated floating photovoltaic plant (FPV) was presented. It is seen that the FPV injected full power into the system during the day and supported the HPP’s generation profile. This resulted in a 50% increase in production, as the reservoir’s water storage capacity allowed for a 50% increase in the grid connection capacity factor. In the study, it was mentioned that further research is needed for large systems connected to the grid [31].
In a study conducted in terms of capital, Micheli L. estimated the possible maximum capital expenditures for floating photovoltaics (FPVs) in Spain to compete with optimally tilted in-land photovoltaic (LPV) systems. The analysis shows that FPV systems may not outperform LPVs in terms of energy yield but can compete with LPVs in terms of the lifetime cost of electricity and profits if lower operating temperatures are provided. Also, it is highlighted the maximum allowed capital expenditure can vary depending on location [32].
With the increasing demand for renewable energy sources, there is a growing emergence of innovative solutions aimed at harnessing solar power in novel and unforeseen manners. An example of an innovative technology is the FPV module system, which presents a groundbreaking method of harnessing solar energy by integrating photovoltaic technology with bodies of water. This innovative system enables the placement of solar modules on the surface of lakes, reservoirs, and other bodies of water, thereby offering numerous advantages and addressing several obstacles commonly encountered with traditional ground-mounted solar installations. This article aims to provide an in-depth analysis of FPV module systems, examining their design, benefits, and various applications. In addition, the objective of this article is to delve into the complexities of this phenomenon. Also, this study aims to offer valuable insights into the existing research gaps within this field. Additionally, it seeks to enhance and intensify the analysis of FPV systems by elucidating the advantages, potentials, and limitations associated with this technology. To achieve this, a 1 MW FPV module system was designed using the PVsyst Program on the Mamasın Dam, located within the borders of Gökçe village in Aksaray province. In order to perform the efficiency analysis, a comparison of the bifacial module and monofacial module installed at a height of 1 m from two different types of modules was made and their energy production was examined. Since it is a current issue, the albedo effect of the sun on the modules, which has not been studied much in the literature before, has been examined with the help of the program. In addition to the performance efficiency for two different module types, the water-saving amount and CO2 emissions of the system were compared.

2. Research Methodology

Engineers, architects, and technical designers utilize PVsyst, a potent modeling program, all over the world to simulate the design of solar projects that are both off-grid and grid-connected. If necessary and real parameters are entered, it gives realistic data about the energy production, losses, and performance ratio (PR) of the PV power plant. PVsyst has a database of meteorological data files from many parts of the world. Using the database, the PVsyst software is extremely useful in modeling solar power plants and evaluating efficiency. In this study, PVsyst software shall be used in the modeling and analysis of 1081 kWp bifacial and 1001 kWp monofacial PV power plants built on the Mamasın Dam Pond in Aksaray, Turkey, in order to examine the albedo effect in FPV power plants. The aim of the study is to examine the albedo effect of the FPV power plant using bifacial modules and to reduce evaporation and increase water savings due to the shadowing created by the modules. In this paper, we present the results of two systems, identified as FPV1 and FPV2. FPV1 can be described as a system using monofacial modules and FPV2 as a system using bifacial modules. These systems are compared with each other.
In order to examine the albedo effect of the dam pond in the FPV power plant in Turkey, analyses were carried out using bifacial and monofacial modules. The hybrid mathematical Perez model for radiance reflection and computation of the diffuse light, as well as the 2D view factor model for the radiance distribution, is used to determine the radiation that will reach the front and back sides of the bifacial PV module. Applying a one-diode model and the simulated radiance data for the front and back sides of the module, the performance of the bifacial PV module is determined. Due to the lack of data on the albedo of the dam pond water surface in Turkey, measurements were carried out in 2023 at the Aksaray site.
Albedo is defined as the ratio of the radiance from the sun to the radiance reflected from the ground. It is measured by placing two pyranometers opposite each other at 180°. One pyranometer is oriented upward to measure the global radiance, and the other is oriented downward to measure the radiance reflected from the ground.
According to the ASTM standard test method, the albedo measurement using a single pyranometer is found by measuring the reflected radiation due to the incident radiation. In this study, albedo measurement was performed by placing two pyranometers with a 180° angle difference. Albedo measurements were carried out on the dam pond when the sun was in the zenith position.

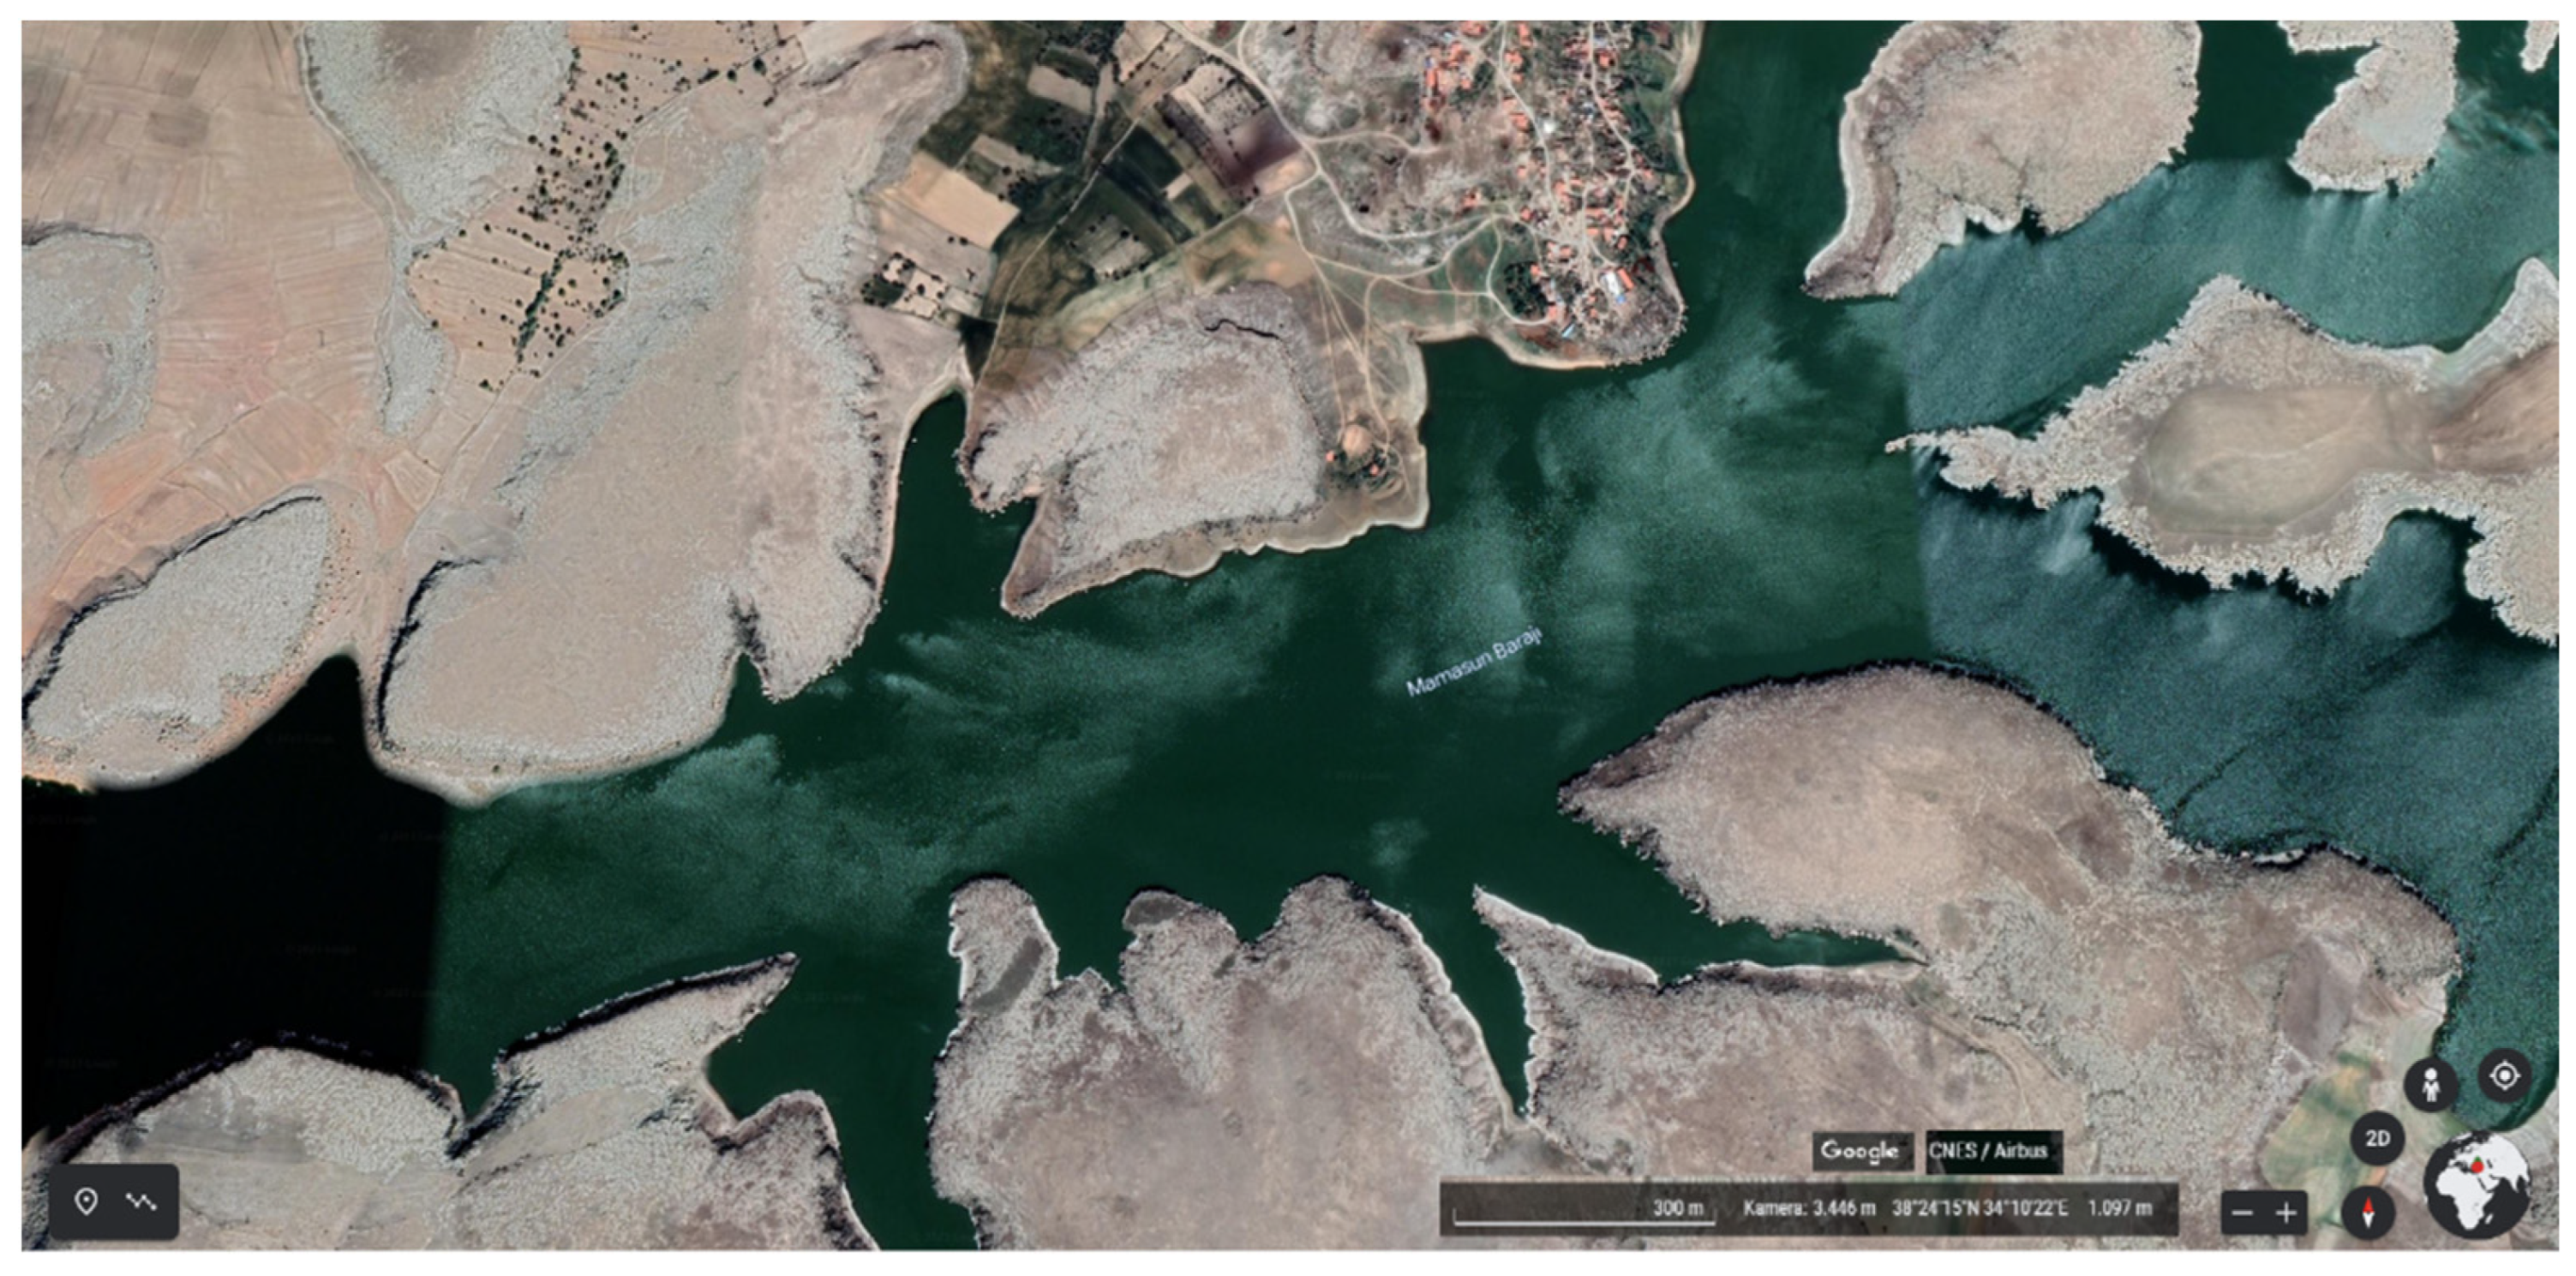
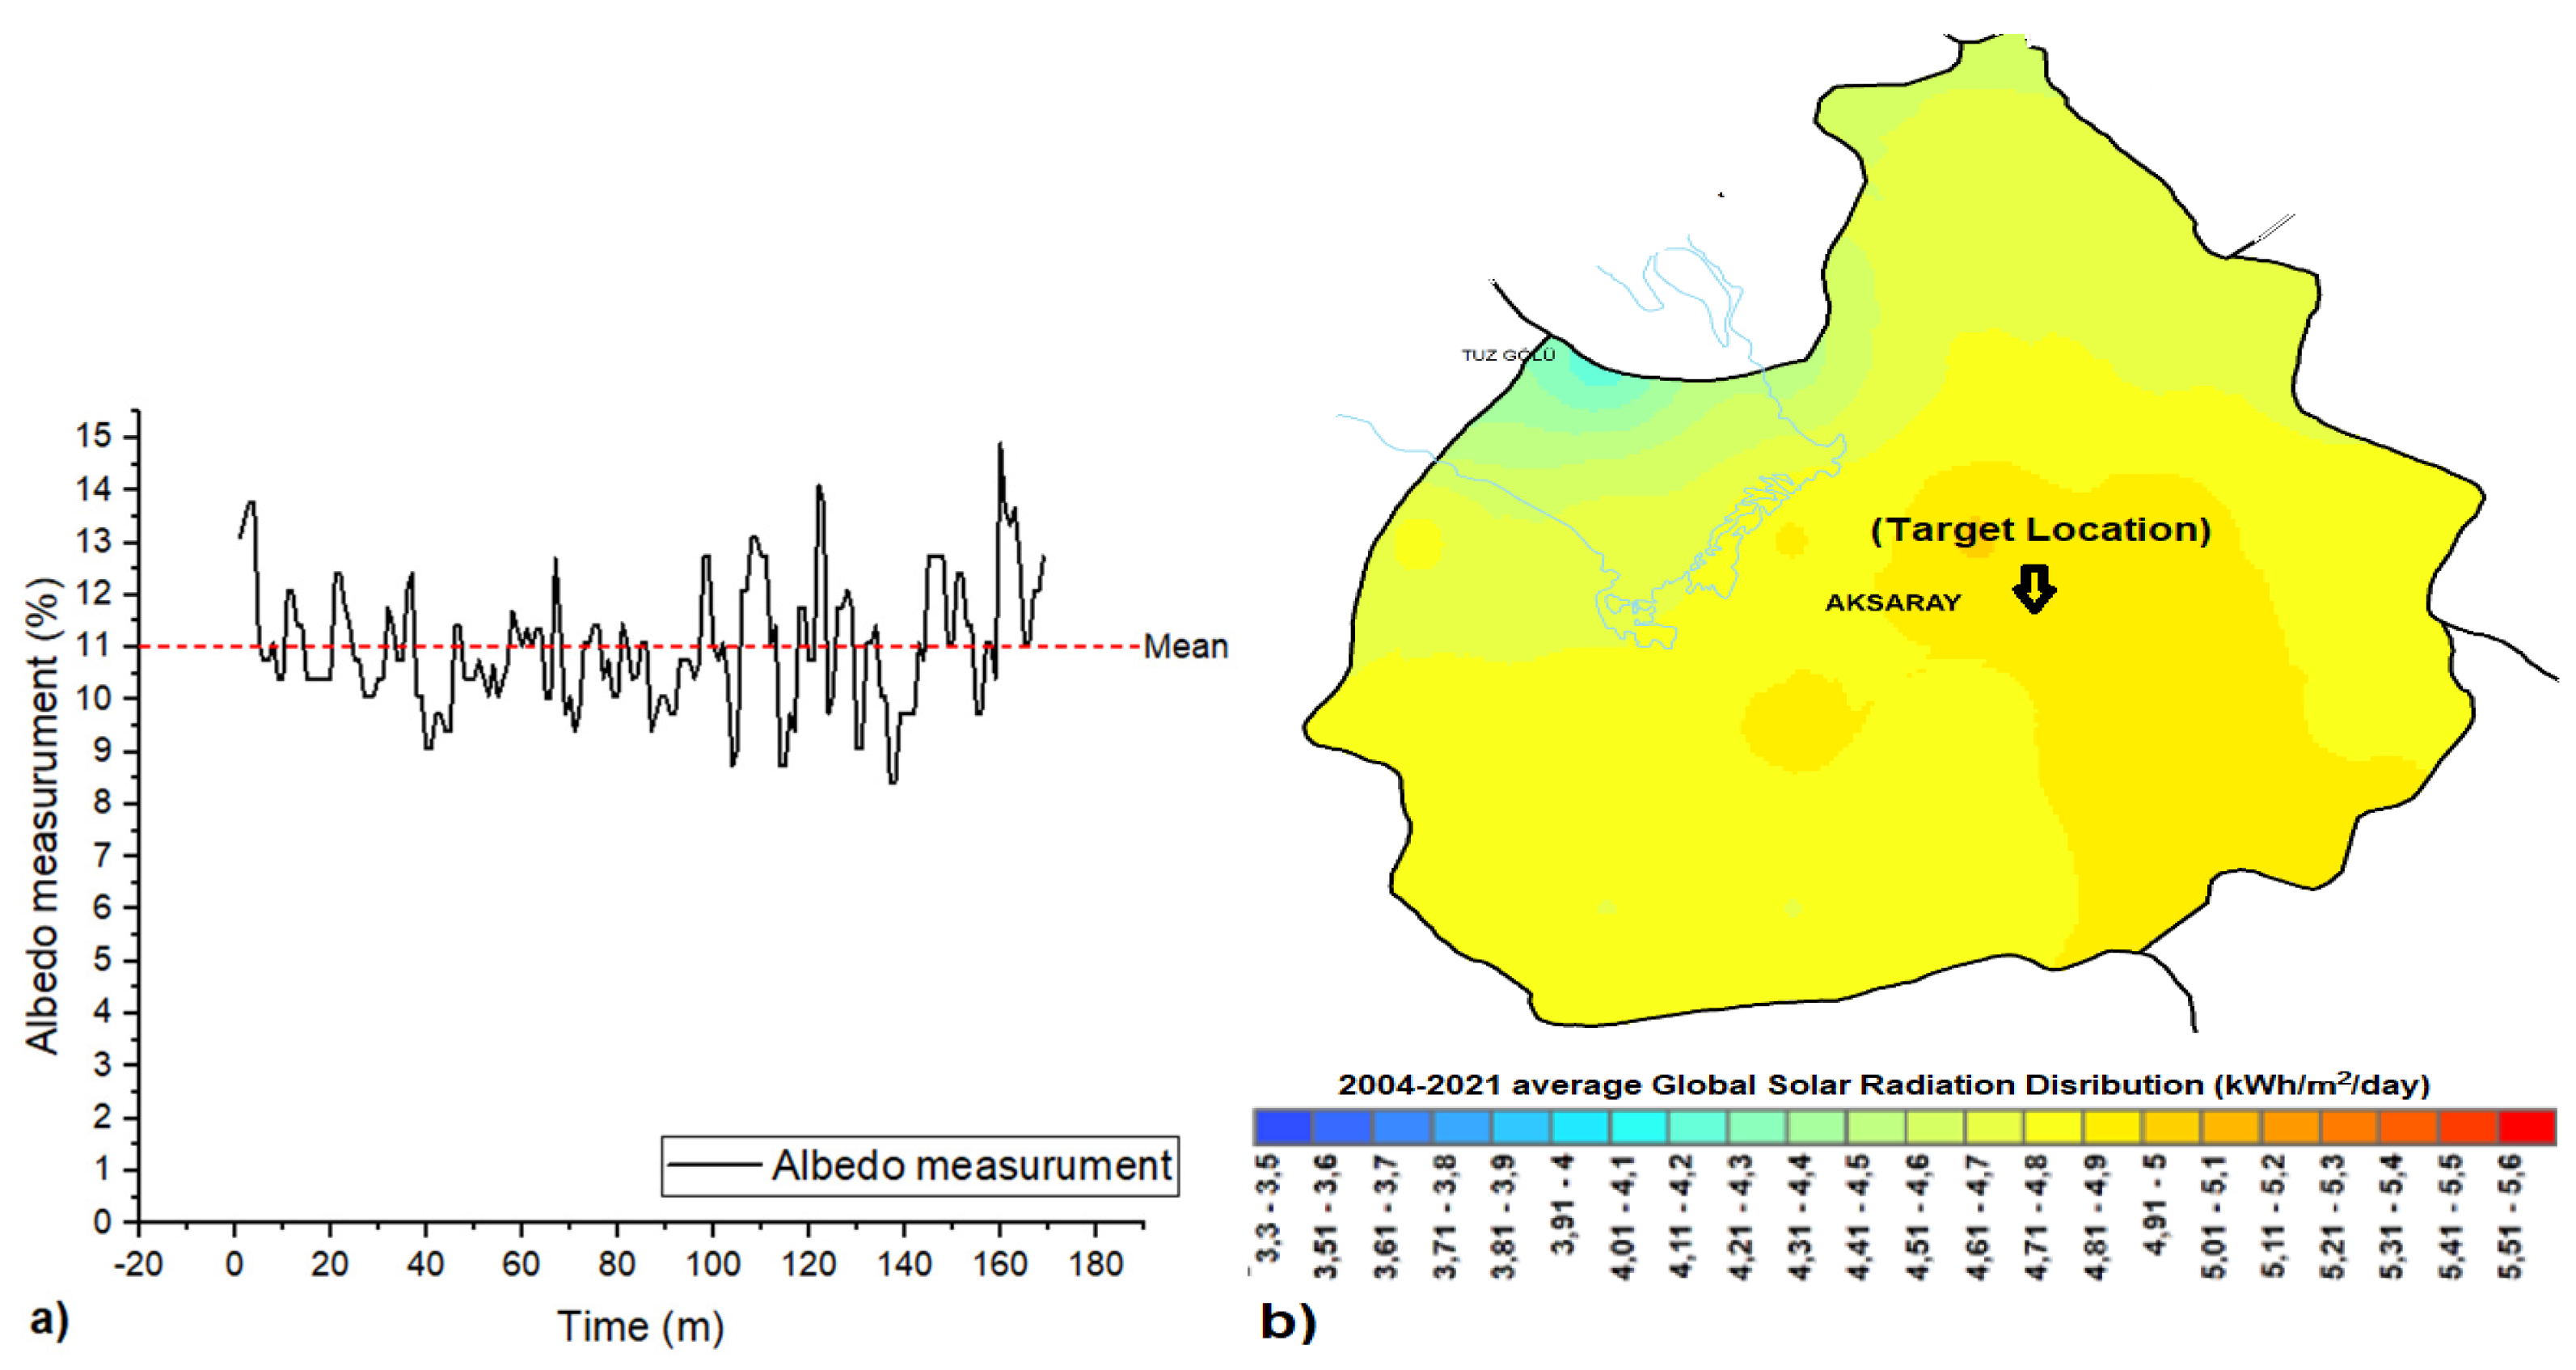
2.1. Study Area: Profile of Place Chosen and Geographical Site Parameters

A dam pond in the city of Aksaray, Turkey, was set as the target for the modeling and analysis of the PV plant. The region was chosen as a target site because the reservoir is used for drinking water and agricultural irrigation in the province of Aksaray. As a result of the global drought in the region in recent years, which was also caused by global warming, the utilization rate of the reservoir has dropped to 18%. A major reason for this decline is water loss due to evaporation from the pond surface. The shading of the FPV power plant to be installed on the pond will reduce the effect of evaporation and prevent water loss. Another reason for selecting the target site is that it is suitable for PV installation due to its high average solar radiation distribution due to its geographical location. The annual average global solar radiation distribution in the region was measured to be 4.7 kWh/m2/day [33,34].
The site of the PV system is 17.5 km from the city center of Aksaray. It is located in the north of the city and lies between 38.40646° and 34.17650° north latitudes and east longitudes. The size of the area is about 4 square kilometers. Its height above sea level is 1085 m. The satellite view of the proposed target location is shown in Figure 2.
Solar radiation, wind, and temperature are climate variables that affect the efficiency and performance of the PV power plant and are therefore used to determine the efficiency and performance. Climate data are obtained from the Meteonom 8.1 meteorological file for the target region in the PVsyst database. The 12-month mean data for 1990 were obtained from the database for the target area and are shown in Table 1.
In Figure 3, horizon information and a graph displaying the sun’s trajectory are provided for the target area. The graph shows that the solar modules receive the sun’s rays during the best irradiation hours of the day, although the sun’s exposure times are very short on 19 January and 22 November and 22 December (for the 6th and 7th hours of the day). As a consequence, it was noted that the plant exhibited a lower performance during the winter months.
Figure 3 illustrates that the sun rays are incoming behind the panel, as indicated by the azimuth and sun height values below the lines indicating the plane. Upon analyzing the graph, it becomes evident that the specified region corresponds to the azimuth angle range of ±90° to ±120°. These angles represent periods during which the sun’s beams exhibit a reduced effectiveness, namely between the early morning and late evening when the sun’s height is between 0° and 20°. The optimal circumstances for achieving the maximum efficiency of the modules have been identified as follows: an azimuth angle of 0°, a high sun height, and, for all dates except the 7th date line, about 01:00 p.m.

2.2. Technical Aspects of FPV Power Plant

The 1081 KW PV power plant was modeled using bifacial modules at the proposed site. The solar modules face south with a tilt angle of 36° and an azimuth angle of 0°. When determining the tilt angle, the geographical location is multiplied by a factor of 0.87, and then the resulting value is increased by 3.1. The calculation of angles is closely related to the geographical location. The tilt angle of 36° was found by calculation using the geographical coordinates of the target area. Since the target location is geographically in the northern hemisphere, the surfaces of the modules should be orientated towards the south. If the azimuth value is zero, it means that the surface of the modules faces south for the northern hemisphere. As the azimuth was 0, it caused the losses of the PV power plant to increase depending on the orientation, and the loss with respect to the optimum was 0%. A total of 2457 modules were installed, each with a rated power of 440 Wp. The bifacial monocrystalline modules were used, connected in 91 arrays and 27 series. Each string was connected in series with a voltage level of 1012 V DC. Three inverters with a nominal power of 160 KW were used to convert the DC voltage to an AC voltage.
The method for conveying the distinct temperature behaviors of a system and reference system is to determine the heat loss coefficient known as the U-value. Photovoltaic modules possessing a high U-value can effortlessly disperse their thermal energy. Equation (1) details the U-value calculation [35].
U = α · G POA · ( 1 η ) T mod T amb
where α represents the fraction of the solar spectrum absorbed, GPOA denotes the in-plane radiation in W/m2, and ƞ is the power conversion efficiency for the module. In the denominator of the equation, there is the difference between the module and the ambient temperature.
In this study, the mounting structure of the modules in the FPV design does not completely cover the water surface, and there is no obstacle between the back of the modules and the water surface. Moreover, the mounting structure in the design does not create an obstacle to the wind. The module temperature, which depends on climate variables, such as the incident irradiation and wind speed, is an important variable in determining the U-value. In land-based PV power plants, the U-value of 20 W/m2K is commonly used [36]. Conversely, in FPV systems, the lack of obstacles on the water surface allows for high wind speeds and evaporating water to decrease module temperatures. Consequently, the U-value used for the simulations of the proposed FPV plant was determined to be 50 W/m2K based on the relevant literature [17]. Several studies have highlighted the potential similarity between the U-value in FPV systems and land-based systems. In accordance with the findings presented in [37], a comparative analysis was conducted to assess the difference in U-values between FPV systems and land-based systems. The results indicate that, even under optimal conditions, a higher U-value contributes to a 2% increase in the efficiency of the FPV system. It is important to note that the U-value is influenced by climate variables and the plant design. Thus, it may fluctuate depending on these factors.

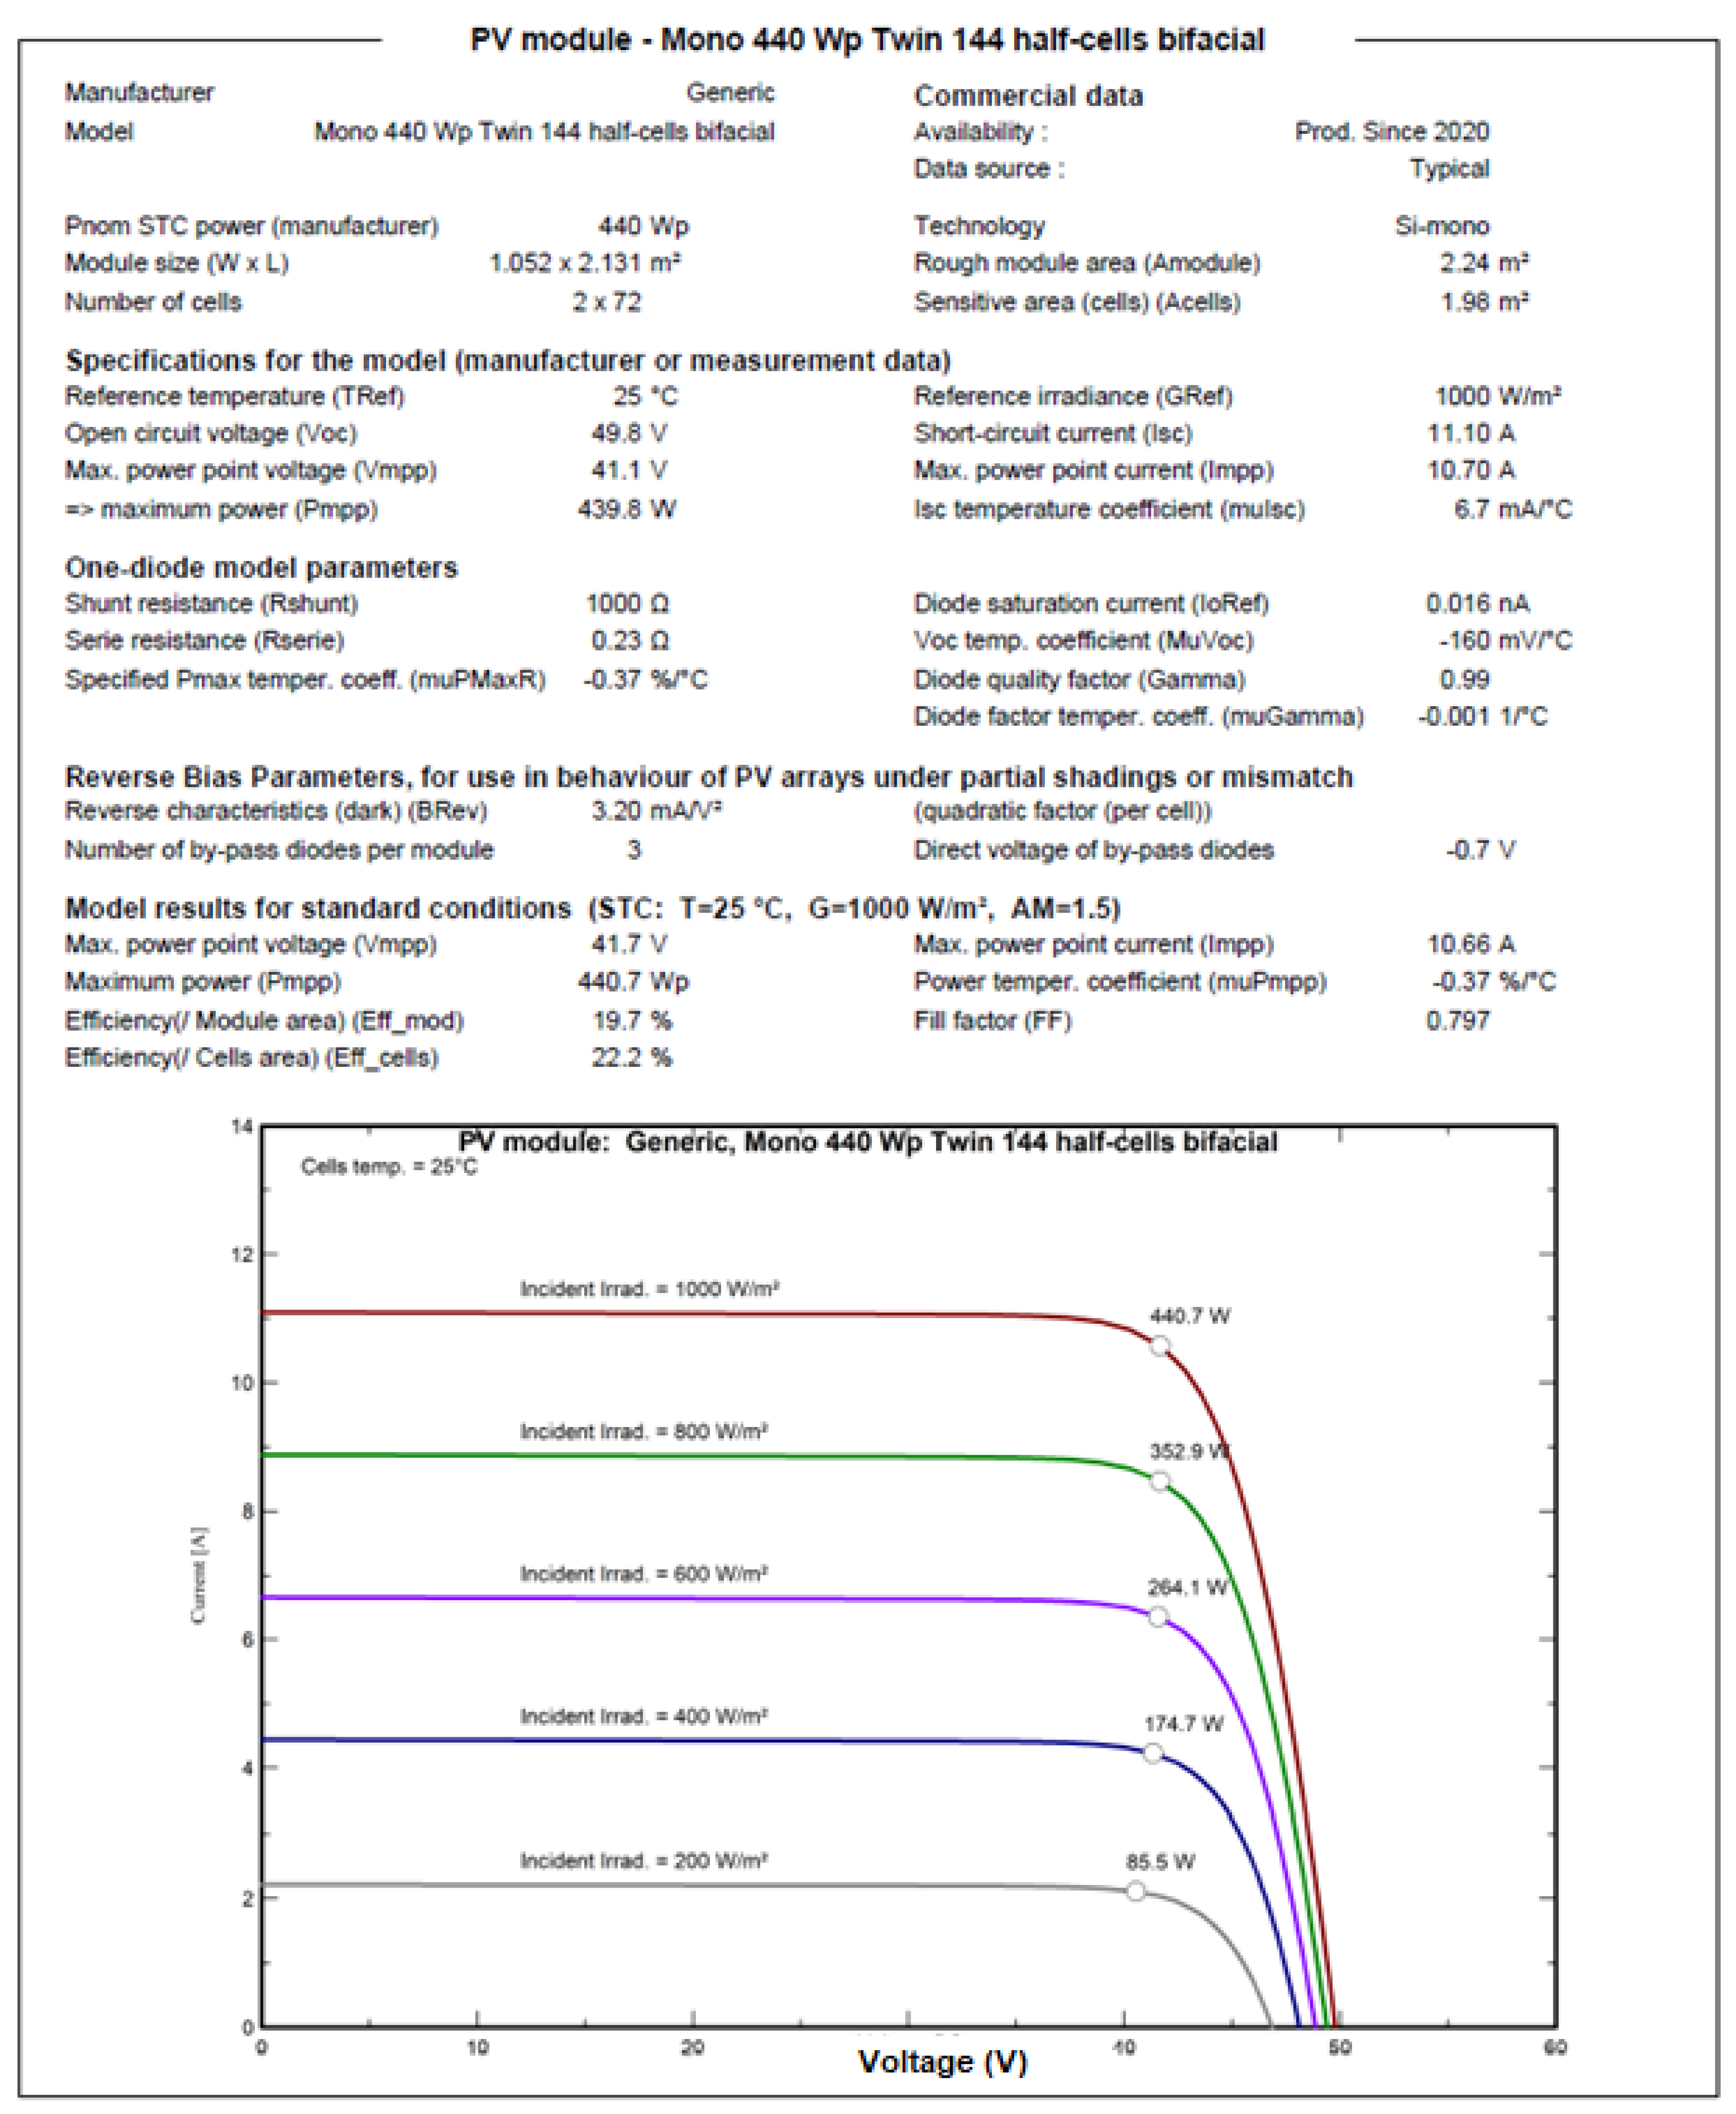
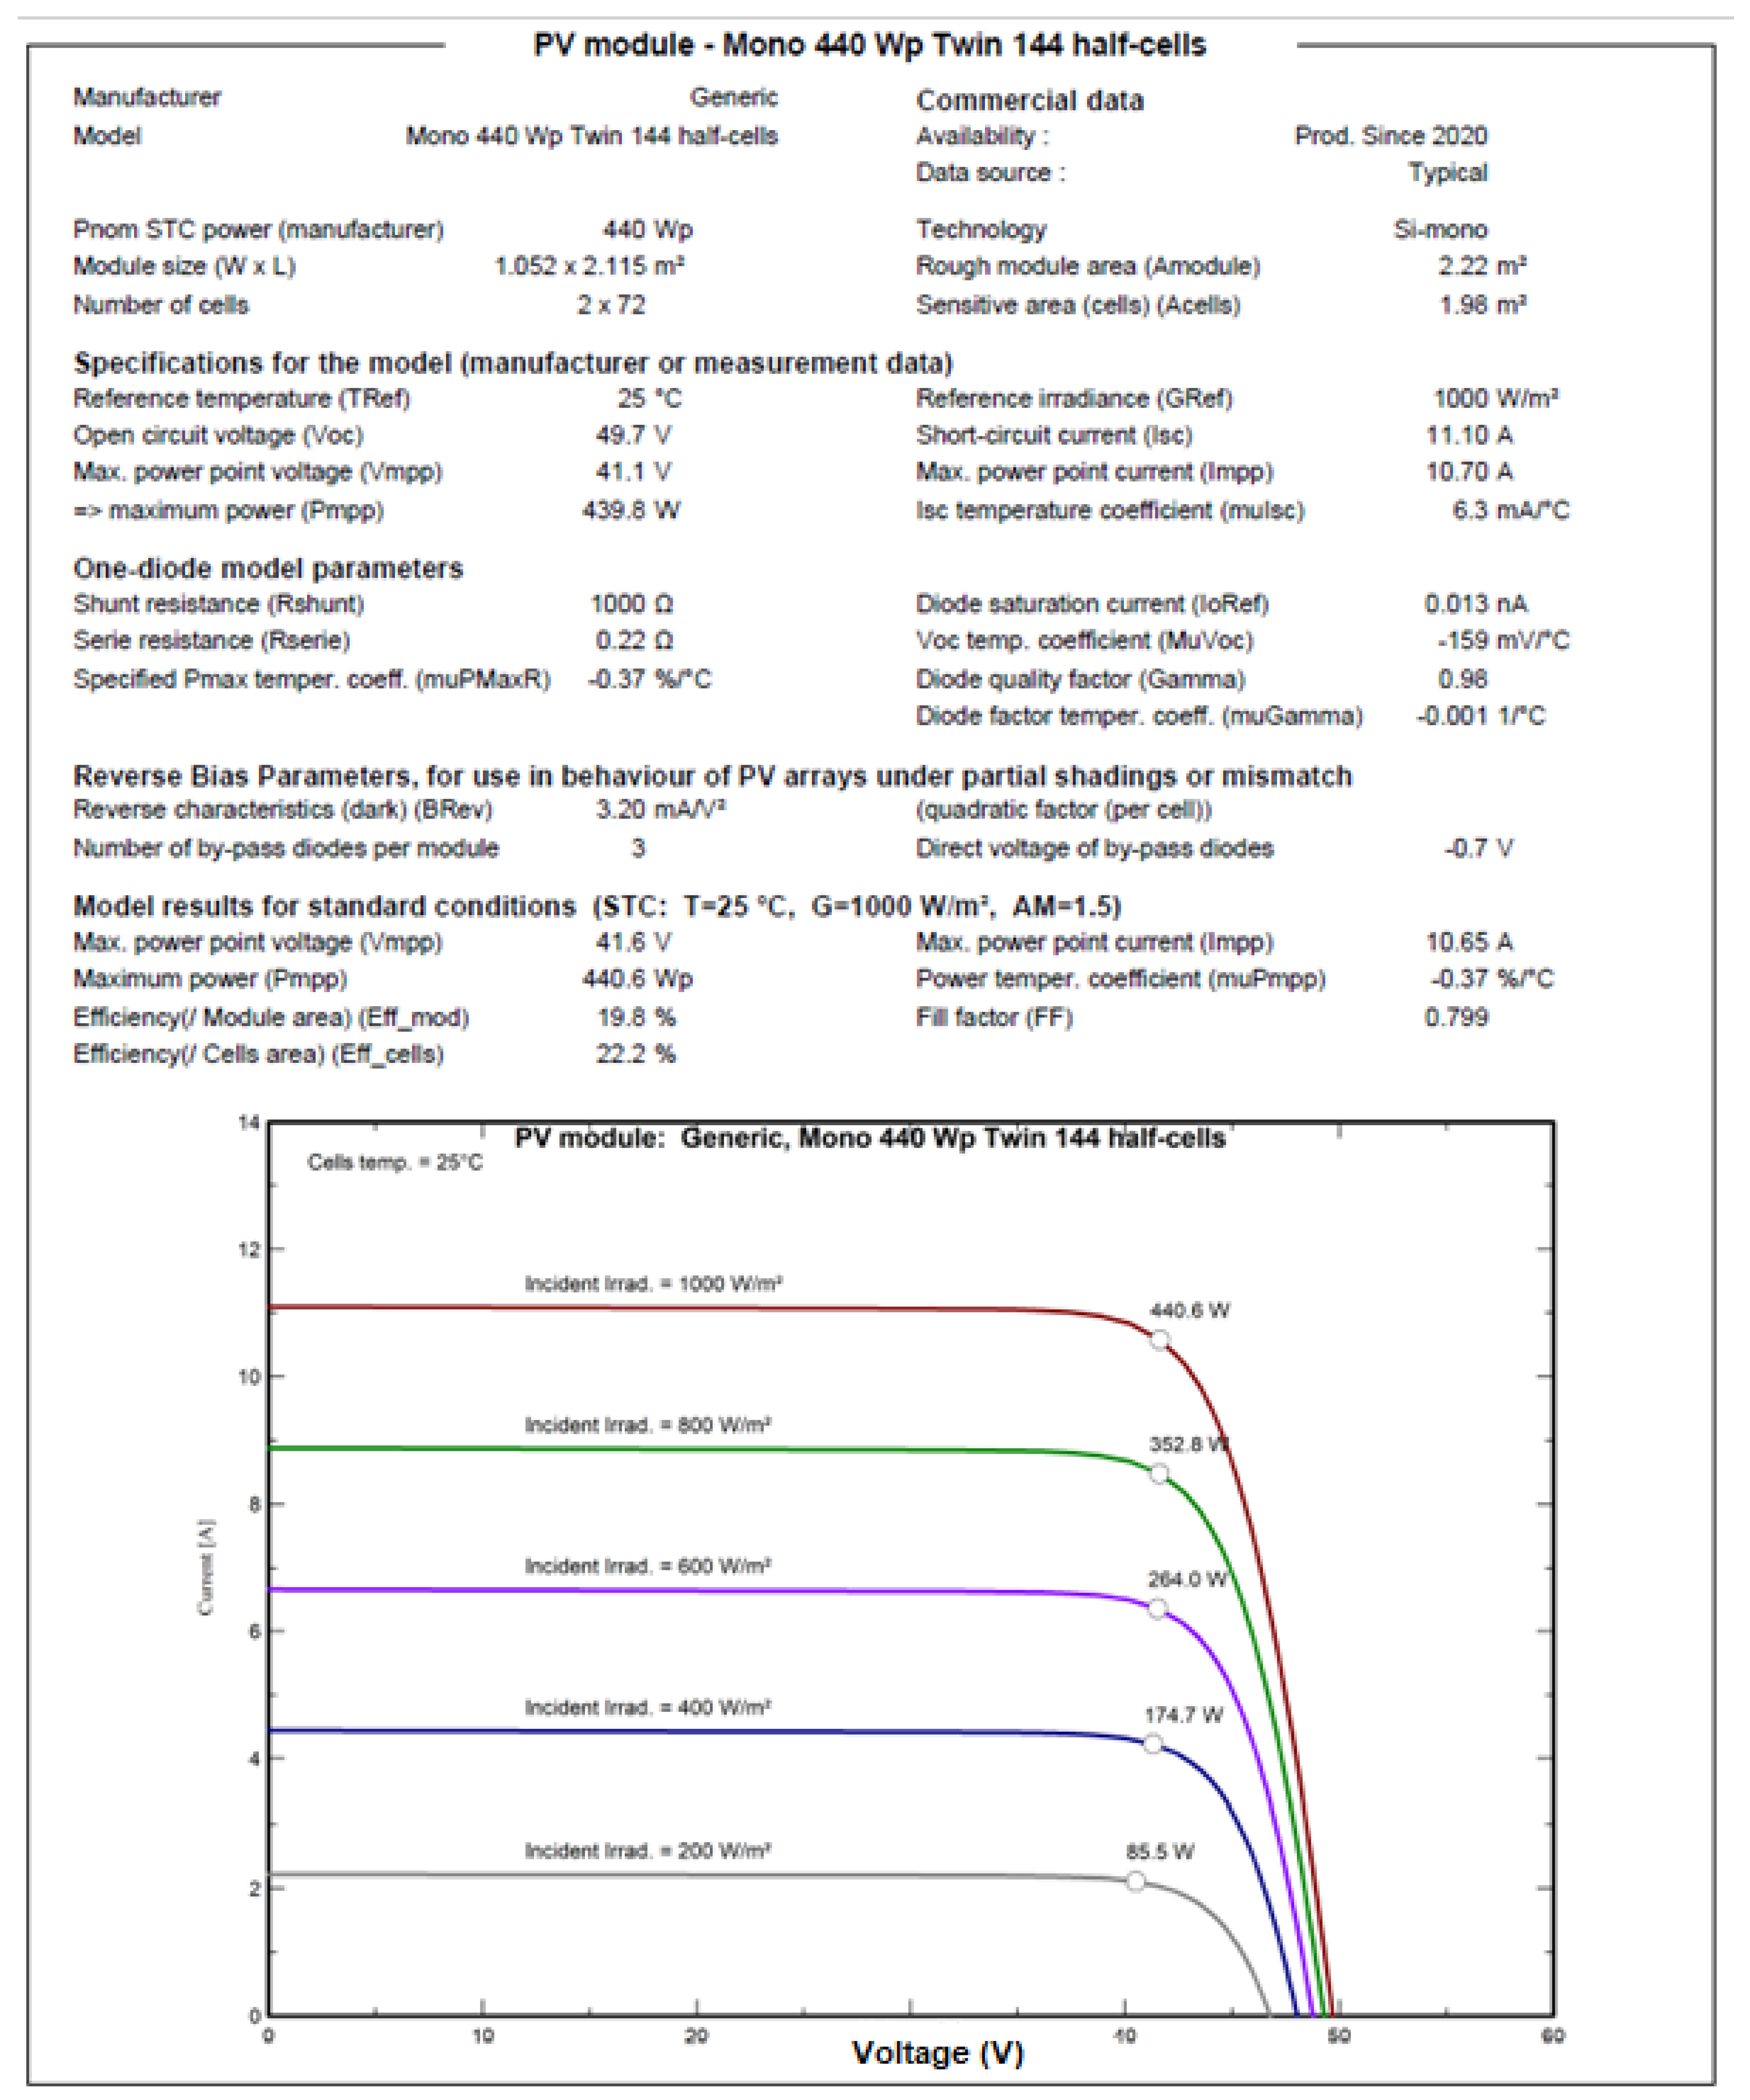
2.2.1. Main Components of the Designed PV Plant

In the FPV1 system, the modules from the monocrystalline silicon cell with a rated power of 440 W and 144 half-cell bifacial modules belonging to the Generic company (see Appendix A) were used. In FPV2, monocrystalline and twin 144 half-cell mono surface modules with a rated power of 440 W (see Appendix B) were used. The size of both modules is 2.131 (m) × 1.052 (m) × 0.035 (m). The technical specifications of the PV modules are given in Table 2.
The proposed PV power plant utilized the SUN2000-185KTL-INH0-50C model inverter from the Huawei Technologies company in Shenzhen, China. Five inverters, each rated at 160 KW, were installed to meet the power requirements. The technical specifications of the inverters are presented in Table 3.

2.2.2. PVsyst Simulations

Simulations were conducted on PVsyst program version 7.3. to design proposed PV systems and calculate parameters, such as the PR and annual losses. The simulation aims to investigate the albedo effect on a 1 MW FPV plant installed on the Mamasın Dam Pond, using bifacial and monofacial PV modules. In addition, the goal is to reduce evaporation through shading created by the FPV system and reduce water loss due to drought.
The modules were positioned facing south with an azimuth of 0° because the target site is in the northern hemisphere, and the tilt angle was set to 36°. Figure 4 displays the azimuth and tilt angle of the modules.

2.2.3. Design

The power plant was arranged in 6 rows, each comprising 400 modules. The modules were arranged in two rows and 200 columns in one of six rows. The distance between each row was set to 10 m, because the greater distance causes the shadow of the front row to affect the back row less. Once 2400 modules were placed this way, the remaining 57 modules were put in 3 rows and 9 columns. The purpose of arranging the modules in two rows within each row is to ensure that their height above the water surface is low. Increasing the height of the modules would result in a rise in their center of gravity, rendering them unstable when placed on the water surface. Moreover, positioning the modules in two rows has led to a larger water surface area being covered by the plants and has helped in reducing evaporation.
Orientation is crucial in ensuring that a solar module performs at its maximum output. The measure of deviation from any reference is the azimuth, and the azimuth is set to 0 degrees, as there are no geographical or technical restrictions on the FPV design. Figure 5 shows the placement of the FPV modules and their positions on the dam.

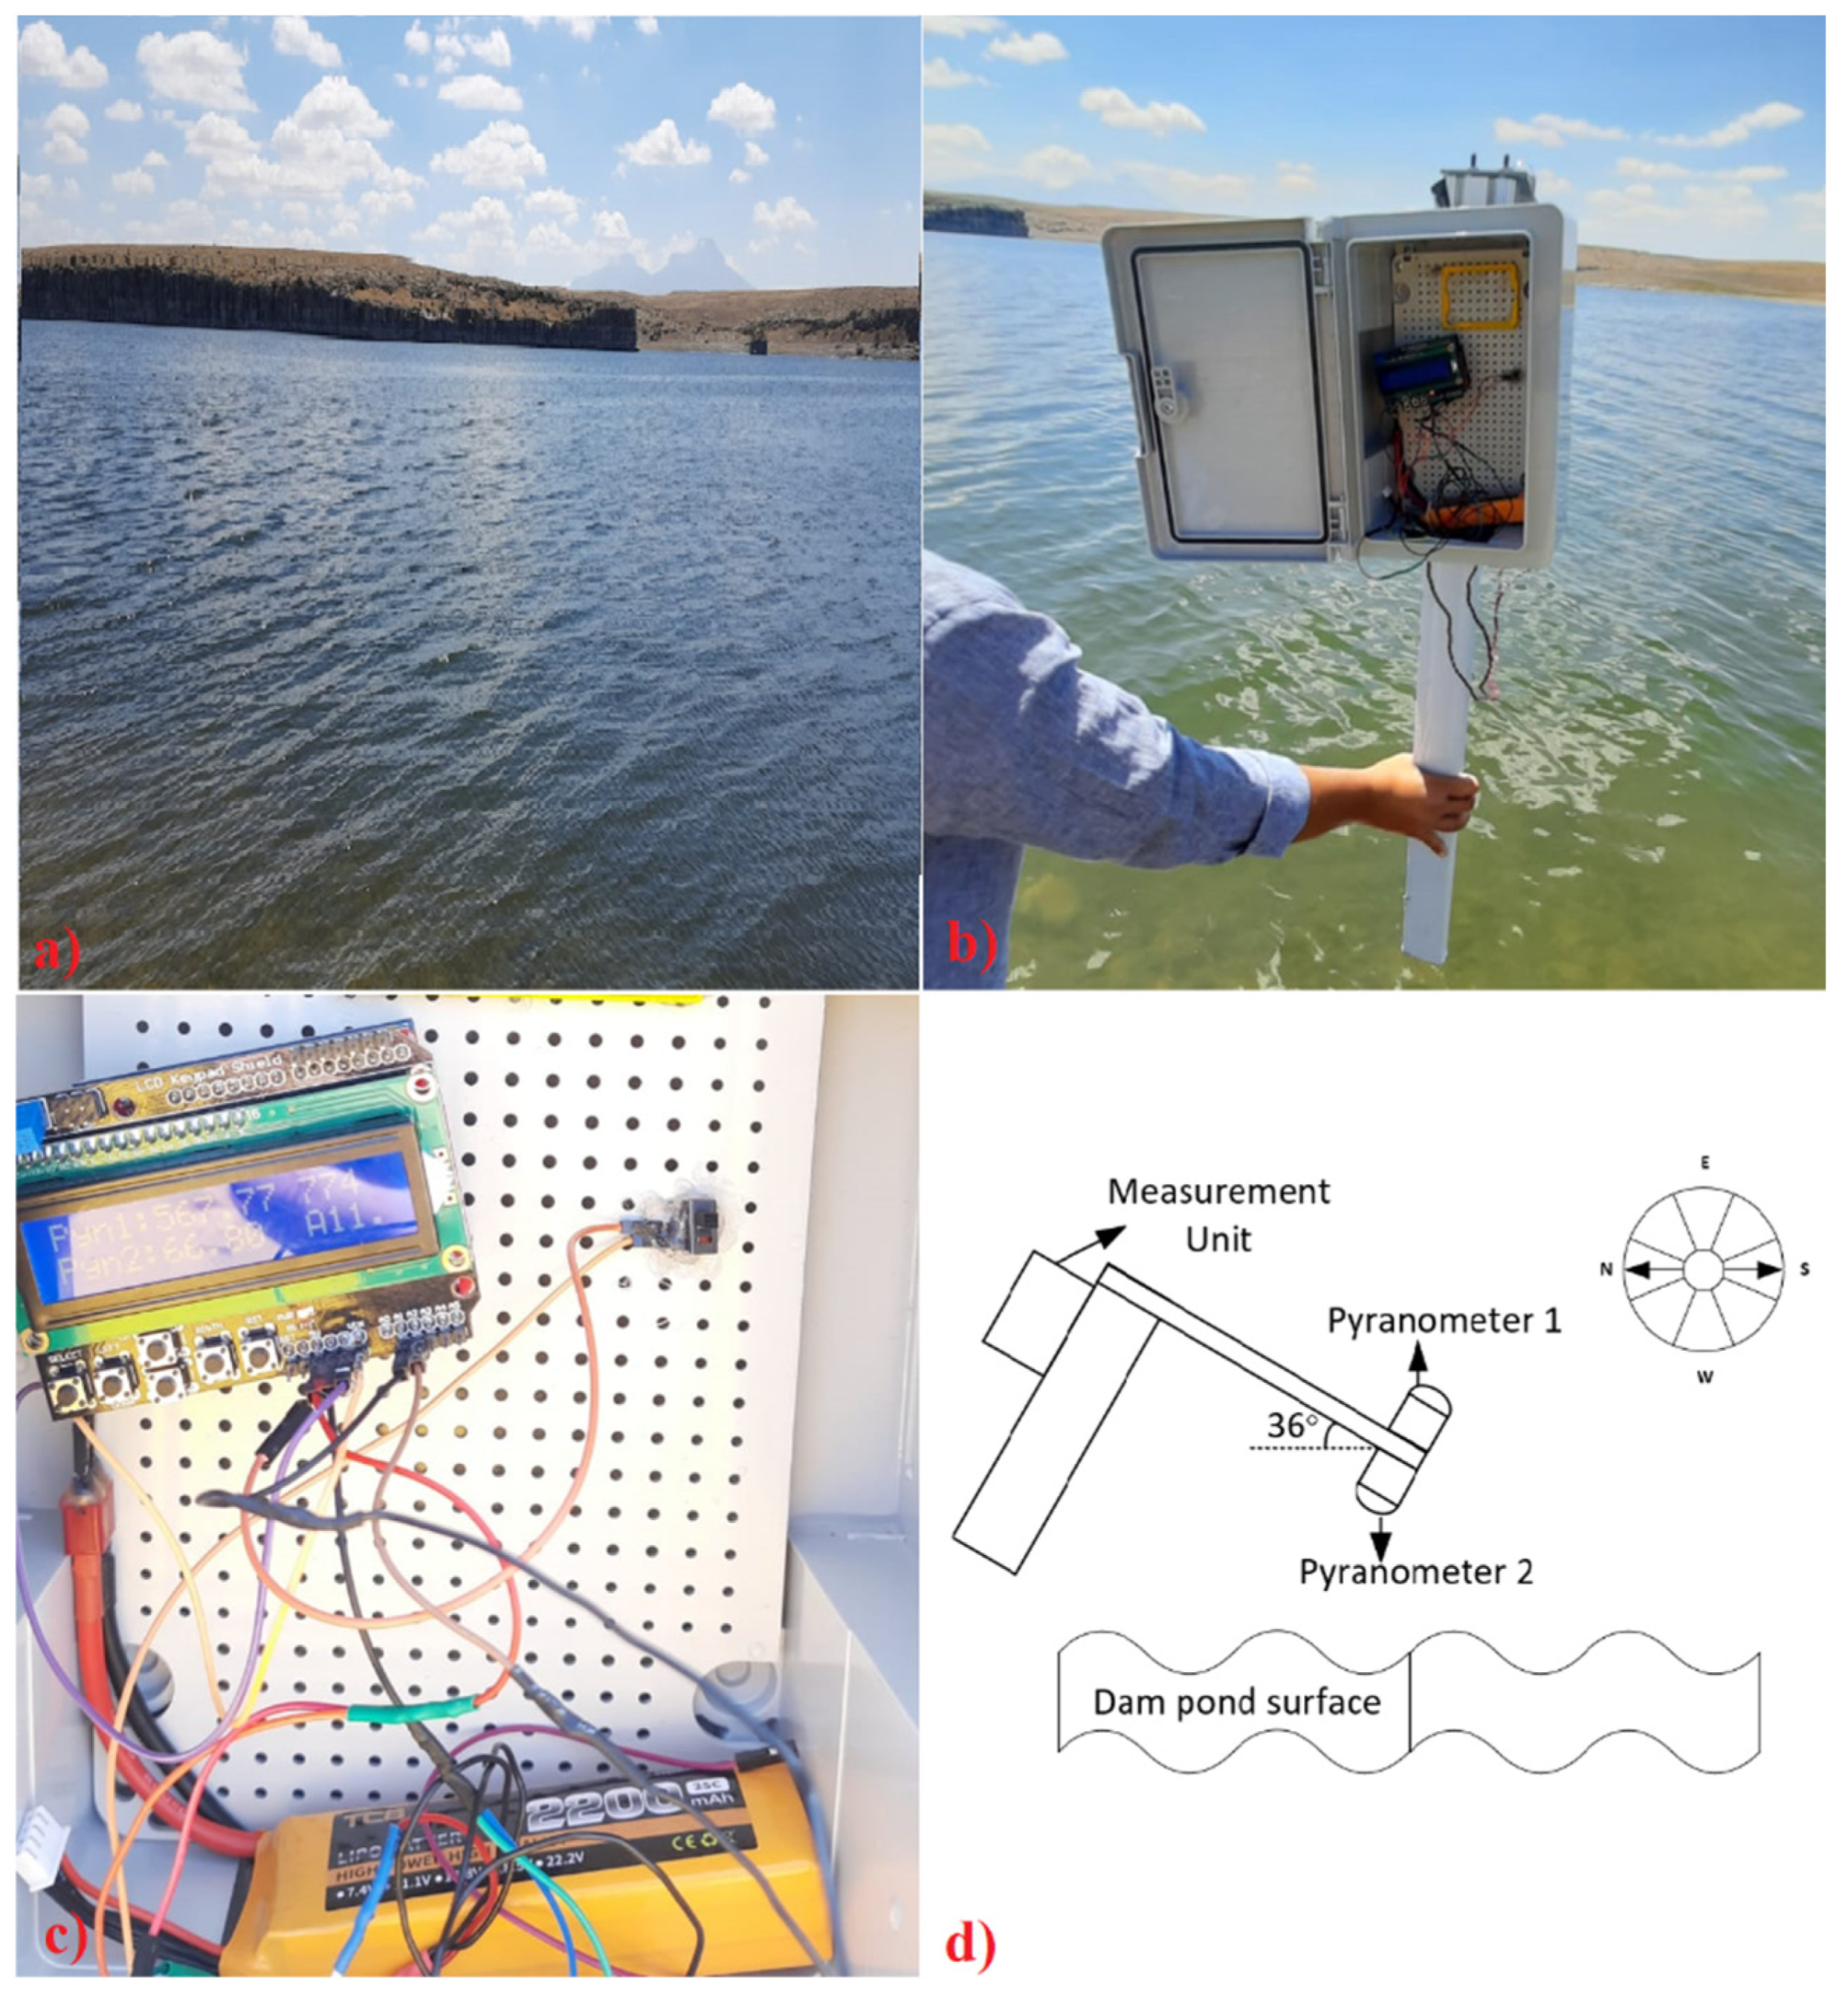
2.2.4. Albedo Measurements

Albedo is determined by positioning two pyranometers 180° apart. The maximum uncertainty for the albedo measurement value in a day is fixed at 2% [38]. The accuracy of albedo measurements is chiefly influenced by the measurement setup and the reflecting properties of the surroundings. The aluminum bars on which the pyranometers are placed are draped with a dull plastic coating to mitigate the reflectivity. The radiation events in the region where the shadows of the bars are captured are assumed to be atmospheric hemispherical diffused radiation. Reflected radiation from shaded and unshaded areas is combined and constitutes celestial radiation [39]. In this study, we developed an albedometer through the use of two pyranometers. Its purpose was to measure radiation by reflecting from the water surface to the back of bifacial modules. Table 4 shows the technical specifications of the pyranometers.
The pyranometers utilized in the albedometer record values ranging from 0 to 1800 W. The recorded value is converted into a 10-bit analogue value. Data are received at intervals of approximately 0.3 s. However, as a result of utilizing an averaging filter, the recorded value is displayed at intervals of approximately 1.5 s. Using the values measured by both pyranometers, the albedo (a) is computed, as in Equation (2), by dividing the reflected solar radiation by the incident solar radiation [38].
a = E r e f l e c t e d   s o l a r   r a d i a t i o n E i n c i d e n t   s o l a r   r a d i a t i o n
To carry out FPV1 simulations with bifacial modules, awareness of the albedo effect is necessary. In order to measure albedo, the albedometer was developed and measurements were taken in the Mamasın Dam Pond. Figure 6 illustrates the measurement configuration and result. The reflection of solar radiation on the surface of water relies on the color and ripples of the water. The color of water in lakes and seas varies. Although this color alters seasonally and over time due to biological conditions, wave formation frequently occurs throughout the day. The scattering of incoming sun rays by waves is a crucial factor that affects albedo measurements. Due to the fact that the water for which albedo is measured is a dam pond, wave formation is at a low level. The measurements also considered mean values.
The measurements were conducted at 11:30 a.m. on 28 August. Pyranometers were strategically positioned along the lake shoreline, approximately 1 m above the water level, and oriented with an azimuth angle of zero. The measurement outcomes are presented in Figure 7a, and the mean global solar radiation distribution for the target location is given in Figure 7b. The average albedo was determined to be 0.11 based on a series of measurements conducted over a duration of 169 min. Measurements of sea surface albedo in the literature review ranged from 7.8% to 16% [41]. As a result, it was determined that the measurement taken in the dam pond was consistent with previous research. Due to dry climatic conditions and dependence on a singular river for its water supply, the dam pond is expected to have a consistent albedo value throughout the year, without any noticeable seasonal variations. Due to this reason, measurements were conducted during the summer season, as it is the period when the photovoltaic power plant exhibits its highest efficiency, and it was assumed to remain consistent on an annual basis. The observed oscillation in the collected measurement data can be attributed to minor fluctuations occurring on the surface of the water. The fluctuation in the measurement data is attributed to the reflection of solar radiation in various directions as a consequence of the waveform of the sea surface.

3. Results and Discussion

PVsyst simulations were conducted for the designed FPV1 and FPV2 power plants with power capacities of 1081 kWp and 1001 kWp, respectively. The performances of FPV1 and FPV2 were found to be 74.92% and 72.22%, respectively. The simulations were carried out with all variables held constant except for the control variable. The albedo effect was examined in both monofacial and bifacial modules in FPV systems. In addition, shading the water surface with PV modules to decrease its temperature will reduce evaporation and prevent water loss. Furthermore, it will aid in the mitigation of global warming by decreasing the amount of CO2 emissions. The PVsyst software enables the estimation of expected reductions in CO2 emissions resulting from the installation of photovoltaic systems. If the carbon footprint of the electricity generated by the PV power plant is lower than the carbon footprint necessary to generate the same amount of electricity, the program estimates CO2 emission savings [42]. The CO2 emissions reduced by the FVP1 and FVP2 systems, respectively, are 19,562.695 and 17,253.475 tons.

3.1. Performance Ratio

The PR is the ratio of the energy actually produced to the energy that would be produced if the system operated continuously at the efficiency of the nominal standard test conditions. The PV conversion, module quality, wiring, ageing, shading, contamination, incompatibility, and system losses are significant factors in determining the PR. The PR mathematical formula is as follows [43]:
P R = E t o t a l E m a x   p o t e n t i a l
The total energy produced formula is as follows:
E t o t a l = E A C P r a t e d
where Etotal is the total energy produced, EAC is the AC power output, and Prated is the rated capacity. It is possible to calculate the maximum energy potential of the PV power plant and its formula is as follows:
E m a x   p o t e n t i a l = G l o b I n c * P n o m P V
where PnomPV is the standard test condition installed power and GlobInc is the incident global irradiation in the collector plane.
A graphical representation of the monthly simulated PR results for the FPV1 and FPV2 systems is displayed in Figure 8. According to the simulation, the PR of the FPV1 system equipped with a bifacial module was 74.92%, and the annual production was 1688.773 MWh/year. The greatest output, at 202.345 MWh (with a PR of 86.6%), was achieved in July, while the lowest, at 51.061 MWh (with a PR of 39.9%), was obtained in December. The FPV2 system with a monofacial module produced an annual energy amount of 1507.355 MWh/year, and its PR was calculated to be 72.22%. The peak yield of 179.618 MWh and PR of 83% occurred in July, whereas the least productive month was December with an output of 45.302 MWh and a PR of 38.3%.
Bifacial modules generate electricity through the photovoltaic cells on their rear surfaces, utilizing the albedo effect and reflecting the solar radiation from the ground. Hence, it is vital to compute the PR of the PV cells on the back of the FPV1 system using bifacial modules. Note that any changes in mounting height, row spacing, and PV module orientation will affect the bifacial PR. In the FPV1 system, which has a mounting height of 1 m and a row spacing of 10 m, the bifacial PR was found to be 72.2% through simulations using an albedo value of 0.11, as measured at the Mamasin Dam Pond.
When comparing FPV1 and FPV2 systems, it is evident that the energy efficiency per year increases when bifacial modules are used. The FPV1 system produced an excess of 181.418 MWh of energy annually. This is proof of the contribution of the albedo effect to the annual energy production in the FPV system. It should be noted that the albedo effect varies depending on the colors of different oceans, lakes, streams, and ponds in different geographical areas. Considering the seasonal variations in lakes that display different color tones at different times of the year, it is reasonable to expect that the albedo effect will also vary.

3.2. Loss Diagram

There are significant losses in a PV power plant, including thermal, module quality, mismatch, module degradation, incident angle, and system unavailability losses. These losses depend on the design and location of the PV plant. Therefore, it is essential to consider the losses that reduce the output power when determining the location and designing the PV plant. Figure 9 shows the loss diagram of the FPV1 and FPV2 systems.
It is clear that the main loss in the FPV1 system is the far shading/horizon. In addition, due to the fact that the FPV1 system is a bifacial system, it provides a power gain depending on the global incident on the ground. However, there was a decrease in the bifacial module gain due to the albedo effect and shading loss on the rear side despite row spacing of 10 m. Figure 10 shows the shading factor diagram. All shading losses were effective on the fifth, sixth, and seventh date lines during the hours when the effect of solar radiation was low. As a result, the diffuse shading factor was determined to be 0.048. A total of 1823 kWh/m2 of global horizontal irradiation from the sun was injected into the grid, in which led to a result of 1688.773 kWh due to losses. There was no bifacial gain in the FPV2 system, which injected 1507.355 kWh of energy into the grid.

3.3. Water Savings Prediction

FPV systems installed on the water surface prevent the sun’s rays from hitting the water surface, reducing water evaporation and preventing water loss. Methods for calculating the evaporation, energy balance, and mass transfer, although theoretical, require data that are not yet available for many studies. In addition, data from lake instruments are often questionable, although they are economical. The use of empirical formulas is therefore essential to obtain estimates of evaporation. The empirical formula used by the United States Geological Survey (USGS) is given in Equation (6) [44].
E = 4.57 * T + 43.3 ( cm / year )
where T is the average temperature of ambient.
According to Meteonom data, the average annual temperature of the target area is 12.8 °C. The FPV1 and FPV2 systems installed on the Mamasın Reservoir cover surface areas of 5508 m2 and 5062 m2, respectively. The annual water loss calculated from these areas using Equation (6) is 5.609 million liters for FPV1 and 5.154 million liters for FPV2.
It is clear that shading the modules on the water surface will reduce evaporation and prevent water losses. However, the amount of water that can be saved varies in different references in the literature. Experimental studies conducted in reference [45] indicated that water savings could reach up to 29.1%. In this scenario, the water conservation for the FPV1 and FPV2 systems would be roughly 1.632 and 1.5 million liters, respectively. According to references [46,47], the air temperature in the shaded area beneath the modules was recorded as 1.6 °C lower than the ambient temperature. Therefore, FPV1 and FPV2 can preserve 0.403 and 0.370 million liters of water, correspondingly.

4. Conclusions

This study investigates the albedo effect in FPV systems using PVsyst simulations. The analysis and design of FPV systems capable of producing 1 MW power with bifacial and monofacial modules were conducted at the Mamasın Dam Pond in Aksaray, Turkey. Albedo ratio measurements were taken to determine the energy production on the back surface of the bifacial modules, by reflecting sun rays from the water surface. As a result of the analysis, the following conclusions can be drawn:
  • The albedo effect of the Mamasin Reservoir was found to be 0.11. The measurements were made in August, at 11:30 a.m., in the summer season when the PV power plant works most efficiently, within 169 min.
  • Simulations showed the results of parameters such as the power ratio and losses. It was calculated that bifacial modules produce 181,418 MWh of excess energy per year. It was found that bifacial modules produce 12.04% more energy per year than monofacial modules.
  • PV modules installed on the water’s surface help to reduce evaporation by preventing the sun’s rays from reaching the water’s surface. Although studies show that water savings are variable, it is estimated that at least 0.403 million liters of water loss will be prevented for bifacial FPV and 0.370 million liters of water loss will be prevented for monofacial FPV.
  • Although FPV systems have significant advantages, their disadvantages should also be investigated. Photovoltaic modules can cause various malfunctions in humid environments. Therefore, the lifetime of modules in FPV systems is expected to be short.
  • The initial installation and maintenance costs of FPV systems on the water surface will be high. Disadvantages that do not exist in land-based PV plants, such as floating systems on the water surface, transmission lines that will carry the energy to the land, and maintenance and repair on the water surface, will increase the costs.
  • An important disadvantage is the impact of FPV systems on nature. The sun’s rays can reach up to 200 m underwater in lakes, seas, and oceans. Sun rays, which are important for underwater life, will not be able to reach the water due to the blocking of FPV systems. The impact of FPV systems on the underwater ecological balance should be studied by researchers in the short, medium, and long term.
  • Another important factor in increasing the PR is to reduce losses. To reduce shading losses, the row spacing was set at 10 m. This distance has been increased to reduce shading losses. In order to completely eliminate shading losses, the distance must be increased. However, increasing the row spacing requires significant changes to the system design.
  • As a result of the simulations, the estimated CO2 emissions savings of the FPV1 and FPV2 systems are 19,562.695 and 17,253.475 tons, respectively. The CO2 emissions saved by PV systems will reduce global warming and help fight the climate crisis.
Simulations have demonstrated the potential for the use of the albedo effect in FPV systems, which can increase energy production by 12.04%. Furthermore, it is evident that module shading reduces water loss through evaporation. Choosing FPV systems instead of PV power plants installed in fertile agricultural areas or geographically challenging dry areas does not affect agricultural production and offers advantages in terms of water savings, for example. However, it is also essential that researchers study the impact of FPV systems on the water ecology over time.

Author Contributions

Conceptualization, A.E.C. and H.D.; methodology, H.D.; software, H.D.; validation, A.E.C. and H.D.; formal analysis, H.D.; investigation, A.E.C. and H.D.; resources, A.E.C.; data curation, H.D.; writing—original draft preparation, A.E.C. and H.D.; writing—review and editing, A.E.C. and H.D.; visualization, A.E.C. and H.D.; supervision, A.E.C. and H.D.; project administration, H.D. All authors have read and agreed to the published version of the manuscript.

Funding

This research received no external funding.

Data Availability Statement

Data are contained within the article.

Conflicts of Interest

The authors declare no conflict of interest.

Appendix A

Figure A1. Technical specification of mono 440 Wp twin 144 half-cells bifacial PV module.
Energies 17 00959 g0a1

Appendix B

Figure A2. Technical specification of mono 440 Wp twin 144 half-cells PV module.
Energies 17 00959 g0a2

References

  1. Coşgun, A.E.; Demir, H. The Experimental Study of Dust Effect on Solar Panel Efficiency. Politek. Derg. 2022, 25, 1429–1434. [Google Scholar] [CrossRef]
  2. Erdogan, S.; Pata, U.K.; Solarin, S.A. Towards Carbon-Neutral World: The Effect of Renewable Energy Investments and Technologies in G7 Countries. Renew. Sustain. Energy Rev. 2023, 186, 113683. [Google Scholar] [CrossRef]
  3. Mustafa, S.; Long, Y.; Rana, S. Role of Domestic Renewable Energy Plants in Combating Energy Deficiency in Developing Countries. End-User Perspective. Energy Rep. 2023. [Google Scholar] [CrossRef]
  4. International Energy Agency. Energy Security Concerns and New Policies Lead to Largest Ever Upward Revision of IEA’s Renewable Power Forecast; International Energy Agency: Paris, France, 2022.
  5. Xie, M.; Jia, T.; Dai, Y. Hybrid Photovoltaic/Solar Chimney Power Plant Combined with Agriculture: The Transformation of a Decommissioned Coal-Fired Power Plant. Renew. Energy 2022, 191, 1–16. [Google Scholar] [CrossRef]
  6. Yan, H.; Chong, D.; Wang, Z.; Liu, M.; Zhao, Y.; Yan, J. Dynamic Performance Enhancement of Solar-Aided Coal-Fired Power Plant by Control Strategy Optimization with Solar/Coal-to-Power Conversion Characteristics. Energy 2022, 244, 122564. [Google Scholar] [CrossRef]
  7. Vyas, M.; Chowdhury, S.; Verma, A.; Jain, V.K. Solar Photovoltaic Tree: Urban PV Power Plants to Increase Power to Land Occupancy Ratio. Renew. Energy 2022, 190, 283–293. [Google Scholar] [CrossRef]
  8. Coşgun, A.E. The Potential of Agrivoltaic Systems in TURKEY. Energy Rep. 2021, 7, 105–111. [Google Scholar] [CrossRef]
  9. Ghosh, A. A Comprehensive Review of Water Based PV: Flotavoltaics, under Water, Offshore & Canal Top. Ocean Eng. 2023, 281, 115044. [Google Scholar] [CrossRef]
  10. Trapani, K.; Redón Santafé, M. A Review of Floating Photovoltaic Installations: 2007–2013: A Review of Floating Photovoltaic Installations. Prog. Photovolt. Res. Appl. 2015, 23, 524–532. [Google Scholar] [CrossRef]
  11. The International Renewable Energy Agency. Renewable Energy Statistics 2021; The International Renewable Energy Agency (IRENA): Abu Dhabi, United Arab Emirates, 2021. [Google Scholar]
  12. Cazzaniga, R.; Rosa-Clot, M. The Booming of Floating PV. Sol. Energy 2021, 219, 3–10. [Google Scholar] [CrossRef]
  13. Lee, K.R.P.; Buceilla, A.; Motyka, M. Floatovoltaics Enters the Renewable Energy Mix: Floating Solar Panels Are Now Commercially Viable; Delloite: London, UK, 2021. [Google Scholar]
  14. Sahu, A.; Yadav, N.; Sudhakar, K. Floating Photovoltaic Power Plant: A Review. Renew. Sustain. Energy Rev. 2016, 66, 815–824. [Google Scholar] [CrossRef]
  15. Nisar, H.; Kashif Janjua, A.; Hafeez, H.; Shakir, S.; Shahzad, N.; Waqas, A. Thermal and Electrical Performance of Solar Floating PV System Compared to On-Ground PV System-an Experimental Investigation. Sol. Energy 2022, 241, 231–247. [Google Scholar] [CrossRef]
  16. El Hammoumi, A.; Chtita, S.; Motahhir, S.; El Ghzizal, A. Solar PV Energy: From Material to Use, and the Most Commonly Used Techniques to Maximize the Power Output of PV Systems: A Focus on Solar Trackers and Floating Solar Panels. Energy Rep. 2022, 8, 11992–12010. [Google Scholar] [CrossRef]
  17. Dörenkämper, M.; Wahed, A.; Kumar, A.; De Jong, M.; Kroon, J.; Reindl, T. The Cooling Effect of Floating PV in Two Different Climate Zones: A Comparison of Field Test Data from the Netherlands and Singapore. Sol. Energy 2021, 219, 15–23. [Google Scholar] [CrossRef]
  18. Shyam, B.; Kanakasabapathy, P. Feasibility of Floating Solar PV Integrated Pumped Storage System for a Grid-Connected Microgrid under Static Time of Day Tariff Environment: A Case Study from India. Renew. Energy 2022, 192, 200–215. [Google Scholar] [CrossRef]
  19. Panda, S.; Panda, B.; Kumar, R.; Sharma, K.; Pradhan, R.; Ranjan Kabat, S. Analyzing and Evaluating Floating PV Systems in Relation to Traditional PV Systems. Mater. Today Proc. 2023. [Google Scholar] [CrossRef]
  20. El Hammoumi, A.; Chalh, A.; Allouhi, A.; Motahhir, S.; El Ghzizal, A.; Derouich, A. Design and Construction of a Test Bench to Investigate the Potential of Floating PV Systems. J. Clean. Prod. 2021, 278, 123917. [Google Scholar] [CrossRef]
  21. Sulaeman, S.; Brown, E.; Quispe-Abad, R.; Müller, N. Floating PV System as an Alternative Pathway to the Amazon Dam Underproduction. Renew. Sustain. Energy Rev. 2021, 135, 110082. [Google Scholar] [CrossRef]
  22. Campana, P.E.; Wästhage, L.; Nookuea, W.; Tan, Y.; Yan, J. Optimization and Assessment of Floating and Floating-Tracking PV Systems Integrated in on- and off-Grid Hybrid Energy Systems. Sol. Energy 2019, 177, 782–795. [Google Scholar] [CrossRef]
  23. Sutanto, B.; Indartono, Y.S.; Wijayanta, A.T.; Iacovides, H. Enhancing the Performance of Floating Photovoltaic System by Using Thermosiphon Cooling Method: Numerical and Experimental Analyses. Int. J. Therm. Sci. 2022, 180, 107727. [Google Scholar] [CrossRef]
  24. Padilha Campos Lopes, M.; De Andrade Neto, S.; Alves Castelo Branco, D.; Vasconcelos De Freitas, M.A.; Da Silva Fidelis, N. Water-Energy Nexus: Floating Photovoltaic Systems Promoting Water Security and Energy Generation in the Semiarid Region of Brazil. J. Clean. Prod. 2020, 273, 122010. [Google Scholar] [CrossRef]
  25. Tina, G.M.; Bontempo Scavo, F.; Micheli, L.; Rosa-Clot, M. Economic Comparison of Floating Photovoltaic Systems with Tracking Systems and Active Cooling in a Mediterranean Water Basin. Energy Sustain. Dev. 2023, 76, 101283. [Google Scholar] [CrossRef]
  26. Bassam, A.M.; Amin, I.; Mohamed, A.; Elminshawy, N.A.S.; Soliman, H.Y.M.; Elhenawy, Y.; Premchander, A.; Oterkus, S.; Oterkus, E. Conceptual Design of a Novel Partially Floating Photovoltaic Integrated with Smart Energy Storage and Management System for Egyptian North Lakes. Ocean Eng. 2023, 279, 114416. [Google Scholar] [CrossRef]
  27. Bajc, T.; Kostadinović, D. Potential of Usage of the Floating Photovoltaic Systems on Natural and Artificial Lakes in the Republic of Serbia. J. Clean. Prod. 2023, 422, 138598. [Google Scholar] [CrossRef]
  28. Silalahi, D.F.; Blakers, A. Global Atlas of Marine Floating Solar PV Potential. Solar 2023, 3, 416–433. [Google Scholar] [CrossRef]
  29. Delacroix, S.; Bourdier, S.; Soulard, T.; Elzaabalawy, H.; Vasilenko, P. Experimental Modelling of a Floating Solar Power Plant Array under Wave Forcing. Energies 2023, 16, 5198. [Google Scholar] [CrossRef]
  30. Islam, M.I.; Jadin, M.S.; Mansur, A.A.; Kamari, N.A.M.; Jamal, T.; Hossain Lipu, M.S.; Azlan, M.N.M.; Sarker, M.R.; Shihavuddin, A.S.M. Techno-Economic and Carbon Emission Assessment of a Large-Scale Floating Solar PV System for Sustainable Energy Generation in Support of Malaysia’s Renewable Energy Roadmap. Energies 2023, 16, 4034. [Google Scholar] [CrossRef]
  31. Piancó, F.; Moraes, L.; Prazeres, I.D.; Lima, A.G.G.; Bessa, J.G.; Micheli, L.; Fernández, E.; Almonacid, F. Hydroelectric Operation for Hybridization with a Floating Photovoltaic Plant: A Case of Study. Renew. Energy 2022, 201, 85–95. [Google Scholar] [CrossRef]
  32. Micheli, L. Energy and Economic Assessment of Floating Photovoltaics in Spanish Reservoirs: Cost Competitiveness and the Role of Temperature. Sol. Energy 2021, 227, 625–634. [Google Scholar] [CrossRef]
  33. Turkish State Meterological Service. Available online: https://www.mgm.gov.tr/kurumici/radyasyon_iller.aspx?il=aksaray (accessed on 23 August 2023).
  34. Turkish Statistical Institute-Central Dissemination System. Available online: https://biruni.tuik.gov.tr/medas/?kn=92&locale=tr (accessed on 23 August 2023).
  35. Skoplaki, E.; Palyvos, J.A. Operating Temperature of Photovoltaic Modules: A Survey of Pertinent Correlations. Renew. Energy 2009, 34, 23–29. [Google Scholar] [CrossRef]
  36. Reindl, T. At the Heart of Floating Solar: Singapore. Pv-Tech Power 2018, 14, 18–23. [Google Scholar]
  37. Micheli, L.; Talavera, D.L.; Marco Tina, G.; Almonacid, F.; Fernández, E.F. Techno-Economic Potential and Perspectives of Floating Photovoltaics in Europe. Sol. Energy 2022, 243, 203–214. [Google Scholar] [CrossRef]
  38. Kipp & Zonen B.V. Instruction Manuel: CMP Series Pyranometer; Kipp & Zonen B.V: Delft, The Netherlands, 2016. [Google Scholar]
  39. Matthias, A.D.; Post, D.F.; Accioly, L.; Fimbres, A.; Sano, E.E.; Batchily, A.K. Measurement of Albedos for Small Areas of Soil. Soil Sci. 1999, 164, 293–301. [Google Scholar] [CrossRef]
  40. Solar Radiation Sensor Solar Irradiance Sensor Solar Radiation Meter Sensor Solar Pyranometer—Sensors—AliExpress. Available online: http://www.aliexpress.com/item/1005004228412283.html?src=ibdm_d03p0558e02r02&sk=&aff_platform=&aff_trace_key=&af=&cv=&cn=&dp= (accessed on 22 September 2023).
  41. Willis, J. Some High Values for the Albedo of the Sea. J. Appl. Meteorol. 1971, 10, 1296–1302. [Google Scholar] [CrossRef]
  42. PVsyst Carbon Balance Tool. Available online: https://www.pvsyst.com/help/carbon_balance_tool.htm (accessed on 23 September 2023).
  43. PVsyst—Performance Ratio PR. Available online: https://www.pvsyst.com/help/performance_ratio.htm (accessed on 22 September 2023).
  44. Office of Water Data Coordination, U.S.G.S. National Handbook of Recommended Methods for Water Data Acquisition; U.S. Government Printing Office: Virginia, VA, USA, 1977.
  45. Kumar, M.; Kumar, A. Performance Assessment of Different Photovoltaic Technologies for Canal-Top and Reservoir Applications in Subtropical Humid Climate. IEEE J. Photovolt. 2019, 9, 722–732. [Google Scholar] [CrossRef]
  46. Barron-Gafford, G.A.; Pavao-Zuckerman, M.A.; Minor, R.L.; Sutter, L.F.; Barnett-Moreno, I.; Blackett, D.T.; Thompson, M.; Dimond, K.; Gerlak, A.K.; Nabhan, G.P.; et al. Agrivoltaics Provide Mutual Benefits across the Food–Energy–Water Nexus in Drylands. Nat. Sustain. 2019, 2, 848–855. [Google Scholar] [CrossRef]
  47. Willockx, B.; Herteleer, B.; Cappelle, J. Combining Photovoltaic Modules and Food Crops: First Agrivoltaic Prototype in Belgium. Proc. Renew. Energy Power Qual. J. 2020, 18, 266–271. [Google Scholar] [CrossRef]
Figure 1. The number of publications in SciDirect that include research key terms (keywords: “waterbased PV” and “Floating PV”).
Energies 17 00959 g001
Figure 2. The satellite view of the proposed target location.
Energies 17 00959 g002
Figure 3. The sun trajectory for Aksaray.
Energies 17 00959 g003
Figure 4. Fixed tilt plane of modules.
Energies 17 00959 g004
Figure 5. (a) The placement of the FPV modules and (b) their position on the dam.
Energies 17 00959 g005
Figure 6. (a) Mamasın Dam Pond, (b) the albedometer, (c) measurement result, and (d) schematic representation of the measurement setup.
Energies 17 00959 g006
Figure 7. (a) Albedo measurements of the dam pond were over a measurement period of 169 min at 11:30 a.m. on 28 August. (b) The mean global solar radiation distribution [33].
Energies 17 00959 g007
Figure 8. Performance ratios of FPV1 and FPV2.
Energies 17 00959 g008
Figure 9. Loss diagram of bifacial and monofacial modules.
Energies 17 00959 g009
Figure 10. Shading factor diagrams.
Energies 17 00959 g010
Table 1. Meteorological data from Meteonom 8.1 of Aksaray.
MonthGlobal Horizontal
(kWh/m2)
Horizontal Diffuse Irradiation
(kWh/m2)
Mean Ambient Temperature
(°C)
Mean Wind Velocity
(m/s)
January69.830.00.22.4
February89.440.82.42.6
March133.454.77.23.0
April167.562.511.82.8
May216.269.216.72.4
June236.059.921.12.6
July237.058.725.02.9
August222.051.325.22.7
September178.440.620.02.3
October126.335.614.02.2
November81.330.37.02.1
December65.925.22.12.2
Year1823.2558.812.82.5
Table 2. PV module specification (see Appendix A and Appendix B).
ParameterPV1PV2Unit
Pmax440440W
Vmpp41.141.1V DC
Impp10.711.1A
Voc49.849.7V
Isc11.111.1A
Bifaciality factor0.8--
Efficiency22.2122.21%
Table 3. The technical specifications of the inverter of SUN2000-185KTL-INH0-50C.
ParameterValueUnit
Maximum MPP voltage1500V
MMPT operating voltage range600–1500V DC
Maximum AC current135A
Maximum AC power185kVA
Maximum efficiency99%
Table 4. The technical specification of the pyranometers [40].
ParameterValueUnit
Working environment−25~60°C
Measuring range0~1800 W/m2
Resolution1 W/m2
Annual stability≤±3%
Non-linear<±3%
Disclaimer/Publisher’s Note: The statements, opinions and data contained in all publications are solely those of the individual author(s) and contributor(s) and not of MDPI and/or the editor(s). MDPI and/or the editor(s) disclaim responsibility for any injury to people or property resulting from any ideas, methods, instructions or products referred to in the content.

