Article

Analysis of Different Scenarios to Include PV Rooftop Systems with Battery Energy Storage Systems in Olive Mills

by
Jose Luis Sánchez-Jiménez
1,2,3,
Francisco José Muñoz-Rodríguez
1,3,4,
Gabino Jiménez-Castillo
3,4,5,
Antonio Javier Martinez-Calahorro
2,3 and
Catalina Rus-Casas
1,3,4,*
1
Department of Electronic and Automatic Engineering, Universidad de Jaén, Campus Las Lagunillas, 23071 Jaen, Spain
2
Groupo Marwen Calsan Ltd., Parque Científico Tecnológico Geolit, C/Sierra Morena, Edificio CTSA 1, 23620 Mengíbar, Spain
3
Research Group SEEL (Laboratorio de Ingeniería Eléctrica y Electrónica Aplicadas a la Energía Solar), TEP-988, Universidad de Jaen, 23071 Jaen, Spain
4
Center for Advanced Studies in Earth, Energy and Environmental Sciences CEACTEMA, Universidad de Jaen, 23071 Jaen, Spain
5
Department of Electrical Engineering, Universidad de Jaén, Campus Las Lagunillas, 23071 Jaen, Spain
*
Author to whom correspondence should be addressed.
Energies 2024, 17(1), 144; https://doi.org/10.3390/en17010144
Submission received: 1 November 2023 / Revised: 22 November 2023 / Accepted: 5 December 2023 / Published: 27 December 2023
(This article belongs to the Special Issue Advances in Photovoltaic Solar Energy II)

Abstract

:
The industrial sector is not the one with the highest energy consumption but, together with, it represents the most, together with the transport sector, the most polluting ones. Photovoltaic Rooftop systems and battery energy storage systems are very strong candidates to include renewable energy, allowing greater grid autonomy and greenhouse gas mitigation. Therefore, this paper aims to outline it will be provided a methodology based on monitored data to analyze the potential of photovoltaic Rooftops with battery energy storage systems regarding self-consumption and self-sufficiency indices in the industrial sector. Direct self-consumption and self-sufficiency indices, either with or without storage, will be analyzed. In addition, the iso self-consumption and iso self-sufficiency curves are used, which allow us to evaluate the matching between the generation and consumption profiles considering either direct self-consumption or the use of batteries. In this sense, a large, medium, and small olive mill were selected in order to cover the entire spectrum of these industries. Olive mills are suitable candidates for the incorporation of photovoltaic systems since generation profiles match the consumption profiles. However, the size of these systems is highly dependent on the period of consumption to be faced. Regarding batteries, both during the harvest and off-harvest periods, the impact on self-sufficiency becomes significant, reaching increases of up to 10%, depending on the battery capacity used.

1. Introduction

In recent years, improved natural resource management and globalization have had a positive impact on the growth of the global economy [1]. However, this economic growth is one of the main drivers of pollution [2,3]. This is due to the fact that the economically productive sectors (primary, secondary, and transportation) still rely on highly polluting primary energy sources [4]. The transition from conventional energy sources, such as natural gas or coal, to renewable sources, such as solar and wind energy, for electricity production could lead to a considerable reduction in greenhouse gas (GHG) emissions [5,6,7]. The consolidated Renewable Energy Directive 2018/2001/EU sets a new binding renewable energy target for 2030 in the EU to enable at least 32% self-consumption of renewable energy, an expanded target of 14% for the contribution of renewable fuels in transport by 2030 and enhanced criteria to ensure the sustainability of bioenergy [8]. In fact, the objective of the European Union’s Green Pact is to become the world’s first emission-neutral continent by 2050.
In this context of sustainable development, factors such as GHG emissions, gross domestic product, population, and labor force growth are directly related to primary and final energy consumption [9]. In Spain, in 2021, the transportation sector was the main contributor to GHG emissions (29.9%), followed by industrial activities (22.6%), agriculture and livestock as a whole (11.4%), electricity generation (10.9%), fuel consumption in the residential, commercial and institutional sectors (9.1%), and waste management (4.6%) [5]. On the other hand, final energy consumption in Spain in 2021, excluding non-energy uses, increased by 8.9%. In the total final energy consumption, transportation stands out as the largest final energy consumer, at 37.8%, followed by the industrial sector at 30.2% [10]. It could be concluded that there is a direct relationship between the most polluting sectors and their final energy consumption [11]. Further in this classification, within the industrial sector in Spain, one of the most important is the agri-food sector and the manufacture of food products since they are not only large emitters of GHGs but also induce more emissions in other sectors [11]. The efficient use of their energy resources becomes crucial in increasing agricultural production, the competitiveness of the agriculture and food industry, and environmental sustainability. Reducing its reliance on increasingly limited fossil energy resources by understanding the energy consumption profiles and analyzing the energy balance of these industries is becoming increasingly necessary [12]. Therefore, the implementation of energy measures that introduce renewable energies in the agri-food industrial sector can significantly contribute to the reduction in GHG emissions and improve its economic competitiveness.
Solar photovoltaic (PV) energy and storage systems are key technologies that enable a higher share of renewable energy and grid autonomy [13]. In countries such as Spain, renewable electricity generation accounted for 42.2% of the national electricity supply in 2022, with wind energy as the second most important source (22.2% of the total) and solar photovoltaic energy as the fourth (10.1%), which contributed to the reduction in GHG emissions [14].
However, renewable energy generation sources have a stochastic behavior that makes it difficult to manage and control them within the generation mix. During their operation, peaks and valleys of production are generated and must be compensated to maintain system stability [15]. This situation has driven the industry’s interest in battery energy storage systems (BESS) as a possible solution [16,17,18,19,20,21]. In this sense, batteries are a key instrument for the transition to a climate-neutral economy that is expected to be achieved by 2050 in order to enable the integration of increasing shares of variable renewable energies.
In the short term, most projections foresee an increment in the use of storage systems, reaching 100 GWh in 2025. Beyond 2025, strong growth continues with the lowest estimants ranging from 8 to 100 GWh, and the highest estimates reaching 400 GWh in 2030, reaching 1300 GWh in 2040. At present, global demand for lithium-ion batteries is expected to exceed 2000 GWh by 2030. Under the most optimistic scenario, it could reach 4000 GWh by 2040 [22].
The expected growth stems from the expected significant technological improvements and further cost reductions. Lithium-ion battery prices, which were above $1100/kWh in 2010, fell to $156/kWh in 2020 [23]. In 2022, the estimated average battery price stood at about $150/kWh, with the cost of pack manufacturing accounting for about 20% of the total battery cost, compared to more than 30% a decade earlier [24]. These factors are essential in making the transition to a cleaner and more sustainable economy, which in turn contributes to the reduction in carbon emissions and the promotion of renewable energy sources in the industry.
In this way, the renewable energy systems with BESS in industries are a topic of growing relevance in today’s energy landscape. It is important to note that a balance must be established between ecosystem conservation, integration with the natural heritage, and the energy productivity of these systems. The debate on the architectural and landscape integration of these systems is extensive [25]. Therefore, policies, recommendations, and design criteria have been identified to promote energy transition in the rural environment, preserving the cultural and natural heritage, as is being performed in [26], where a full discussion of policy-related design criteria for the integration of photovoltaic systems is presented. By increasing the aesthetic, functional, and environmental value of a building or natural environment, photovoltaic technologies can lead to new market growth and social acceptance [27,28,29,30,31].
In this context, a cost–benefit analysis of PV and BESS planning for an industrial site, with the objective of maximizing the solar resource, is illustrated in [32]. A study to size the BESS of a particular customer using the generic load profile for industrial customers located in northern Taiwan is performed in [33]. This is also in [34], where the impact of different regulations on the optimal sizing of a solar hybrid system is studied, comparing systems under net metering and zero export schemes located in an industrial township in Delhi. In [35], a two-level stochastic programming model is proposed to determine the optimal power and capacity of the BESS for industrial consumers. In particular, in the agriculture and agri-food industry, photovoltaic (PV) Rooftop systems, with or without batteries, is one of the most widely used renewable energy sources with various applications [36,37,38], as water pumping systems for irrigation purposes [39], or electricity production in the agri-food sector [40,41,42].
These studies provide very interesting findings, but even so, research gaps have been identified. The studies found in the industrial sector do not provide an exhaustive analysis of the consumption profiles of the industries, which constitutes a key issue in order to provide a proper analysis of the potential of PV Rooftops, and no specific industries have been studied. Moreover, very few of them use real performance data, and in many cases, consumption averages or statistics are used instead of real monitored power consumption profiles throughout a year. This means that the detail of when and how the energy is consumed is lost as previous studies typically focus on cumulative energy consumption values, which may illustrate the total amount of kWh consumed but do not provide insights into the energy behavior of the industry. While studies without real performance data may provide valuable insights under controlled conditions, they often face limitations in terms of external validity, practical applicability, and the ability to account for the complexities of real-world scenarios.
This paper aims to illustrate the potential of incorporating renewable energy into the industry via PV Rooftop systems with batteries. For this purpose, a previous energy characterization of the real consumption profiles of these industries has been carried out. Industries usually have very different consumption profiles. Therefore, the aim of this article is to provide a methodology based on monitored data to analyze the potential of PV Rooftops with BEES regarding their consumption profiles together with self-consumption and self-sufficiency indices either with or without a storage system (direct self-consumption) in the industrial sector. This methodology is based on an analysis of the consumption profile over one year where either power and energy data have been considered and they may be very useful in order to maximize the self-consumed energy and, therefore, the self-consumption and self-sufficiency indices. Moreover, this methodology has been used within the olive mill agri-food industrial sector to analyze the matching between consumption and photovoltaic generation in three olive mills, considering the daily consumption profiles monitored throughout the year. Each of the analyzed olive mills belongs to a type according to the classification published in [43]: small, medium, and large. This classification is made considering the different sizes or productive scope. Although direct self-consumption was considered initially, the study has been extended by taking into account the effect of incorporating BESS into the PV Rooftop system. In this way, an analysis has been provided which illustrates the potential of PV Rooftops with or without BEES in this type of industry as it will consider as different types of olive mills have been considered to cover the whole spectrum of this sector. It must be highlighted that although there are studies regarding PV Rooftops in olive mills can be found, they only consider direct self-consumption [44], and the study is only focused on a determined olive mill. For the analysis of the potential of PV Rooftop systems with batteries, the iso self-consumption and iso self-sufficiency curves have been used to evaluate the matching between the generation and consumption profiles considering either direct self-consumption or the use of BEES [45]. Direct self-consumption analysis has been made, taking into account not only global self-sufficiency but self-sufficiency in solar hours [46]. In this way, the suit of PV Rooftops have been analysed with or without BEES in olive mills. Moreover, different scenarios are provided to take advantage of this type of system when facing energy consumption. It must be noted that in most cases, olive mills are located very near urban zones in rural areas, which would allow the use of collective PV Rooftops facilities via energy communities. This opens up new and profitable opportunities in these rural areas to access energy based on renewable sources, thus having a very positive impact not only on the environment but also on the olive mills’ economic activities as well.
Finally, the methodology provided here can be extended to any type of industry when analyzing the matching capability and suitability of PV Rooftops systems with or without BEES. Special attention must be paid to the consumption analysis given the wide variety of consumption profiles that already exist in the industrial sector. This fact demands an ad hoc analysis not only to properly assess the potential of PV Rooftops systems but also to provide a proper analysis of the PV array and BEES.
In order to approach this study, the article is arranged as follows: Section 2 offers an analisys of the methodology used in the study and the data required; Section 3 shows the results of the study and the discussion of these results when plotting the curves of self-consumption, self-sufficiency, and self-sufficiency in sunshine hours; finally, Section 4 presents the most relevant conclusions.

2. Materials and Methods

In this section, the materials and methods employed in this study are detailed with a particular focus on the description of the industries under analysis, together with their monitored electricity consumption data. Figure 1 summarizes the different stages of the study, identifying each phase of the proposed methodology. This methodological approach aims to provide an understanding of the factors influencing the energy consumption of these industries and their potential for incorporating rooftop PV systems with batteries.

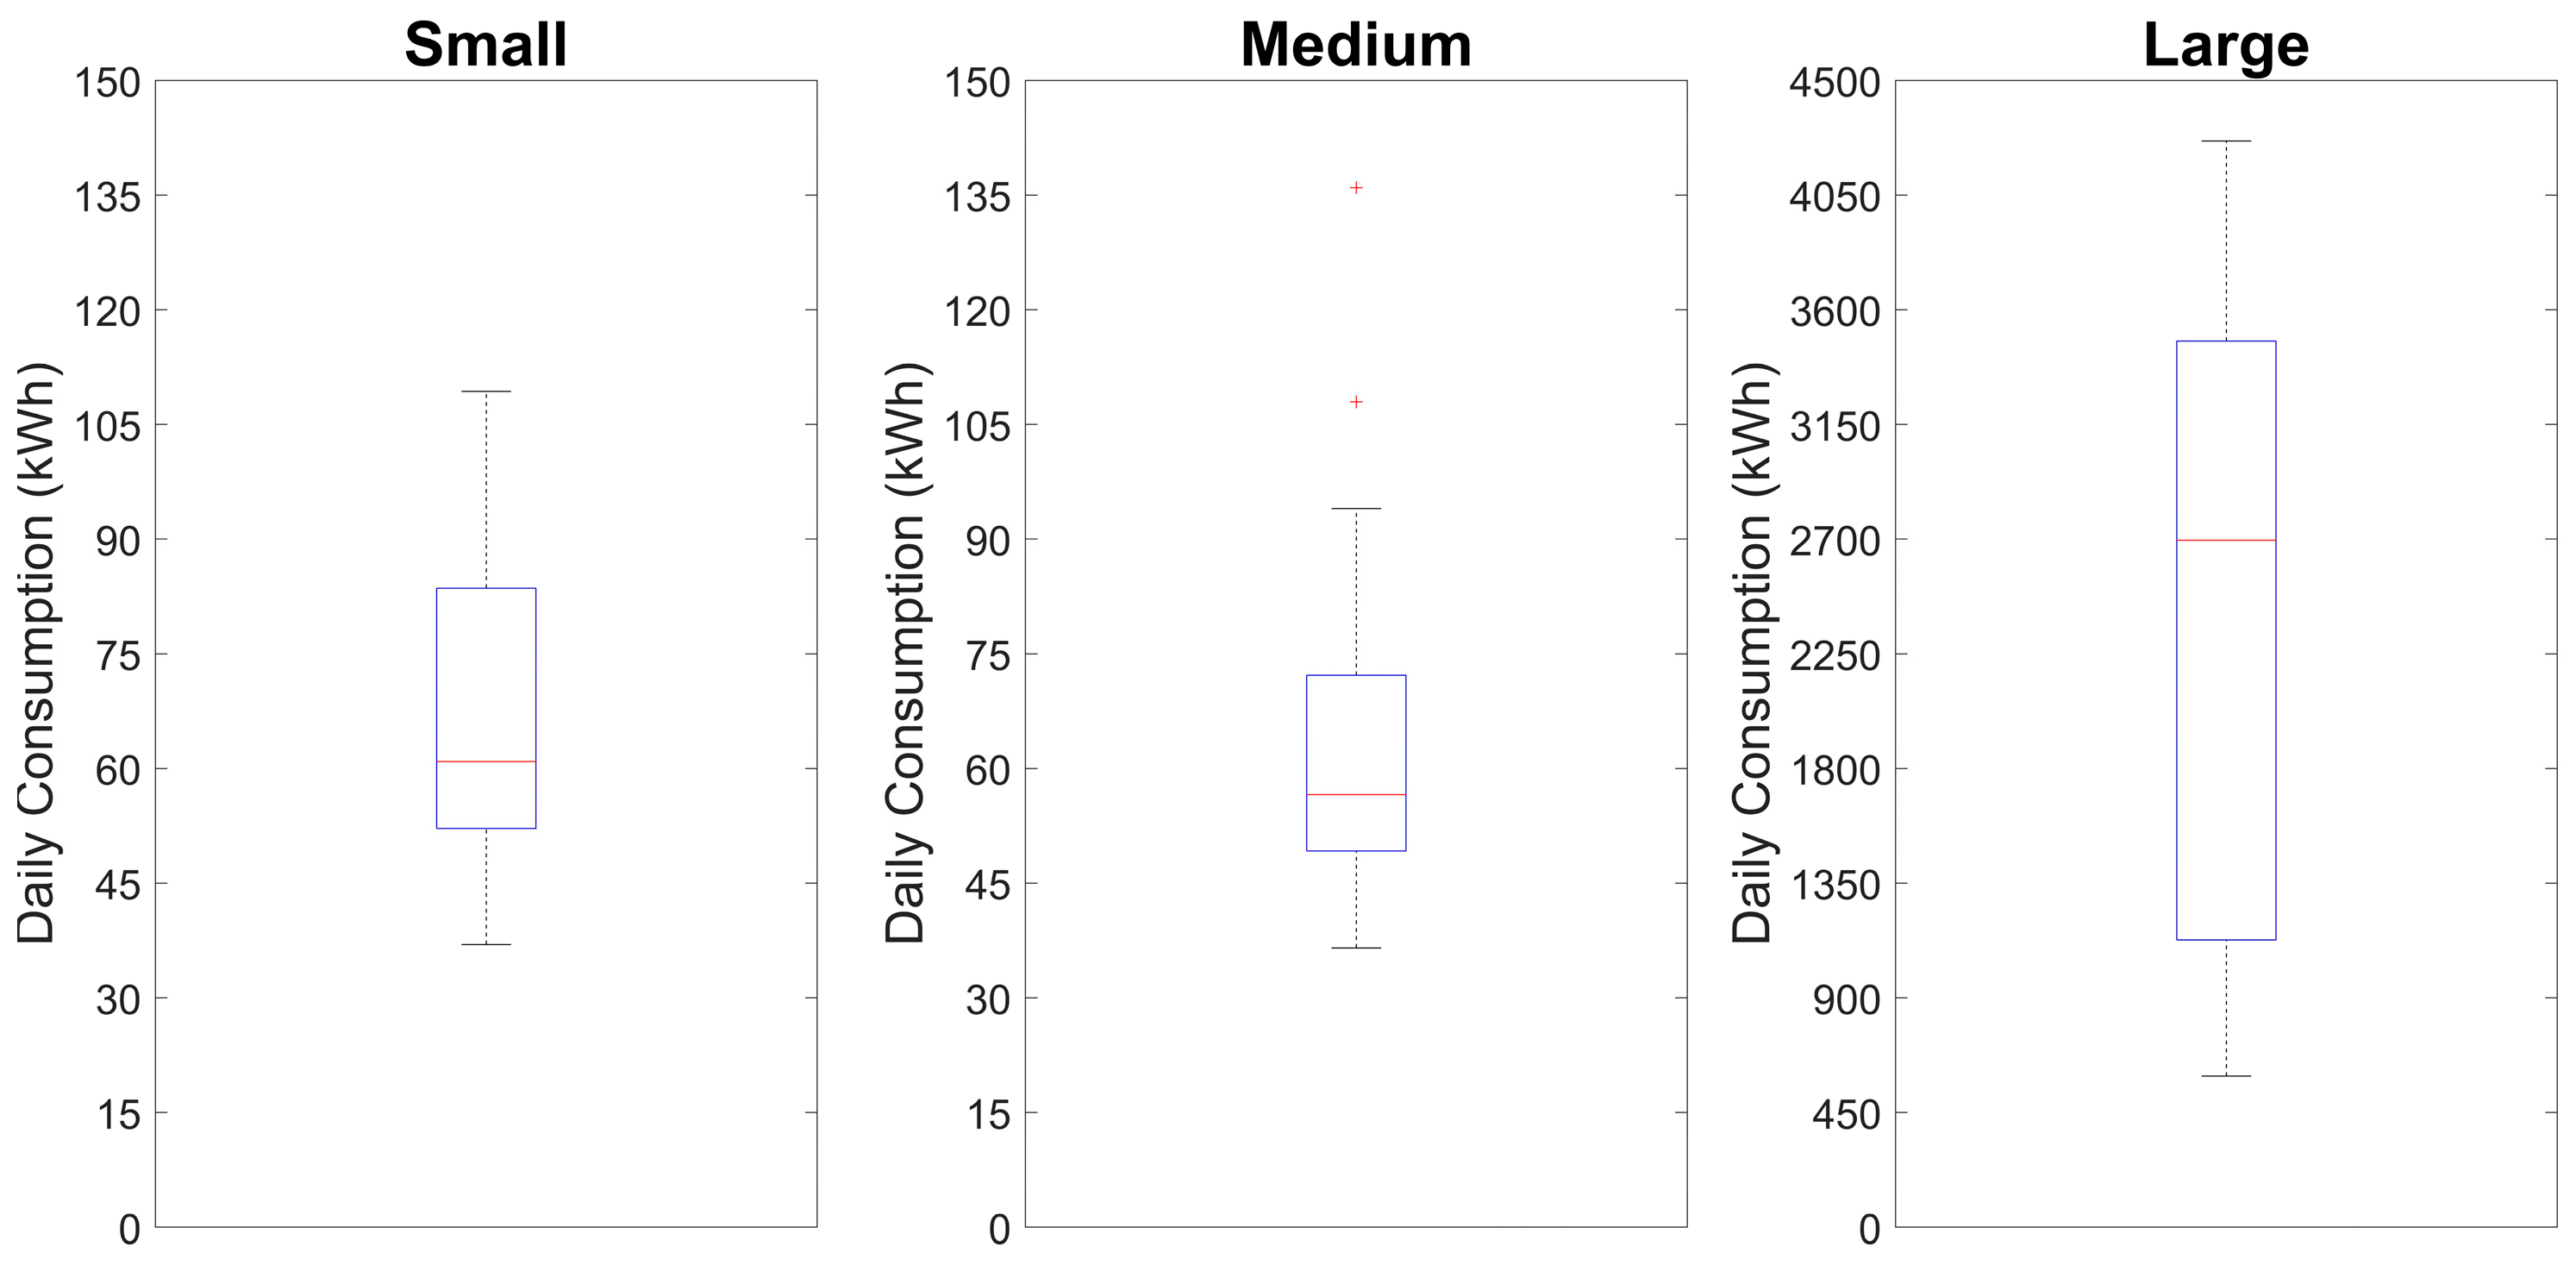
2.1. Description of the Industries

Olive oil mills play a crucial role in Spain, making the country the largest producer of olive oil in the European Union and a crucial part of its economy [47]. According to the Olive Oil Market Information System (SIMO) managed by the Ministry of Agriculture, Fisheries and Food (MAPA), Andalusian cooperatives play an essential role in the production of olive oil in Spain, being responsible for the production of 80% of the country’s total oil production [48]. These mills are a significant part of the industrial framework in Andalusia, accounting for 35.8% of the food sector turnover in the region, which underlines their relevance in this region. Moreover, these industries are scattered throughout the region, from the largest urban areas to the most remote rural areas [49].
These industries, due to the fact that, in most cases, they are located in rural areas, may have favorable access to renewable energy sources, such as solar, wind, hydro, and biomass, among others [50,51]. In rural areas, in fact, the population’s options for remaining in these areas are highly conditioned by the evolution of this productive sector [50]. The new distributed generation technologies, on a medium and small scale, can help to avoid the complete reliance of these industries on an energy supply that, until now, has had a high environmental impact [52]. A clear example is the energy communities, which are regulated by Royal Decree 244/2019 [53]. It establishes that in order to connect collective self-consumption facilities, generation and consumption must be connected at a distance less than 500 m from each other. In the particular case of photovoltaic facilities, this distance may be up to 2000 m. In most cases, in rural areas, the olive mills are integrated very close to the urban center, which would allow the use of this consumption option. This opens up new and profitable opportunities to access energy based on renewable sources in olive oil mills, thus having a very positive impact on the environment and on their economic activities. In Andalusia, due to the high level of solar irradiation available throughout the year (avg.: 5.11 kWh/m2/day [54]), PV Rooftop systems can be considered to be a potential energy solution to cover part of the electricity consumption of olive oil mills, as well as being an alternative technical solution to face challenges such as the reduction in GHG and the use of renewable energies in these industries.
The electrical energy consumed by oil mills can be characterized by two periods: a first period in which the mill is producing oil, called the harvest period, and a second period in which no oil is produced, called the off-harvest period. During the first period, in this type of industry, electricity consumption is mainly related to the processes of cleaning the fruit (conveyor belts, bar screens, washing machines, motors, etc.) and milling (mills and centrifugal pumps). In addition to the phases of the fruit cleaning process, the “horizontal technologies” installed in the mill, such as offices, lighting, and air conditioning, also consume electricity. Air conditioning consumption is significant because it enables the ambient temperature of the cellar to be maintained between 15 °C and 20 °C, thus preserving the properties of the oil until it is sold. Therefore, there is energy consumption throughout the year due to auxiliary needs, such as air compressors, computer systems, lighting systems, etc. However, there is some equipment that is only used during the harvest period and is used in several stages of the olive oil production process, such as cleaning and crushing of the olives.
The amount of olive oil production is the first factor that can be directly related to the electrical energy consumption of the mill. In this way, there is a proposed classification [43] that considers large mills as those with an annual production of more than 5000 tons and an average annual electricity consumption equal to or greater than 1000 MWh; on the other hand, medium mills are those with a production between 1000 and 5000 tons and an average consumption between 500 and 1000 MWh; and finally, small mills are those with a production of less than 1000 tons and an electricity consumption less than 500 MWh.
The following subsections describe the data acquisition used and the characteristics of the electrical energy consumption of the olive mills under study during one year of operation.

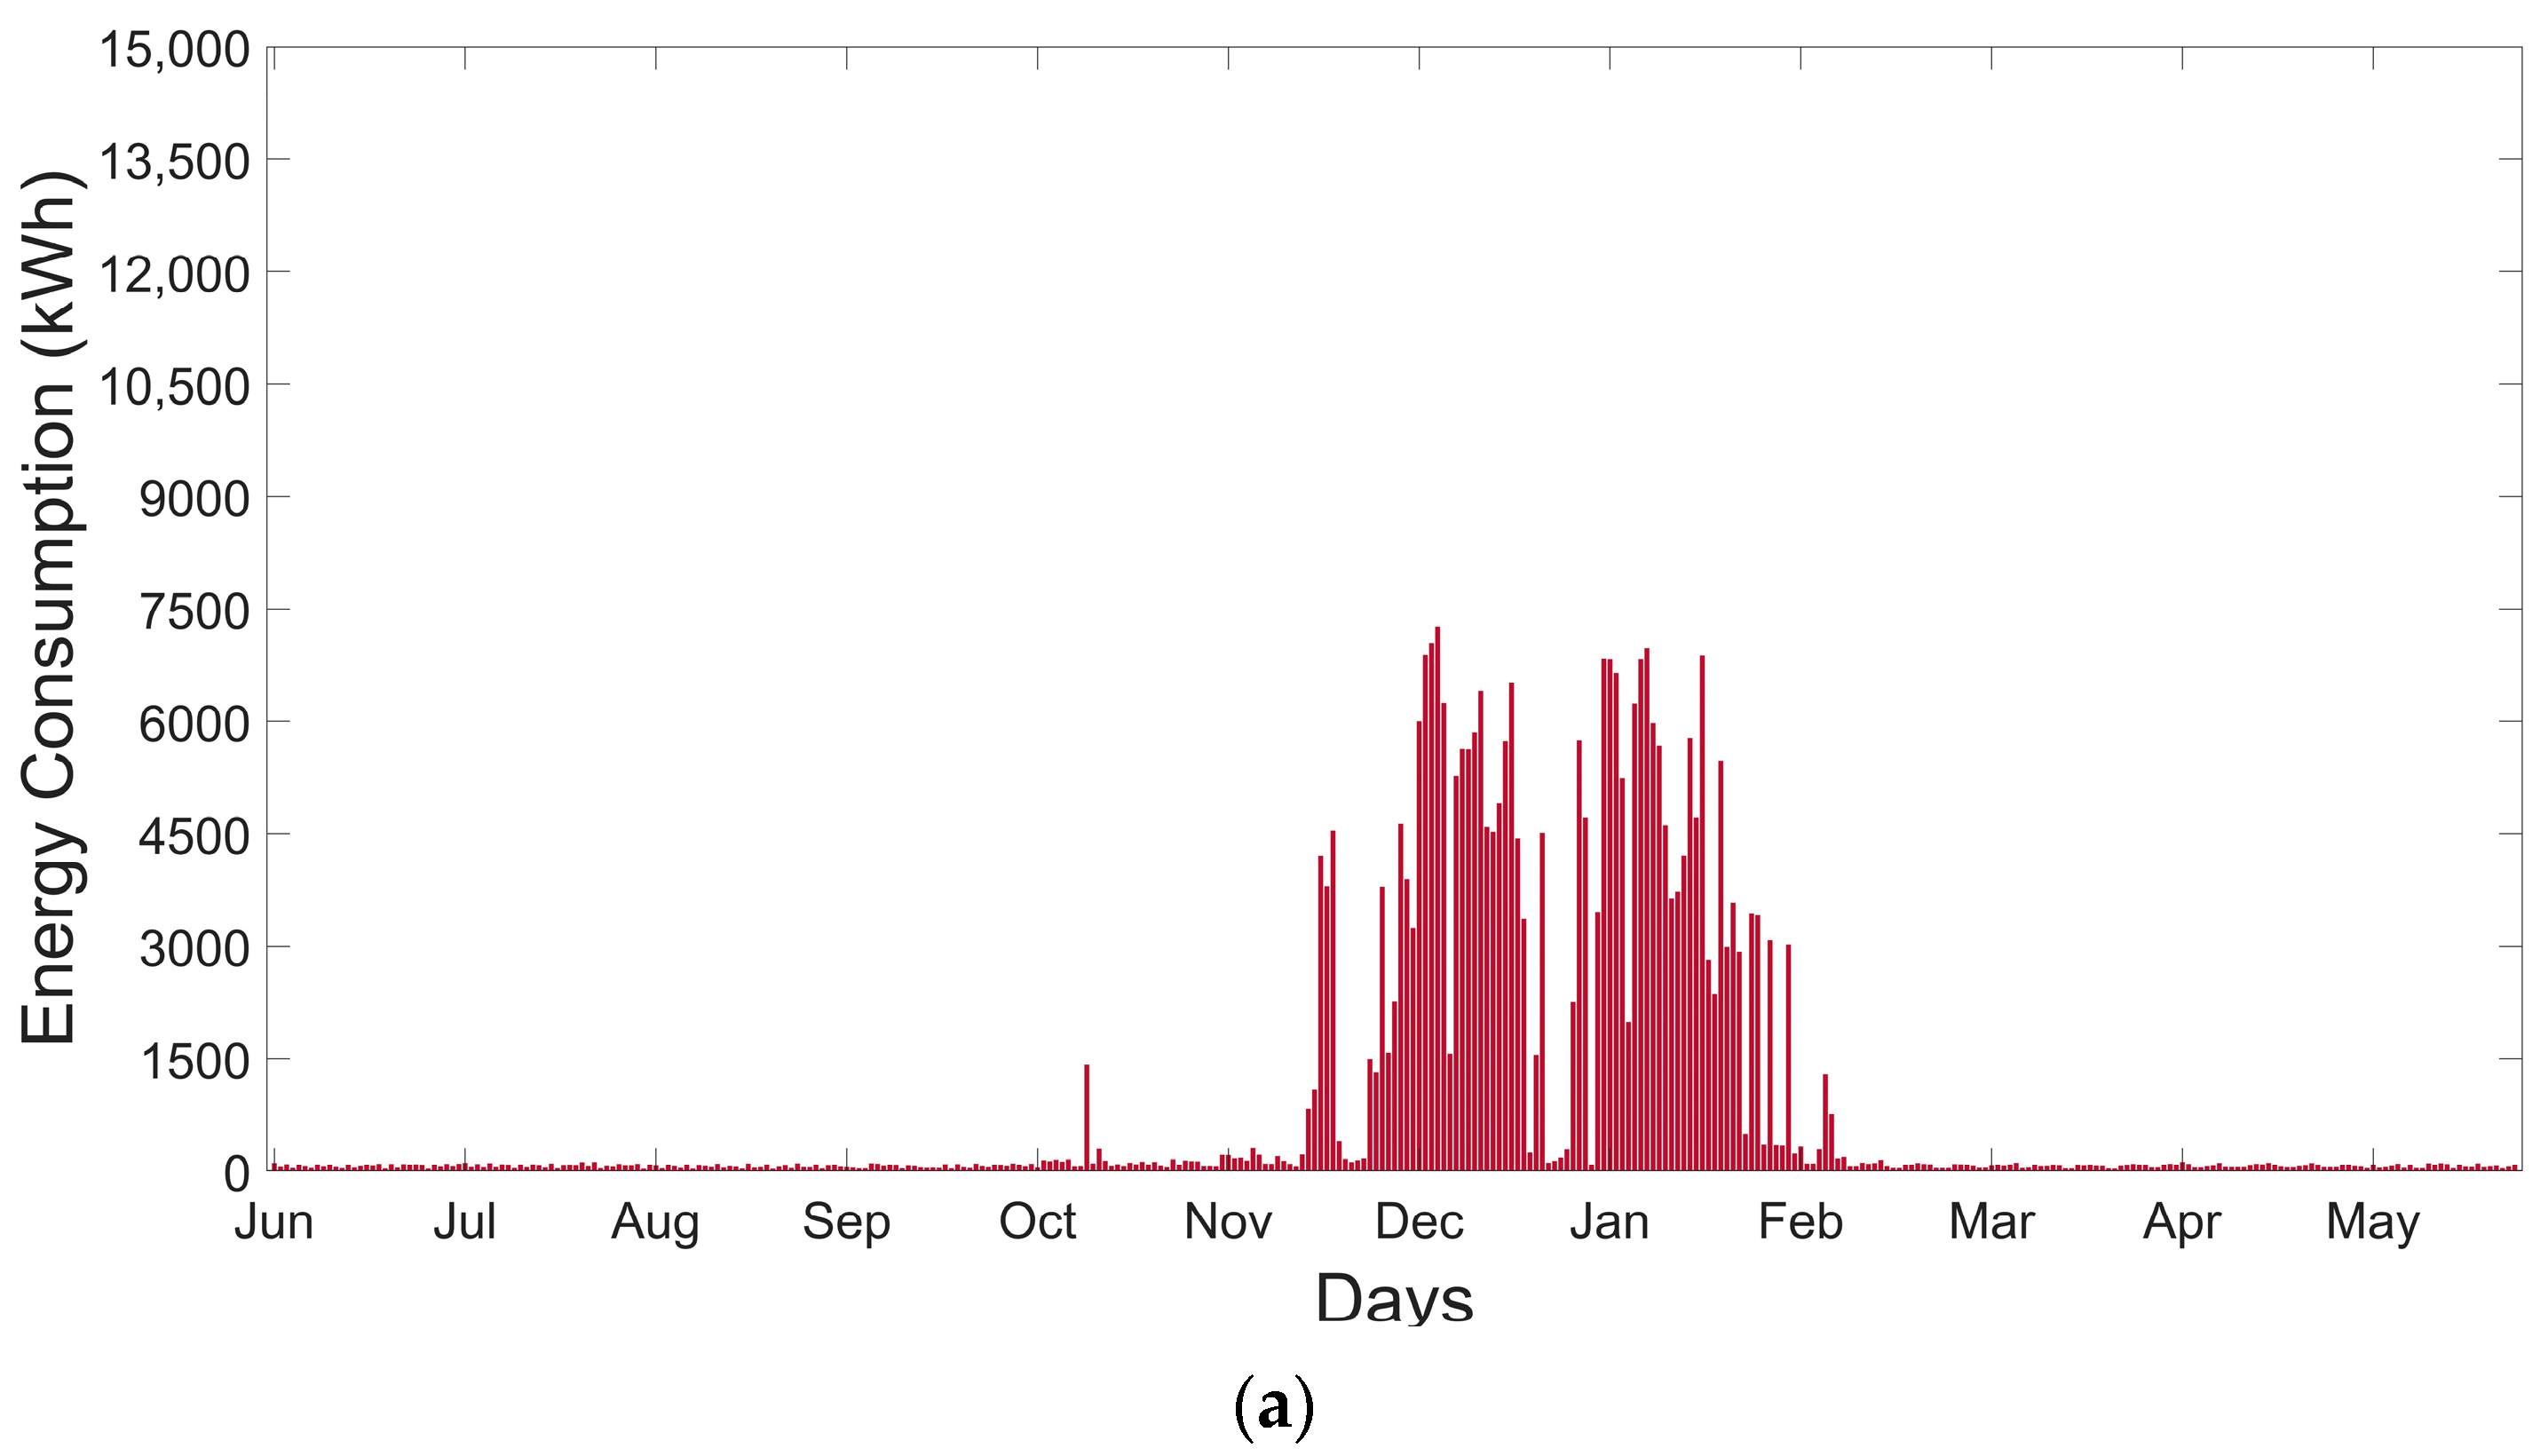
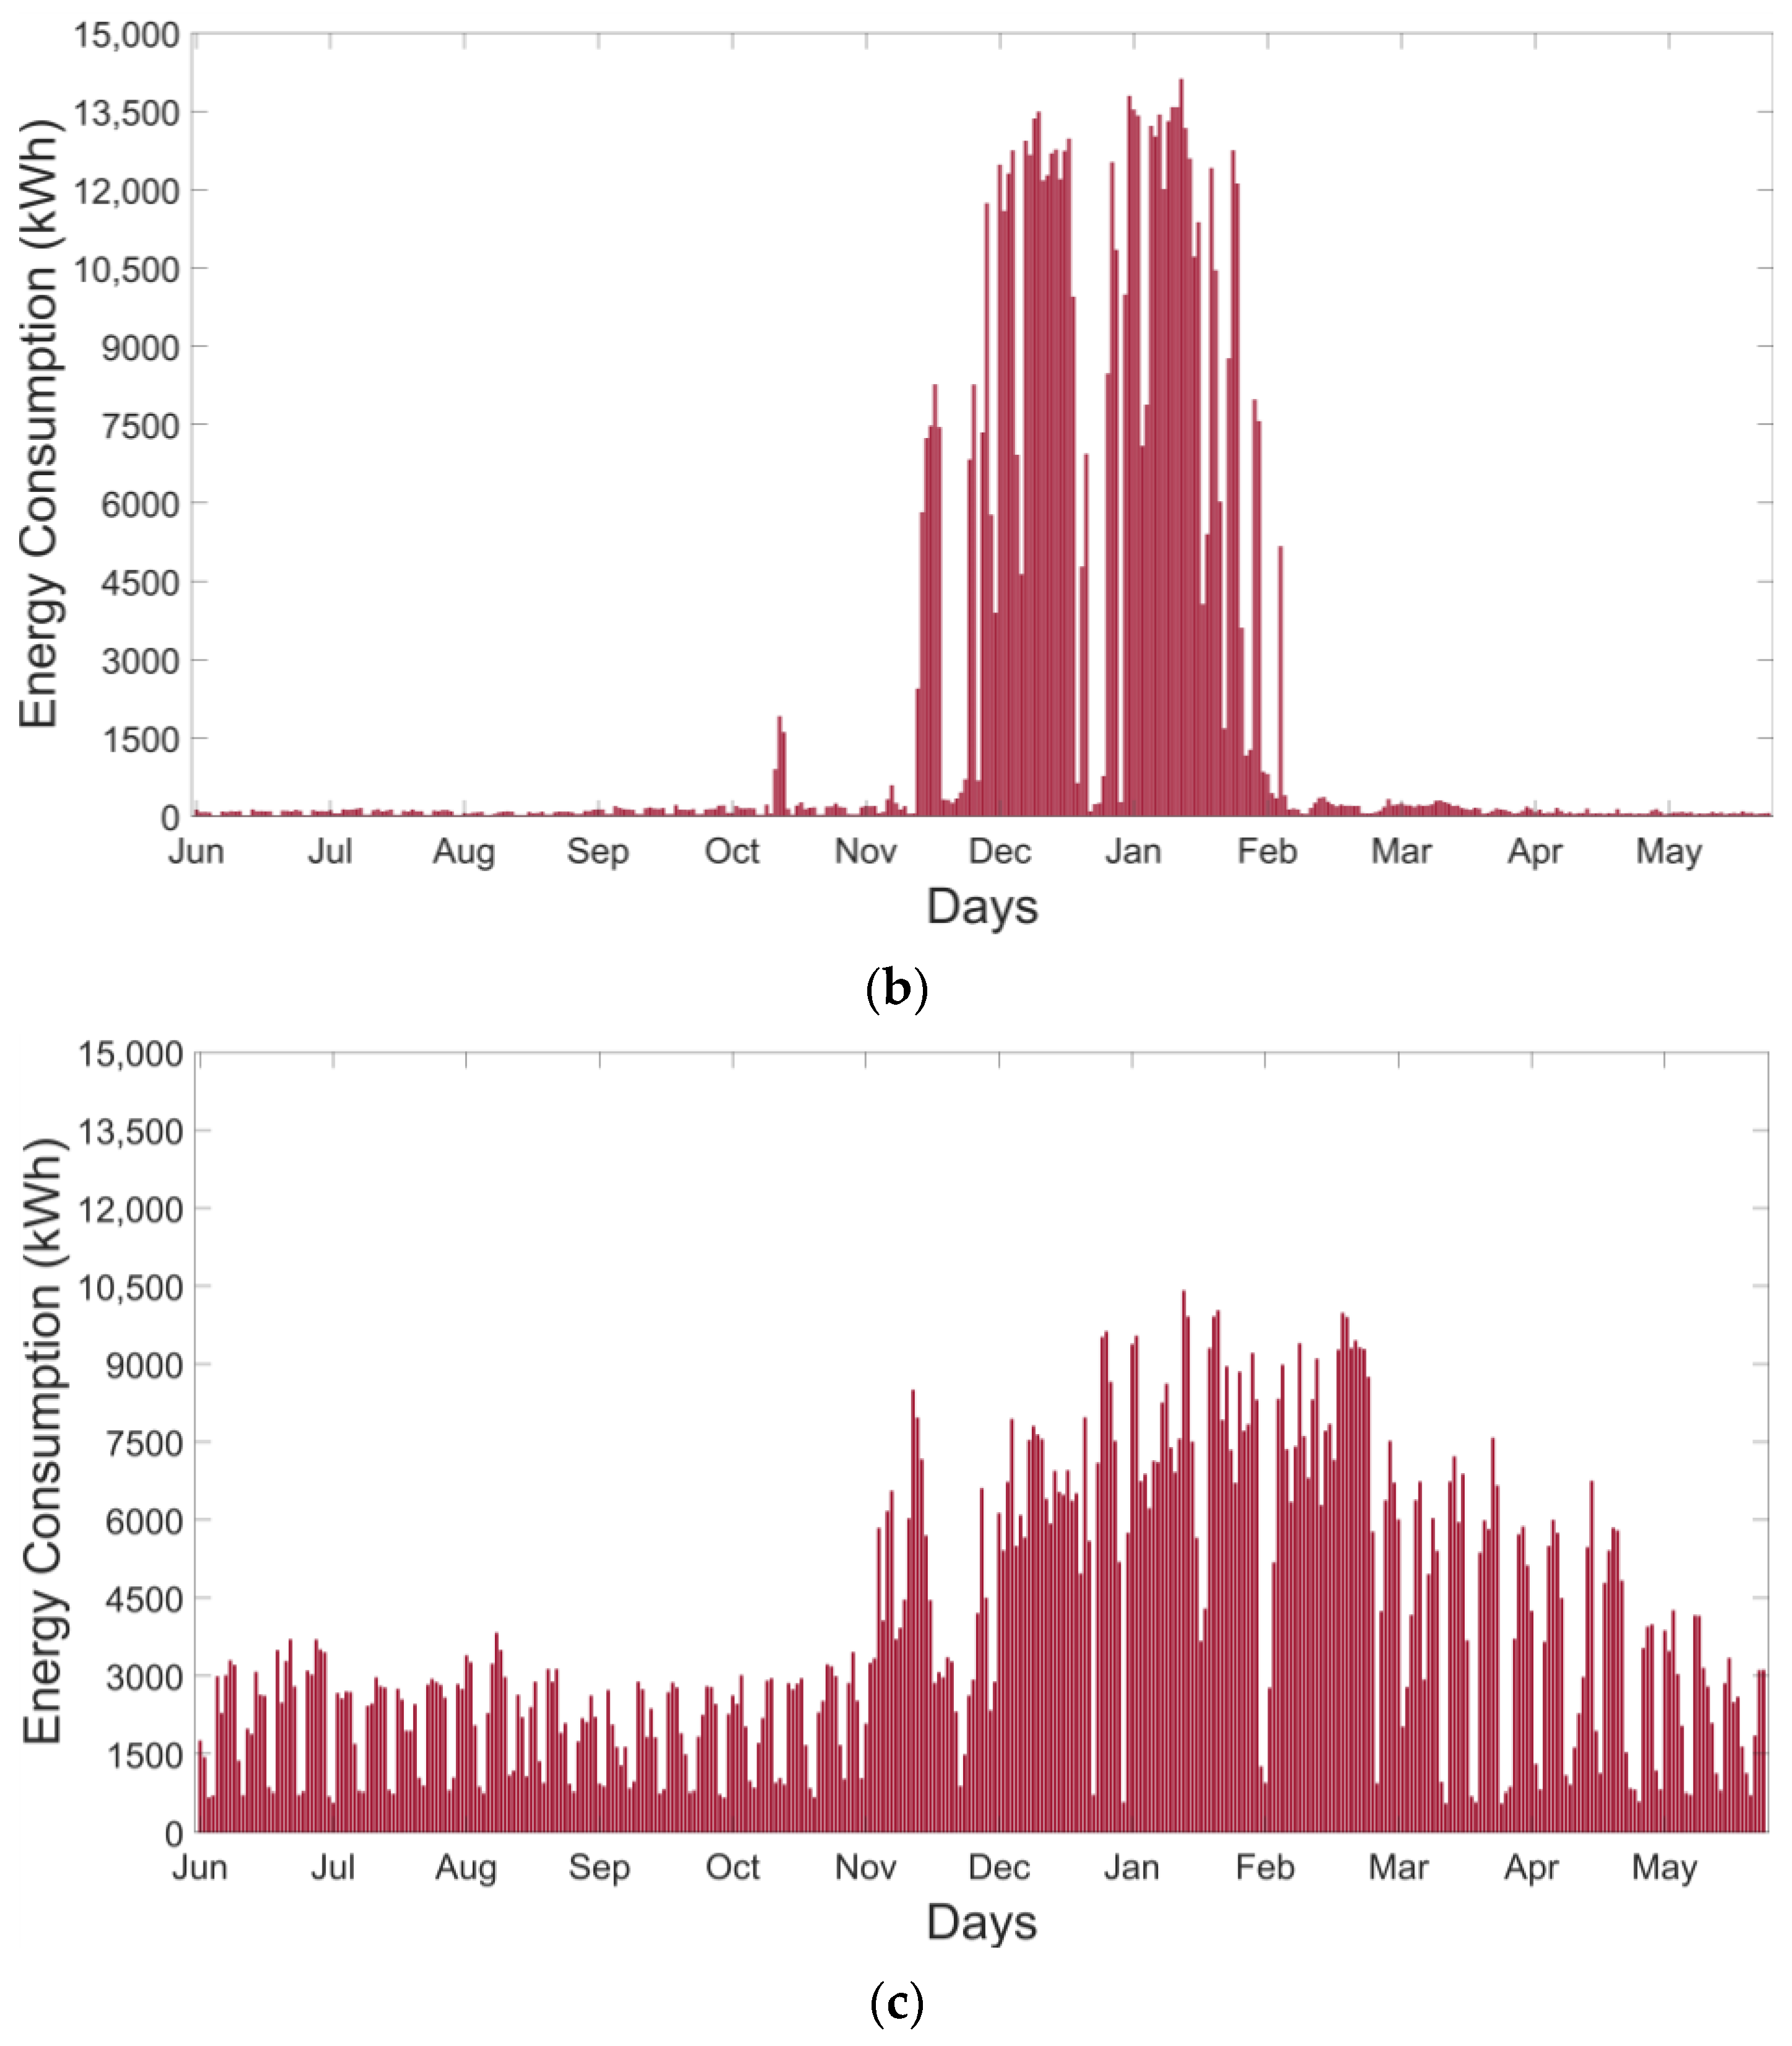
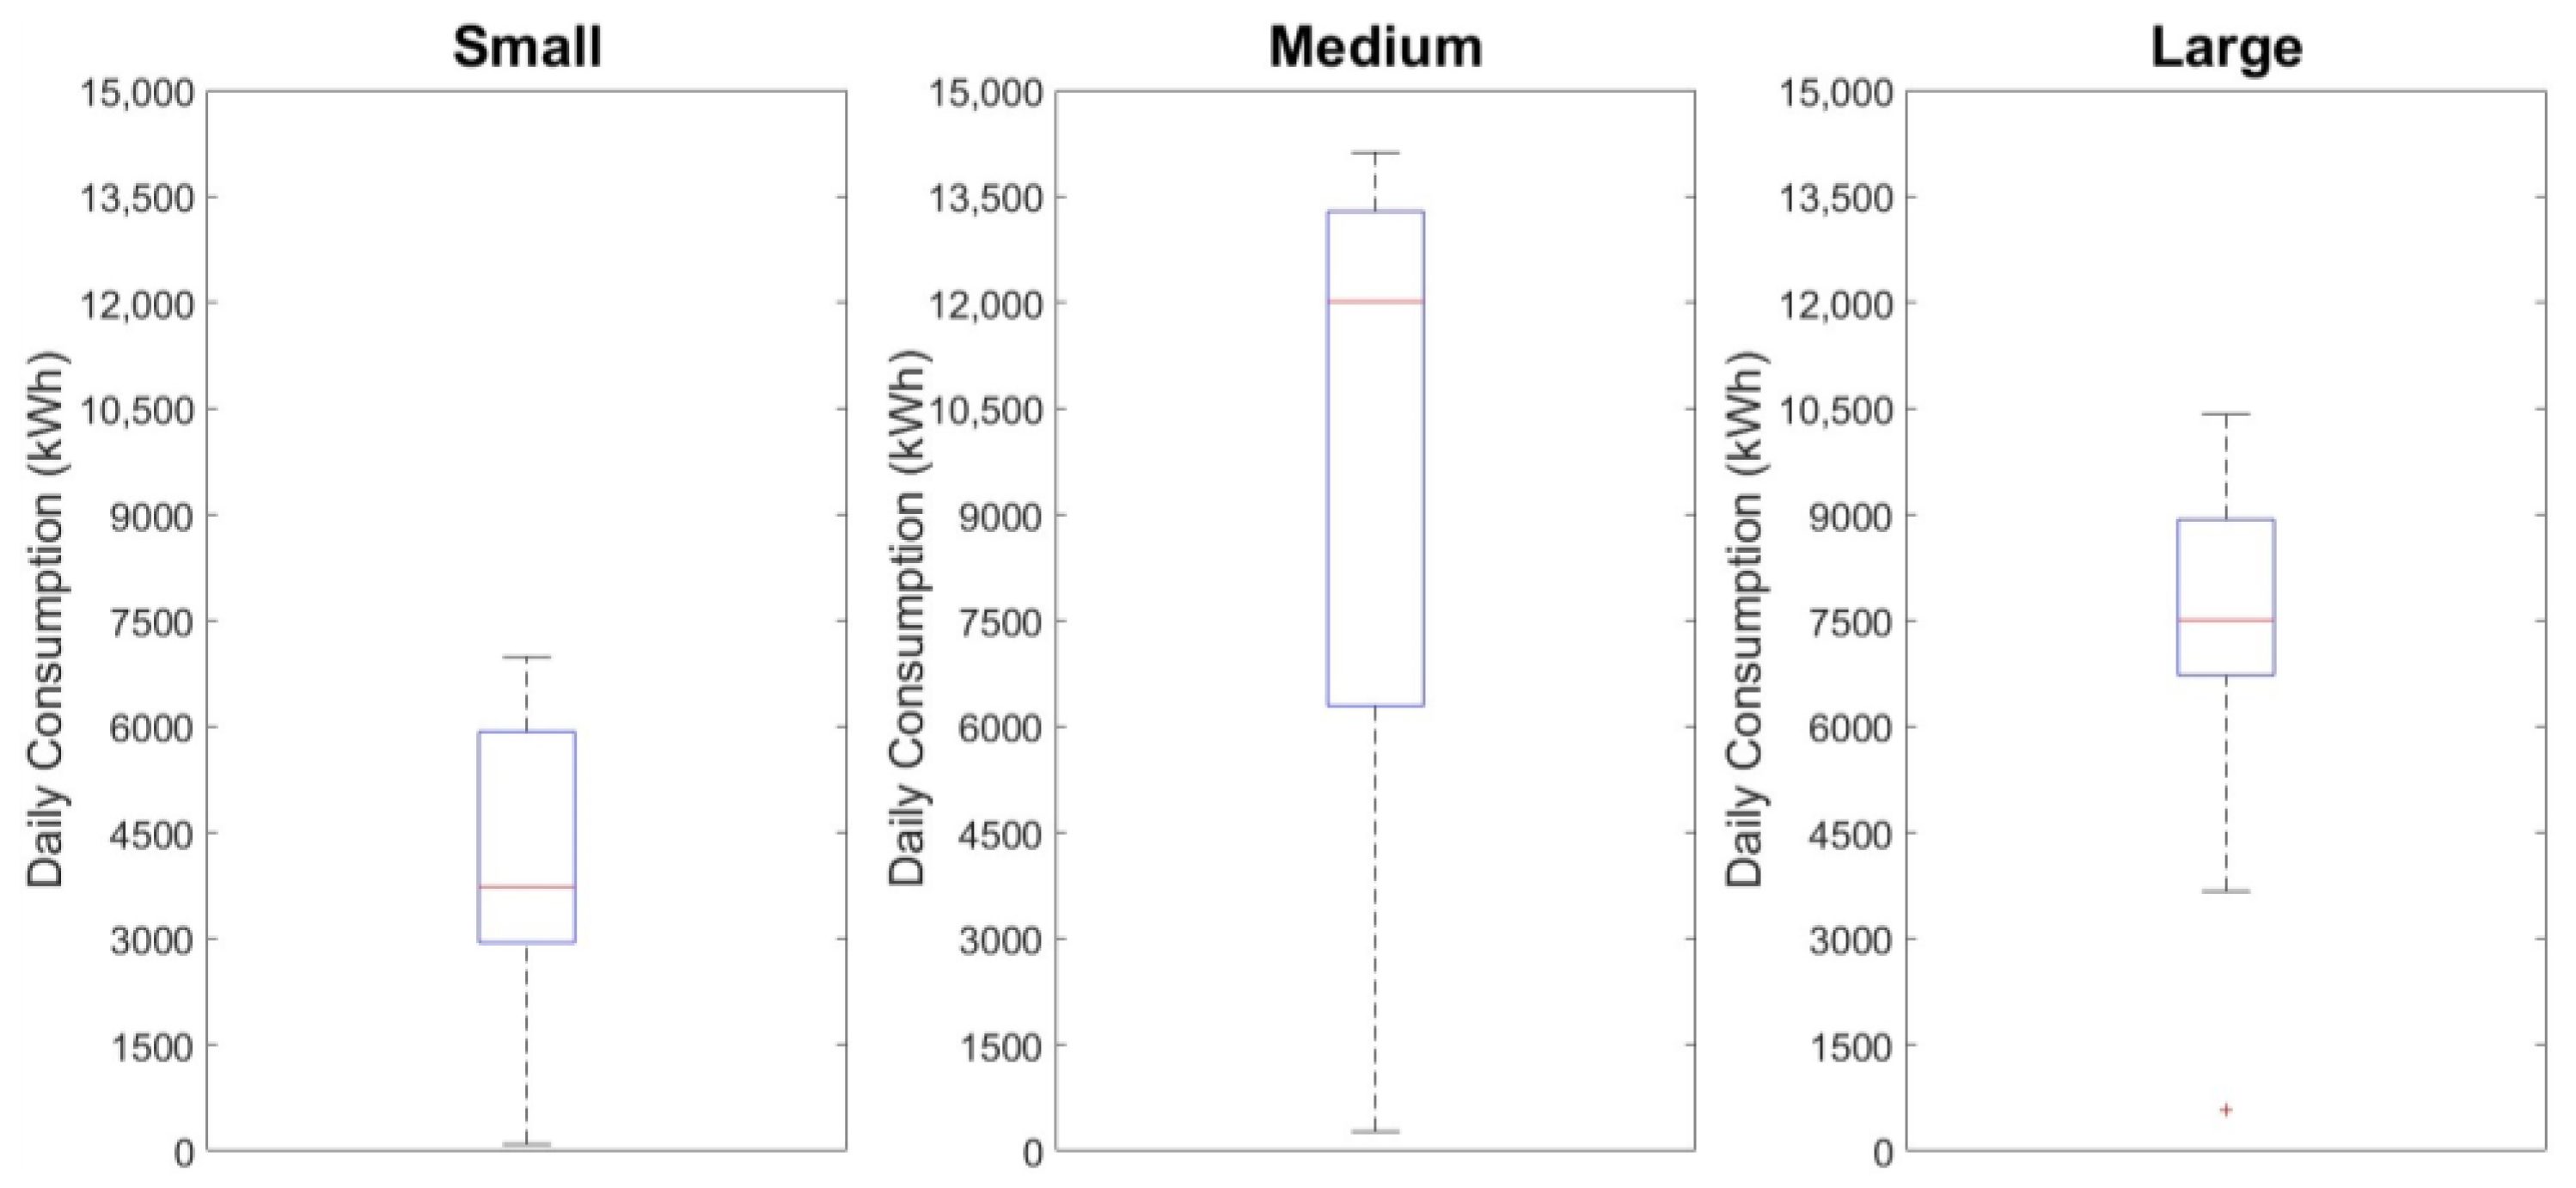
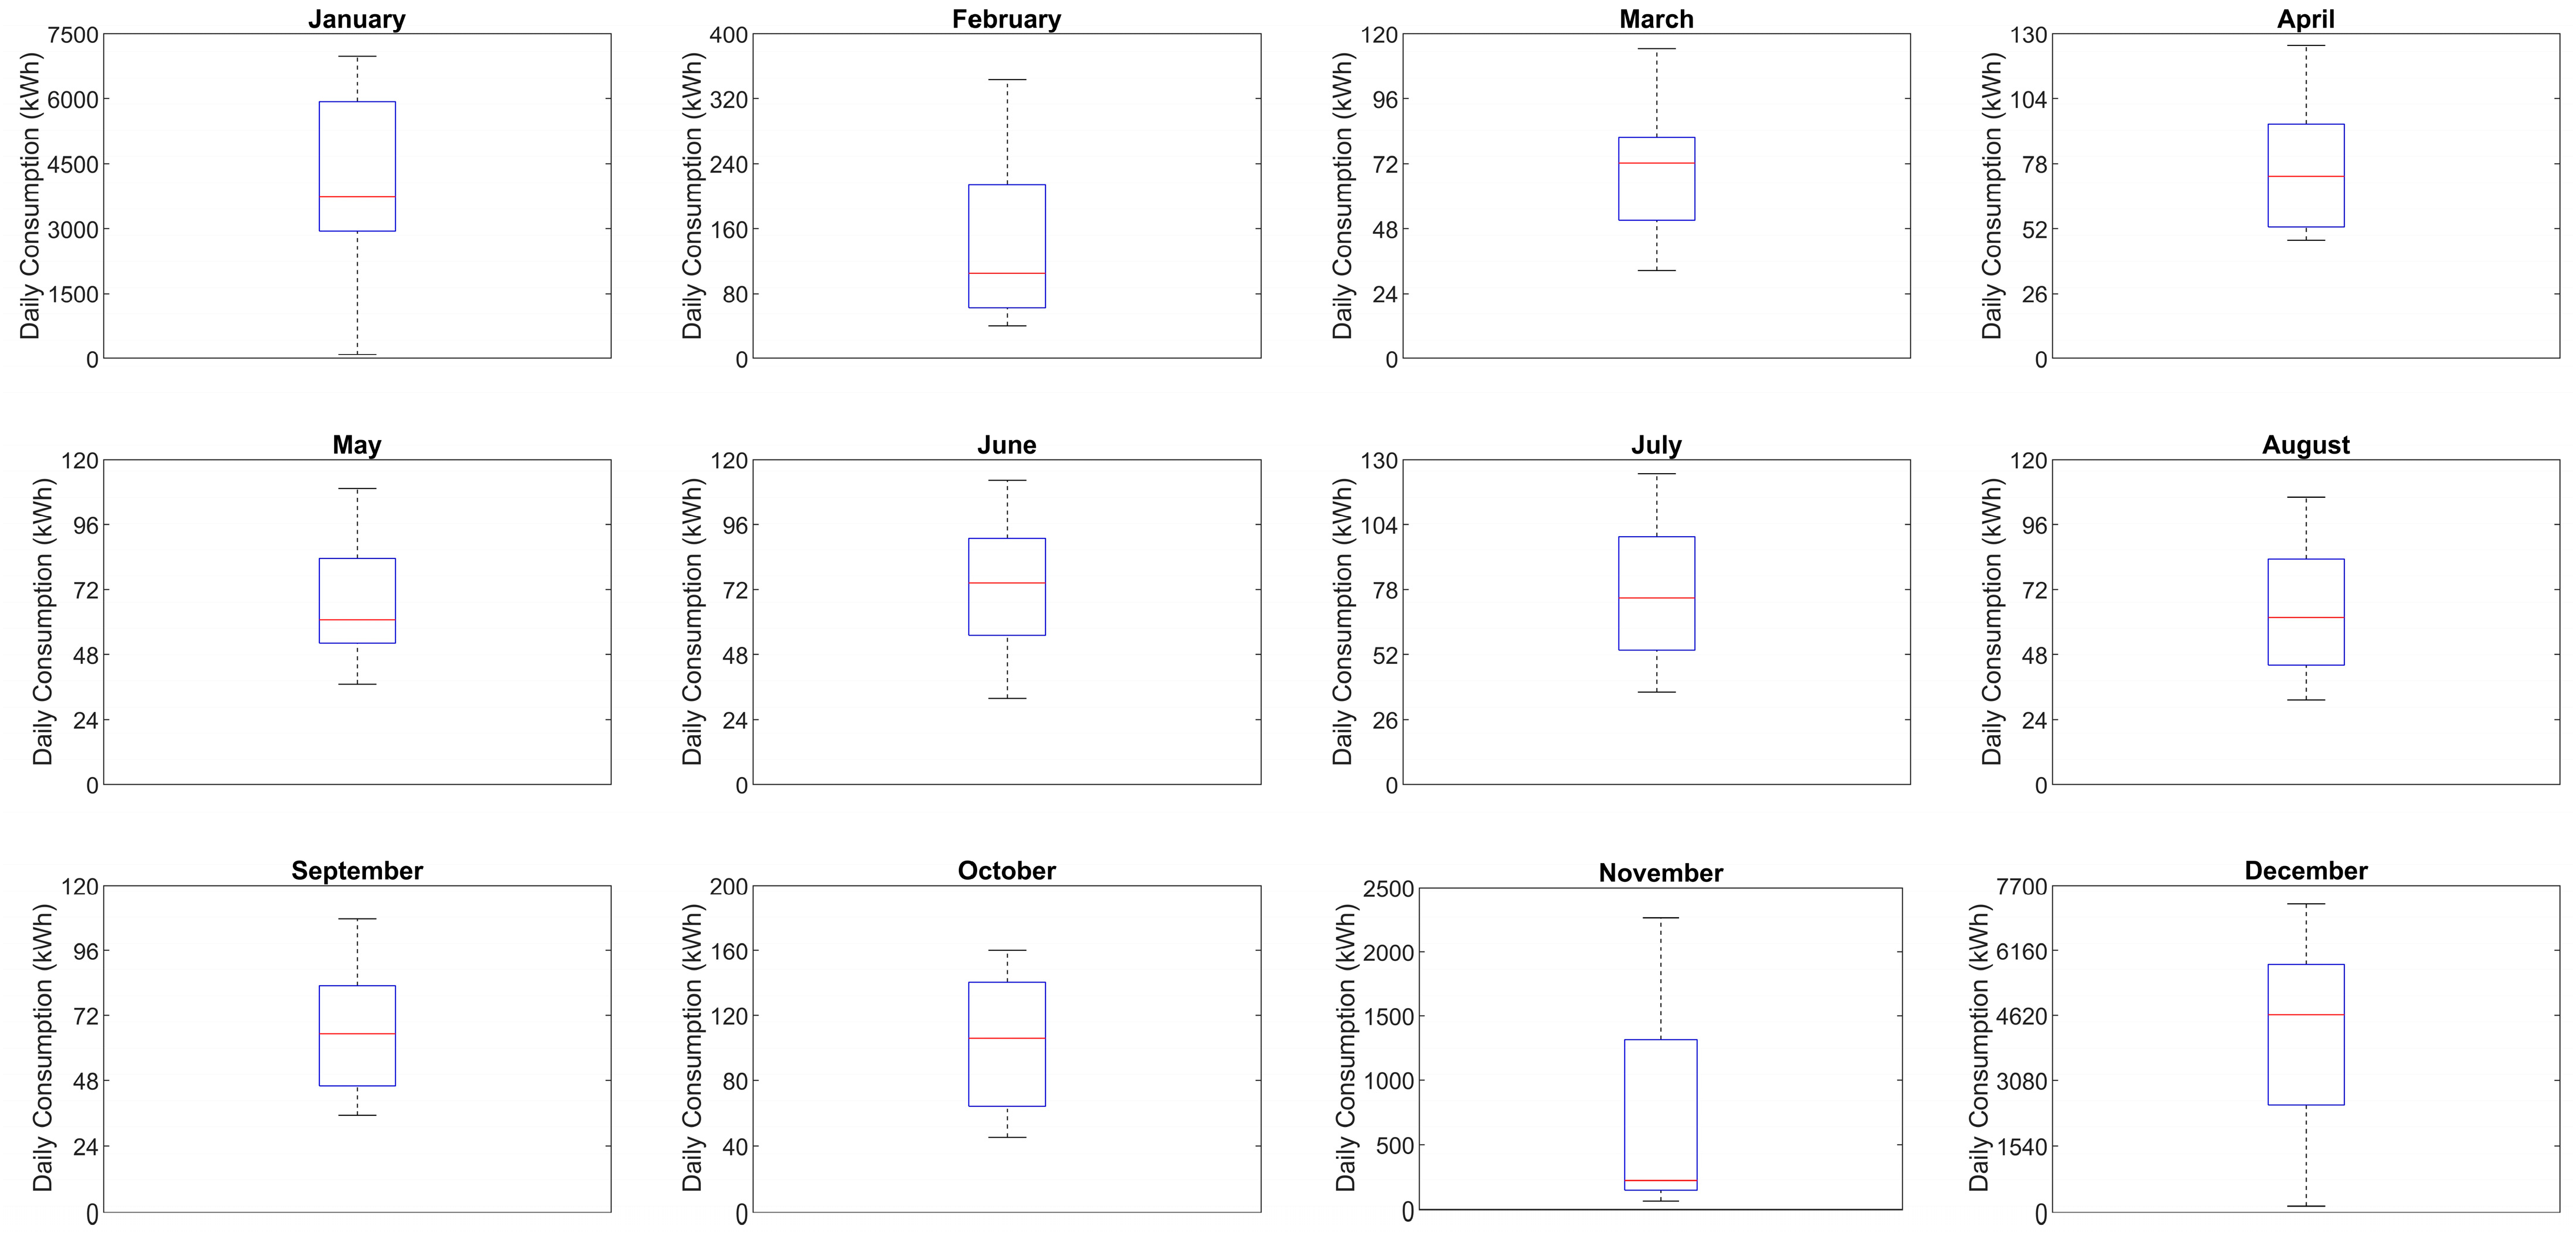
Monitoring and Characterization of the Electricity Consumption of the Industries Analyzed

The data monitoring has been carried out using the smart electricity meter reading, which allows us to obtain the electrical power consumed every 60 min [55,56,57]. These devices made it possible to evaluate and record the electrical energy consumption efficiently, i.e., the energy flowing from the electrical network to the user’s installation (consumption). Moreover, in the absence of sensors, it is possible to use databases to obtain solar radiation and ambient temperatures, such as the NASA database, Meteonorm, or even the Andalusian Energy Agency for local data. In this case, the global solar irradiation database, PVGIS, was used to obtain these parameters [58]. Power consumption has been monitored over a year, showing a complete operating cycle, and the processes carried out in this industry such as oil production, bottlingor storage have been visualized.
Table 1 shows the size category of each olive mill under study.
According to the above-mentioned olive oil production classification criteria, olive mill 1 is considered small, olive mill 2 is considered medium, and olive mill 3 is classified as large. The electricity consumed by these industries is obtained from the power grid. These energy consumptions can be divided into electrical and thermal. The two consumption periods mentioned above, harvest and non-harvest, make it necessary for most of these industries to have a different electricity tariff for each period of operation. The tariff associated with the off-harvest period is characterized by reduced power capacity since it is only necessary to supply electricity to the offices and cellars. At the beginning of the harvest period, the tariff is changed, and the electricity contract is made exclusively for the high electricity supply required for this period.
The first step to characterize the energy consumption of these industries is to identify their consumption profiles during a complete annual operating cycle. Figure 2 shows the daily accumulated energy consumption data for the entire year.
In Figure 2, the y-axis corresponds to energy consumption in kWh, and the x-axis corresponds to the day of the year. In this case, the months of the year have been indicated on the abscissa axis to show in a more comprehensive way how consumption evolves since these industries have clearly seasonal consumption. Two different consumption periods can be distinguished in these industries. Throughout the months that typically correspond to the olive harvesting season, which is the harvest period (December, January, February, and March), daily electricity consumption is significantly higher than the consumption that occurs during the off-season period. Likewise, during the same harvest period, consumption stands out in the months of December and January, while in the months of February and March, consumption decreases in small and medium olive mills.
It’s important to emphasize that the harvest period may vary depending on the weather conditions of the chosen year, as well as the characteristics of the olive mill itself, but it always follows this pattern of differentiated consumption in two periods. Therefore, it can be said that there is an irregular consumption structure [59].
Figure 2 shows the difference in production processes among the three types of olive mills. During the harvest period, peak consumption values were reached by all three olive mills, primarily due to the fruit cleaning and milling processes. However, the medium olive mill shows the highest consumption values. Nevertheless, when considering the annual total consumption, the small and medium-sized olive mills have a lower consumption than the large olive mill. This is because, in the large olive mill, in addition to fruit cleaning and milling, oil bottling processes take place, resulting in significantly higher consumption during the off-harvest period.
Table 2 shows the monthly electricity consumption. In addition, this table provides different ratios: the monthly energy consumption ( E L , m o n t h ) and the monthly consumption rate (MCR), which is the ratio between the energy consumed for a complete month compared to the annual energy consumption ( E L , y e a r ):
M C R = M o n t h l y   e n e r g y   c o n s u m p t i o n A n n u a l   e n e r g y   c o n s u m p t i o n = E L , m o n t h E L , y e a r · 100
Figure 2 clearly shows the two operating periods graphically, but the MCR parameter is used to quantify in a simple way the relative weight of each month in the complete operating cycle and to evaluate the greater or lesser homogeneity in cumulative consumption.
Electricity consumption differs widely from one month to another among the three olive mills. In December, there was an extremely high consumption for every olive mill, while in April and May, the consumption was considerably lower. Large olive mills had similar electricity consumption in most periods, but small and medium olive mills usually consume less during the off-harvest period. It shows how the relative contribution of each month to the total annual consumption of small and medium olive mills is concentrated in months corresponding to the harvest period (November, December, and January). For example, December represents more than 40% of the total annual consumption in these olive mills. These data, together with their graphical representation, are useful to identify and evaluate electricity consumption throughout the year and to compare consumption between the different types of olive mills.
The characteristics of the two representative periods of these industries can be seen in Figure 3 and Figure 4 where a comparative analysis of the distribution of daily energy consumption is carried out. In this case, the daily energy consumption for a month within the harvest period (January) and another within the off-harvest period (May). This tool provides information about the data dispersion as well as the median (red horizontal line) and the interquartile range (IQR), which is represented within a boxplot containing values between the first quartile (25%) and the third quartile (75%), Outliers are represented by the symbol “+”, effectively visualizing the distribution of numerical data for each of the olive mill energy consumptions.
In this case, during the month within the harvest period (January), it was observed that the data consumption asymmetry was greater for small and the medium olive mills, where medium olive mill showed the greatest one. In contrast, a large olive mill was characterized by having reduced asymmetry. It can be inferred that the dispersion of consumption values for small and large olive mills is lower than for medium olive mills. The origin of this high dispersion for medium olive mills may be attributed to their high raw material (olive) processing capacity, which is greatly affected by the variability in the raw material income. On the other hand, small and large olive mills are less affected, possibly due to their lower processing capacity. However, the large olive mills have higher annual consumption. During this month, 50% of the daily consumption for the small olive mills fell between 3000 and 6000 kWh, between 6200 and 13,400 kWh for the medium olive mills, and between 7000 and 9000 kWh for the large olive mills.
The month of May, corresponding to the off-harvest period, was chosen to characterize the energy consumption for this period. Figure 4 displays the corresponding box plot for the three olive mills under study.
In this case, in order to observe the consumption distribution of the large olive mill, it was necessary to adjust the scale range. As previously mentioned, this industry has significant electricity consumption due to the bottling activity. An important factor is the high similarity in the median value between small and medium olive mills, approximately 60 kWh, although the asymmetry in small olive mills is greater. These figures indicate that, in these industries, there are not only differences in the energy consumption profiles between the harvest and off-harvest periods but also notable differences within each size category during these periods. During the harvest period, the medium olive mill showed the highest variability in daily consumption, whereas, during the off-harvest period, the consumption of the small and medium olive mills was very similar since only the office and the equipment that keeps the temperature of the cellar where the oil is stored were in use active. The charts and for each month and olive mill category can be found in Appendix A.
However, it is important to know not only the cumulative daily consumption values over a year but it should be also considered the daily consumption profiles. Figure 5 and Figure 6 show the electricity consumption profiles of small and medium olive mills, respectively, during typical days corresponding to the harvest and off-harvest periods. Thus, between a harvest day and an off-harvest day, the consumption profiles showed clearly well-differentiated patterns.
It can be seen that, for both small and medium olive mills, during the harvest period. As seen in Figure 5a and Figure 6a, the daily consumption for both the small and medium olive mills during the harvest period showed low variability throughout the day, which is more pronounced during sunshine hours. The small olive mill showed an average consumption of 240 kW, with power peaks from midday to the end of the afternoon reaching a maximum of 317 kW, which corresponds mainly to energy needs due to the olive cleaning and transport processes. The same applies to the medium olive mill, although it reached an average consumption of 550 kW and peaks of up to 650 kW. In both figures, the consumption profile of a day in the off-harvest period was included with a different background scale in order to observe the electricity consumption in that period, Figure 5b and Figure 6b. It observed during sunshine hours when generation is at its maximum, consumption was higher.
In this case, during the off-harvest period, the highest consumption took place during office hours, between 9 am and 2 pm, with an average power of 4.7 kW and 6 kW, with a maximum of 9.9 kW and 14.4 kW, corresponding to the hottest hours when refrigeration was activated for the small and medium olive mills, respectively. In these olive mills, power consumption during the harvest period was between forty and fifty times higher than power consumption during the off-harvest period. Both the harvest and off-harvest periods showed an increased consumption during sunshine hours. This characteristic can facilitate the matching between the generation and consumption profiles in this type of industry. This behavior can also be seen for the large mill in Figure 7.
Regarding the large olive mill, and during the harvest period, Figure 7a, the daily power consumption also showed little variations throughout the day. An average consumption of 375 kW was reached, with a maximum of 440 kW. In this olive mill, during the off-harvest period, the highest consumption also occurred during office hours, between 7 am and 2 pm, with an average power consumption of 60 kW and a maximum of 120 kW. This olive mill, due to its particular production processes, did not show as significant a difference between the two periods as the small and medium olive mills.

2.2. Photovoltaic Generator and Storage Systems—Modeling and Analysis Parameters

2.2.1. Photovoltaic Generator

To assess the suitability of PV Rooftop system in olive mills, it has proved necessary to consider a mathematical procedure that, for certain meteorological conditions obtained from databases (solar radiation and ambient temperature), calculates the power obtained from the photovoltaic generator. There are a wide variety of methods to estimate the power output of a photovoltaic generator [60]. Among them, it has been selected a method that offers a compromise between simplicity and accuracy and that has been used in several scientific studies [61,62,63,64,65]. This approach is based on calculating the DC power obtained at the generator output by applying the Osterwald method:
P P V , D C = P 0 · G I G S T C · 1 + γ · T c T c , S T C
where P 0 is the nominal power of the generator under STC (W), G I the effective irradiance incident on the generator in-plane, and G S T C is the standard reference irradiance of the system (STC, radiation 1000 W/m2 and cell temperature of 25 °C). On the other hand, γ represents the temperature power coefficient, and T c is the cell temperature at standard conditions, which is dependent on the ambient temperature.
Then, to obtain the AC power output at the inverter, an overall loss factor of 15% has been considered to take into account losses due to inverter efficiency, wiring losses, mismatch, spectral losses, etc. [66,67]
These losses are introduced into the system performance ( η ).
P P V g e n = P 0 · G I G S T C · 1 + γ · T c 25 · η
In order to analyze the sizing of the photovoltaic generator, an algorithm was used to perform a wide scan of photovoltaic generator power in order to obtain the self-consumption and self-sufficiency curves together with the self-sufficiency in sunshine hours [46]. This last curve proved to be interesting the level of matching between the consumption and generation during the sunshine hours since these industries showed an increased consumption during that time. This scan starts with a 0.01 kWp photovoltaic generator and iterates with a step that depends on the system to be analyzed and the period of analysis (annual period, harvest period, and off-harvest period). These indices, self-consumption, self-sufficiency, and self-sufficiency in sunshine hours, are defined by Equations (4)–(6):
ϕ S C , d i r e c t = E P V c o n , τ E P V g e n , τ
ϕ S S , d i r e c t = E P V c o n , τ E L , τ
ϕ S S S H , d i r e c t = E P V c o n , τ E L S H , τ
The self-consumption index ( ϕ S C ) is the ratio between self-consumed photovoltaic electricity in the industry ( E P V c o n , τ ) and the electric energy generated by the photovoltaic system ( E P V g e n , τ ) . On the other hand, the self-sufficiency index ( ϕ S S ) provides the percentage of the energy consumption ( E L ) that is covered by the generated photovoltaic energy. The self-sufficiency index in sunshine hours ( ϕ S S S H ) provides the self-sufficiency of the olive mill industry when the PV Rooftop system is operating from sunrise to sunset and illustrates the ratio of power consumption during sunshine hours ( E L S H , τ ) that is covered from the energy provided by the PV Rooftop system ( E P V c o n , τ ) [46,68,69].

2.2.2. Storage System

Due to the irregular consumption of these industries, and in order to increase and optimize the self-sufficiency in these industries, it is proposed to analyze not only the PV generator but also the impact of incorporating a storage system. For this purpose, a simplified battery charge algorithm is used to maximize self-consumption [70,71]. Moreover, the battery model assumes that the battery does not self-discharge and that the charge and discharge efficiencies of the battery was equal and constant [72]. At the same time, and taking into account the state of charge, when PV generation exceeds industry consumption, the battery is charged and discharged when consumption exceeds generation. If there is a photovoltaic generation, once the battery state of charge is at its maximum value, this value is fed into the grid. However, to perform this storage system analysis, it is possible to consider different battery modelling, as well as different battery charge management algorithms.
If the storage system is taken into account, the energy consumed ( E P V c o n , τ ) must consider not only the overlapping part of the generation and load profiles, but also the photovoltaic energy delivered to the inverter-charger or bi-directional inverter (BDI) to charge the battery ( E T P a c , τ ). Furthermore, EPV-BAT, which is the energy given by the array and the battery to the loads, should be taken into account E P V d i r e c t , τ and the energy given by the BDI from the batteries to the loads ( E F P a c , τ ), (Equation (10)), as shown in [45].
φ S C = E P V c o n , τ E P V g e n , τ = E P V , d i r e c t , τ + E T P a c , τ E P V g e n , τ = E P V , d i r e c t , τ E P V g e n , τ + E T P a c , τ E P V g e n , τ
φ S S S H = E P V B A T , τ E L , τ = E P V , d i r e c t , τ + E F P a c , τ E L , τ = E P V , d i r e c t , τ E L , τ + E F P a c , τ E L , τ
E P V c o n , τ = E P V , d i r e c t , τ + E T P a c , τ
E P V B A T , τ = E P V , d i r e c t , τ + E F P a c , τ
E F P a c , τ = E T P a c , τ · η B D I 2 · η B A T
η B D I and η B A T includes the bi-directional inverter and battery efficiencies, respectively. In addition, η B A T includes the charge, storage, and discharge efficiencies. τ refers to the study period. In this case, the curves of self-consumption and self-sufficiency for a year will be studied, and the harvest period and off-harvest period of the olive mills analyzed will also be considered.

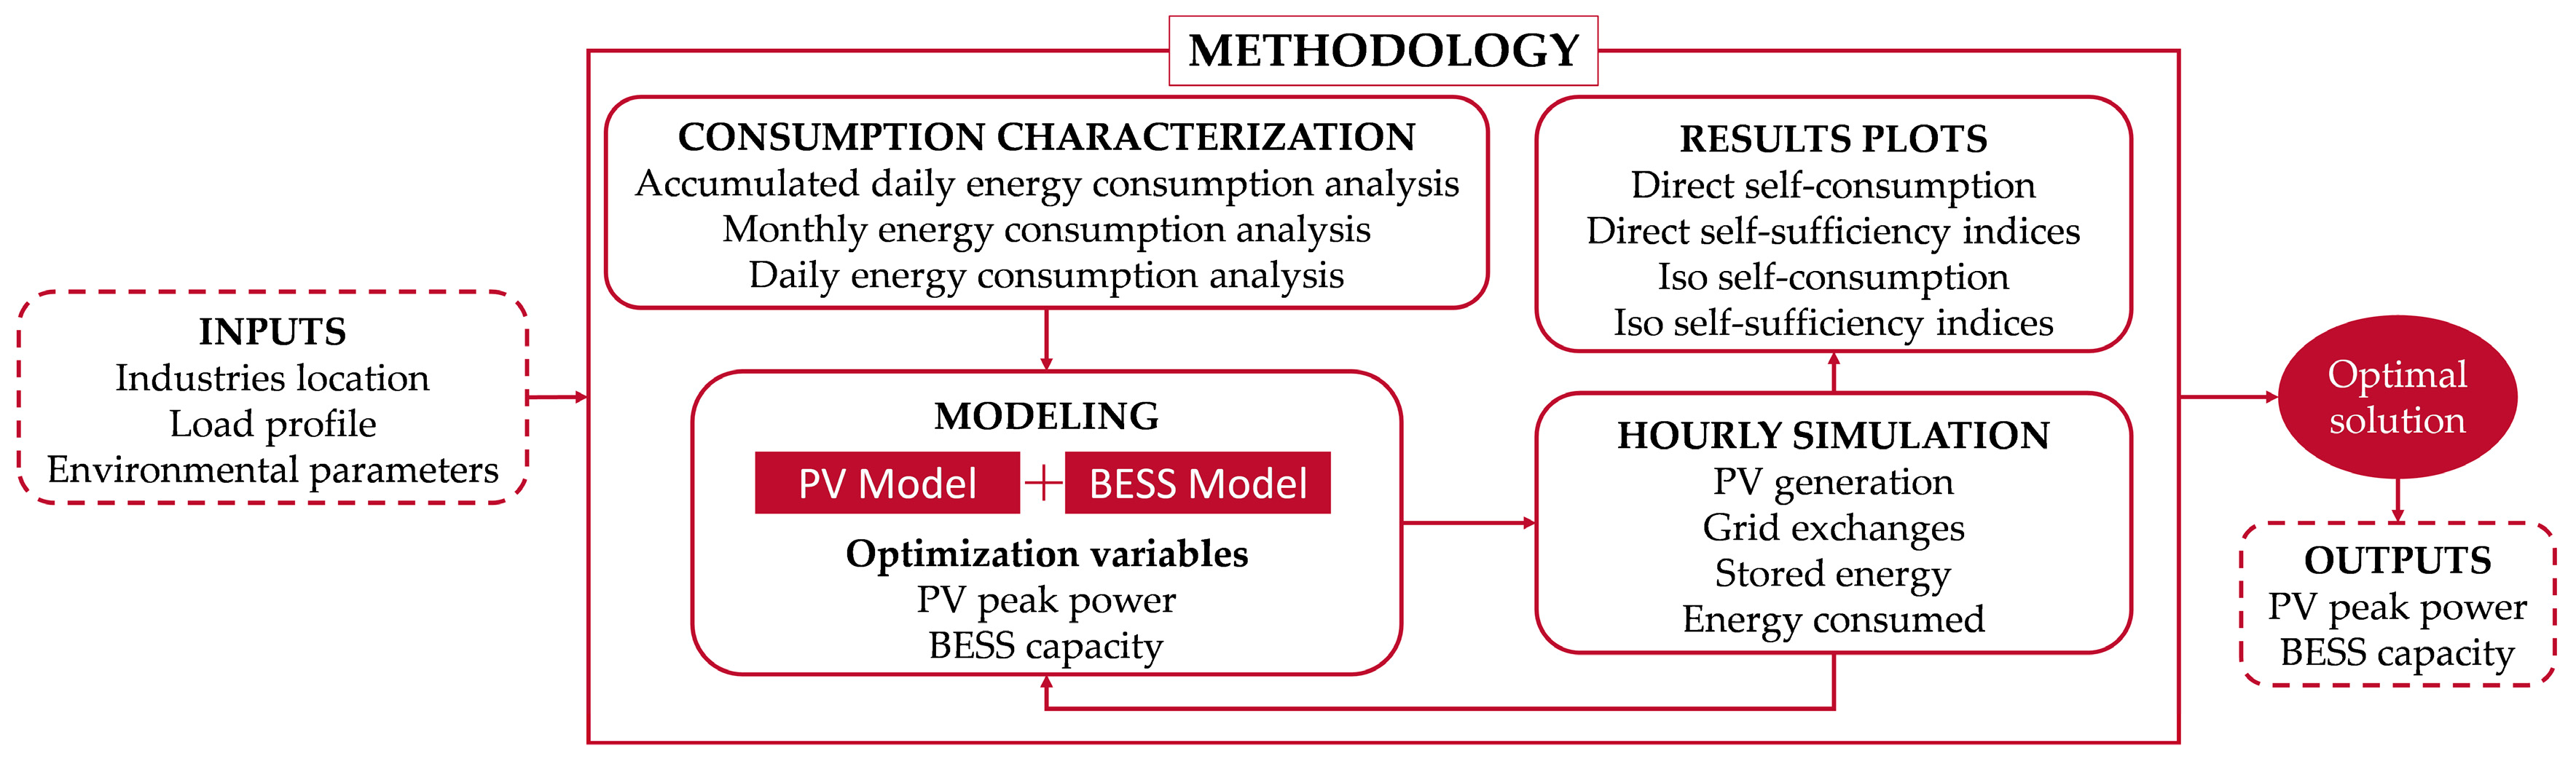
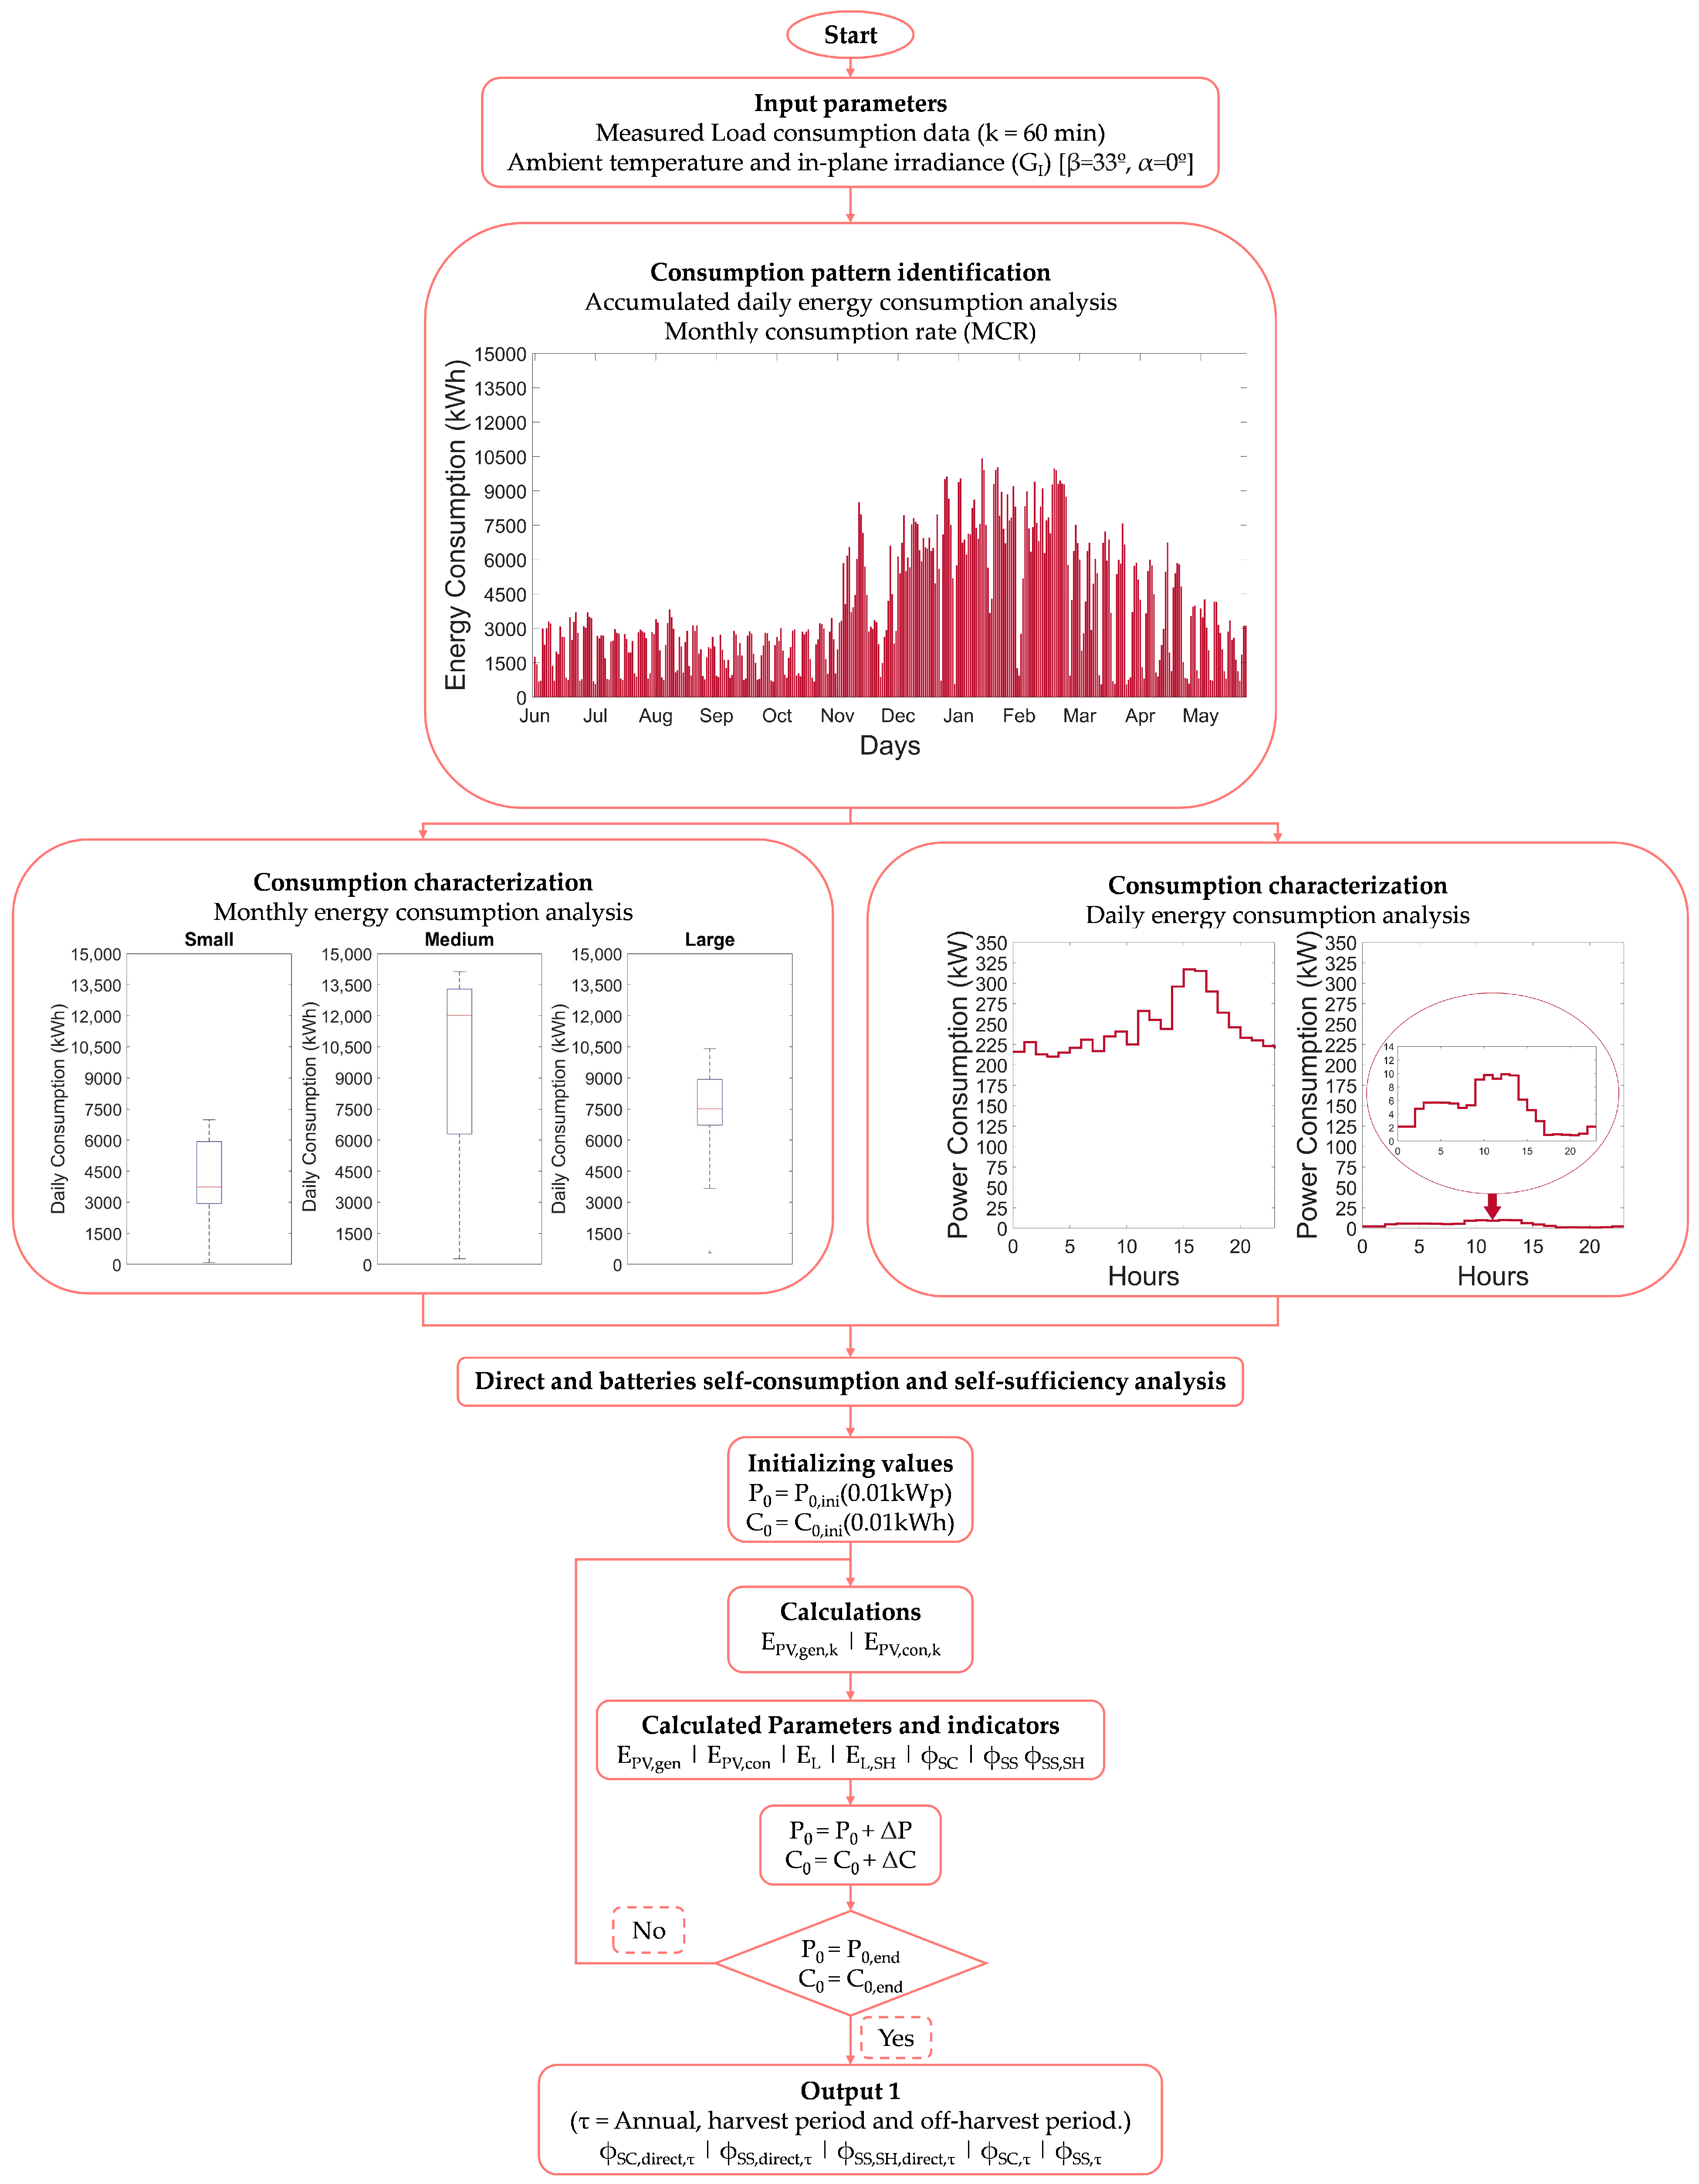
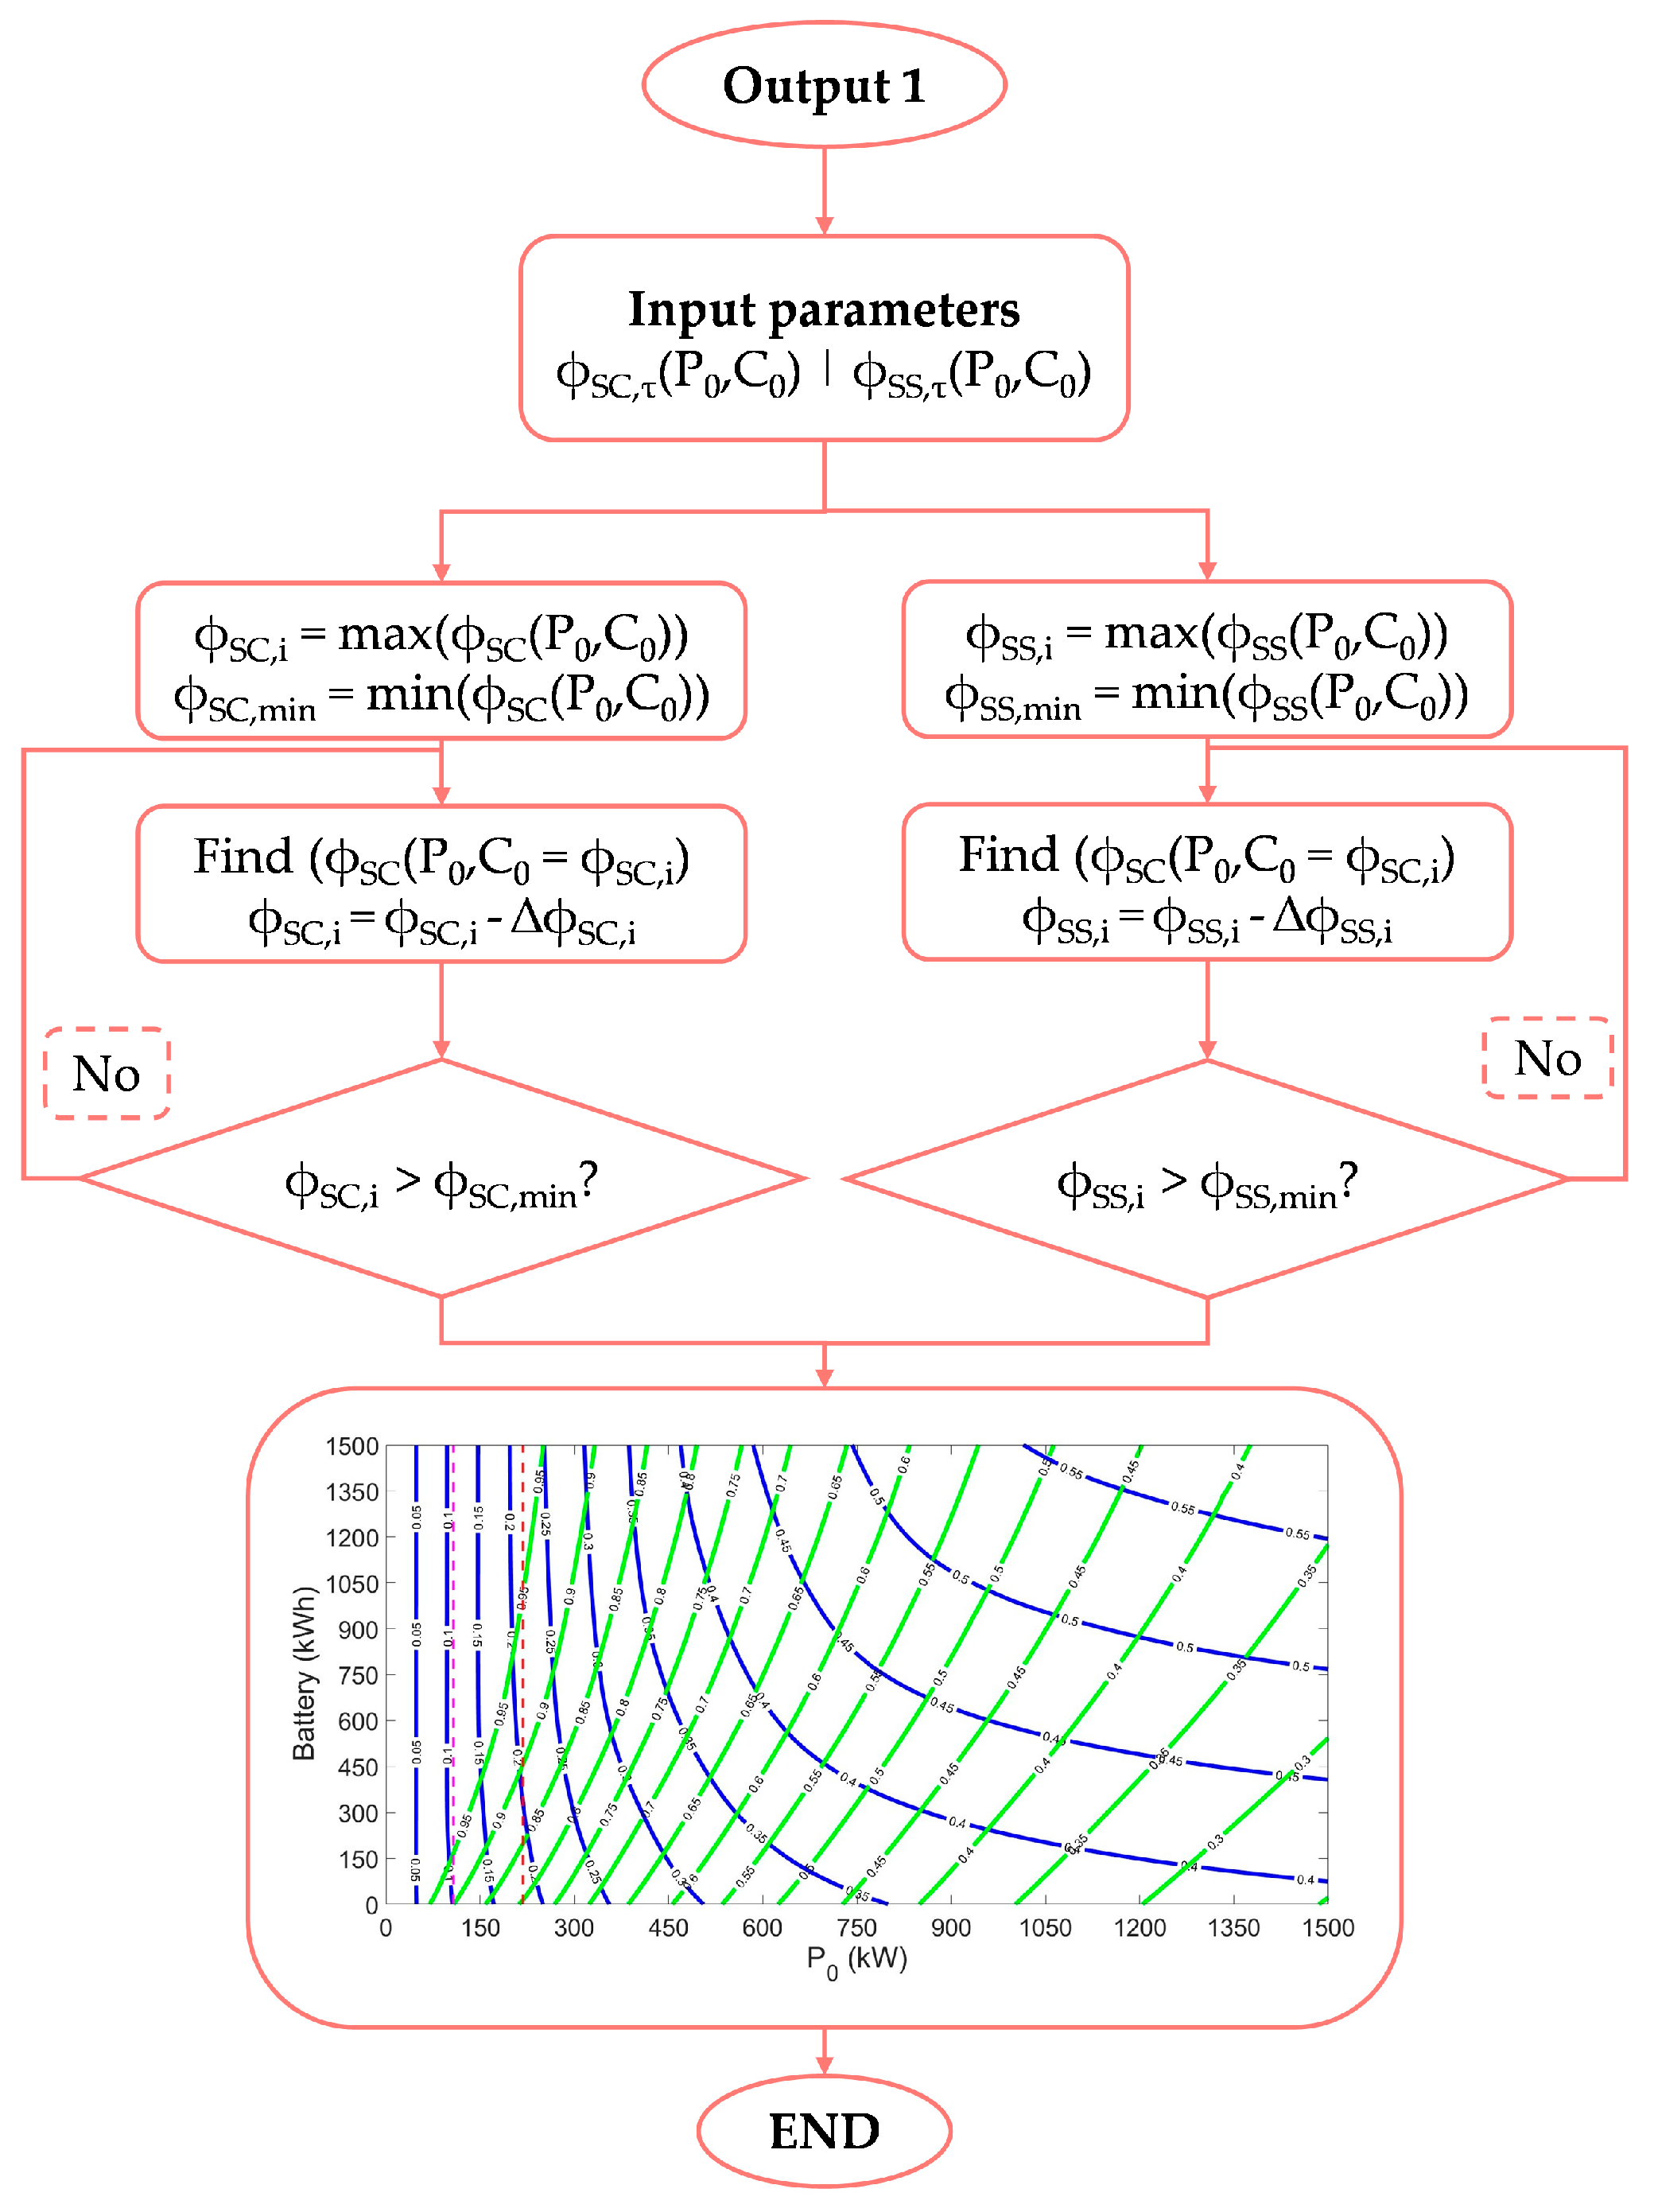
2.3. Applied Methodology for the Analysis of the Potential of Photovoltaic Systems with Batteries

The first main stage of this methodology focuses on analysing and identifying the consumption profile of these industries. These steps are shown in Figure 8. Next, the self-consumption and self-sufficiency indices are studied, both direct and sunshine hours. The study of the global self-consumption and self-sufficiency indices is also carried out using batteries. This analysis will lead to the next main stage, which focuses on the study of battery use.
The analysis of the potential of a PV Rooftop system with a battery can be carried out using 2D figures that combine the self-sufficiency and self-consumption indices as a function of the power of the photovoltaic generator and the storage system. For this purpose, the tool provided by [45] is very useful since it not only simplifies the analysis but also makes the sizing of this type of system even easier and more intuitive via the use of the iso self-consumption (isoSC) and iso self-sufficiency (isoSS) curves. These curves are contour plots containing the iso-lines of the SS and SC indices as a function of the PV generator power and the nominal capacity of the batteries. In a plane, the isolines are plotted with the self-sufficiency and self-consumption values, where the x-axis and y-axis corresponds to the nominal capacity, respectively. The first step is to find the maximum and minimum value of both indices. Starting with the maximum value, the next steps are to find the range of iso-curves from the maximum value to the minimum value.
After this procedure, the self-consumption and self-sufficiency indices are obtained in order to analyze direct self-consumption and the consumption with batteries. Then, the iso self-consumption and self-sufficiency curves are plotted, as shown in Figure 9 [45]. A minimum self-consumption index of 50% has been selected for the simulations; therefore, the final simulated size of the PV generator and batteries are related to this value.

3. Results and Discussion

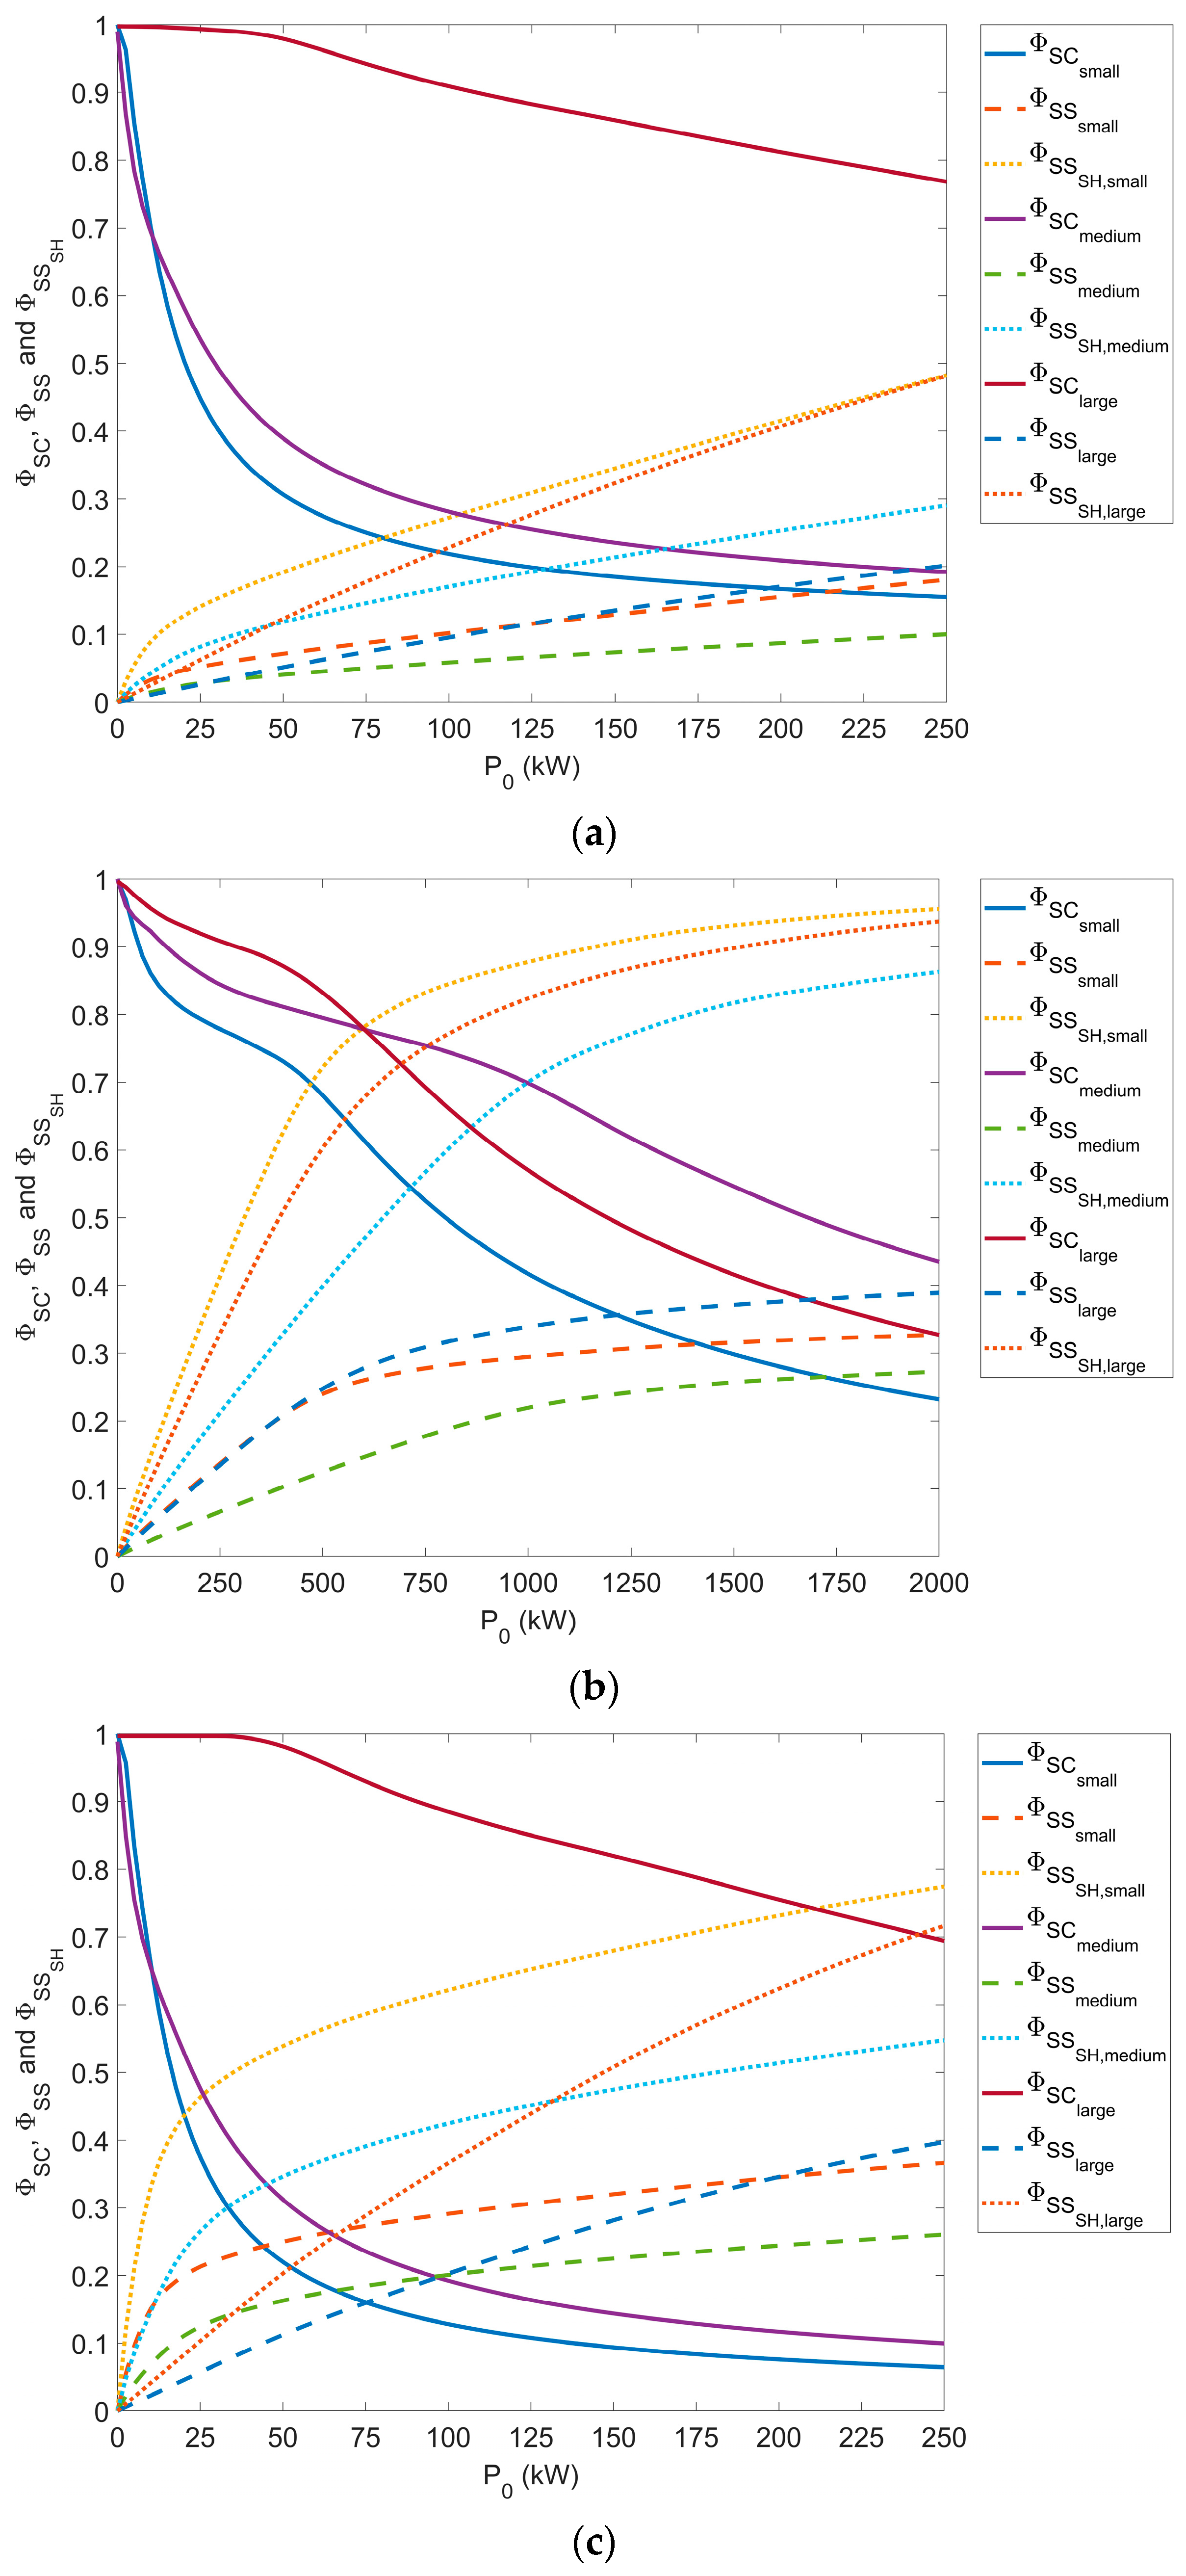
3.1. Direct Self-Consumption and Self-Sufficiency

Firstly, the analysis of the direct self-consumption and self-sufficiency indices has been carried out. Figure 10 shows the self-sufficiency and self-consumption curves for each period and each olive mill.
It can be observed how, for the small and medium olive mills, direct self-consumption is not appropriate for these industries. For high values of self-consumption, around 80 and 90%, the self-sufficiency indices obtained are very low, Figure 10a. However, if the study is carried out separately for the harvest and off-harvest periods, for the same self-consumption values, the self-sufficiency indices increase considerably, Figure 10b,c. Note that the background scale is different for the harvest period to clearly observed from the curves. This already shows the difference in consumption between the two periods.
As expected, for every olive mill and every period considered, the self-sufficiency indices in solar hours was higher than the self-sufficiency index. ϕ S S S H , used as a supplementary metric to increase the insights provided by the self-sufficiency index in the literature, assesses the impact of PV Rooftop systems when meeting energy requirements exclusively during sunshine hours, which corresponds to the time frame in which photovoltaic energy was generated. Additionally, it provides a more accurate characterization of PV Rooftop systems, particularly in the industrial sector, where energy consumption profiles tend to have a high degree of variability and non-uniform distribution throughout the whole day.
Table 3 summarizes the most significant results obtained from the curves mentioned above. The analysis of direct self-consumption and self-sufficiency curves was carried out by selecting two high self-consumption values, 80 and 90%; the aim is to maximize self-consumption in order to obtain maximum energy use. As mentioned above, the high difference between the power consumption of both periods results in very low self-sufficiency indices when the study is carried out on an annual basis. This is due to the fact that the harvest period, although it corresponds to a reduced period of time, between 3 and 4 months, represents concentrates between 60 and 80% of the annual electricity consumption of the mills, depending on their size. Although most of the consumption is concentrated in the harvest period, the rest of the time corresponds to the off-harvest period, between 8 and 9 months. The reduced consumption in this period has an impact on the annual self-consumption and self-sufficiency indices and it is necessary to carry out an individual study for both periods in order to study the suitability of PV Rooftop systems.
Taking into account high self-consumption indices, 80 and 90%, the self-sufficiency indices in sunshine hours are obtained, as well as their corresponding array power. Considering the harvest period, the array power should be between 53 and 176 kW for the the small olive mill, between 120 and 460 kW for the medium olive mill, and between 247 and 560 kW for the large olive mill. For the off-harvest period, the PV generator size drops significantly, especially for the small and medium olive mills, and is very close to the annual sizes. This fact highlights the impact of this period when considering an annual reporting period. However, the self-sufficiency in the sunshine hours index increases in the study of both periods for all the olive mills. In this case, the highest indices were found in the harvest period and off-harvest period for the large olive mills, making it possible to obtain self-sufficiency in sunshine hours of 66 and 52%, respectively.
The study of direct self-consumption shows that PV Rooftops are suitable for large olive mills. This is not the case for small and medium olive mills although during the harvest period, the 32% renewable energy target that the EU wants to achieve by 2030 is reached in all olive mills [8]. In this case, a collective consumption solution may be chosen in order to use the generation surplus during the off-harvest period and increase self-sufficiency.

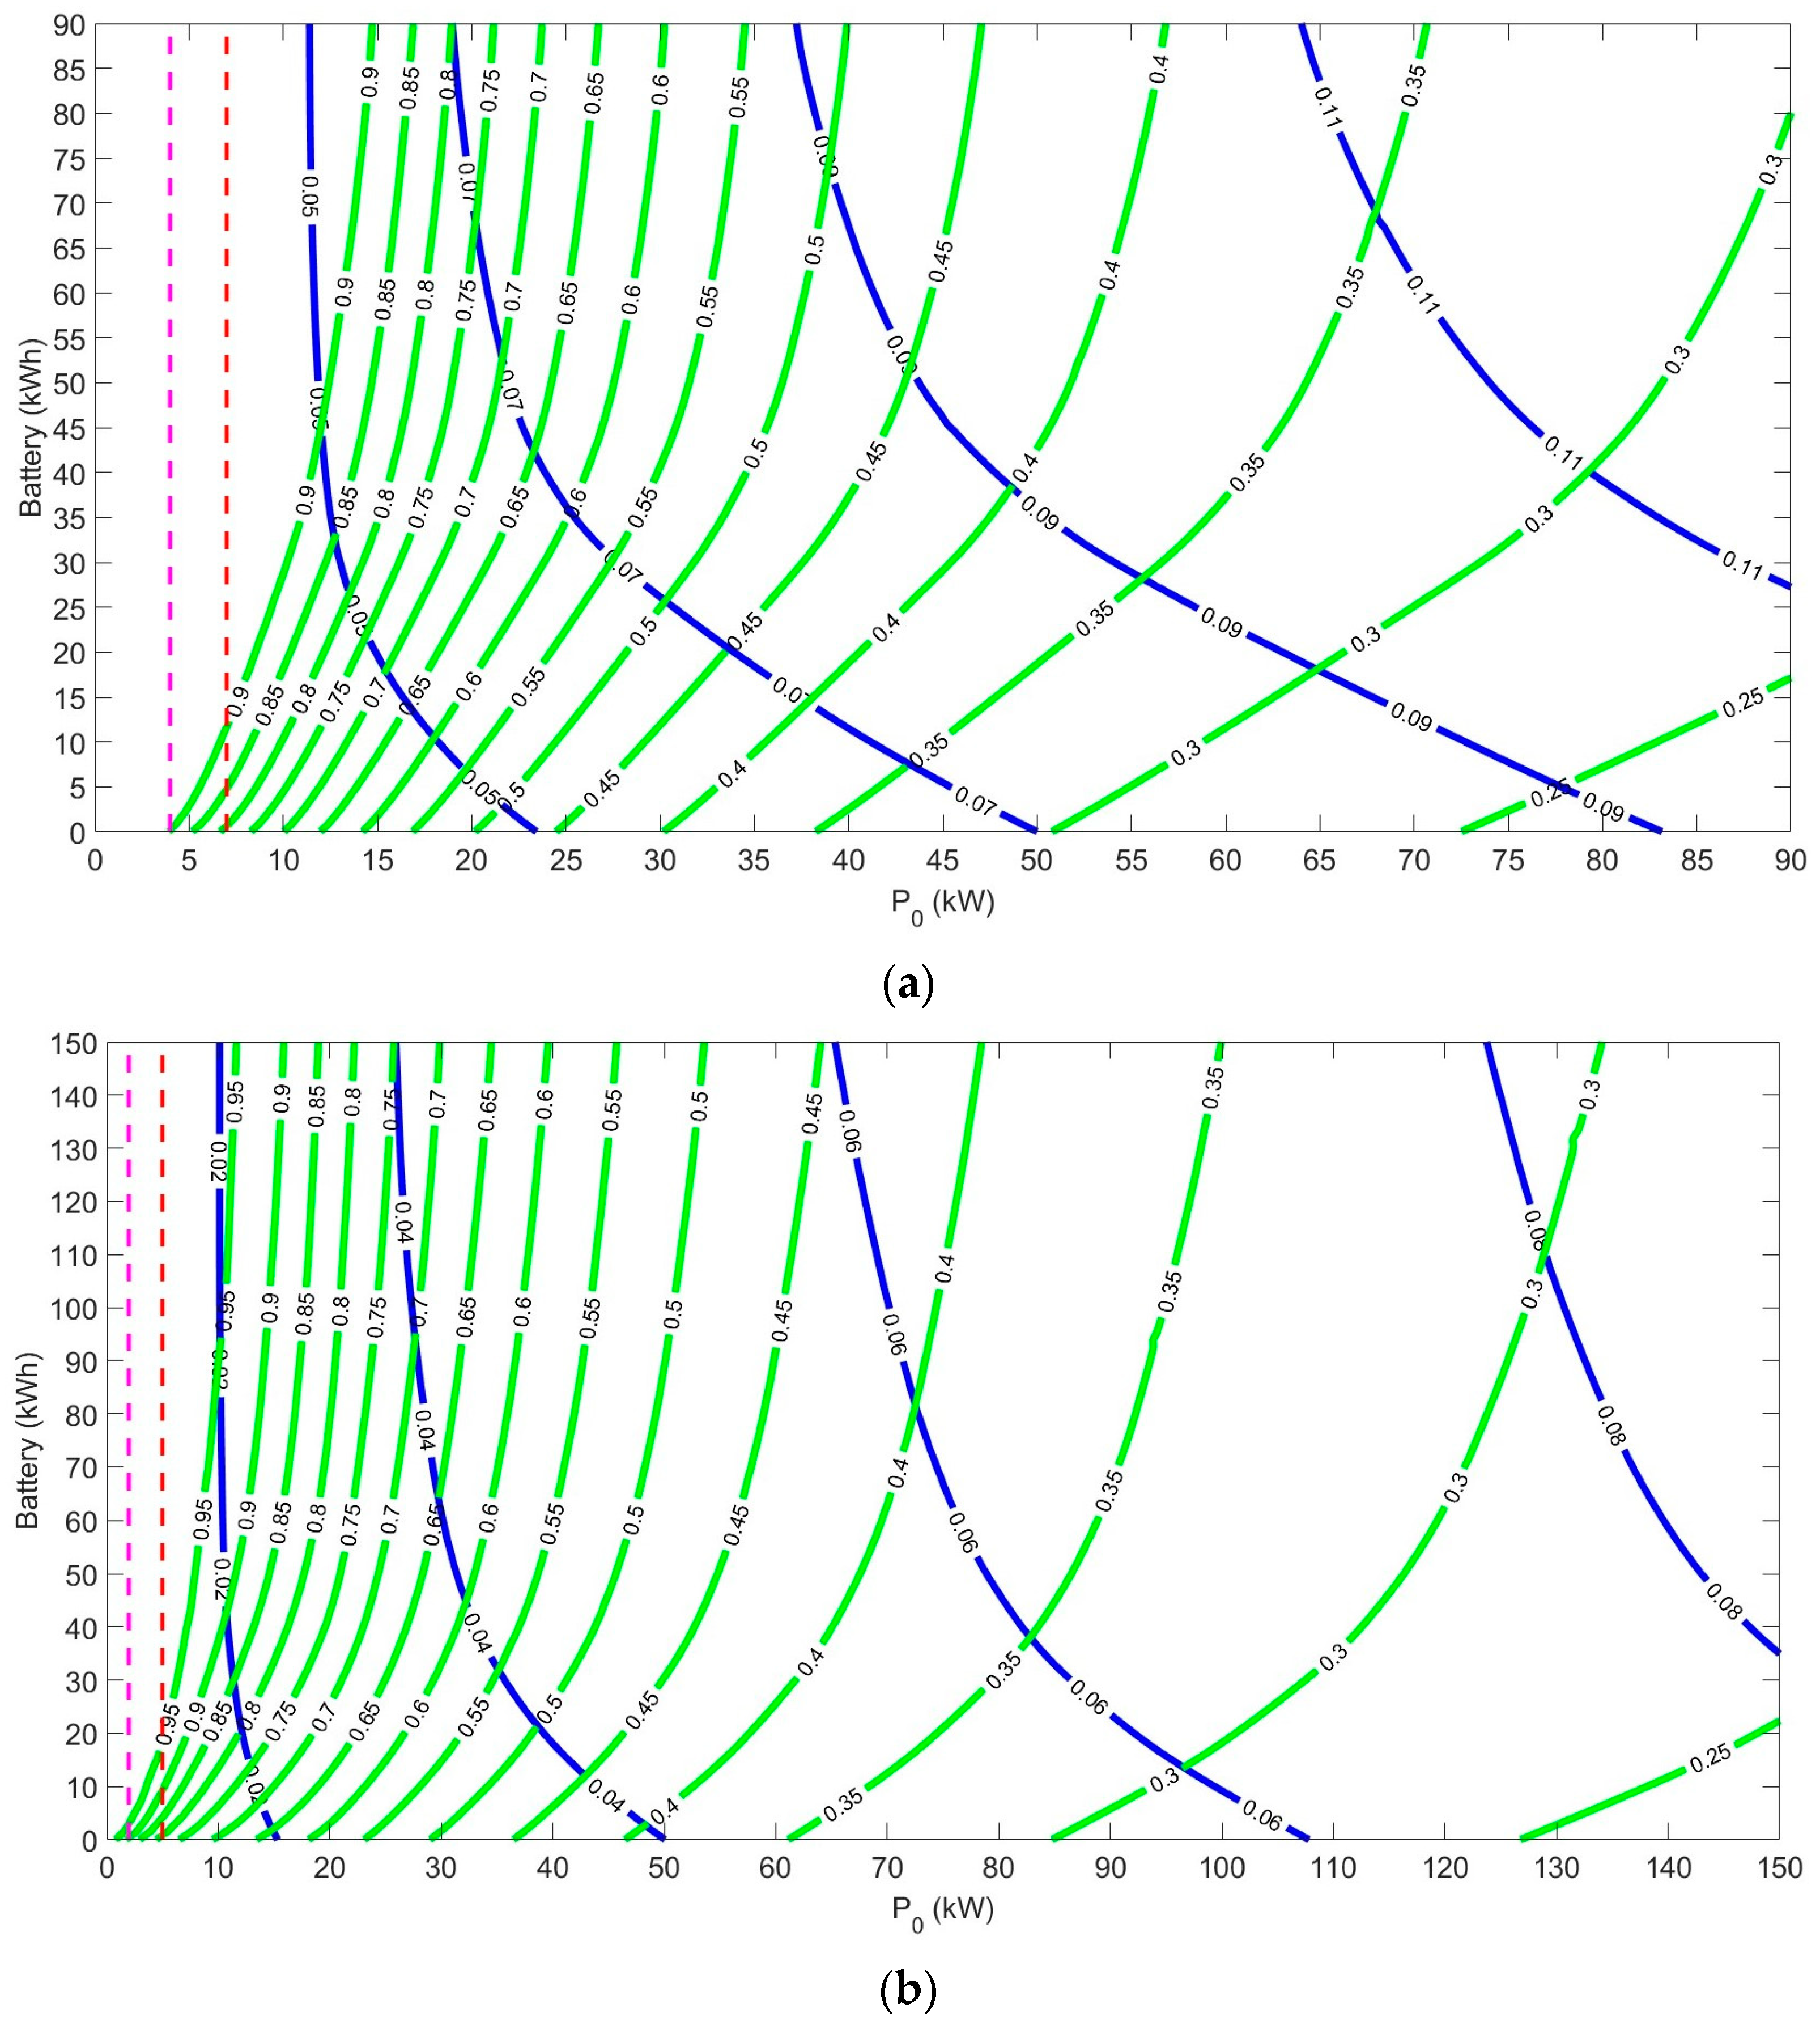
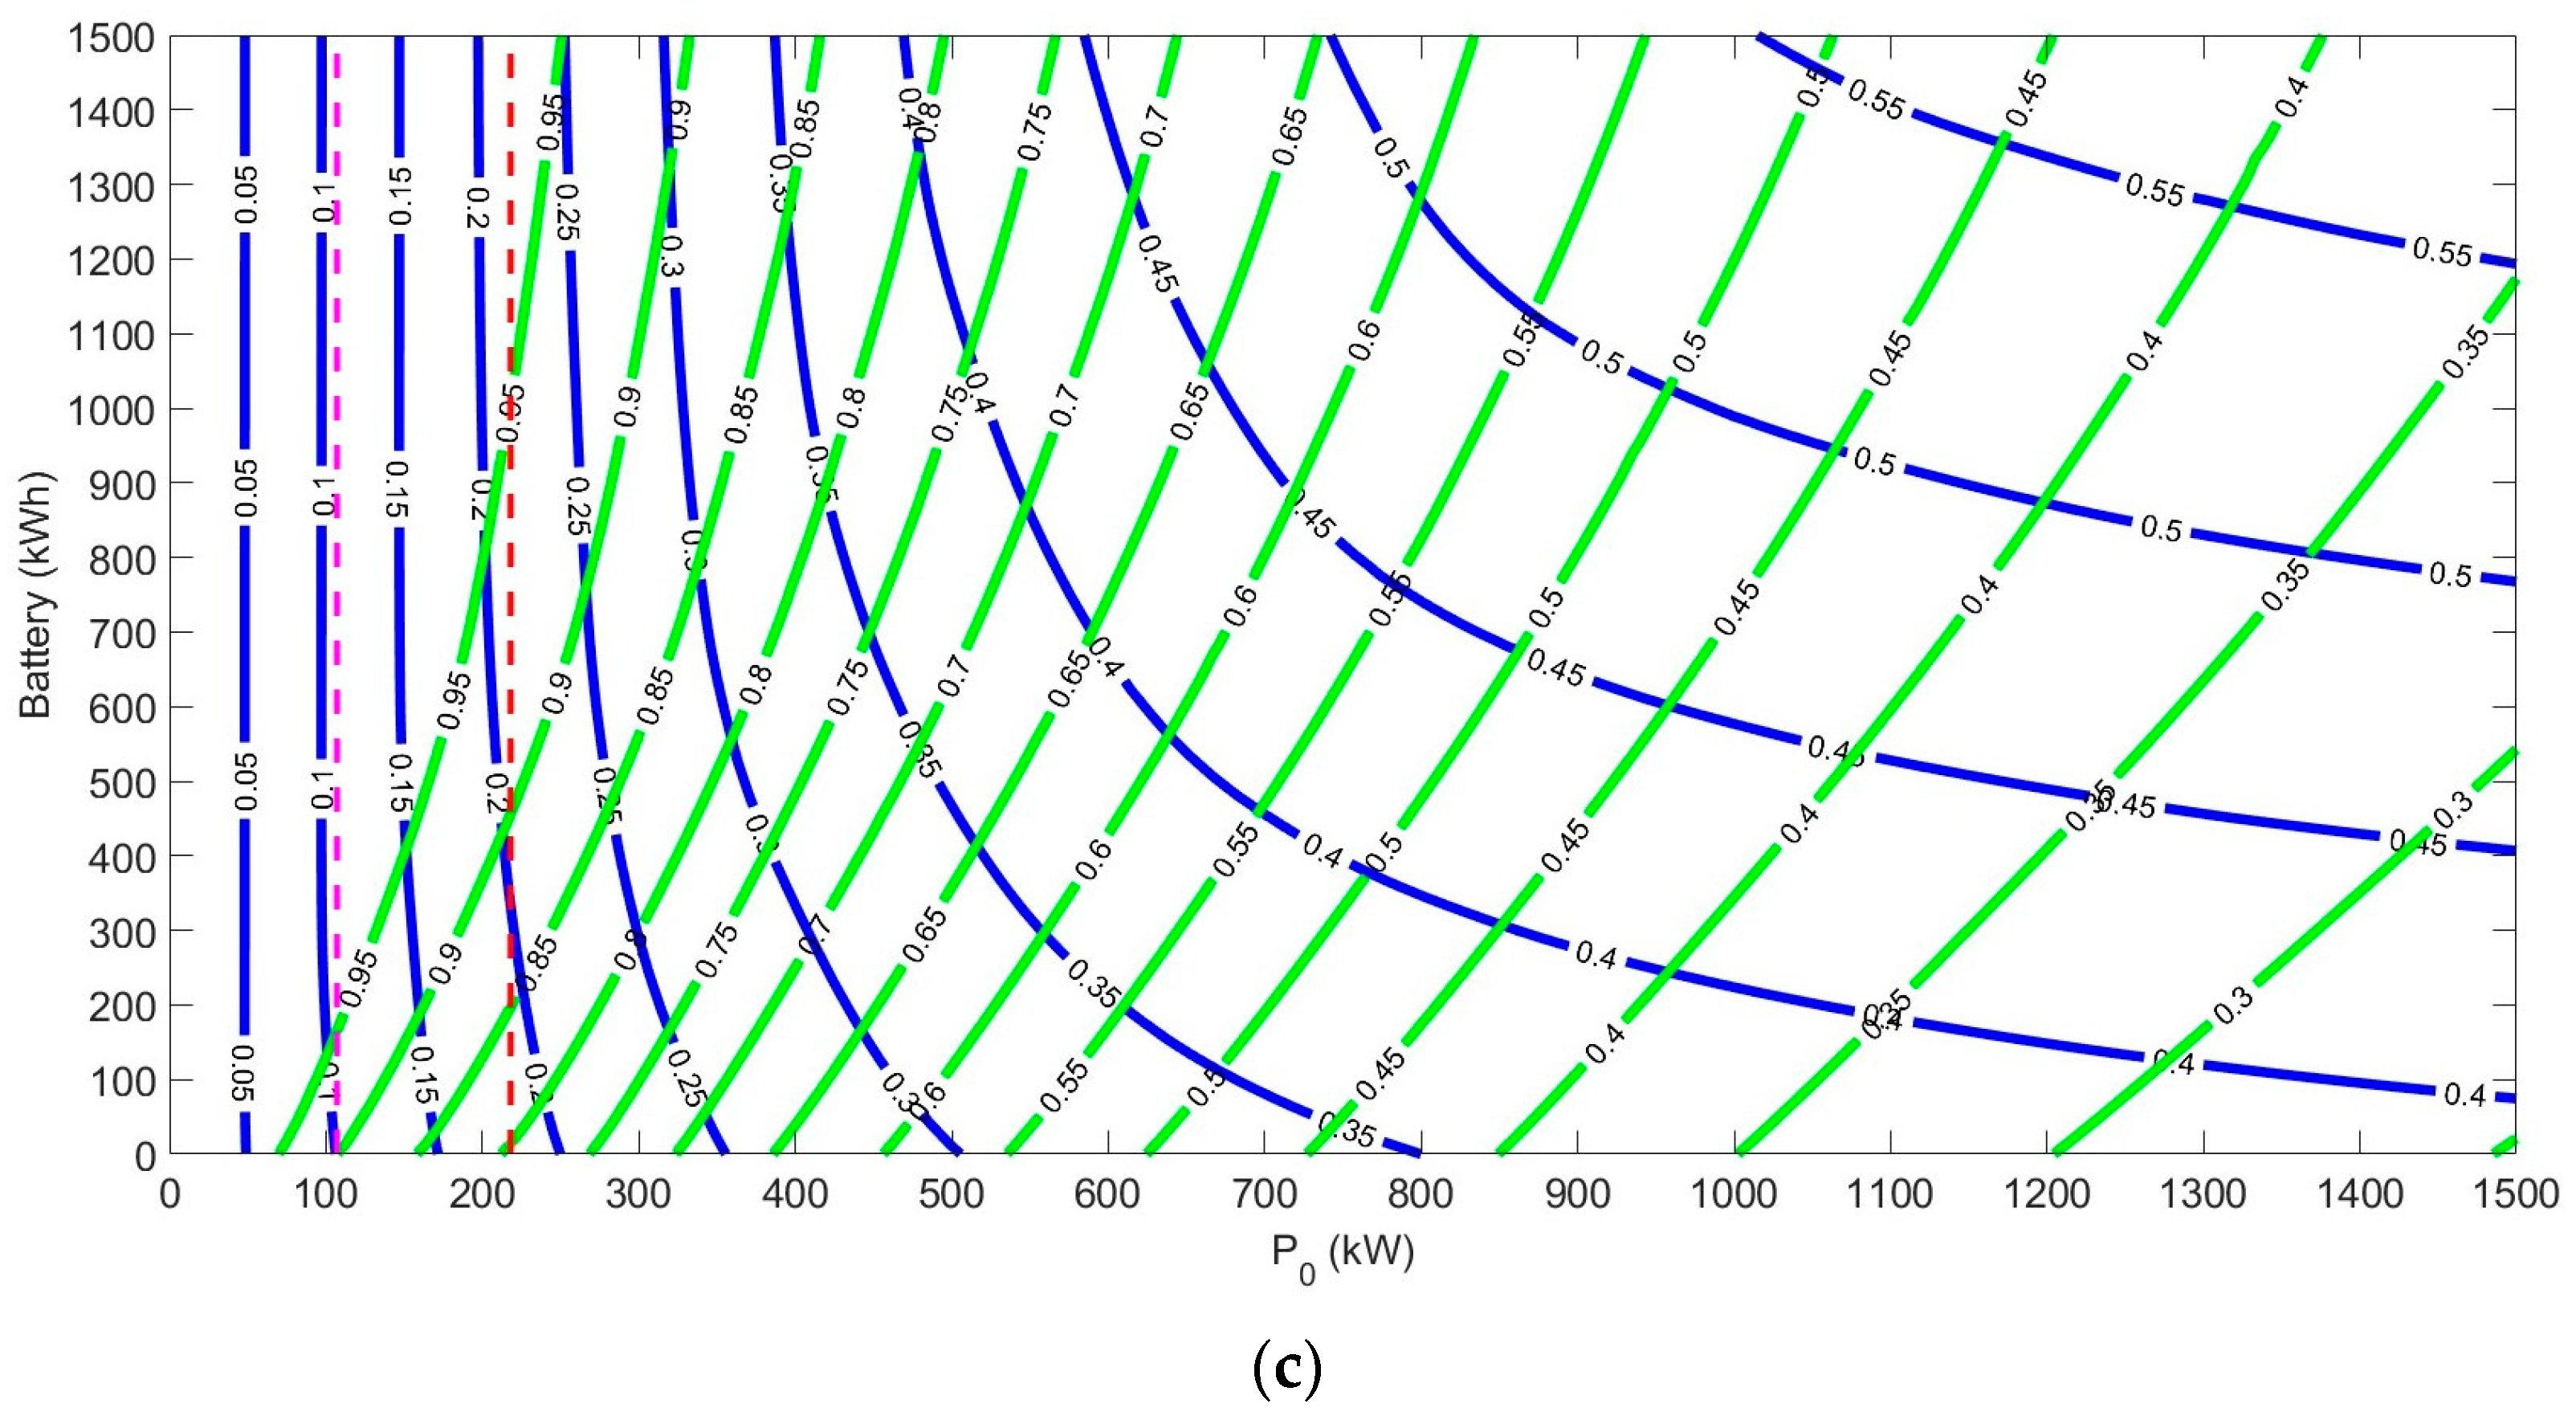
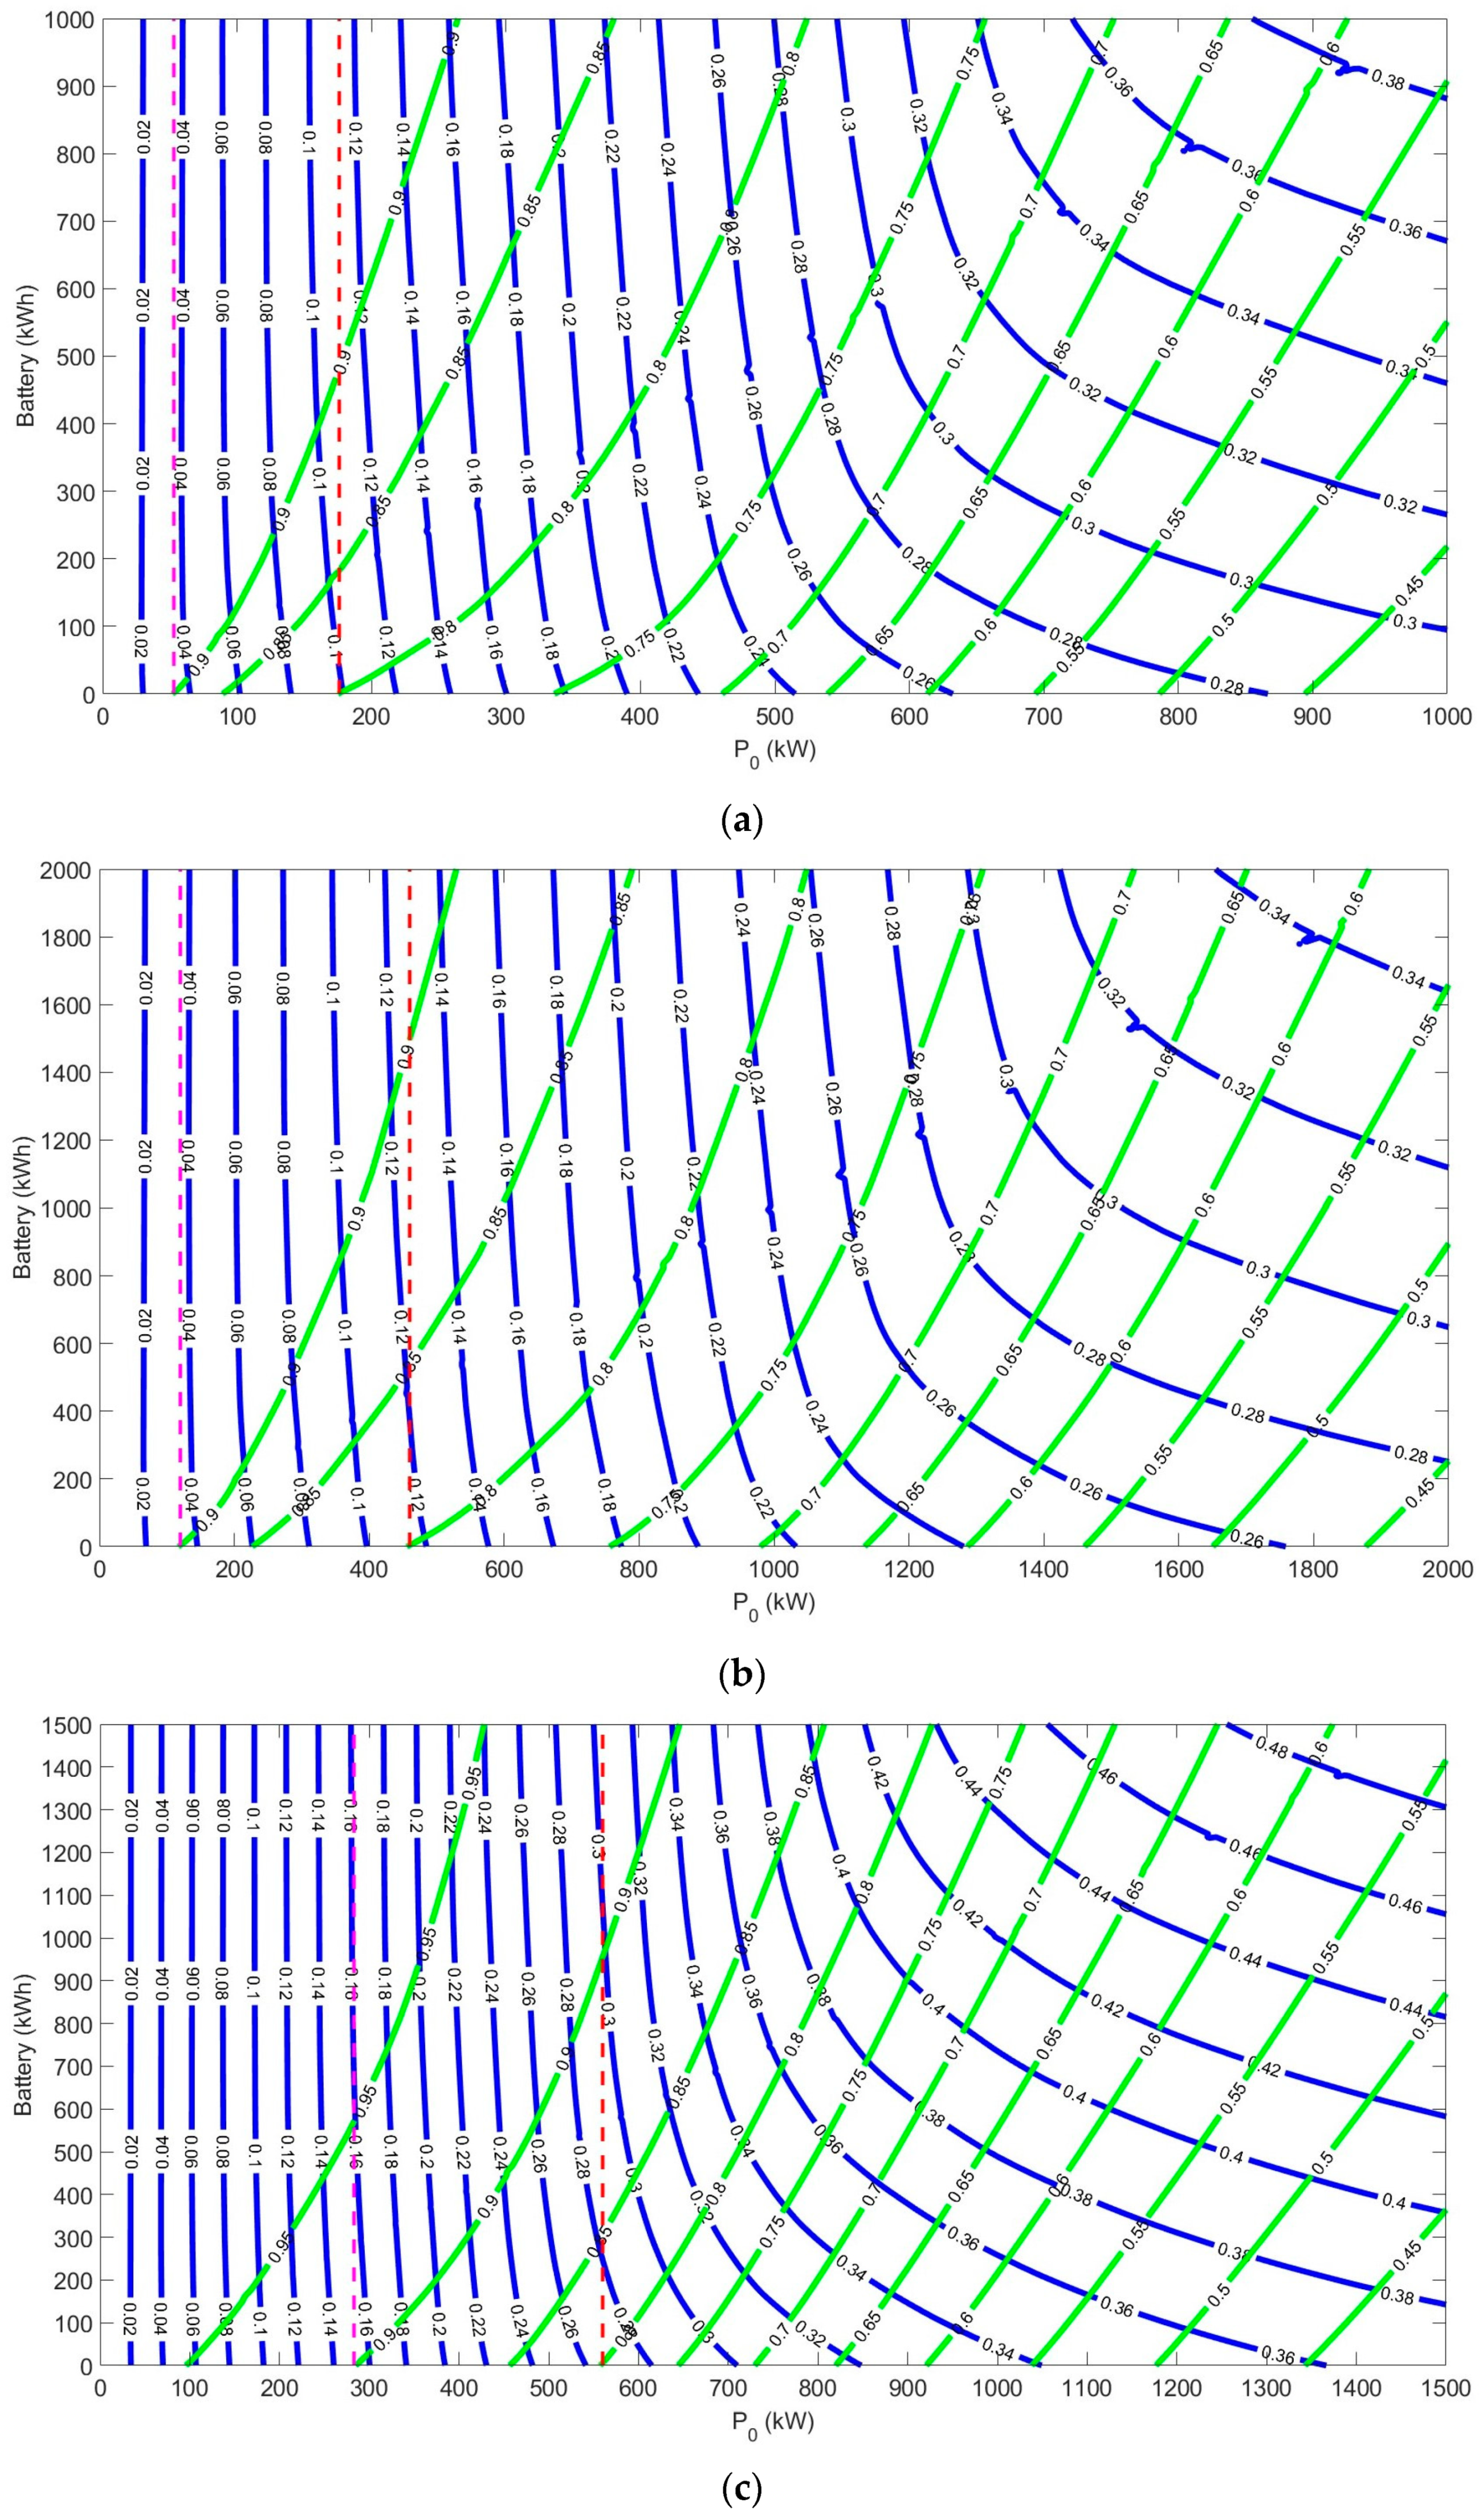
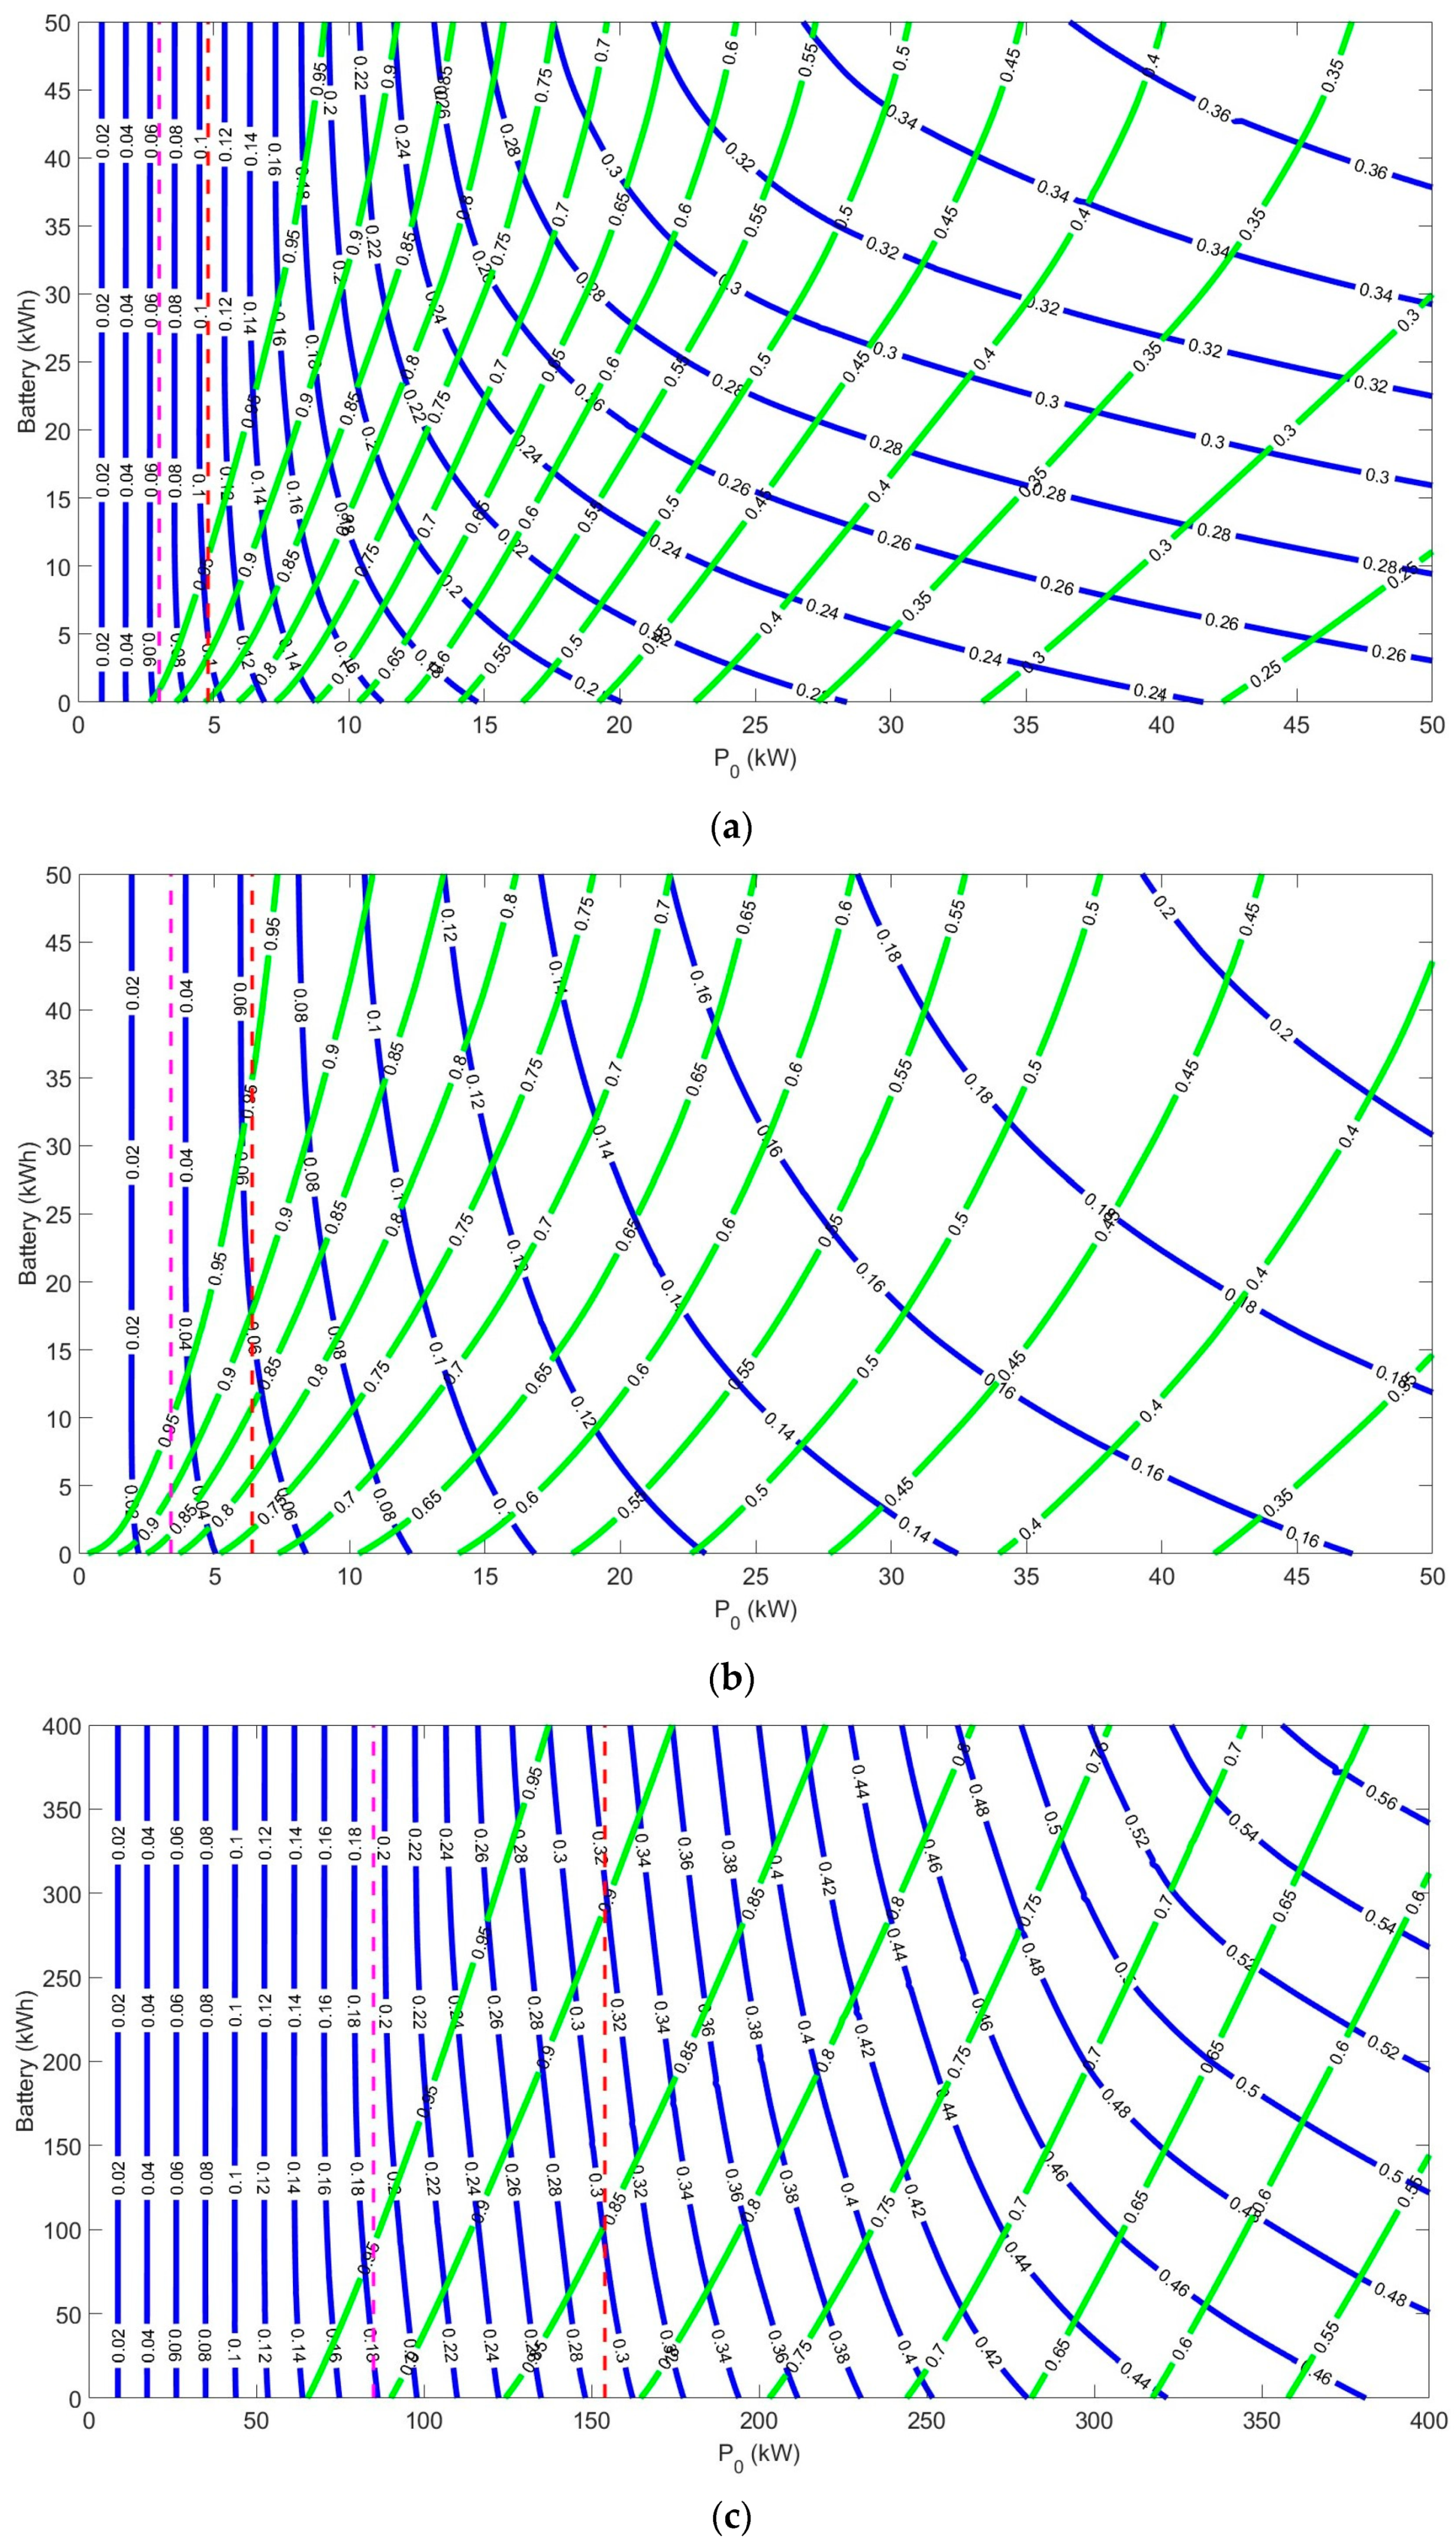
3.2. Self-Consumption and Self-Sufficiency Indices with Batteries

This sections applies the methodology described above and uses a graphical tool that assesses the role of the array power together with the storage system. Figure 11 shows the annual global isoSC and isoSS curves described in Section 2.3. In this case, since the influence of the storage system is being analyzed, it is more convenient to use the self-sufficiency index rather than the self-sufficiency index during sunshine hours, as the effect of the batteries may be significant during the hours when there is no photovoltaic generation.
These curves obtain different array power and nominal capacity of the battery to determine self-consumption and self-sufficiency indices. The intersection of the isoSC curves (green) with the abscissa axis provides the value of the PV generator for a given direct self-consumption index. For example, in this case, the values of 80 and 90% of direct self-consumption have been selected as a reference, characterized by the red and magenta dashed lines, respectively. This done to obtain a comparative baseline of the results obtained with the battery sizing tool, and the results of the sizing without batteries, direct self-consumption since the purpose is also to quantify the impact of batteries on the self-consumption and self-sufficiency indices.
It was noted that both for the small and medium olive mills, the self-consumption indices corresponding to array powers higher than 30 kWp were below 50%. For the small olive mill, and taking into account the isoSC curve of 50%, the maximum self-sufficiency index barely may be increased 5 to 9%, depending on the battery capacity. Even if the size of the PV generator and batteries was increased, the improvement in self-sufficiency was very small, and self-consumption was greatly reduced. This means that the consumption of this industry has a high grid reliance, even if batteries of the order of 70 kWh are incorporated. This may indicate that a study of the consumption profile in an annual period for this type of industry is not accurate due to its high variability from one period of operation to another.
It has been observed that, for the PV generator power considered to harness most of the PV energy generated, between 4 kWp (magenta dashed line) and 7 kWp (red dashed line) for 90 and 80% self-consumption, respectively, self-sufficiency indices near 3% are achieved, Figure 11a, without the use of storage systems. Additionally, considering the use of a storage system is irrelevant, as the curves tend to be vertical. To obtain a self-sufficiency index of 10%, especially when one of the requirements is to harness a large part of the photovoltaic energy generated (i.e., a self-consumption index higher than 75%), it has been observed that there is no combination of PV generator power and capacity that provides these values (these values would be obtained as the intersection between the isoSC curves of 75% and isoSS of 15%) for the olive mill under consideration.
In this case, it was possible to obtain a self-sufficiency index of 11% with PV generator power and nominal capacity above to 65 kWp and 80 kWh, respectively, indicating very low grid autonomy and poor energy efficiency in this case. To obtain a self-consumption index higher than 75%, a PV generator power and a nominal capacity of 10 kWp and 10 kWh, respectively, can be used.
It should also be noted that the isoSS curves are very similar to those obtained in Figure 11b for the medium olive mill. It was discovered that the highest self-sufficiency index to be obtained at 50% self-consumption was close to 5%. This means, again, that the consumption of this type of industry will have a high reliance on the grid regardless of the size of the PV generator and batteries used.
Likewise, increasing the size of the PV generator has little impact on achieving a high self-sufficiency index. It is necessary to increase the power from 50 kWp to 110 kWp to increase self-sufficiency from 4 to 6%. In order to obtain a high energy self-consumption index over 75%, a PV generator power and a nominal capacity of 15 kWp and 20 kWh, respectively, should be considered.
Figure 11a,b shows not only the low self-consumption indices for large PV generator sizes, which shows the poor matching between generation and load profiles if the study is performed on an annual basis. Moreover, the use of batteries in these cases does not achieve high self-consumption indices.
Finally, the isoSC and isoSS curves have been used for the large olive mill. As indicated in Section 2, the electricity consumption of this mill is much higher than that of the other two industries and differed in that it was relatively constant over time due to its characteristic productive activities. This industry provides the best self-consumption and self-sufficiency indices, Figure 11c. This may be due to a remarkable baseline electricity consumption, as is the case of other industries, making them strong candidates for the incorporation of this PV Rooftops [46].
In this olive mill, it can be noted that the maximum self-sufficiency index that was possible to reach considering a 50% self-consumption index is 55%, considerably higher than in the other two mills. In this case, increasing the size of the photovoltaic generator and batteries produced an improvement in self-sufficiency up to a certain value. This suggests that the consumption of this industry can reach a relatively high level of independence from the grid depending on the size of the PV generator and batteries used.
It has been observed that if PV generator power is considered to harness most of the PV power generated (between 107 and 218 kWp for 90 and 80% self-consumption, respectively), provide self-sufficiency indices between 10 and 18%are obtained, Figure 11c, without the incorporation of storage systems. However, as can be seen in the 10 and 20% isoSS curves, the same applies to the small and medium olive mills. The incorporation of a storage system for low PV array power was irrelevant since the curves tend to be vertical.
As mentioned above, since these industries have such a characteristic consumption profile divided into two well-differentiated periods (harvest and off-harvest), it is necessary to study both separately. Figure 12 and Figure 13 show the isoSC and isoSS curves for the harvest and off-harvest periods, respectively.
In Figure 12, the analysis period is restricted to the harvest period. During this period, the estimated size of the PV generator was higher for every olive mill compared to the annual analysis, Figure 11. The same behavior registered in the annual analysis was observed for the three olive mills. If the size of the batteries was increased, the value of the self-sufficiency index remained practically unaffected below 600 kWp for the small olive mill Figure 12a, 1000 kWp for the medium olive mill, Figure 12b and 600 kWp for the large olive mill, Figure 12c regardless the battery capacity. However, it can be seen how the value of the self-sufficiency index has increased compared to the annual analysis. For the small olive mills, Figure 12a, if it is considered self-consumption indices higher than 75%, the self-sufficiency indices may reach values up to 30%. For the medium olive mill, Figure 12b, it can be seen that the maximum self-sufficiency index that was possible to obtain with 75% self-consumption is 30%, the same as the small olive mill.
The isoSC and isoSS curves for the large olive mill during the harvest period have also been included in Figure 12c. For this olive mill, it can be seen that the maximum self-sufficiency index that is possible to reach with high use of generation, 75% of self-consumption, is 45%, higher than the small and medium olive mills. Therefore, the indices considerably for the entire spectrum of olive mills during the harvest period.
Finally, Figure 13 plots the same curves for the off-harvest period. In this case, the sizes of the PV generators and batteries were reduced, as expected since consumption during this period is much lower. In this sense, all olive mills continued showing the same behavior as during the harvest period for reduced PV generator ranges. If the size of the batteries is increased, the value of the self-sufficiency index remained nearly unaffected below 5 kWp for the small olive mill, Figure 13a, 10 kWp for the medium olive mill, Figure 13b, and 150 kWp for the large olive mill, Figure 13c. However, it can be seen again how the value of the self-sufficiency indices increases with respect to the annual analysis.
In the small olive mill, Figure 13a, in order to obtain a high self-consumption index higher than 75%, the self-sufficiency indices reach values up to 30%. It would be necessary to use a PV generator power and rated capacity of 18 kWp and 50 kWh to obtain self-consumption and self-sufficiency indices of 75 and 30%, respectively. In the case of the medium olive mill, Figure 13b, it could be obtained that the maximum self-sufficiency index that can be achieved with 75% self-consumption is nearly 15%, lower than in the small olive mill.
The isoSC e isoSS curves for the large olive mill during the off-harvest period are shown in Figure 13c. In the case of this olive mill, it can be observed that the maximum level of self-sufficiency that could be reached with a high use of self-consumed energy (75%) was 52% with 305 kWp and 375 kWh. It is therefore concluded that if the photovoltaic generator and the battery capacity are analyzed for the off-harvest period, the indices increase for all olive mills, which supports the concept that the annual analysis of this type of industry is inaccurate due to their peculiar consumption profile.
After this study, to improve the understanding of the integration of PV Rooftop systems with batteries in olive mills, the next phase involves the exploration of different studies to analyze other aspects of these systems further. In this sense, the existing research regarding PV systems with BESS could be broadly categorized into six types. These are Lifetime Improvement, Cost Reduction Analysis, Optimal Sizing, Mitigation of Power Quality Issues, Optimal Control of the Power System and Peak Load Shifting, and Minimizing [73]. One of the most widely studied is the economic feasibility. Future research should evaluateworks should evaluate key financial parameters, such as return on investment (ROI) and payback periods (PBP). Using economic analysis, it is possible to quantify the long-term economic benefits and feasibility of these systems. Several research studies have been conducted in recent years, focusing on the techno-economic evaluation of these systems in different countries, such as Egypt [74], Italy [75], Belgium [76], and other European countries [77]. Most studies focus exclusively on economic profitability, mainly using parameters such as net present value (NPV) and internal rate of return (IRR) [78,79,80]. However, some authors opt for other economic parameters such as ROI and PBP [81,82]. In spite of this predominant orientation, it is essential to consider other parameters in the analysis, such as self-consumption and self-sufficiency indices, as other authors have proposed [83,84].
In the first approach, a simple but illustrative economic study has been carried out. A specific size of photovoltaic generator and battery is evaluated for each of the olive mills, using the ROI and PBP as economic indicators. These are two recognized indicators to evaluate the economic performance of renewable systems. ROI refers to the economic return investors obtain from investment activity. As an important economic index, the ROI can reflect the comprehensive profitability of investment projects [82]. The ROI is the gain made from an investment, in this case, the amount saved using a solar PV system compared to standard electricity divided by the initial start-up costs. Further, PBP represents the first year when the NPV reaches zero and defines the period it takes to recover the initial investment [85].
In the analysis, a low penetration of renewable energy scenario in olive mills has been developed, compared to the EU target of 32% [8]. This scenario represents more unfavourable conditions (greater technical and administrative difficulties, higher costs, lower availability of alternatives, offers, and business models for the promotion of self-consumption, etc.). Firstly, the analysis was conducted without batteries, and secondly, a specific battery size was incorporated so that all the olive mills could reach at least 20% self-sufficiency. A literature review has been conducted to gather the necessary economic information about the systems involved: PV and BESS. Out of this literature review, a PV capital expenditure of 806 EUR /kW and 7 EUR /kW/year was selected [86]. A BESS capital expenditure of 275 EUR /kWh was considered [82]. The cost of energy was established at 0.215 EUR /kWh [87] and the cost of sale at 0.110 EUR /kWh [88]. Finally, a PV and BESS lifetime of 25 and 15 years, respectively, was chosen.
Comparing these two scenarios for each mill, the PV systems without batteries were the most feasible to implement with payback periods of 3.7 years for the small mill, 3.3 years for the medium mill, and 5.5 years for the large mill, while the scenarios with batteries had slightly longer payback periods, 4.3, 4.1 and 6, respectively. The same is applicable to ROI, going from 337% without batteries to 285% with batteries for the small olive mill, from 390% to 303% for the medium olive mill, and from 222% to 198% for the large olive mill.
Overall, the ROI is lower for systems with batteries compared to systems without batteries for all olive mill sizes. The payback period is also longer for batteries systems for all sizes. Based on these data, it could be concluded that, in strictly economic terms, the non-battery systems are more cost-effective in the short term. However, it is also important to consider other factors such as sustainability, energy autonomy, and possible government incentives or subsidies for renewable energies. Government incentives can promote the profitability and growth of this type of system because, in the absence of economic incentive policies, there is a lower probability of economic viability of this kind of renewable energy generation [89]. Economic profitability may not be the only factor to consider when making decisions. In addition, energy storage technologies may improve, and costs may decrease in the future, which could change the economic dynamics. In summary, although battery systems have an economic impact, other factors must also be taken into account when making decisions, and a more detailed analysis with additional considerations could be useful.

4. Conclusions

This study has addressed the suitability analysis of PV Rooftop systems with storage in three types of olive oil mills that can be found. Olive oil mills are identified as industries with high suitability for these systems from an energetic point of view. This study has provided a methodology based on monitored data to analyze the potential of photovoltaic Rooftops with battery energy storage systems regarding self-consumption and self-sufficiency indices in the industrial sector. Two types of olive mills can be identified according to the consumption analysis performed. One type has year-round industrial activity, and the other one has high consumption only during the harvest period. In the off-harvest period, all studied olive mills show small PV generator sizes with adequate self-sufficiency in sunshine hours. PV generator sizes increase significantly during the harvest period, and with new consumption trends like collective consumption, these industries can improve the sustainability of their environment.
For the small and medium olive mills, placing a PV generator of 3 to 6 kWp can result in direct self-consumption indices up to 80% and 10 to 21% self-sufficiency in sunshine hours during the off-harvest period. Consumption similarities between small and medium olive mills during the off-harvest period, to auxiliary needs (air compressors, computer systems, lighting systems, etc.) rather than production processes, were noted.
Differences in energy consumption become evident during the harvest period, requiring larger PV generators for higher self-consumption and self-sufficiency in sunshine hours.
The large olive mill showed the best results, both for the harvest period and the off-harvest period, with self-sufficiency indices in sunshine hours of 66 and 52%, respectively. The smaller gap between consumption periods, harvest and off-harvest, leads to a greater use of photovoltaic generation compared to medium and small olive mills, making PV Rooftop systems ideal for this type of industry.
In a preliminary analysis, batteries enhance the self-sufficiency indices for every olive mill studied above a certain PV generator power threshold. Lower PV generator power (<5 kWp) provided no additional value, while higher powers lead to significant self-sufficiency indices increases, up to 10%, depending on the capacity.
The large olive mill consumption profile matches well with generation due to its high basal consumption throughout the year. However, decision-making for small and medium olive mills depends on the period studied and the desired energy management strategy of the industry. It is possible to install a small generator to face the off-harvest period consumption or install a large generator to cover the consumption during the harvest period. In the latter case, it may be interesting to explore the opportunities offered by collective consumption since the mills are usually located in rural areas but close to urban centers.
Based on the analysis carried out, the economic variables related to these systems deserve further study. Nevertheless, the reductions in non-renewable energy expenditure and GHG emissions suggest olive oil mills are strong candidates for distributed energy generators, given their favorable surface area for energy generation. Olive oil mills, influential in the Spanish economy and present globally in areas such as in Italy, Portugal, Greece, Africa, Asia, America, and Oceania, make this study applicable to regions with this type of agri-food industry.
On the other hand, the study has shown that the difference between the consumption of their operating periods, harvest and off-harvest, requires further analysis, including economic scenarios that, together with the energy analysis performed, can propose new indices based on PV generator and battery sizes. In addition, governments’ proposals, including storage systems and energy sharing via the creation of energy communities, could benefit industries with unbalanced power consumption.

Author Contributions

Methodology, J.L.S.-J., F.J.M.-R. and C.R.-C.; Formal analysis, G.J.-C. and A.J.M.-C.; Investigation, J.L.S.-J., F.J.M.-R., G.J.-C., A.J.M.-C. and C.R.-C.; Resources, A.J.M.-C.; Data curation, J.L.S.-J.; Writing—original draft, J.L.S.-J. and C.R.-C.; Writing—review & editing, J.L.S.-J., F.J.M.-R., G.J.-C., A.J.M.-C. and C.R.-C.; Supervision, F.J.M.-R. and C.R.-C. All authors have read and agreed to the published version of the manuscript.

Funding

This research was funded by the Agencia Estatal de Investigación (AEI). Projects oriented towards the ecological transition and the digital transition. (Grant No. TED2021-131137B-I00 “Aportación a la Transición Ecológica en el sector Industrial a través del Autoconsumo Fotovoltaico”). The authors also would like to thank the Project “Contribución al abastecimiento de energía eléctrica en pequeñas y medianas empresas de Andalucía. AcoGED_PYMES”. Ref: 1380927. Programa Operativo Proyectos de ID+i en el marco del Programa Operativo FEDER Andalucía 2014/2020. The authors also acknowledge the support provided by the Thematic Network 723RT0150 “Red para la integración a gran escala de energías renovables en sistemas electricos (RIBIERSE-CYTED)” financed by the call for Thematic Networks of the CYTED (Ibero-American Program of Science and Technology for Development) for 2022.

Data Availability Statement

The data that has been used is from the companies provided for this study.

Conflicts of Interest

Authors Jose Luis Sánchez-Jiménez, Gabino Jiménez-Castillo and Antonio Javier Martinez-Calahorro were employed by the company Grupo Marwen Calsan Ltd., Parque Científico Tecnológico Geolit, C/Sierra Morena, Edificio CTSA 1, 23620 Mengíbar, Jaén. The remaining authors declare that the research was conducted in the absence of any commercial or financial relationships that could be construed as a potential conflict of interest.

Appendix A

Figure A1. Cumulative daily consumption for small olive mill.
Energies 17 00144 g0a1
Figure A2. Cumulative daily consumption for medium olive mill.
Energies 17 00144 g0a2
Figure A3. Cumulative daily consumption for large olive mill.
Energies 17 00144 g0a3

References

  1. IEA. World Energy Outlook 2022; World Energy Outlook; OECD: Paris, France, 2022; ISBN 9789264425446. [Google Scholar]
  2. Dong, K.; Hochman, G.; Timilsina, G.R. Do Drivers of CO2 Emission Growth Alter Overtime and by the Stage of Economic Development? Energy Policy 2020, 140, 111420. [Google Scholar] [CrossRef]
  3. Yang, B.; Usman, M.; Jahanger, A. Do Industrialization, Economic Growth and Globalization Processes Influence the Ecological Footprint and Healthcare Expenditures? Fresh Insights Based on the STIRPAT Model for Countries with the Highest Healthcare Expenditures. Sustain. Prod. Consum. 2021, 28, 893–910. [Google Scholar] [CrossRef]
  4. Neves, S.A.; Marques, A.C.; Patrício, M. Determinants of CO2 Emissions in European Union Countries: Does Environmental Regulation Reduce Environmental Pollution? Econ. Anal. Policy 2020, 68, 114–125. [Google Scholar] [CrossRef]
  5. Adam, A.D.; Apaydin, G. Grid Connected Solar Photovoltaic System as a Tool for Green House Gas Emission Reduction in Turkey. Renew. Sustain. Energy Rev. 2016, 53, 1086–1091. [Google Scholar] [CrossRef]
  6. Su, C.W.; Pang, L.D.; Tao, R.; Shao, X.; Umar, M. Renewable Energy and Technological Innovation: Which One Is the Winner in Promoting Net-Zero Emissions? Technol. Forecast. Soc. Chang. 2022, 182, 121798. [Google Scholar] [CrossRef]
  7. Jahangir, M.H.; Montazeri, M.; Mousavi, S.A.; Kargarzadeh, A. Reducing Carbon Emissions of Industrial Large Livestock Farms Using Hybrid Renewable Energy Systems. Renew. Energy 2022, 189, 52–65. [Google Scholar] [CrossRef]
  8. Council European Parliament. E.U. Directive (EU) 2018/2001 on the Promotion of the Use of Energy from Renewable Sources (Recast); European Parliament: Strasbourg, France, 2018. [Google Scholar]
  9. Zaharia, A.; Diaconeasa, M.C.; Brad, L.; Lădaru, G.-R.; Ioanăș, C. Factors Influencing Energy Consumption in the Context of Sustainable Development. Sustainability 2019, 11, 4147. [Google Scholar] [CrossRef]
  10. Ministerio de Industria y Energía. La Energía En España; Centro de Publicaciones: Madrid, Spain, 2021. [Google Scholar]
  11. Alcántara, V.; Padilla, E. Key Sectors in Greenhouse Gas Emissions in Spain: An Alternative Input—Output Analysis. J. Ind. Ecol. 2020, 24, 577–588. [Google Scholar] [CrossRef]
  12. Bajan, B.; Mrówczyńska-Kamińska, A.; Poczta, W. Economic Energy Efficiency of Food Production Systems. Energies 2020, 13, 5826. [Google Scholar] [CrossRef]
  13. Saviuc, I.; Peremans, H.; Van Passel, S.; Milis, K. Economic Performance of Using Batteries in European Residential Microgrids under the Net-Metering Scheme. Energies 2019, 12, 165. [Google Scholar] [CrossRef]
  14. Red Eléctrica de España Informes de Generación. Available online: https://www.ree.es/es/datos/generacion (accessed on 11 February 2023).
  15. Saha, S.; Saini, G.; Mishra, S.; Chauhan, A.; Upadhyay, S. A Comprehensive Review of Techno-Socio-Enviro-Economic Parameters, Storage Technologies, Sizing Methods and Control Management for Integrated Renewable Energy System. Sustain. Energy Technol. Assess. 2022, 54, 102849. [Google Scholar] [CrossRef]
  16. Gandiglio, M.; Marocco, P.; Bianco, I.; Lovera, D.; Blengini, G.A.; Santarelli, M. Life Cycle Assessment of a Renewable Energy System with Hydrogen-Battery Storage for a Remote off-Grid Community. Int. J. Hydrogen Energy 2022, 47, 32822–32834. [Google Scholar] [CrossRef]
  17. Sahebi, H.; Khodoomi, M.; Seif, M.; Pishvaee, M.S.; Hanne, T. The Benefits of Peer-to-Peer Renewable Energy Trading and Battery Storage Backup for Local Grid. J. Energy Storage 2023, 63, 106970. [Google Scholar] [CrossRef]
  18. Liu, J.; Wu, H.; Huang, H.; Yang, H. Renewable Energy Design and Optimization for a Net-Zero Energy Building Integrating Electric Vehicles and Battery Storage Considering Grid Flexibility. Energy Convers. Manag. 2023, 298, 117768. [Google Scholar] [CrossRef]
  19. Sifnaios, I.; Sneum, D.M.; Jensen, A.R.; Fan, J.; Bramstoft, R. The Impact of Large-Scale Thermal Energy Storage in the Energy System. Appl. Energy 2023, 349, 121663. [Google Scholar] [CrossRef]
  20. Costa, V.B.F.; e Silva, T.L.M.R.; Morais, L.B.S.; Bonatto, B.D.; Zambroni, A.C.; Guedes, P.A.; Ribeiro, P.F. Economic Analysis of Industrial Energy Storage Systems in Brazil: A Stochastic Optimization Approach. Sustain. Energy Grids Netw. 2023, 33, 100968. [Google Scholar] [CrossRef]
  21. Ben Youssef, W.; Maatallah, T.; Menezo, C.; Ben Nasrallah, S. Assessment Viability of a Concentrating Photovoltaic/Thermal-Energy Cogeneration System (CPV/T) with Storage for a Textile Industry Application. Sol. Energy 2018, 159, 841–851. [Google Scholar] [CrossRef]
  22. Lebedeva, N.; Tarvydas, D.; Tsiropoulos, I.; European Commission. Li-Ion Batteries for Mobility and Stationary Storage Applications: Scenarios for Costs and Market Growth; Joint Research Centre: Brussels, Belgium, 2018; ISBN 9789279972546. [Google Scholar]
  23. Trahey, L.; Brushett, F.R.; Balsara, N.P.; Ceder, G.; Cheng, L.; Chiang, Y.M.; Hahn, N.T.; Ingram, B.J.; Minteer, S.D.; Moore, J.S.; et al. Energy Storage Emerging: A Perspective from the Joint Center for Energy Storage Research. Proc. Natl. Acad. Sci. USA 2020, 117, 12550–12557. [Google Scholar] [CrossRef]
  24. IEA Global EV Outlook 2023: Catching up with Climate Ambitions; IEA: Paris, France, 2023.
  25. Chang, R.; Cao, Y.; Lu, Y.; Shabunko, V. Should BIPV Technologies Be Empowered by Innovation Policy Mix to Facilitate Energy Transitions?—Revealing Stakeholders’ Different Perspectives Using Q Methodology. Energy Policy 2019, 129, 307–318. [Google Scholar] [CrossRef]
  26. Lucchi, E. Integration between Photovoltaic Systems and Cultural Heritage: A Socio-Technical Comparison of International Policies, Design Criteria, Applications, and Innovation Developments. Energy Policy 2022, 171, 113303. [Google Scholar] [CrossRef]
  27. Pagliaro, M.; Ciriminna, R.; Palmisano, G. BIPV: Merging the Photovoltaic with the Construction Industry. Prog. Photovolt. Res. Appl. 2010, 18, 61–72. [Google Scholar] [CrossRef]
  28. Lucchi, E.; Adami, J.; Peluchetti, A.; Camilo Mahecha Zambrano, J. Photovoltaic Potential Estimation of Natural and Architectural Sensitive Land Areas to Balance Heritage Protection and Energy Production. Energy Build. 2023, 290, 113107. [Google Scholar] [CrossRef]
  29. Lucchi, E.; Adami, J.; Stawinoga, A.E. Social Acceptance of Photovoltaic Systems in Heritage Buildings and Landscapes: Exploring Barriers, Benefits, Drivers, and Challenges for Technical Stakeholders in Northern Italy. Sustain. Energy Technol. Assess. 2023, 60, 103544. [Google Scholar] [CrossRef]
  30. Uldrijan, D.; Kováčiková, M.; Jakimiuk, A.; Vaverková, M.D.; Winkler, J. Ecological Effects of Preferential Vegetation Composition Developed on Sites with Photovoltaic Power Plants. Ecol. Eng. 2021, 168, 106274. [Google Scholar] [CrossRef]
  31. Vaverková, M.D.; Winkler, J.; Uldrijan, D.; Ogrodnik, P.; Vespalcová, T.; Aleksiejuk-Gawron, J.; Adamcová, D.; Koda, E. Fire Hazard Associated with Different Types of Photovoltaic Power Plants: Effect of Vegetation Management. Renew. Sustain. Energy Rev. 2022, 162, 112491. [Google Scholar] [CrossRef]
  32. Guo, Y.; Xiang, Y. Cost–Benefit Analysis of Photovoltaic-Storage Investment in Integrated Energy Systems. Energy Rep. 2022, 8, 66–71. [Google Scholar] [CrossRef]
  33. Tsai, C.-T.; Ocampo, E.M.; Beza, T.M.; Kuo, C.-C. Techno-Economic and Sizing Analysis of Battery Energy Storage System for behind-the-Meter Application. IEEE Access 2020, 8, 203734–203746. [Google Scholar] [CrossRef]
  34. Kumar, P.; Malik, N.; Garg, A. Comparative Analysis of Solar-Battery Storage Sizing in Net Metering and Zero Export Systems. Energy Sustain. Dev. 2022, 69, 41–50. [Google Scholar] [CrossRef]
  35. Xu, G.; Shang, C.; Fan, S.; Zhang, X.; Cheng, H. Sizing Battery Energy Storage Systems for Industrial Customers with Photovoltaic Power. Energy Procedia 2019, 158, 4953–4958. [Google Scholar] [CrossRef]
  36. Chel, A.; Kaushik, G. Renewable Energy for Sustainable Agriculture. Agron. Sustain. Dev. 2011, 31, 91–118. [Google Scholar] [CrossRef]
  37. Mekhilef, S.; Faramarzi, S.Z.; Saidur, R.; Salam, Z. The Application of Solar Technologies for Sustainable Development of Agricultural Sector. Renew. Sustain. Energy Rev. 2013, 18, 583–594. [Google Scholar] [CrossRef]
  38. Ali, N.; Wahid, A.; Shaw, R.; Mason, K. Reinforcement Learning for Battery Management in Dairy Farming. arXiv 2023, arXiv:2308.09023. [Google Scholar]
  39. Garcia, A.V.M.; Sánchez-Romero, F.J.; López-Jiménez, P.A.; Pérez-Sánchez, M. A New Optimization Approach for the Use of Hybrid Renewable Systems in the Search of the Zero Net Energy Consumption in Water Irrigation Systems. Renew. Energy 2022, 195, 853–871. [Google Scholar] [CrossRef]
  40. Squatrito, R.; Sgroi, F.; Tudisca, S.; di Trapani, A.M.; Testa, R. Post Feed-in Scheme Photovoltaic System Feasibility Evaluation in Italy: Sicilian Case Studies. Energies 2014, 7, 7147–7165. [Google Scholar] [CrossRef]
  41. Sgroi, F.; Tudisca, S.; di Trapani, A.M.; Testa, R.; Squatrito, R. Efficacy and Efficiency of Italian Energy Policy: The Case of PV Systems in Greenhouse Farms. Energies 2014, 7, 3985–4001. [Google Scholar] [CrossRef]
  42. Carroquino, J.; Roda, V.; Mustata, R.; Yago, J.; Valiño, L.; Lozano, A.; Barreras, F. Combined Production of Electricity and Hydrogen from Solar Energy and Its Use in the Wine Sector. Renew. Energy 2018, 122, 251–263. [Google Scholar] [CrossRef]
  43. Federación Andaluza de Empresas Cooperativas Agrarias. Manual de Ahorro y Eficiencia Energética Del Sector; Federación Andaluza de Empresas Cooperativas Agrarias: Madrid, Spain, 2020. [Google Scholar]
  44. Jiménez-Castillo, G.; Muñoz-Rodríguez, F.J.; Martinez-Calahorro, A.J.; Tina, G.M.; Rus-Casas, C. Impacts of Array Orientation and Tilt Angles for Photovoltaic Self-Sufficiency and Self-Consumption Indices in Olive Mills in Spain. Electronics 2020, 9, 348. [Google Scholar] [CrossRef]
  45. Muñoz-Rodríguez, F.J.; Jiménez-Castillo, G.; Hernández, J.d.l.C.; Peña, J.D.A. A New Tool to Analysing Photovoltaic Self-Consumption Systems with Batteries. Renew. Energy 2021, 168, 1327–1343. [Google Scholar] [CrossRef]
  46. Martínez-Calahorro, A.J.; Jiménez-Castillo, G.; Rus-Casas, C.; Gómez-Vidal, P.; Muñoz-Rodríguez, F.J. Photovoltaic Self-Consumption in Industrial Cooling and Refrigeration. Electronics 2020, 9, 2204. [Google Scholar] [CrossRef]
  47. European Commission. Market Situation in the Olive Oil and Table Olives Sectors. In Committee for the Common Organisation of the Agricultural Markets-Arable Crops and Olive Oil; European Commission: Brussels, Belgium, 2022. [Google Scholar]
  48. Sistema de Información de los Mercados Oleícolas, (SIMO). Avance de la Situación de Mercado del Sector Oleícola Campaña 2020/21; Ministerio de Agricultura, Alimentación y Medio Ambiente, Gobierno de España: Madrid, Spain, 2021. [Google Scholar]
  49. Ministerio de Agricultura, Alimentación y Medio Ambiente, (MAPA). Anuario de Estadística Agroalimentaria; Ministerio de Agricultura, Alimentación y Medio Ambiente, Gobierno de España: Madrid, Spain, 2021. [Google Scholar]
  50. Sánchez-Martínez, J.D.; Rodríguez-Cohard, J.C.; Garrido-Almonacid, A.; Gallego-Simón, V.J. Territorial Challenges in Rural Areas: Performance and Potential of Innovative Olive Cooperatives in Andalusia (Spain). Terra Rev. Desarro. Local 2022, 29, 23725. [Google Scholar] [CrossRef]
  51. López, V.C.; Avi, J.R.; Jiménez, M.J.O.; Reinoso, J.R. A Modelling of the Number of Almazaras by Municipality in Andalusia. Stud. Appl. Econ. 2022, 40, 3. [Google Scholar]
  52. Ncube, A.; Fiorentino, G.; Panfilo, C.; De Falco, M.; Ulgiati, S. Circular Economy Paths in the Olive Oil Industry: A Life Cycle Assessment Look into Environmental Performance and Benefits. Int. J. Life Cycle Assess. 2022. [Google Scholar] [CrossRef]
  53. Ministerio para la Transición Ecológica. Real Decreto 244/2019, de 5 de Abril, Por El Que Se Regulan Las Condiciones Administrativas, Técnicas y Económicas Del Autoconsumo de Energía Eléctrica; Ministerio para la Transición Ecológica: Madrid, Spain, 2019. [Google Scholar]
  54. Jiménez-Torres, M.; Rus-Casas, C.; Lemus-Zúiga, L.; Hontoria, L. The Importance of Accurate Solar Data for Designing Solar Photovoltaic Systems—Case Studies in Spain. Sustainability 2017, 9, 247. [Google Scholar] [CrossRef]
  55. Jiménez-Castillo, G.; Rus-Casas, C.; Tina, G.M.; Muñoz-Rodriguez, F.J. Effects of Smart Meter Time Resolution When Analyzing Photovoltaic Self-Consumption System on a Daily and Annual Basis. Renew. Energy 2021, 164, 889–896. [Google Scholar] [CrossRef]
  56. Sun, S.I.; Smith, B.D.; Wills, R.G.A.; Crossland, A.F. Effects of Time Resolution on Finances and Self-Consumption When Modeling Domestic PV-Battery Systems. In Proceedings of the Energy Reports; Elsevier: Amsterdam, The Netherlands, 1 May 2020; Volume 6, pp. 157–165. [Google Scholar]
  57. UNE-EN 61724-1:2017; Photovoltaic System Performance Monitoring-Part 1: Monitoring. IEC: Madrid, Spain, 2018; ISBN 978-2-8322-3988-9.
  58. Huld, T.; Müller, R.; Gambardella, A. A New Solar Radiation Database for Estimating PV Performance in Europe and Africa. Sol. Energy 2012, 86, 1803–1815. [Google Scholar] [CrossRef]
  59. Wei, T.; Junfeng, L.I. Analysis on the Status Quo of Rural Energy Consumption and “Carbon Neutrality” Capability. Energy China 2021, 43, 60–65. [Google Scholar]
  60. Rus-Casas, C.; Aguilar, J.D.; Rodrigo, P.; Almonacid, F.; Pérez-Higueras, P.J. Classification of Methods for Annual Energy Harvesting Calculations of Photovoltaic Generators. Energy Convers. Manag. 2014, 78, 527–536. [Google Scholar] [CrossRef]
  61. Schweiger, M.; Herrmann, W.; Gerber, A.; Rau, U. Understanding the Energy Yield of Photovoltaic Modules in Different Climates by Linear Performance Loss Analysis. IET Renew. Power Gener. 2017, 11, 558–565. [Google Scholar] [CrossRef]
  62. Muñoz, J.V.; Nofuentes, G.; Fuentes, M.; de la Casa, J.; Aguilera, J. DC Energy Yield Prediction in Large Monocrystalline and Polycrystalline PV Plants: Time-Domain Integration of Osterwald’s Model. Energy 2016, 114, 951–960. [Google Scholar] [CrossRef]
  63. Rodrigo, P.; Rus, C.; Almonacid, F.; Pérez-Higueras, P.J.; Almonacid, G. A New Method for Estimating Angular, Spectral and Low Irradiance Losses in Photovoltaic Systems Using an Artificial Neural Network Model in Combination with the Osterwald Model. Sol. Energy Mater. Sol. Cells 2012, 96, 186–194. [Google Scholar] [CrossRef]
  64. Fuentes, M.; Nofuentes, G.; Aguilera, J.; Talavera, D.L.; Castro, M. Application and Validation of Algebraic Methods to Predict the Behaviour of Crystalline Silicon PV Modules in Mediterranean Climates. Sol. Energy 2007, 81, 1396–1408. [Google Scholar] [CrossRef]
  65. Torres-Ramírez, M.; Nofuentes, G.; Silva, J.P.; Silvestre, S.; Muñoz, J.V. Study on Analytical Modelling Approaches to the Performance of Thin Film PV Modules in Sunny Inland Climates. Energy 2014, 73, 731–740. [Google Scholar] [CrossRef]
  66. Reich, N.H.; Mueller, B.; Armbruster, A.; van Sark, W.G.J.H.M.; Kiefer, K.; Reise, C. Performance Ratio Revisited: Is PR > 90% Realistic? Prog. Photovolt. Res. Appl. 2012, 20, 717–726. [Google Scholar] [CrossRef]
  67. Muñoz-Rodríguez, F.J.; Jiménez-Castillo, G.; Rus-Casas, C. Photovoltaic Rooftops in Smart Energy Systems. In Handbook of Smart Energy Systems; Mahdi, F., Zio, E., Pardalos, P.M., Eds.; Springer: Cham, Switzerland, 2021; pp. 1–28. ISBN 978-3-030-72322-4. [Google Scholar]
  68. Talavera, D.L.; Muñoz-Rodriguez, F.J.; Jimenez-Castillo, G.; Rus-Casas, C. A New Approach to Sizing the Photovoltaic Generator in Self-Consumption Systems Based on Cost–Competitiveness, Maximizing Direct Self-Consumption. Renew. Energy 2019, 130, 1021–1035. [Google Scholar] [CrossRef]
  69. Luthander, R.; Widén, J.; Nilsson, D.; Palm, J. Photovoltaic Self-Consumption in Buildings: A Review. Appl. Energy 2015, 142, 80–94. [Google Scholar] [CrossRef]
  70. Weniger, J.; Tjaden, T.; Quaschning, V. Sizing of Residential PV Battery Systems. Energy Procedia 2014, 46, 78–87. [Google Scholar] [CrossRef]
  71. Mulder, G.; de Ridder, F.; Six, D. Electricity Storage for Grid-Connected Household Dwellings with PV Panels. Sol. Energy 2010, 84, 1284–1293. [Google Scholar] [CrossRef]
  72. Nyholm, E.; Goop, J.; Odenberger, M.; Johnsson, F. Solar Photovoltaic-Battery Systems in Swedish Households–Self-Consumption and Self-Sufficiency. Appl. Energy 2016, 183, 148–159. [Google Scholar] [CrossRef]
  73. Rana, M.M.; Uddin, M.; Sarkar, M.R.; Shafiullah, G.M.; Mo, H.; Atef, M. A Review on Hybrid Photovoltaic-Battery Energy Storage System: Current Status, Challenges, and Future Directions. J. Energy Storage 2022, 51, 104597. [Google Scholar] [CrossRef]
  74. Emad, D.; El-Hameed, M.A.; El-Fergany, A.A. Optimal Techno-Economic Design of Hybrid PV/Wind System Comprising Battery Energy Storage: Case Study for a Remote Area. Energy Convers. Manag. 2021, 249, 114847. [Google Scholar] [CrossRef]
  75. Gul, E.; Baldinelli, G.; Bartocci, P.; Bianchi, F.; Domenighini, P.; Cotana, F.; Wang, J. A Techno-Economic Analysis of a Solar PV and DC Battery Storage System for a Community Energy Sharing. Energy 2022, 244, 123191. [Google Scholar] [CrossRef]
  76. Alonso, A.M.; Costa, D.; Messagie, M.; Coosemans, T. Techno-Economic Assessment on Hybrid Energy Storage Systems Comprising Hydrogen and Batteries: A Case Study in Belgium. Int. J. Hydrogen Energy 2023, in press. [Google Scholar] [CrossRef]
  77. Escamilla, A.; Sánchez, D.; García-Rodríguez, L. Techno-Economic Study of Power-to-Power Renewable Energy Storage Based on the Smart Integration of Battery, Hydrogen, and Micro Gas Turbine Technologies. Energy Convers. Manag. X 2023, 18, 100368. [Google Scholar] [CrossRef]
  78. López Prol, J.; Steininger, K.W. Photovoltaic Self-Consumption Is Now Profitable in Spain: Effects of the New Regulation on Prosumers’ Internal Rate of Return. Energy Policy 2020, 146, 111793. [Google Scholar] [CrossRef]
  79. Zhang, Y.; Campana, P.E.; Lundblad, A.; Yan, J. Comparative Study of Hydrogen Storage and Battery Storage in Grid Connected Photovoltaic System: Storage Sizing and Rule-Based Operation. Appl. Energy 2017, 201, 397–411. [Google Scholar] [CrossRef]
  80. Ijeoma, M.W.; Chen, H.; Carbajales-Dale, M.; Yakubu, R.O. Techno-Economic Assessment of the Viability of Commercial Solar PV System in Port Harcourt, Rivers State, Nigeria. Energies 2023, 16, 6803. [Google Scholar] [CrossRef]
  81. Quijano, A.; Lorenzo, C.; Narvarte, L. Economic Assessment of a PV-HP System for Drying Alfalfa in The North of Spain. Energies 2023, 16, 3347. [Google Scholar] [CrossRef]
  82. Yang, B.; Guo, Y.; Xiao, X.; Tian, P. Bi-Level Capacity Planning of Wind-PV-Battery Hybrid Generation System Considering Return on Investment. Energies 2020, 13, 3046. [Google Scholar] [CrossRef]
  83. Ciocia, A.; Amato, A.; Di Leo, P.; Fichera, S.; Malgaroli, G.; Spertino, F.; Tzanova, S. Self-Consumption and Self-Sufficiency in Photovoltaic Systems: Effect of Grid Limitation and Storage Installation. Energies 2021, 14, 1591. [Google Scholar] [CrossRef]
  84. Gallego-Castillo, C.; Heleno, M.; Victoria, M. Self-Consumption for Energy Communities in Spain: A Regional Analysis under the New Legal Framework. Energy Policy 2021, 150, 112144. [Google Scholar] [CrossRef]
  85. Terlouw, T.; AlSkaif, T.; Bauer, C.; van Sark, W. Multi-Objective Optimization of Energy Arbitrage in Community Energy Storage Systems Using Different Battery Technologies. Appl. Energy 2019, 239, 356–372. [Google Scholar] [CrossRef]
  86. Renewable Energy Agency. Renewable Power Generation Costs in 2022; Renewable Energy Agency: Abu Dhabi, United Arab Emirates, 2023; ISBN 978-92-9260-544-5. [Google Scholar]
  87. Perdigones, A.; García, J.L.; García, I.; Baptista, F.; Mazarrón, F.R. Economic Feasibility of PV Mounting Structures on Industrial Roofs. Buildings 2023, 13, 2834. [Google Scholar] [CrossRef]
  88. Ordóñez, Á.; Sánchez, E.; Rozas, L.; García, R.; Parra-Domínguez, J. Net-Metering and Net-Billing in Photovoltaic Self-Consumption: The Cases of Ecuador and Spain. Sustain. Energy Technol. Assess. 2022, 53, 102434. [Google Scholar] [CrossRef]
  89. de Doile, G.N.D.; Rotella Junior, P.; Rocha, L.C.S.; Janda, K.; Peruchi, R.; Aquila, G.; Balestrassi, P.P. Impacts of Economic Regulation on Photovoltaic Distributed Generation with Battery Energy Storage Systems. J. Energy Storage 2023, 72, 108382. [Google Scholar] [CrossRef]
Figure 1. Methodology implemented in the development of the study.
Energies 17 00144 g001
Figure 2. Accumulated daily energy consumption of the olive mills studied: (a) Small olive mill; (b) Medium olive mill; (c) Large olive mill.
Energies 17 00144 g002aEnergies 17 00144 g002b
Figure 3. Cumulative daily consumption for a harvest month (January) for the three types of olive mills.
Energies 17 00144 g003
Figure 4. Cumulative daily consumption for a harvest month (May) for the three types of olive mills.
Energies 17 00144 g004
Figure 5. Hourly consumption profile for a typical day at a small olive mill: (a) Harvest period; (b) Off-harvest period.
Energies 17 00144 g005
Figure 6. Hourly consumption profile for a typical day at the medium olive mill: (a) harvest period; (b) off-harvest period.
Energies 17 00144 g006
Figure 7. Hourly consumption profile for a typical day at a large olive mill: (a) harvest period; (b) off-harvest period.
Energies 17 00144 g007
Figure 8. Flow chart of the applied methodology for the analysis of self-consumption and self-sufficiency with and without batteries.
Energies 17 00144 g008
Figure 9. Flow chart of the applied methodology for the analysis of the PV generator and battery [45].
Energies 17 00144 g009
Figure 10. Self-consumption and self-sufficiency curves for the different types of olive mills and periods considered: (a) Annual; (b) Harvest period; (c) Off-harvest period.
Energies 17 00144 g010
Figure 11. isoSC (green) and isoSS (blue) annual curves. (a) Small olive mill; (b) Medium olive mill; (c) Large olive mill.
Energies 17 00144 g011aEnergies 17 00144 g011b
Figure 12. isoSC (green) and isoSS (blue) harvest period curves. (a) Small olive mill; (b) Medium olive mill; (c) Large olive mill.
Energies 17 00144 g012
Figure 13. isoSC (green) and isoSS (blue) off-harvest period curves. (a) Small olive mill; (b) Medium olive mill; (c) Large olive mill.
Energies 17 00144 g013
Table 1. Annual energy consumption and classification of monitored mills.
IndustryAnnual Energy Consumption
(kWh)
Classification
Olive mill 1313Small
Olive mill 2699Medium
Olive mill 31407Large
Table 2. Monthly energy consumption, monthly consumption rate for each olive mill under study.
Period E L , m o n t h
(kWh/Period)
MCR
(%)
SmallMediumLargeSmallMediumLarge
June2140.62296.068,283.00.70.34.9
July2361.32794.764,509.00.80.44.6
August2002.41904.967,635.00.60.34.8
September1981.43535.952,970.00.60.53.8
October4709.48083.367,194.01.51.24.8
November28,388.866,756.0125,344.09.19.68.9
December129,409.0277,884.0198,244.041.339.814.1
January127,661.0299,849.0233,352.040.742.916.6
February8206.527,073.7208,175.02.63.914.8
March2149.25377.5139,263.00.70.89.9
April2246.31668.8107,102.00.70.27.6
May2101.41501.075,133.00.70.25.3
Total313,357.1698,724.81,407,204.0100100100
Table 3. Self-consumption and self-sufficiency indices during sunshine hours indices together with their corresponding array power for each olive mill and each period studied.
AnnualHarvest PeriodOff-Harvest Period
ϕ S C , d i r e c t
(%)
ϕ S S S H
(%)
P 0
(kW)
ϕ S S S H
(%)
P 0
(kW)
ϕ S S S H
(%)
P 0
(kW)
Small90441053153
806736176215
Medium90121012053
802534460106
Large9024107322473285
80432186656052154
Disclaimer/Publisher’s Note: The statements, opinions and data contained in all publications are solely those of the individual author(s) and contributor(s) and not of MDPI and/or the editor(s). MDPI and/or the editor(s) disclaim responsibility for any injury to people or property resulting from any ideas, methods, instructions or products referred to in the content.

