Article

Smart Contracts-Based Demand Response Bidding Mechanism to Enhance the Load Aggregator Model in Thailand

by
Anchisa Pinyo
1,2,* and
Athikom Bangviwat
1,2,*
1
The Joint Graduate School of Energy and Environment, King Mongkut’s University of Technology Thonburi, Bangkok 10140, Thailand
2
Center of Excellence on Energy Technology and Environment (CEE), Ministry of Higher Education Science Research and Innovation (MHESI), Bangkok 10140, Thailand
*
Authors to whom correspondence should be addressed.
Energies 2023, 16(8), 3606; https://doi.org/10.3390/en16083606
Submission received: 13 March 2023 / Revised: 15 April 2023 / Accepted: 18 April 2023 / Published: 21 April 2023
(This article belongs to the Special Issue Blockchain, IoT and Smart Grids Challenges for Energy)

Abstract

:
In 2022, Thailand’s Demand Response (DR) business model was shifting from the Traditional Utility (TU) model to the Load Aggregator (LA) model in accordance with Thailand’s smart grid master plan. This research studied the current demand response model and mechanism to draw possible gaps in operations. This research deals with the data system owned by the individual load aggregator. The load aggregators collect meter data and evaluate demand adaptations before sending the results to claim compensation on behalf of their customers. This approach lacks transparency and facilitates distortion of the facts. Hence, this research introduces the data execution by smart contracts and data records on the blockchain that enhance transparent data sharing among multiple parties and maintain data integrity. Moreover, the proposed bidding algorithm allows customers to offer an expected price under the maximum incentive payment determined by the avoided costs of running the peaking power plants. Hence, the bidding helps reflect the DR operation costs on the customer side and control the budget for incentive payments. This study emphasized the smart contracts and decentralized application layer, so the public blockchain is a reasonable network for the test. However, implementation in real cases using the public blockchain requires careful considerations, such as network fees, transaction speeds, and the security of smart contract codes.

1. Introduction

By section 1252(e)(3) of the Energy Policy Act of 2005, Federal Energy Regulatory Commission (FERC) defined the demand response as changes in electric usage by demand-side resources from their normal consumption patterns in response to changes in the price of electricity over time, or to incentive payments designed to induce lower electricity use at times of high wholesale market prices or when system reliability is jeopardized [1]. As presented in Thailand Smart Grid Master Plan, the demand response business models are broadly classified into three models by customer participation: (i) the Traditional Utility (TU) model, a model in which individual customers directly contract with a utility which manages the whole process of demand response programs; (ii) the Load Aggregator (LA) model, a model where a third-party firm is responsible for aggregate customers’ loads and provides them with utilities or the capability to trade as a resource in the power market; and (iii) the Customer Provisioned model, a model where large electricity customers directly offer the demand response resources to trade in the power market [2].

1.1. The Review of Demand Response Programs in Thailand

Thailand’s demand response business model was initially implemented in the form of the Traditional Utility model. In 2004, the Peak Cut project launched by the Electricity Generating Authority of Thailand (EGAT) allowed industries to run their backup generators instead of consuming electricity from the grid. However, the project was rejected because the diesel price was increasing. In 2008, the Yadana gas plant was temporally shut down due to maintenance, so the Ministry of Energy announced the Interruptible Load Program to address the power reserve during the system peak. In 2014, the Energy Regulatory Commission of Thailand (ERC) launched a Demand Response (DR) pilot program, which was a combination of the Critical Peak Time Rebate (CPTR) and the Emergency Demand Response Program (EDRP). The main purpose of the pilot program was to save the fuel cost of running peaking plants, so the compensation rate was determined by the avoided costs during the system peak. There were four implementations within the pilot program, twice for the whole country and twice for the south of Thailand. The implementation results showed that the total demand reductions did not reach the targets, except for the third implementation in April 2015 [3].
Since 2015, the Energy Policy and Planning Office (EPPO) Ministry of Energy has launched the smart grid master plan as a roadmap to develop Thailand’s power sector. Within the demand response aspect, Thailand’s smart grid master plan has driven the restructuring of the demand response from the Traditional Utility model to the Load Aggregator model and the Customer Provisioned model, respectively. In 2022, Energy Policy and Planning Office (EPPO) proposed the commit capacity program, a Load Aggregator demand response model, which consists of a collaboration of multiple entities [4]. Figure 1 shows the roles and interactions of each responsible party, which are:
(i)
The Energy Policy and Planning Office (EPPO) issues the demand response programs and incentive rates and then submits them to National Energy Policy Council (NEPC) for approval.
(ii)
The Energy Regulatory Commission of Thailand (ERC) announces and regulates the demand response program and incentive rates.
(iii)
The Electricity Generating Authority of Thailand (EGAT) established the Demand Response Control Center (DRCC) for the overall demand response management throughout the country. The DRCC receives DR orders from National Control Center (NCC) and forwards them to the Firm Load Aggregator Management System (Firm LAMS).
(iv)
The Load Aggregators, a new business role that has a number of contracted customers, forward the DR signal to their customers. Then, the customers shift their loads according to the agreements. Thailand initially implemented the Load aggregator model in 2022. Hence, the Provincial Electricity Authority (PEA) and Metropolitan Electricity Authority (MEA) were assigned to this role.
Due to the current demand response operation and semi-auto demand response (orange zone), the load aggregators (MEA and PEA) evaluate the customer’s load adaptations using the metered data from individual load aggregator’s Advanced Metering Infrastructures (AMIs). Then, they claim compensation for their customers based on the demand response rates in Table 1. The current demand response rates are fixed and determined by the avoided cost of running peaking power plants.
However, based on the smart grid plan, Thailand’s demand response operation will shift to the fully auto demand response (green zone). Hence, the demand response control center will execute the whole country’s demand response evaluation and settlement instead of the individual load aggregator’s management systems.

1.2. The Review of Blockchain-Based Demand Response Programs

According to Thailand’s smart grid master plan, the demand response model will be transformed into the Load Aggregator model, which requires a collaboration of multiple parties to provide services to support the demand response mechanism. Hence, this section studies how to apply the blockchain and smart contracts to the demand response context because they are helpful tools to support the secure sharing of data among multiple entities. As summarized in Table 2, there are two main categories of demand response programs, incentive- and price-based demand response programs. The key objectives of the incentive-based demand response service are to promote grid balance in a community and to adjust loads depending on the DR signals. Hence, the features of smart contracts are to support consumption baseline load calculation, demand response evaluation, and settlement. In the case of price-based demand response programs, the main purposes are to maximize profits or minimize costs of community or individual users using home or building energy management controllers. The energy management controllers adjust the electric loads depending on significant parameters, such as dynamic electricity pricing or the probability of the next hour. In this case, the blockchain securely holds and shares these parameters so that the controllers can call the parameters and manage their loads.

1.3. Problem Statement

Thailand’s demand response business model is a Load Aggregator model, which supports the enhanced single-buyer power market structure. However, from the review, the current demand response mechanism still faces problems that are arranged in sequence relevant to this research as follows:
(i)
The current model assigns load aggregators to collect meter data and evaluate demand responses before sending the results to claim compensation on behalf of its customers. The data records lack transparency and ease of distorting the facts.
(ii)
The demand response rates are fixed and only reflect the costs of the supply side. Hence, the electricity end users cannot sacrifice their workloads to participate in the demand response program because the benefits received from demand response are below the participation costs.
(iii)
The demand response programs lack flexibility on a particular date and time of requests based on the current demand-supply imbalance. This leads to the waste of budgets without problem-solving.
(iv)
The performance rate used in the current evaluation method cannot reflect the stability of demand adaptation from customers.
(v)
The Consumption Baseline Load (CBL) calculation sets at the beginning of participation time. Then, the CBL dataset is used in a single time of the demand response request. These CBLs lead to a free-rider problem and the variability of seasonal consumption.

1.4. Research Contributions

To fill the gaps in demand response operation, this article aims to propose a smart contracts-based demand response bidding mechanism modified by Thailand’s current demand response model. The data execution by smart contracts and data records on the blockchain enhances transparent data sharing among multiple parties and maintain data integrity instead of the data system owned by the individual aggregators. The proposed design of smart contracts can execute bids in the bidding process and load adaptations in the evaluation process. Furthermore, this study developed a guaranteed fund system to ensure the incentive or penalty transfer through the demand response mechanism.
The proposed demand response bidding mechanism allows customers to offer an expected price under the maximum incentive payment. Hence, the bid prices set by individual customers can reflect the demand response participation costs. Furthermore, this approach is capable of setting the demand response requests at a particular date and time, especially during the system peak. Moreover, the proposed performance rate used in the evaluation step helps reflect the stability of customer demand adaptation. The CBL used in performance rate calculation is recalculated at every time of evaluation.

2. The Design of Demand Response Bidding Mechanism for Thailand

This section presents the design of a demand response mechanism and describes how the business players participate through the proposed mechanism.

2.1. Business Players and Roles

Based on Thailand’s power market structure, the enhanced-single buyer model, the feasible form of demand response business model is a centralized pattern. Figure 2 represents the proposed system architecture modified from the current LA model in Thailand’s smart grid master plan. This model is presented in case a number of load aggregators will be integrated into Thailand’s power market. The load aggregators and large electricity end users are private business companies participating in demand response programs, but EGAT, PEA, and MEA still own the Advanced Metering Infrastructures (AMIs). Three groups of business players exist: (i) policymakers and regulators, (ii) operators, and (iii) customers.

2.1.1. Policymaker and Regulator

In this model, the policymaker, the Energy Policy and Planning Office (EPPO), is responsible for issuing the demand response policy. Then, the regulator, the Energy Regulatory Commission of Thailand (ERC), is responsible for setting the bid price cap, which refers to the maximum incentive payment. The maximum incentive payment is generally determined based on the avoided cost of running peaking power plants, and the long-term power purchase agreements arrange the power plant’s scheduling.

2.1.2. Operators

There are two categories of operators. The market operator (orange) is responsible for managing the Demand Response Control Center (DRCC) and National Control Center (NCC). The market operator sets up a DR order from the forecasting information received by the National Control Center. This model presents a new role called meter data providers. In this case, the meter data providers who own the Advanced Metering Infrastructures provide the DR Control Center metered data.

2.1.3. Customers

Load Aggregators (LA) and electricity end users work as customers who bid for the expected price of demand adaptations sold on the DR Control Center. If their demand reduction achieves the commitment, they will receive compensation. Otherwise, they will be charged a penalty. In this case, the load aggregators provide services to manage their contracted customer’s loads and claim incentives based on the demand adapting results.
The proposed smart contracts-based demand response bidding was developed as a digital platform in the Demand Response Control Center. The business players interact with each other through this platform. A set of smart contracts executes the input data and then securely stores the data in a public blockchain. This approach enhances transparency and integrity instead of the data system owned by the individual aggregators.

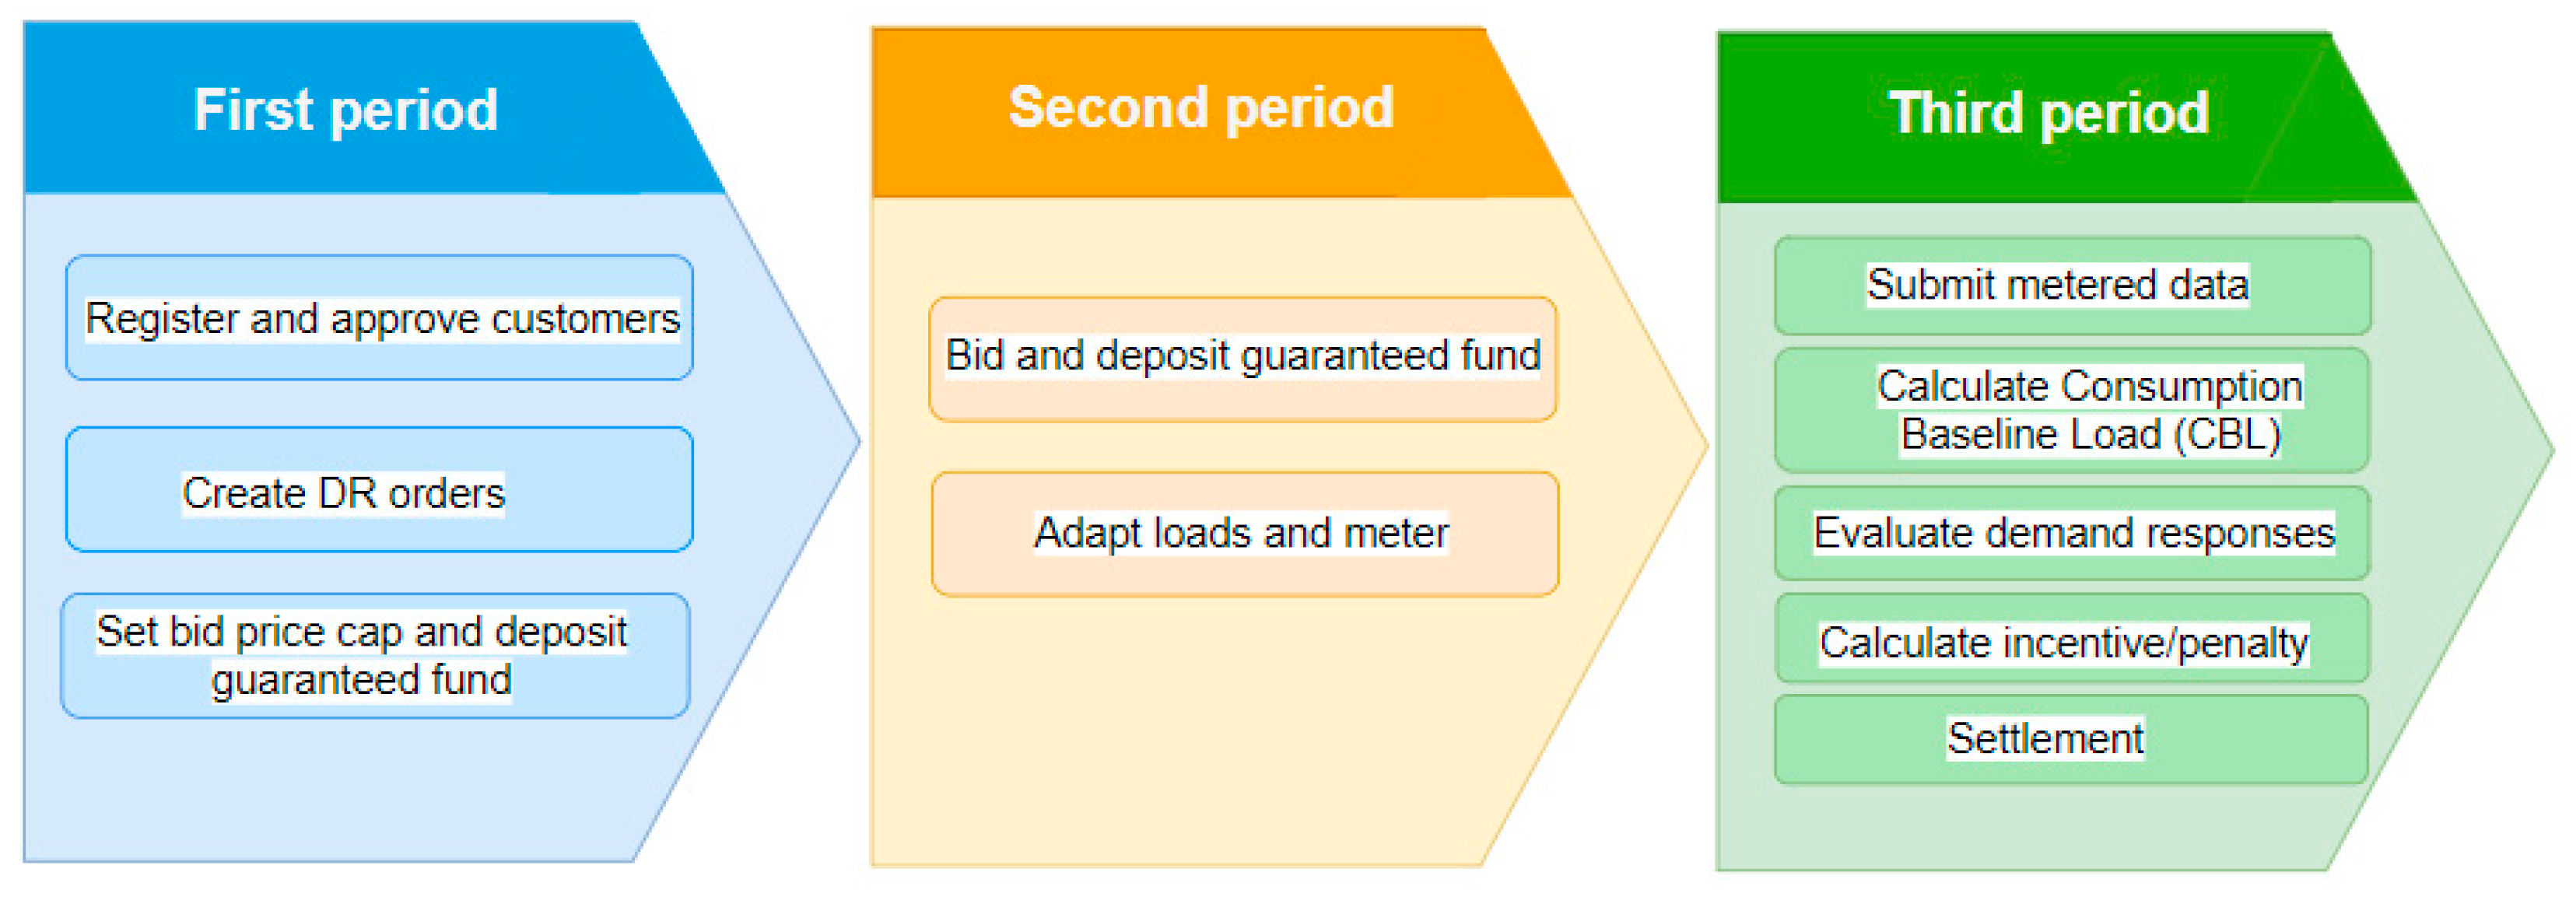
2.2. Demand Response Bidding Mechanism

This research proposes a demand response mechanism which consists of the timeline and activities of how the demand reductions will be sold on the DR Control Center [16]. Figure 3 presents three periods of the proposed demand response bidding mechanism.
The first period has three activities as follows:
(i)
Customers (Load Aggregators (LA) or electricity end users) who are willing to participate in the DR program register for the DR Control Center.
(ii)
The meter data providers receive notifications from the registrants, and then they will verify those registrants to ensure they can efficiently comply with the demand response program. First, the meter data provider checks the following general requirements: (i) each electricity end-user consumes energy through a meter with an AMR system for at least 90 days, and (ii) each registrant can provide a stable reduced demand of at least 500 kW during the DR period [17,18]. Then, the meter data provider will further check technical requirements if they meet all the general qualifications. This research applies the Relative Root Mean Square Error (RRMSE) as a technical requirement to examine the high-variable-load customers [19]. The registrants with an exceeding RRMSE of 20% cannot participate in the DR program. After checking both general and technical requirements, the registrants who pass all assessments will be approved to participate in the DR program as bidders.
(iii)
The demand response programs are generally implemented during emergency events or system peak periods. In addition, the maximum incentive payment determines based on the avoided cost of running peaking power plants. Hence, in this model, the market operator should request the demand adaptations or set a demand response order with a capacity target (kW) by forecasting the system peak. Then, the regulator set up the bid price cap (Baht/kWh), referring to the maximum incentive payments, based on the avoided cost of running peaking power plants. After that, the regulator will deposit the guaranteed fund to ensure compensation transfers to customers.
The second period has two activities as follows:
(i)
A bidder (customer) can bid on a contract capacity (kW) and a bid price (Baht/kWh).
This research applies the reverse auction [20] to select the bidders who can provide demand responses. Multiple sellers compete to sell the demand reductions to a single buyer. The bidders know each other’s bid, so they bid at a lower and lower price to win. The bid prices gradually decrease until the end of bidding. Each bidder will deposit the guaranteed fund to ensure penalty transfers for the market operator. After the bidding close, the bids are sorted in ascending prices so the algorithm can prioritize bidders. The lower-price bidders are selected until the accumulated quantity reaches the target value. The bidders who receive the acceptance are assigned a new role as a DR participant, so they can further participate in the DR event. On the other hand, bidders who obtain the rejection cannot join the next step. Hence, the market will withdraw the deposited fund back to them.
(ii)
Each DR participant will receive a notification from the DR Control Center and adapt the electricity consumption during the DR event.
In the third period, at the end of the DR event, the meter data providers submit metered data to the DR Control Center. Then, the DR Control Center will calculate the Consumption Baseline Load (CBL) and evaluate the demand responses for each customer. If customers comply with the commitments, they will receive incentives plus the deposited fund. Otherwise, they will be charged with a penalty. So, the customers will receive the remaining deposited fund after the charge.

2.3. Evaluation and Compensation Methods

This research proposes the evaluation method adapted from the Demand Response Pilot Project 2022–2023 [21]. At the end of the DR event, the DR Control Center evaluates the demand responses using the consumption baseline load and actual energy usage submitted from the meter data providers. In the first step, the DR Control Center calculates the average performance rate using Equations (1) and (2). In Equation (1), the value of performance rate at t hour ( P t ) ranks between 0 and 1. If the value exceeds 1.00, it will be cut down to 1. If the value drops below 0, it will be reset to 0.
P t = C B L t L o a d t O f f e r e d   r e d u c t i o n t ,
P a v = t T P t T n
C B L t refers to the consumption baseline load at t hour (kWh), L o a d t refers to the consumption usage at t hour (kWh), O f f e r e d   r e d u c t i o n t refers to the offered reduction at t hour (kWh), T refers to the time duration of DR event (hour), and T ( n ) refers to a number of time duration of DR event.
The market clearing price (MCP: Baht/MWh) is the individual bid price for the accepted bidders. Then, the demand responses are evaluated based on the criteria in Table 3. If the average performance rate ( P a v ) is less than 60 percent, the consumer will not receive any compensation as a penalty. If the average performance rate ( P a v ) is from 60 percent and less than 75 percent, the customers will receive compensation at half of the performance rate. If the average performance rate ( P a v ) is more than 75 percent, the consumers will receive compensation at their performance rate.

3. The Design of Smart Contracts for Demand Response Bidding

Smart contract is a computer program run by nodes (computers) in the blockchain network [23]. The differences between a general business contract and a smart contract are (i) the smart contract is software codes stored on every single node, (ii) the smart contract code is immutable, and (iii) the smart contract execution charges some fee based on the size of data input and complexity of the codes. This research proposes the following four smart contracts in accordance with the proposed demand response bidding mechanism: (i) the THB contract, (ii) the baseline contract, (iii) the bidding contract, and (iv) the evaluation contract. All contracts interact with each other and run within the following three systems.

3.1. Bidding System

The bidding system aims to manage DR orders and bids that are data objects called the Mapping of Struct. The first object, Order, is related to the second object, Bid, using an order ID. Each Order contains multiple Bids owned by the individual bidders. Figure 4 illustrates the clear procedure to create these two objects through the following smart contracts: bidding and THB contracts. The bidding contract works as a primary contract, while the THB contract is imported to operate guaranteed funds. Firstly, after receiving the forecasting data from the National Control Center (NCC), the market operator will set the target capacity (kW) of the DR order at a particular date and time of system peak. The market operator can delete the order any time before bidding opens. Then, the regulator will set the bid price cap and deposit a guaranteed fund for DR customers’ incentives. At the same time, the order will be opened for bidding, and then the bidders create bids by calling the bidding contract. The bidders must deposit a guaranteed fund to ensure their penalty transfer if they cannot provide the demand reduction to comply with the agreement. At the end of bidding, the market operator calculates the bidding results by running the reverse auction through the bidding contract. The Order and Bids objects will be updated in the new status. The bidders who own the rejected bids will have their deposited funds returned, whereas the bidders who receive the acceptance will be granted a new role, called DR_PARTICIPANT.

3.2. Guaranteed Fund System

The guaranteed fund system was proposed to ensure compensation transfers, both incentives to customers and penalties from customers. As demonstrated in Figure 5, the funds are deposited to a treasury wallet, a safe wallet created by multiple signatures from the responsible parties. First, the regulator approves the bidding contract to transfer fund on behalf of the regulator. Then, the bidding contract has enough allowance to deposit the fund into the treasury wallet as a guaranteed fund for incentive transfer. The fund is calculated as the target capacity (kW) multiplied by the bid price cap (Baht/kWh) and the number of time duration of the DR event (hours). Second, before the bidder places a bid into the DR Control Center, they must approve the bidding contract to transfer fund on behalf of the bidder. If the bidding contract has enough allowance, the fund can be deposited into the treasury wallet as a guaranteed fund for penalty transfer. The fund is calculated as the contract capacity (kW) multiplied by the market clearing price (Baht/kWh) and the number of time duration of the DR event (hours). Third, the market operator closes the bidding and withdraws the deposited funds for individual bidders who get rejected. Again, the bidding contract must be approved before the total funds are transferred from the treasury wallet. Finally, the DR participants confirm their evaluation results. If the average performance rate exceeds 0.60, the DR participant will receive the incentive plus the deposited fund. Otherwise, the DR participant will obtain the remaining deposited fund after charging the penalty. In this step, the evaluation contract must be approved before the funds are transferred from the treasury wallet. After the execution at each stage, the Order and Bid objects will be updated with the new status or data.

3.3. Evaluation System

As presented in Figure 6, the key functions of the evaluation system are to evaluate the demand responses and manage the compensation according to the evaluation results. In the first step, the meter data providers submit their customers’ energy consumption data to the evaluation contract. As mentioned in Equation (1) in Section 2.3, the calculation requires the energy used and consumption baseline load, so the baseline contract with the functions of the CAISO 10in10 plus a scalar adjustment is imported to generate the consumption baseline load [19]. Then, the evaluation contract calculates the average performance rate and records it in the Bid object. In the second step, the DR participants confirm the evaluation results (the average performance rate) through the evaluation contract. After that, the contract will calculate the compensation using the data recorded in each bid object. Next, the THB contract is imported to transfer the incentive plus the deposited fund or the remaining deposited fund after the charge to customers. Finally, the bidding contract will revoke the DR participant role and update the new data in the Bid object.

4. Blockchain Implementations

Blockchain is a Distributed Ledger Technology (DLT) in which every single node stores a copy of the data record in a set of blocks linked by a chain [24]. As mentioned earlier, the demand response mechanism requires the cooperation of responsible parties and demand response evaluation. Therefore, this study draws on the advantages of the blockchain to support data sharing among multiple parties and maintain data integrity within the demand response mechanism. The selected blockchain network is BNB Smart Chain (BSC), a public permissioned blockchain with a Proof-of-Staked-Authority (PoSA) consensus algorithm [25], because the public blockchain supports infrastructure for tests, and the permission-based consensus provides a much faster network than the permissionless-based consensus [26]. This project emphasizes the smart contract and decentralized application layer, so the reasonable network for the test is the public blockchain. However, implementations in real cases using the public blockchain require careful considerations.

4.1. Network Fees

The network fee refers to the service fees that validators charge for the data operation within the network [27]. In this project, the main cause of the network fees is to execute data, such as deploying smart contract codes and writing data in the blockchain. The smart contract deployment runs only once at the beginning of the project, while the data writing carries on every single time, calling the write functions in smart contracts. Costs of network fees are a primary concern for those market players in the real implementations. The network fees depend on the size of input data and complexity of smart contract codes. Hence, the research summarizes these costs in the results and discussion.

4.2. Transaction Speeds

Transaction speeds, the number of transactions per second, represent the time taken to send a transaction from sender to recipient [27]. In blockchain operation, transaction speed depends on factors such as block size, block time, pending transactions, and gas price. First, the block size is limited by a network configuration called the Block Gas Limit. The block gas limit is the maximum amount of gas used by all transactions in a block. In the BNB smart chain, the average block gas limit during the experimental period is 50 million units [28]. Second, block time, a network configuration, refers to the time duration from creating a block until adding the block to the chain. The blocks are made every three seconds in a BNB smart chain [29]. The first and second factors are fixed and depend on chain configurations. Third, the pending transaction is defined as the number of transactions waiting to include in the chain [30]. This factor is an external factor, representing network congestion. Finally, for gas price per transaction, a higher gas price raises the priority of picking the transaction and having it in the block [31]. Consequently, the transaction speeds are adjustable and related to the mentioned parameters rather than the smart contract executions.

4.3. Smart Contract Security

Smart contracts can control large amounts of value and data based on immutable code deployed on the blockchain. Hence, blockchain and smart contracts have created a trustless ecosystem, including decentralized applications that provide many advantages to businesses. However, in public blockchains, such as the BNB smart chain, the codes might represent opportunities for attackers looking to profit by exploiting vulnerabilities in smart contracts. Therefore, this research handled both security and bugs in smart contract codes. First, these codes avoid reentrancy attacks, a recursive process that transfers funds between two smart contracts [32], using a secure wallet instead of a contract address and adding a modifier from OpenZeppelin called nonReentrant [33]. Second, the codes apply the role-based access control [34] to set the participants who can call the functions. Third, the codes prevent bugs by checking the integer overflow and underflow, which is optimized gas used by setting the proper data sizes. In practice, the smart contract codes are verified by the auditors before the deployment on production.

5. Results and Discussion

This study simulated 15 electricity customers who consumed the energy demand in 15 min higher than 1000 kW through a single power meter with an AMR system [35]. The individual customer’s energy consumption (kWh) was collected for customer assessment and demand response evaluation. The dataset for customer assessment is the energy used the 60 days before the registration day, except on weekends, holidays, and event days. Then, the dataset was taken into calculation for the Relative Root Mean Square Error (RRMSE) using Equation (A1) in Appendix A.1. The simulated customers received a RRMSE of 8.25 percent at most, so they are not high-variation-load customers and are capable of participating in the demand response program. A second dataset collected for CBL calculation is the energy used for the 10 days before the DR event day, except on weekends and holidays. As presented in Appendix A.2, the 10-day data was calculated for the Customer Baseline Load (CBL) using CAISO 10in10. After that, the data on the event day during the adjustment window was taken to adjust the raw CBL values. The adjustment shifted the raw CBL based on the operating conditions on the event day. The simulated DR order for the test is opened for bids at a target capacity of 19.5 MW and bid price cap of 173.61 Baht/kWh, so the guaranteed fund deposited by the regulator is 10,156,185 Baht (19.5 MW × 173.61 Baht/kWh × 3 h). The bidding started at 9:00 a.m. and ended at noon before the DR event day. The DR event started at 1:00 p.m. and ended at 4:00 p.m.

5.1. Bidding Results

After bidding starts, each customer offers a capacity (kW) and price (Baht/kWh), estimated by the available loads and cost-benefits of load adaptation. For example, in Figure 7, the offered capacities rank between 1000 kW and 2000 kW, and the bid prices are from the net benefit and lower than the bid price cap, 150.00–173.61 Baht/kWh. The bidders will deposit the guaranteed funds to the treasury wallet for every bid. At the end of bidding, the total offered capacity shown in the result exceeds the capacity target, so some bids with lower prices are accepted. The bidders who received acceptance (green buttons) are granted to be DR participants and allowed to adapt the loads during the DR event.
Therefore, unlike the rejected bidders (red buttons), they redeem the deposited fund and wait for the following order. As mentioned earlier, the compensation is calculated based on the market clearing price (Baht/kWh), the individual bid price. Hence, the customers are delighted with the compensation because the bid price is higher than the net benefit. Furthermore, the guaranteed fund deposited by the regulator is calculated by the bid price cap (173.61 Baht/kWh), so the summation of compensations for all customers is safer than that deposited fund even if all customers reach the ultimate average performance rate of 1.00.

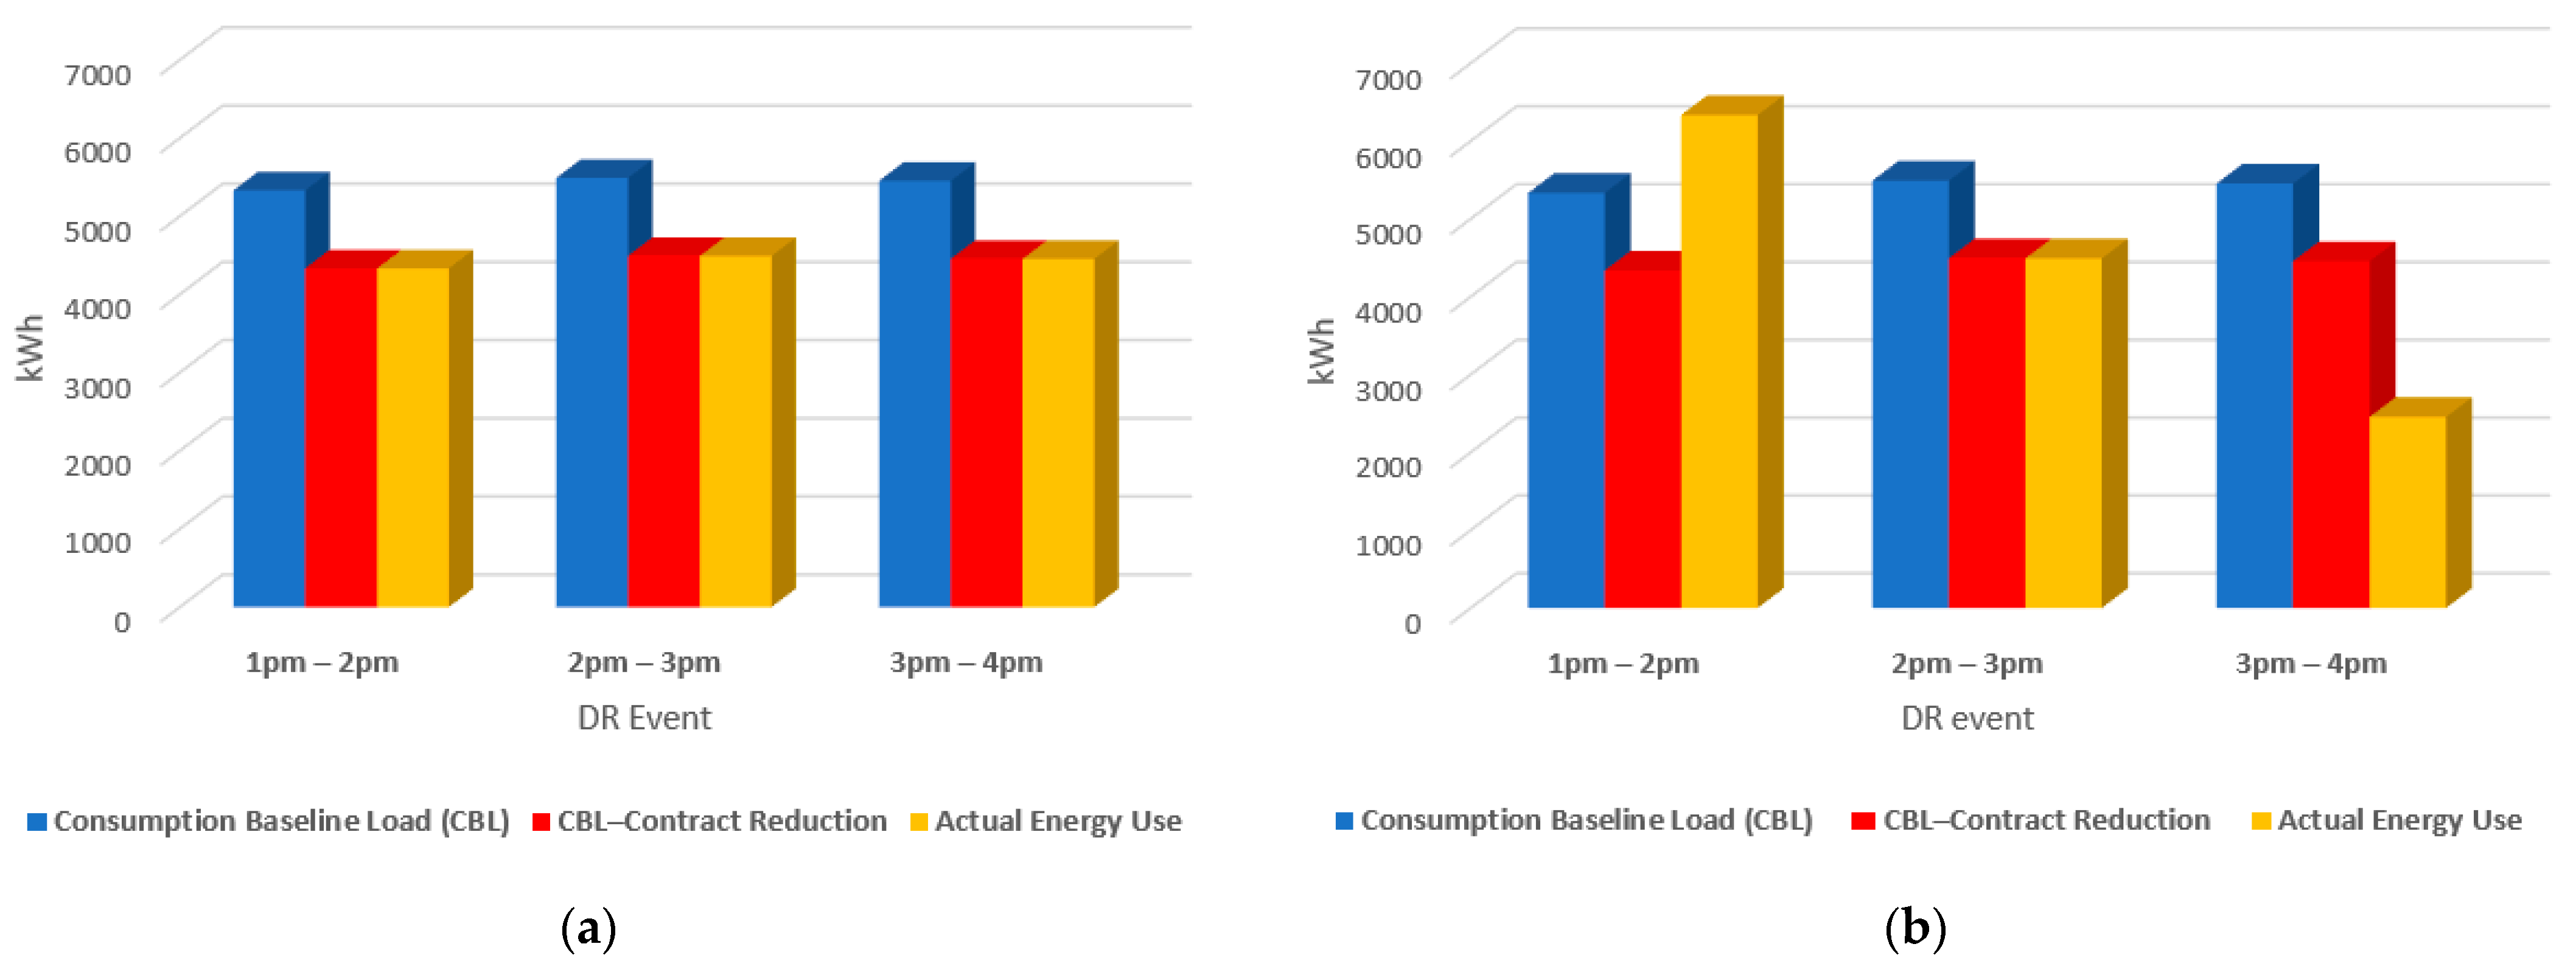
5.2. Evaluation and Performance Rate

A parameter used for evaluating demand adaptation is the performance rate. This section discusses the comparison of the performance rate calculation approaches, the current approach in Thailand, and the approach proposed by this research. The performance rate calculated by the current approach is described as follows: (i) the differences between the consumption baseline load (kWh) and the actual energy used (kWh) are accumulated, and (ii) the summation value is divided by the total contract reduction (kWh) during the DR event. According to the example in Figure 8a, the performance rate calculated by the current method is (1000 + 1000 + 1000)/3000 = 1.00. In Figure 8b, the performance rate calculated by the current method is (−1000 + 1000 + 3000)/3000 = 1.00. As a result, with the performance rate of 1.00, the customer can provide an actual reduction of 3000 kWh complied with the contract. However, this approach cannot represent the stability of load adaptation. Therefore, this research proposed the average performance rate described in Section 2.3. The average performance rate calculated based on the example (a) is (1 + 1 + 1)/3 = 1.00. In example (b), the average performance rate is (0 + 1 + 1)/3 = 0.67. It is feasible to represent the performance of providing the load reduction and stability of the load adaptation.

5.3. The Guaranteed Funds and Payments

This study set the following five scenarios for the payment system tests: Case 1: the average performance rate is from 0.75 to 1.00; Case 2: the average performance rate is from 0.60 and less than 0.75; Case 3: the average performance rate is from 0 and less than 0.60; Case 4: the average performance rate is 1.00, but the actual reduction is higher than the contract reduction; and Case 5: the average performance rate is 0, but the actual energy used is higher than the consumption baseline load. Table 4 demonstrates the compensation and payments for each case. The guaranteed funds deposited by customers were calculated by the contract capacity multiplied (kW) by the market clearing price (Baht/kWh) and the time duration of the DR event (hours).
For example, in case 1, the deposited fund is 1500 × 153 × 3 = 688,500 Baht. In case 1, the average performance rate was 1.00, from 1.00 to 0.75. The customer received an incentive of 1.00 × 153 × 1500 × 3 = 688,500 Baht. Hence, the customer will receive the deposited fund plus the incentive of 688,500 + 688,500 = 1,377,000 Baht. In case 2, the average performance rate was 0.60, from 0.60 and less than 0.75. The customer received an incentive of 0.50 × 0.60 × 165 × 1400 × 3 = 207,900 Baht. Hence, the customer will receive the deposited fund plus the incentive of 693,000 + 207,900 = 900,900 Baht. In case 3, the average performance rate was 0.22, from 0.00 and less than 0.60. The customer received a penalty of (0.60–0.22) × 165 × 1700 × 3 = 319,770 Baht. Hence, the customer will receive the deposited fund after being charged the penalty of 841,500–319,770 = 512,800 Baht. In case 4, the average performance rate was 1.00. The customer received an incentive of 1.00 × 156 × 1700 × 3 = 795,600 Baht, which is the maximum value even if the customer provides that the actual reduction is higher than the contract reduction. Hence, the customer will receive the deposited fund plus the incentive of 795,600 + 795,600 = 1,591,200 Baht. In case 5, the average performance rate was 0.00. The customer received a penalty of (0.60–0.00) × 158 × 2000 × 3 = 568,800 Baht. Hence, the customer will receive the deposited fund after being charged the penalty of 948,000–568,800 = 379,200 Baht. The redeemed fund in case 5 shows that the minimum deposited fund could be 0.60 of the contract capacity multiplied (kW) by the market clearing price (Baht/kWh) and the time duration of the DR event (hours).

5.4. Network Fees

This project selected the BNB Smart Chain (BSC) test network, a public blockchain for tests, so the cost of network fees should be a primary consideration in actual implementations. Table 5 presents the costs of smart contract deployments. The project developer will be charged 16.59 USD for the smart contract deployments and 0.12 USD for each time-granting role.
Table 6 shows that these costs will be charged when a player calls a write function in a smart contract. In this project, three players run the demand response mechanism: (i) the regulator, (ii) the operators, and (iii) the customers. The first group, the regulator, is charged 0.23 USD to set a bid price cap. The second group has two categories, market operator and meter data provider. The market operator is charged 2.73 USD to operate DR orders and bidding. In contrast, the meter data providers are charged 1.00 USD for every instance of customer assessment and evaluation. The third group, customers, is charged 3.48 USD to make a bid and confirm evaluation results.

6. Conclusions

The proposed smart contracts-based demand response (DR) bidding mechanism is a feasible approach to apply in the context of Thailand’s demand response business model, the Load Aggregator model. This approach introduces the data execution by smart contracts and data records on the blockchain that enhance transparent data sharing among multiple parties and maintain data integrity compared to the data system owned by the individual aggregators. The proposed smart contracts-based demand response bidding was developed as a digital platform and connected to a public blockchain for tests. The public blockchain provides scalability and infrastructure but requires careful consideration of network fees, transaction speed, and the security of smart contract codes. In the case of implementing the demand response mechanism in a blockchain system, this research proposed a guaranteed fund system that ensures the transfer of incentives and penalties in the blockchain system. According to the results, the customer’s guaranteed fund should be 60% of the expected compensation.
Moreover, the demand response bidding mechanism enables customers to bid on a possible demand (kW) and expected price (Baht/kWh). Therefore, this approach significantly helps control the DR operation cost even though all customers ultimately reach the expected compensations. Moreover, the proposed performance rate calculation approach represented better load adaptation performance and stability compared to the current method used in the Demand Response Pilot Project 2022–2023. However, the bidding system is more practical in a competitive market than the enhanced single-buyer structure. Suppose that Thailand’s power market will be transformed into a competitive market, especially the power pool structure. In that case, the bidding system is an effective tool to encourage customer participation in demand response programs. Therefore, future research might consider the practical design of the demand response bidding mechanism implemented in the context of Thailand’s competitive power market.

Author Contributions

Conceptualization, A.P. and A.B.; methodology, A.P. and A.B.; software, A.P.; validation, A.P. and A.B.; formal analysis, A.P.; investigation, A.P.; resources, A.P.; data curation, A.P.; writing—original draft preparation, A.P.; writing—review and editing, A.P. and A.B.; visualization, A.P.; supervision, A.B.; project administration, A.P.; funding acquisition, A.B. All authors have read and agreed to the published version of the manuscript.

Funding

This research was funded by National Science, Research, and Innovation Fund (FF 2565). FRB650048/0164, and the Petchra Pra Jom Klao Doctoral Degree Research Scholarship (31/2561).

Data Availability Statement

Not applicable.

Acknowledgments

This research was supported by National Science, Research, and Innovation Fund (FF 2565). FRB650048/0164. I express my sincere thanks to the Petchra Pra Jom Klao Doctoral Degree Research Scholarship (31/2561) from King Mongkut’s University of Technology Thonburi (KMUTT) and The Joint Graduate School of Energy and Environment (JGSEE) for granting me the scholarship.

Conflicts of Interest

The authors declare no conflict of interest.

Appendix A

Appendix A.1. Relative Root Mean Square Error (RRMSE)

Relative Root Mean Squared ERROR (RRMSE) is a parameter to ensure that the Consumption Baseline Load (CBL) used to predict the customer load and therefore determine the quantity of each hourly load reduction is reasonably accurate and non-biased. The Relative Root Mean Squared ERROR (RRMSE) is calculated by the equation below.
R R M S E = d D , t T ( C B L d , t L o a d d , t ) 2 D ( n ) x T ( n ) ÷ d D , t T L o a d d , t D n x T ( n )
Note: D refers to investigation days, D(n) refers to the number of investigation days, T refers to the time duration of investigation days, T(n) refers to the number of the time duration of investigation days, C B L d , t refers to the customer baseline load at t hour on d day, and L o a d d , t refers to the electricity usage at t hour on d day.

Appendix A.2. An Example of Consumption Baseline Calculation (CAISO 10in10 Plus Adjustment)

Table A1. Consumption baseline calculation.
DateAdjustment WindowDR Event Window
9:00 a.m.–10:00 a.m.10:00 a.m.–11:00 a.m.11:00 a.m.–12:00 p.m.1:00 p.m.–2:00 p.m.2:00 p.m.–3:00 p.m.3:00 p.m.–4:00 p.m.
28_4_225918.005502.005824.005368.005544.005542.00
27_4_225956.006296.005904.005368.005644.005542.00
26_4_225956.006296.005904.005368.005601.005542.00
25_4_225852.005628.005996.006013.005990.005968.00
22_4_225868.005928.006116.005966.006085.006100.00
21_4_225498.005364.005098.005058.005215.005253.00
20_4_225650.005648.005518.005810.005832.005772.00
19_4_225670.005874.005868.005854.006100.005036.00
18_4_225268.005420.005422.005184.005510.005578.00
12_4_225278.005406.005064.005070.005172.005974.00
Raw CBL5691.405736.205671.405505.905669.305630.70
CBL5512.285555.675492.915332.625490.875453.49

References

  1. Federal Energy Regulatory Commission (FERC). Demand Response. Available online: https://www.ferc.gov/power-sales-and-markets/demand-response (accessed on 12 January 2023).
  2. Energy Policy and Planning Office (EPPO); Ministry of Energy (MOE). Thailand Smart Grid Master Plan 2015–2036. Thailand. 2015. Available online: https://www.eppo.go.th/images/POLICY/ENG/PDP2015_Eng.pdf (accessed on 12 January 2023).
  3. Energy Regulatory Commission (ERC). Demand Response. Available online: https://pdfmkm.erc.or.th/file_upload/module/manage_digital_file/digital_file/c4c89c49.pdf (accessed on 12 January 2023).
  4. Energy Policy and Planning Office (EPPO); Ministry of Energy (MOE). The Progress Report on the Short-Term Thailand Smart Grid Master Plan. Thailand. 2021. Available online: https://www.eppo.go.th/images/Power/pdf/smart_grid_actionplan.pdf (accessed on 12 January 2023).
  5. Pop, C.; Tudor, C.; Marcel, A.; Ionut, A.; Ioan, S.; Massimo, B. Blockchain Based Decentralized Management of Demand Response Programs in Smart Energy Grids. Sensors 2018, 18, 162. [Google Scholar] [CrossRef] [PubMed]
  6. Patsonakis, C.; Terzi, S.; Moschos, I.; Ioannidis, D.; Votis, K.; Tzovaras, D. Permissioned Blockchains and Virtual Nodes for Reinforcing Trust Between Aggregators and Prosumers in Energy Demand Response Scenarios. In Proceedings of the 2019 IEEE International Conference on Environment and Electrical Engineering and 2019 IEEE Industrial and Commercial Power Systems Europe (EEEIC/I&CPS Europe), Genova, Italy, 11–14 June 2019; pp. 1–6. [Google Scholar]
  7. Pop, C.D.; Marcel, A.; Tudor, C.; Ionut, A.; Ioan, S. Blockchain and Demand Response: Zero-Knowledge Proofs for Energy Transactions Privacy. Sensors 2020, 20, 5678. [Google Scholar] [CrossRef] [PubMed]
  8. Sciumè, G.; Palacios-García, E.; Gallo, P.; Sanseverino, E.; Vasquez, J.C.; Guerrero, J. Demand Response Service Certification and Customer Baseline Evaluation Using Blockchain Technology. IEEE Access 2020, 8, 139331. [Google Scholar] [CrossRef]
  9. Afzal, M.; Huang, Q.; Amin, W.; Umer, K.; Raza, A.; Naeem, M. Blockchain Enabled Distributed Demand Side Management in Community Energy System with Smart Homes. IEEE Access 2020, 8, 37428–37439. [Google Scholar] [CrossRef]
  10. Di Silvestre, M.L.; Gallo, P.; Sanseverino, E.R.; Sciumè, G.; Zizzo, G. Aggregation and Remuneration in Demand Response with a Blockchain-Based Framework. IEEE Trans. Ind. Appl. 2020, 56, 4248–4257. [Google Scholar] [CrossRef]
  11. Wen, S.; Xiong, W.; Tan, J.; Chen, S.; Li, Q. Blockchain Enhanced Price Incentive Demand Response for Building User Energy Network in Sustainable Society. Sustain. Cities Soc. 2021, 68, 102748. [Google Scholar] [CrossRef]
  12. Tsao, Y.C.; Teck, V.; Wu, Q. Sustainable microgrid design considering blockchain technology for real-time price-based demand response programs. Int. J. Electr. Power Energy Syst. 2021, 125, 106418. [Google Scholar] [CrossRef]
  13. Kolahan, A.; Maadi, S.R.; Teymouri, Z.; Schenone, C. Blockchain-Based Solution for Energy Demand-Side Management of Residential Buildings. Sustain. Cities Soc. 2021, 75, 103316. [Google Scholar] [CrossRef]
  14. Zou, D.; Shao, X.; Chen, X. Research on architecture and smart contract of household intelligent power service platform based on blockchain. In Proceedings of the 2021 International Conference on Intelligent Computing, Automation and Systems (ICICAS), Chongqing, China, 29–31 December 2021; pp. 445–449. [Google Scholar]
  15. Cioara, T.; Toderean, L.; Mitrea, D.; Chifu, V.; Antal, M.; Anghel, I.; Croce, V.; Bertoncini, M.; Nucci, F. Decentralized Demand Response in Energy Communities Using Blockchain. In Proceedings of the 2022 Workshop on Blockchain for Renewables Integration (BLORIN), Palermo, Italy, 2–3 September 2022; pp. 7–12. [Google Scholar]
  16. Australian Energy Market Operator (AEMO). Demand Response Mechanism and Ancillary Services Unbundling–Detailed Design. 2013. Available online: https://aemo.com.au/-/media/files/initiatives/wdr/drm_detailed_design_final_181113.pdf (accessed on 12 January 2023).
  17. California ISO. Proxy Demand Resource (PDR) & Reliability Demand Response Resource (RDRR) Participation Overview. 2014. Available online: https://www.caiso.com/Documents/PDR_RDRRParticipationOverviewPresentation.pdf (accessed on 12 January 2023).
  18. Electricity Generating Authority of Thailand (EGAT). Interruptible Rate for TOU Rate. 2020. Available online: https://www.egat.co.th/home/wp-content/uploads/2021/07/20200807-Interruptible-Rate-for-TOU-Rate_Additional-16Jul2020.pdf (accessed on 12 January 2023).
  19. Australian Energy Market Operator (AEMO). Development of Demand Response Mechanism Baseline Consumption Methodology—Phase 1 Results. 2013. Available online: https://aemo.com.au/-/media/files/initiatives/wdr/baseline-consumption-methodology---phase-i-reportpdf.pdf (accessed on 12 January 2023).
  20. Cintuglu, M.; Martin, H.; Mohammed, O. Real-Time Implementation of Multiagent-Based Game Theory Reverse Auction Model for Microgrid Market Operation. IEEE Trans. Smart Grid 2015, 6, 1064–1072. [Google Scholar] [CrossRef]
  21. Provincial Electricity Authority (PEA). Demand Response Pilot Project 2022–2023. Thailand. 2022. Available online: https://www.pea.co.th/drpilot (accessed on 12 January 2023).
  22. Pacific Gas and Electric Company (PG&E). Capacity Bidding Program Rate. 2021. Available online: https://www.pge.com/tariffs/assets/pdf/tariffbook/ELEC_SCHEDS_E-CBP.pdf (accessed on 12 January 2023).
  23. Zheng, Z.; Xie, S.; Dai, H.; Chen, X.; Wang, H. An Overview of Blockchain Technology: Architecture, Consensus, and Future Trends. In Proceedings of the 2017 IEEE International Congress on Big Data (BigData Congress), Honolulu, HI, USA, 25–30 June 2017; pp. 557–564. [Google Scholar]
  24. Buterin, V. Ethereum: A Next-Generation Smart Contract and Decentralized Application Platform. White Paper 2014, 3. Available online: https://scholar.google.co.kr/citations?view_op=view_citation&hl=en&user=DLP9gTAAAAAJ&citation_for_view=DLP9gTAAAAAJ:IjCSPb-OGe4C (accessed on 12 January 2023).
  25. BNB Smart Chain (BSC). BNB Smart Chain White Paper. Available online: https://github.com/bnb-chain/whitepaper (accessed on 12 January 2023).
  26. Xiao, Y.; Zhang, N.; Lou, W.; Hou, Y.T. A Survey of Distributed Consensus Protocols for Blockchain Networks. IEEE Commun. Surv. Tutor. 2020, 22, 1432–1465. [Google Scholar] [CrossRef]
  27. Liu, Y.; Lu, Y.; Nayak, K.; Zhang, F.; Zhang, L.; Zhao, Y. Empirical Analysis of EIP-1559: Transaction Fees, Waiting Time, and Consensus Security. arXiv 2022, arXiv:2201.05574. [Google Scholar]
  28. BSC Testnet Network. BSC Average Gas Limit Chart. Available online: https://testnet.bscscan.com/chart/gaslimit (accessed on 12 January 2023).
  29. BSC Testnet Network. BSC Average Block Time Chart. Available online: https://testnet.bscscan.com/chart/blocktime (accessed on 12 January 2023).
  30. BSC Testnet Network. BSC Network Pending Transactions Chart. Available online: https://testnet.bscscan.com/chart/pendingtx (accessed on 12 January 2023).
  31. BSC Testnet Network. BSC Average Gas Price Chart. Available online: https://testnet.bscscan.com/chart/gasprice (accessed on 12 January 2023).
  32. Alkhalifah, A.; Ng, A.; Watters, P.; Kayes, A.S.M. A Mechanism to Detect and Prevent Ethereum Blockchain Smart Contract Reentrancy Attacks. Front. Comput. Sci. 2021, 3, 598780. [Google Scholar] [CrossRef]
  33. Openzeppelin. Security (ReentrancyGuard). Available online: https://docs.openzeppelin.com/contracts/4.x/api/security (accessed on 12 January 2023).
  34. Openzeppelin. Access Control (Role-Based Access Control). Available online: https://docs.openzeppelin.com/contracts/4.x/access-control (accessed on 12 January 2023).
  35. Provincial Electricity Authority (PEA). Electricity Tariffs. 2018. Available online: https://www.pea.co.th/Portals/1/demand_response/Electricity%20Tariffs%20Nov61.pdf?ver=2018-11-21-145427-433. (accessed on 12 January 2023).
Figure 1. The current demand response model in Thailand.
Energies 16 03606 g001
Figure 2. The proposed system architecture.
Energies 16 03606 g002
Figure 3. The demand response bidding mechanism.
Energies 16 03606 g003
Figure 4. Bidding system.
Energies 16 03606 g004
Figure 5. Guaranteed fund system.
Energies 16 03606 g005
Figure 6. Evaluation system.
Energies 16 03606 g006
Figure 7. Bidding results.
Energies 16 03606 g007
Figure 8. The examples of demand response evaluation: (a) The demand response with stable load adaptations. (b) The demand response with unstable load adaptations.
Energies 16 03606 g008
Table 1. Demand response rates implemented in the current demand response program.
CompensationRate
Availability Payment44.5692 Baht/kW/month
Energy PaymentJanuary, February, November, December 1.2790 Baht/kWh
March–October2.5581 Baht/kWh
Table 2. A review of blockchain-based demand response programs.
ReferencesObjectivesMarket PlayersDR ProgramBlockchain PlatformSmart Contract Functions
Claudia, D.P. (2018) [5]Provide the individual adaptations based on the signals and maintain grid balance in community.DSO and customersIncentive-based DREthereum
-
Calculate grid balancing parameter
-
Evaluate adaptions and calculate compensation
Patsonakis, C. (2019) [6]Apply blockchain to secure transactions between virtual nodes and load aggregator.Load aggregator and virtual nodesIncentive-based DRHyperledger Fabric
-
Setup DR orders
-
Accept or reject the DR order
-
DR program settlement and remuneration
Claudia, D.P. (2020) [7]Present zero-knowledge proof (ZKF) solution to hide the energy monitoring data.Load aggregator and prosumersIncentive-based DREthereum
-
Encrypt the energy data before storing in blockchain
-
Evaluate demand responses
Sciumè, G.(2020) [8]Present the experimental test of demand response implementation by using Blockchain.DSO and customersIncentive-based DRHyperledger Fabric
-
Calculate consumption baseline
-
Evaluate demand responses and calculate compensation
Afzal, M. (2020) [9]Minimize cost of electricity in the individual home and the whole community.Smart home users, community manager and utility gridPrice-based DREthereum
-
Check the availability of required electricity and prices
-
Handle the negotiation rules of purchasing the electricity
Silvestre, M.L.D. (2020) [10]Present a reliable and transparent approach for load and generation aggregation in a distributed demand response (DR) service and customer remuneration system.Grid operator, market operator and customersIncentive-based DRHyperledger Fabric
-
Record energy consumption and production in blockchain
-
Calculate consumption baseline, evaluate load adaptations, and remunerate customers
Wen, S. (2021) [11]Shift or cut down the electric loads to maximize profits.Community manager and building usersPrice-based DREthereum
-
Generate the consensus thermal price
-
Encrypt the individual the optimal strategies before storing in blockchain
Tsao, Y.C. (2021) [12]Maximize the total profit of network, minimizes the environmental impacts, and maximize the social benefits of consumers.Consumers, aggregators, and distributed generation unitsPrice- and incentive-based DREthereum
-
Record dynamic electricity pricing in blockchain
-
Calculate the deviation, adaptability power curve (APC) and compensation
Kolahan, A. (2021) [13]Reduce consumption load and increase the thermal comfort of occupants.Load aggregator and customersIncentive-based DREthereum
-
Validate the Probability of the Next Hour (PNH), before storing in blockchain
Zou, D. (2021) [14]Present the design of smart contracts for the Household intelligent power service (HIPS).Power grid companies, load aggregators and usersIncentive-based DRHyperledger Fabric
-
Create service requests
-
Evaluates the response values and calculate compensation for the individual users
Cioara, T. (2022) [15]Present the Bright project solution for applying the decentralized DR program management via P2P flexibility trading.Grid operator, market operator and prosumersIncentive-based DREthereum
-
Trace the individual flexibility of different assets
-
Operate the P2P flexibility market
-
DR program settlement and remuneration
Table 3. Evaluation criteria and compensation adapted from [22].
CriteriaCompensation
0.75 ≤ P a v ≤ 1.00Incentive = P a v × M C P B a h t M W h × Offered Reduction (MWh)
Penalty = 0
0.60 < P a v ≤ 0.75Incentive = 0.50 × P a v × M C P B a h t M W h × Offered Reduction (MWh)
Penalty = 0
0 < P a v < 0.60Incentive = 0
Penalty = (0.60 − P a v ) × M C P B a h t M W h × Offered Reduction (MWh)
Table 4. Compensation and payments.
ParametersCase 1Case 2Case 3Case 4Case 5
Contract capacity (kW) 15001400170017002000
Market clearing price (Baht/kWh)153165165156158
Deposited amount (Baht)688,500693,000841,500795,600948,000
Average performance rate1.000.600.221.000.00
Incentive (Baht)688,500207,9000795,6000
Penalty (Baht)00319,7700568,800
Total transfer (Baht)1,377,000900,900512,8001,591,200379,200
Table 5. Costs of smart contract deployments.
Contract NameContract AddressTransaction Fee
THB0xCFaac2Af…….c65985A430.01041286 BNB ($2.54)
Baseline0x4fBACECa…….b1F7571410.00671471 BNB ($1.64)
Bidding0xBeA45959…….C3Eb226de0.03895269 BNB ($9.51)
Evaluation0x7b701990…….00f344f3750.01186256 BNB ($2.90)
Table 6. Costs of smart contract interactions.
FunctionsRolesTransaction Fee
Grant roleMETER_DATA_PROVIDER0.00048265 BNB ($0.12)
Create DR order MARKET_OPERATOR0.00242357 BNB ($0.59)
Delete DR order MARKET_OPERATOR0.00062064 BNB ($0.15)
Set a bid price cap REGULATOR0.00094859 BNB ($0.23)
Open biddingMARKET_OPERATOR0.00030649 BNB ($0.07)
Close biddingMARKET_OPERATOR0.00849131 BNB ($2.07)
EvaluateMETER_DATA_PROVIDER0.00359519 BNB ($0.88)
BidBIDDER0.01100779 BNB ($2.69)
Confirm evaluation resultDR_PARTICIPANT0.00323641 BNB ($0.79)
Disclaimer/Publisher’s Note: The statements, opinions and data contained in all publications are solely those of the individual author(s) and contributor(s) and not of MDPI and/or the editor(s). MDPI and/or the editor(s) disclaim responsibility for any injury to people or property resulting from any ideas, methods, instructions or products referred to in the content.

