

Impacts Analysis of Dual Carbon Target on the Medium- and Long-Term Petroleum Products Demand in China

Abstract
:1. Introduction
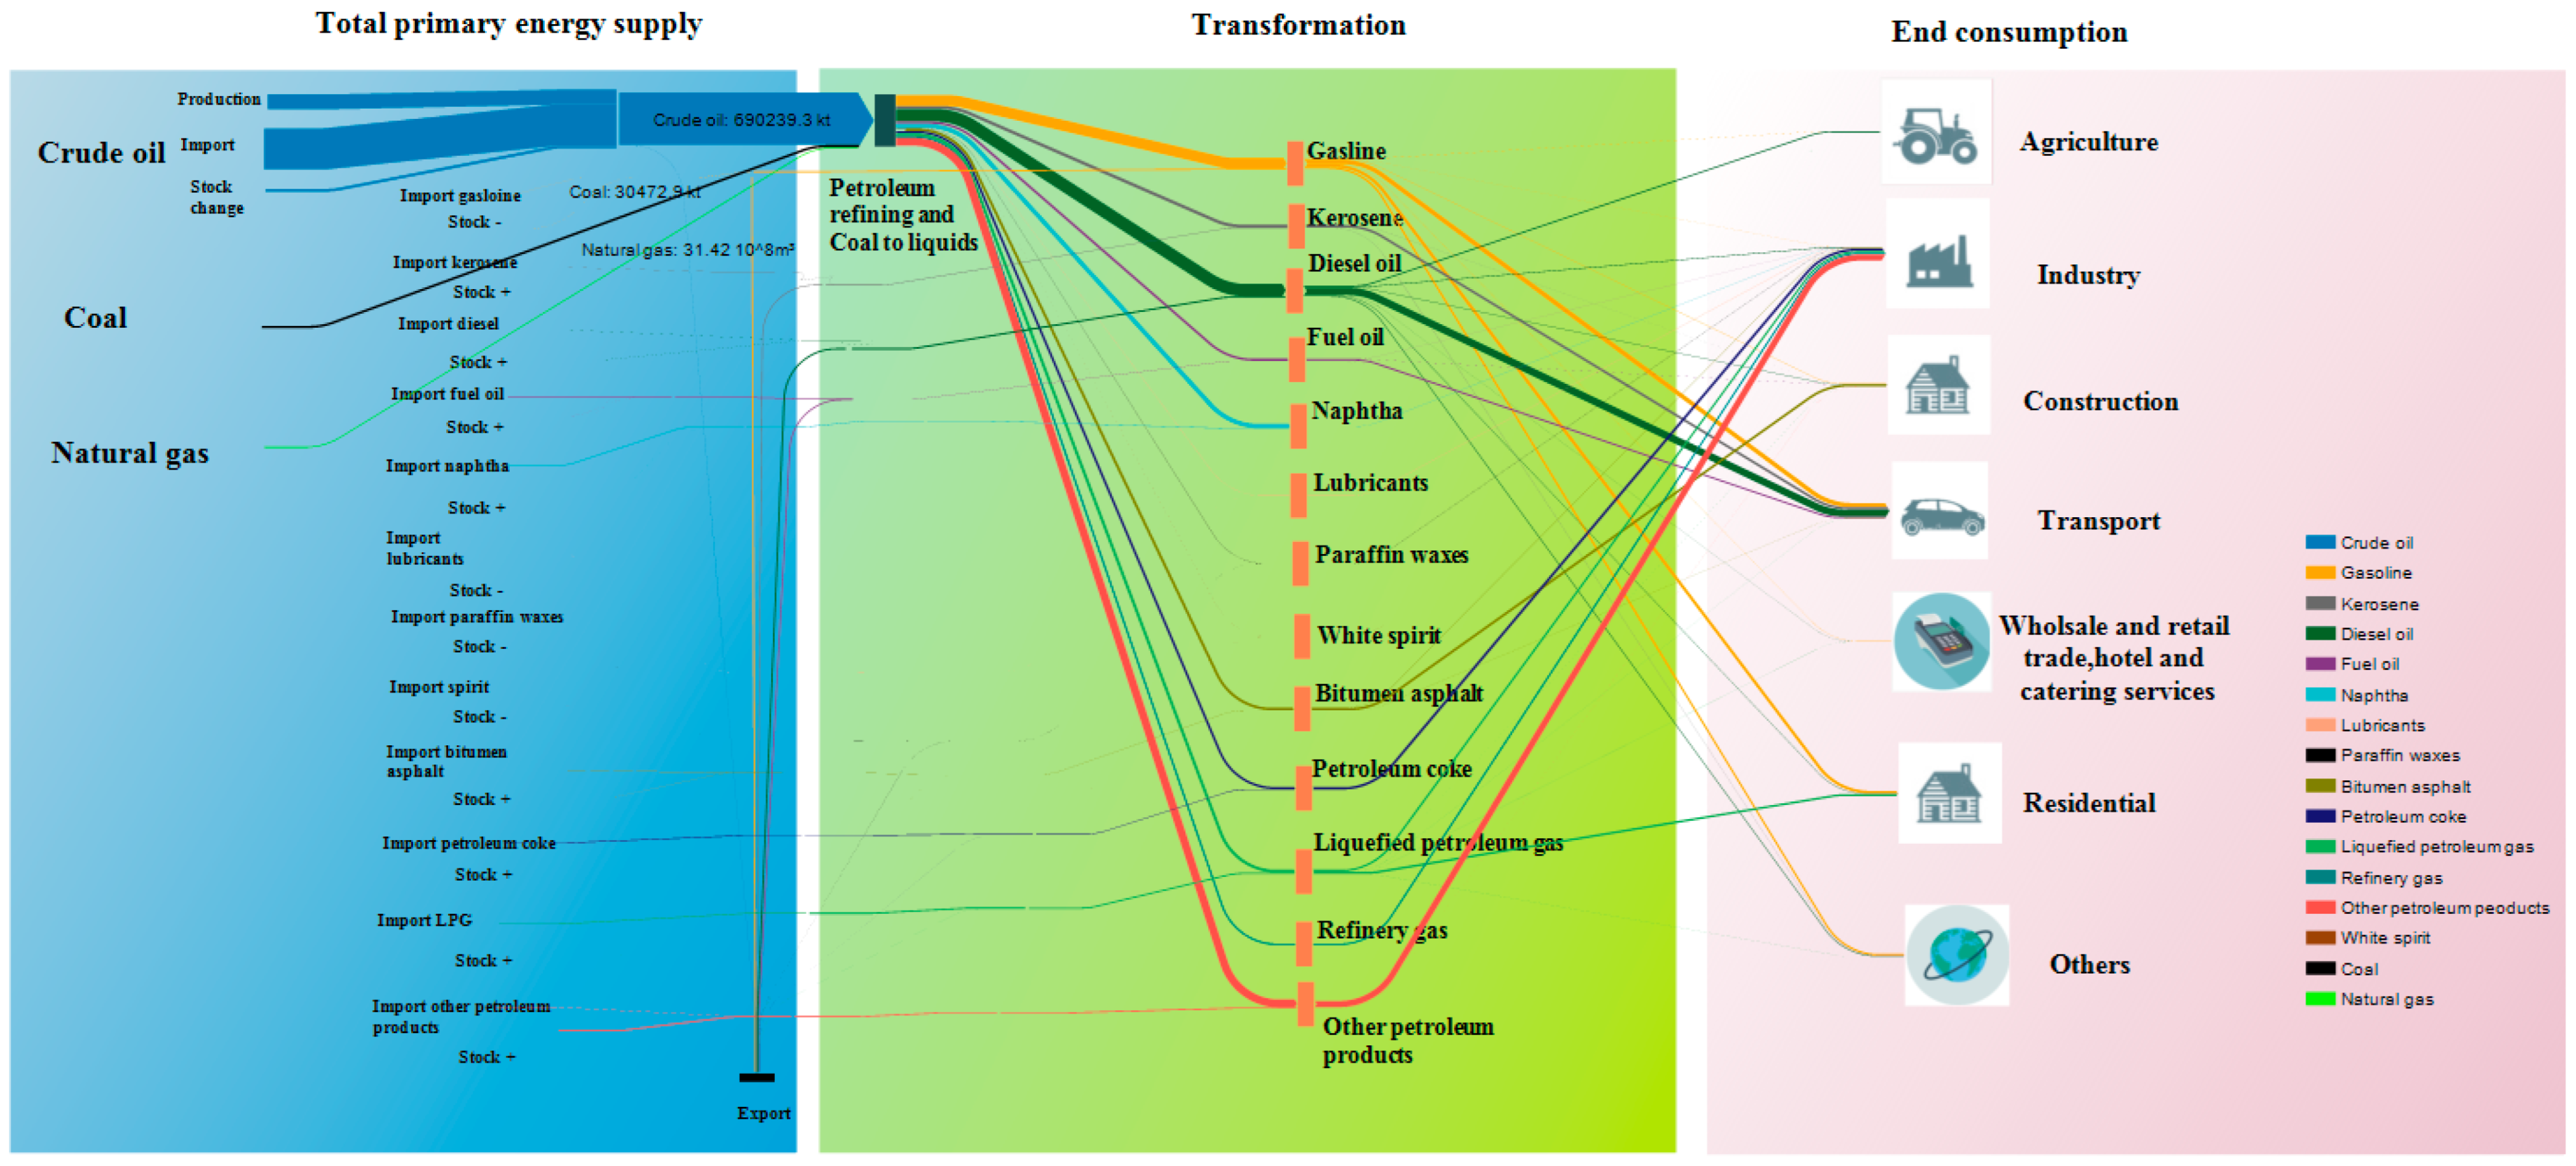
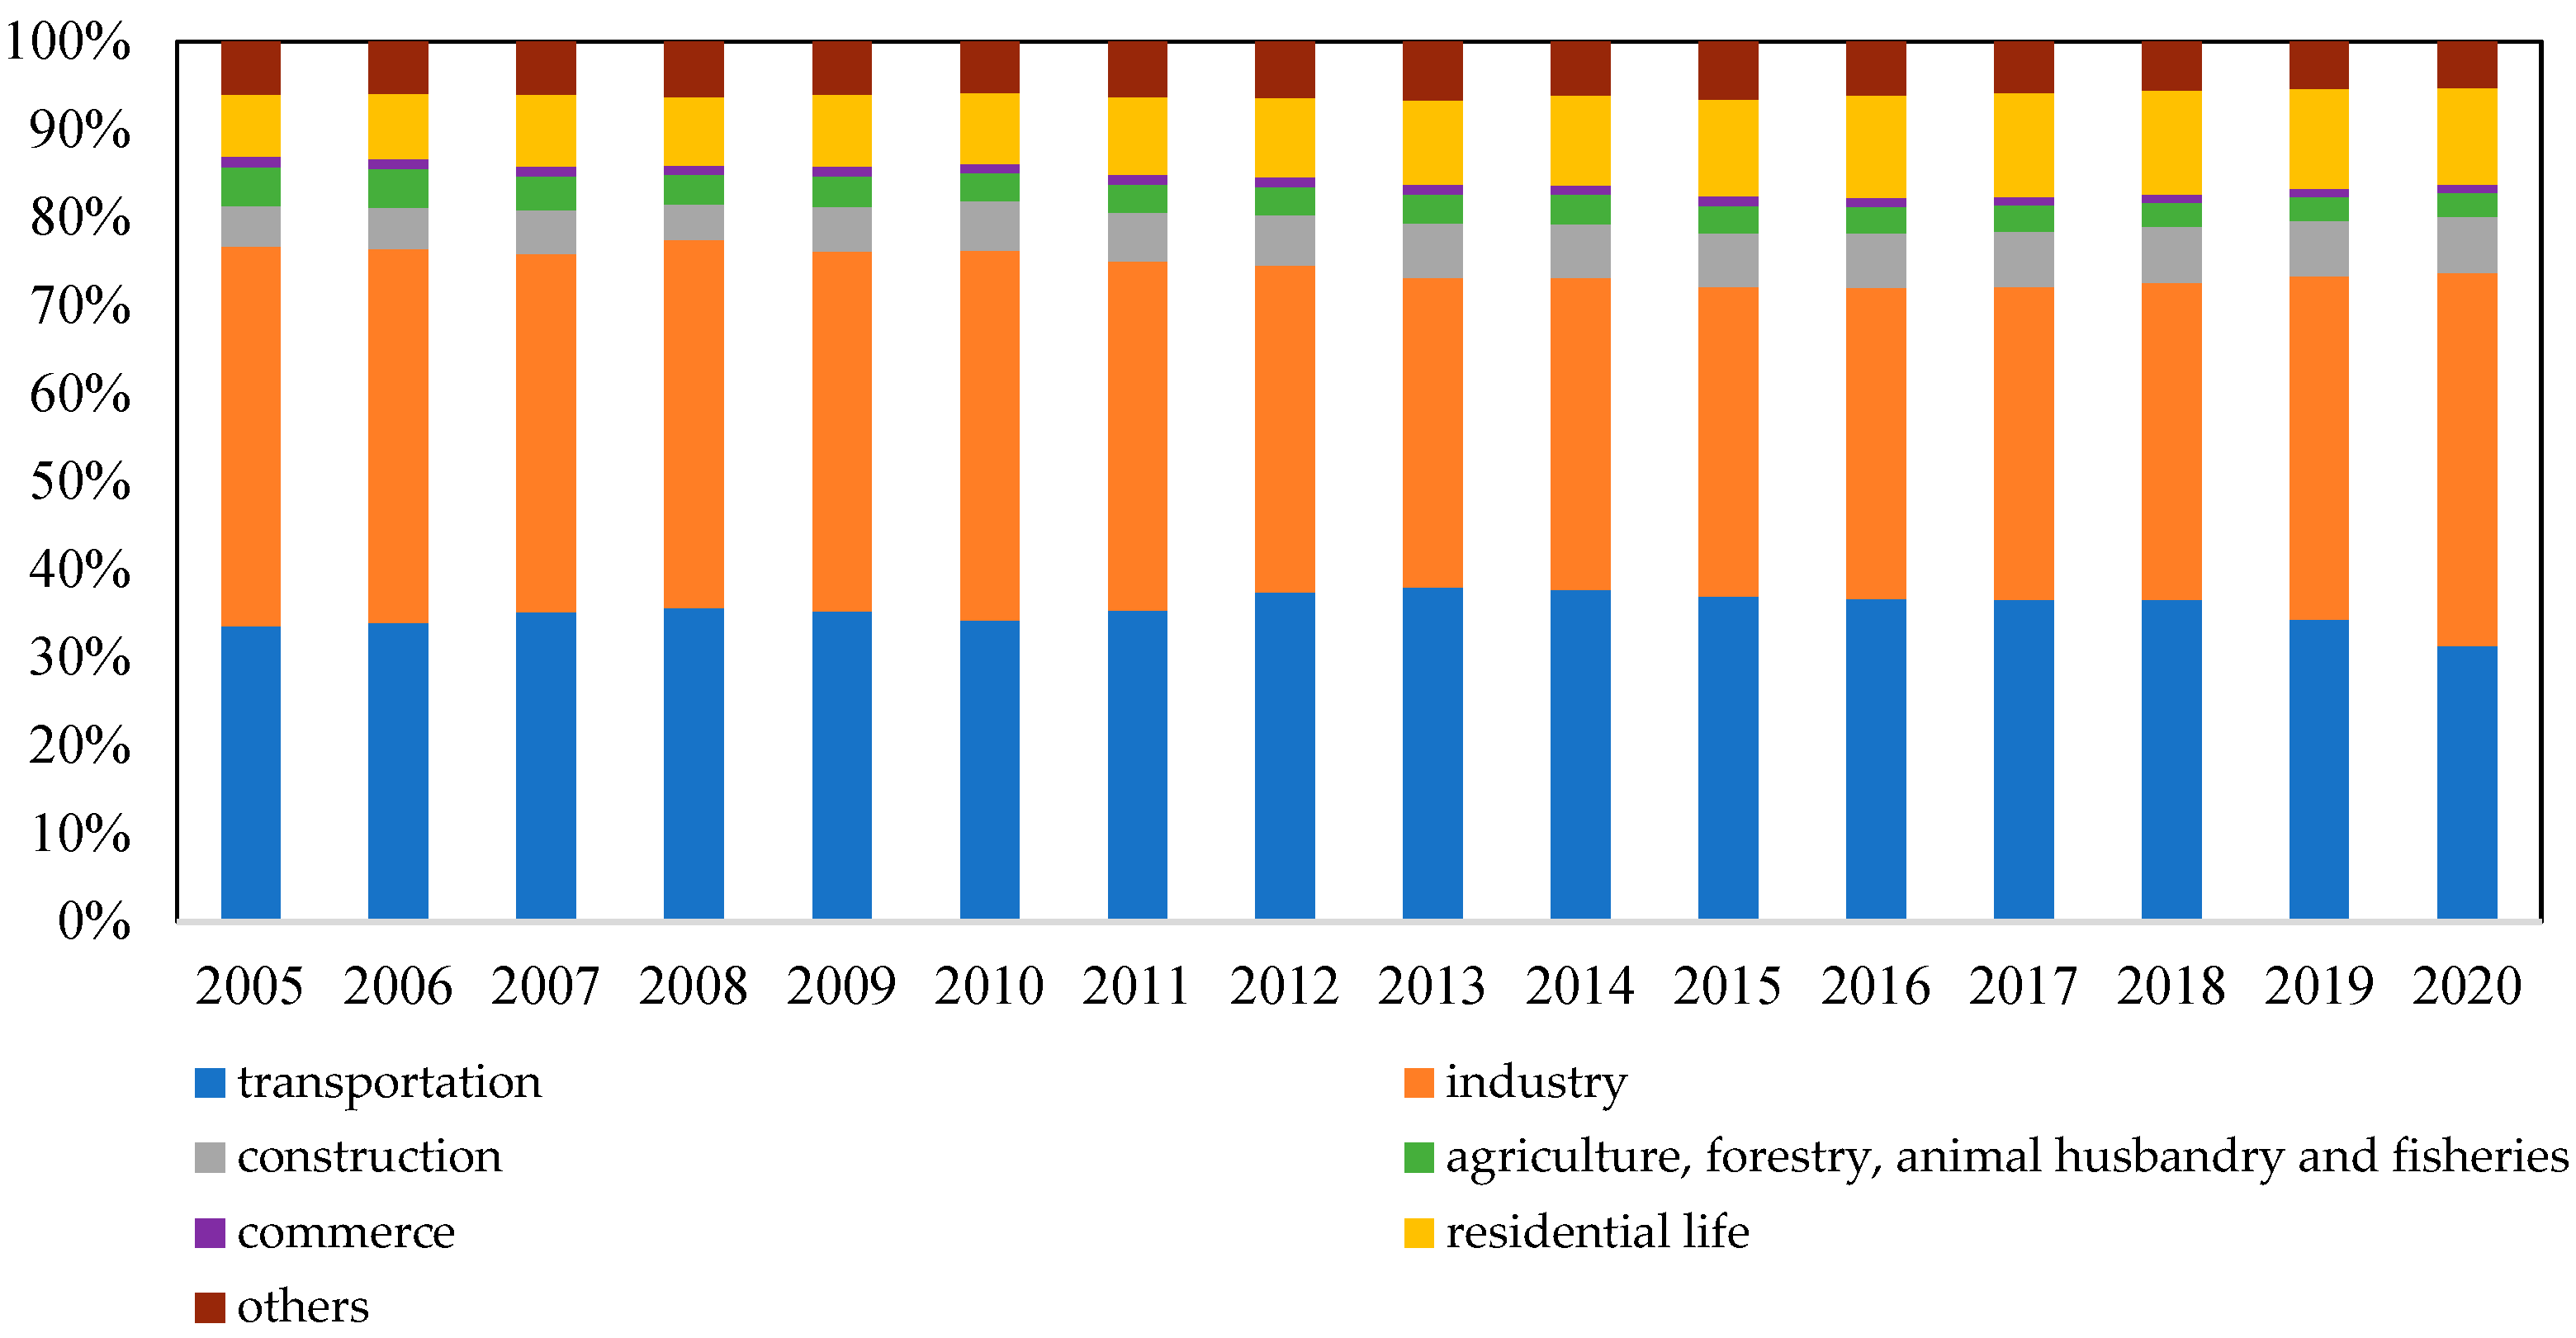
2. Characteristics of Petroleum Products in China
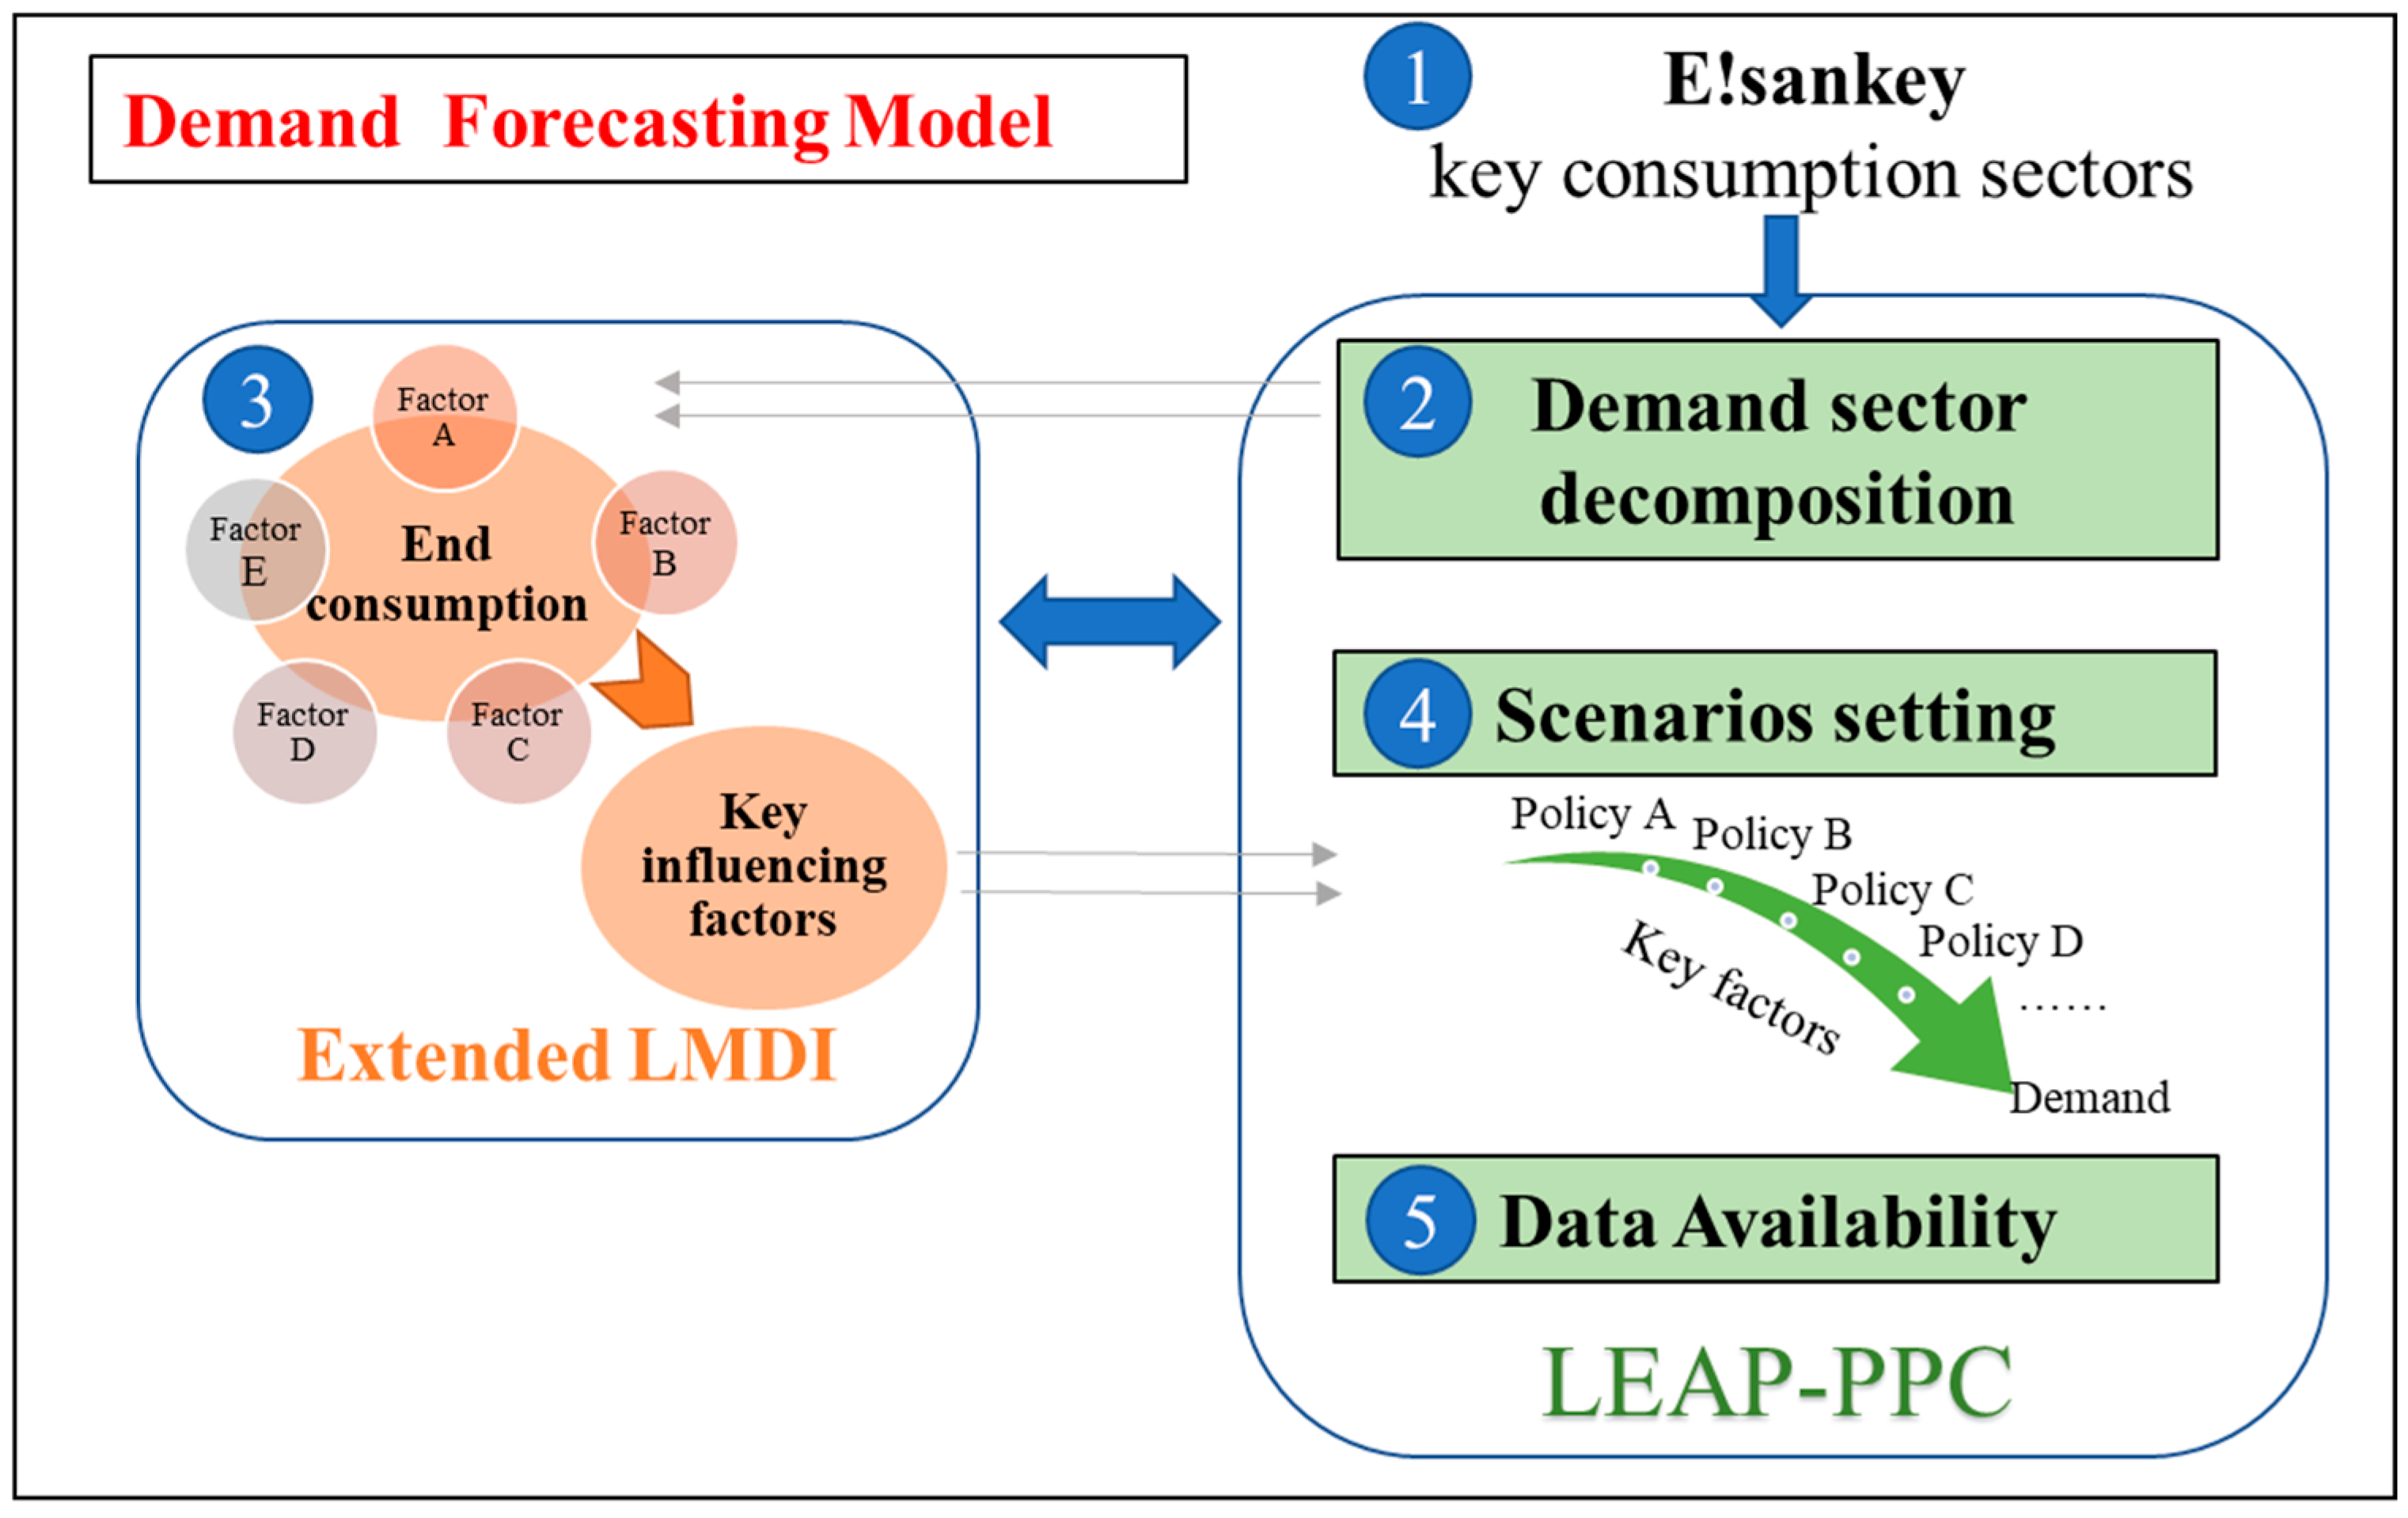
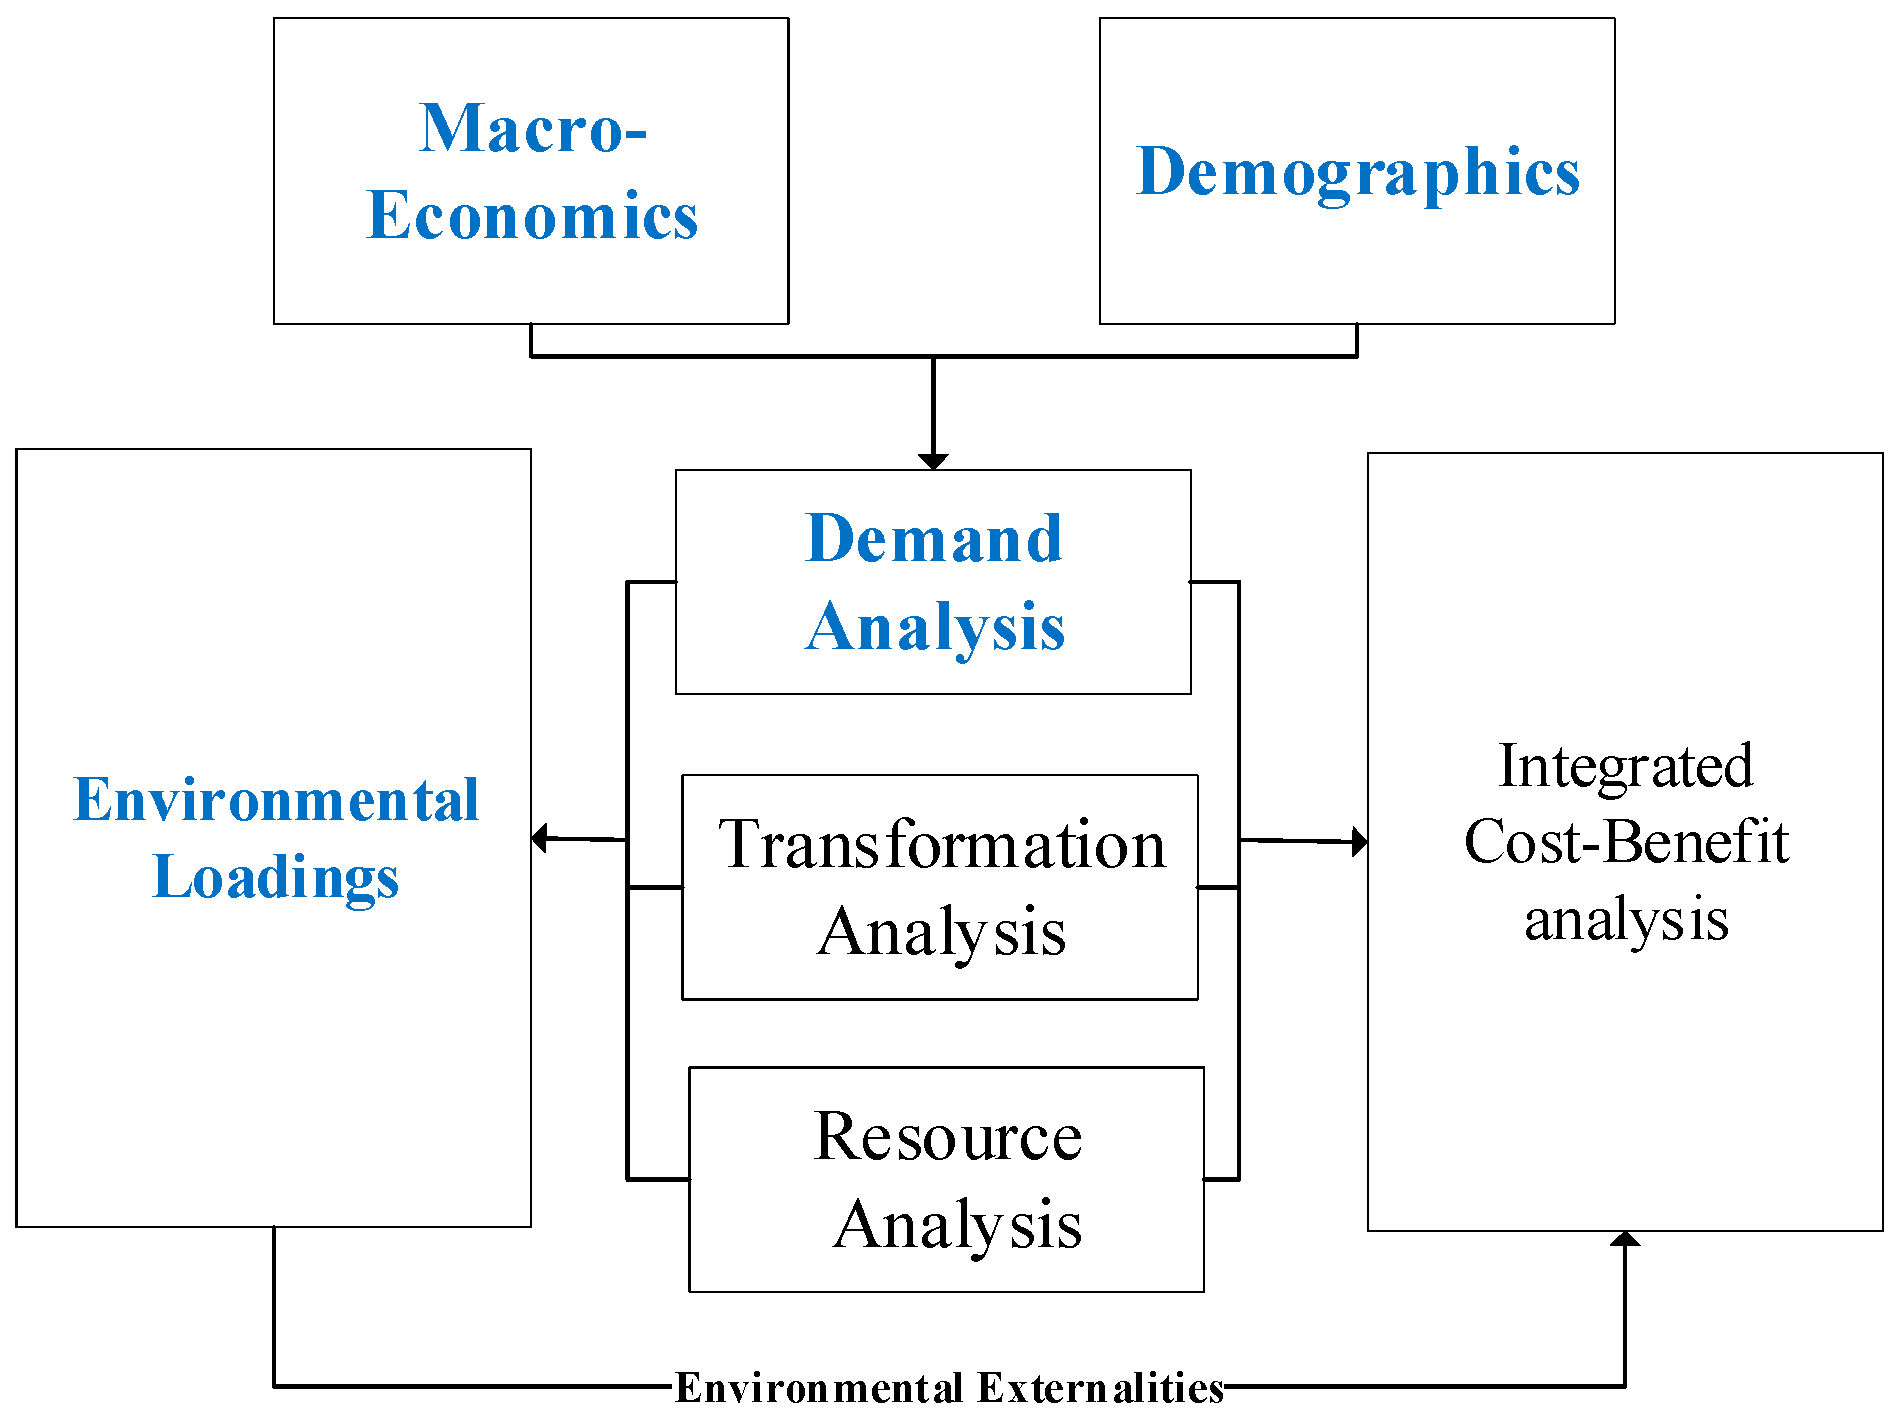
3. Modeling Methodology of LEAP-PPC
3.1. Principle of Demand Calculation
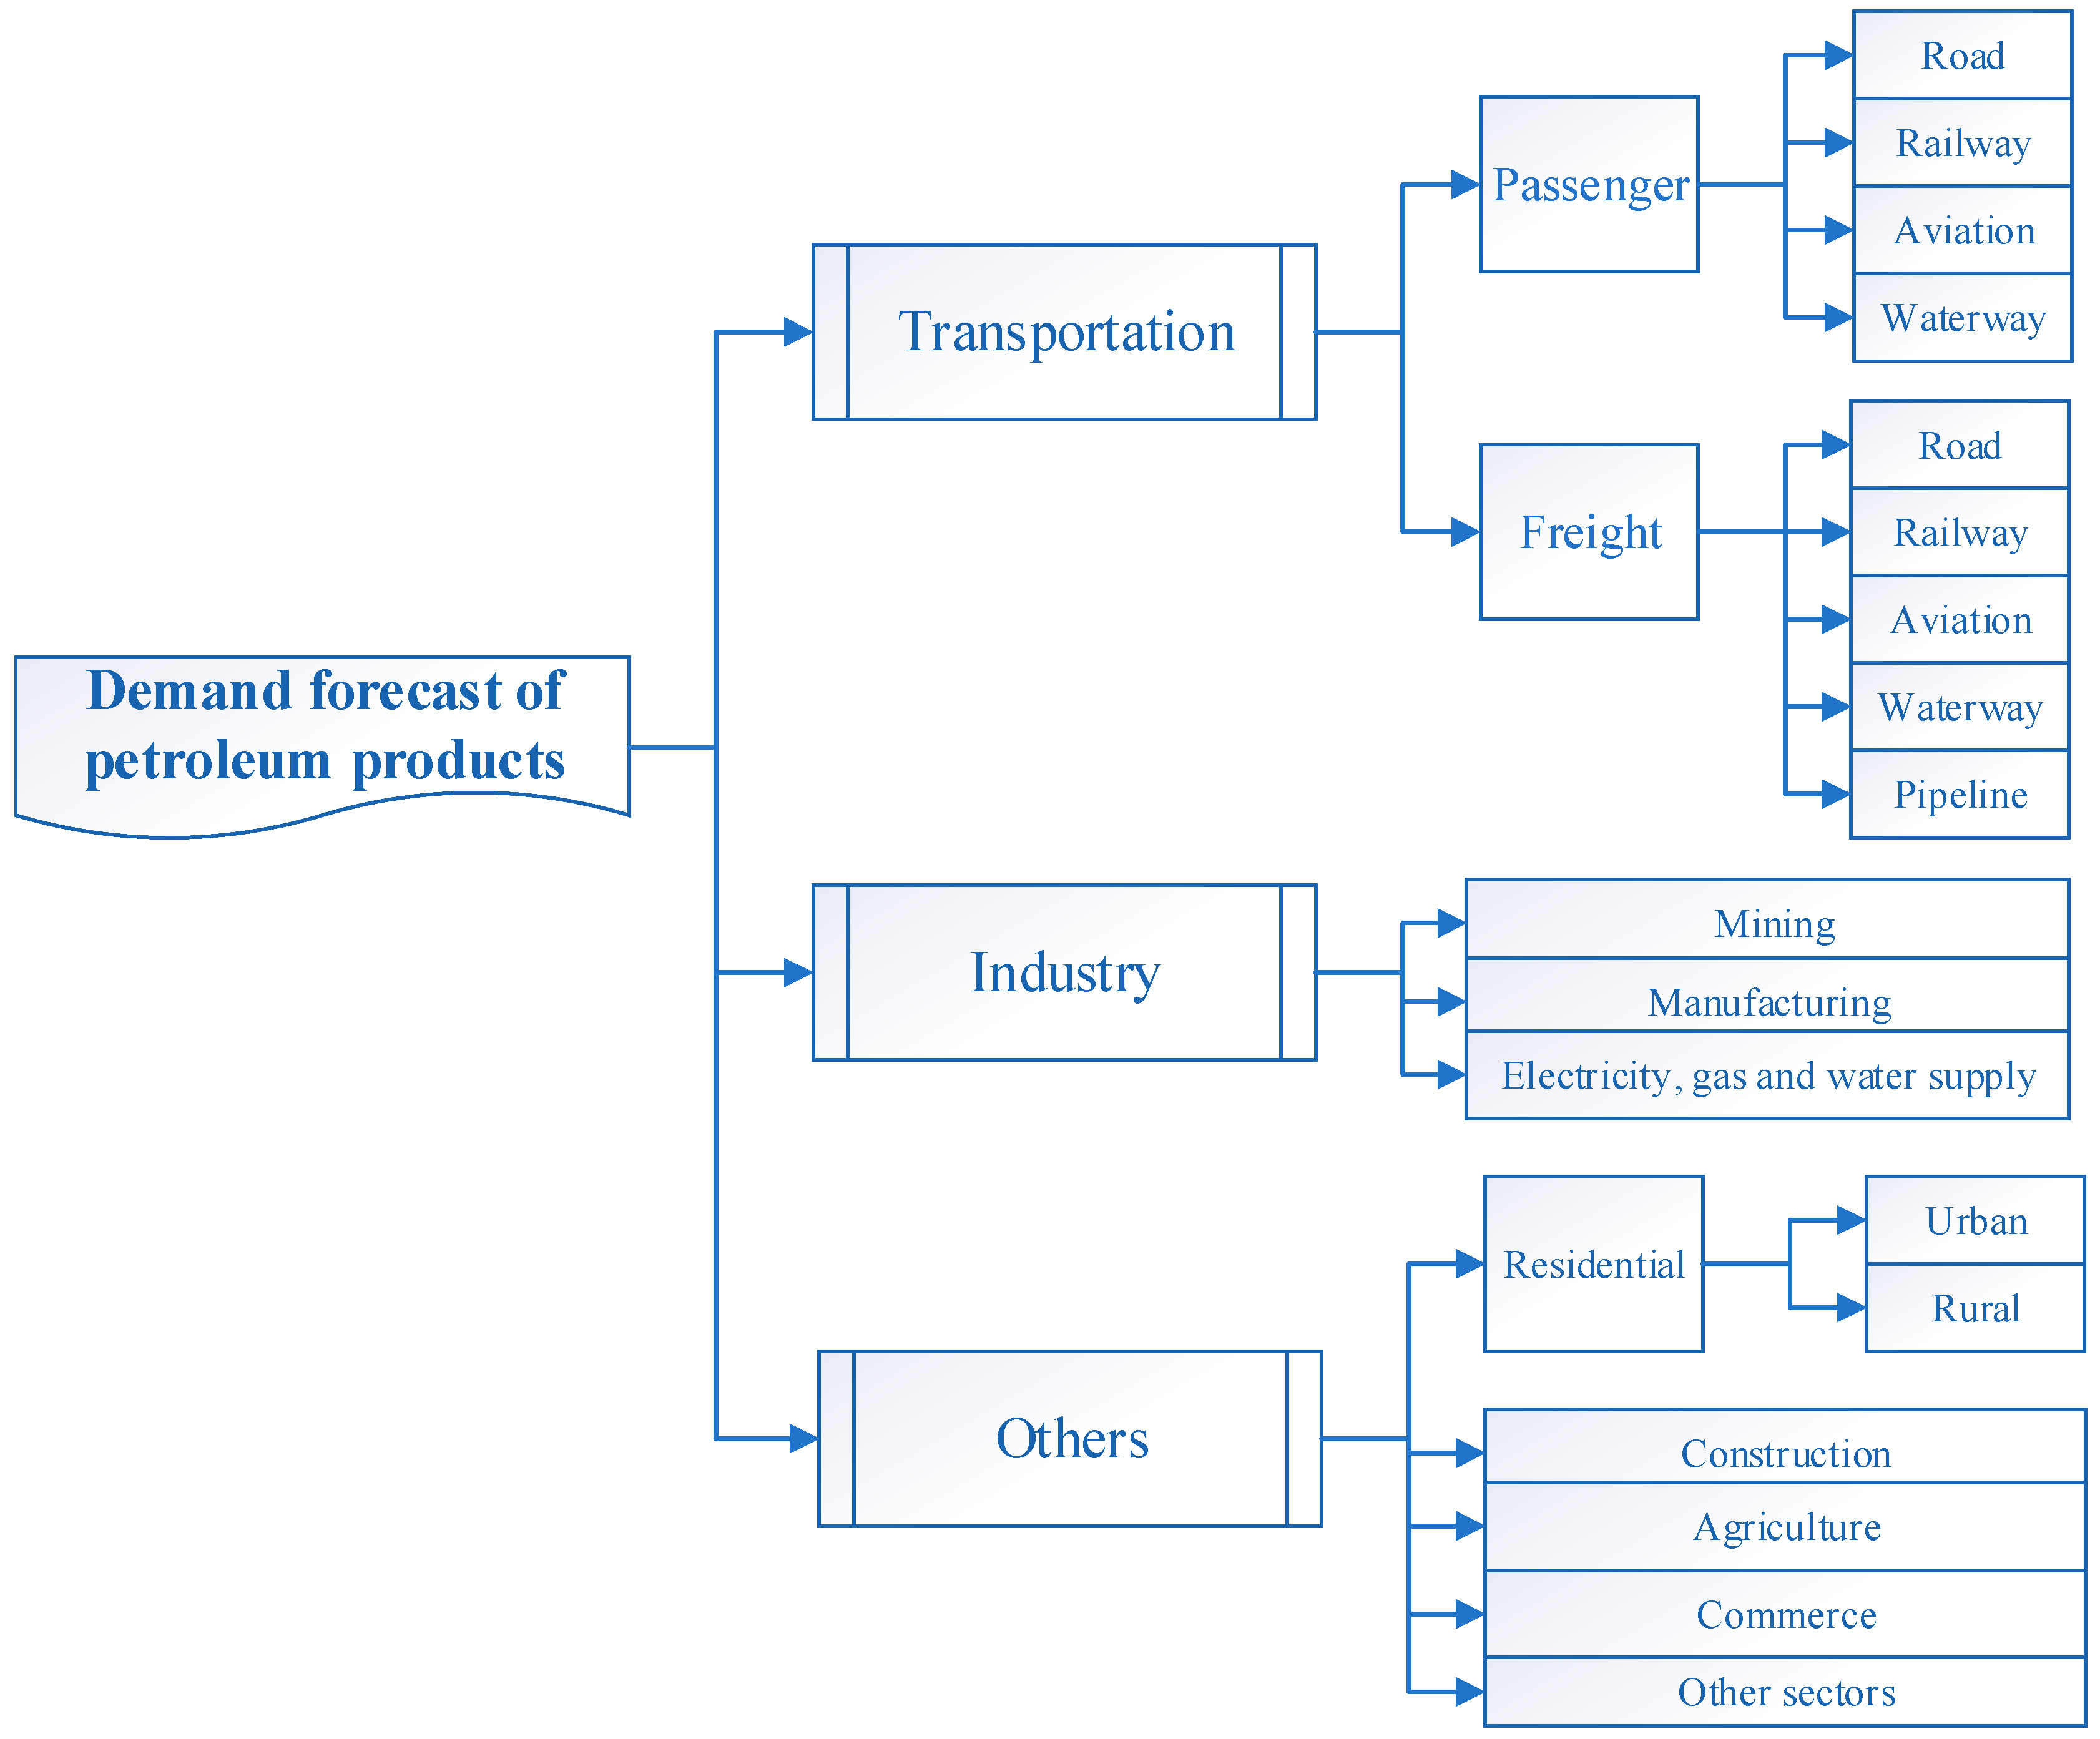
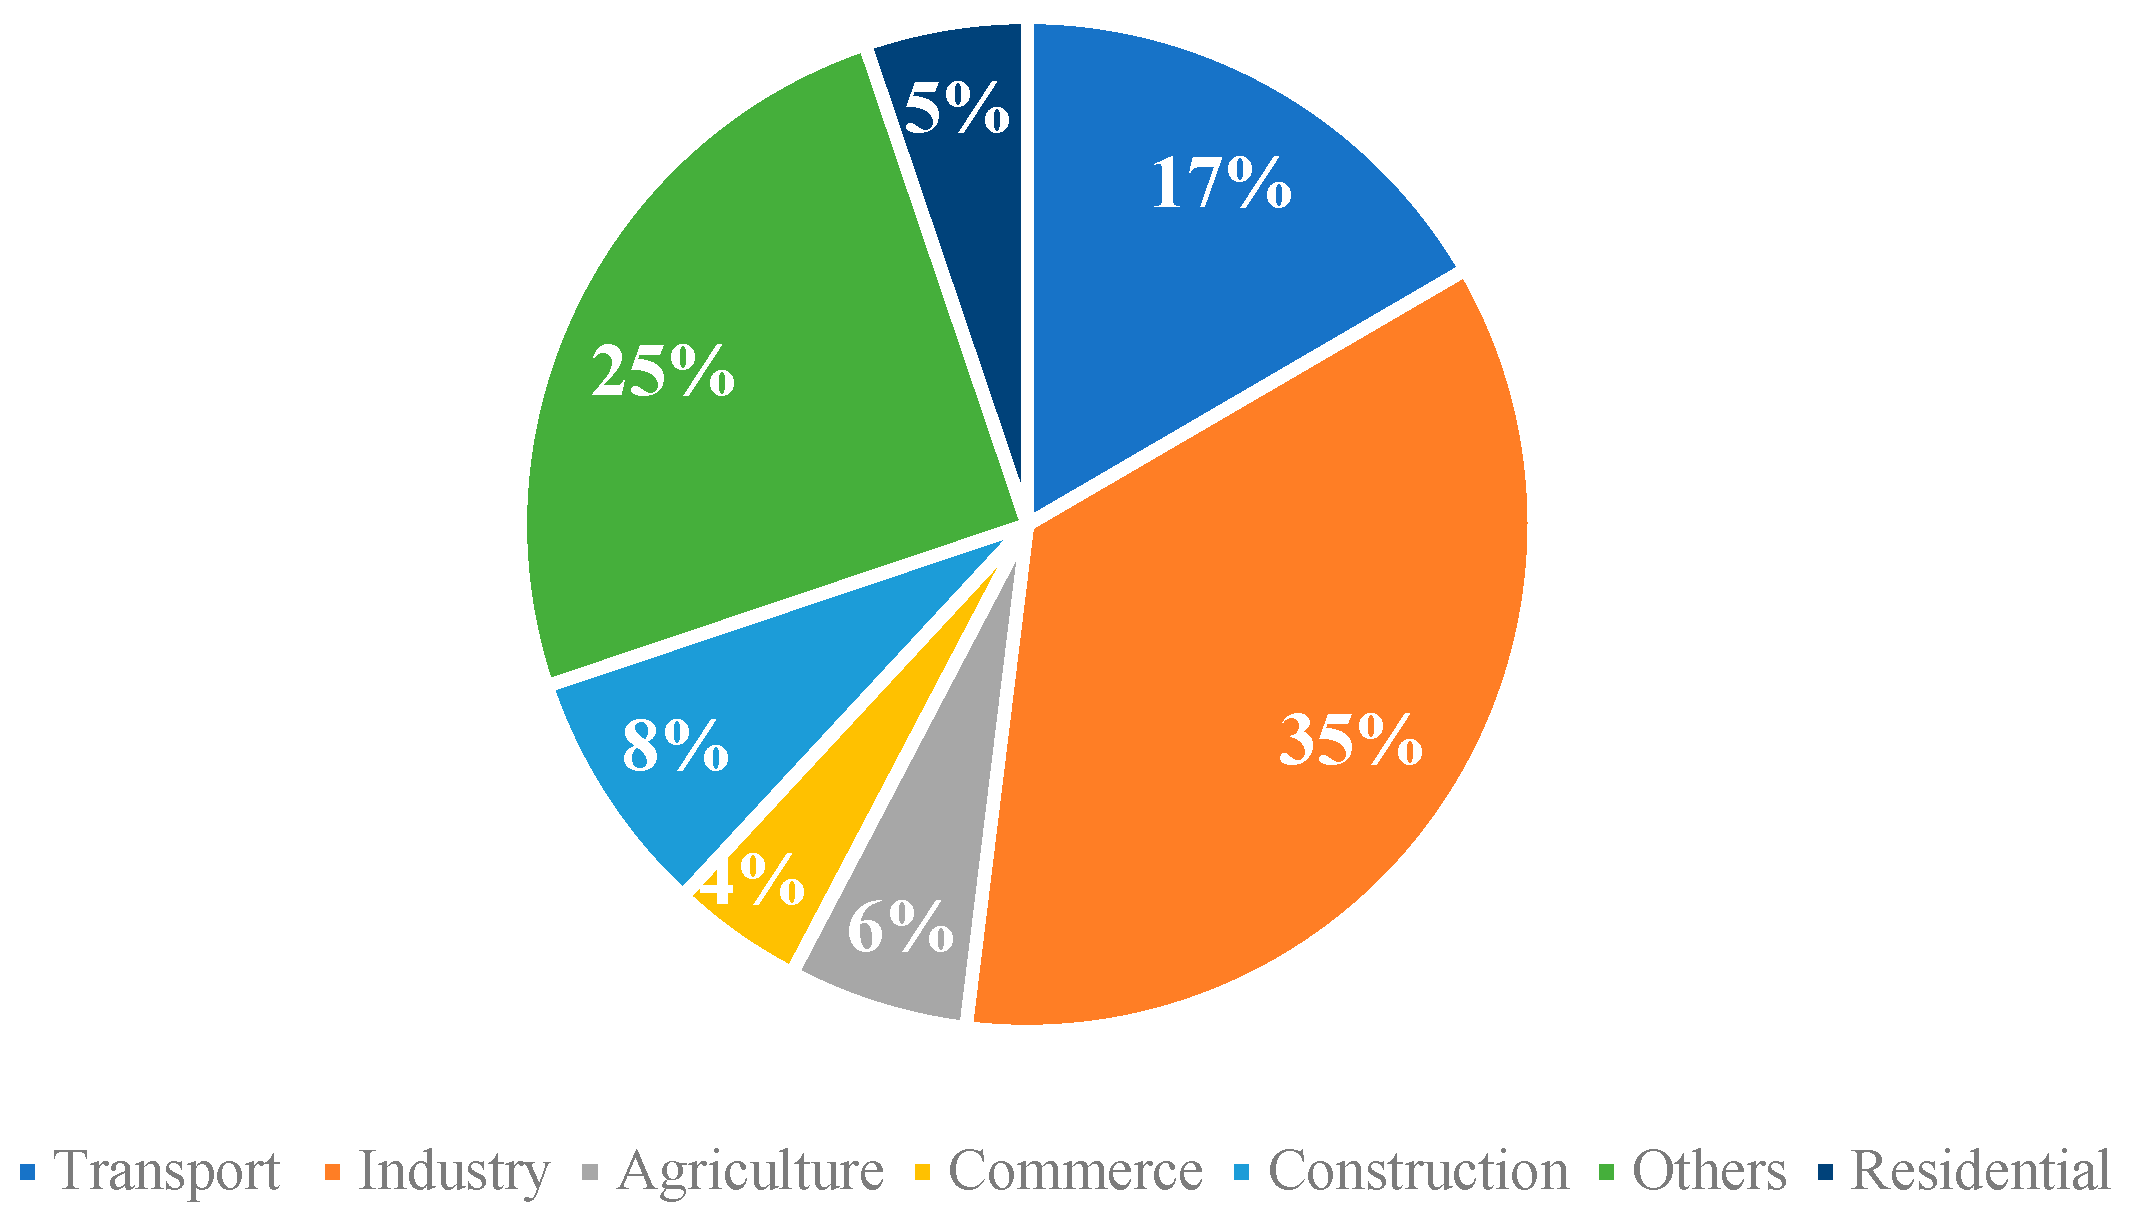
3.2. Decomposition of Demand Sectors
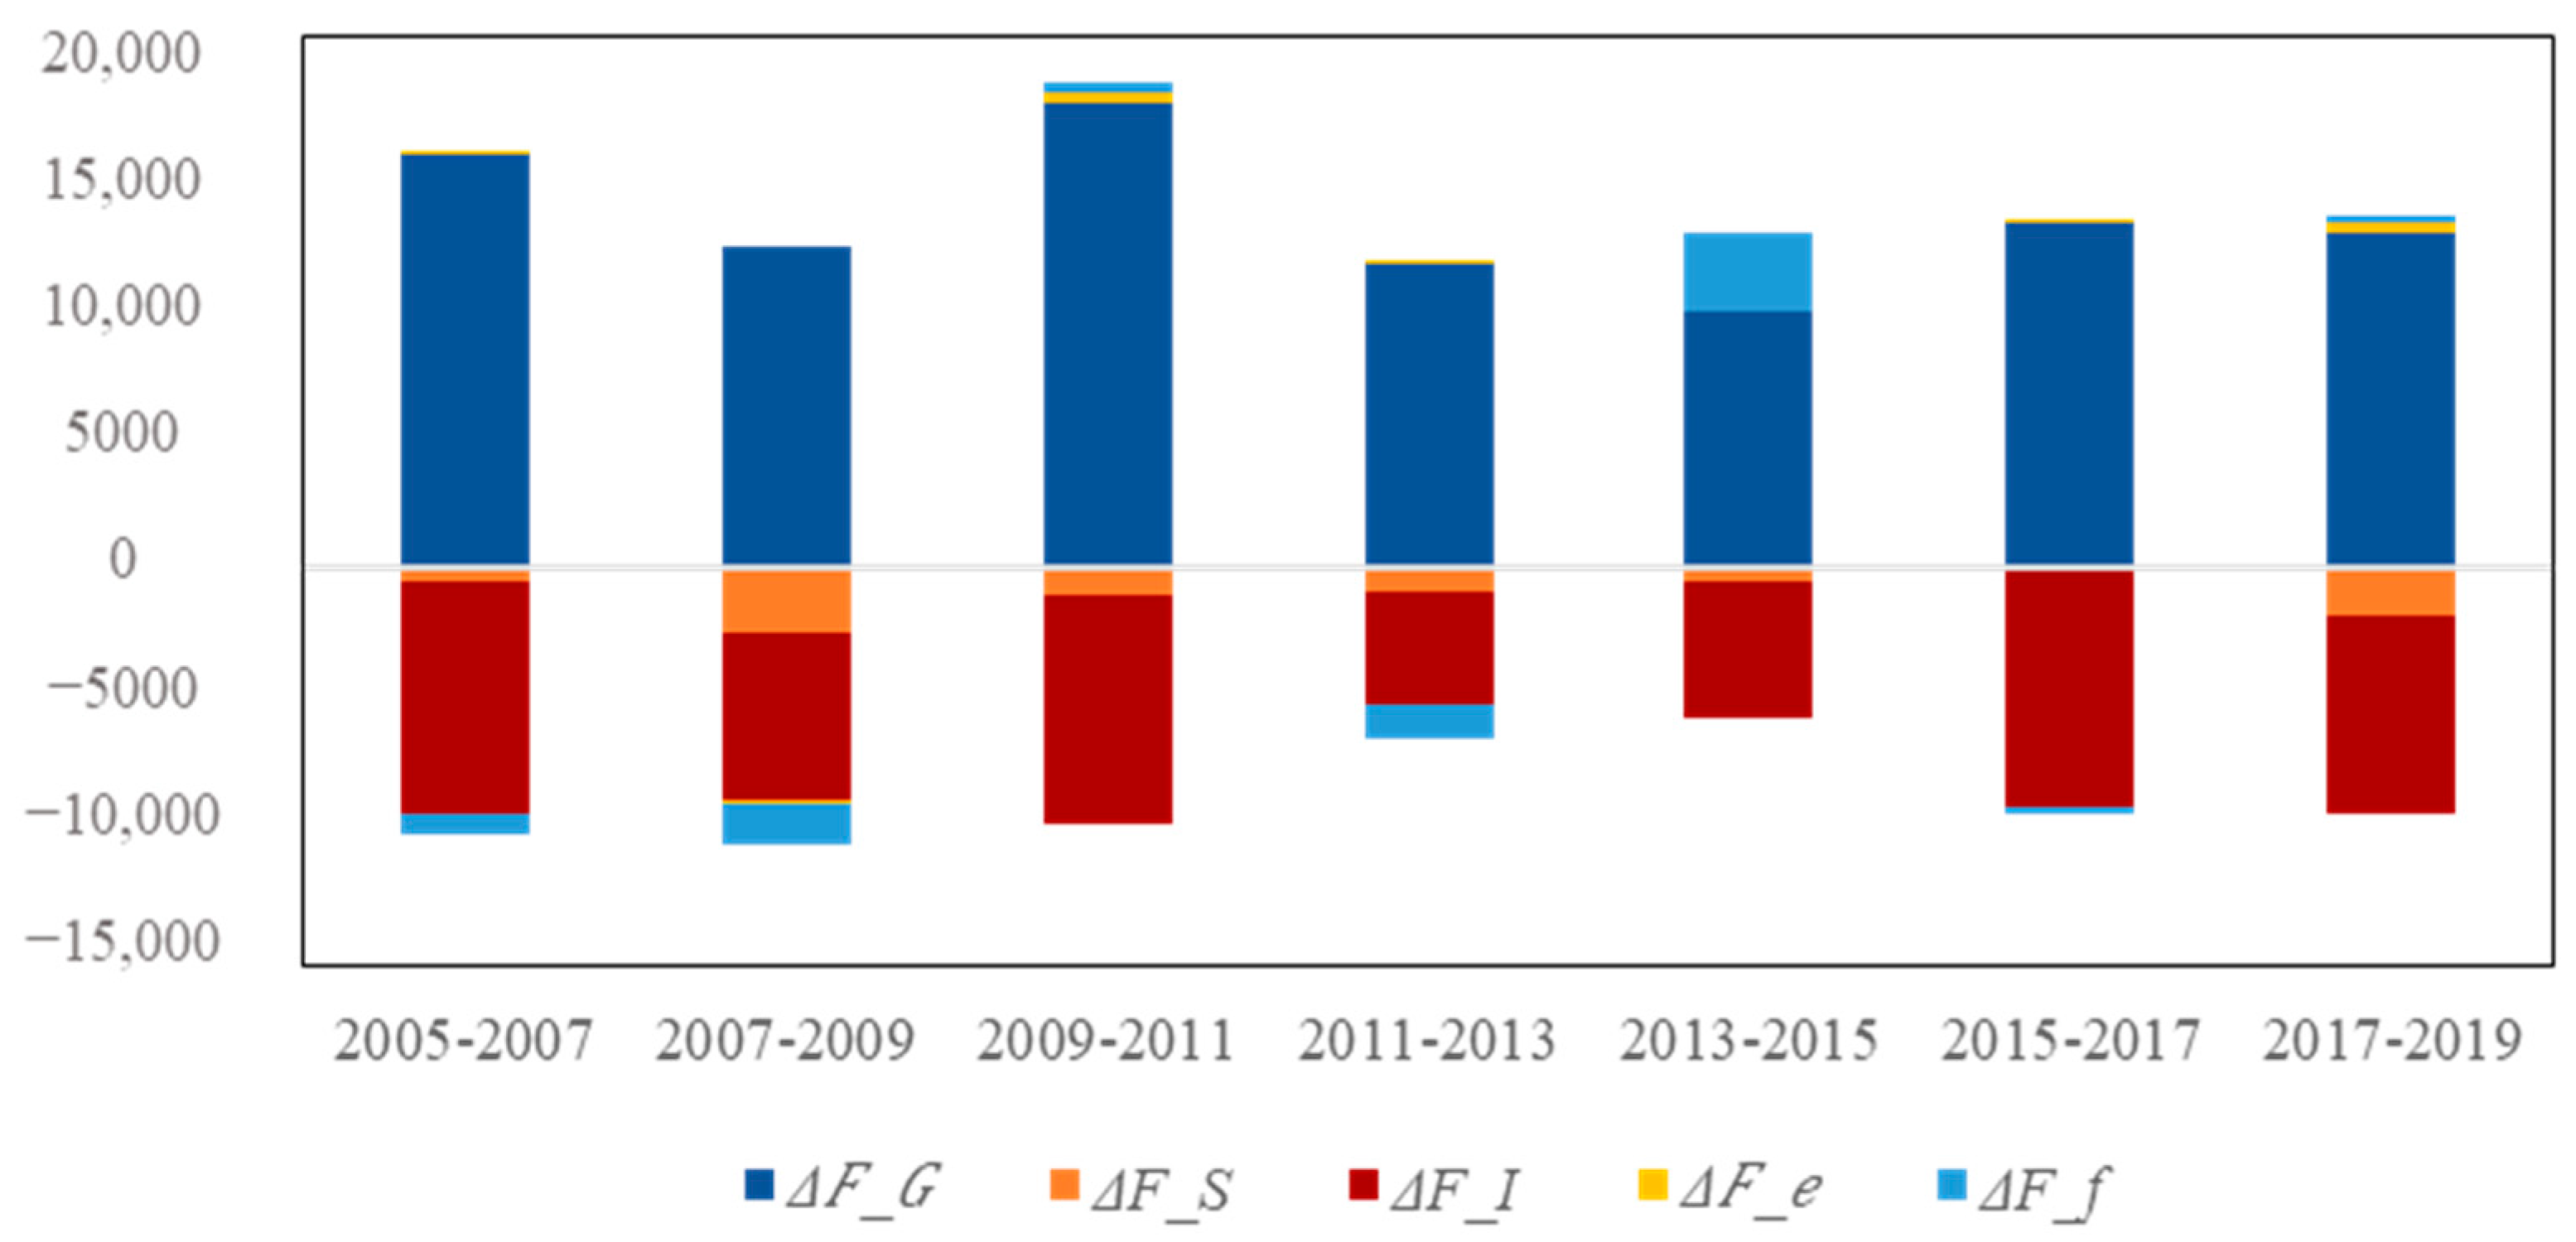
3.3. Identification of Key Factors by Extended LMDI
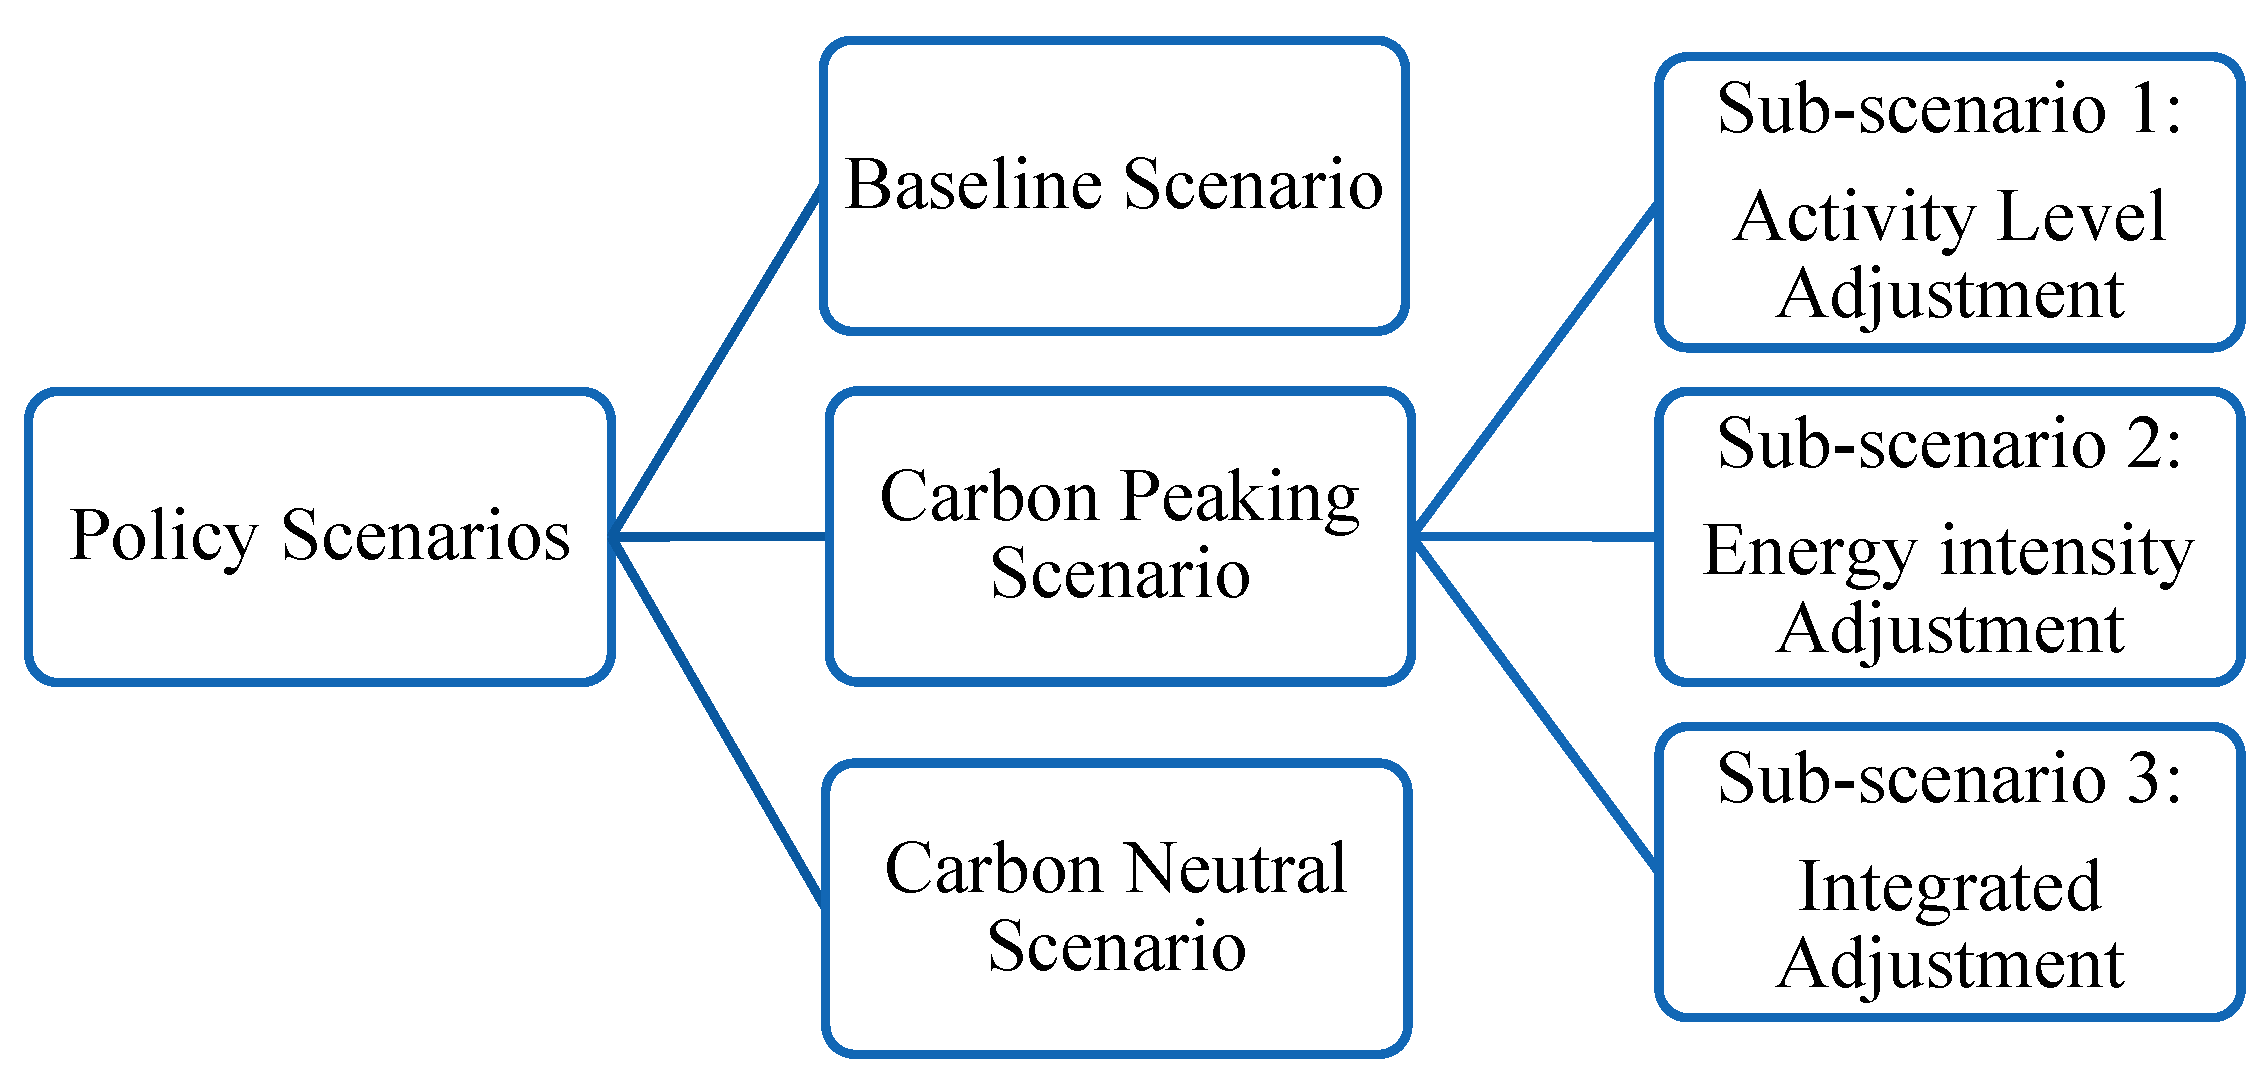
3.4. Scenarios Setting
3.4.1. Baseline Scenario
3.4.2. The Carbon Peaking Scenario
3.4.3. The Carbon Neutral Scenario
3.5. Data Availability
4. Results and Discussions
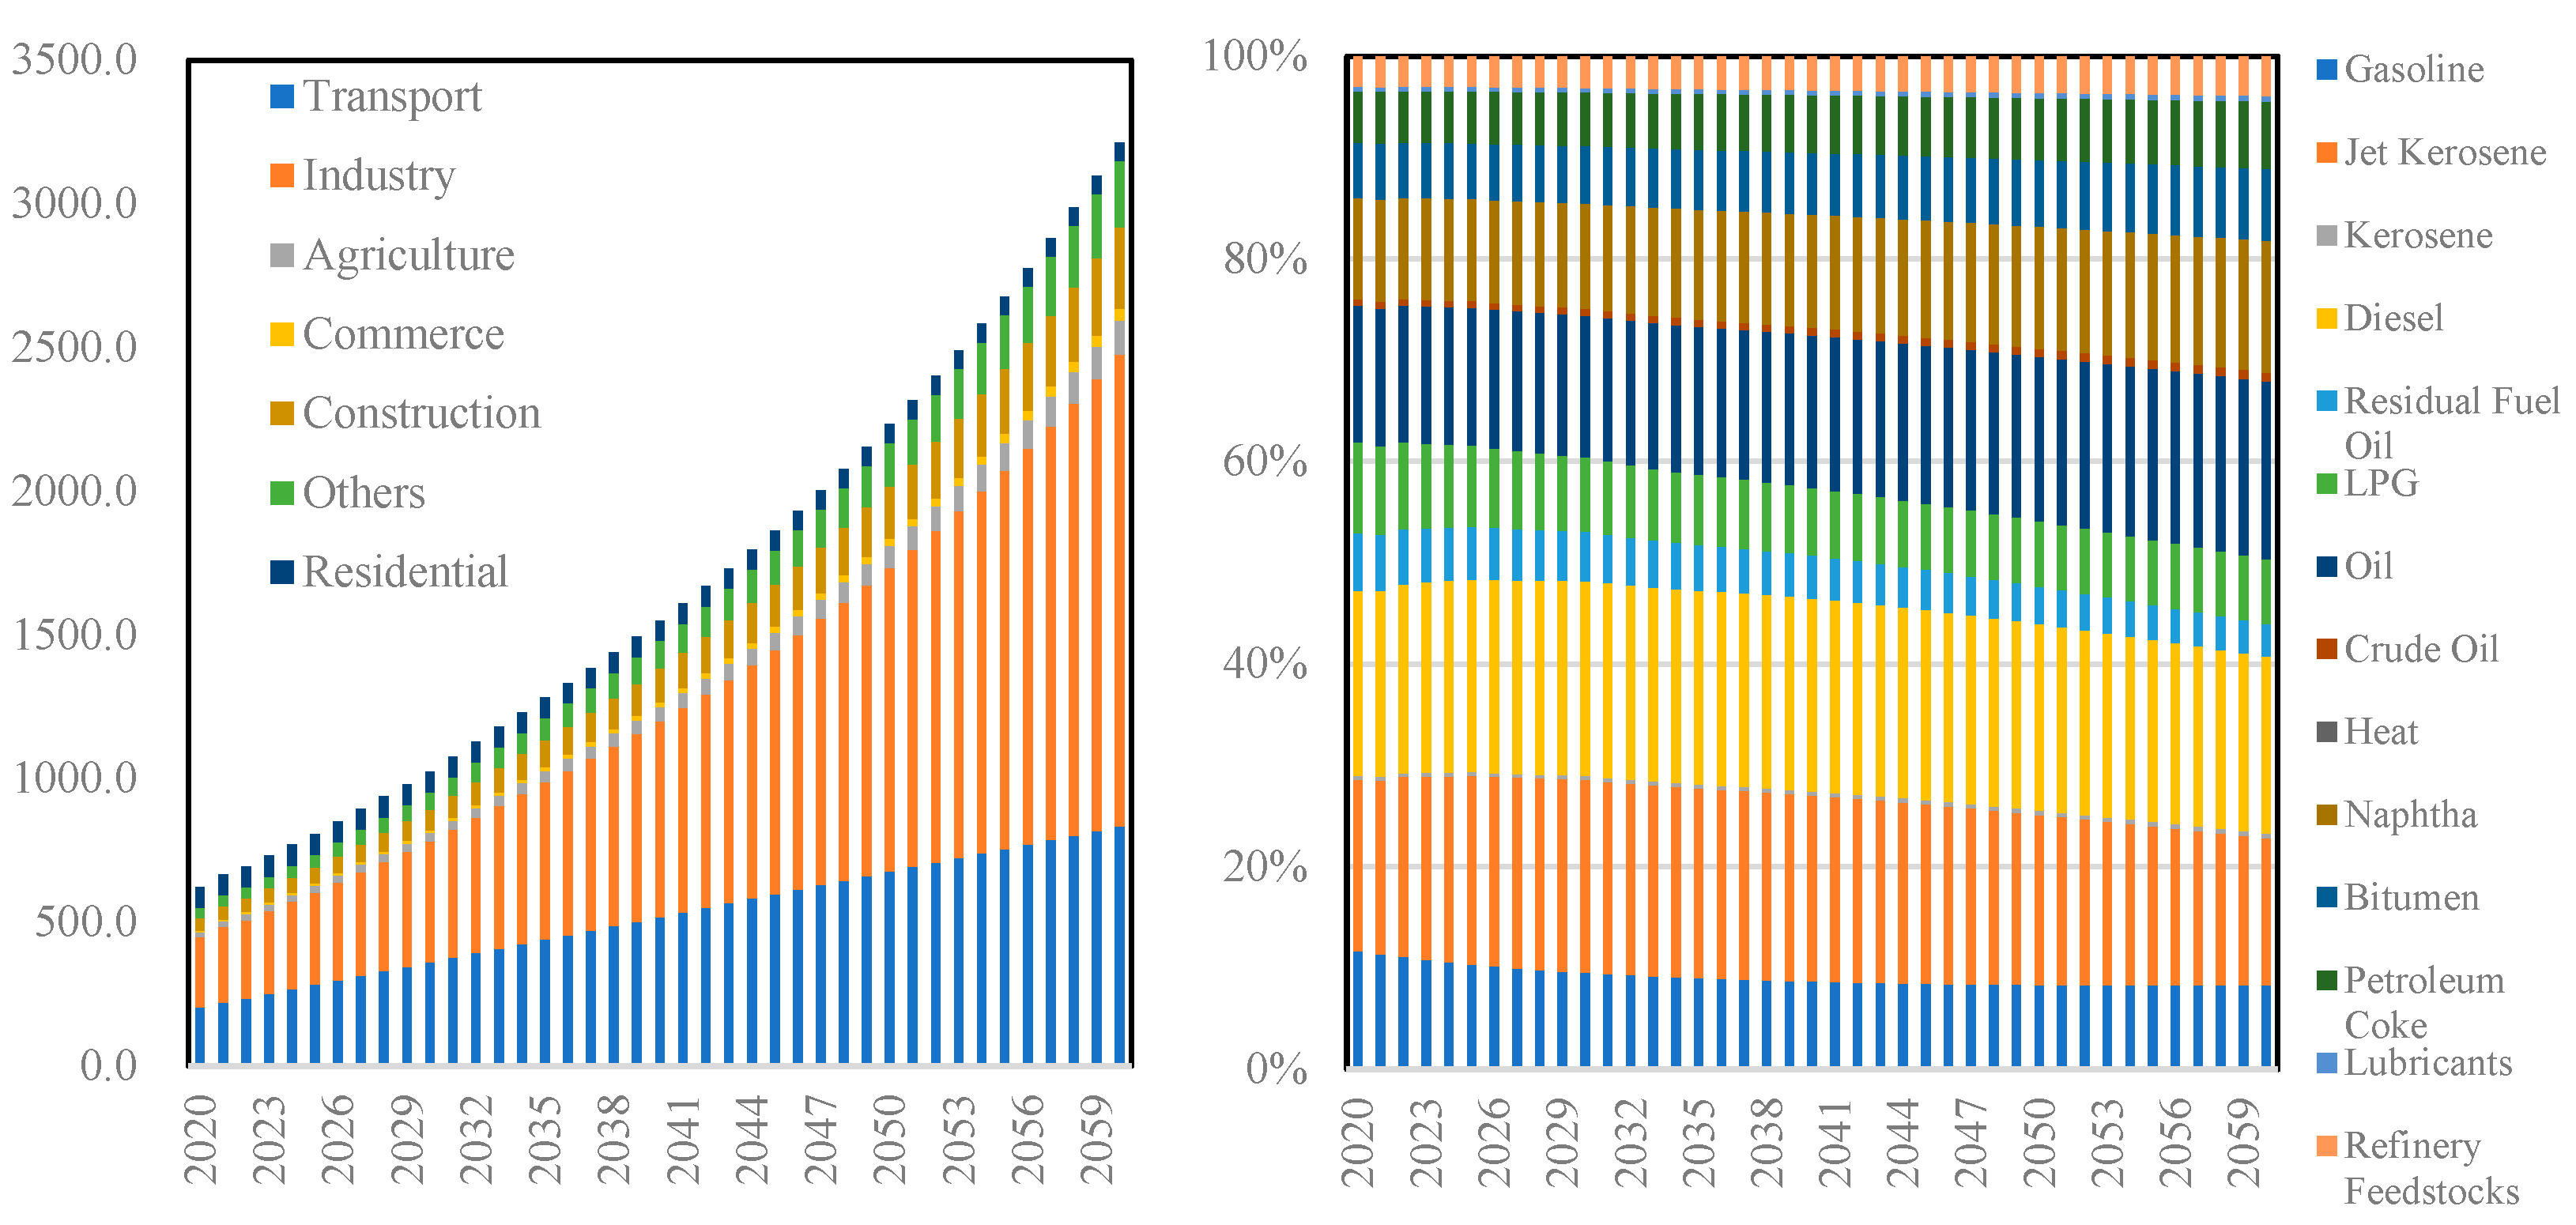
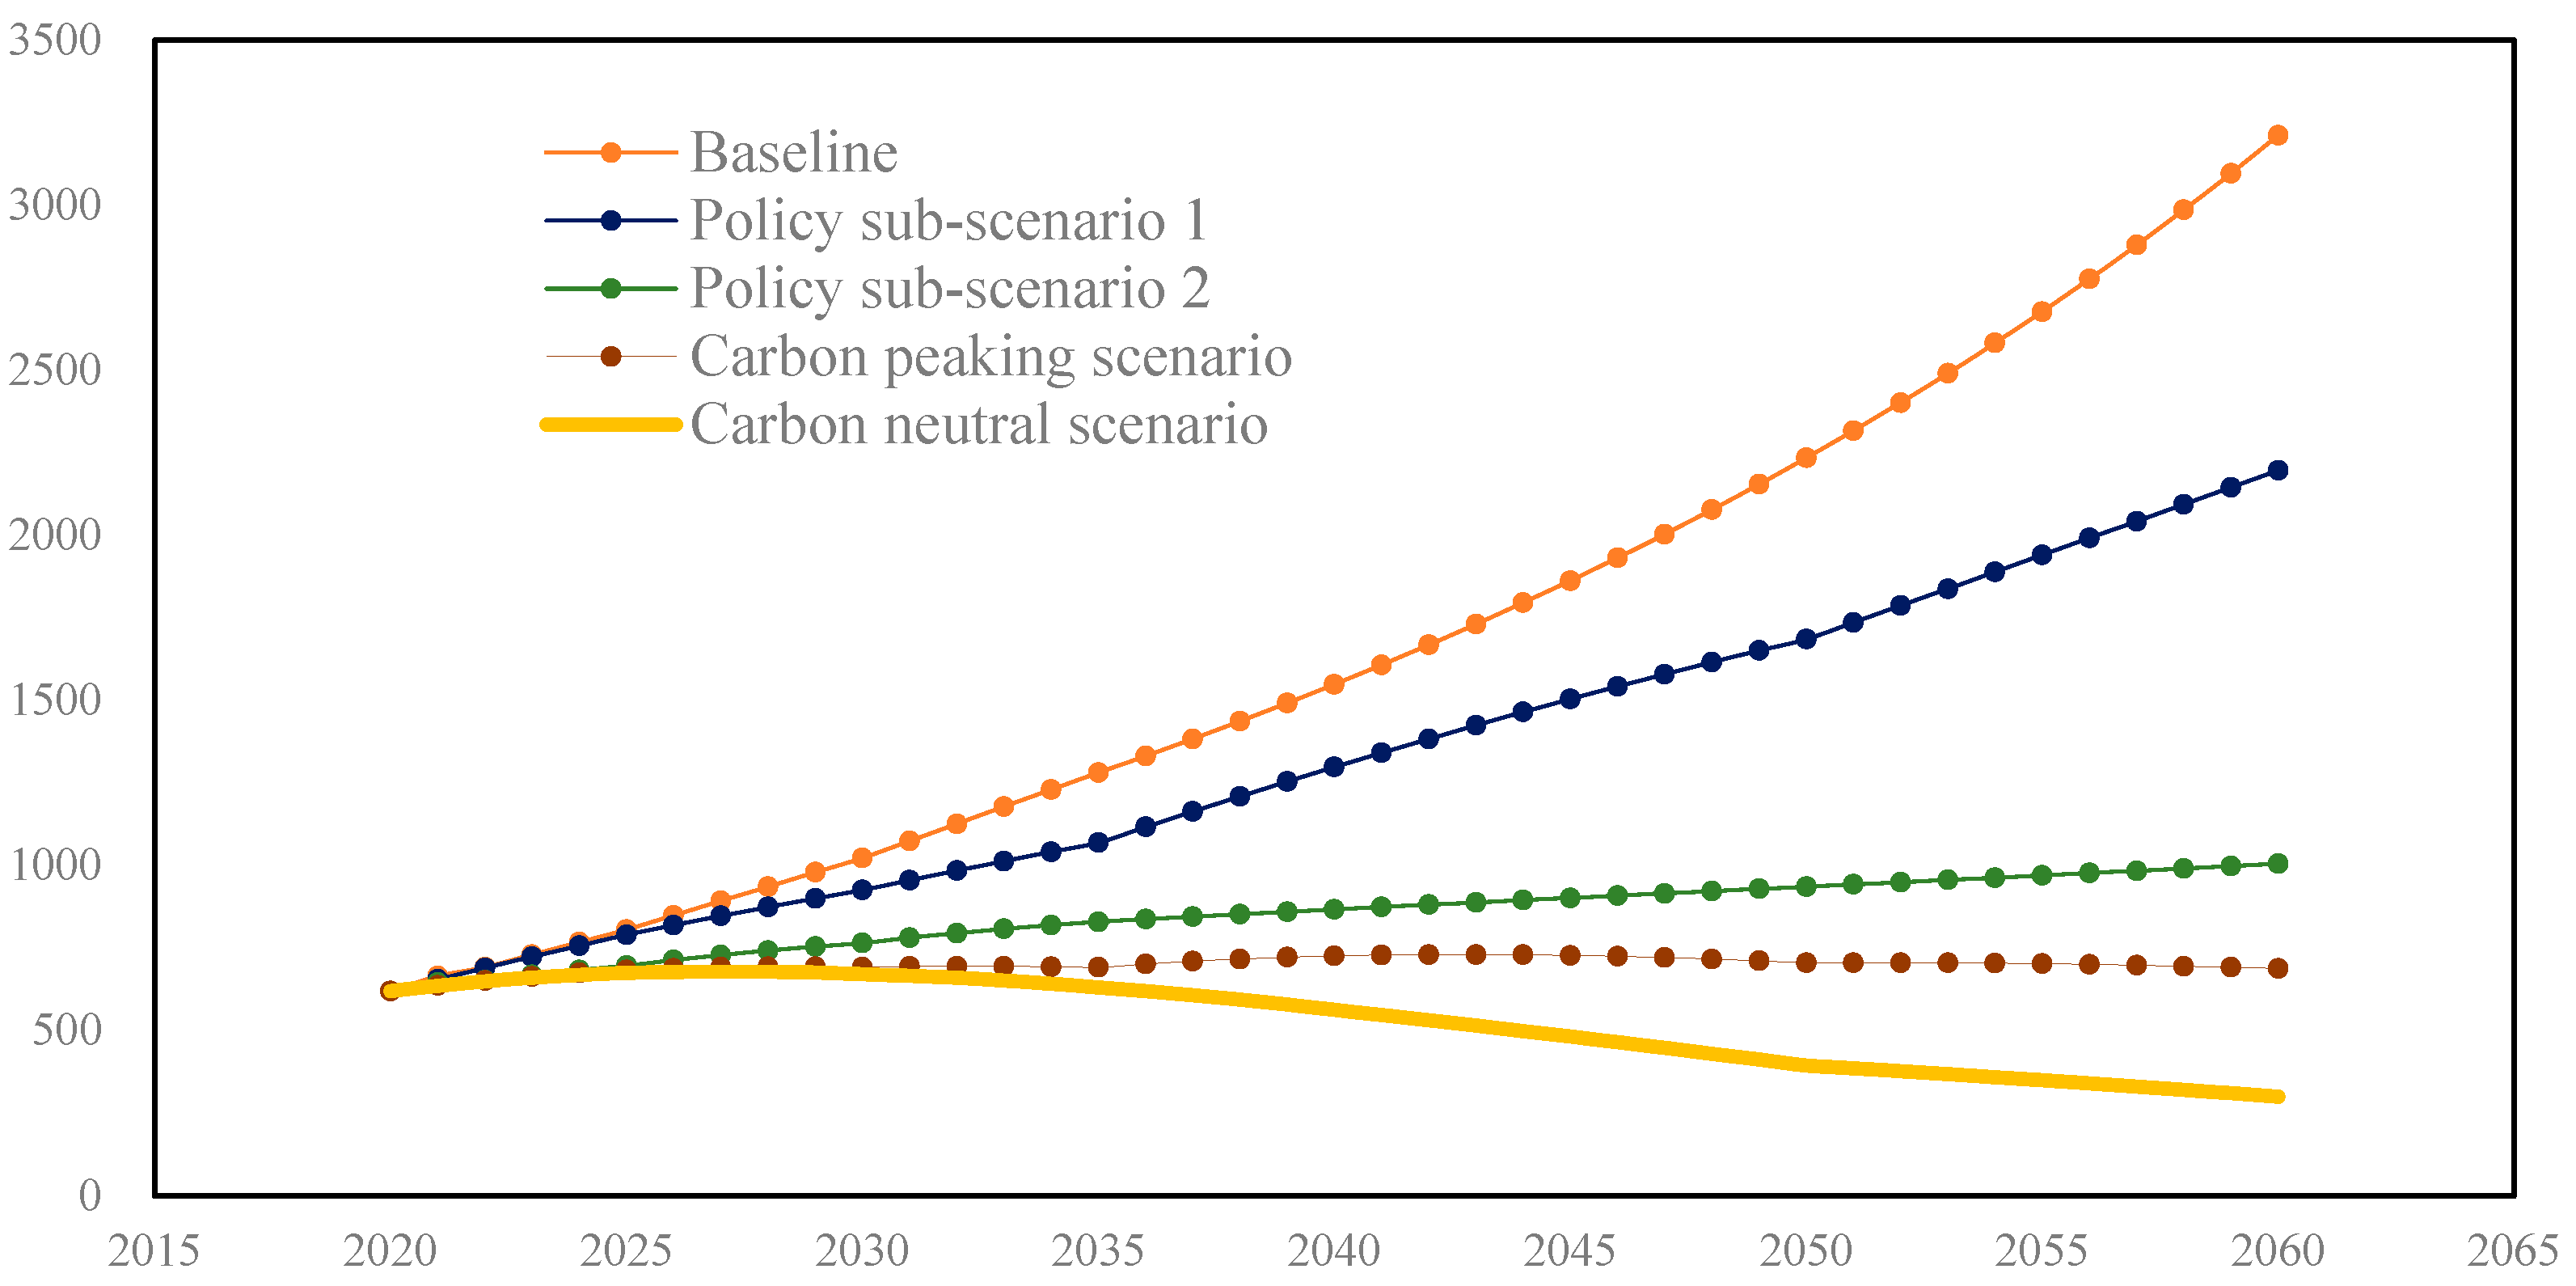
4.1. Baseline Scenario
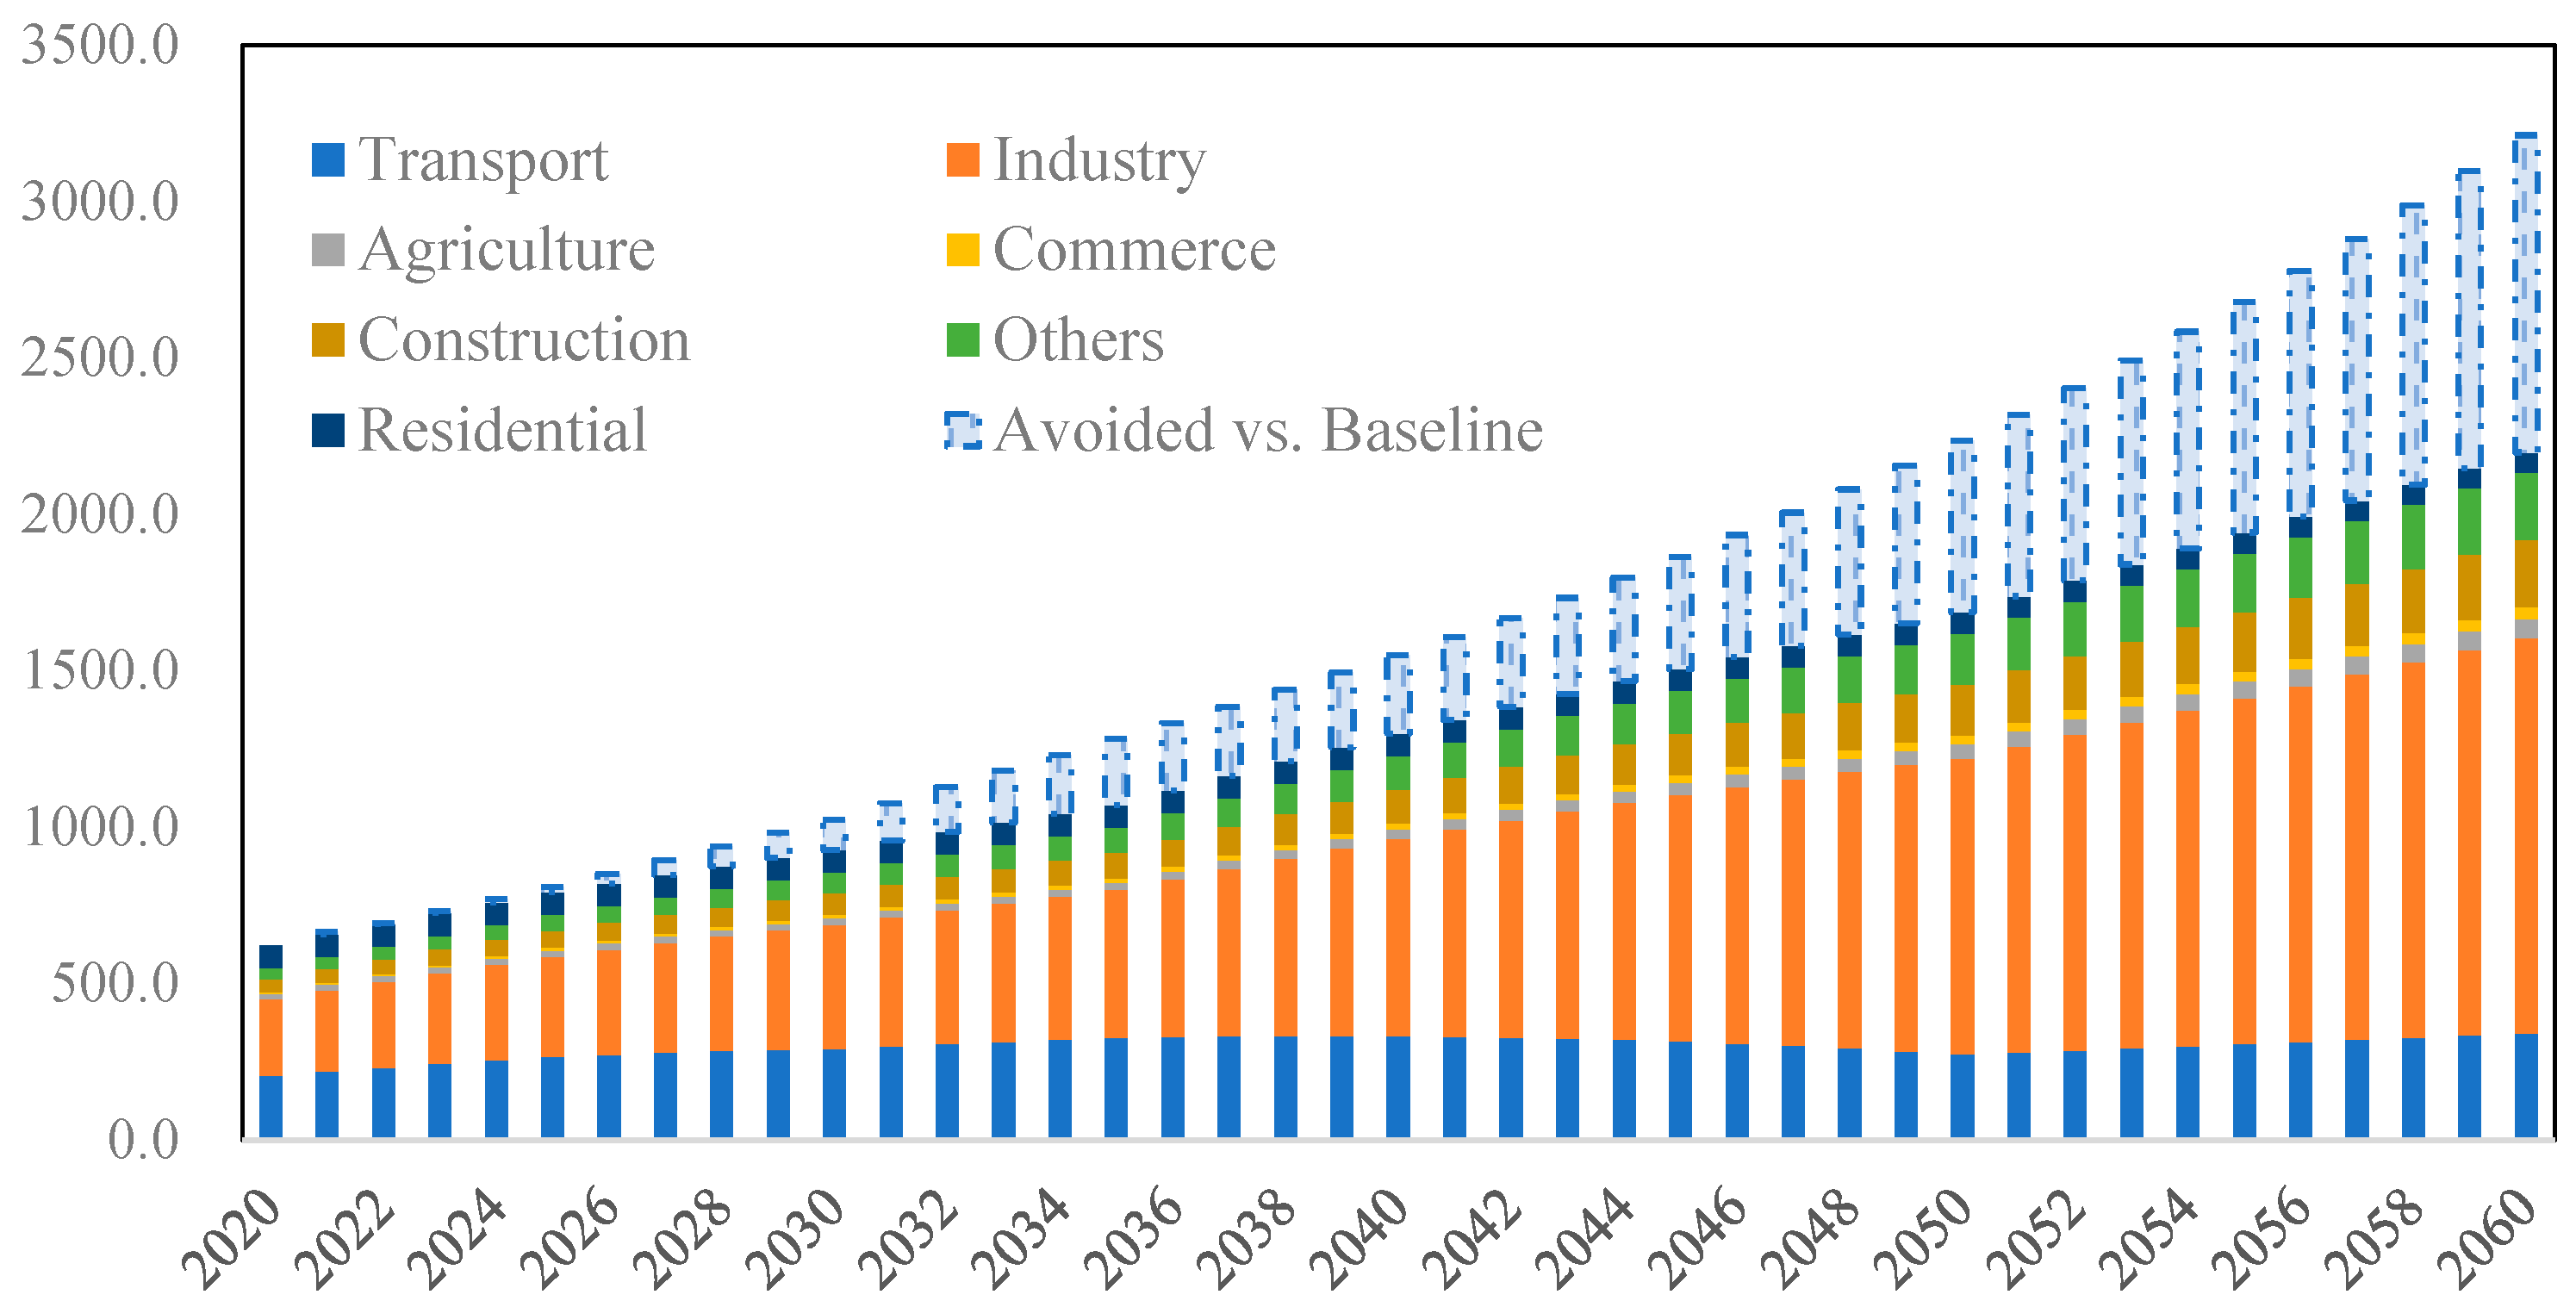
4.2. Policy Impacts of Activity Level Adjustment on Petroleum Products Demand
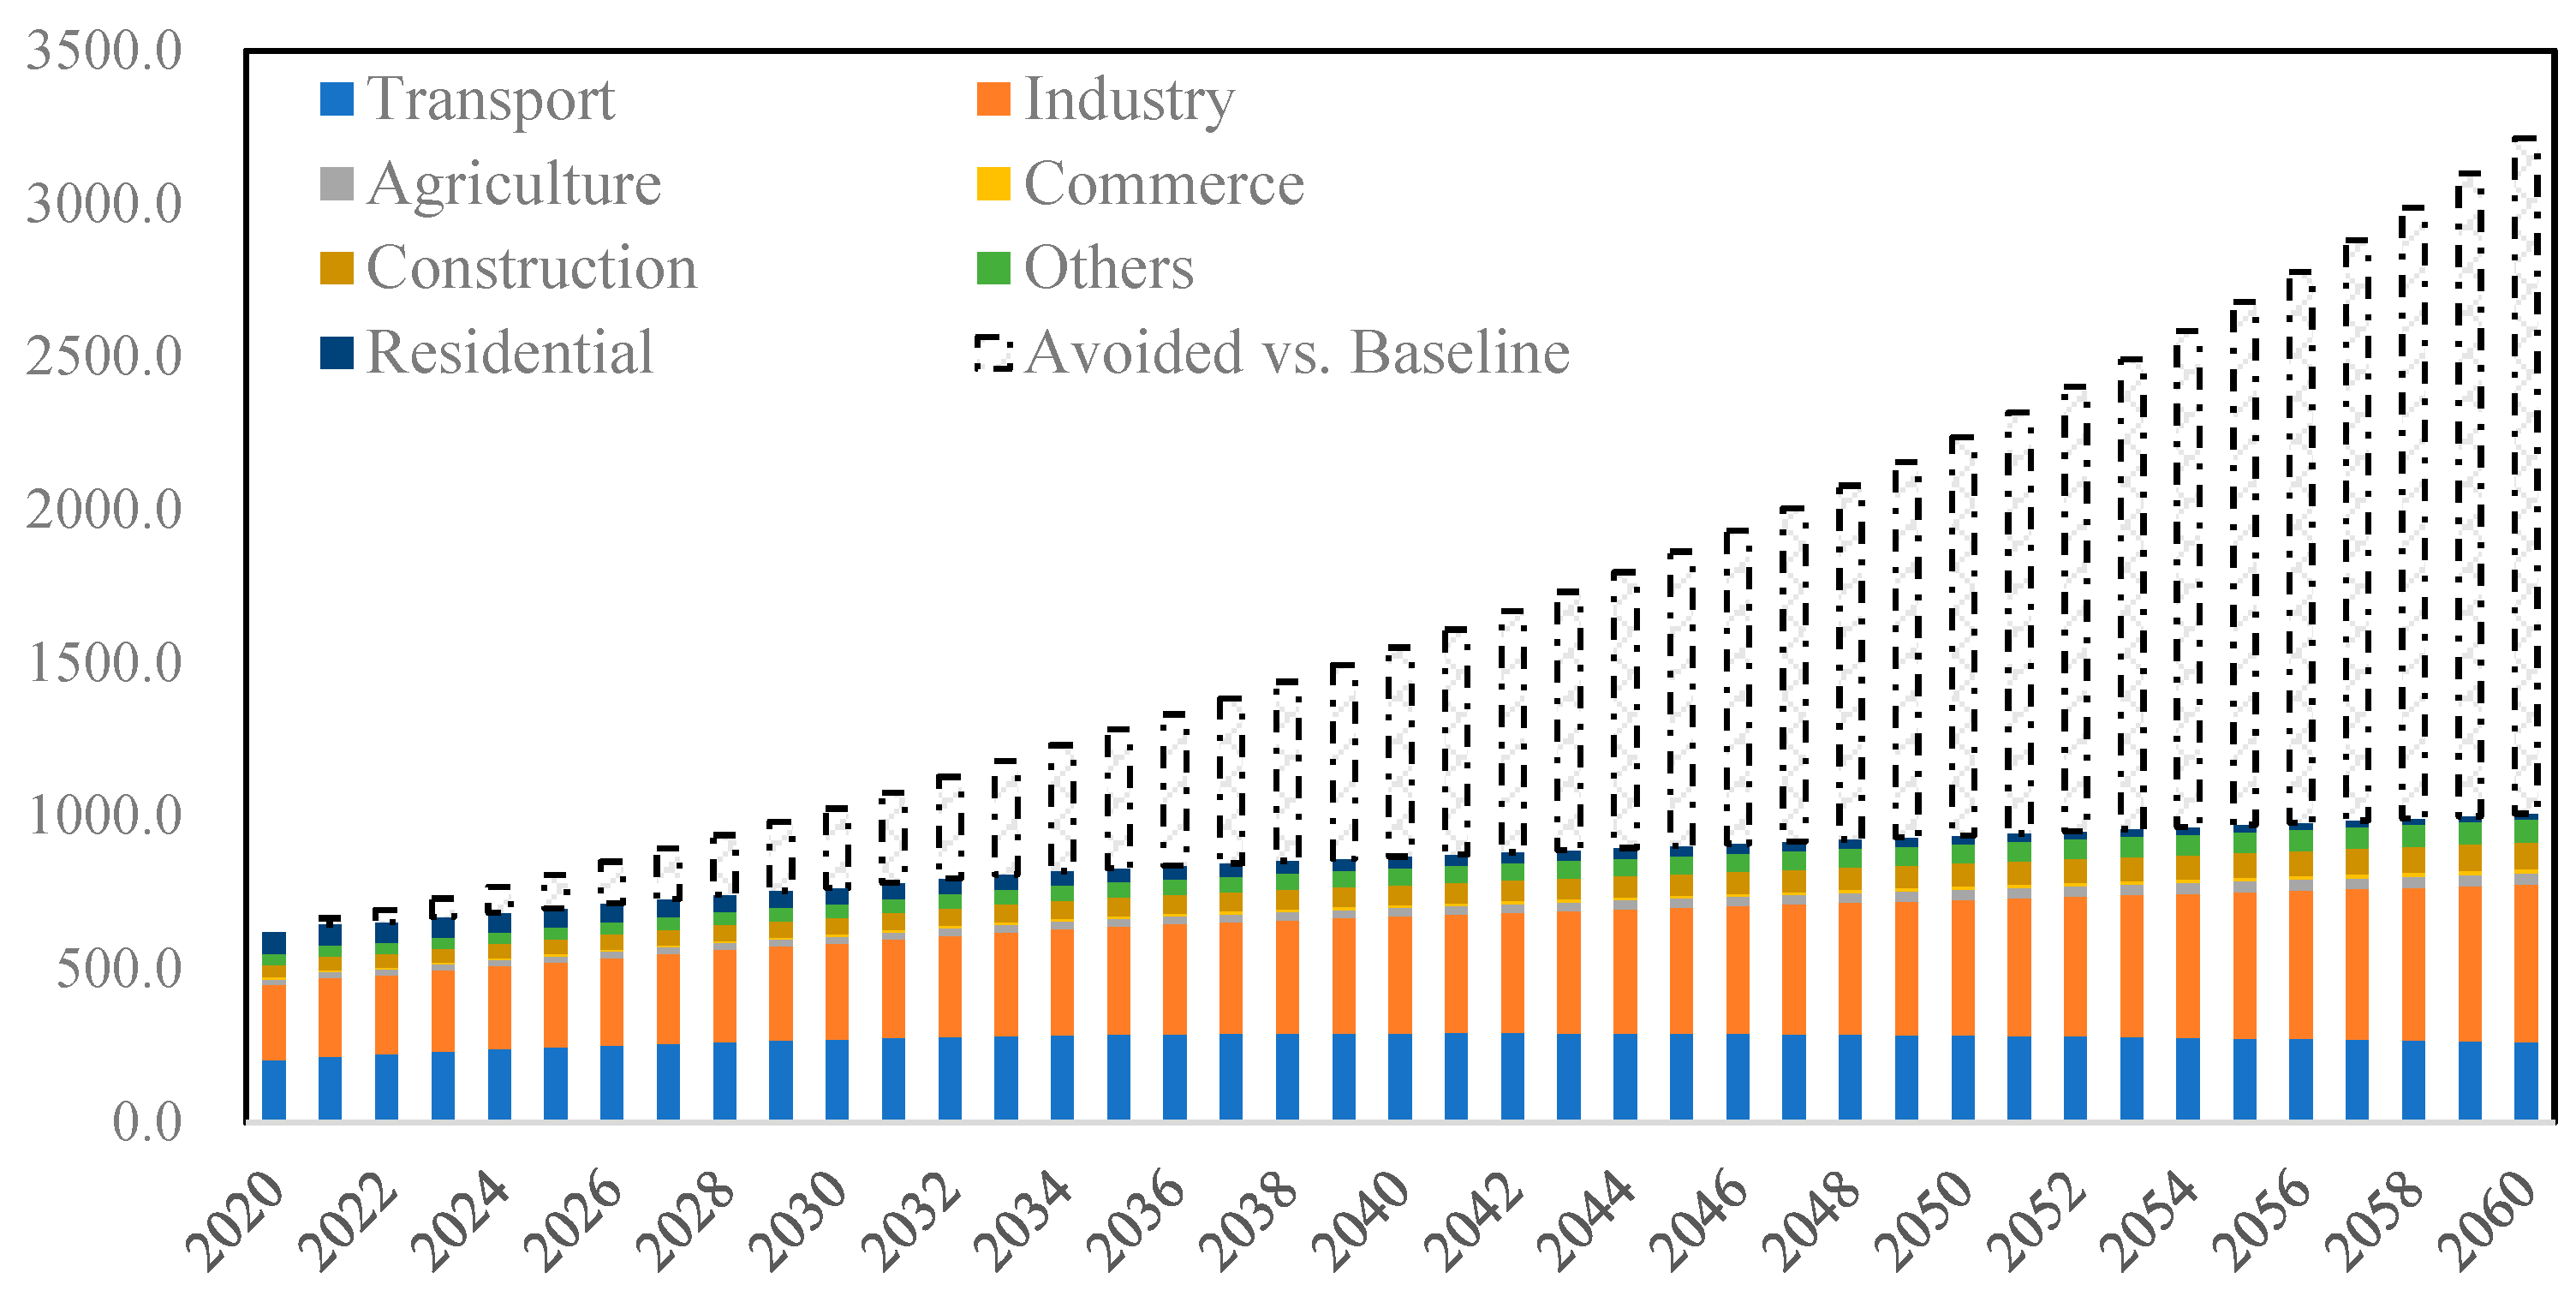
4.3. Policy Impact of Energy Intensity Adjustment on Petroleum Products Demand
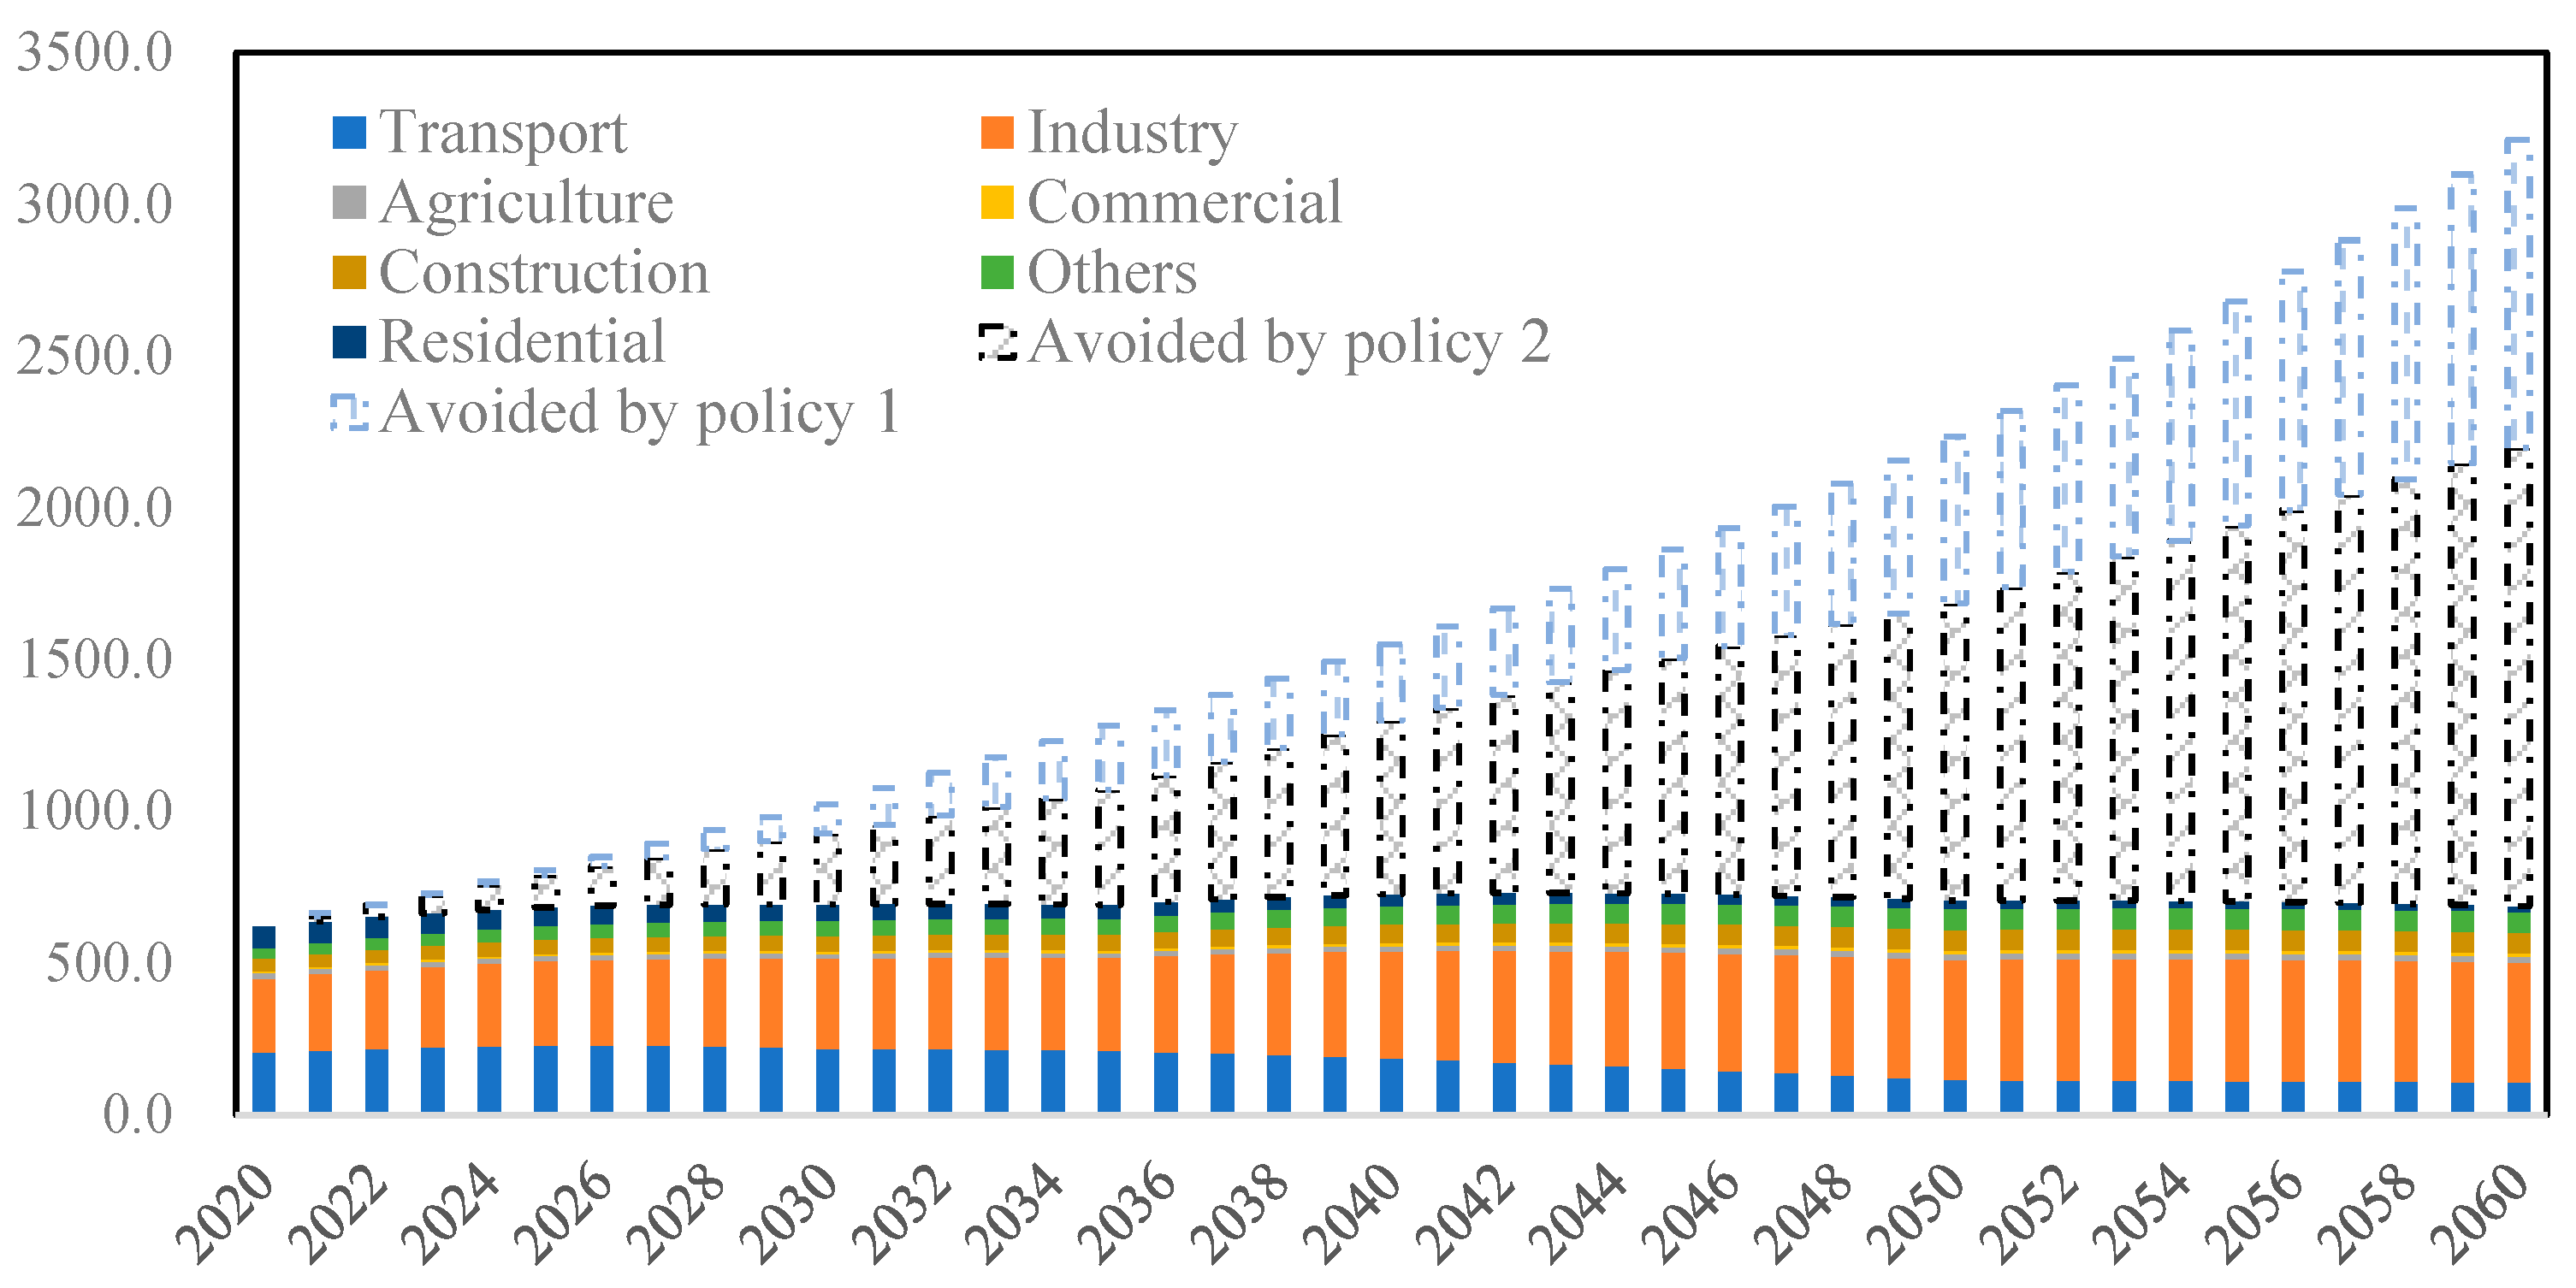
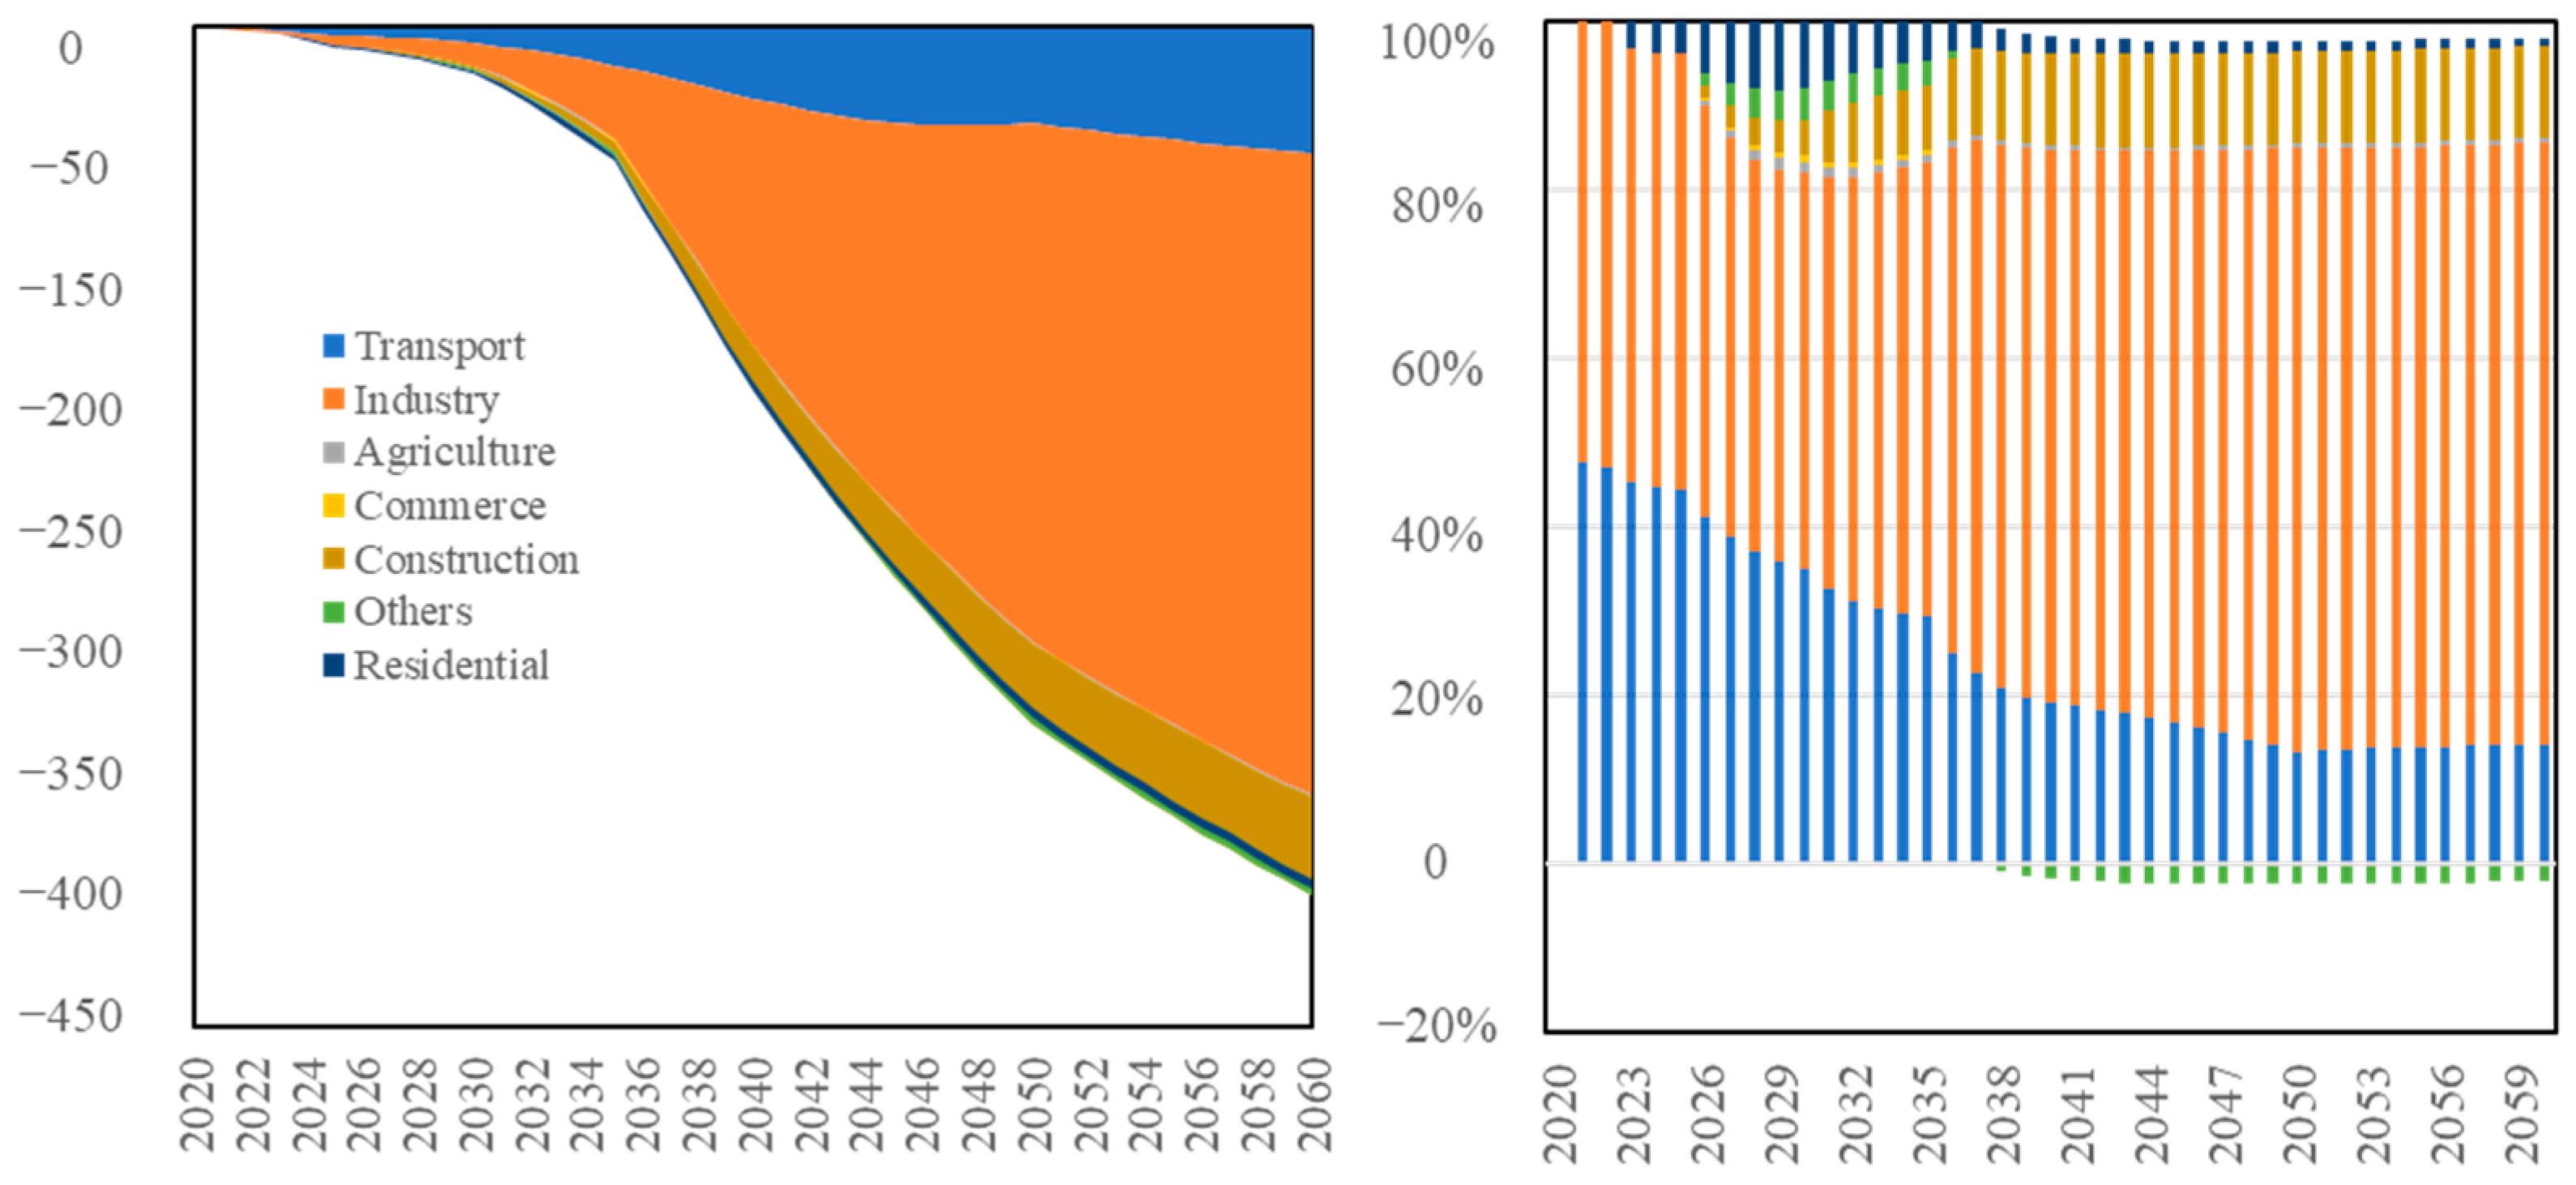
4.4. Impacts of the Carbon Peaking Policy on Petroleum Products Demand
4.5. Impacts of Carbon Neutral Policy on Petroleum Products Demand
5. Conclusions, Policy Recommendations, and Future Work
Author Contributions
Funding
Data Availability Statement
Conflicts of Interest
Abbreviations
| LMDI | Logarithmic Mean Divisia Index |
| LEAP | A Long-range Energy Alternatives Planning system |
| LEAP-PPC | The LEAP-Petroleum Products of China model |
| ICEVs | Conventional internal combustion engine vehicles |
| PP | Petroleum Products |
| AL | Activity level data |
| EI | Energy consumption intensity |
References
- National Bureau of Statistics. Statistical Bulletin of Year 2020 on National Economic and Social Development. 2021. Available online: http://www.gov.cn/xinwen/2021-02/28/content_5589283.htm (accessed on 28 February 2021).
- Ren, X.; Li, Y.; Qi, Y.; Duan, K. Asymmetric effects of decomposed oil-price shocks on the EU carbon market dynamics. Energy 2022, 254, 124172. [Google Scholar] [CrossRef]
- Dutta, A. Modeling and forecasting the volatility of carbon emission market: The role of outliers, time-varying jumps and oil price risk. J. Clean. Prod. 2018, 172, 2773–2781. [Google Scholar] [CrossRef]
- Li, G.; Niu, M.; Xiao, J.; Wu, J.; Li, J. The rebound effect of decarbonization in China’s power sector under the carbon trading scheme. Energy Policy 2023, 177, 113543. [Google Scholar] [CrossRef]
- National Bureau of Statistics. China Energy Statistical Yearbook 2021; China Statistics Press: Beijing, China, 2022. [Google Scholar]
- The State Council. Carbon Peaking Action Plan by 2030. 2021. Available online: http://www.gov.cn/xinwen/2021-10/26/content_5645001.htm (accessed on 26 October 2021).
- GB 31570-2015; Emission Standard of Pollutants for Petroleum Refining Industry. Ministry of Ecology and Environment of China: Beijing, China, 2015. Available online: https://www.mee.gov.cn/ywgz/fgbz/bz/bzwb/dqhjbh/dqgdwrywrwpfbz/201505/t20150505_300609.shtml (accessed on 1 July 2015).
- GB 31571-2015; Emission Standard of Pollutants for Petroleum Chemistry Industry. Ministry of Ecology and Environment of China: Beijing, China, 2015. Available online: https://www.mee.gov.cn/ywgz/fgbz/bz/bzwb/dqhjbh/dqgdwrywrwpfbz/201505/t20150505_300663.shtml (accessed on 1 July 2015).
- China Petroleum and Chemical Industry Federation. Declaration on Carbon Peaking and Carbon Neutrality in China’s Petroleum and Chemical Industry. 2021. Available online: https://news.bjx.com.cn/html/20210202/1133882.shtml (accessed on 15 January 2021).
- Liu, J.G.; Zhu, Y.Z.; Ji, S.Y. The path choice of “de-oiling” in China’s transportation industry under the double carbon target. China Econ. Trade Her. 2021, 17, 38–40. [Google Scholar]
- Sun, Y.; Lin, Z.S.; Guan, W.H. Dynamic prediction and suggestion of supply and demand of total petroleum in China. J. Nanjing Norm. Univ. (Nat. Sci.) 2006, 29, 120–123. [Google Scholar]
- Xu, G.; Wang, W.G. Portfolio Forecast of China’s Oil Consumption. HLJ Foreign Econ. Relat. Trade 2009, 10, 72–74+134. [Google Scholar]
- Shi, Y.L.; An, H.Z.; Gao, X.Y. China’s petroleum consumption prediction based on Time-Neural network model. Resourcesindustries 2011, 13, 37–42. [Google Scholar]
- Chi, L. The Prediction of Beijing Passenger Traffic Energy Demand and Pollutants Emission in Future Based on LEAP Model. Ph.D. Thesis, Beijing Jiaotong University, Beijing, China, 2014. [Google Scholar]
- Change, Z.; Pan, K.X. An analysis of Shanghai’s long- term energy consumption and carbon emission based on LEAP model. Contemp. Financ. Econ. 2014, 01, 98–106. [Google Scholar]
- Jiao, J.L.; Han, X.F.; Li, L.L.; Zhu, J.H. Prediction of China Oil Demand with the Constraints of CO2 Abatement. J. Beijing Inst. Technol. (Soc. Sci. Ed.) 2015, 17, 48–52. [Google Scholar]
- The Research Institute of Economics and Technology of China Petroleum & Chemical Corporation. China oil consumption scenario analysis (2015–2050). 2019. Available online: http://www.nrdc.cn/Public/uploads/2019-10-12/5da14e2722d50.pdf (accessed on 1 September 2019).
- Poudyal, R.; Loskot, P.; Nepal, R.; Parajuli, R.; Khadka, S.K. Mitigating the current energy crisis in Nepal with renewable energy sources. Renew. Sustain. Energy Rev. 2019, 116, 109388. [Google Scholar] [CrossRef]
- Gao, J.L.; Jiang, K.J.; Liu, J.; Xu, X.Y. Scenarios analysis of the coal demand in China based on LEAP model. China Coal 2017, 43, 23–27. [Google Scholar]
- Zhang, D.Y.; Liu, G.Y.; Chen, C.C.; Zhang, Y.; Hao, Y.; Casazza, M. Medium-to-long-term coupled strategies for energy efficiency and greenhouse gas emissions reduction in Beijing (China). Energy Policy 2019, 127, 350–360. [Google Scholar] [CrossRef]
- Nasir, R.; Ahmad, S.R.; Shahid, M. Emission reduction energy model of Punjab: A case study. J. Clean. Prod. 2021, 329, 129755. [Google Scholar] [CrossRef]
- Dong, J.; Li, C.B.; Wang, Q.Q. Decomposition of carbon emission and its decoupling analysis and prediction with economic development: A case study of industrial sectors in Henan Province. J. Clean. Prod. 2021, 321, 129019. [Google Scholar] [CrossRef]
- Ang, B.W. LMDI decomposition approach: A guide for implementation. Energy Policy 2015, 86, 233–238. [Google Scholar] [CrossRef]
- Zheng, Y.; Xu, K.N. Study of the Driving Factors for Changing Energy Intensity Trend in China—Based on the LMDI Decomposition Analysis. Econ. Manag. 2012, 34, 11–21. [Google Scholar]
- Cui, M.X. Research on temporal and spatial evolution of carbon intensity in China’s petroleum & chemical industry. Ph.D. Thesis, Northeast Petroleum University, Daqing, China, 2020. [Google Scholar]
- Alajmi, R.G. Factors that impact greenhouse gas emissions in Saudi Arabia: Decomposition analysis using LMDI. Energy Policy 2021, 156, 112454. [Google Scholar] [CrossRef]
- Xie, P.J.; Gao, S.S.; Sun, F.H. An analysis of the decoupling relationship between CO2 emission in power industry and GDP in China based on LMDI method. J. Clean. Prod. 2019, 211, 598–606. [Google Scholar] [CrossRef]
- Heaps, C. Energy Planning and Policy Analysis—LEAP. 2008. Available online: https://www.sei.org/publications/energy-planning-policy-analysis-leap/ (accessed on 17 August 2009).
- Ang, B.W. The LMDI approach to decomposition analysis: A practical guide. Energy Policy 2005, 33, 867–871. [Google Scholar] [CrossRef]
- Wang, C.C. Forecast of Fujian Energy Demand and CO2 Emission Based on the Index Decomposition and LEAP Model. Master’s Thesis, Nanjing University, Nanjing, China, 2019. [Google Scholar]
- Chen, J.; Wang, P.; Cui, L.; Huang, S.; Song, M. Decomposition and decoupling analysis of CO2 emissions in OECD. Appl. Energy 2018, 231, 937–950. [Google Scholar] [CrossRef]
- Zhang, W.; Wang, N. Decomposition of energy intensity in Chinese industries using an extended LMDI method of production element endowment. Energy 2021, 221, 119846. [Google Scholar] [CrossRef]
- Jiang, S.; Zhu, Y.; He, G.; Wang, Q.; Lu, Y. Factors influencing China’s non-residential power consumption: Estimation using the Kaya–LMDI methods. Energy 2020, 201, 117719. [Google Scholar] [CrossRef]
- The State Council. Government Work Report. 2022. Available online: http://www.gov.cn/gongbao/content/2022/content_5679681.htm (accessed on 3 March 2022).
- International Monetary Fund. Word Economic Outlook Report. 2022. Available online: https://www.imf.org/en/Publications/WEO/Issues/2022/10/11/world-economic-outlook-october-2022 (accessed on 1 October 2022).
- World Bank. Global Economic Prospects. 2023. Available online: https://www.worldbank.org/en/publication/global-economic-prospects#outlook (accessed on 1 January 2023).
- United Nations, Department of Economic and Social Affairs, Population Division. World Population Prospects 2022 [OL]. 2022. Available online: https://population.un.org/wpp/Download/Standard/MostUsed/ (accessed on 1 December 2022).
- The State Council. Notice of the State Council on Printing and Distributing the “Fourteenth Five-Year Plan” Comprehensive Work Plan for Energy Conservation and Emission Reduction. 2021. Available online: http://www.gov.cn/zhengce/content/2022-01/24/content_5670202.htm (accessed on 28 December 2021).
- Ministry of Industry and Information Technology, National Development and Reform Commission &Ministry of Ecology and Environment. Implementation Plan for Carbon Peaking in Industry. 2022. Available online: http://www.gov.cn/gongbao/content/2022/content_5717004.htm (accessed on 7 July 2022).
- National Bureau of Statistics. China Statistical Yearbook 2021; China Statistics Press: Beijing, China, 2022. [Google Scholar]
- National Bureau of Statistics. Statistical Bulletin of Year 2021 on National Economic and Social Development. 2022. Available online: http://www.gov.cn/xinwen/2022-02/28/content_5676015.htm (accessed on 28 February 2022).
- National Bureau of Statistics. Preliminary GDP Accounting Results for the Fourth Quarter and the Whole Year of 2022. 2023. Available online: http://www.gov.cn/xinwen/2023-01/18/content_5737710.htm (accessed on 18 January 2023).
- The Party Central Committee, the 19th Congress Report—To Build a Moderately Prosperous Society and Win the Great Victory of Socialism with Chinese Characteristics in the New Era. 2017. Available online: http://www.gov.cn/zhuanti/2017-10/27/content_5234876.htm (accessed on 18 October 2017).
- The State Council. Outline of the Fourteenth Five-Year Plan of the National Economic and Social Development of the People’s Republic of China and the Vision 2035. 2021. Available online: https://www.ndrc.gov.cn/fggz/fzzlgh/gjfzgh/202103/t20210323_1270102.html (accessed on 23 March 2021).
- The State Council. National New Urbanization Plan (2014–2020). 2014. Available online: http://www.gov.cn/zhengce/2014-03/16/content_2640075.htm (accessed on 16 March 2014).
- IEA. An Energy Sector Roadmap to Carbon Neutrality in China; IEA: Paris, France, 2021; Available online: https://www.iea.org/reports/an-energy-sector-roadmap-to-carbon-neutrality-in-china (accessed on 1 September 2021).


| Time | Regions | Time | Schedule of Vehicle Enterprises |
|---|---|---|---|
| 2024 | Rome, Italy | 2025 | Honda plans to increase the proportion of new energy vehicles in the European market to two-thirds by 2025 |
| 2025 | Norway, Mexico, Greece Athens, Spain Madrid, France Paris | BAIC Group proposed that by 2025, its own brands will completely stop selling conventional ICEVs in China | |
| 2029 | California, USA | ||
| 2030 | China Hainan, Netherlands, Britain, India, Israel, Japan Tokyo | Chang’an Automobile proposes to stop selling conventional ICEVs in 2025 | |
| 2035 | Canada, Japan, European Union | 2030 | Volkswagen plans to electrify all cars by 2030, and the sales of conventional ICEVs will be completely stopped |
| 2040 | Spain |
| Key Factors/Sectors | Baseline Scenario | The Carbon Peaking Policy Scenario (Policy already in Place) | The Carbon Neutral Policy Scenario (Policy Enhancement) | ||
|---|---|---|---|---|---|
| Sub-scenario 1: Activity Level | Sub-Scenario 2: Energy Intensity | Sub-Scenario 3: Integrated Policy | |||
| Petroleum Products-Related Industries all Maintain the Development Level in 2020 | Policy Effects of GDP and Industrial Structure Optimization | Policy Effects of Industrial Energy Intensity Reduction | Combined Effects of “Activity Level + Energy Intensity” Policy | Further Tightening and Upgrading of Existing Carbon Peaking Policies. | |
| Economy | GDP growth rate is maintained at 2.3% in 2020, 8.4% in 2021, and 3% in 2022. | ||||
| Annual growth rate of GDP: 5.5% in 2022–2035 and 4.5% after 2035. The industrial structure is maintained at the 2020 level. | Annual growth rate of GDP: 5% in 2022–2035 and 4% after 2035. Industrial structure optimization: by 2035, the tertiary sector will account for 60%. | Same as the Baseline scenario | Same as the Sub-scenario 1 | Annual growth rate of GDP: 5% in 2025–2035, slowing down to 4% after 2035 Continuous optimization of industrial structure, with the tertiary sector accounting for 60% in 2035 and 75% in 2050. | |
| Population | According to the UN medium variant: a peak of 1425.9 million in 2022, 1416.8 million in 2030, and 1211.0 million in 2060. | According to the UN low variant: it reaches a peak of 1425.9 million in 2022 and 1396.2 million in 2030, and 1080.6 million in 2060. | |||
| By the end of 2020, the urbanization rate is 63.89% | According to the National New Urbanization Plan (2014–2020), it is expected to reach 66% in 2030, enter a period of stable urbanization development after 2040, and have an urbanization rate of 75% in 2050 | ||||
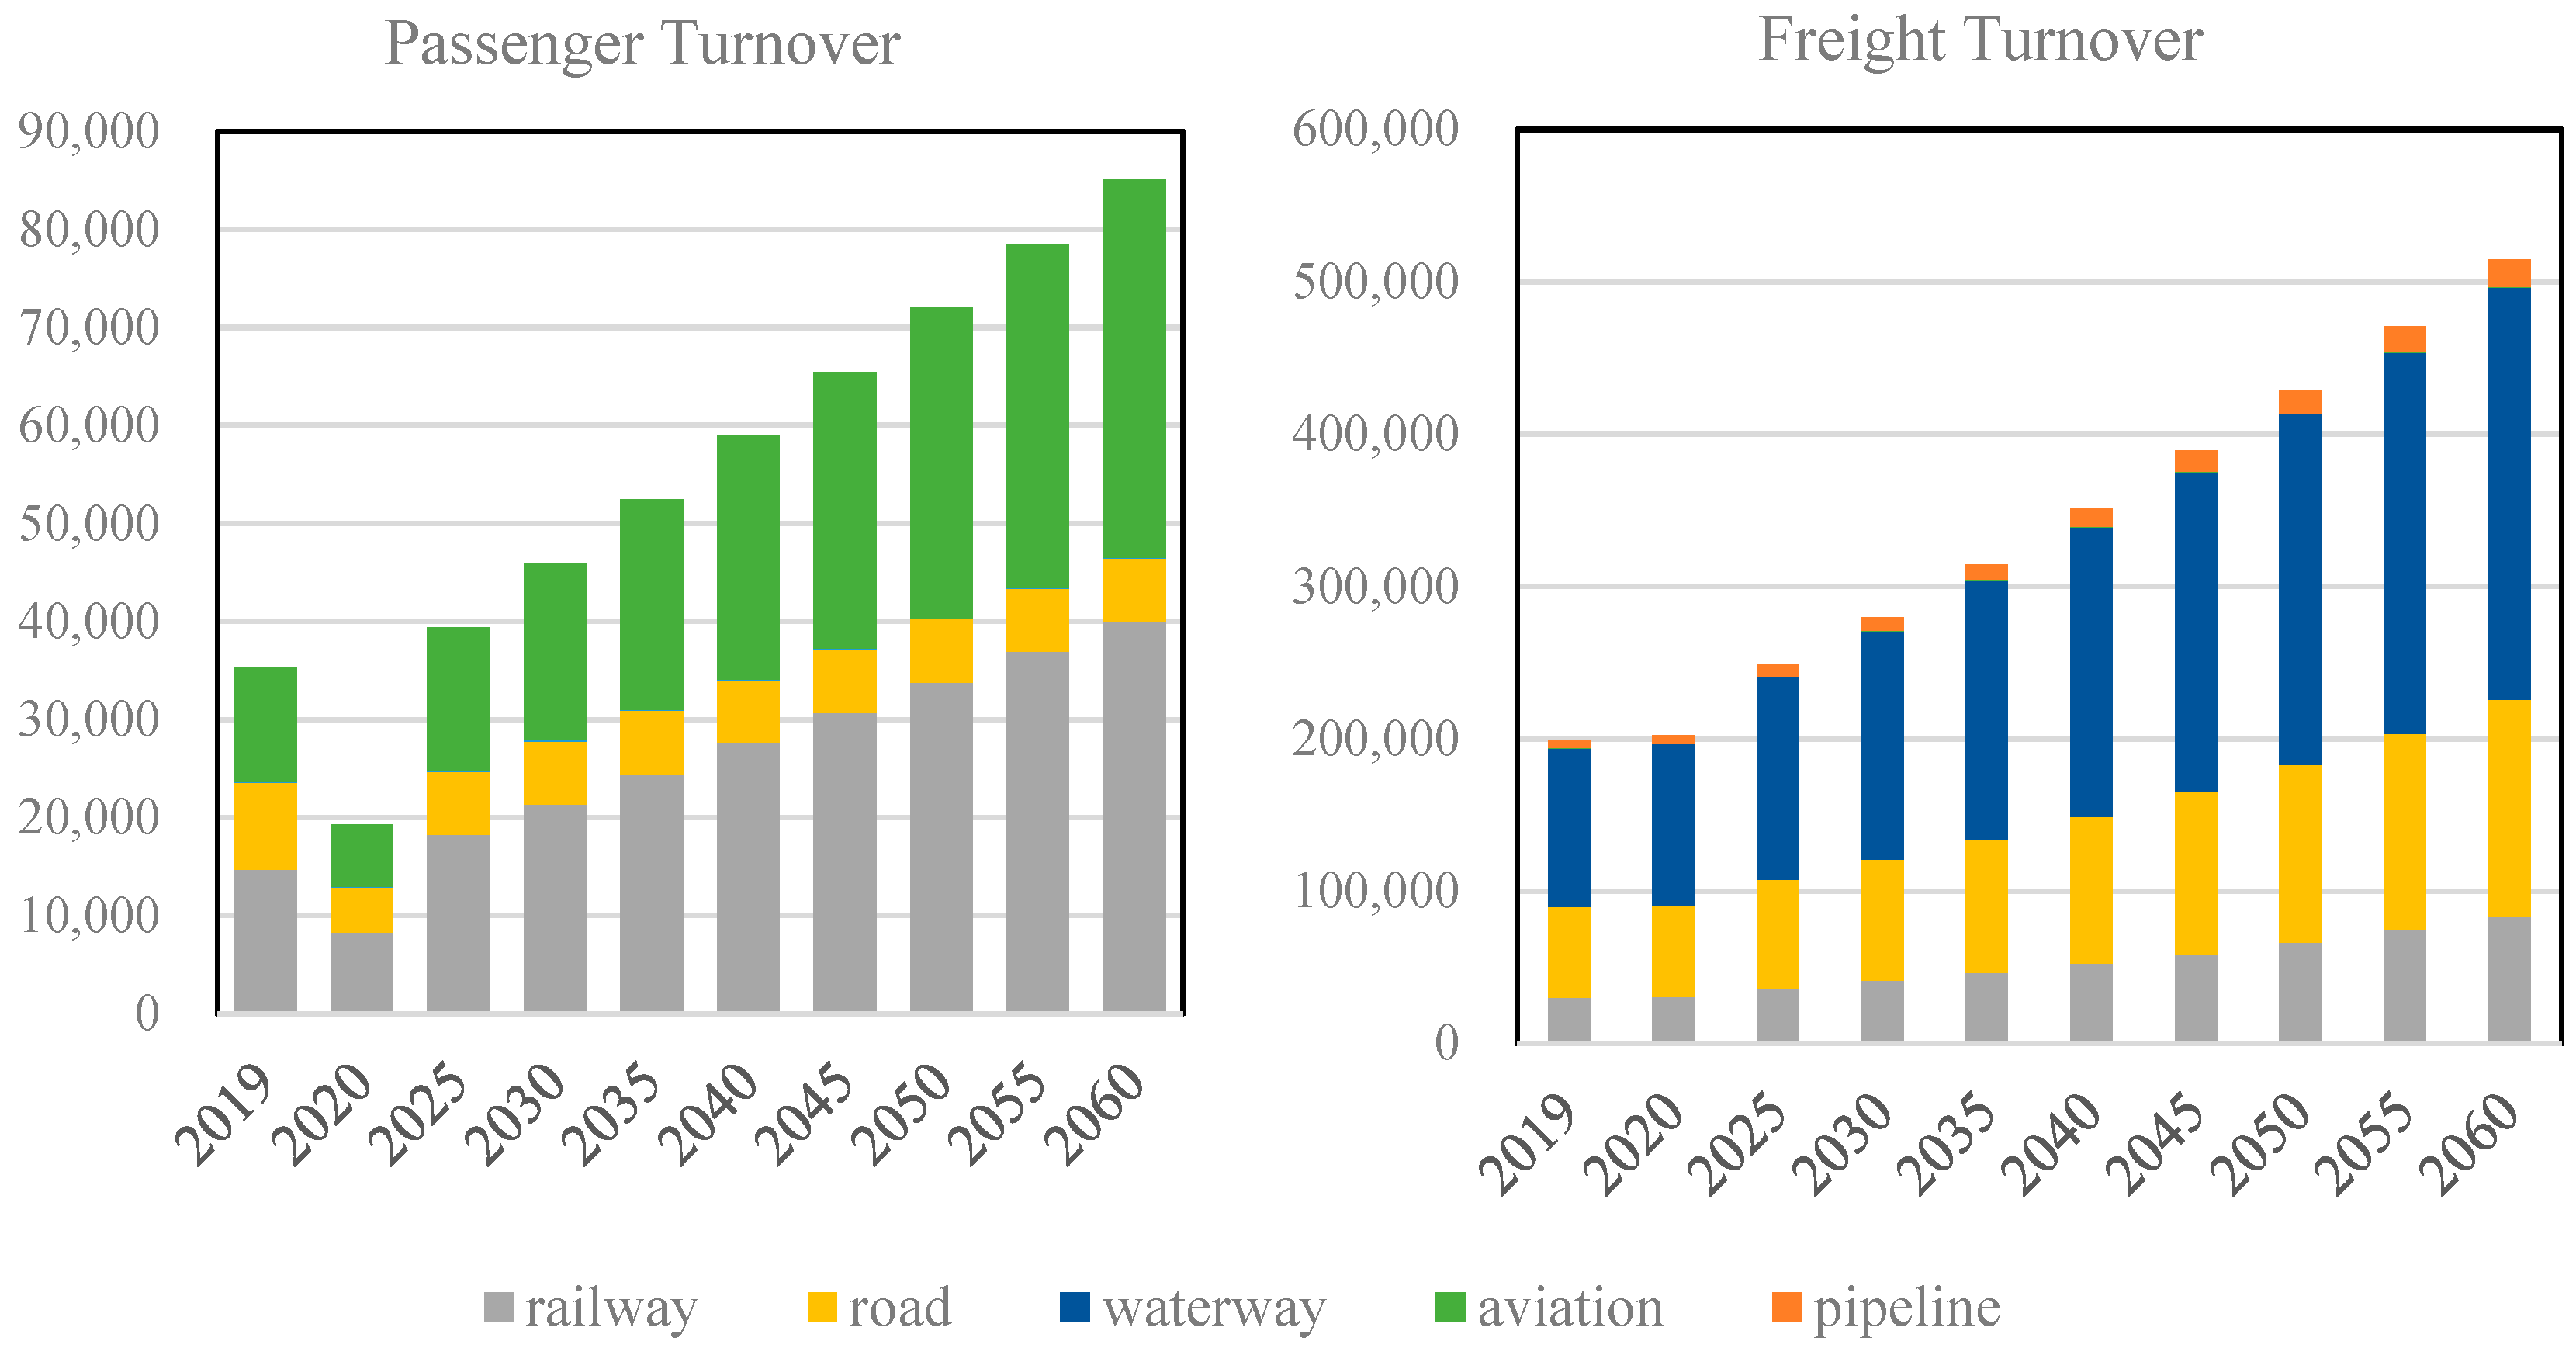
| Transportation sector | The transport demand continues to grow. In 2060, passenger turnover will be 8,503,924 million passenger-kilometers; the freight turnover will be 514,902 billion-ton kilometers. | ||||
| Traffic structure and energy intensity are maintained at the 2020 level. The passenger turnover is 1925.15 billion passenger-kilometers at the end of 2020, of which railways, roads, waterways, and aviation account for 42.94%, 24.11%, 0.17%, and 32.78%, respectively. The freight turnover is 20,221.1 billion ton-kilometers at the end of 2020, of which railways, roads, waterways, aviation, and pipeline account for 15.09%, 29.76%, 52.34%, 0.12%, and 2.7%, respectively. | Comprehensively promote green and low-carbon transformation, and deeply promote the restructuring of transportation. Gradually build a medium- and long-distance freight transport system, and the proportion of railways and waterways will increase significantly. Energy intensity is maintained at 2020 level. | Optimize the energy structure of vehicles. Railways: full electrification in 2035. Roads: vigorously promote the transformation of motor vehicle fuels from oil to electricity, with the new energy vehicle ratio to be 40% in 2030. Waterways: increase the application of new energy-saving technologies and optimize the energy efficiency of ships. Aviation: biofuels will account for 2% in 2025 and 63% in 2050. The traffic structure is maintained at the 2020 level. | Optimize the traffic structure and energy structure of vehicles. The specific parameters are the same as in Sub-scenario 1 and Sub-scenario 2. | Further deep optimization of traffic structure and non-fossil fuel substitution of vehicles. Especially after 2030, the policy is further strengthened and the intensity of energy consumption improvement in transportation is higher than that in other sectors. The energy consumption intensity will decrease by 15% in 2025, 30% in 2030, and further increase in 2040 when the sale of fossil fuel cars is completely banned. | |
| Industrial Sector | The industrial structure (30.8% of GDP) and energy intensity are maintained at 2020 levels. | Continuous optimization of industrial structure, with the goal of basic modernization in 2035, and the tertiary sector will reach the benchmark level of developed countries, i.e., 60%. Energy consumption intensity is maintained at the 2020 level. | The efficiency of energy and resource utilization will be significantly improved, by 2025, the energy consumption per GDP of industry above the scale will drop by 13.5% compared to 2020. During the “15th Five-Year Plan” period, the carbon-neutral capacity will be strengthened on the basis of achieving the carbon peak in the industrial sectors. The industrial structure is maintained at the 2020 level. | Continuous optimization of industrial structure. Energy intensity decreases by 13.5% by 2025, and maintains the decline rate after 2025. The specific parameters are the same as in Sub-scenario 1 and Sub-scenario 2. | Further optimization of the industrial structure, with the share of tertiary sector reaching the average level of developed countries, i.e., 75%, by 2050. The energy intensity of the industrial sector further decreases on the basis of the carbon peaking policy. In particular, the manufacturing has a higher reduction in energy intensity than other industries. |
| Other sectors (residential, construction, agricultural, commercial, and other consumer sectors) | Population/industry structure and energy intensity are maintained at 2020 levels | Optimize industrial structure. Energy intensity is maintained at the 2020 level | With a 13.5% reduction in energy intensity by 2025, and maintain the decline rate after 2025. | Optimize industrial structure and energy intensity. The specific parameters are the same as in Sub-scenario 1 and Sub-scenario 2. | With the gradual improvement of the new power system and the continuous progress of technology, the energy consumption intensity of other sectors will be optimized, of which construction will decrease more strongly than other sectors. |
Disclaimer/Publisher’s Note: The statements, opinions and data contained in all publications are solely those of the individual author(s) and contributor(s) and not of MDPI and/or the editor(s). MDPI and/or the editor(s) disclaim responsibility for any injury to people or property resulting from any ideas, methods, instructions or products referred to in the content. |
© 2023 by the authors. Licensee MDPI, Basel, Switzerland. This article is an open access article distributed under the terms and conditions of the Creative Commons Attribution (CC BY) license (https://creativecommons.org/licenses/by/4.0/).
Share and Cite
Shang, L.; Shen, Q.; Song, X.; Yu, W.; Sun, N.; Wei, W. Impacts Analysis of Dual Carbon Target on the Medium- and Long-Term Petroleum Products Demand in China. Energies 2023, 16, 3584. https://doi.org/10.3390/en16083584
Shang L, Shen Q, Song X, Yu W, Sun N, Wei W. Impacts Analysis of Dual Carbon Target on the Medium- and Long-Term Petroleum Products Demand in China. Energies. 2023; 16(8):3584. https://doi.org/10.3390/en16083584
Chicago/Turabian StyleShang, Li, Qun Shen, Xuehang Song, Weisheng Yu, Nannan Sun, and Wei Wei. 2023. "Impacts Analysis of Dual Carbon Target on the Medium- and Long-Term Petroleum Products Demand in China" Energies 16, no. 8: 3584. https://doi.org/10.3390/en16083584