Article

Precipitation of Barium Sulphate during the Waterflooding Process in Polish Offshore Oilfields—Case Analysis

by
Michał Gruszka
1,2,* and
Stanisław Nagy
2
1
LOTOS Petrobaltic, 80-758 Gdańsk, Poland
2
Department of Gas Engineering, Faculty of Drilling, Oil, and Gas, AGH University of Science and Technology, 30-059 Kraków, Poland
*
Author to whom correspondence should be addressed.
Energies 2023, 16(8), 3345; https://doi.org/10.3390/en16083345
Submission received: 16 February 2023 / Revised: 18 March 2023 / Accepted: 5 April 2023 / Published: 10 April 2023
(This article belongs to the Special Issue Advances in Natural Gas Engineering II)

Abstract

:
The fundamentals of scaling during waterflooding of an oilfield are presented. Mineral precipitation is described using both the kinetics approach, with the corresponding equations given, and the thermodynamic models’ theoretical foundation discussed—mainly specific ion interaction and Pitzer models. This paper focuses on the process of mixing incompatible waters during both water injection and production from an oilfield, as this was identified as a primary reason for barium sulphate precipitation. Two methods of minimizing the risk of solid phase deposition during the mixing of water using the addition of inhibitors and removal of sulfur compounds through a membrane system before water injection into the bed are shown. In addition, formation damage to the near-well zone is discussed with its implications for field operators. Using thermodynamics, especially equations based on the HKF-SRK modified model, this paper describes typical conditions for barium sulphate precipitation during hydrocarbon production on a Polish offshore oilfield. The case study is presented using scaling tendency (ST) and solid concentration values to distinguish the most vulnerable places of solid deposition, both topside and subsurface. The importance of avoiding the mixing of incompatible waters is documented and shown in comparison to a non-mixing scenario.

1. Introduction

The classic oil production process may usually be divided into two or three stages. The first stage involves using energy accumulated in the reservoir (primary recovery) to promote the flow of crude oil from the reservoir to the surface. This stage usually occurs through natural oil flow (gas lift) or submersible pumps. The second stage of oil recovery is carried out immediately after the end of the first and consists in supplying energy to the reservoir by injecting water into the formation (secondary recovery). The secondary recovery process involves injecting water—usually below the water–oil contour—to raise the reservoir pressure to a value above the saturation point pressure. Sometimes the third stage of the exploitation process is distinguished—the so-called enhanced oil recovery—by injecting CO2, polymers, gas, etc. (sometimes called tertiary recovery). Injection well placement strategies vary widely and depend primarily on the shape of the bed, the presence of sealing faults, and the method chosen to drill production wells [1].
Figure 1 and Figure 2 show how a different approach may be required to select a producer–injector drilling pattern. The B3 and B8 oilfields are located within 30 km of each other in the same reservoir rock, yet the drilling strategy had to be completely different. It is due to the different shapes of the oil-bearing layers and various structural faults which strongly influence how the hydrocarbons are trapped in the reservoir.
Waterflooding is a complex solution for several hydrodynamic and thermodynamic processes in the wellbores and reservoirs. One of the most vital dangers for oil and gas companies is mixing incompatible waters. Waters are deemed incompatible when they cannot mix without making reactions leading to the precipitation of solids. It is often the case when there is a need to boost reservoir pressure, but the amount of formation water produced needs to be higher [2]. This paper, with its case study presented, is aimed at highlighting the importance of well-planned waterflooding and the implications it may cause, especially formation damage resulting in revenue loss.

2. Results

2.1. Fundamentals of Barite Scaling

It is common for inorganic salts to precipitate, migrate, and deposit during oil and gas production due to the presence of highly mineralized waters. Three main drives of this phenomenon can be distinguished that lead to the development of scale in petroleum formations [3]:
  • Self-scaling out of the formation water, subject to changes in pressure/temperature.
  • Mixing of formation and sea waters because of waterflooding.
  • Evaporation of solvent.
In the first case mentioned above, calcium carbonate (CaCO3) is the usual product. It is formed when, during production, the effluent is moving upwards, and the pressure drops. Furthermore, it can precipitate on surface facilities when there is a high enough temperature increase (e.g., heat exchangers, steam traps, boilers).
Collins [2] listed the most common scales that can precipitate from typical formation and seawater and the reactions leading to them:
CaCl2 + Na2SO4 →  2NaCl +CaSO4
CaCl2 + MgSO4  →  MgCl2 + CaSO4
Ca (HCO3)2     →  CO2 + H2O + CaCO3
CaCl2 + 2NaHCO3  →  2NaCl + CO2 + H2O + CaCO3
SrCl2 + NaSO4    →  2NaCl + SrSO4
SrCl2 + MgSO4   →  MgCl2 + SrSO4
BaCl2 + NaSO4   →  2NaCl + BaSO4
BaCl2 + MgSO4  →  MgCl2 + BaSO4
Fe + H2S        →  H2 + FeS ↓
Fe2O3 + 6H2S     →  6H2O + 2Fe2S3
Barium sulphate (barite, BaSO4) scaling occurs when the pressure/temperature conditions are favourable, in the presence of barium cations, found in formation brines, and sulphate anions, common in seawater that is often injected into a reservoir to maintain a stable pressure regime. Thus, the two incompatible waters must mix for the barite to precipitate.
The pictures below show examples of barium sulphate scale deposited on production facilities and later cleaned of any residual hydrocarbons in the laboratory (Figure 3). SEM pictures of barite crystals in a rock matrix can be found in the literature [4].
Bader [5] created a list of significant components and places in a general hydrocarbon production facility where barite can form:
  • Tanks upstream of injection pumps, where waters could mix;
  • Injection wells when seawater contacts formation fluids;
  • In formation, when formation fluids are being pushed out of pore space by injected water;
  • In formation, when mixed incompatible waters are in proximity of a production well;
  • In formation, when mixed incompatible waters enter the well;
  • Where flows from two or more zones join in tubing, if those zones produce brines of different compositions;
  • Production manifold, where fluids from multiple wells join;
  • Surface facilities during the separation of hydrocarbons;
  • In disposal wells.
Barium sulphate scaling is a considerable challenge in oil and gas production due to its negligible solubility in water—1.04 × 10⁻⁵ mol/L at 25 °C [6]. It is also nearly impervious to most conventional solvents. Close to the wellbore, where the pressure regime changes more rapidly, its deposition can lower reservoir rock permeability and productivity significantly. Moreover, when barium sulphate and strontium sulphate form, it very often leads to simultaneous deposition of, naturally existing in the Earth’s crust, radium, in the form of radium sulphate [7]. It is an additional challenge for oil and gas companies, endangering their employees and increasing the upkeep costs for all installations due to the necessity of testing the scales in the laboratory to determine the level of radiation and eventually safely disposing of the scale.

2.2. Kinetics of Precipitation of Solid Minerals

For any inorganic salt to precipitate out of its solution, the concentration should be higher than the specific compound’s solubility in the given conditions. This is usually represented by the saturation index [8], which is
S I = l o g 10 S R
where SR is the saturation ratio defined by
S R = I A P / K s p
IAP is the ion activity product, which describes the deviation from thermodynamic equilibrium by introducing the actual activity coefficients of species in solution. Ksp is an equilibrium constant of a reaction for a given salt, e.g.,
a A ( s ) b B ( a q ) + d D ( a q )
K s p = ( a B ) b ( a D ) d
where A is an activity coefficient. Ksp could also be defined as
ln K = Δ G o / R T
The above equations do not consider the kinetics of a reaction, meaning the growth of crystals and ion–ion interactions. From a thermodynamic point of view, SI/SR indicates:
  • SR < 1/SI < 0—tendency towards dissolution;
  • SR = 1/SI = 0—equilibrium, the chemical reaction stopped;
  • SR > 1/S > 0—tendency towards precipitation.
In a solution that has reached a state of supersaturation, the first short period of phase reaction is called an induction time [9]. It is the amount of time needed to form critical nuclei and grow to a detectable size (usually a few micrometers).
After supersaturation and induction time end, the nucleation begins. It is called primary nucleation if it happens without any other nuclei, in contrast to secondary nucleation [10]. Furthermore, primary nucleation could occur as homogenous or heterogeneous.
Homogenous nucleation requires a more significant amount of free energy, meaning that the ion concentration should be significantly higher than the solubility of a product. It is its primary drive mechanism, which happens without foreign particles, surfaces, or nuclei [11]. This type of nucleation is rarely happening; even in laboratory conditions, it is difficult to achieve it [12].
In oil and gas formations, heterogenous nucleation occurs more frequently, resulting from the presence of many impurities in formation waters (known as TSS—total suspended solids) and rugged surfaces that lower the energy required for the reaction to commence [13]. It stems from the fact that the moving ions in a solution, at some point, come across those surfaces (e.g., porous rock). Particles adsorb to the surface, and using two-dimensional diffusion, they form compounds by ionic bonds and later join into the crystal lattice, resulting in zones of crystal growth.
Nancollas and Purdie [12] conducted a series of tests, during which to a solution already supersaturated with Ba2+ and SO42−, they kept adding seeded barite crystals in regular time intervals. The speed of an ongoing reaction was measured conductometrically. The results proved that after the initial rapid growth phase, which represents approx. 1–25% of the whole reaction time, there was a more stable second phase, described by
d m d t = k s ( m m 0 ) 2
where m—barite concentration in time t, m0—concentration in thermodynamic equilibrium, k—rate of crystallisation, and s—linear function describing the rate of seed crystals addition for a unit volume.
The initial growth phase could also be calculated using the above equation, assuming the supersaturation would not be high. It is important to notice that the kinetics of the crystallisation process do not depend on flow dynamics—that is, flow rates and injection rates in oil and gas production.
A fundamental requirement for a process of precipitation to occur is a specific value of the solubility product in given conditions, which determines the direction of a chemical reaction. Nancollas and Liu [13] emphasize that other factors, such as the total number of ions dissolved or the number of neutral species in solution, play an essential part in how precipitation occurs and, thus, the final shape or size of the crystals formed.

2.3. Selected Thermodynamic Models of Precipitation Processes

One of the first equations that allowed us to estimate, with limited certainty, go, which represents the deviation from an ideal solution, was published by Debye and Huckel in 1923 [14]. It was a very simplified model, which was proven to correlate with experimental data only for low concentrations and solutions with symmetrical species with charge numbers of either −1 or +1 (e.g., Na+, Cl). The authors also assumed a complete dissociation of all species and did not consider the ion–solvent interaction.
Davies [15] attempted to improve the model by adding an empirical extension, making it possible to account for higher concentrations. However, his work still did not make it possible to calculate activity coefficients in solutions with ions of higher charges.
The SIT (specific ion interaction) theory, initially proposed by Bronsted [16] and Guggenheim and Turgeon [17], is the first of the two widely used tools that allow determining the ion activity coefficients in solutions with far greater concentrations compared to the Debye and Huckel model. The theory clarifies previous equations based on molal concentration and interaction coefficients. Their values should be established for every pair of ions that interact with each other. It is possible by having solutions with only those species that need to have the interaction coefficient found. The SIT theory can be successfully used for 8–10 mol/kg molalities. Above the upper value, discrepancies between experimental and theoretical results are found. This is probably due to additional forces that alter species’ behaviour when there are many ions close to each other in highly concentrated solutes [18].
Kenneth Pitzer [19] created theoretical and experimental equations that describe not only the ion–ion interactions but also the influence of solvent on each ion. The Pitzer parameters allow for the calculation of the mixed ion activity coefficients with more accuracy than SIT theory; however, they are much more challenging to determine than SIT parameters [20].
The comparison between the accuracy of activity coefficients’ determination of both SIT and Pitzer theories was performed by Elizalde and Aparicio [21]. The results were presented using a kw (ionic product of water) value for LiCl, NaCl, and KCl electrolytes vs. molality. They proved that the Debye and Huckel, SIT, and Pitzer models are all valid for very low concentrations. For higher molalities, the Pitzer equations tend to be the most reliable.

2.4. Mixing of Incompatible Waters during Waterflooding

Water injection into the existing aquifer, as one of the most widespread secondary recovery methods, is vital in water-driven reservoirs to slow down a pressure decrease for the field to remain economically viable. What happens quite often is that the expected pressure decline is observed early in the lifetime of the field, when there is almost no water cut (meaning the formation water has not reached the producers yet). This situation causes offshore companies to rely upon seawater injection. Unfortunately, it drastically increases the risk of precipitation of sparingly soluble salts due to the incompatibility of waters.
Sea water and formation brine are often called incompatible, as they disturb the equilibrium in source rock by introducing ionic species to the mixture that easily attract each other, such as cations Ba2+ and Ca2+ (mostly in formation waters), and anions SO42− and CO32− (typically high concentrations in sea waters) [22]. On the contrary, waters that mix without starting any chemical reaction between their dissolved species are compatible [2].
There are proven methods of minimalizing the risk of scale deposition due to the mixing of incompatible waters, such as:
  • Scale inhibitor addition to injected water [23,24];
  • Sulphate removal from seawater prior to injection using specifically designed membrane facilities [25].
Other factors determine if the scale would form, apart from the sole co-existence of cations and anions able to form a compound. Composition of the source rock, in which the fluids mix, could influence the composition of the whole mixture and therefore change the thermodynamic equilibrium of the reaction [26]. Finally, water composition is usually complex, and simultaneous precipitation could occur, influencing the activity coefficient values, especially for species that can precipitate as several different compounds, e.g., barium sulphate and calcium sulphate [27].
The adverse effects of mixing incompatible waters can be used to advantage in other stages of hydrocarbon field development. For instance, when drilling through a highly permeable zone with a significant risk of losing large amounts of mud, the scaling effect could be used to avoid it. During production, when dealing with a multi-zone reservoir with heavily flooded lower layers, a properly planned and executed intervention using incompatible waters could be an economically beneficial option, an alternative for bridge plugs or using very expensive polymers [28].

2.5. Formation Damage of the Near-Well Zone

The main consequence of the precipitation of barium sulphate (and other sparingly soluble salts) is porosity and permeability reduction. The damage may not even be noticed when it occurs far from the producers and injectors. However, in most cases, the thermodynamic equilibrium is disturbed near the wellbore, and inside lower completion, due to the following:
  • Zones with high horizontal permeability resulting in injected water reaching the wellbore quicker than predicted, thus mixing with formation fluids in lower completion.
  • Natural pressure drops near the wellbore, which is more rapid than further in the reservoir, decreases the solubility of most inorganic salts.
Crystals formed during the precipitation of barium sulphate could damage the permeability in a few different ways [29]:
  • Crystals deposit on the pores’ surface because of attractive forces between the molecules and the surface;
  • A cluster of crystals blocking the pore throat;
  • A single crystal blocking the pore throat.
The amount of damage a formation receives could vary depending on the reservoir rock type, initial formation parameters, concentration of ions in brines, or thermo- and hydrodynamic properties. The literature provides information on the permeability decrease because of scaling from approx. 15 to 25% (Figure 4), even up to 80–90% [26].
The process of formation losing its permeability due to the precipitation of barium sulphate can be modelled based on two parameters that have to be determined in the laboratory for every different combination of core and brine [30]:
  • λ—a kinetic coefficient describing how quickly the reaction will progress. It is being determined using the active mass law of chemical reaction, as well as breakthrough concentration when waterflooding with the formation of brine and seawater simultaneously in a specified p/T regime.
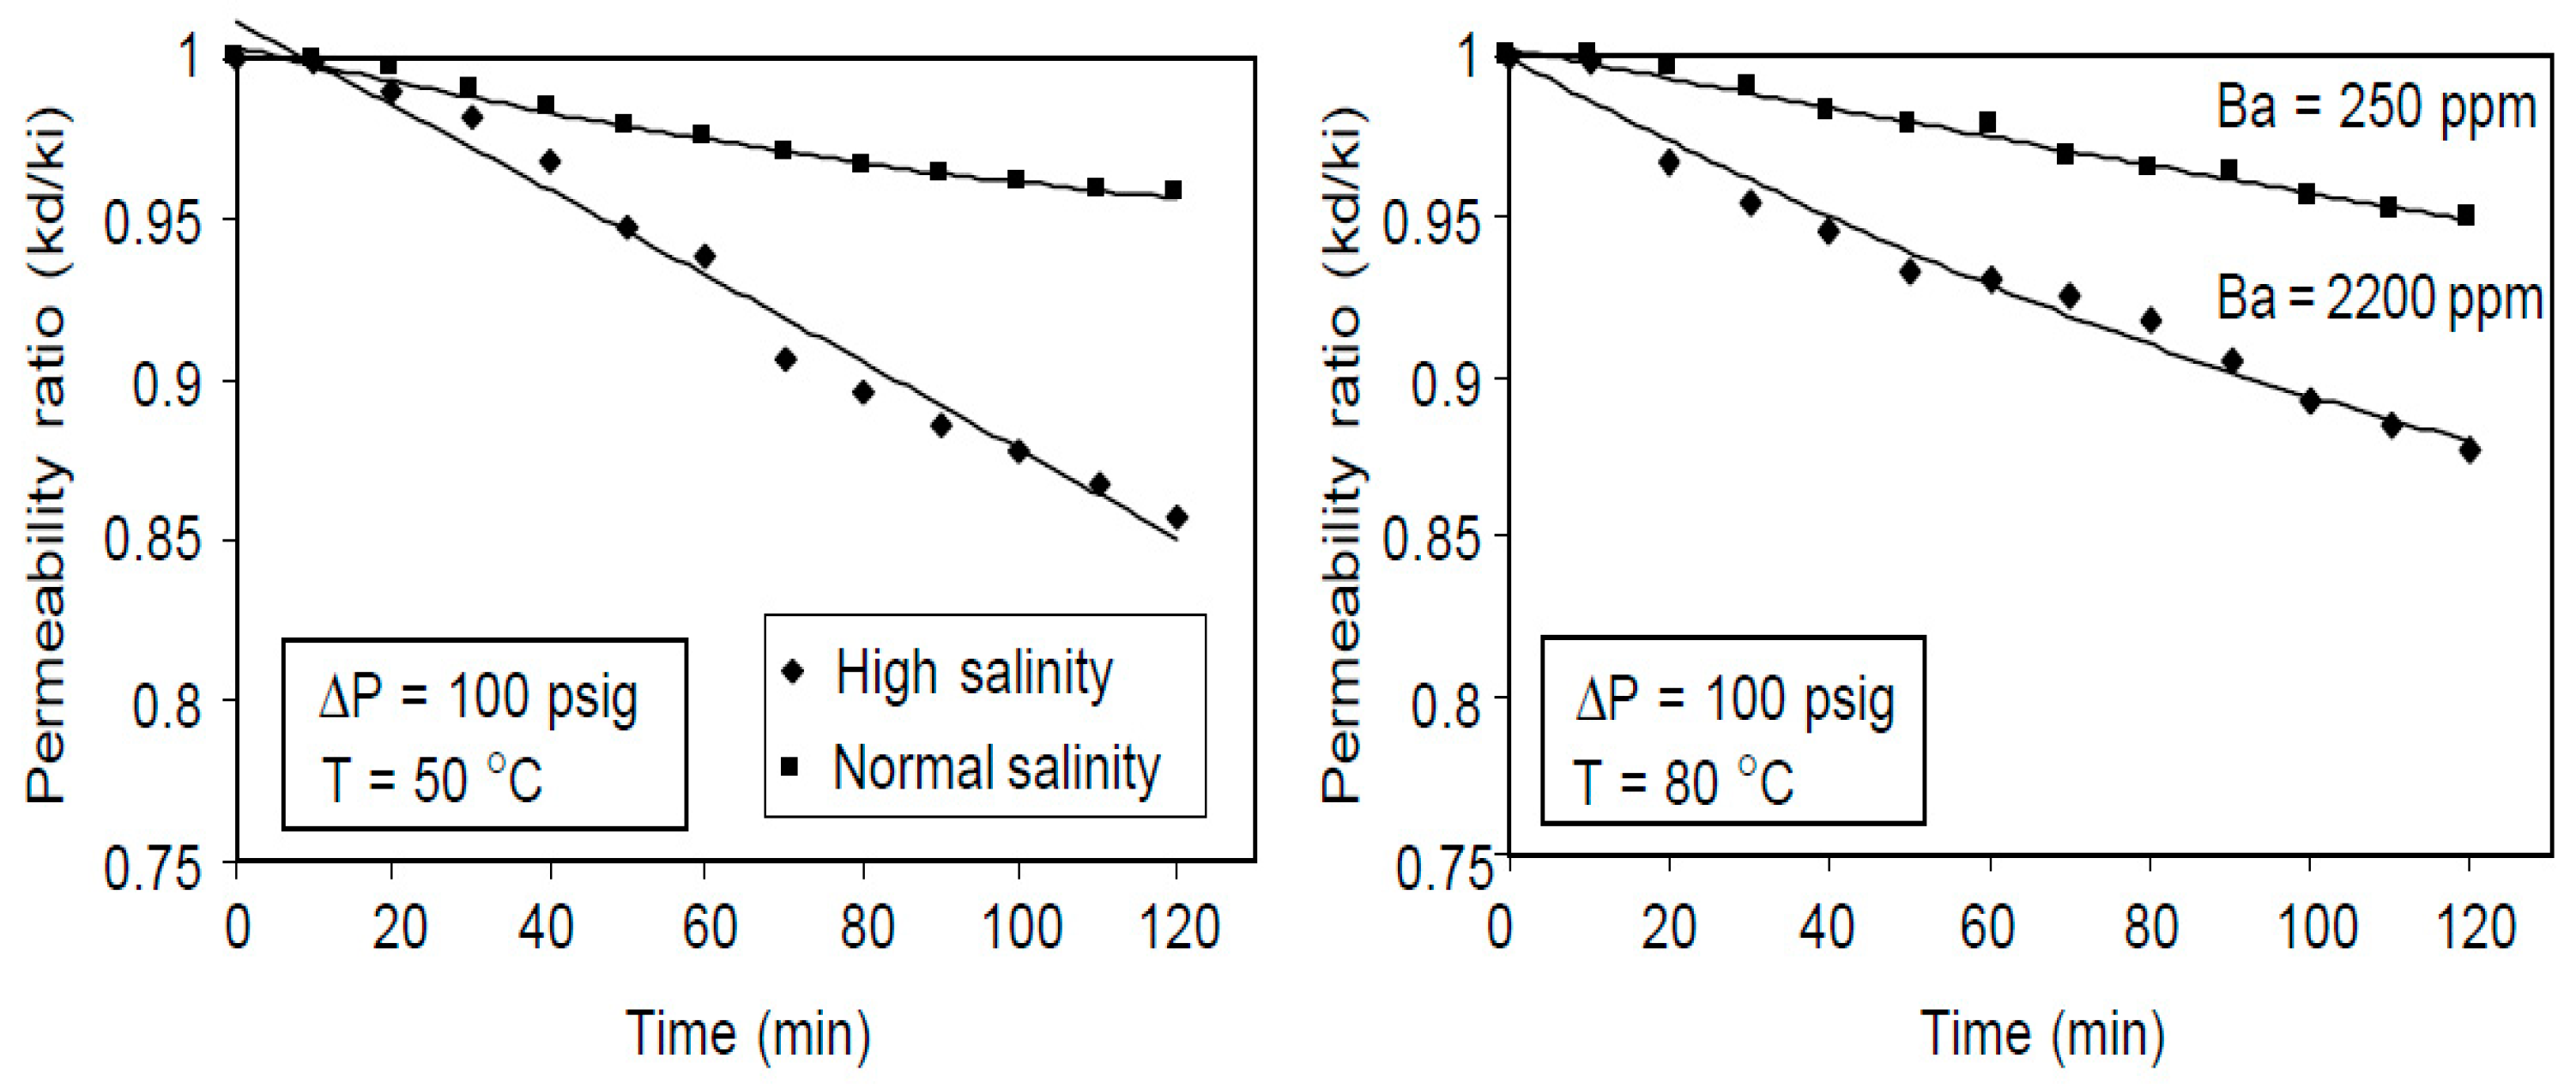
  • β—formation damage coefficient, indicating the extent of damage caused by deposition of sulphate scale. Determined based on differential pressure measurement during laboratory core flooding.
Civan [31] determined several methods to monitor and mitigate near-wellbore formation damage. This is possible by performing field tests, especially pressure transient tests, to verify if the well’s performance is disturbed by porosity, permeability, or wettability damage. In addition, it is recommended to perform lab tests on existing cores to determine the extent and mechanism that is causing the production loss. In open-hole completions, it is possible to gather a core sample of the damaged rock with a sidewall coring tool. It is also important to distinguish between damage as a change in properties of formation and an alteration in fluid properties—such as viscosity deterioration—which could be caused by an emulsion block leading to a change in mobility.

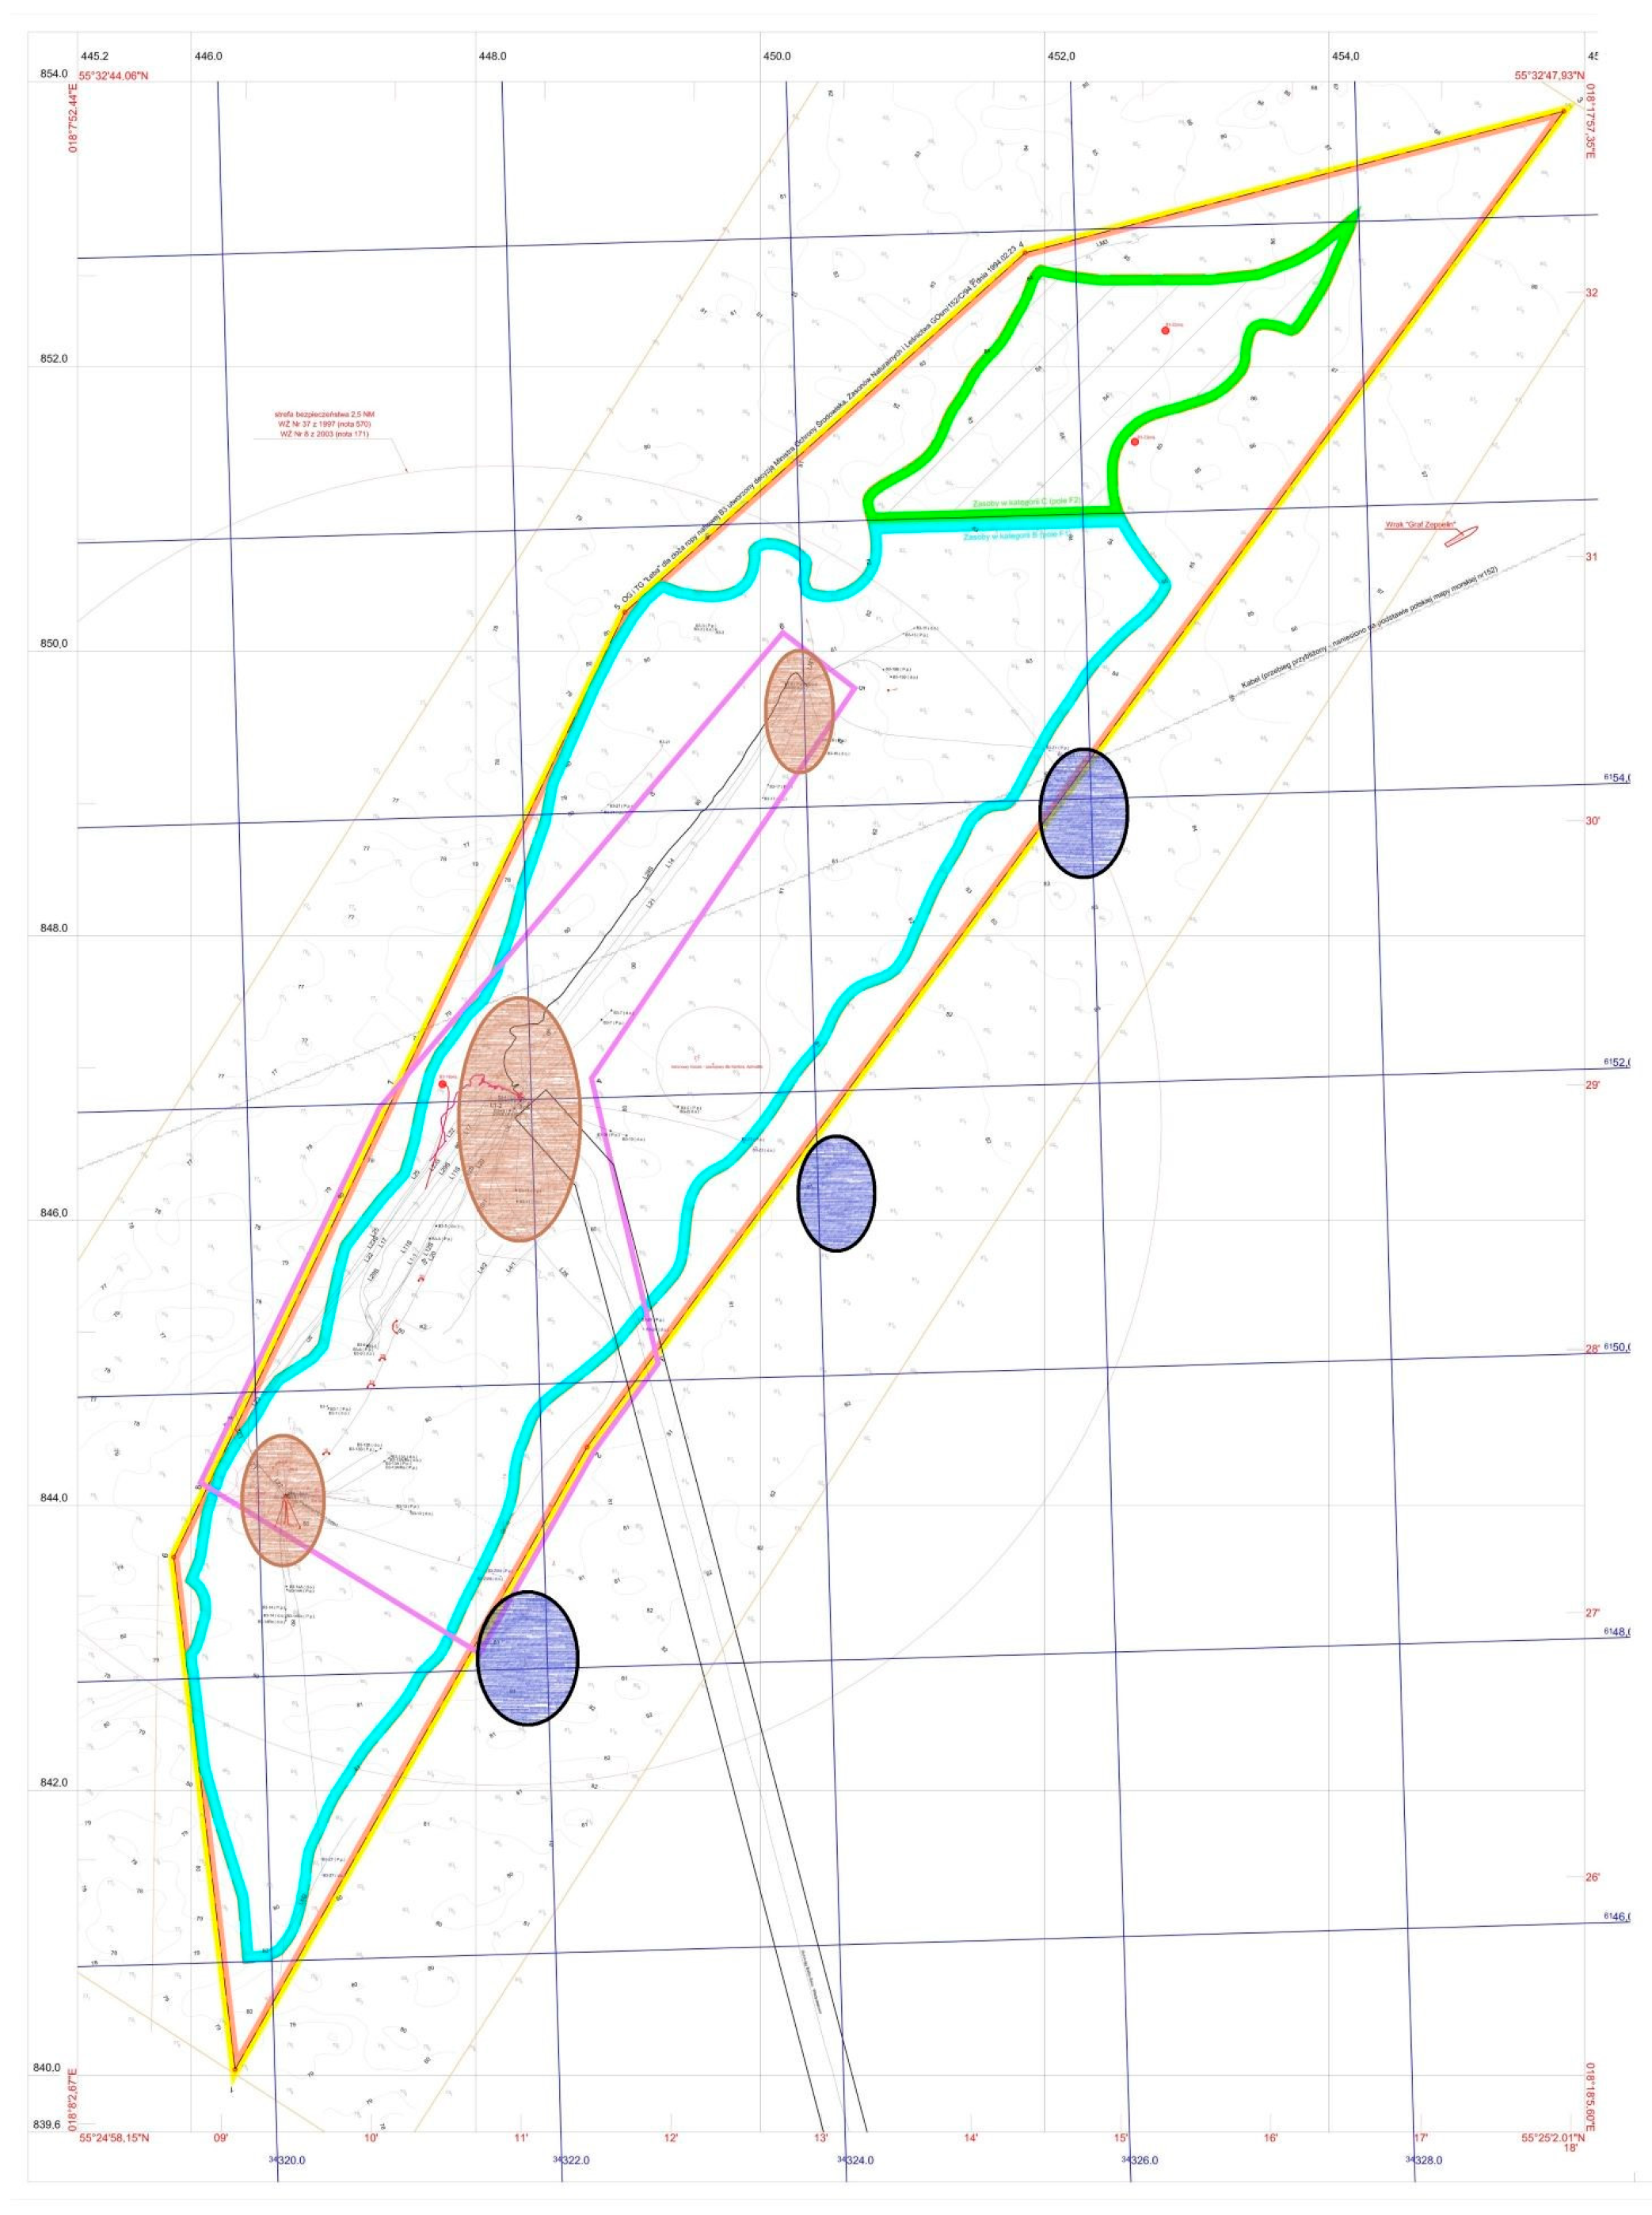
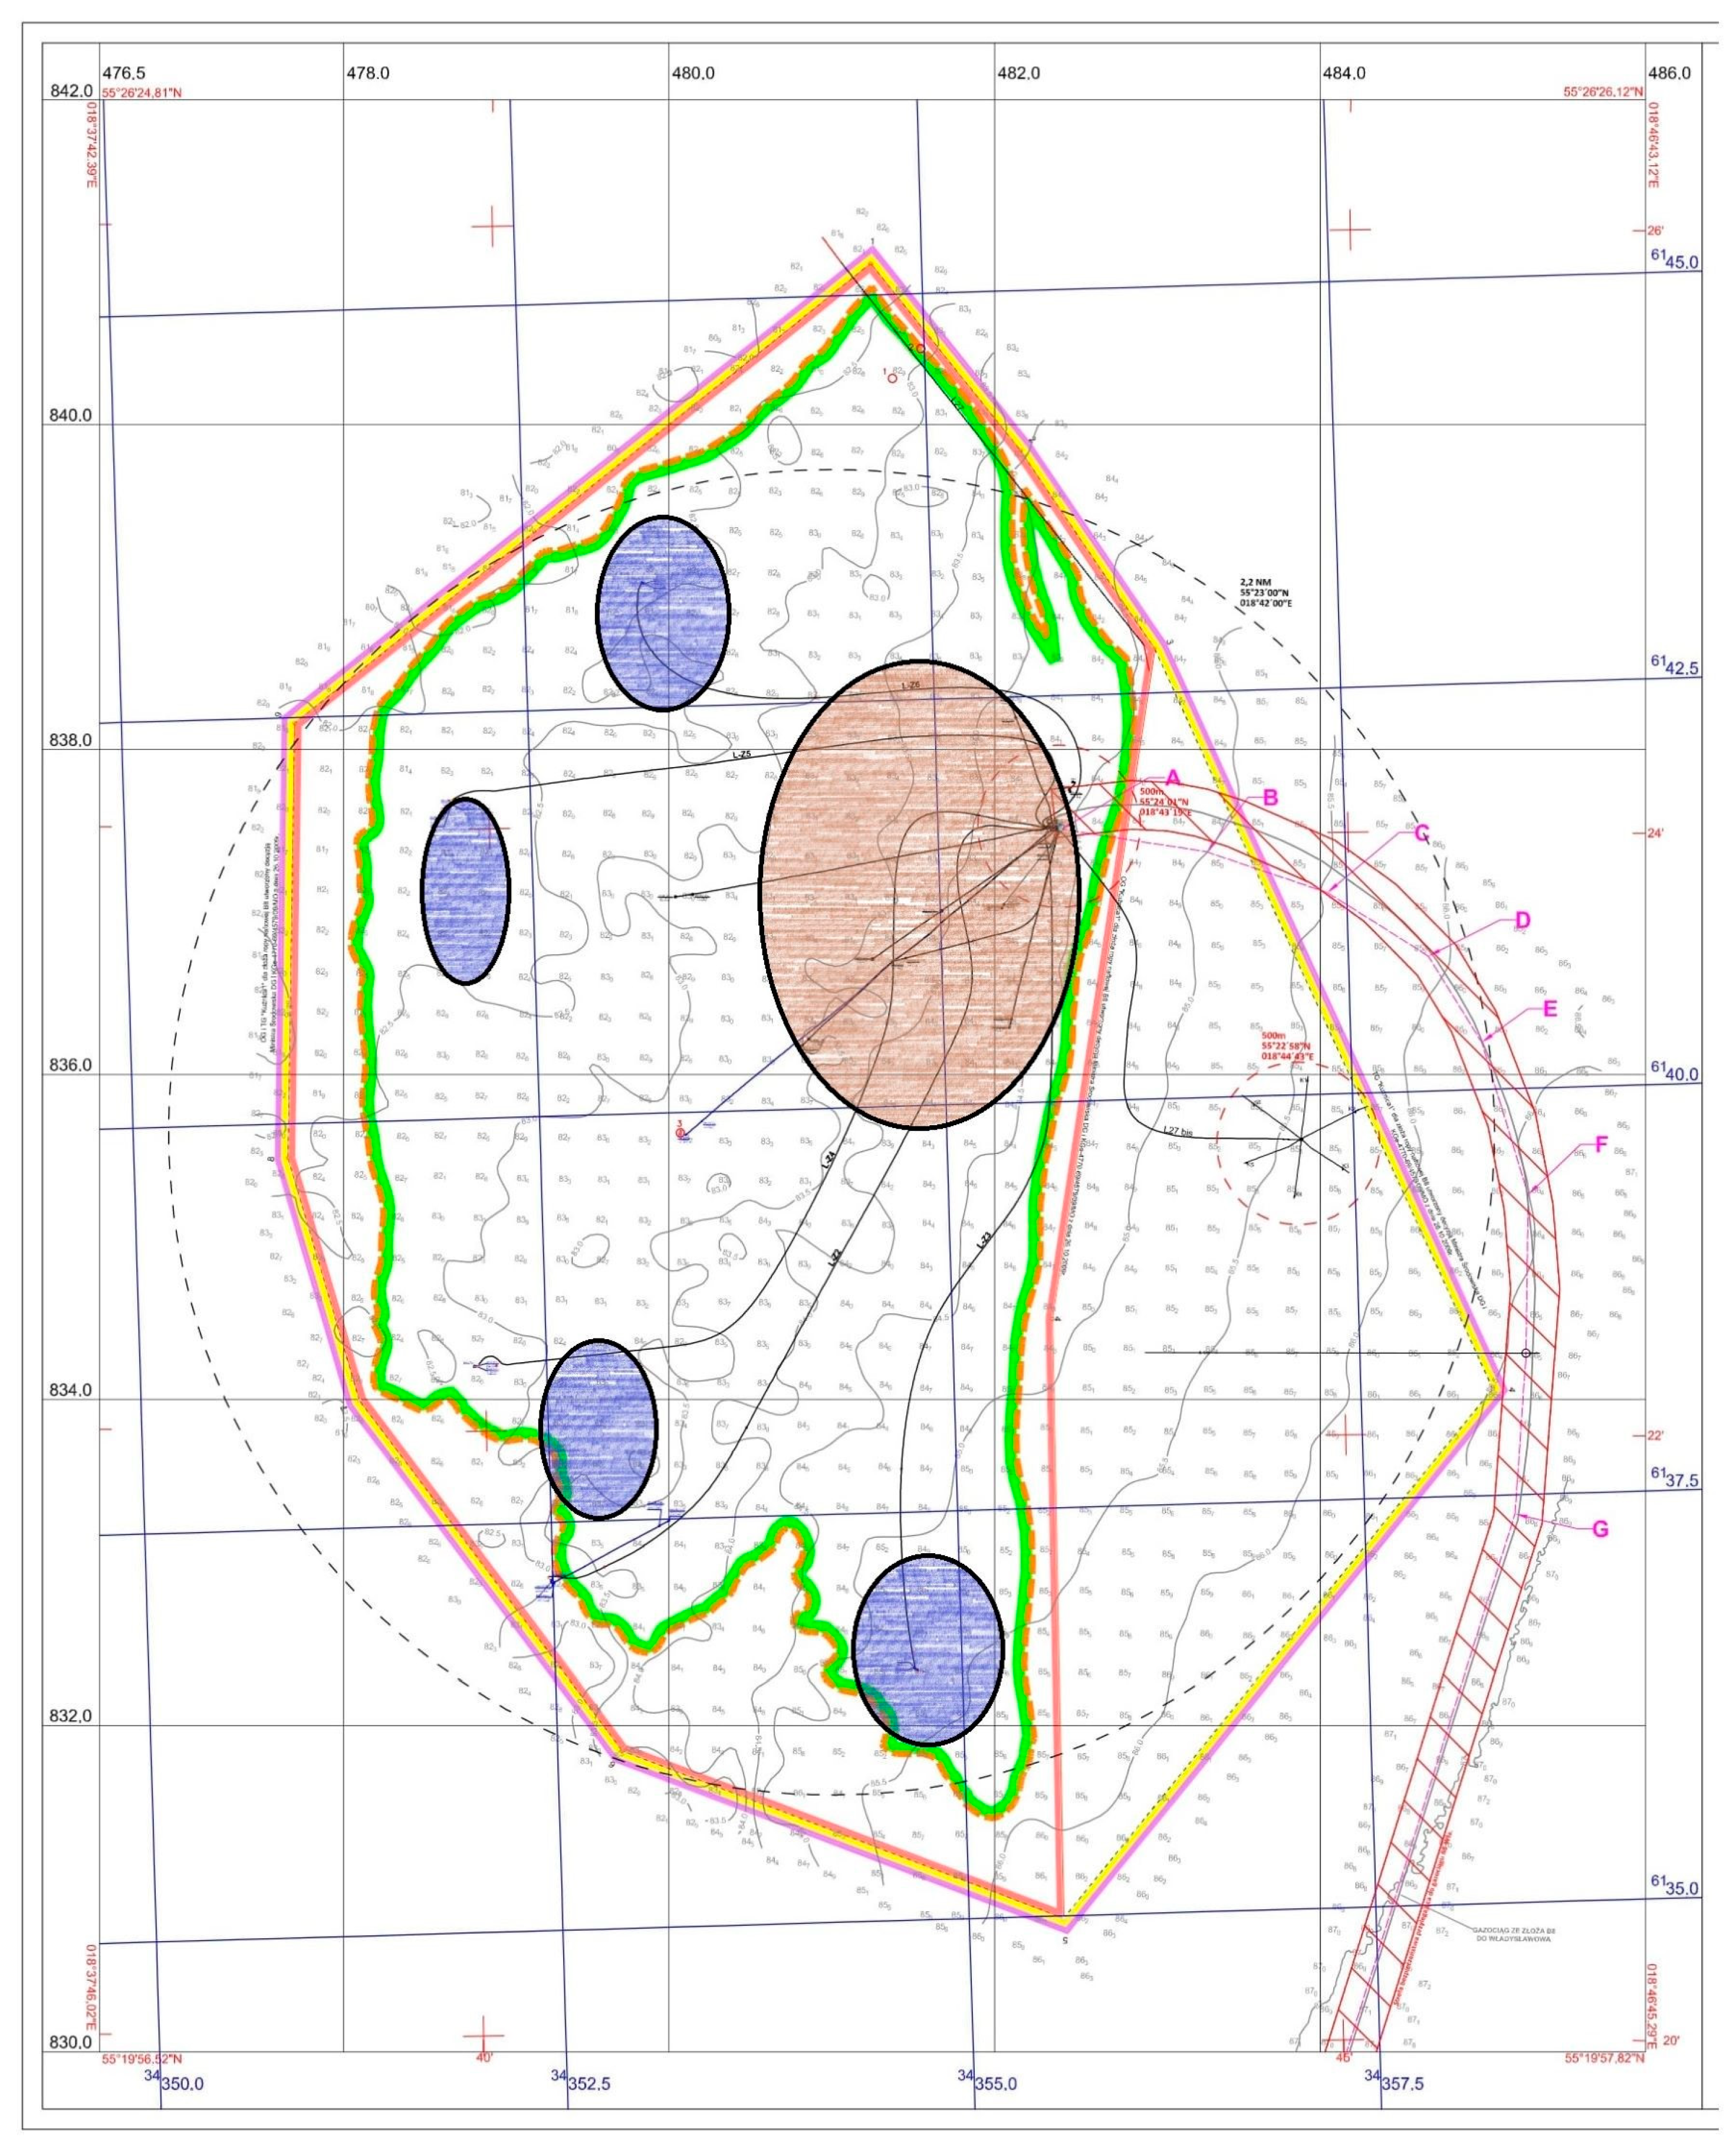
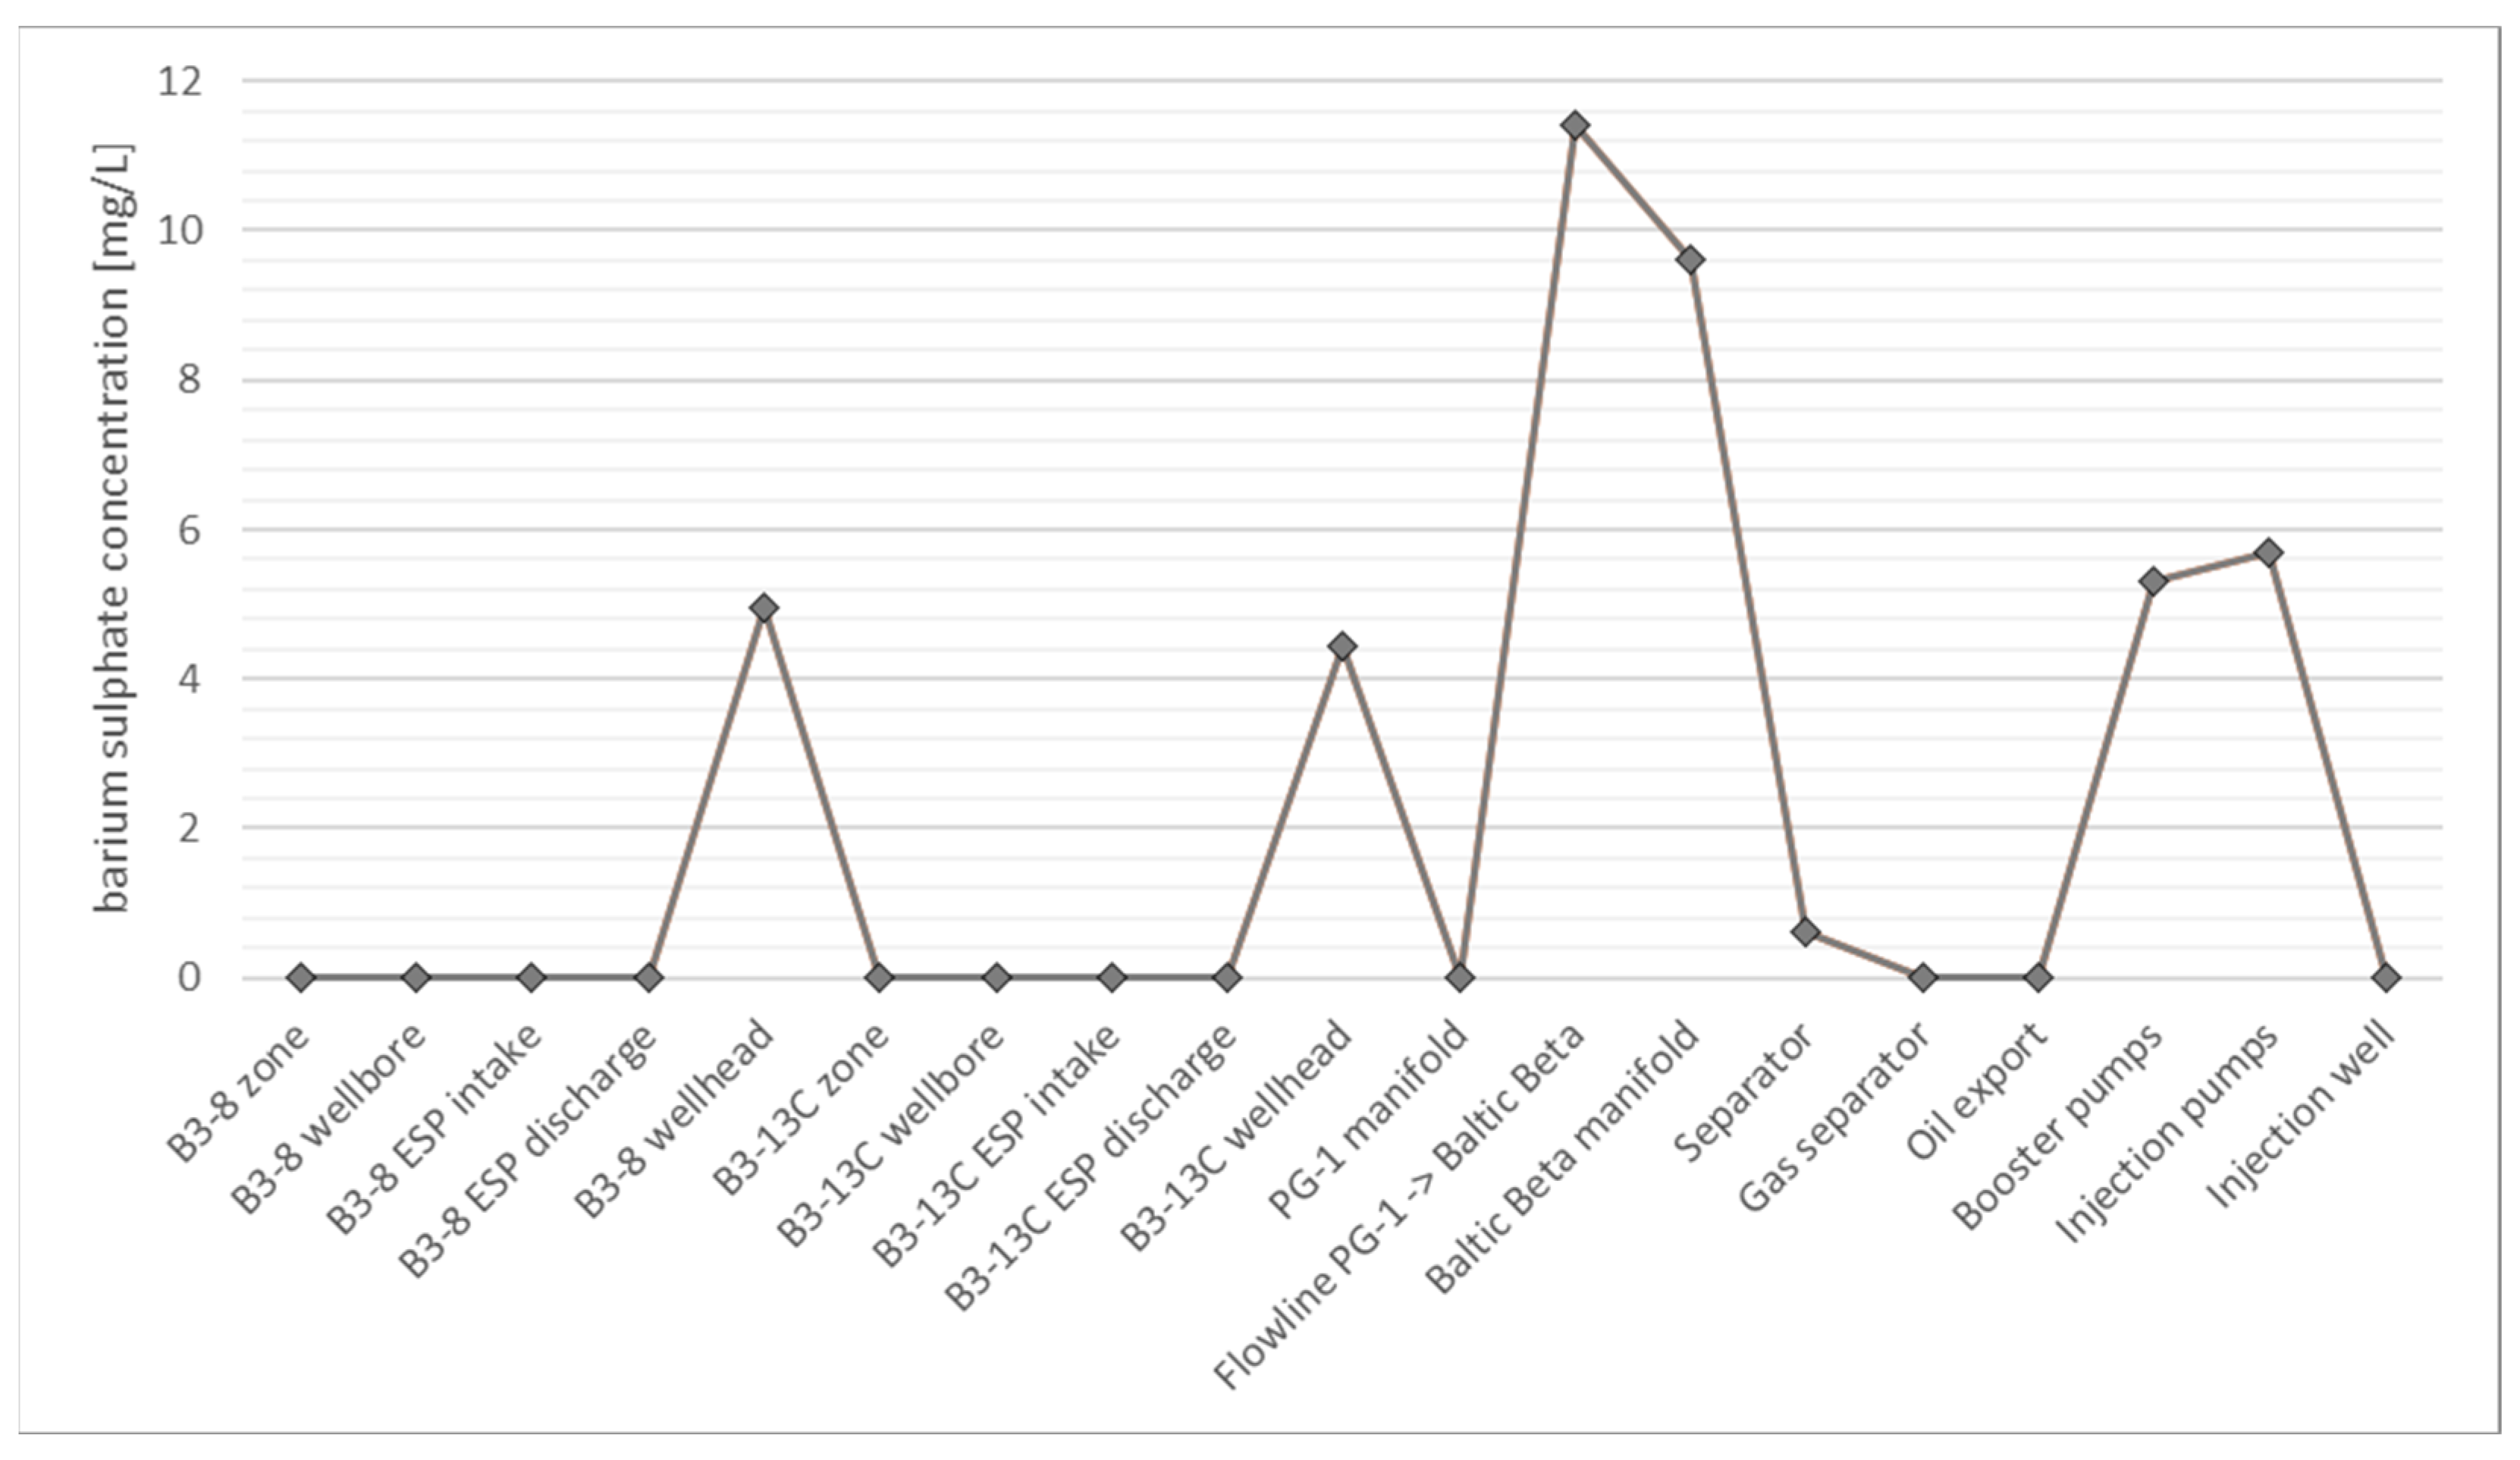
2.6. A Real-Life Example of Barium Sulphate Precipitation—B3 Oilfield

B3 oilfield in the Polish offshore economic zone of the Baltic Sea was discovered in 1981. It is a mid-Cambrian compacted sandstone reservoir with relatively low to mediocre porosity and permeability. The field has been produced since 1994. Due to the nature of the reservoir rock, type, and parameters of the fluid—approx. 41 API crude oil—and lack of proper reservoir drive support, the forecasted total recovery ratio had been 10%. Therefore, the decision was made to commence waterflooding using treated seawater in 1998. In 2001, water started to break through in the producing wells, but it was treated and disposed of. In 2012, due to legislation and an increasing need to support the reservoir pressure even further, produced water injection facility was incorporated on the rig, and commingled waterflooding using both waters began. Scale inhibitor was added to the formation water just upstream of the injection pumps.
The first symptoms of possible scale precipitation were observed in 2017 in a B3-8 well in the southern part of the reservoir. Wellhead fluid samples were regularly taken, and BSW (basic sediments and water) measurements were checked using a centrifuge. While the number of solids from those samples increased, XRD analysis, performed by a third party, proved the scale to be 98% barium sulphate.
To describe the thermodynamic potential of the B3 field’s produced water to self-scale, OLI’s ScaleChem software Ver. 11.0.1.9 was used. The framework used was OLI’s MSE-SRK, a thermodynamic model that combines MSE (Mixed Solvent Electrolyte) model for electrolytes and Soave-Redlich-Kwong EOS for a second liquid phase and natural gas. This framework has been established to provide accurate results when dealing with problems in the oil and gas industry specifically.
The water composition used for calculations was sourced from an analysis in 2008, performed due to the necessity to improve the water treatment system on the Baltic Beta jack-up (Table 1). Using only formation water for calculation, scaling potential was found for a range of pressures (1–400 bara) and temperatures (0–60 °C). The results are shown in Table 2 in terms of the saturation ratio (SR).
Based on the results, B3 formation water has a moderate tendency to self-scale, especially in topside conditions. This proves why no scale was found in wells where there was no seawater breakthrough, nor was seawater mixed in any way with produced water. Although maximum SR = 14.94 is reached when p = 1 bara, T = 0 °C, topside scaling is not observed due to local inhibition. The parameter distribution in Table 2 also indicates that the precipitation of barium sulphate is mostly temperature dependent.
Extensive historical analysis of the waterflooding process showed that the southern part of the reservoir, where the B3-8 well was the best producer of both oil and water, was subjected to the most frequent changes in terms of the type of water being injected. This could have led to mixing incompatible waters in virtually any part of the formation between the injector and producer wells.
A similar model to the one described in Table 2 was calculated, although the simulated flow was a 50/50 mixture of seawater and formation water, with conditions unaltered (Table 3). The results clearly indicate that the B3 waters are highly incompatible. Maximum SR, in this case, is 116.2, which is 10 times higher than for formation water alone. This proves that most barite scaling problems, if not all, are due to the mixing of seawater and production water.
Increasing precipitation of solids proved to be a problem for the topside facility. Unlike most documented issues concerning scale precipitation in the industry, where the wellbore and completion damage are the main cases, neither on the B3 oilfield, neither permeability damage nor any fluid and downhole issues have been observed. In this case, barite precipitates in the wellbore but does not deposit. This could be an effect of adding the scale inhibitor, which hampers the growth of crystals, unfavourable thermodynamic and flow characteristics in this reservoir, or both.
To establish the critical topside vessels and equipment where barite scaling can occur in the highest amounts, a production simulation was performed using OLI ScaleChem’s facilities feature. It allows the creation of nodes, which are equivalent to different points on the rig and downhole. Pressure and temperature conditions for these points are set, and flow regimes need to be set. In this case, two wells, B3-8 and B3-13C, were input at the same time. This is because both wells, located on an unmanned PG-1 platform, produce into the same flowline, which transfers fluids to a Baltic Beta separation system. Therefore, for the precipitated barite amounts to be accurate, both wells are incorporated into the model. Setpoints are shown in Table 4.
Oil and gas compositions were taken from a PVT analysis performed after drilling the first well. Some important assumptions were made for the calculation. Most importantly, no solids were allowed to precipitate in any part of the facility. Thermodynamic precipitation simulation cannot indicate where the solids will form and deposit. It only shows the maximum potential (risk) and, eventually, the scale of the phenomenon that could happen. This tool is therefore used to assess the risk of scaling.
Another assumption is that in the reservoir—but not in a near-well zone—all fluids are in equilibrium with each other and with the reservoir rock. This is because the whole reservoir was in equilibrium for many millions of years (prior to the production of the field), and any scale that had the potential to precipitate already did so. This is a starting condition, and extracting fluids from the reservoir disturbs the equilibrium, leading to potential precipitation.
Results for the whole facility are presented in Figure 5. The highest barite concentration (11.5 mg/L) that can precipitate is in the PG-1 unmanned platform to the Baltic Beta jack-up flowline and on a manifold to which the flowline is connected. The barite amount is twice as high as on both wellheads. This is because the flowline is on the seabed, where the temperature is close to 4 °C, but also due to the commingled flow from both wells, which increases the stoichiometric potential of precipitation. Nonetheless, booster and injection pumps should also be considered under risk, with possible scale concentrations up to 5.5 mg/L.
The above results match with scale observed over the last 4 years on the Baltic Beta vessels and equipment. Pump filters are cleaned regularly from the barite scale. No plugging problems were observed on the flowline, most likely due to constant flow and inhibition, but the scaled mass from the flowline and manifold was found in the separator during the inspection. It was the perfect vessel for barite to deposit due to the long retention time.
For several reasons, topside problems with barite precipitation and deposition should be taken seriously. Firstly, due to lower temperatures and much lower velocities in rig vessels such as separators, water filters, etc., the conditions for solid deposition are much better than the wellbore. This leads to a necessary cleaning of those vessels, often requiring production or injection stop, which is a massive cost for a producing company and increases the risk of infrastructure failure. There is also an important HSE hazard to personnel, particularly barium sulphate scale classifies as NORM—naturally occurring radioactive material. If not handled correctly, this could pose a severe problem to working staff, especially in an offshore environment where there is a limited option for controlling this hazard because of a lack of space.
Scale inhibition maintained on the B3 oilfield was aimed at controlling the precipitation in such a way that it either does not occur at all or, even if it does, it would not allow for the crystals to create a ‘cake’ on the completion elements and subsequently grow on it further. After the problems with scale in the topside facilities, the decision was made to start running completions with control lines allowing to inject scale inhibitor in the near-wellbore zone so that barite precipitation would be controlled from both sides of an injector-producer path. The above measures proved to drastically decrease the amount of scale observed in the BSW wellhead samples and reduced the necessity to perform vessel and equipment cleaning to a minimum.

3. Conclusions

The B3 oilfield’s history allowed the performance of a long-term observation of the common field lifecycle and its leading events, such as initial productivity loss, the necessity to launch secondary recovery methods, water breakthrough in producing wells, water treatment and disposal, and water mixing leading to precipitation of inorganic scale.
The case researched in this paper shows how different produced water can behave when mixed with sulphate-rich seawater in different places of injection and production facilities. The impact of solid deposition during the mixing of incompatible waters should be taken into consideration during the risk assessment of a waterflooding implementation on every new oilfield, especially offshore. Even if both waters must be injected in order to keep producing hydrocarbons, one should plan it in such a way as to avoid contact between those waters at all times.
Even though most formation waters have the potential to self-precipitate some minerals, it is usually not vital due to a low concentration of solids being a product of such a chemical reaction. However, mixing incompatible waters, especially high sulphate sea water and heavy cation-enriched formation water, could lead to a financial disaster for an unprepared operator. This shows the importance of implementing an injection and water-handling strategy before any waterflooding. This is particularly vital in the offshore industry, where seawater is commonly used as an injection fluid due to its availability.
Solid precipitation can damage the near-wellbore zone by decreasing the permeability and porosity of the reservoir rock. It can cluster around completion (e.g., ESP pumps), leading to failure and the need for costly workovers. It could also fill up and choke topside facility equipment, mainly separators, cyclonic traps, desanders, and filters used on water treatment plants, which lead to random shutoffs. Finally, the barite scale poses a threat to personnel, as it tends to emit alpha and gamma radiation.
Scale inhibitors are a must wherever there is the slightest potential of supersaturation conditions and risk of precipitation. However, even if added to treated water and simultaneously injected into the produced well, the inhibitor alone would not be able to prevent scaling when there are incompatible mixed waters. Complex solutions must always be developed to minimize the risk and extensity of scale precipitation.

Author Contributions

Validation, S.N.; Formal analysis, S.N.; Investigation, M.G.; Writing—original draft, M.G.; Writing—review & editing, both authors; Project administration, M.G.; Funding acquisition, S.N. All authors have read and agreed to the published version of the manuscript.

Funding

Research was partly funded by AGH University of Science and Technology, Krakow, within the Excellence Initiative Research University (IDUB).

Data Availability Statement

Data belongs to LOTOS Petrobaltic, meaning there cannot be any dataset containing well or platform data available for public viewing.

Conflicts of Interest

The authors declare no conflict of interest.

References

  1. Forrest, F.C., Jr. The Reservoir Engineering Aspects of Waterflooding; Monograph Series; Society of Petroleum Engineers of AIME: Richardson, TX, USA, 1970; ISBN 978-1-61399-421-4. [Google Scholar]
  2. Collins, A. Geochemistry of Oilfield Waters, 1st ed.; Elsevier Science: Amsterdam, The Netherlands, 1975; Volume 1, ISBN 9780080868554. [Google Scholar]
  3. Jordan, M.M.; Mackay, E.J. Integrated Field Development for Effective Scale Control throughout the Water Cycle in Deep Water Subsea Fields. In Proceedings of the SPE Europec/EAGE Annual Conference, Madrid, Spain, 13–16 June 2005; Society of Petroleum Engineers: Richardson, TX, USA, 2005. [Google Scholar]
  4. BinMerdhah, A.B. Inhibition of barium sulfate scale at high-barium formation water. J. Pet. Sci. Eng. 2012, 90–91, 124–130. [Google Scholar] [CrossRef]
  5. Bader, M. Sulfate removal technologies for oil fields seawater injection operations. J. Pet. Sci. Eng. 2007, 55, 93–110. [Google Scholar] [CrossRef]
  6. Rosseinsky, D.R. The solubilities of sparingly soluble salts in water. Part 5—The solubility of barium sulphate at 25 °C. Trans. Faraday Soc. 1958, 54, 116–118. [Google Scholar] [CrossRef]
  7. Krishnan, C.; Kopperson, D.; Cuthill, T. Discovery of Radioactive Barium Sulphate Scale In PanCanadian Petroleum Producing Operations In Southeastern Alberta. J. Can. Pet. Technol. 1994, 33, 49–54. [Google Scholar] [CrossRef]
  8. Sohnel, O.; Garside, J. Precipitation: Basic Principles and Industrial Application; Butterworth-Heinemann: Oxford, UK, 1992; ISBN 0750611073. [Google Scholar]
  9. Söhnel, O.; Mullin, J.W. Interpretation of crystallization induction periods. J. Colloid Interface Sci. 1988, 123, 43–50. [Google Scholar] [CrossRef]
  10. Kondepudi, D.K.; Kaufman, R.J.; Singh, N. Chiral Symmetry Breaking in Sodium Chlorate Crystallization. Science 1990, 250, 975–976. [Google Scholar] [CrossRef] [PubMed]
  11. Goodman, C.H.L. Crystal Growth: Theory and Techniques; New York Plenum Press: New York, NY, USA, 1974; ISBN 978-1-4757-1272-8. [Google Scholar]
  12. Nancollas, G.H.; Purdie, N. Crystallization of barium sulphate in aqueous solution. Trans. Faraday Soc. 1963, 59, 735–740. [Google Scholar] [CrossRef]
  13. Nancollas, G.H.; Liu, S.T. Crystal Growth and Dissolution of Barium Sulfate. Soc. Pet. Eng. J. 1975, 15, 509–516. [Google Scholar] [CrossRef]
  14. Debye, P.; Huckel, E. The theory of electrolytes. I. Lowering of freezing point and related phenomena. Phys. Z. 1923, 24, 185–206. [Google Scholar]
  15. Davies, C.W. Ion Association; Butterworths: Oxford, UK, 1962. [Google Scholar]
  16. Brönsted, J.N. Studies on solubility. iv. the principle of the specific interaction of ions. J. Am. Chem. Soc. 1922, 44, 877–898. [Google Scholar] [CrossRef] [Green Version]
  17. Guggenheim, E.A.J.C. Turgeon, Specific interaction of ions. Trans. Faraday Soc. 1955, 51, 747–761. [Google Scholar] [CrossRef]
  18. Sipos, P. Application of the Specific Ion Interaction Theory (SIT) for the ionic products of aqueous electrolyte solutions of very high concentrations. J. Mol. Liq. 2008, 143, 13–16. [Google Scholar] [CrossRef]
  19. Pitzer, K.S. Activity Coefficients in Electrolyte Solutions, 2nd ed.; CRC Press: Boca Raton, FL, USA, 1991; ISBN 0849354153. [Google Scholar]
  20. Grenthe, I.; Puigdomenech, I. Modelling in Aquatic Chemistry; Nuclear Energy Agency: Paris, France, 1997; Chapter 9; ISBN 92-64-15569-4. [Google Scholar]
  21. Elizalde, M.P.; Aparicio, J.L. Current theories in the calculation of activity coefficients–II. Specific interaction theories applied to some equilibria studies in solution chemistry. Talanta 1995, 42, 395–400. [Google Scholar] [CrossRef] [PubMed]
  22. Binmerdhah, A.B. Study of scale formation due to incompatible water. J. Teknol. 2008, 49, 9–26. [Google Scholar]
  23. Kandarpa, V.; Vetter, O.J. Predictions of Salt Precipitations due to Injecting of Foreign Waters into Geothermal Reservoirs. Trans. Geotherm. Resour. Counc. 1981, 5, 341–344. [Google Scholar]
  24. Vetter, O.J.; Kandarpa, V.; Harouaka, A. The Prediction of Scale Problems Due to Injectino of Incompatible Waters. In Proceedings of the SPE Middle East Oil Technical Conference, Manama, Philippines; 1979. [Google Scholar]
  25. Davis, R.A.; McElhiney, J.E. The Advancement of Sulfate Removal from Seawater in Offshore Waterflood Operations. In Proceedings of the Corrosion, Denver, CO, USA, 7 April 2002. [Google Scholar]
  26. Zohoorian, A.H.; Moghadasi, J.; Abbasi, S.; Jamialahmadi, M. Mixed Salt Scaling in Porous Media Due to Water Incompatibility: An Experimental Investigation. In Proceedings of the SPE International Oilfield Scale Conference and Exhibition, Aberdeen, UK, 11 May 2016. [Google Scholar]
  27. Sheikholeslami, R.; Ong, H.W.K. Kinetics and thermodynamics of calcium carbonate and calcium sulfate at salinities up to 1.5 M. Desalination 2003, 157, 217–234. [Google Scholar] [CrossRef]
  28. Nasr-El-Din, H.A.; Raju, K.U.; Hilab, V.V.; Esmail, O.J. Injection of Incompatible Water as a Means of Water Shut-Off. In Proceedings of the 6th International Symposium on Oilfield Scale, Aberdeen, UK, 26 May 2004. [Google Scholar]
  29. Allaga, D.A.; Wu, G.; Sharma, M.M.; Lake, L.W. Barium and Calcium Sulfate Precipitation and Migration Inside Sandpacks. SPE Form. Eval. 1992, 7, 79–86. [Google Scholar] [CrossRef]
  30. Carageorgos, T.; Marotti, M.; Bredrikovetsky, P. A New Method To Characterize Scaling Damage From Pressure Measurements. In Proceedings of the SPE International Symposium and Exhibition on Formation Damage Control, Lafayette, LA, USA, 13 February 2008. [Google Scholar]
  31. Civan, F. Reservoir Formation Damage, 3rd ed.; Elsevier: Amsterdam, The Netherlands, 2015; ISBN 9780128018989. [Google Scholar]
Figure 1. B3 oilfield map; brown areas indicate production zones, while blue areas are injection zones. Water is injected into the aquifer, creating a single front of water in the reservoir.
Energies 16 03345 g001
Figure 2. B8 oilfield map; brown areas indicate production zone, while blue areas are injection zones. Water is injected into the aquifer, creating a circular shape around the production area.
Energies 16 03345 g002
Figure 3. Clean barium sulphate on filtration paper.
Energies 16 03345 g003
Figure 4. Permeability decreases in time for different temperatures and barium concentration values [22].
Energies 16 03345 g004
Figure 5. Possible barite concentration in different critical points of the installation.
Energies 16 03345 g005
Table 1. Seawater and produced water compositions.
SeawaterProduced Water
Physical Properties
pH Measured at 25 degC7.835.53
Density Measured at 23.8 degC (kg/L)1.00381.0986
Anionic Species (mg/L)
Chloride412487,074
Sulphate58132
Bromide14.5879
Phosphate as PO406
Bicarbonate32.695
Cationic Species (mg/L)
Sodium223225,260
Potassium83490
Calcium10722,451
Magnesium2742966
Strontium1,7565
Barium<0.151
Iron<0.1123
Copper<0.32.2
Zinc02.2
Manganese022
Aluminium<0.310
Neutral Species (mg/L)
Carbon Dioxide3.5132
TDS (mg/L)
7539144,964
Table 2. Scaling tendency for barium sulphate of a B3 field produced water.
Temperature T [degC]
Pressure p [bara]0102030405060
114.949.676.624.713.452.581.96
10013.839.136.334.553.362.531.94
20012.758.616.064.413.282.491.92
30011.788.145.824.283.212.461.9
40010.937.725.614.173.162.431.89
Table 3. Scaling tendency for barium sulphate of a mixture of 50/50 B3 field’s produced water and seawater.
Temperature T [degC]
Pressure p [bara]0102030405060
1116.2176.6548.7436.4927.7721.6516.13
10099.1166.9244.0332.8525.2119.7814.82
20086.4259.5939.9130.0623.2318.3313.95
30074.2752.4535.8227.2821.2616.8712.91
40065.3847.1232.7325.1619.7415.7512.11
Table 4. Pressure and temperature conditions on critical elements of the upstream production facility.
Node #NameTemperature (degC)Pressure (bara)
1B3-8 zone62122
2B3-8 wellbore66119
3B3-8 ESP intake7070
4B3-8 ESP discharge72146
5B3-8 wellhead1622.8
6B3-13C zone62122
7B3-13C wellbore66119
8B3-13C ESP intake7090.6
9B3-13C ESP discharge74134.7
10B3-13C wellhead1727.2
11PG-1 manifold30.719.8
12Flowline PG-1 -> Baltic Beta419
13Baltic Beta manifold718
14Separator245
15Gas separator154
16Oil export2810
17Booster pumps168
18Injection pumps12250
19Injection well20378
Disclaimer/Publisher’s Note: The statements, opinions and data contained in all publications are solely those of the individual author(s) and contributor(s) and not of MDPI and/or the editor(s). MDPI and/or the editor(s) disclaim responsibility for any injury to people or property resulting from any ideas, methods, instructions or products referred to in the content.

