Article

Anaerobic Digestion of Agricultural Waste Using Microbial Inocula: Performance and Characterization of Bacterial Communities Using 16S rRNA Sequencing Approach

by
Btissam Niya
1,2,
Kaoutar Yaakoubi
1,*,
Salah Eddine Azaroual
1,
Fatima Zahra Beraich
3,
Moha Arouch
2 and
Issam Meftah Kadmiri
1,4,*
1
Plant and Microbial Biotechnology Center, Moroccan Foundation of Advanced Science Innovation and Research MAScIR, Rue Mohamed Al Jazouli Madinat Al Irfane, Rabat 10100, Morocco
2
Engineering, Industrial Management & Innovation Laboratory IMII, Faculty of Science and Technics (FST), Hassan 1st University of Settat, Settat 26002, Morocco
3
Biodome.sarl, Research and Development Design Office of Biogas Technology, Casablanca 20500, Morocco
4
Plant and Soil Microbiome Sub-Program, AgroBioSciences, Mohammed VI Polytechnic University (UM6P), Ben Guerir 43150, Morocco
*
Authors to whom correspondence should be addressed.
Energies 2023, 16(8), 3300; https://doi.org/10.3390/en16083300
Submission received: 17 February 2023 / Revised: 21 March 2023 / Accepted: 31 March 2023 / Published: 7 April 2023
(This article belongs to the Section A4: Bio-Energy)

Abstract

:
Anaerobic digestion is considered a beneficial treatment for biogas production (BP). To improve the performance of this bioprocess, the addition of well-selected inocula could be an interesting approach that affects the overall efficiency of the BP. In this study, the reactor performance and energy analysis of liquid-state anaerobic digestion of cattle manure (CM) at high solids concentration (TS%) (94.87%) with six different inocula—two cellulosic (C.I1, C.I2), one lipidic (Li.I), two lactic (La.I1, La.I2), and one saccharidic (Sacc.I)—were investigated. The results showed that inocula improved the biogas production and yield during anaerobic digestion of CM by 109%, 86%, and 52.4%, respectively, when the cellulosic (C.I1), lipidic (Li.I), and lactic (La.I1) inocula were added, compared with the substrate production alone at a substrate/inoculum (S/I) ratio of 5:3 (v/v). The addition of inocula in an appropriate range is useful for the performance of the anaerobic digestion process. In our study, the 16S rRNA sequencing approach was followed to investigate microbial community structure and diversity in the substrate CM and the three inocula that showed a significant improvement in biogas production (C.I1, Li.I, and La.I). The most abundant bacterial populations were found to be Firmicutes, Bacteroidetes, Proteobacteria, and Actinobacteria, with different abundance percentages. Interestingly, C.I1, which resulted in the highest biogas production, showed the dominance of Cyanobacteria (53.44%) belonging mainly to the class Nostocophycidae. This study highlighted the role of inocula in improving biogas production from cattle manure (CM) thanks to their microbial diversity.

1. Introduction

Renewable energy technologies have become one of the world’s priorities for the development of a new green energy source [1]. The valorization of bio-waste is a promising method for producing energy (e.g., biogas) from various types of biomass, such as animal manure and agricultural and food waste, via a complex microbiological process [2,3]. Anaerobic digestion (AD) is one of the best bioprocesses for producing clean energy from various types of solid waste. The four phases of organic matter degradation by AD are hydrolysis, acidogenesis, acetogenesis, and methanogenesis [4,5,6]. Under anaerobic digestion conditions, serial multi-stage biological operations are performed for the decomposition and stabilization of organic matter with the participation of different groups of anaerobic microorganisms. Various types of organic waste can be converted into a renewable energy source known as biogas, a mixture containing mainly methane (CH4: 50–70%) and carbon dioxide (CO2: 30–50%) [7]. Biogas is an energy source that can be used directly as a replacement for natural gas, to produce heat and electricity through cogeneration, or as fuel for vehicles [8,9]. The raw materials for biogas can be obtained from agricultural wastes such as cattle manure (CM). This latter is widely used as a substrate in anaerobic digestion because of its richness in microorganisms with high methanogenic potential, which can enhance the process and the biogas yield of AD [10,11]. The application of microbial inocula in anaerobic digestion could be a good approach to accelerate the anaerobic digestion of CM through the activity of microorganisms involved in biogas generation. The inoculum can enrich the substrate with an additional community of microorganisms. They can also provide some sources of nutrients when added to the substrate, as they are made from different organic matter sources that can be degraded by microorganisms and can improve the stability of the AD process [3,12]. The type of organic waste digested with the addition of inocula could be the key factor in improving and accelerating the hydrolysis step due to the presence of several taxa that can start the AD process. Furthermore, the microbial community composition changes and varies with the addition of inocula to the substrate [13]. Therefore, the addition of inoculum can influence several parameters in the course of AD processes. The important parameter is the dynamics of the microbial community during the process, the interactions between the microbiomes, and the effect of physicochemical and biochemical factors. Therefore, the reason for adding inoculum to the digester was to stabilize the process and improve biogas production. Similarly, the composition of the microbial community also changes with the nature of the inoculum [14]. The key to achieving successful exploitation of anaerobic digestion as biological treatment facilities lies in a thorough understanding and elucidation of the microbial communities that catalyze the conversion of organic compounds to alternative energy [15]. Oxford Nanopore Technology (ONT) is one of the most promising next-generation sequencing (NGS) technologies that has been developed. Compared to conventional sequencing methods, it allowed for high-throughput DNA sequencing [16]. Consistently, a large number of bacterial species are usually found in anaerobic digestion systems. In particular, the Firmicutes (Clostridium and Bacilli) and the phylum Bacteroidetes (Bacteroides) [17] are commonly present. In addition, other species belonging to the phyla Chloroflexi, Proteobacteria, Spirochaetes, and Actinobacteria have also been detected with differences in their abundance but generally with a lower frequency than the Firmicutes and Bacteroidetes [18,19]. This study aimed to screen the best inocula for biogas production using cattle manure as substrate and characterize the microbial community of the suitable inocula using a 16S rRNA amplicon sequencing approach.

2. Materials and Methods

2.1. Substrate and Inocula

Fresh manure used in this study was taken directly from a dairy cow house on a cattle farm in Skhirat, Rabat city, Morocco. The substrate and the inoculum were subjected to pre-treatment by being ground with an electric mixer to facilitate the process. The maximum particle size did not exceed 2 mm. Six different types of inocula were prepared according to Table 1 and obtained by the pre-AD step to stimulate the microbial communities of the inocula. This step consisted of anaerobic storage at 35 °C for 10 days, with glucose addition every 24 h for 8 days and a rest time during the last two days [20]. The inocula were then stored at 4 °C.

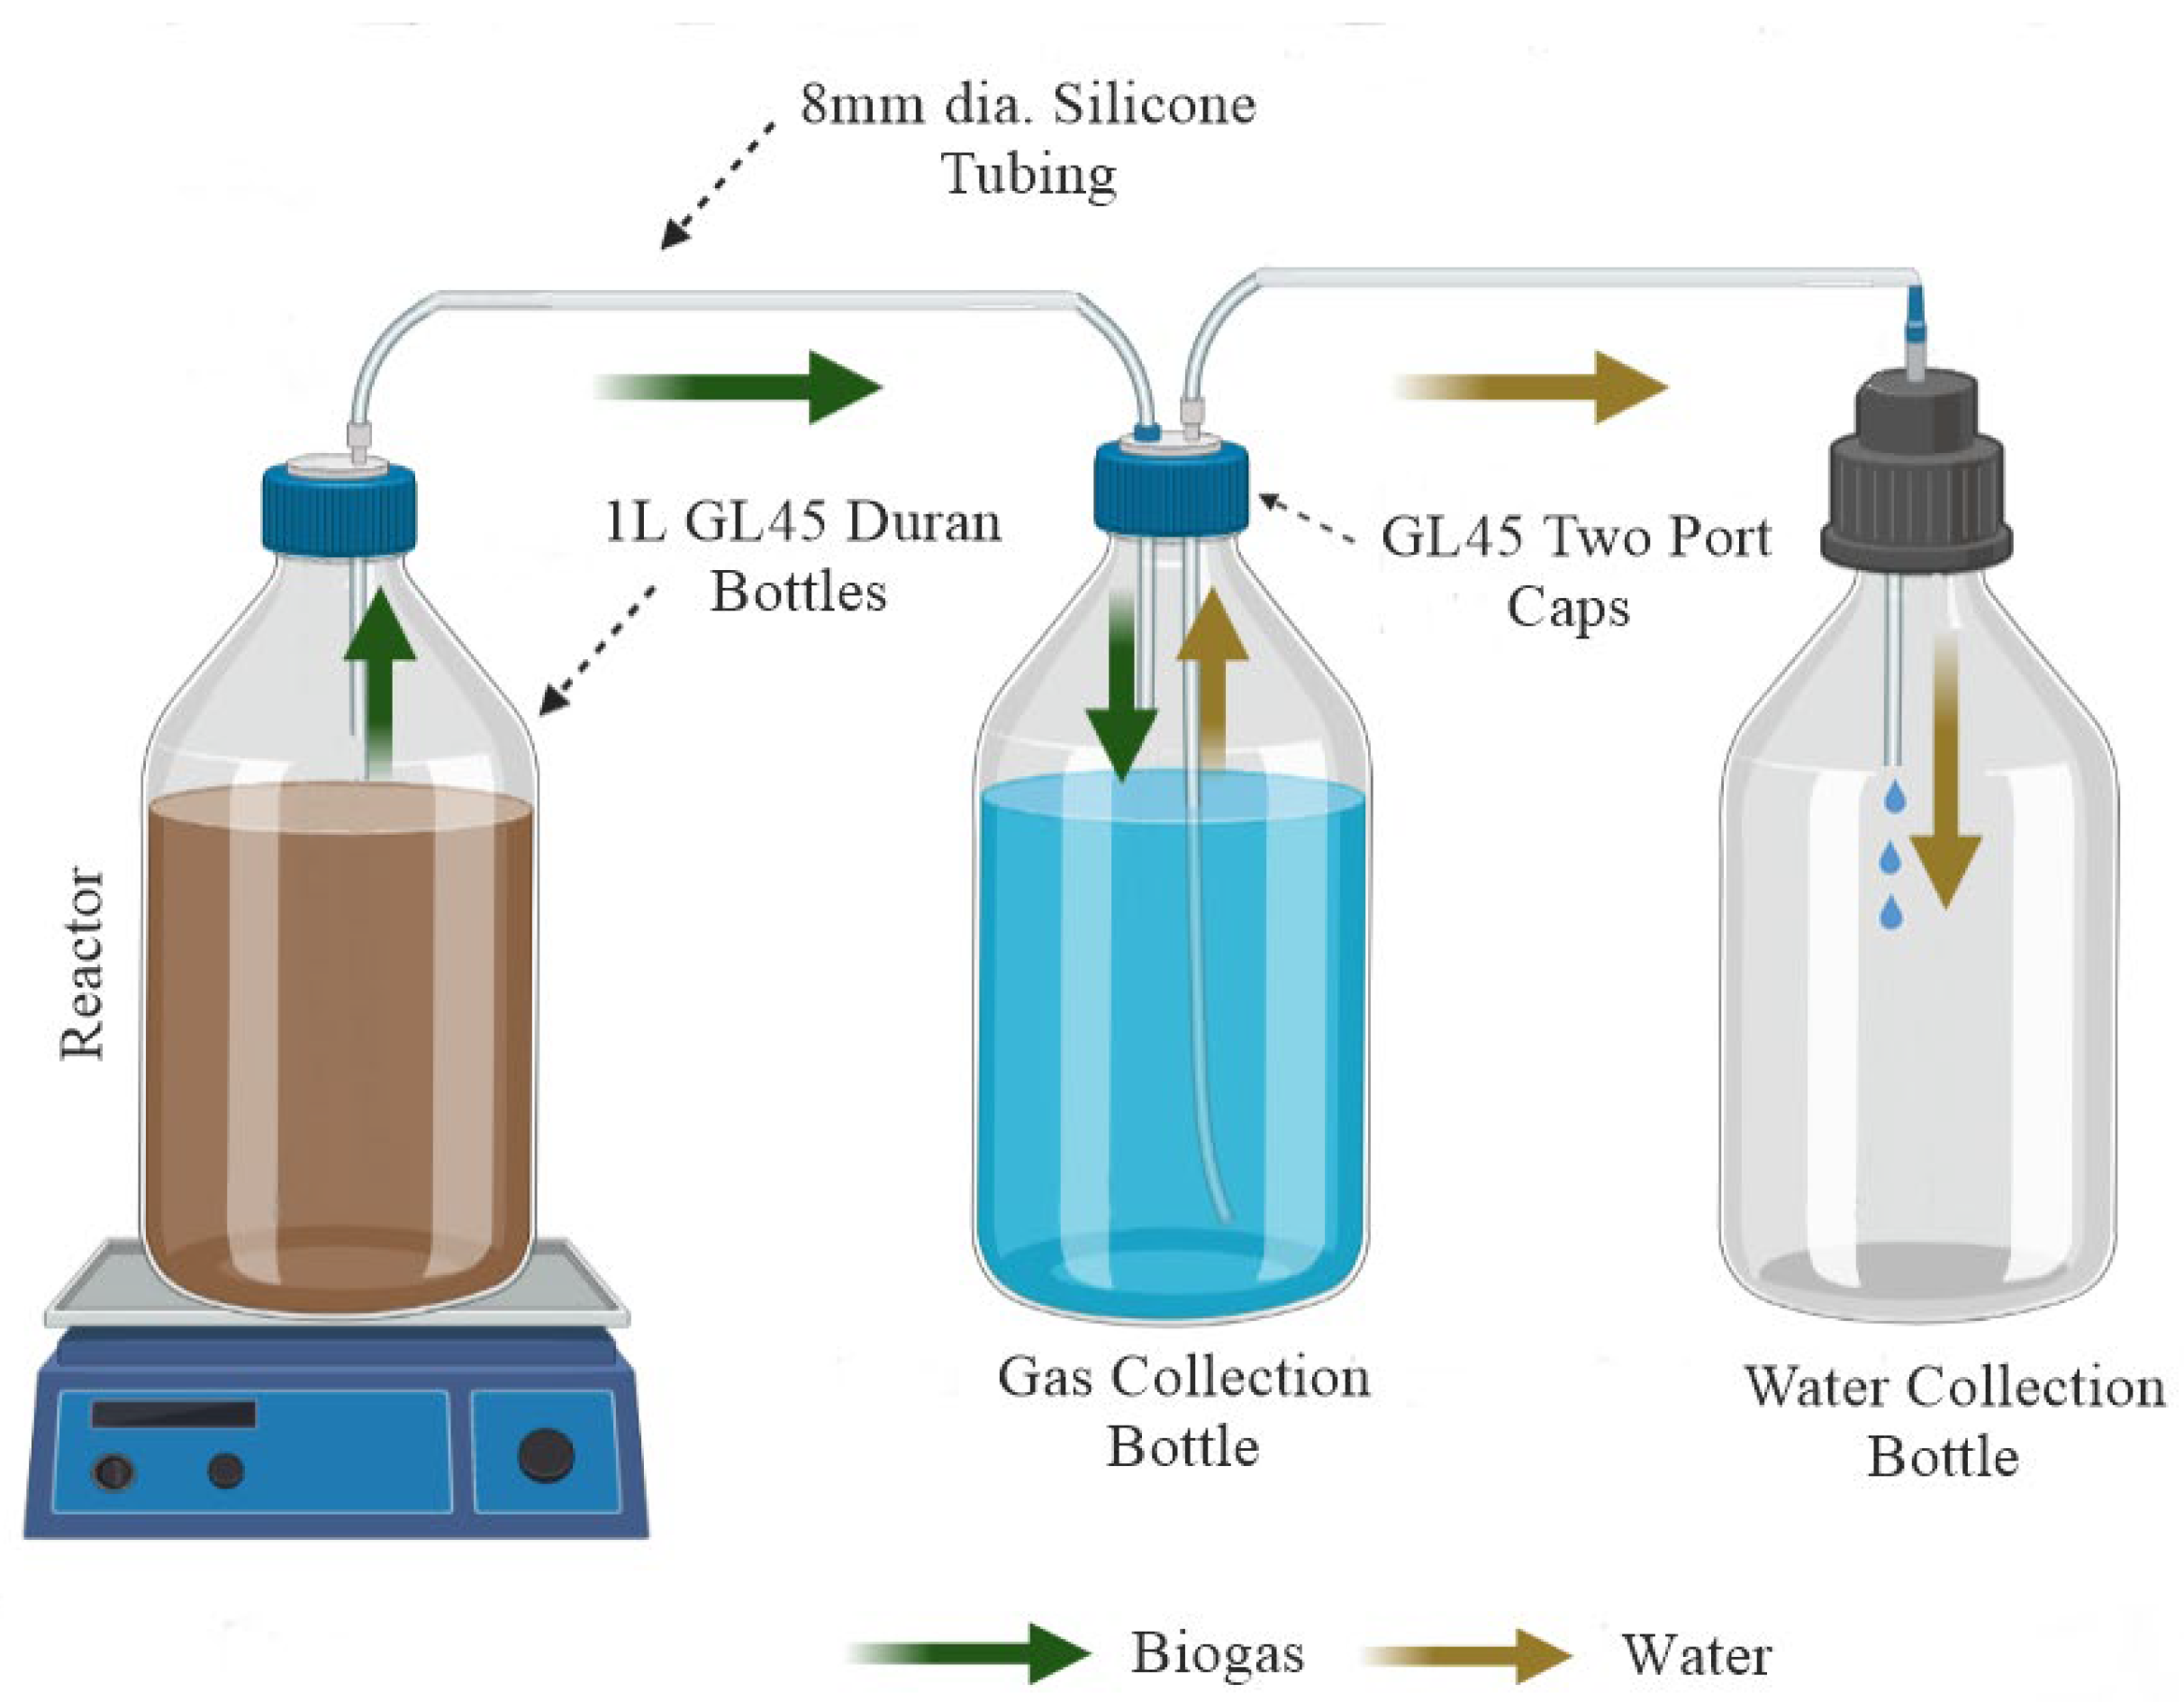
2.2. Anaerobic Digestion Batches Set-Up

In this study, AD assays were performed on cattle manure alone (control) and with the addition of inocula in batch mode at a lab scale. The biochemical methane potential (BMP) was used in these experiments, adapted from the EN 1173 standards [18] (Scheme 1). Experiments were performed in 1-L digestion reactors with a working volume of 0.8 L for each experiment.
To ensure homogenous mixing, the raw materials (CM and added inocula) were stirred for 10 min. The seven experiments were performed simultaneously, with the CM substrate as the control and the other reactors containing the CM substrate and six different types of inocula that were combined separately. The initial volatile solid (VS) concentration for the batch digestion of CM was adjusted to 366.6 g VS L−1 and the corresponding S:I ratio was set to 5:3, which was the most efficient ratio according to our preliminary assays. In these assays, we used three different ratios of inoculum per substrate (1:4, 3:5, and 5:6), and the VS:TS ratios were also calculated for each experiment. The digesters were sealed with rubber septa, and the airspaces were flushed with nitrogen gas (purity: N40) for 5 min to provide anaerobic conditions within each digester. These experiments were performed in triplicates following the VDI 4630 standards [19]. The reactors were shaken using a magnetic stirrer at 150 rpm and incubated at 37 °C ± 0.5 °C under mesophilic conditions [14]. The final operational volume was 800 mL.

2.3. Biochemical Characterization of Substrate and Inocula

Total lipids were extracted according to the methods of Bligh and Dyer [20]. This method involved homogenizing samples with a mixture of water/methanol (≥99.8%)/chloroform (99–99.4%) at a ratio of 1:1:2 (v/v/v), separately. Dilution with chloroform and water separates the homogenate into two phases, and the organic phase containing chloroform was recovered. The solvent was evaporated by nitrogen gas (purity: N40), and the lipids were weighted. Total sugar was extracted by adding 10 mg of the dry sample to 2 mL of sulfuric acid with a purity of 95–97%. The mixture was then heated to 90 °C for 120 min and placed in an ultrasound bath model (Branson, Ultrasonic Bath1510, US Ultrasonics. LLC, Amelia, OH, USA), and sonicated at 40 kHz for 15 min. The total sugar was determined using the phenol-sulfuric acid method [21]. The concentration of total sugar for each sample was determined using the standard curve prepared with known glucose concentrations. A modified version of the method described in [22] to extract the proteins. This method involved measuring the change in absorbance (measured at 595 nm) and the change in color of Comassie blue (G-250) after its reaction with amino acids. Known concentrations of bovine serum albumin (BSA) were used as the standard [23].

2.4. Analytical Methods

Samples were taken by inserting a syringe into the digester and pipetting a quantity of the mixture through the rubber tubing to avoid opening the batch digester. Total solids (TS) and volatile solids (VS) were measured according to standard method 2540 G [24,25] The pH was determined using a pH meter (SevenCompact S220-Basic, Metler Toledo, Kowloon, Hong Kong) with a combination glass electrode, calibrated in buffers at pH 2, 4, 7, and 10. For the analysis, the fermentation mixture was removed from each reactor and promptly filtered with 0.5 µm syringe filters. Chemical oxygen demand (COD) and biological oxygen demand over 5 days (BOD5) were measured using methods described in “Standard methods for the examination of water and wastewater”, published jointly by APHA, AWWA, and WEF [26]. We calculated the COD and BOD5 efficiencies following the formula:
COD   Efficiency = CODf CODi CODi × 100
Total organic nitrogen, calcium, and total phosphorus were determined using the Continuous Flow Analyzer (CFA) (SKALAR San++, Breda, The Netherlands). COT was measured according to the standard NF X 31-109 method. Bacterial community analysis was carried out using an amplicon sequencing approach based on next-generation sequencing (NGS) to investigate the bacterial communities in the best-performing inocula. Three samples of inocula (C.I1, Li.I, and La.I1), which showed maximum production of biogas along with the substrate CM (the control), were chosen for this analysis. Briefly, the samples were centrifuged at 10,000 rpm for 10 min, and the pellet was used for DNA extraction using the PowerSoil kit (DNeasy PowerSoil, Qiagen, Hilden, Germany). The obtained DNA was purified using the AMPure XP beads protocol and quantified by the Qubit 4 Fluorometer. The extracted DNA was amplified using 16S rDNA primers, and each sample was barcoded. Amplicons were purified using the AMPure XP beads protocol and quantified by a Qubit 4 fluorometer. The library of 16S rDNA amplicons was prepared via the SQK-RAB204 kit. The sequencing experiments were launched for 24 h and monitored in real-time using MinIon from the Oxford Nanopore Technology (ONT). The raw sequencing data were basecalled and demultiplexed by MinKNOW software (version 22.12.7), and the analysis of taxonomic profiles was performed by the EPI2ME web server (https://epi2me.nanoporetech.com accessed on 12 January 2023). Graphs presenting bacterial composition and abundances were generated using GraphPad Prism 9.0.0 software. Further data analysis was performed using QIIME2 software [27] to evaluate the diversity and construct principal coordinate analysis (PCoA) plots using the Emperor tool [28].

2.5. Data Analysis

BMP experiments were performed in triplicate, and data are expressed as the mean standard deviation. One-way ANOVA was used to evaluate the statistical significance of experimental results with a p ≤ 0.05. All statistical analyses and graphs were generated using GraphPad Prism 9.0.0 software.

3. Results

3.1. Characterization of the Raw Substrate and Used Inocula

3.1.1. Total Solids and Volatile Solids

The parameters measured for inoculum characterization were pH, total solids (TS), volatile solids (VS), lipids, proteins, and sugar contents. In our study, the VS contents of inocula were different according to the type of inoculum. The minimum value of 14.25 ± 1.08% was observed in Li.I, whereas the highest value of 62.25 ± 4.58% was obtained for the lactic type La.I1 (Table 2). As a parameter, volatile solids (VS) measure biodegradation, which shows directly the metabolic state of microbial groups in the anaerobic reactors [29]. Compared to the inoculum, the cattle manure (CM) substrate showed higher VS and TS contents, with 89.43 ± 5.17 and 94.87%, respectively. These values seem similar to those published by [30], who indicated a VS percentage of CM of up to 79.20%. The VS/TS ratio is a crucial indicator for assessing the organic content of the substrate [31]. A previous study highlighted a high VS/TS ratio for cattle manure (CM) with 76% of TS [32], which is in accordance with our results that showed a very high VS/TS ratio for this substrate, up to 94.26% of TS (Table 2). On the other hand, the VS/TS ratio of the inoculum varies from 59.5% (Sacc.I) to 88.36% (C.I1) (Table 2). VS and TS degradations are consistent with a better nutrient balance for microbial activities, which leads to a high degradation of organic matter [33]. Generally, substrates having a significant quantity of organic matter show a positive effect on BP [31,34]. Nevertheless, a previous study showed that the inoculum with high lignin content was inefficient to be converted into biogas by the anaerobic digestion process [35]. Based on these assumptions, the comparison of different inocula made from organic compounds aimed to identify the best inoculum that has the best methanogenic potential for biogas production.

3.1.2. Biochemical Characterization

The biochemical analysis results of various inocula used for the AD process are presented in Table 2. The contents of carbohydrates, lipids, and proteins varied according to the nature of the inoculum used. The lipidic inoculum (Li.I), mainly produced from olive pomace, contained up to 35.05% lipids, while the cellulosic inoculum contained up to 8.15% carbohydrates. Depending on their composition, the inocula provide nutrients and support microbial populations that positively impact biogas production and maintain the stability of the AD process [3]. A positive relationship was found between BMP and lipid content because lipids have a very high biogas potential. Therefore, lipidic inocula represent a ready and easily biodegradable source of nutrition, besides their capability to ensure the digestibility of the soluble material for micro-organisms, which guarantees their survival [36,37].

3.2. Monitoring of the BMP Experiments

To monitor AD, the following parameters were analyzed during BMP experiments: pH, COD, BOD5, TOC, and TON. The results are presented in Table 3. The efficiency of organic matter degradation is presented by COD and BOD5 efficiency. The results showed that efficiency decreased during anaerobic digestion in almost all digesters, which explained the degradation of the substrate’s organic load and its consumption by microorganisms involved in BP. Thus, a significant decrease in COD efficiency was observed mainly in C1.I, with 77.28% (Table 3). This decrease could be explained by the degree of degradation of this organic matter [38]. The biodegradability index (BI), calculated by the COD/BOD5 ratio, initially ranged between 1.05 and 2.64 for lipidic (Li.I) and lactic (La.I1) inocula, respectively (Table 3). Suhartini et al. [33] showed that this ratio should range between 1.92 and 2.05. Indeed, a low value of COD/BOD5 implies the presence of a high content of biodegradable material suitable for biological treatment. However, the saccharidic inoculum (Sacc.I) showed a higher final BI ratio of 4.16. Consequently, the experiment, including saccharidic inoculum made from molasses and CM, was not adequately digested by microorganisms. The average values of the COD/BOD5 ratio for the different digestion experiments were ≤3, which is the maximum limit of biodegradability [39]. The C/N values presented in Table 3 reflect the ratio between carbon and nitrogen content in the materials. The substrate CM alone showed the highest C/N ratio of 39.64, which means it is rich in organic carbon. For BMP experiments with inocula addition, the minimum and maximum C/N ratios were for Sacc.I and C.I1 inocula with 19.5 and 33.94, respectively. For optimal BP, the microbial communities need a suitable C/N ratio for their metabolism, which is generally ≥20 [40,41,42]. The total carbon content was measured for the maximum C/N ratio experiment involving C1.I was 52.18% (Table 3). This high total carbon content with low nitrogen could explain the suitability of this inoculum with CM for biological activity. On the other hand, when the C/N ratio is higher than the appropriate range, VFA accumulation occurs and leads to a pH decrease and subsequent inhibition or even failure of the AD system [3,43]. Consequently, a mixture of wastes poor in nitrogen with others rich in carbon allows for obtaining adequate ratios [44,45,46].

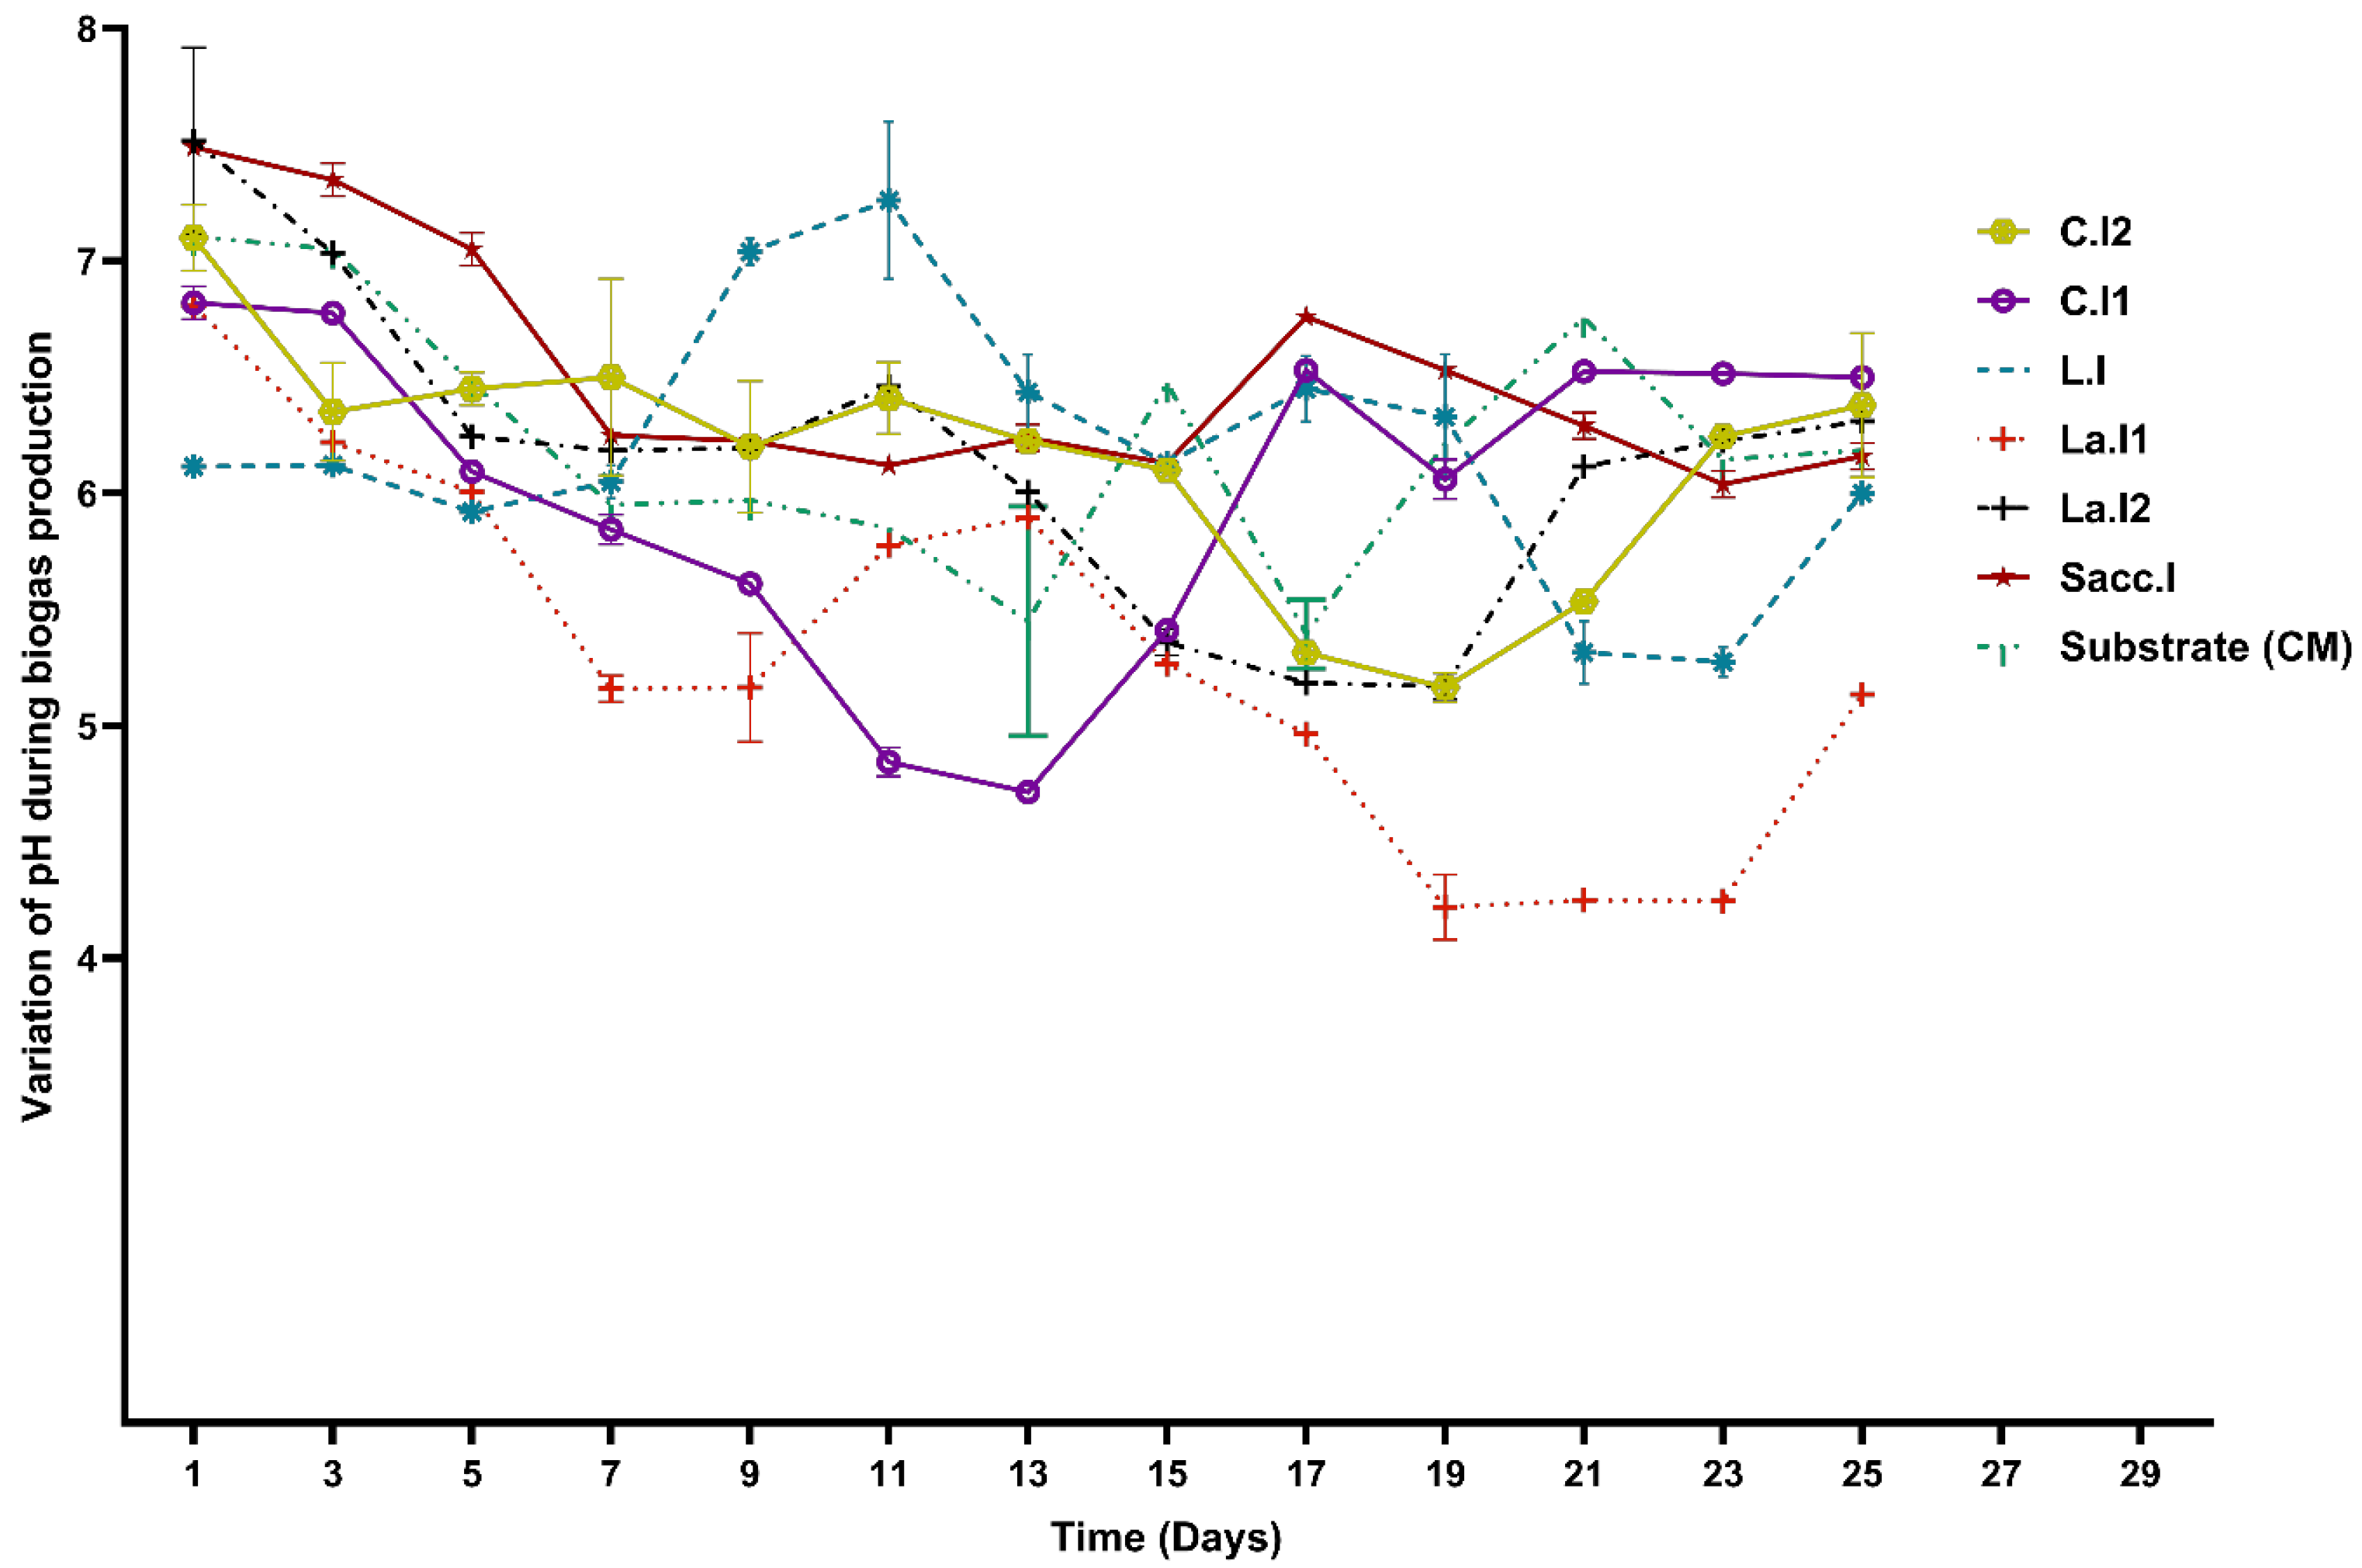
3.3. Daily Monitoring of pH Variation during BMP Experiments

pH monitoring results from different BMP experiments using the six inocula for over 20 days showed a common tendency (Figure 1). The pH values started between 6 and 7.5, which can be considered neutral conditions, and then decreased in all experiments during the first 5 to 11 days. In fact, the pH decrease was more pronounced in the experiment with cellulosic inoculum C.I1, which reached 4.5. The pH values then increased for almost all the reactors, which can be due to the degradation of acids and the generation of biogas, and remained stable until the end of the digestion period [47,48]. pH is an important parameter in BP since it directly affects the anaerobic digester’s performance and stability [49]. Microorganisms are very sensitive to pH because each group of bacteria requires a different pH range for their growth [50]. Leung et al. [51] have shown that the pH requirement for acidogenic and acetogenic bacteria is >5.0 and 6.2, respectively, for acceptable enzymatic activity. Similarly, methanogenic bacteria show better performance at pH values between 6.8–7.2. It is reported that biogas production is more efficient with a pH > 5.5 [52].

3.4. Biogas Production in Different BMP Experiments

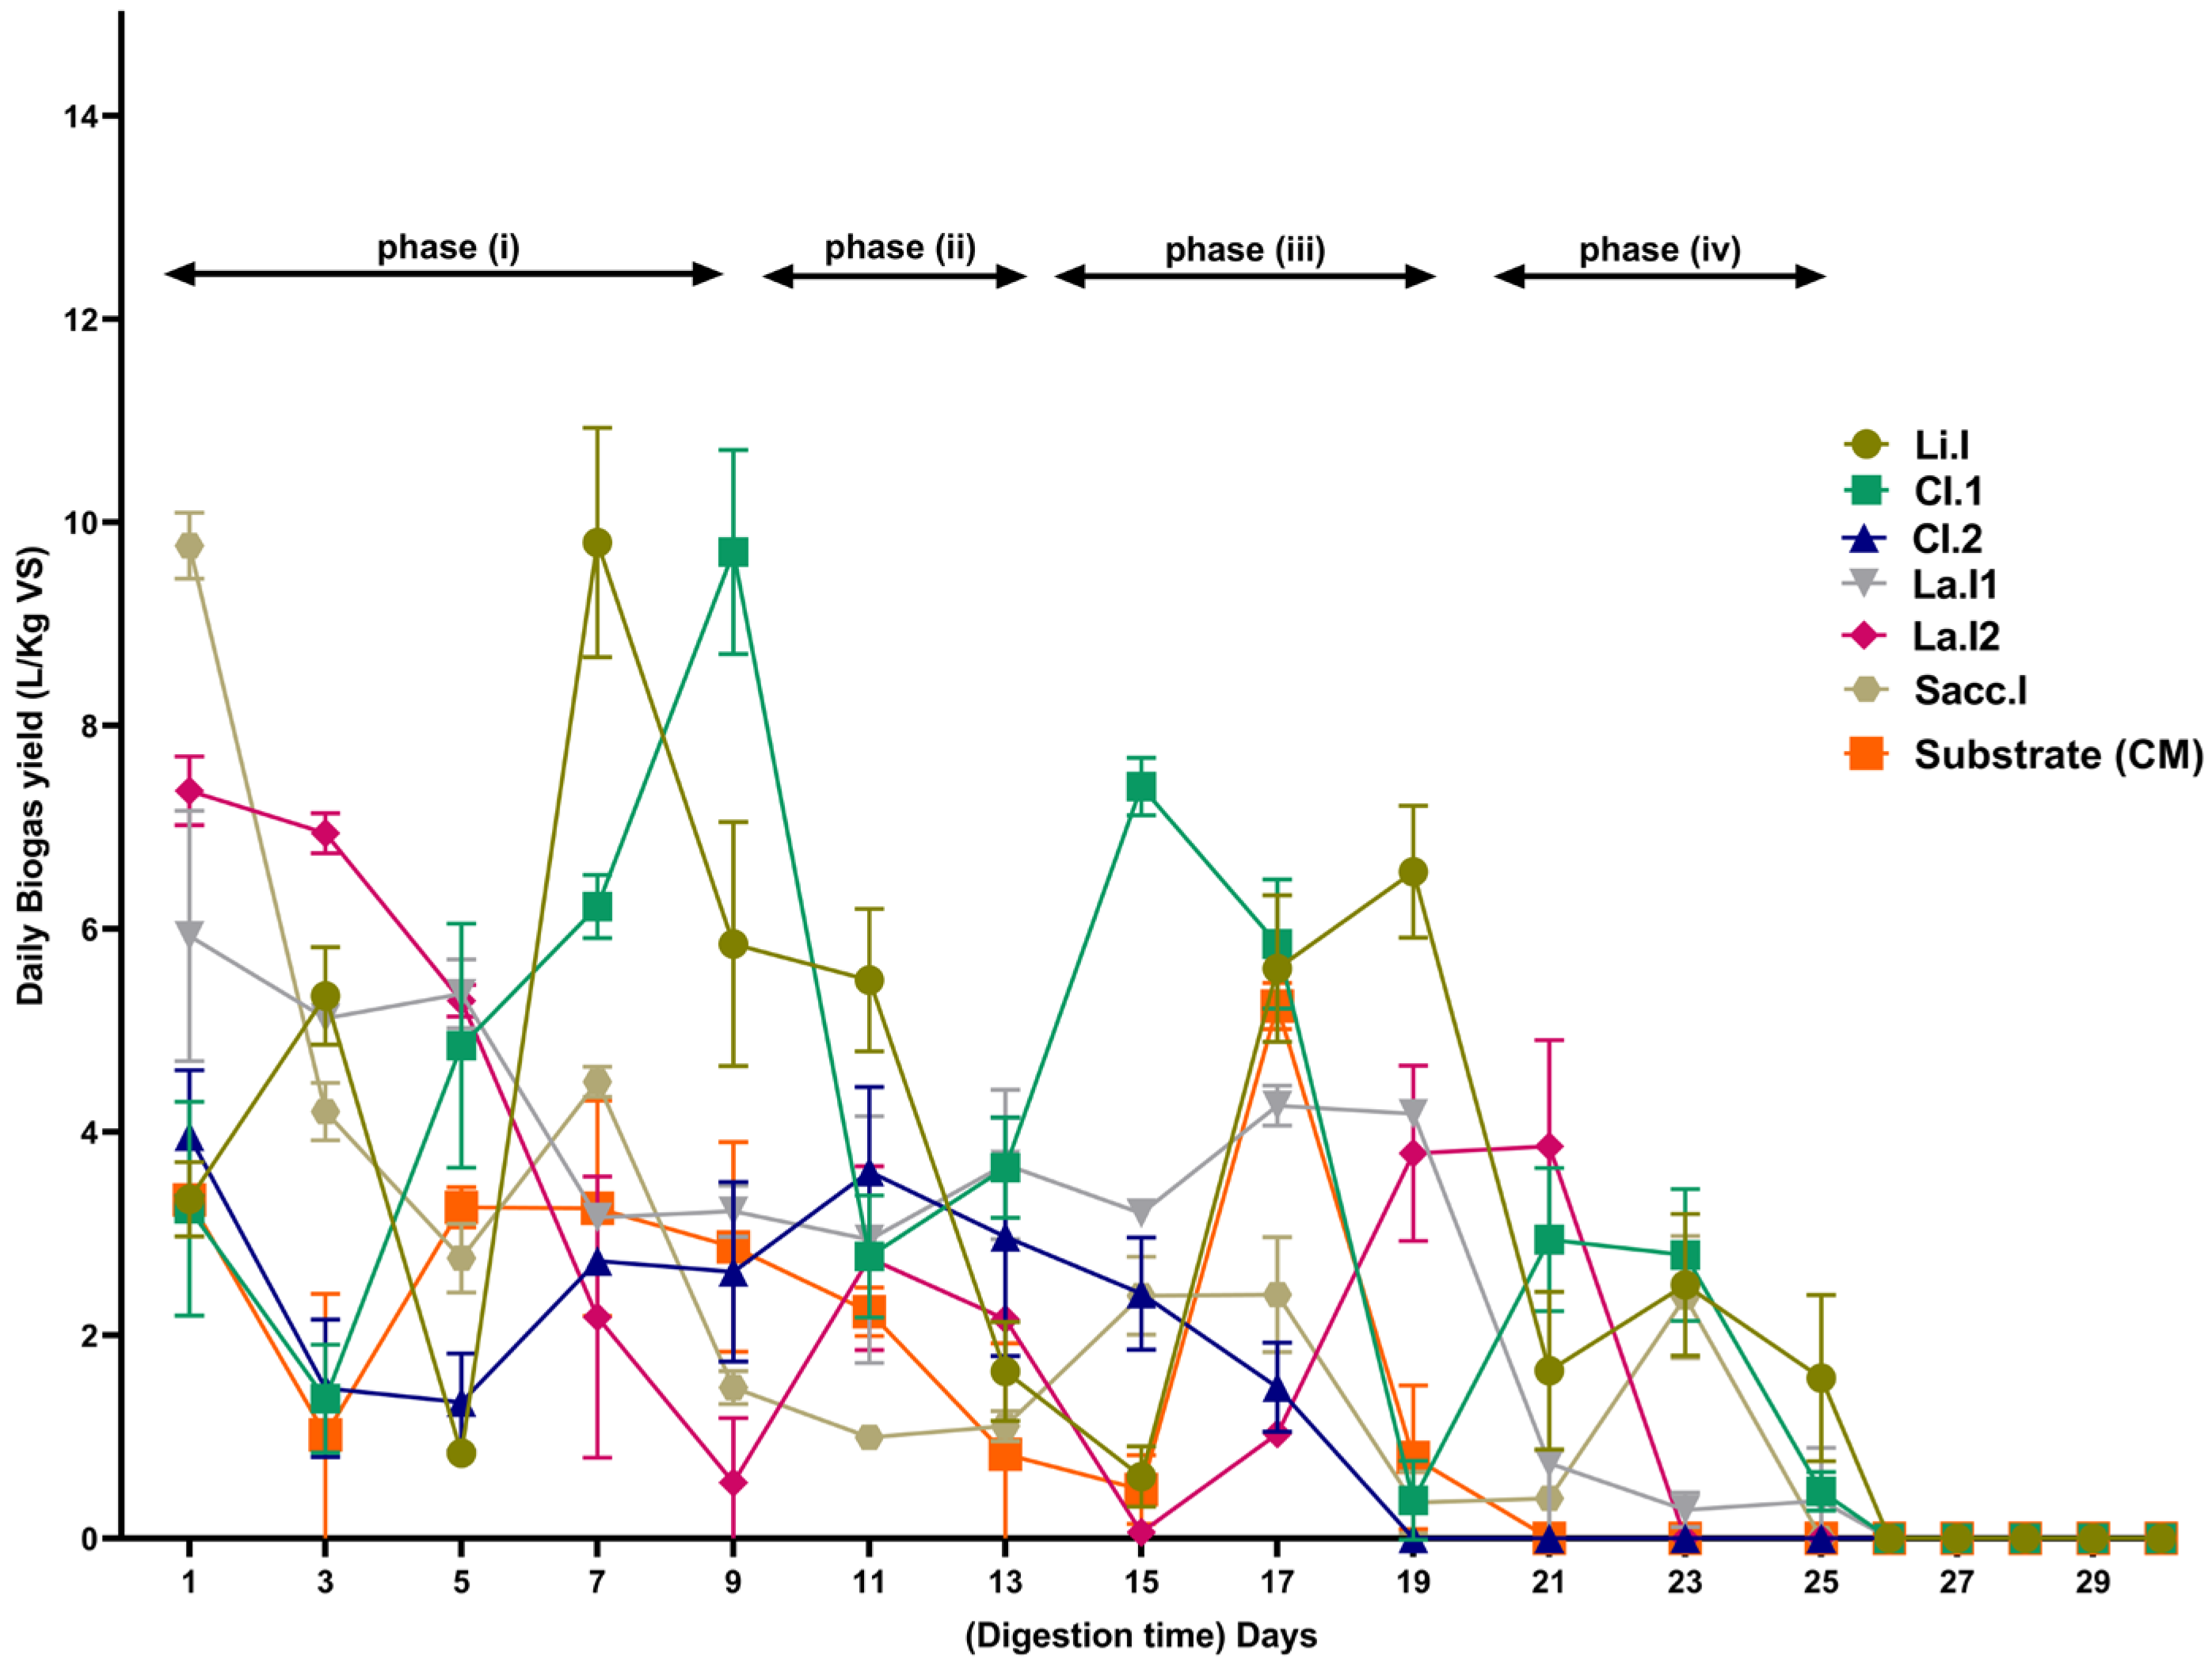
3.4.1. Daily Monitoring of Biogas Production

BMP assays were conducted in this study to determine the maximum biogas yield of the substrate in AD reactors. Additionally, BMP was used to measure the daily biogas yield (DBY) from the AD of cattle manure (CM) and with various inocula assessed in the study over 25 days. To assess the actual effect of the inoculum on the biogas production of the feedstock (CM), the biogas volume results presented in Figure 2 were derived by subtracting the total production (inoculum + CM) from the production volume of the inoculum alone and expressed as L·Kg−1 VS. The obtained results showed that DBY could be divided into four main phases: (i) the exponential phase of continuous daily production; (ii) the phase of production decrease in almost all experiments from the 10th to the 14th day; (iii) the phase of boosting biogas production to reach maximum values before substrate exhaustion; and (iv) the end of the production phase. The maximum values of daily biogas production of CM without any addition of inoculum were 5.81 L·Kg−1 VS on the 17th day. High quantities of DBY were obtained in LI, C.I1, and Sacc.I inocula with 9.8, 9.71, and 9.7 L·Kg−1 VS, respectively. Finding a positive relationship between BMP and lipid content confirms that the presence of LI.1 inoculum rich in lipidic matter in the digester had a very strong effect on the biogas potential [53]. The obtained results also showed an association between the highest and lowest VS/TS ratios and maximum and minimum biogas production, respectively. This indicates a positive correlation between VS/TS ratios and the volume of biogas produced. The highest daily gas production volumes were obtained in experiments with the cellulosic inoculum, which could contain sufficiently active and adapted consortiums, explaining the biodegradability of this material [33,54].
Fluctuations in production at the beginning of the process were observed in almost all trials and were explained by the emission of volatile fatty acids [4,44]. The drop in COD in the digester over time (Table 3) indicated a reduction in organic load, which led to microbial decomposition and consumption of organic waste, resulting in high BP. The results indicated that a strong reduction in COD (Table 3) leads to a better BP.

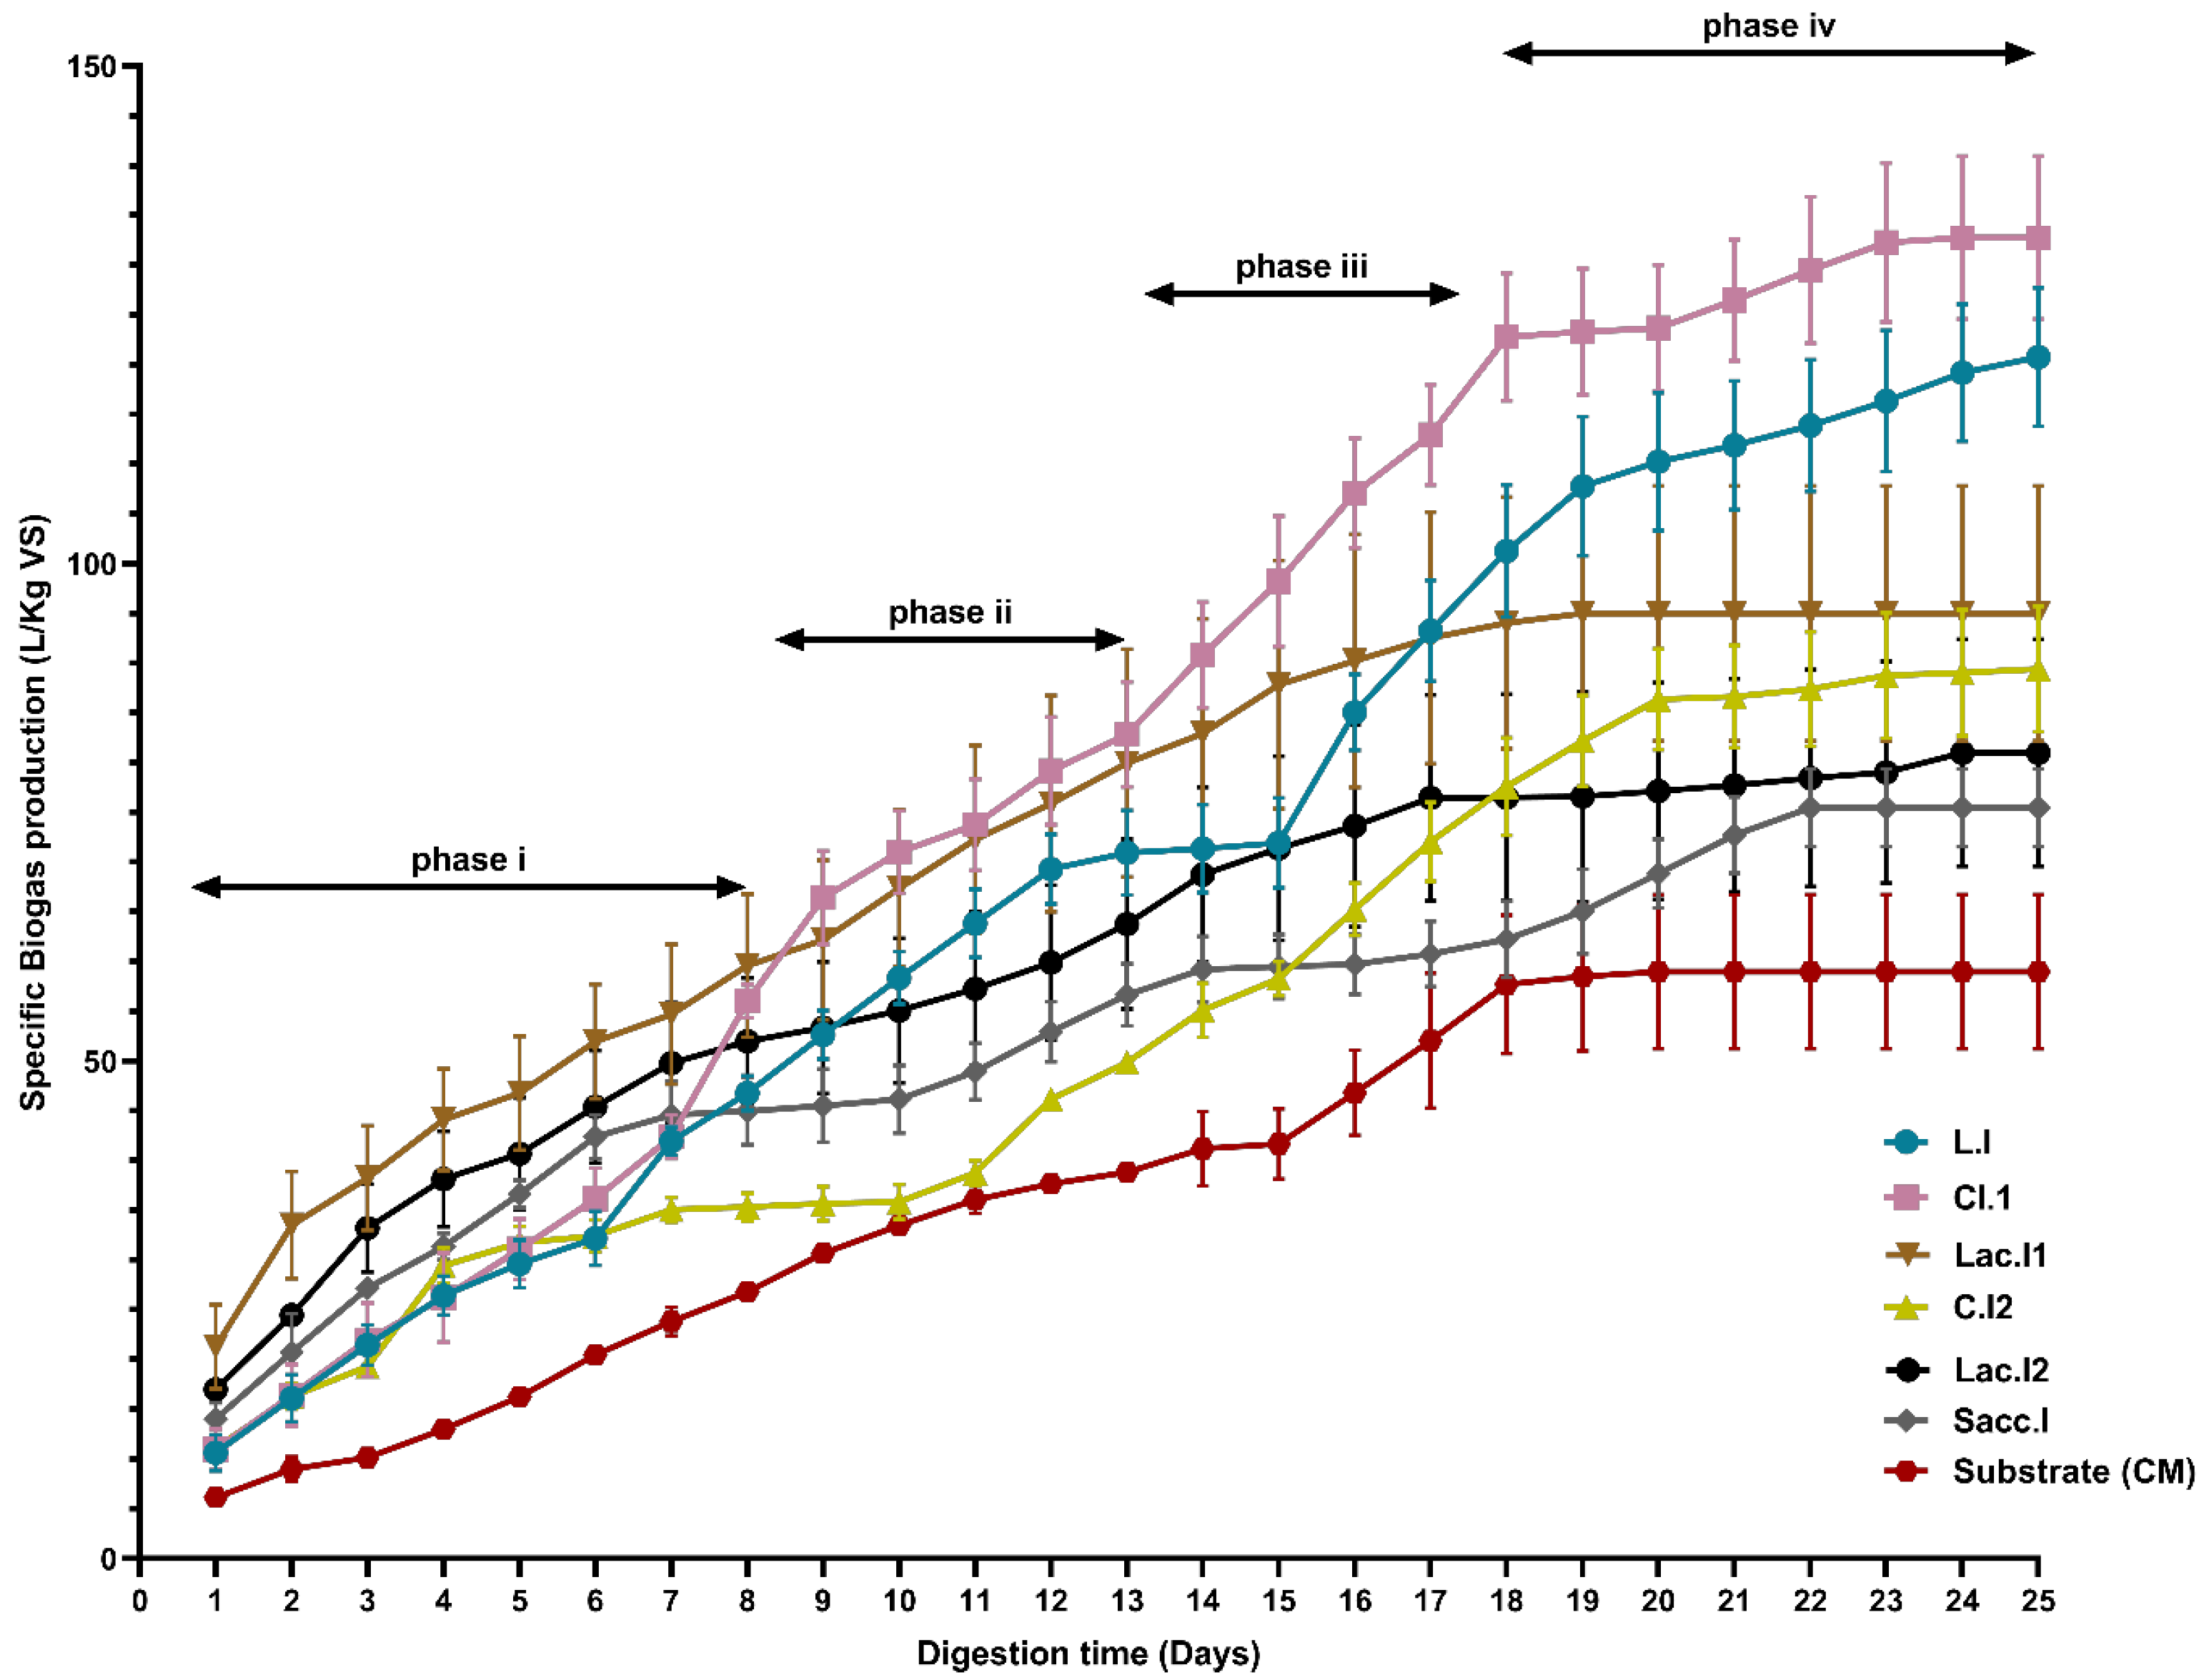
3.4.2. Cumulative Biogas Yield of Different BMP Experiments

In this study, the cumulative biogas yield (CBY) of different BMP assays using multiple types of inocula and CM was determined (Figure 3). Even though CM is considered the most active type of substrate since it contains a high number of active acetogenic and methanogenic bacteria [55,56], the results revealed a minimum cumulative production of 63.47 ± 4.52 L·Kg−1 VS of biogas over 25 days for the CM alone compared with other digestion experiments. The highest CBY was observed in the digesters where the inocula C.I1, Li.I, and La.I1 were added to CM with cumulative production of 132.74 ± 5.14, 120.75 ± 6.23, and 95.65 ± 8.45 L·Kg−1 VS of biogas, respectively. Lower yields of 89.4 ± 1.98, 75.47 ± 2.11, and 58.98 ± 1.23 L·Kg−1 VS of biogas were obtained in the experiments with the inocula C.I2, La.I2, and Sacc.I, respectively (Figure 3).
Furthermore, biogas yield using the C.I1 inoculum was 2.09 times higher than that of CM assays alone. Figure 3 shows that the first phase of BP in the laboratory digesters was exponential with rapid biogas production, which was due to the conversion of volatile fatty acids by acetoclastic methanogenesis to CO2 and CH4 [57]. The second phase is a stabilization step, where the BP yield was very slow for 4–6 days in most digestion experiments. After this stabilization step, the BP restarted and reached maximum values (phase iii) before the total process ended. The reduction of BP during this phase may be due to the reduction in TS, which leads to a decrease in microbial activity [48].

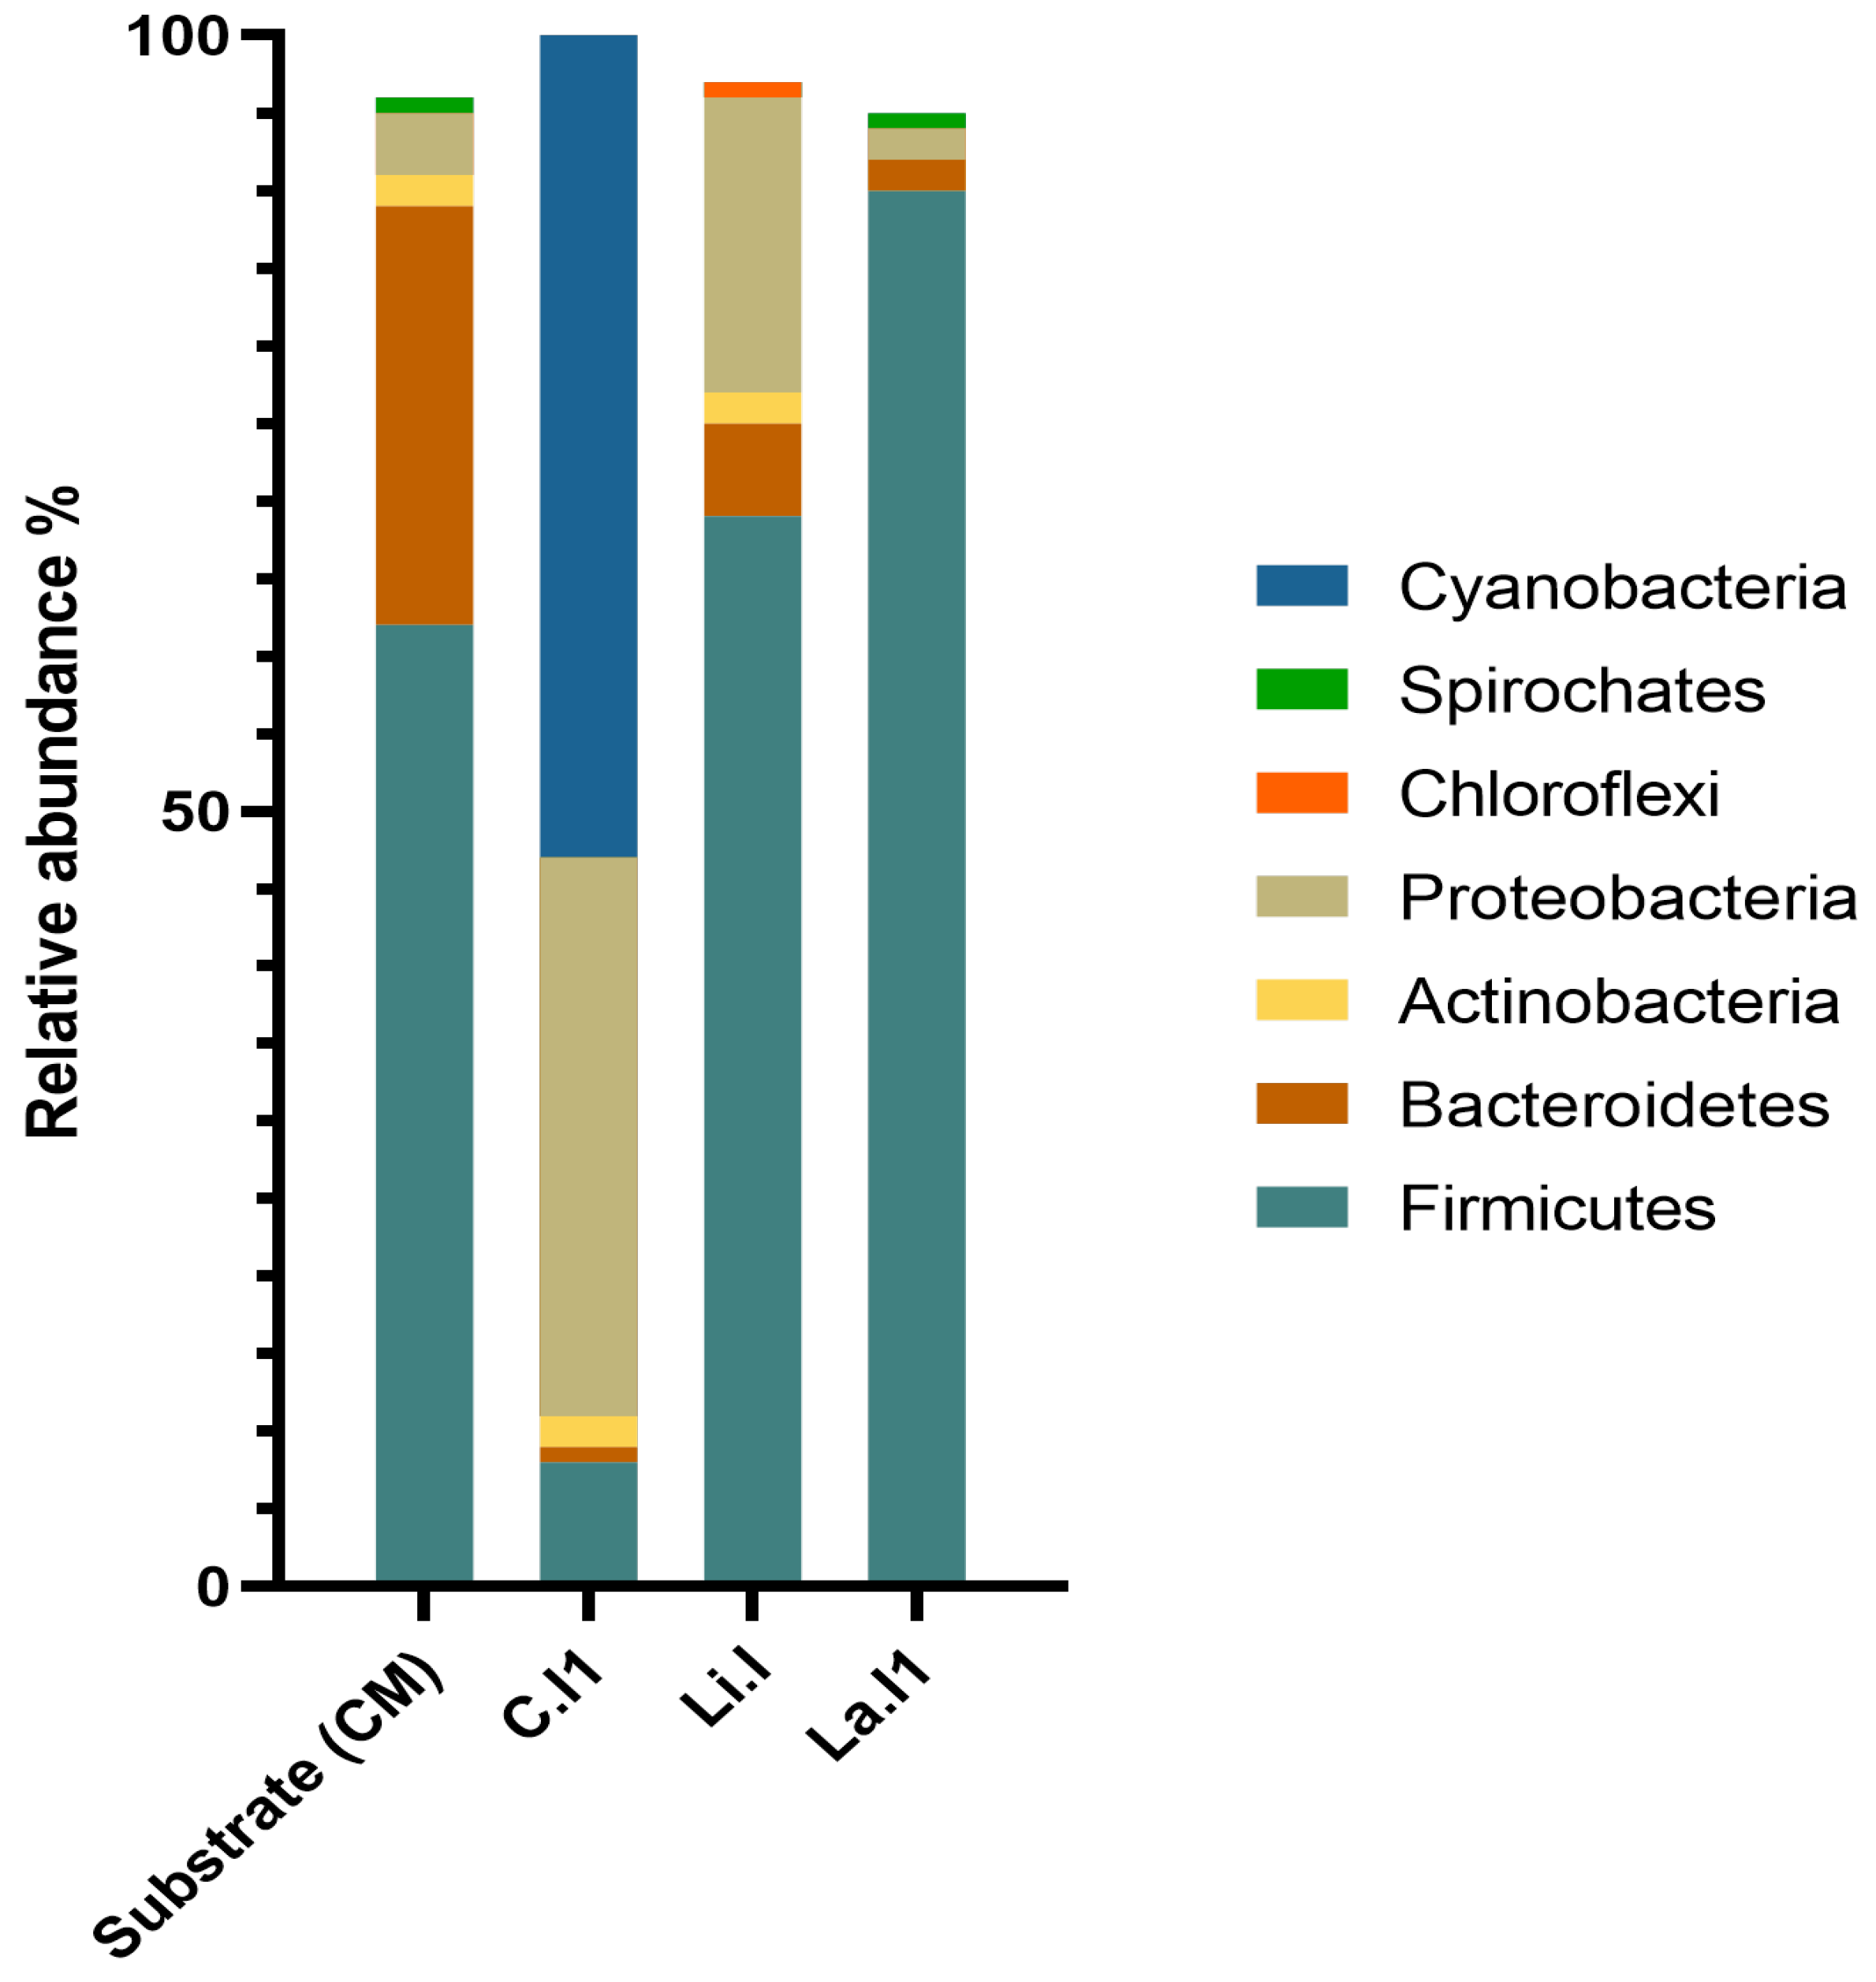
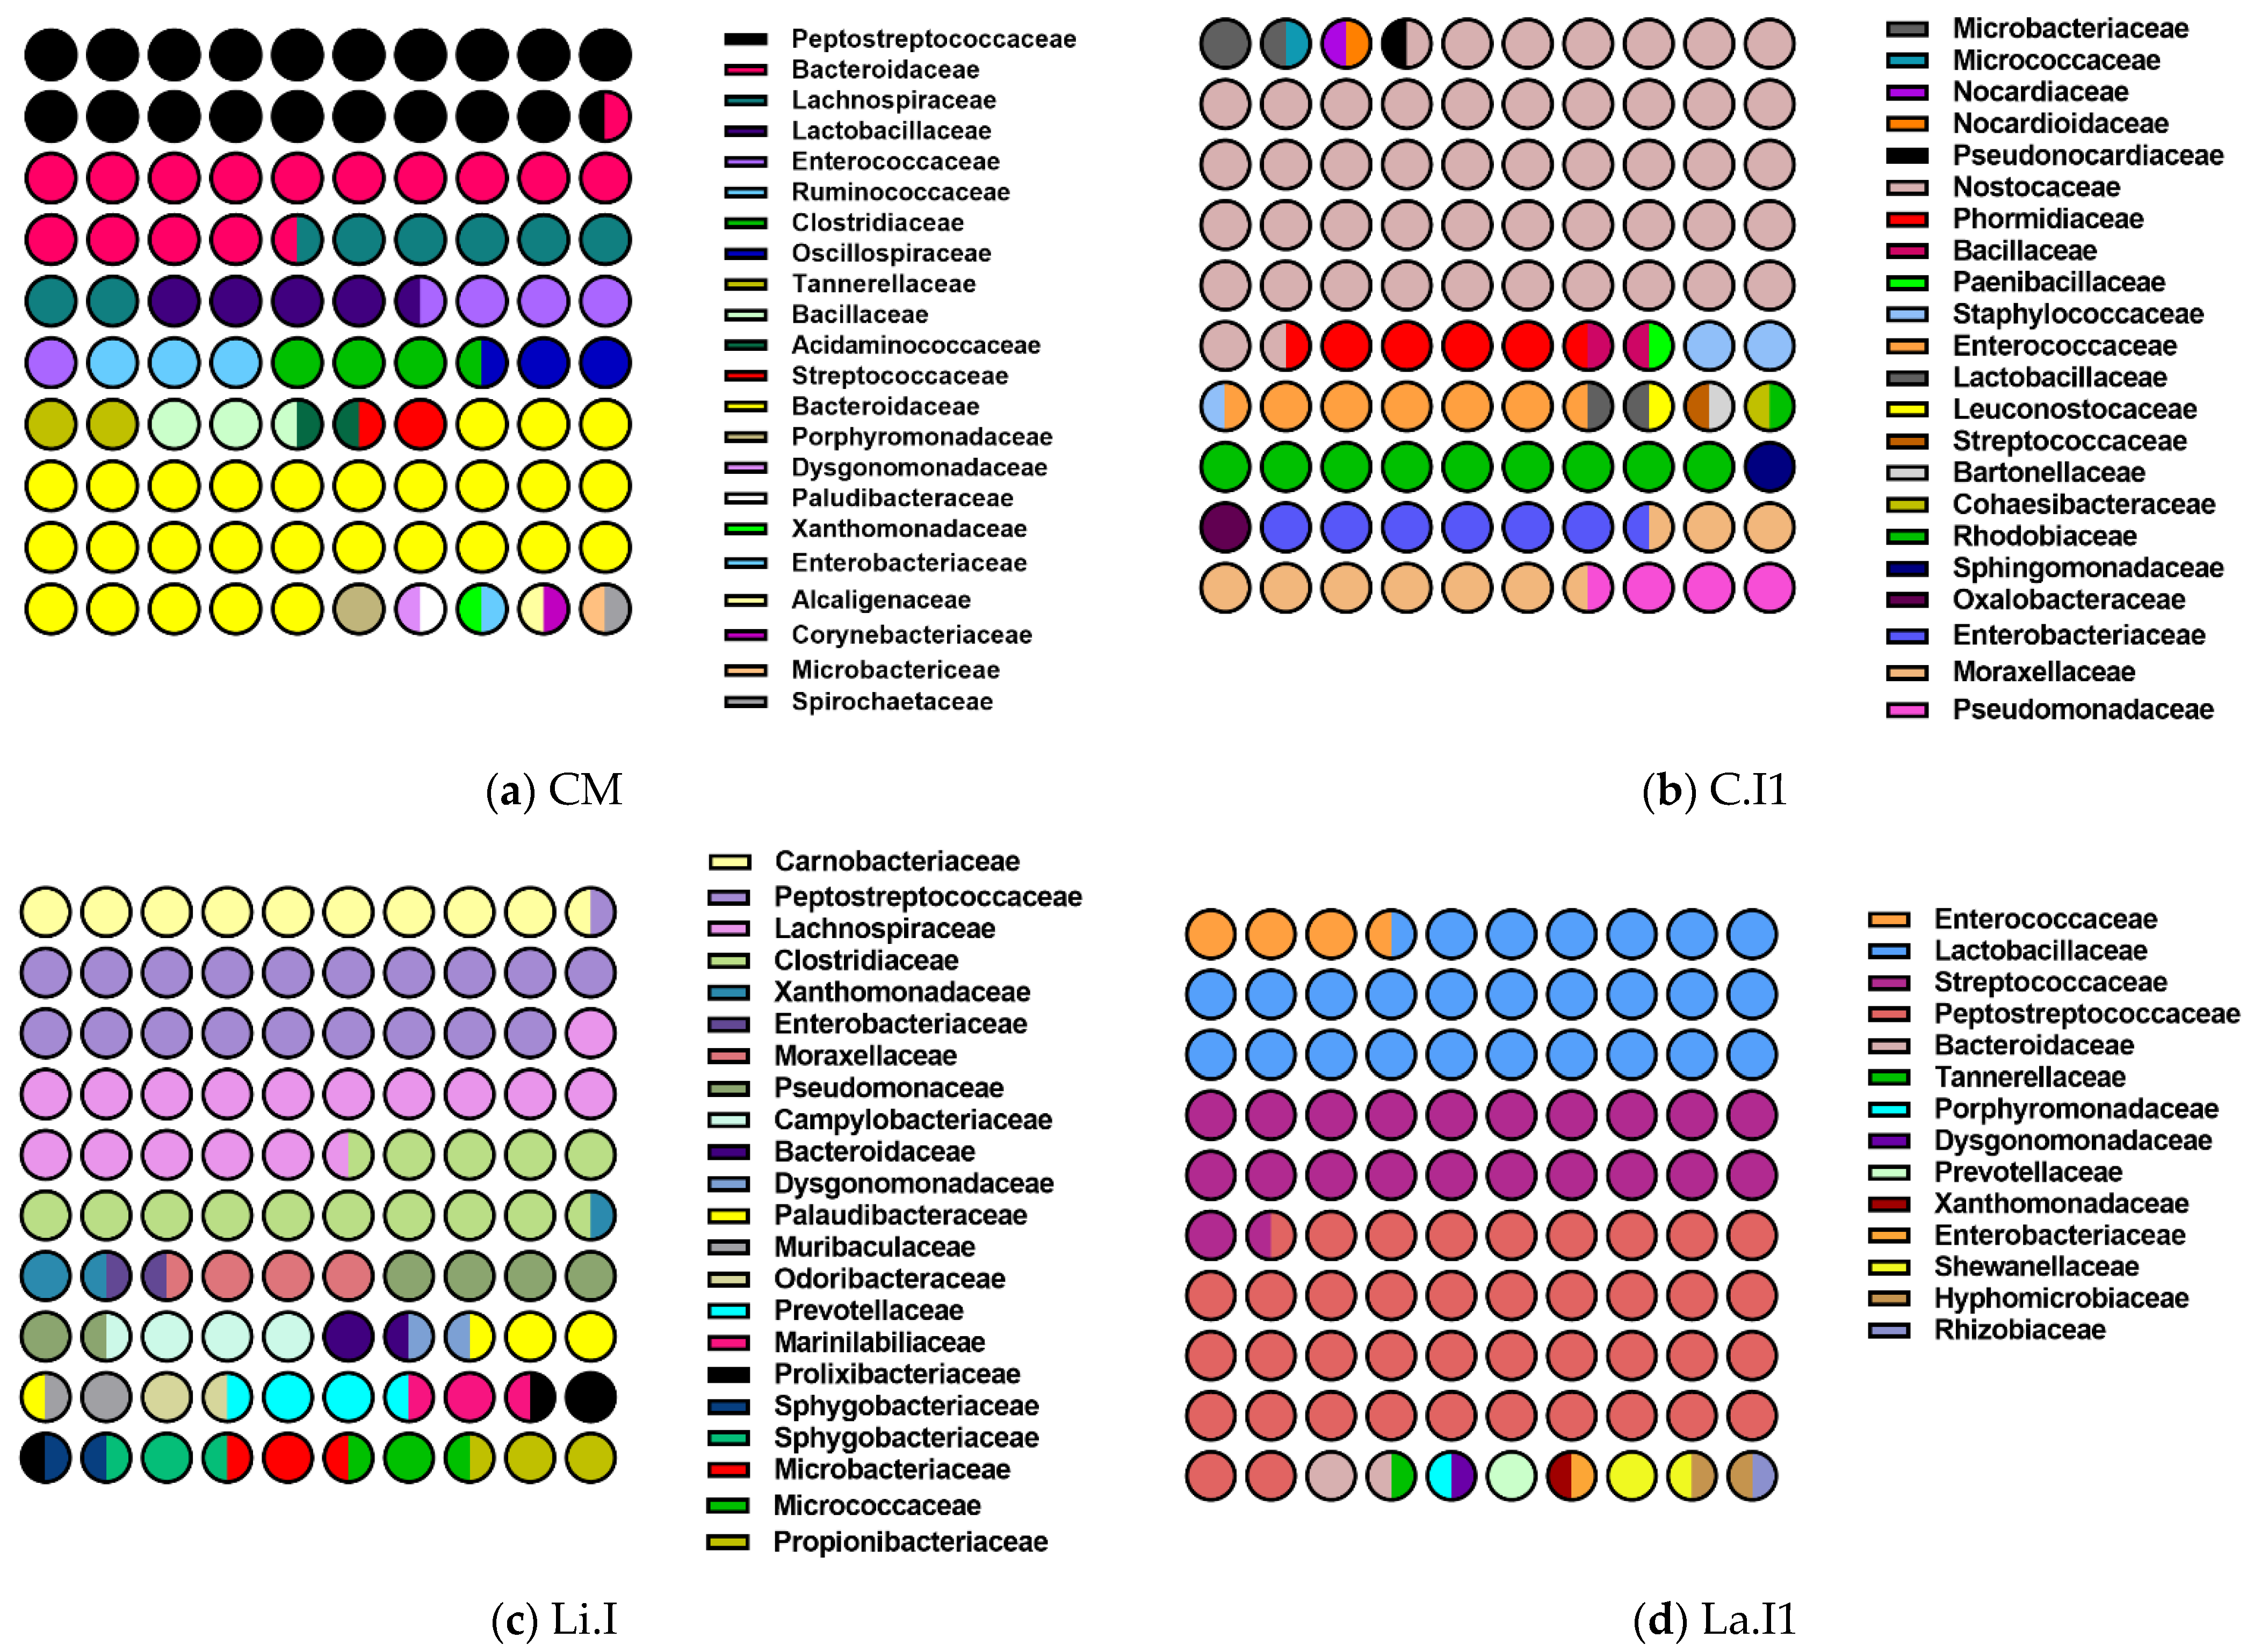
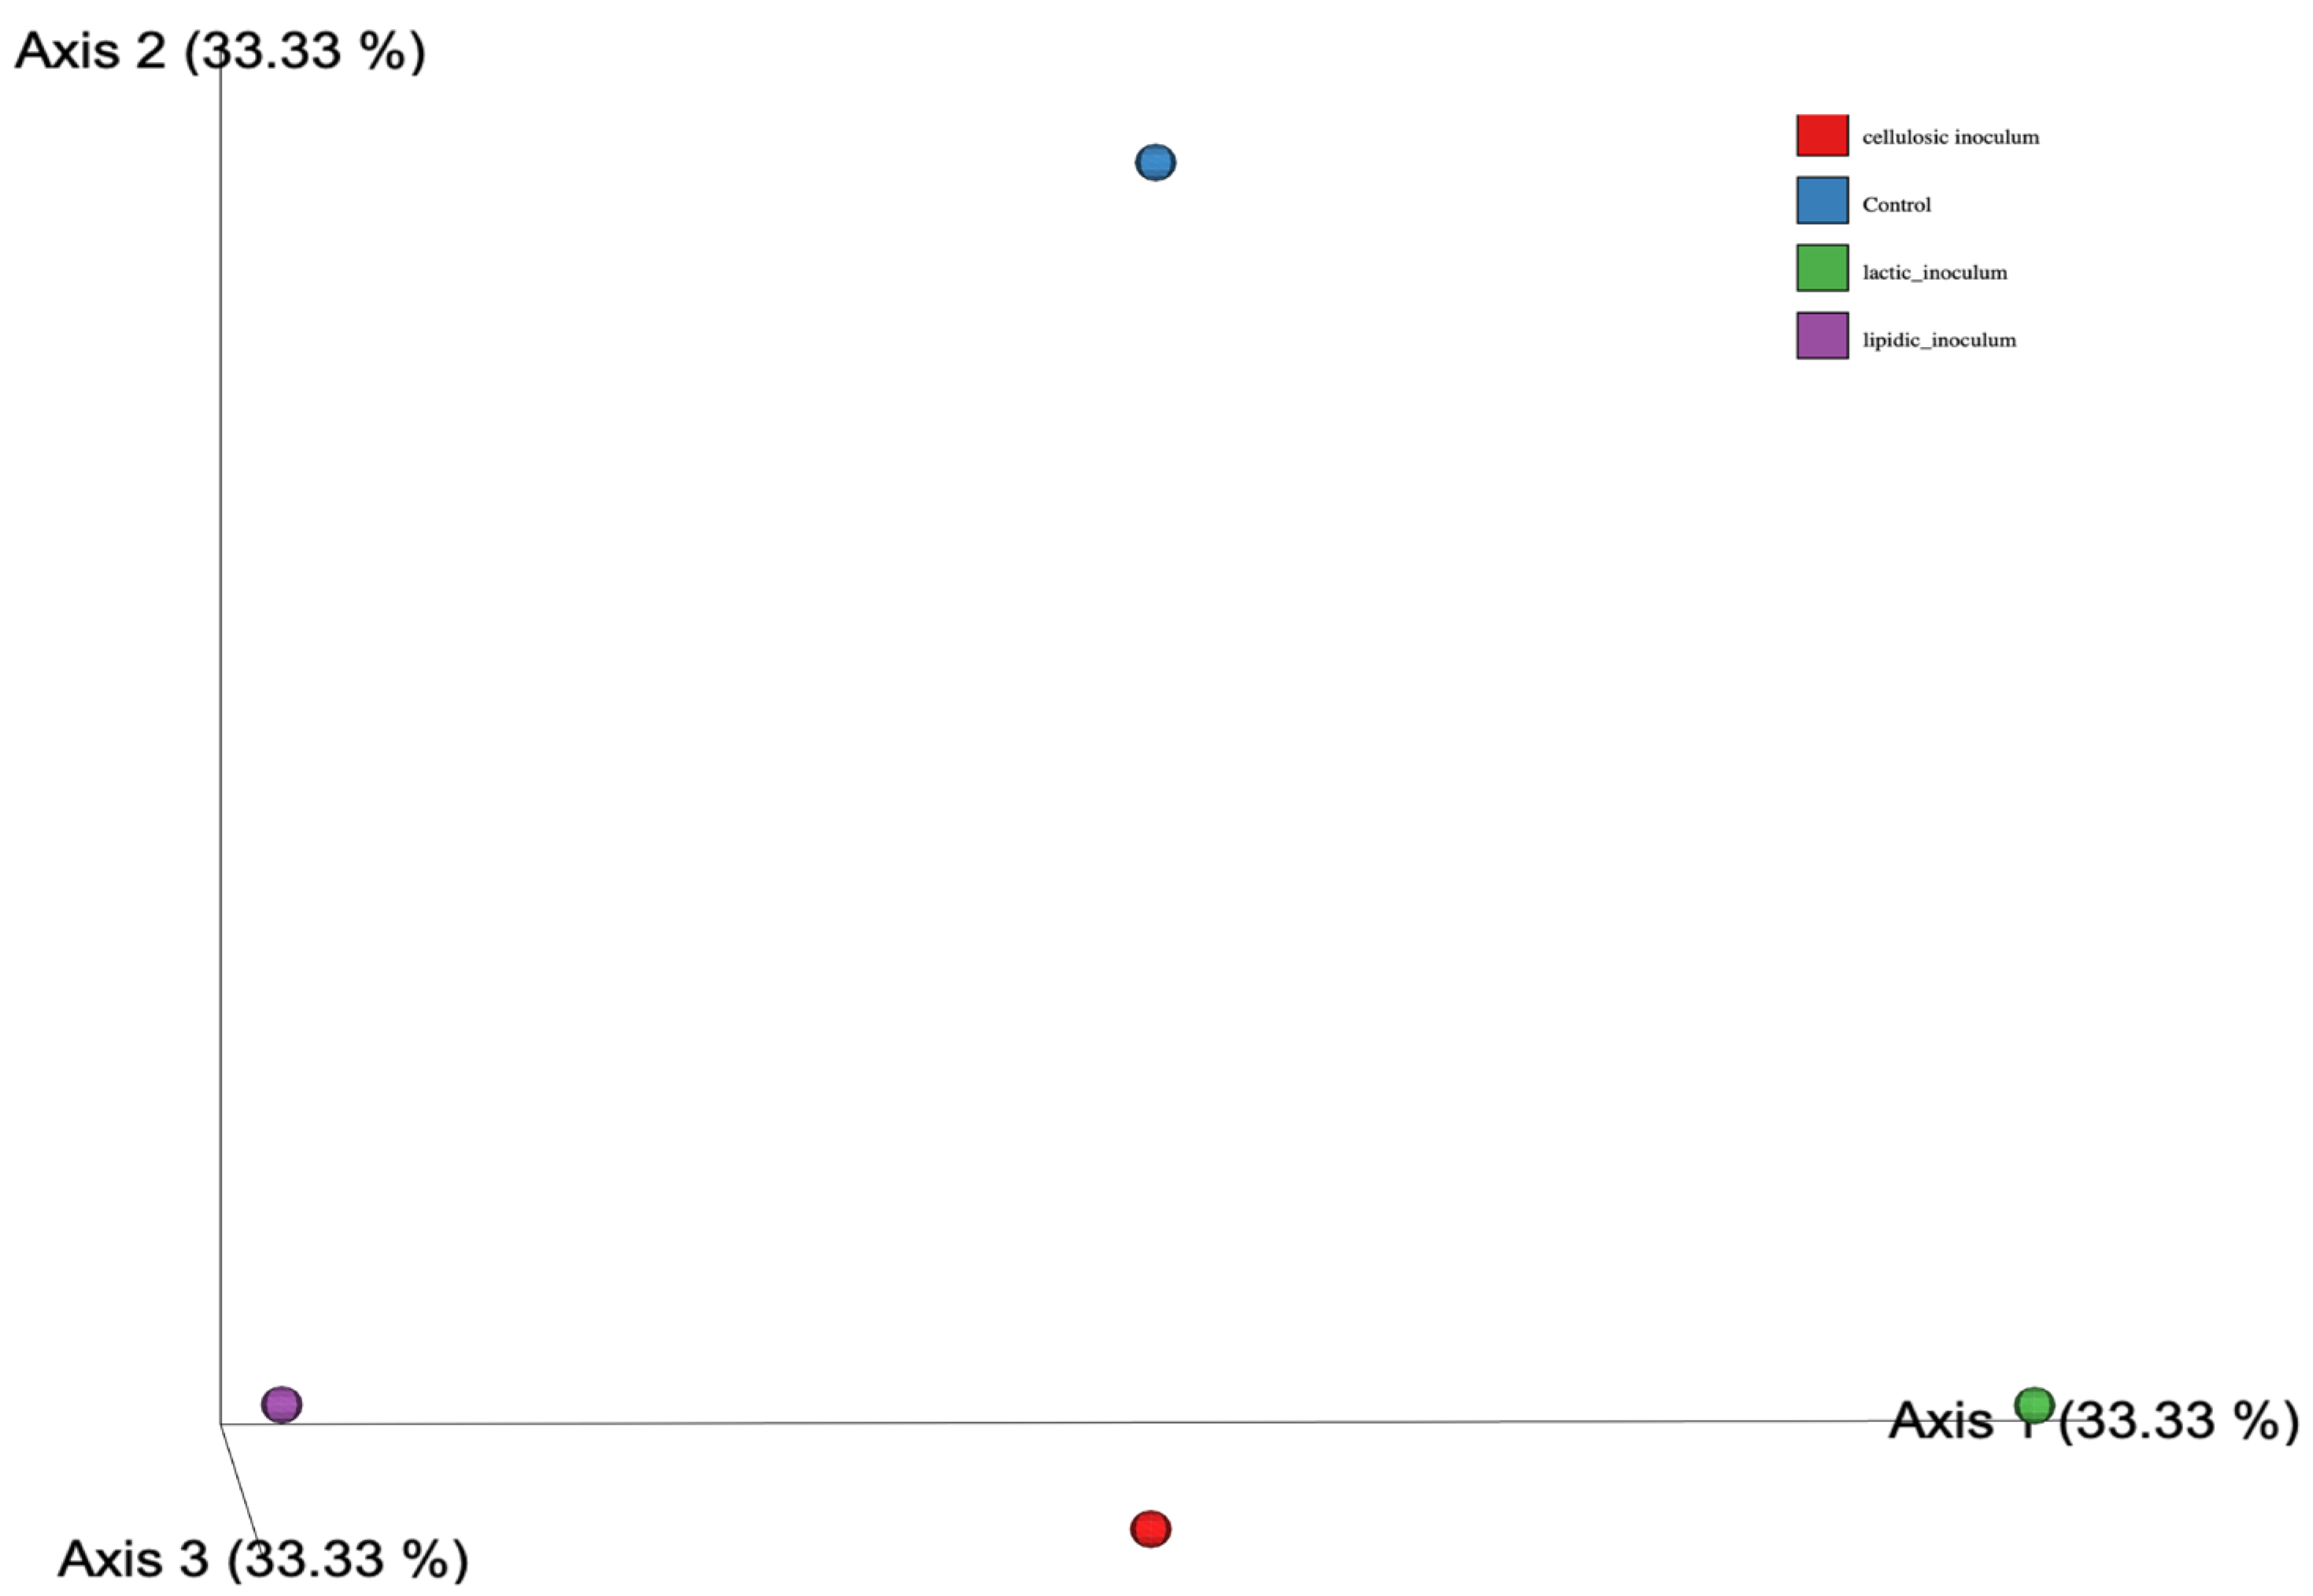
3.5. 16S rRNA Sequencing Analysis of Bacterial Compositions

In this study, 16S rRNA metagenomic analysis was performed on the CM substrate and on the three best inocula experiments that showed maximum BP. MinION sequencing experiments produced more than 7.0 Gb of reads from the four analyzed samples. The composition at the phylum level is presented in Figure 4. The classification analysis revealed that about 98.64% of the sequences were attributed to bacteria, while 1.34% were archaea using the WIMP workflow and Qiime2 analysis. Bacteroidetes, Firmicutes, Proteobacteria, and Actinobacteria were identified as the main bacterial phyla in all samples. These results are in accordance with those obtained in some previous studies. However, the relative abundances of these phyla in each sample were different. The data from the CM sample revealed two dominant phyla: Firmicutes and Bacteroidetes. However, in the used inocula, Firmicutes were found to be dominant in Li.I and La.I1, while Proteobacteria were dominant in C.I1, and Spirochaetes were the least abundant phylum in the analyzed samples (Figure 4). A slight relative abundance of Chloroflexi (0.18%) in Li.I inoculum was noticed, which was specific to this type of inoculum. The fundamental role of these phyla is essential to start the AD process [58], and they are also involved in the hydrogenesis phase, which represents the first degradation of organic matter [36,59]. Firmicutes are well-known fermenters and syntrophic bacteria that can degrade various substrates [60,61]. The relative abundances of Firmicutes were 8.29, 23.50, 69.74, and 47.75% in the three inocula (C.I1), (Li.I), (La.I1), and CM, respectively. Although C.I1 revealed a lower frequency of Firmicutes abundance with an absence of the Clostridia class, for other inocula, these phyla engage in the hydrolysis of plant fibers [62,63].
The bacterial composition was completely different in all samples at the family level (Figure 5). Three families of Firmicutes were identified in all inocula and even in the organic waste (CM), namely Streptococcaceae, Lactobacillaceae, and Peptostreptococcaceae. Bacteroidetes is a very diverse phylum, presenting different relative abundances of 0.17%, 3.48%, 1.69%, and 19.13% in C.I1, Li.I, La1.I, and CM, respectively. The relative abundances of Bacteroidetes were higher in the CM (19.13%), while their lowest abundances were observed in the C.I1 inoculum (0.17%). These results are in accordance with previous studies [64,65]. This class is considered a very influential group, able to perform metabolic activities such as polysaccharide and protein hydrolysis, fermentation of sugars, and production of volatile fatty acids [60,66]. Members of this phylum also participate in the hydrolysis and acidogenesis phases, producing CO2 and H2 in the AD process [67]. The monomers resulting from hydrolysis and the dissolved compounds serve as substrates for these families of fermentative bacteria. This degrades them mainly into low molecular weight acids such as volatile fatty acids (VFAs) such as propionate, butyrate, valerate, etc. [68].
According to the results, two examples can indicate the difference in bacterial cocktails found in the three inocula: first, Cyanobacteria represented more than 50% of the C.I1 inoculum, and second, the richness of Lactobacillaceae was observed in the La.I1 inoculum. Using the Jaccard distance matrix, the beta diversity analysis presented in Figure 6 showed that there were statistically different types of bacteria in each sample. Consequently, the performance differences of adding these inocula to the CM in terms of anaerobic digestion and BP could be explained by this diverse bacterial composition, with some unique taxa specified for some inocula. This study clearly showed that the use of inocula in AD had an important role in the process performance because of its bacterial community contribution. Previous studies also showed that inocula affected the BP from organic wastes in batch experiments [32,58]. Our study showed that the bacterial community recovered in inocula was different from that found in the CM substrate (Figure 6). This indicates the contribution of adding inocula to the anaerobic digestion of organic wastes. The bacterial composition of inoculum C.I1 specifically showed the occurrence of cyanobacteria with the highest relative abundance, belonging mainly to the class Nostocophycidae with 38.40%. The specific occurrence of this taxon in this inoculum may be involved in the increase in BP. However, further studies are needed to understand the role of this phylum in anaerobic digestion.

4. Conclusions

This study demonstrates that adding inocula to the anaerobic digestion (AD) process of cattle manure has a significant impact on its performance. The C.I1 inoculum, which had a cellulosic composition and was compatible with the type of agricultural waste used, exhibited the best methanogenic potential and allowed the production of significant quantities of biogas, reaching 132.74 ± 5.14 L·kg−1 VS within 25 days. The bacterial community profiles characterized by a culture-independent approach using a nanopore 16S rDNA sequencing workflow indicated differences in the bacterial load that characterized each inoculum and substrate. The most abundant bacterial phyla in the samples were Firmicutes, Bacteroidetes, Proteobacteria, and Actinobacteria. The analysis of C.I1 revealed specific abundances of Cyanobacteria, and the role of the latter on the performance of this inoculum in the AD process needs further investigation.
Further studies are required to validate these results in the scale-up of the optimization of the biogas plant. This study has established the application of a culture-independent approach based on sequencing to characterize the bacterial taxa delivered by different inocula to the digesters. However, additional research is required to comprehend the metabolic rate and time-dependent resilience of these taxa. To satisfy this requirement, future studies should examine digesters at the laboratory scale to monitor the variation in bacterial community abundances during the AD process.

Author Contributions

B.N.: performed the experiments, analyzed and interpreted the data, and wrote the paper. K.Y.: supervised the work and wrote the paper. S.E.A.: performed the experiments and contributed to the paper correction. F.Z.B.: supervised the work and provided the (C1.I) inoculum. M.A.: conceived and designed the experiments. I.M.K.: conceived and designed the experiments, and wrote the paper. All authors have read and agreed to the published version of the manuscript.

Funding

This work was funded by the Solar Energy and New Energies Research Institute under grant number: FAPPB. The funders had no role in the study design, data collection, analysis and interpretation of the data, the decision to publish, or the preparation of the manuscript.

Data Availability Statement

The sequencing datasets generated during the current study are available in the NCBI repository, under the Bioproject number PRJNA824285 available through the web link https://dataview.ncbi.nlm.nih.gov/object/PRJNA824285.

Acknowledgments

The authors gratefully acknowledge the support of the Solar Energy and New Energies Research Institute (IRESEN) and the Moroccan Foundation for Advanced Science, Innovation and Research (MAScIR). Special acknowledgments to the members of the Green Biotechnology Laboratory for their support during the accomplishment of experiments.

Conflicts of Interest

The authors declare no conflict of interest.

References

  1. Kumar, A.; Sah, B.; Singh, A.R.; Deng, Y.; He, X.; Kumar, P.; Bansal, R.C. A Review of Multi Criteria Decision Making (MCDM) towards Sustainable Renewable Energy Development. Renew. Sustain. Energy Rev. 2017, 69, 596–609. [Google Scholar] [CrossRef]
  2. Bouallagui, H.; Torrijos, M.; Godon, J.J.; Moletta, R.; Ben Cheikh, R.; Touhami, Y.; Delgenes, J.P.; Hamdi, M. Two-Phases Anaerobic Digestion of Fruit and Vegetable Wastes: Bioreactors Performance. Biochem. Eng. J. 2004, 21, 193–197. [Google Scholar] [CrossRef]
  3. Yao, Y.; Wei, Y.; An, L.; Zhou, J. Effect of Inoculum on Anaerobic Co-Digestion of Vegetable Processing Wastes and Cattle Manure at High Solids Concentration. Waste Biomass Valoriz. 2018, 9, 2091–2098. [Google Scholar] [CrossRef]
  4. Lahboubi, N.; Kerrou, O.; Karouach, F.; Bakraoui, M.; Schüch, A.; Schmedemann, K.; Stinner, W.; El Bari, H.; Essamri, A. Methane Production from Mesophilic Fed-Batch Anaerobic Digestion of Empty Fruit Bunch of Palm Tree. Biomass Convers. Biorefinery 2020, 12, 3751–3760. [Google Scholar] [CrossRef]
  5. Abbas, Y.; Yun, S.; Wang, Z.; Zhang, Y.; Zhang, X.; Wang, K. Recent Advances in Bio-Based Carbon Materials for Anaerobic Digestion: A Review. Renew. Sustain. Energy Rev. 2021, 135, 110378. [Google Scholar] [CrossRef]
  6. Wang, K.; Yun, S.; Xing, T.; Li, B.; Abbas, Y.; Liu, X. Binary and Ternary Trace Elements to Enhance Anaerobic Digestion of Cattle Manure: Focusing on Kinetic Models for Biogas Production and Digestate Utilization. Bioresour. Technol. 2021, 323, 124571. [Google Scholar] [CrossRef]
  7. Wu, D.; Li, L.; Zhao, X.; Peng, Y.; Yang, P.; Peng, X. Anaerobic Digestion: A Review on Process Monitoring. Renew. Sustain. Energy Rev. 2019, 103, 1–12. [Google Scholar] [CrossRef]
  8. Kowalczyk-Juśko, A. Agricultural Biogas—Characteristics, Substrates and Its Use. Siln. Spalinowe 2012, 51, 148. [Google Scholar]
  9. Dahlgren, S.; Dahlgren, S. Biogas-Based Fuels as Renewable Energy in the Transport Sector: An Overview of the Potential of Using CBG, LBG and Other Vehicle Fuels Produced from Biogas from Biogas. Biofuels 2022, 13, 587–599. [Google Scholar] [CrossRef]
  10. Alatriste-Mondragón, F.; Samar, P.; Cox, H.H.J.; Ahring, B.K.; Iranpour, R. Anaerobic Codigestion of Municipal, Farm, and Industrial Organic Wastes: A Survey of Recent Literature. Water Environ. Res. 2006, 78, 607–636. [Google Scholar] [CrossRef]
  11. Coarita Fernandez, H.; Teixeira Franco, R.; Bayard, R.; Buffiere, P. Mechanical Pre-Treatments Evaluation of Cattle Manure Before Anaerobic Digestion. Waste Biomass Valoriz. 2020, 11, 5175–5184. [Google Scholar] [CrossRef]
  12. Romero-Güiza, M.S.; Vila, J.; Mata-Alvarez, J.; Chimenos, J.M.; Astals, S. The Role of Additives on Anaerobic Digestion: A Review. Renew. Sustain. Energy Rev. 2016, 58, 1486–1499. [Google Scholar] [CrossRef]
  13. Ghaleb, A.A.S.; Kutty, S.R.M.; Ho, Y.C.; Jagaba, A.H.; Noor, A.; Al-Sabaeei, A.M.; Almahbashi, N.M.Y. Response Surface Methodology to Optimize Methane Production from Mesophilic Anaerobic Co-Digestion of Oily-Biological Sludge and Sugarcane Bagasse. Sustainability 2020, 12, 2116. [Google Scholar] [CrossRef] [Green Version]
  14. Szilágyi, Á.; Bodor, A.; Tolvai, N.; Kovács, K.L.; Bodai, L.; Wirth, R.; Bagi, Z.; Szepesi, Á.; Markó, V.; Kakuk, B.; et al. A Comparative Analysis of Biogas Production from Tomato Bio-Waste in Mesophilic Batch and Continuous Anaerobic Digestion Systems. PLoS ONE 2021, 16, e0248654. [Google Scholar] [CrossRef]
  15. Rodríguez, E.; García-Encina, P.A.; Stams, A.J.M.; Maphosa, F.; Sousa, D.Z. Meta-Omics Approaches to Understand and Improve Wastewater Treatment Systems. Rev. Environ. Sci. Biotechnol. 2015, 14, 385–406. [Google Scholar] [CrossRef]
  16. Carabeo-Pérez, A.; Guerra-Rivera, G.; Ramos-Leal, M.; Jiménez-Hernández, J. Metagenomic Approaches: Effective Tools for Monitoring the Structure and Functionality of Microbiomes in Anaerobic Digestion Systems. Appl. Microbiol. Biotechnol. 2019, 103, 9379–9390. [Google Scholar]
  17. Kim, N.-K.; Lee, S.-H.; Kim, Y.; Park, H.-D. Current Understanding and Perspectives in Anaerobic Digestion Based on Genome-Resolved Metagenomic Approaches. Bioresour. Technol. 2022, 344, 126350. [Google Scholar] [CrossRef] [PubMed]
  18. Stolze, Y.; Zakrzewski, M.; Maus, I.; Eikmeyer, F.; Jaenicke, S.; Rottmann, N.; Siebner, C.; Pühler, A.; Schlüter, A. Comparative Metagenomics of Biogas-Producing Microbial Communities from Production-Scale Biogas Plants Operating under Wet or Dry Fermentation Conditions. Biotechnol. Biofuels 2015, 8, 14. [Google Scholar] [CrossRef] [PubMed] [Green Version]
  19. Wang, P.; Wang, H.; Qiu, Y.; Ren, L.; Jiang, B. Microbial Characteristics in Anaerobic Digestion Process of Food Waste for Methane Production—A Review. Bioresour. Technol. 2018, 248, 29–36. [Google Scholar] [CrossRef]
  20. Wang, H.; Fotidis, I.A.; Yan, Q.; Angelidaki, I. Feeding Strategies of Continuous Biomethanation Processes during Increasing Organic Loading with Lipids or Glucose for Avoiding Potential Inhibition. Bioresour. Technol. 2021, 327, 124812. [Google Scholar] [CrossRef]
  21. ISO 11734; Water Quality—Evaluation of the Anaerobic Biodegradability of Organic Compounds in Digested Sludge—Method by Measurement of the Biogas Production, ISO Guideline 11734. European Committee for Standardization: Brussels, Belgium, 1995.
  22. VDI 4630; Fermentation of Organic Materials—Characterisation of the Substrate, Sampling, Collection of Material Data, Fermentation Tests, VDI Guideline 4630. Verlag des Vereins Deutscher: Düsseldorf, Germany, 2006.
  23. Bligh, E.G.; Dyer, W.J. A Rapid Method of Total Lipid Extraction and Purification. Can. J. Biochem. Physiol. 1959, 37, 911–917. [Google Scholar] [CrossRef]
  24. Dubois, M.; Dang, T.T.; Berrin, J.G.; Haltrich, D.; To, K.A.; Sigoillot, J.C.; Yamabhai, M. Cloning, Expression in Pichia Pastoris, and Characterization of a Thermostable GH5 Mannan Endo-1,4-Beta-Mannosidase from Aspergillus Niger BK01. Microb. Cell Fact. 1956, 8, 59. [Google Scholar] [CrossRef]
  25. Marion, M.; Bradford, Z.; Siadat, S.A.; Bakhshandeh, A.; Ghasemi Pirbalouti, A.; Hashemi, M. Interactive Effects of Drought Stress and Chitosan Application on Physiological Characteristics and Essential Oil Yield of Thymus Daenensis Celak. Crop J. 1976, 5, 407–415. [Google Scholar] [CrossRef]
  26. APHA Part 3000 Metals; 3111 Metals by Flame Atomic Absorption Spectrometry. 3111 B Direct Air—Acetylene Flame Method. Standard Methods for the Examination of Water and Wastewater. American Public Health Association: Washington, DC, USA, 1992; pp. 3–104.
  27. Brandt, C.; Bongcam-Rudloff, E.; Müller, B. Abundance Tracking by Long-Read Nanopore Sequencing of Complex Microbial Communities in Samples from 20 Different Biogas/Wastewater Plants. Appl. Sci. 2020, 10, 7518. [Google Scholar] [CrossRef]
  28. Vázquez-Baeza, Y.; Pirrung, M.; Gonzalez, A.; Knight, R. EMPeror: A Tool for Visualizing High-Throughput Microbial Community Data. Gigascience 2013, 2, 2–5. [Google Scholar] [CrossRef] [Green Version]
  29. Elango, D.; Pulikesi, M.; Baskaralingam, P.; Ramamurthi, V.; Sivanesan, S. Production of Biogas from Municipal Solid Waste with Domestic Sewage. J. Hazard. Mater. 2007, 141, 301–304. [Google Scholar] [CrossRef] [PubMed]
  30. Elsayed, M.; Diab, A.; Soliman, M. Methane Production from Anaerobic Co-Digestion of Sludge with Fruit and Vegetable Wastes: Effect of Mixing Ratio and Inoculum Type. Biomass Convers. Biorefinery 2021, 11, 989–998. [Google Scholar] [CrossRef]
  31. Wang, C.; Hong, F.; Lu, Y.; Li, X.; Liu, H. Improved Biogas Production and Biodegradation of Oilseed Rape Straw by Using Kitchen Waste and Duck Droppings as Co-Substrates in Two-Phase Anaerobic Digestion. PLoS ONE 2017, 12, e0182361. [Google Scholar] [CrossRef] [Green Version]
  32. Rico, C.; García, H.; Rico, J.L. Physical-Anaerobic-Chemical Process for Treatment of Dairy Cattle Manure. Bioresour. Technol. 2011, 102, 2143–2150. [Google Scholar] [CrossRef]
  33. Suhartini, S.; Nurika, I.; Paul, R.; Melville, L. Estimation of Biogas Production and the Emission Savings from Anaerobic Digestion of Fruit-Based Agro-Industrial Waste and Agricultural Crops Residues. Bioenergy Res. 2021, 14, 844–859. [Google Scholar] [CrossRef]
  34. Castrillón, L.; Marañón, E.; Fernández-Nava, Y.; Ormaechea, P.; Quiroga, G. Thermophilic Co-Digestion of Cattle Manure and Food Waste Supplemented with Crude Glycerin in Induced Bed Reactor (IBR). Bioresour. Technol. 2013, 136, 73–77. [Google Scholar] [CrossRef] [PubMed] [Green Version]
  35. Petersson, A.; Thomsen, M.H.; Hauggaard-Nielsen, H.; Thomsen, A.B. Potential Bioethanol and Biogas Production Using Lignocellulosic Biomass from Winter Rye, Oilseed Rape and Faba Bean. Biomass Bioenergy 2007, 31, 812–819. [Google Scholar] [CrossRef] [Green Version]
  36. Li, Y.; Feng, L.; Zhang, R.; He, Y.; Liu, X.; Xiao, X.; Ma, X.; Chen, C.; Liu, G. Influence of Inoculum Source and Pre-Incubation on Bio-Methane Potential of Chicken Manure and Corn Stover. Appl. Biochem. Biotechnol. 2013, 171, 117–127. [Google Scholar] [CrossRef] [PubMed]
  37. Dhamodharan, K.; Kumar, V.; Kalamdhad, A.S. Effect of Different Livestock Dungs as Inoculum on Food Waste Anaerobic Digestion and Its Kinetics. Bioresour. Technol. 2015, 180, 237–241. [Google Scholar] [CrossRef] [PubMed]
  38. Zwain, H.M.; Dahlan, I. Biological Treatment of Recycled Paper Mill Wastewater Using Modified Anaerobic Inclining-Baffled Bioreactor (MAIB-R). In Wastewater Engineering: Advanced Wastewater Treatment Systems; International Journal of Scientific Research (IJSR) Publications: Penang, Malaysia, 2014; pp. 72–86. [Google Scholar]
  39. Zaier, H.; Chmingui, W.; Rajhi, H.; Bouzidi, D.; Roussos, S.; Rhouma, A. Physico-Chemical and Microbiological Characterization of Olive Mill Wastewater (OMW) of Different Regions of Tunisia (North, Sahel, South). J. New Sci. Agric. Biotechnol. 2017, 48, 2897–2906. [Google Scholar]
  40. Huang, X.; Yun, S.; Zhu, J.; Du, T.; Zhang, C.; Li, X. Mesophilic Anaerobic Co-Digestion of Aloe Peel Waste with Dairy Manure in the Batch Digester: Focusing on Mixing Ratios and Digestate Stability. Bioresour. Technol. 2016, 218, 62–68. [Google Scholar] [CrossRef]
  41. Wang, Z.; Yun, S.; Xu, H.; Wang, C.; Zhang, Y.; Chen, J.; Jia, B. Mesophilic Anaerobic Co-Digestion of Acorn Slag Waste with Dairy Manure in a Batch Digester: Focusing on Mixing Ratios and Bio-Based Carbon Accelerants. Bioresour. Technol. 2019, 286, 121394. [Google Scholar] [CrossRef]
  42. Li, Y.; Zhao, J.; Krooneman, J.; Euverink, G.J.W. Strategies to Boost Anaerobic Digestion Performance of Cow Manure: Laboratory Achievements and Their Full-Scale Application Potential. Sci. Total Environ. 2021, 755, 142940. [Google Scholar] [CrossRef]
  43. Jiang, Y.; Heaven, S.; Banks, C.J. Strategies for Stable Anaerobic Digestion of Vegetable Waste. Renew. Energy 2012, 44, 206–214. [Google Scholar] [CrossRef] [Green Version]
  44. Rouez, M. Dégradation Anaérobie de Déchets Solides: Caractérisation, Facteurs d’Influence et Modélisations. Ph.D. Thesis, Civil Engineering and Environmental Engineering Laboratory (LGCIE), INSA Lyon—National Institute of Applied Sciences of Lyon, Lyon, France, 2008. ISBN 3865376657. [Google Scholar]
  45. Berle, E. Methane Production Through Anaerobic Digestion of Various Organic Substrates. Bachelor’s Thesis, Novia University of Applied Sciences, Vaasa, Finland, 2016; p. 82. [Google Scholar]
  46. Xiao, Y.; Zan, F.; Zhang, W.; Hao, T. Alleviating Nutrient Imbalance of Low Carbon-to-Nitrogen Ratio Food Waste in Anaerobic Digestion by Controlling the Inoculum-to-Substrate Ratio. Bioresour. Technol. 2021, 346, 126342. [Google Scholar] [CrossRef]
  47. Abbas, Y.; Yun, S.; Wang, K.; Ali Shah, F.; Xing, T.; Li, B. Static-Magnetic-Field Coupled with Fly-Ash Accelerant: A Powerful Strategy to Significantly Enhance the Mesophilic Anaerobic-Co-Digestion. Bioresour. Technol. 2021, 327, 124793. [Google Scholar] [CrossRef] [PubMed]
  48. Li, B.; Yun, S.; Xing, T.; Wang, K.; Ke, T.; An, J. A Strategy for Understanding the Enhanced Anaerobic Co-Digestion via Dual-Heteroatom Doped Bio-Based Carbon and Its Functional Groups. Chem. Eng. J. 2021, 425, 130473. [Google Scholar] [CrossRef]
  49. Han, S.; Liu, Y.; Zhang, S.; Luo, G. Reactor Performances and Microbial Communities of Biogas Reactors: Effects of Inoculum Sources. Appl. Microbiol. Biotechnol. 2016, 100, 987–995. [Google Scholar] [CrossRef]
  50. Pramanik, S.K.; Suja, F.B.; Zain, S.M.; Pramanik, B.K. The Anaerobic Digestion Process of Biogas Production from Food Waste: Prospects and Constraints. Bioresour. Technol. Rep. 2019, 8, 100310. [Google Scholar] [CrossRef]
  51. Leung, D.Y.C.; Wang, J. An Overview on Biogas Generation from Anaerobic Digestion of Food Waste. Int. J. Green Energy 2016, 13, 119–131. [Google Scholar] [CrossRef]
  52. Yadvika; Santosh; Sreekrishnan, T.R.; Kohli, S.; Rana, V. Enhancement of Biogas Production from Solid Substrates Using Different Techniques—A Review. Bioresour. Technol. 2004, 95, 1–10. [Google Scholar] [CrossRef]
  53. Edwiges, T.; Frare, L.; Mayer, B.; Lins, L.; Mi Triolo, J.; Flotats, X.; de Mendonça Costa, M.S.S. Influence of Chemical Composition on Biochemical Methane Potential of Fruit and Vegetable Waste. Waste Manag. 2018, 71, 618–625. [Google Scholar] [CrossRef] [PubMed] [Green Version]
  54. Xu, F.; Li, Y.; Ge, X.; Yang, L.; Li, Y. Anaerobic Digestion of Food Waste—Challenges and Opportunities. Bioresour. Technol. 2018, 247, 1047–1058. [Google Scholar] [CrossRef]
  55. Neves, L.; Oliveira, R.; Alves, M.M. Influence of Inoculum Activity on the Bio-Methanization of a Kitchen Waste under Different Waste/Inoculum Ratios. Process Biochem. 2004, 39, 2019–2024. [Google Scholar] [CrossRef] [Green Version]
  56. Zhang, X.; Gu, J.; Wang, X.; Zhang, K.; Yin, Y.; Zhang, R.; Zhang, S. Effects of Tylosin, Ciprofloxacin, and Sulfadimidine on McrA Gene Abundance and the Methanogen Community during Anaerobic Digestion of Cattle Manure. Chemosphere 2019, 221, 81–88. [Google Scholar] [CrossRef] [PubMed]
  57. El Gnaoui, Y.; Sounni, F.; Bakraoui, M.; Karouach, F.; Benlemlih, M.; Barz, M.; El Bari, H. Anaerobic Co-Digestion Assessment of Olive Mill Wastewater and Food Waste: Effect of Mixture Ratio on Methane Production and Process Stability. J. Environ. Chem. Eng. 2020, 8, 103874. [Google Scholar] [CrossRef]
  58. Yavini, T.D.; Chia, A.I.; John, A. Evaluation of the Effect of Total Solids Concentration on Biogas Yields of Agricultural Wastes. Int. Res. J. Environ. Sci. 2014, 3, 70–75. [Google Scholar]
  59. Yang, Y.; Yu, K.; Xia, Y.; Lau, F.T.K.; Tang, D.T.W.; Fung, W.C.; Fang, H.H.P.; Zhang, T. Metagenomic Analysis of Sludge from Full-Scale Anaerobic Digesters Operated in Municipal Wastewater Treatment Plants. Appl. Microbiol. Biotechnol. 2014, 98, 5709–5718. [Google Scholar] [CrossRef] [PubMed]
  60. St-Pierre, B.; Wright, A.D.G. Comparative Metagenomic Analysis of Bacterial Populations in Three Full-Scale Mesophilic Anaerobic Manure Digesters. Appl. Microbiol. Biotechnol. 2014, 98, 2709–2717. [Google Scholar] [CrossRef] [PubMed]
  61. Garcia, S.L.; Jangid, K.; Whitman, W.B.; Das, K.C. Transition of Microbial Communities during the Adaption to Anaerobic Digestion of Carrot Waste. Bioresour. Technol. 2011, 102, 7249–7256. [Google Scholar] [CrossRef]
  62. Schwarz, W.H. The Cellulosome and Cellulose Degradation by Anaerobic Bacteria. Appl. Microbiol. Biotechnol. 2001, 56, 634–649. [Google Scholar] [CrossRef]
  63. Lynd, L.R.; Weimer, P.J.; Van Zyl, W.H.; Isak, S. Microbial Cellulose Utilization: Fundamentals and Biotechnology Microbial Cellulose Utilization: Fundamentals and Biotechnology. Microbiol. Mol. Biol. Rev. 2002, 66, 506–577. [Google Scholar] [CrossRef] [Green Version]
  64. Wang, Z.; Yun, S.; Shi, J.; Han, F.; Liu, B.; Wang, R.; Li, X. Critical Evidence for Direct Interspecies Electron Transfer with Tungsten-Based Accelerants: An Experimental and Theoretical Investigation. Bioresour. Technol. 2020, 311, 123519. [Google Scholar] [CrossRef] [PubMed]
  65. Yun, S.; Xing, T.; Han, F.; Shi, J.; Wang, Z.; Fan, Q.; Xu, H. Enhanced Direct Interspecies Electron Transfer with Transition Metal Oxide Accelerants in Anaerobic Digestion. Bioresour. Technol. 2021, 320, 124294. [Google Scholar] [CrossRef] [PubMed]
  66. Martí-Herrero, J.; Alvarez, R.; Flores, T. Evaluation of the Low Technology Tubular Digesters in the Production of Biogas from Slaughterhouse Wastewater Treatment. J. Clean. Prod. 2018, 199, 633–642. [Google Scholar] [CrossRef]
  67. Traversi, D.; Villa, S.; Lorenzi, E.; Degan, R.; Gilli, G. Application of a Real-Time QPCR Method to Measure the Methanogen Concentration during Anaerobic Digestion as an Indicator of Biogas Production Capacity. J. Environ. Manag. 2012, 111, 173–177. [Google Scholar] [CrossRef] [PubMed]
  68. Xu, H.; Wang, K.; Zhang, X.; Gong, H.; Xia, Y.; Holmes, D.E. Application of In-Situ H2-Assisted Biogas Upgrading in High-Rate Anaerobic Wastewater Treatment. Bioresour. Technol. 2020, 299, 122598. [Google Scholar] [CrossRef] [PubMed]
Scheme 1. Experimental design of the biochemical methane potential (BMP).
Energies 16 03300 sch001
Figure 1. pH variation during anaerobic digestion.
Energies 16 03300 g001
Figure 2. Daily biogas production from anaerobic digestion of cattle manure (CM) using various inoculum types. Error bars represent the standard deviation from three measurements.
Energies 16 03300 g002
Figure 3. Cumulative Biogas yields various types of inocula in the anaerobic digestion process.
Energies 16 03300 g003
Figure 4. Phylum distribution of prokaryotic 16S rDNA gene sequences in various inocula.
Energies 16 03300 g004
Figure 5. Graphs showing the abundances of bacterial communities at the family level in cattle manure (CM) (a) and three inocula: C.I1 (b), Li.I (c), and La.I1 (d), based on the 16S rDNA sequencing data using Nanopore workflow. The square represents the whole percentage (100%) and the cycle represents 1%, which indicates the total of cycles in each color and provides information on the percentage of the family.
Energies 16 03300 g005
Figure 6. Principal coordinate analysis (PCoA) of beta diversity of bacterial communities from CM substrate (control) and three best inocula (cellulosic C.I1; lipidic Li.I; and lactic La.I1). Analyses were performed by using the Jaccard distance matrix and visualized with Emperor.
Energies 16 03300 g006
Table 1. Composition of the inoculum used for anaerobic digestion.
InocCellulosic Inoculum1 (C.I1)Cellulosic Inoculum2 (C.I2)Lipidic Inoculum (Li.I)Lactic Inoculum1 (La.I1)Lactic Inoculum2 (La.I2)Saccharidicinoculum (Sacc.I)
Composition (in % w/w)30% Leaf litter
40% Wheat straw
10% Milk
10% Glucose
10% Water
40% Wheat straw
40% rice straw
20% corn stover
10%vegetabl peels
11% Coffee grounds
5% Yoghurt
30% Leaves and branches of plants
44% Olive pomace
10% Glucose
90% Lactoserum
5% Yeast
25% Flour
70% natural yeast
100% molasses
Table 2. Physicochemical and biochemical parameters of inocula and substrate samples.
ParameterC.I1C.I2Li.ILa.I1La.I2Sacc.ISubstrate (CM)
pH6.15 ± 0.03 d6.52 ± 0.02 c7.08 ± 0.06 a7.12 ± 0.02 a4.62 ± 0.11 e6.81 ± 0.06 b7.19 ± 0.01 a
Total Solids (%wet basis)41.70 ± 0.2 cd26.16 ± 0.97 ef19.33 ± 2.28 f76.12 ± 3.30 b33.89 ± 1.93 de44.33 ± 4.6 c94.87 ± 5.25 a
Volatiles Solids (%wet basis)36.85 ± 1.53 c22.27 ± 1.73 de14.25 ± 1.08 e62.25 ± 4.58 b24.85 ± 3.66 d26.38 ± 1.16 d89.43 ± 5.17 a
VS/TS (% TS)88.3685.1273.7181.7773.3259.594.26
Total lipid %20.26 ± 1.39 bc13.66 ± 1.49 d35.05 ± 2.93 a24.08 ± 0.57 b12.9 ± 0.985.04 ± 0.6 e16.11 ± 1.78 cd
Total sugar %7.12 ± 0.61 ab4.06 ± 0.5 cd2.21 ± 0.68 d5.75 ± 1.16 bc7.27 ± 0.56 ab8.15 ± 0.66 a4.16 ± 0.01 cd
Total protein %4.44 ± 1.34 c14 ± 1.81 a6.08 ± 1.6 bc5.17 ± 1.37 c4.59 ± 0.84 c2.33 ± 0.62 c10.01 ± 1.49 ab
P (mg·g−1)12.72 ± 1.05 b15.70 ± 0.16 a8.75 ± 1.28 c6.75 ± 0.27 c7.75 ± 0.23 c11.1 ± 0.73 b11.13 ± 0.42 c
Ca (mg·g−1)0.4 ± 0.00 c0.4 ± 0.19 c5.48 ± 0.20 a0.84 ± 0.15 c4.38 ± 0.32 b0.51 ± 0.14 c4.63 ± 0.39 b
Particle size (mm)2≤2≤31–1.5--1–1.5
The values indicated by different letters are statistically significant (p ≤ 0.05). The significations were made according to the application of different inocula for the same parameter.
Table 3. Anaerobic digestion parameters monitoring of BMP experiments for CM substrate and with the addition of different inocula.
ParameterC.I1C.I2Li.ILa.I1La.I2Sacc.ISubstrate (CM)
Initial pH6.87 ± 0.31 b7.12 ± 0.08 ab6.13 ± 0.45 c6.81 ± 0.00 b7.23 ± 0.04 ab7.48 ± 0.04 a7.11 ± 0.18 ab
Final pH6.50 ± 0.00 a6.16 ± 0.01 bcd6 ± 0.00 d5.17 ± 0.05 e6.32 ± 0.11 b6.12 ± 0.00 cd6.18 ± 0.03 bc
Total Carbon (TC) %52.18 ± 2.02 c67.04 ± 1.92 b18.58 ± 0.66 e36.32 ± 3.2 d66.37 ± 1.92 b22.62 ± 1.78 e76.95 ± 2.57 a
Total Nitrogen (TN) %1.537 ± 0.04 cd3.199 ± 0.2 a2.444 ± 0.11 b1.609 ± 0.1 cd2.106 ± 0.32 bc1.160 ± 0.27 d1.941 ± 0.38 bc
C/N33.9420.957.6022.5731.5119.539.64
COD efficiency (%)77.2839.2315.0768.2364.8114.9743.05
BOD5 efficiency96.4542633.3351.8533.3341.17
Initial COD/BOD51.1441.9331.052.3682.5172.4121.09
Final COD/BOD51.351.1821.2131.1281.8394.162.64
Temperature °C37373737373737
The values indicated by different letters are statistically significant (p ≤ 0.05). The significations were made according to the application of different inocula for the same parameter.
Disclaimer/Publisher’s Note: The statements, opinions and data contained in all publications are solely those of the individual author(s) and contributor(s) and not of MDPI and/or the editor(s). MDPI and/or the editor(s) disclaim responsibility for any injury to people or property resulting from any ideas, methods, instructions or products referred to in the content.

