1. Introduction
The successful integration of a rising share of decentralized electricity generation into the power grid is crucial for the transition to a sustainable energy system. Grid operators find themselves faced with an increase of power generation from fluctuating renewable energy sources accompanied by diversifying strategies of local consumption, short-term storage and marketing of the generated energy. Therefore, reliable information and models for the present and for the forecasting of renewable energy feed-in is becoming increasingly more important for a secure and cost-efficient electricity supply. This study builds on data records and regulatory aspects for Germany, but the problem setting and, hence, the findings can be applied generally to any system with decentralized generation and consumption. Parts of this paper were presented at the 11th Solar & Storage Integration Workshop and published in the workshop’s proceedings [
1].
The generation of electric power by photovoltaics (PV) is primarily determined by the incoming solar irradiance. Models to describe its changes with fluctuating weather conditions and solar position have been developed in solar energy meteorology [
2]. The local demand has to be considered additionally in order to describe the electricity feed-in since many PV systems are part of an environment of electricity consumers, e.g., a commercial or residential building. These so-called “prosumer” systems simultaneously act as energy producers and consumers in the power grid. Instead of feeding all the generated electricity into the grid, energy can be used for self-consumption, i.e., to meet the local demand directly. The problem of a rising share of prosumers in the power system and its influence on PV feed-in and consumption profiles was discussed in detail in a recent review article [
3]. The effect is also called “behind-the-meter PV”, as the balancing between power generation and load in many cases takes place before the measurement point and can therefore not be monitored by utilities or grid operators.
The energy consumption in a power grid is commonly estimated using standard load profiles, in Germany for consumers with an annual demand up to 100 MWh, while the PV feed-in is typically assessed independently [
4]. PV self-consumption changes load profiles considerably, which has prompted the idea of developing additional prosumer load profiles [
5]. The share of self-consumption in the total energy generated by PV has increased continuously over the past years, reaching around 7% in Germany in the year 2018 [
6]. It can be expected that with decreasing remuneration by feed-in tariffs (FITs) and increasing energy purchase prices, self-consumption will become even more attractive in the very near future [
7]. For roof-mounted PV systems in Germany, a growth up to almost 15% in 2025 was predicted [
8]. With a targeted development in total installed nominal PV power from 66.5 GW
p in 2022 to 215 GW
p in 2030 and to 400 GW
p in 2040 in Germany [
9], large amounts of self-consumed energy in absolute numbers are anticipated. Hence, errors in the estimation of self-consumption have the potential for disruptive effects on the grid.
Detailed information concerning energy generation, consumption and feed-in on various aggregation levels in the power grid is required for the trading and billing of balancing groups, grid load calculations and operational planning. The decision-making involved is especially challenged by the distributed energy generation and self-consumption [
10]. Moreover, in order to accomplish these tasks, grid operators have only limited access to relevant measurement data. Feed-in time series are measured for a subset of PV systems, called “SOL systems” here according to the German accounting category for this class of systems. Generally, these are installations with higher-than-average nominal power, e.g., on commercial or industrial buildings, and it is expected that the profiles cannot simply be extrapolated to the full portfolio of PV systems. Furthermore, transmission system operators (TSOs) can access this data only in terms of transfer time series which are aggregated over entire distribution grids. Time-resolved measurements of PV generation or self-consumption are usually not available at all. The total energy generated by an individual PV system, together with a breakdown into self-consumption and feed-in, can be obtained from annual meter readings. However, this information is known to be incomplete. In Germany, for example, no separate measurements are required for PV systems with a nominal power less than 10 kW
p [
6].
The fundamentally different time courses and local balancing of PV generation and electricity consumption build up a complex system. Independent averaging of generation and consumption at the grid level, e.g., using standard load profiles, will not adequately describe actual feed-in and consumption. Instead, an integrated analysis of both is required in order to understand the behaviour of the system as a whole. Since very little measurement data are available for this task, a detailed bottom-up simulation model comprising PV power generation and consumption on an individual prosumer level is chosen here to fill this gap. The approach facilitates a detailed analysis of influencing factors on PV self-consumption and the identification of suitable parameters in data-driven models as a basis to improve PV upscaling methods. It furthermore allows for the estimation of the future effects of expected changes and variable compositions of different prosumer systems in large portfolios. In order to keep the complexity of different usage strategies out, additional technologies such as local battery storages, heat pumps or electric cars are not included in the model at this stage.
In contrast to other approaches of modelling PV self-consumption, the bottom-up simulation allows for the reproduction of the local balancing of PV generation and consumption at the individual prosumer level. In this way, the observed mismatch between PV generation estimates (obtained, e.g., from PV power upscaling) and actually measured feed-in can be described realistically. In a top-down model, this mismatch has to be estimated from an overall perspective on the grid for which currently a good data basis is missing, as the balancing takes place “behind-the-meter” [
11]. The results obtained with the stochastic bottom-up model accounting for all individual prosumer systems in a portfolio are thought to better reflect the effects and be suitable to building a basis for the implementation of data-driven models describing the grid-level effects of PV self-consumption. Such a model could follow a top-down approach enriched by other influencing factors, such as the seasonal cycles identified in the bottom-up model.
Other perspectives on PV self-consumption require different modelling approaches. As the model presented here does not cover energy storage, demand-side management or other flexibility options, it cannot describe, for instance, the economics of different prosumer usage strategies. For this, models of single PV prosumers with battery storage under different optimization targets, such as self-sufficiency vs. cost-efficiency maximization, have been examined [
12], for example. Energy system optimization models (ESOMs) are used to find globally optimized grid configurations from a top-down perspective [
13]. Agent-based models (ABMs), on the other hand, can capture the effects of locally optimized usage strategies of PV prosumers in a grid [
14]. The coupling of ESOMs and ABMs has been proposed to study the economics of prosumer business models, regulatory frameworks and cost-efficient energy system design [
15]. For the disaggregation of PV generation and consumption profiles from net demand measurements, methods from game theory have also been employed [
16].
Our novel approach to PV self-consumption modelling and analysis at the portfolio level is as follows. Based on currently available data records on PV generation, consumption and feed-in and the characteristics of PV systems and prosumers (
Section 2.1), we developed a realistic bottom-up simulation model system of self-consumption in the control area of the German TSO TransnetBW (
Section 2.2). We validated the prosumer model against available measurement data and quantified the improvement over a linear reference model (
Section 3). We analysed the overall effect of self-consumption and its change with yearly, weekly and daily cycles as well as other parameters (
Section 4). Furthermore, the expected differences in behaviour in a 100% prosumers scenario were estimated. In the final section of this paper, we conclude with a short summary and outlook (
Section 5).
3. Model Validation
As described in
Section 2.1, the measurement data available for a rigorous validation are very limited. We completed two steps of validation, comparing the simulation results first with the annual meter readings and second with the transfer time series EUZ. The different data sets do not provide fully coherent information about which PV systems actually perform self-consumption. Some PV systems do not report any self-consumed energy in the annual meter readings although they are registered as “designed for self-consumption” in the system master data record and vice versa. As the regulations of the German Renewable Energy Act EEG do not require reporting self-consumption for PV systems up to 10 kW
p, this is not necessarily an error in the data. Therefore, the set of prosumers in the model portfolio was selected differently for the two validation steps according to the best information available.
3.1. Comparison with Annual Meter Readings
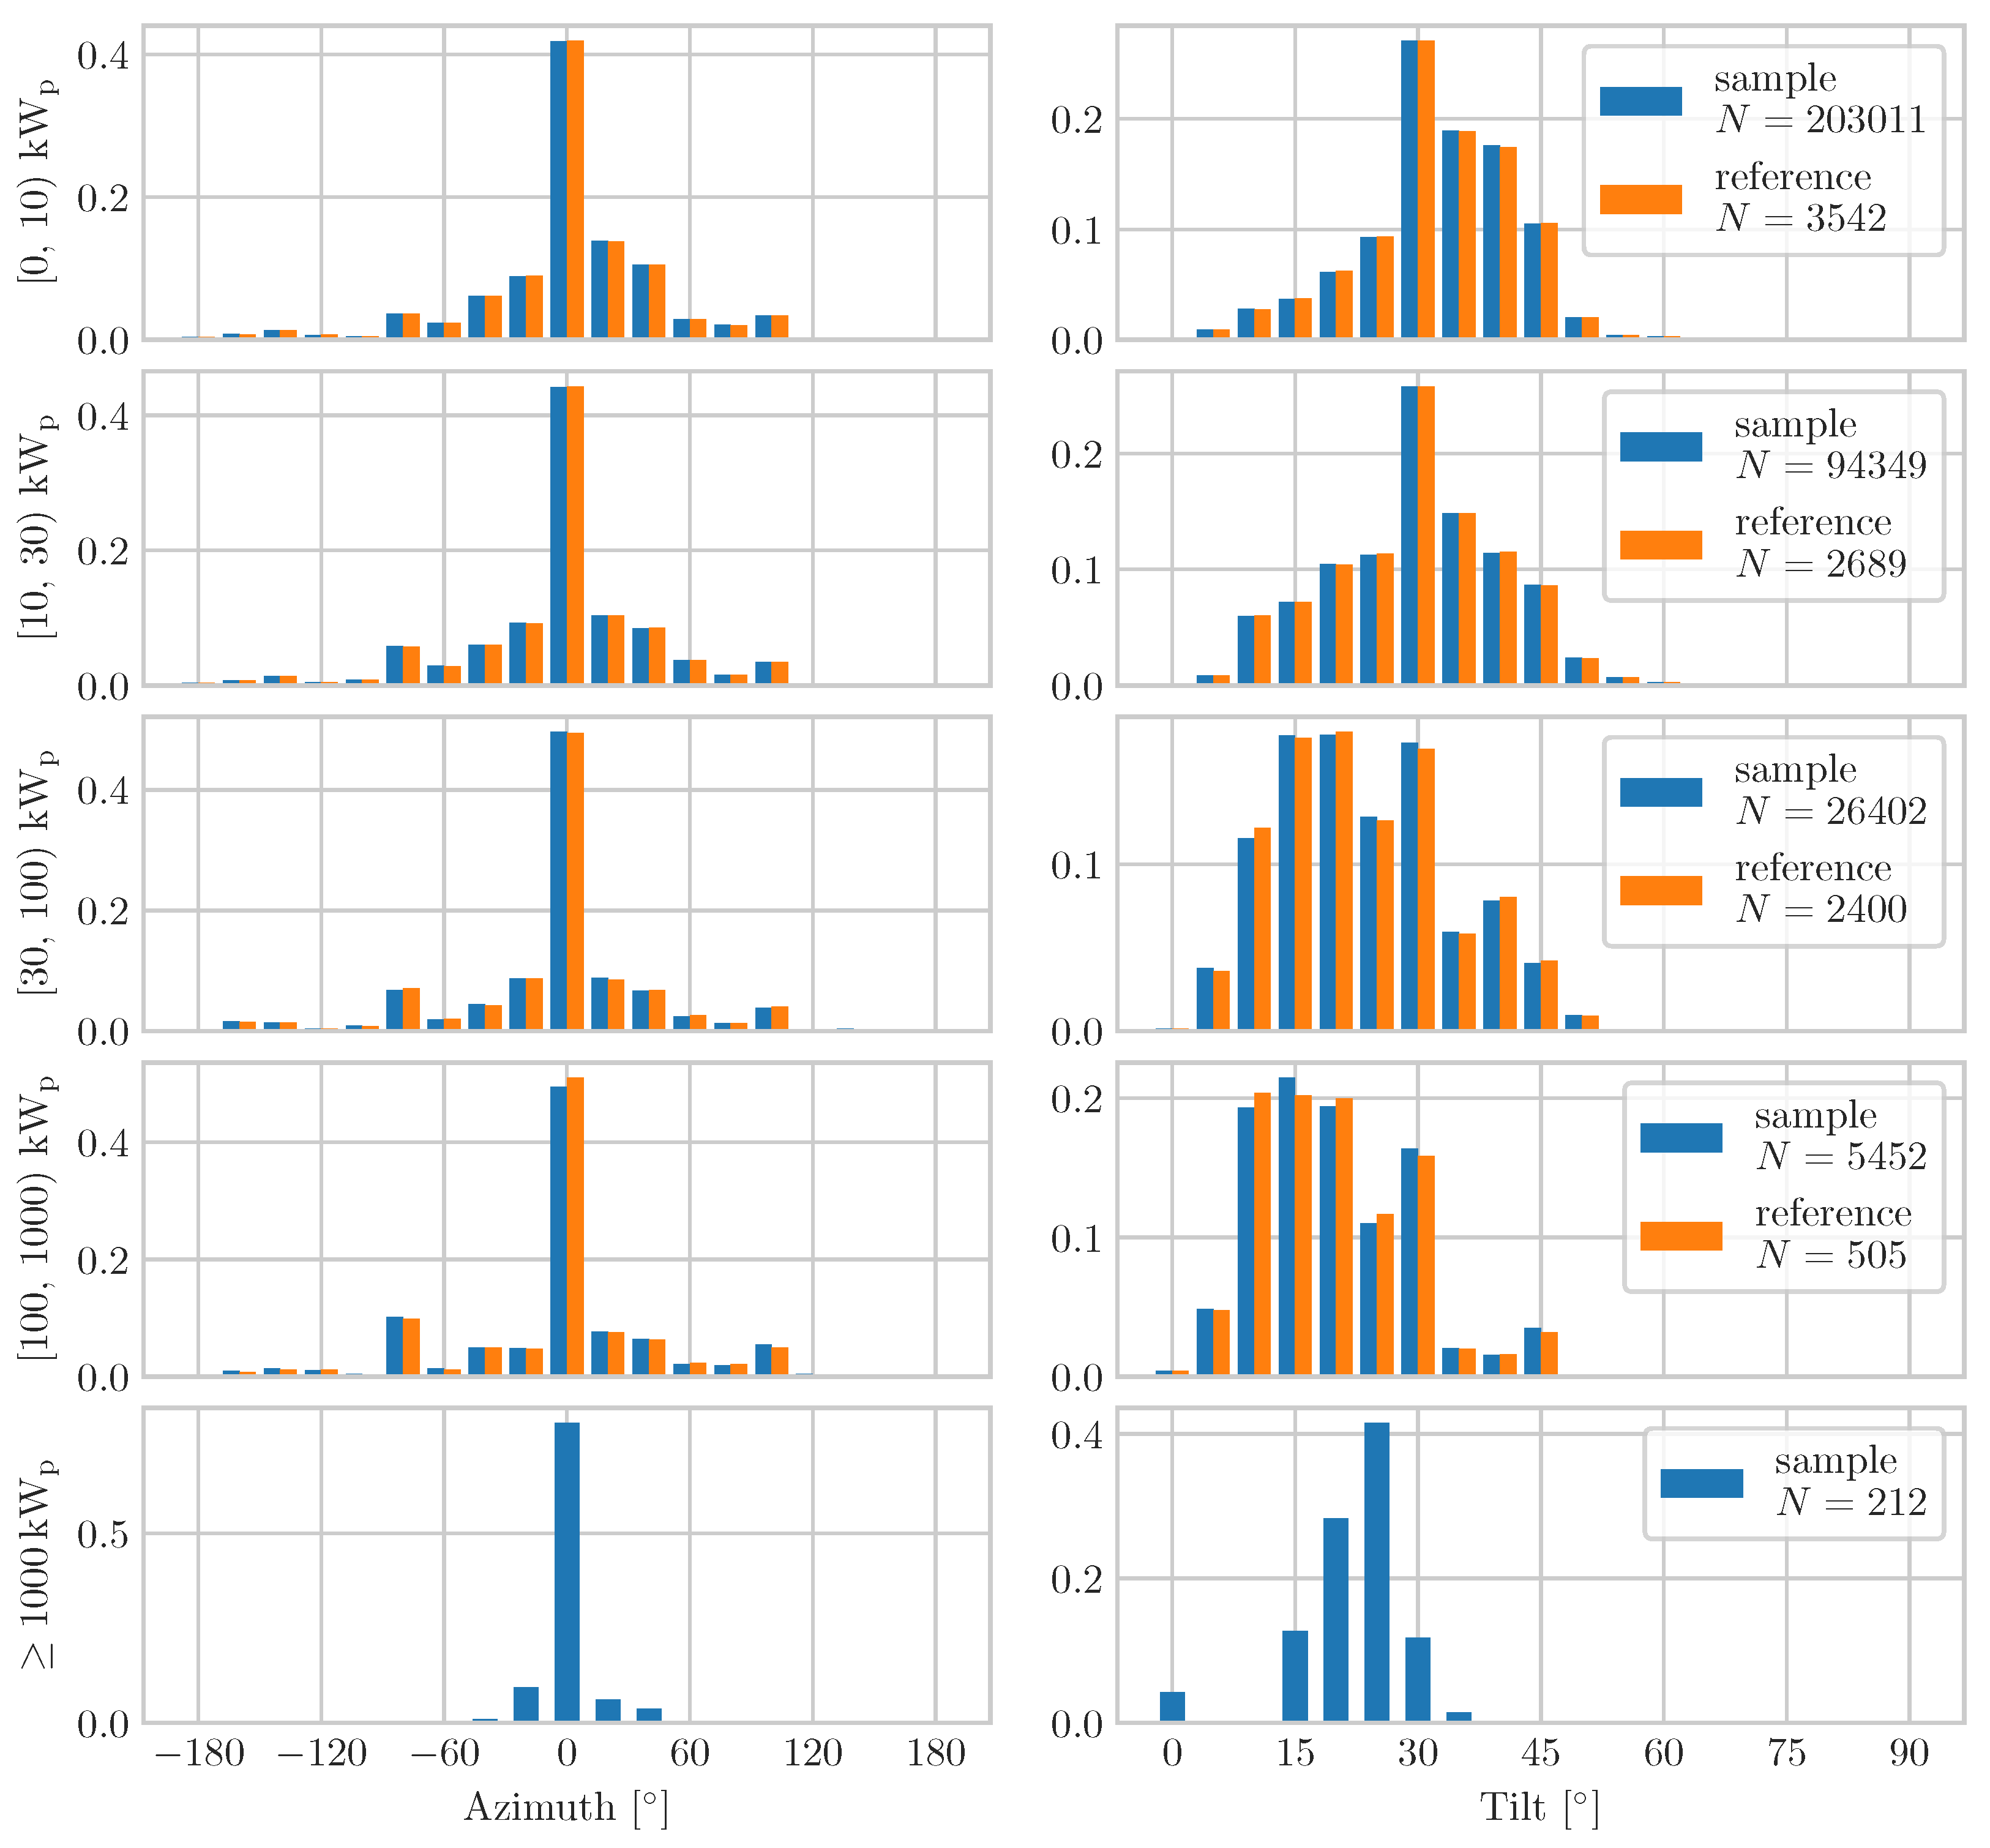
The structure of the full model portfolio with 118,650 PV systems is presented in
Table 2. For the first step of validation, annual totals of simulated PV generation, feed-in, and self-consumption were compared to the corresponding meter readings which are available for almost 117 thousand PV systems in the portfolio. Here, it is assumed, that only the PV systems with reported self-consumption (
Table 2, right column) are prosumers.
Table 3 shows the results. The model slightly overestimates the reported annual PV generation (3.5%) but underestimates self-consumption by 10.7%. There are several explanations for this deviation. First, the model does not consider battery storages and load management, which are often designed to increase self-consumption capabilities. Second, especially in the nonresidential case, consumption profiles are very individual and not straightforward to identify. Particularly industry, the sector with the potentially largest consumption, is not considered as a separate usage category. Furthermore, due to data availability, no postprocessing calibration is performed on the consumption model. The resulting modelled self-consumption rate is 7.2%, slightly below the 8.3% from the meter readings. Finally, this results in a deviation of less than 5% of the modelled PV feed-in compared to the meter readings. This is overall an acceptable agreement which indicates that the prosumer model can quantitatively represent different factors contributing to PV power feed-in.
3.2. Comparison with Transfer Time Series
In a second validation step, the time series generated by the prosumer model were compared to the SOL transfer time series EUZ. This represents the part of the PV systems which are measured. Those systems for which the feed-in is estimated based on feed-in profiles by the grid operators (SOT systems) were not considered for validation. It is worth noting at this point that all metadata records and measurements used here were collected under real operating conditions for regulatory and market processes and not to provide an exact basis for scientific evaluations. Furthermore, as described above, our model portfolio does not include all systems. Therefore, a subset of the EUZ time series has to be selected in order to minimize irregularities in and between the different data sets. The validation is in this part restricted to distribution grids for which the following quality criteria apply:
The difference between the annual feed-in energy integrated over the EUZ and the meter reading sum over all systems is less than 5%.
The share of systems (in number and nominal power) for which meter readings are available is at least 90%.
The EUZ contains data for the whole year, and no irregularities like jumps or data gaps are observed.
There are at least 10 systems of the distribution grid in the model portfolio.
The model portfolio contains at least 50% of the SOL systems in the distribution grid.
This quality check selects 34 out of the 157 distribution grids for the validation of time series. These 34 distribution grids contain, according to the system master data, 2711 SOL systems with 369.5 MW
p nominal power out of which the prosumer model covers 1761 systems with 225.1 MW
p nominal power.
Table 4 summarizes the composition of this portfolio.
Here, unlike the validation against meter readings, all PV systems registered as “designed for self-consumption” are treated as prosumers. As the model only covers about 65% of the SOL systems in the validation set, the resulting time series have to be rescaled for comparison with the measurement data (SOL EUZ). The simulated time series are scaled by a global factor to match the total energy of the corresponding transfer time series.
In order to analyse the benefit of introducing the detailed prosumer model, a comparative validation with a linear reference model was used. The linear modelling approach is grounded on the idea that the only available measurement data on PV generation, self-consumption and feed-in representative for the whole grid are annual energy totals. As the basic time-resolved estimates for self-consumption based on this information, PV generation time series are scaled linearly by the annual self-consumption or feed-in rates on an individual system or portfolio level. Here, the total feed-in energy is calculated directly from the integral over the transfer time series EUZ. The PV generation time series are then scaled down to the feed-in time series such that the total EUZ feed-in energy is reached. In this way, the linear “PV-scaled” model for feed-in profiles is constructed as a basic reference to compare the results of the prosumer model.
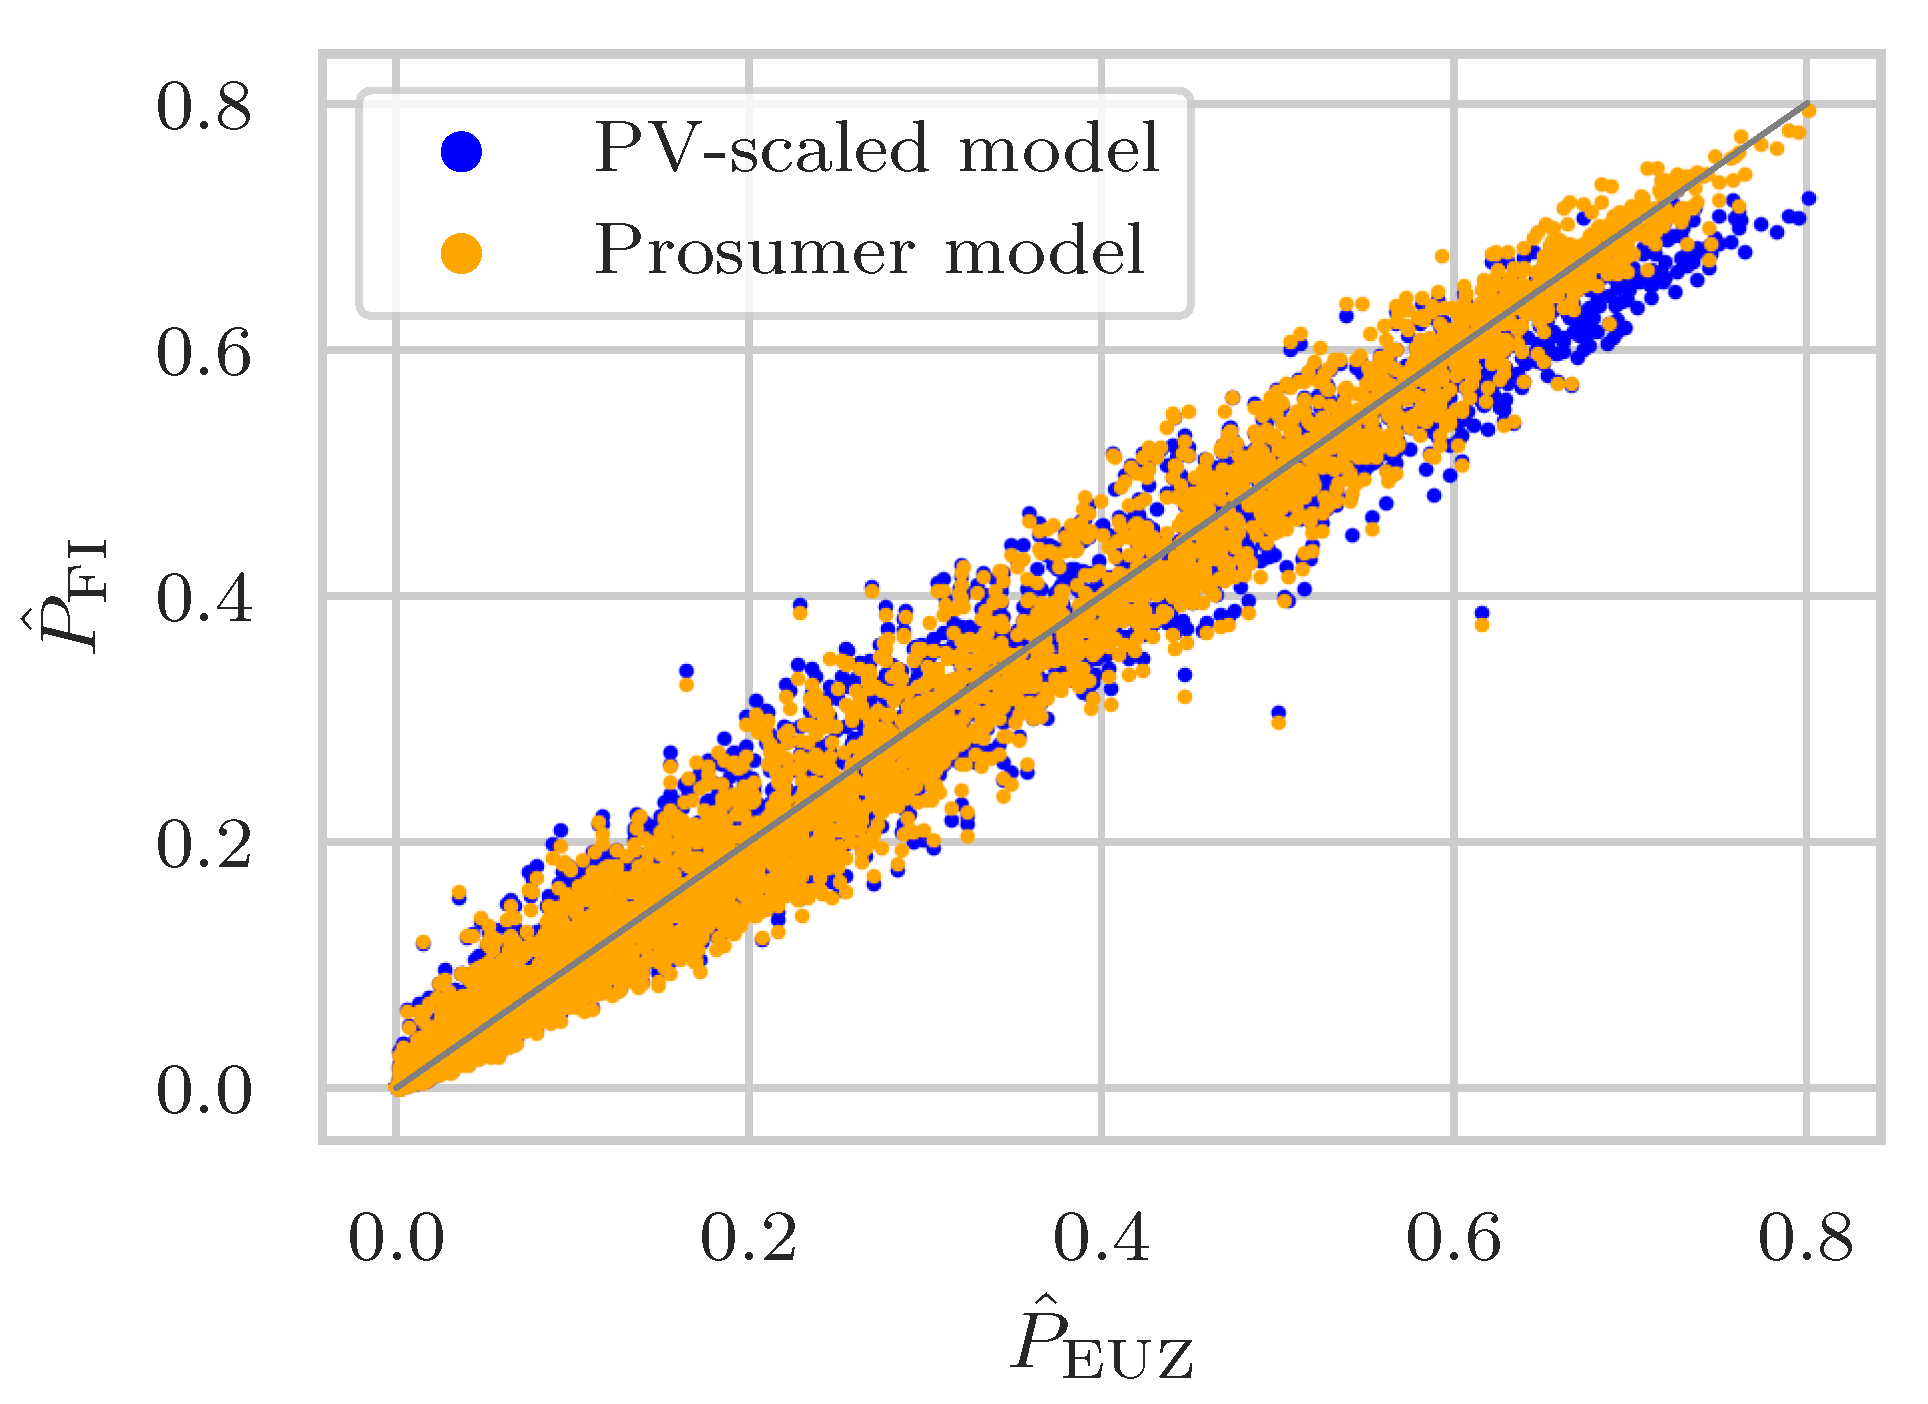
A scatter plot of the modelled PV power feed-in over the EUZ (
Figure 3) illustrates an improved concordance of the prosumer model with the EUZ feed-in compared to the “PV-scaled” reference model. The latter exhibits a notable underestimation for high values of PV power feed-in, which will be further discussed in
Section 4. In contrast, the prosumer model shows a better agreement with the EUZ over the full range of the specific feed-in values.
For a quantitative assessment, the root mean square error (RMSE) of the absolute feed-in to the EUZ is calculated as follows:
where the time
t runs over all day-time values with positive simulated PV power. These are the times for which at least one modelled PV system is generating, i.e., the sun is above the horizon. The number of these events is denoted by
T. A relative RMSE (normalized by the total nominal PV power
) of 1.98% for the “PV-scaled” reference model and 1.89% for the prosumer model is found (see
Table 5). This means that the detailed self-consumption modelling yields an improvement of the RMSE as follows:
where
/
denotes the RMSE of the reference/prosumer model to the EUZ.
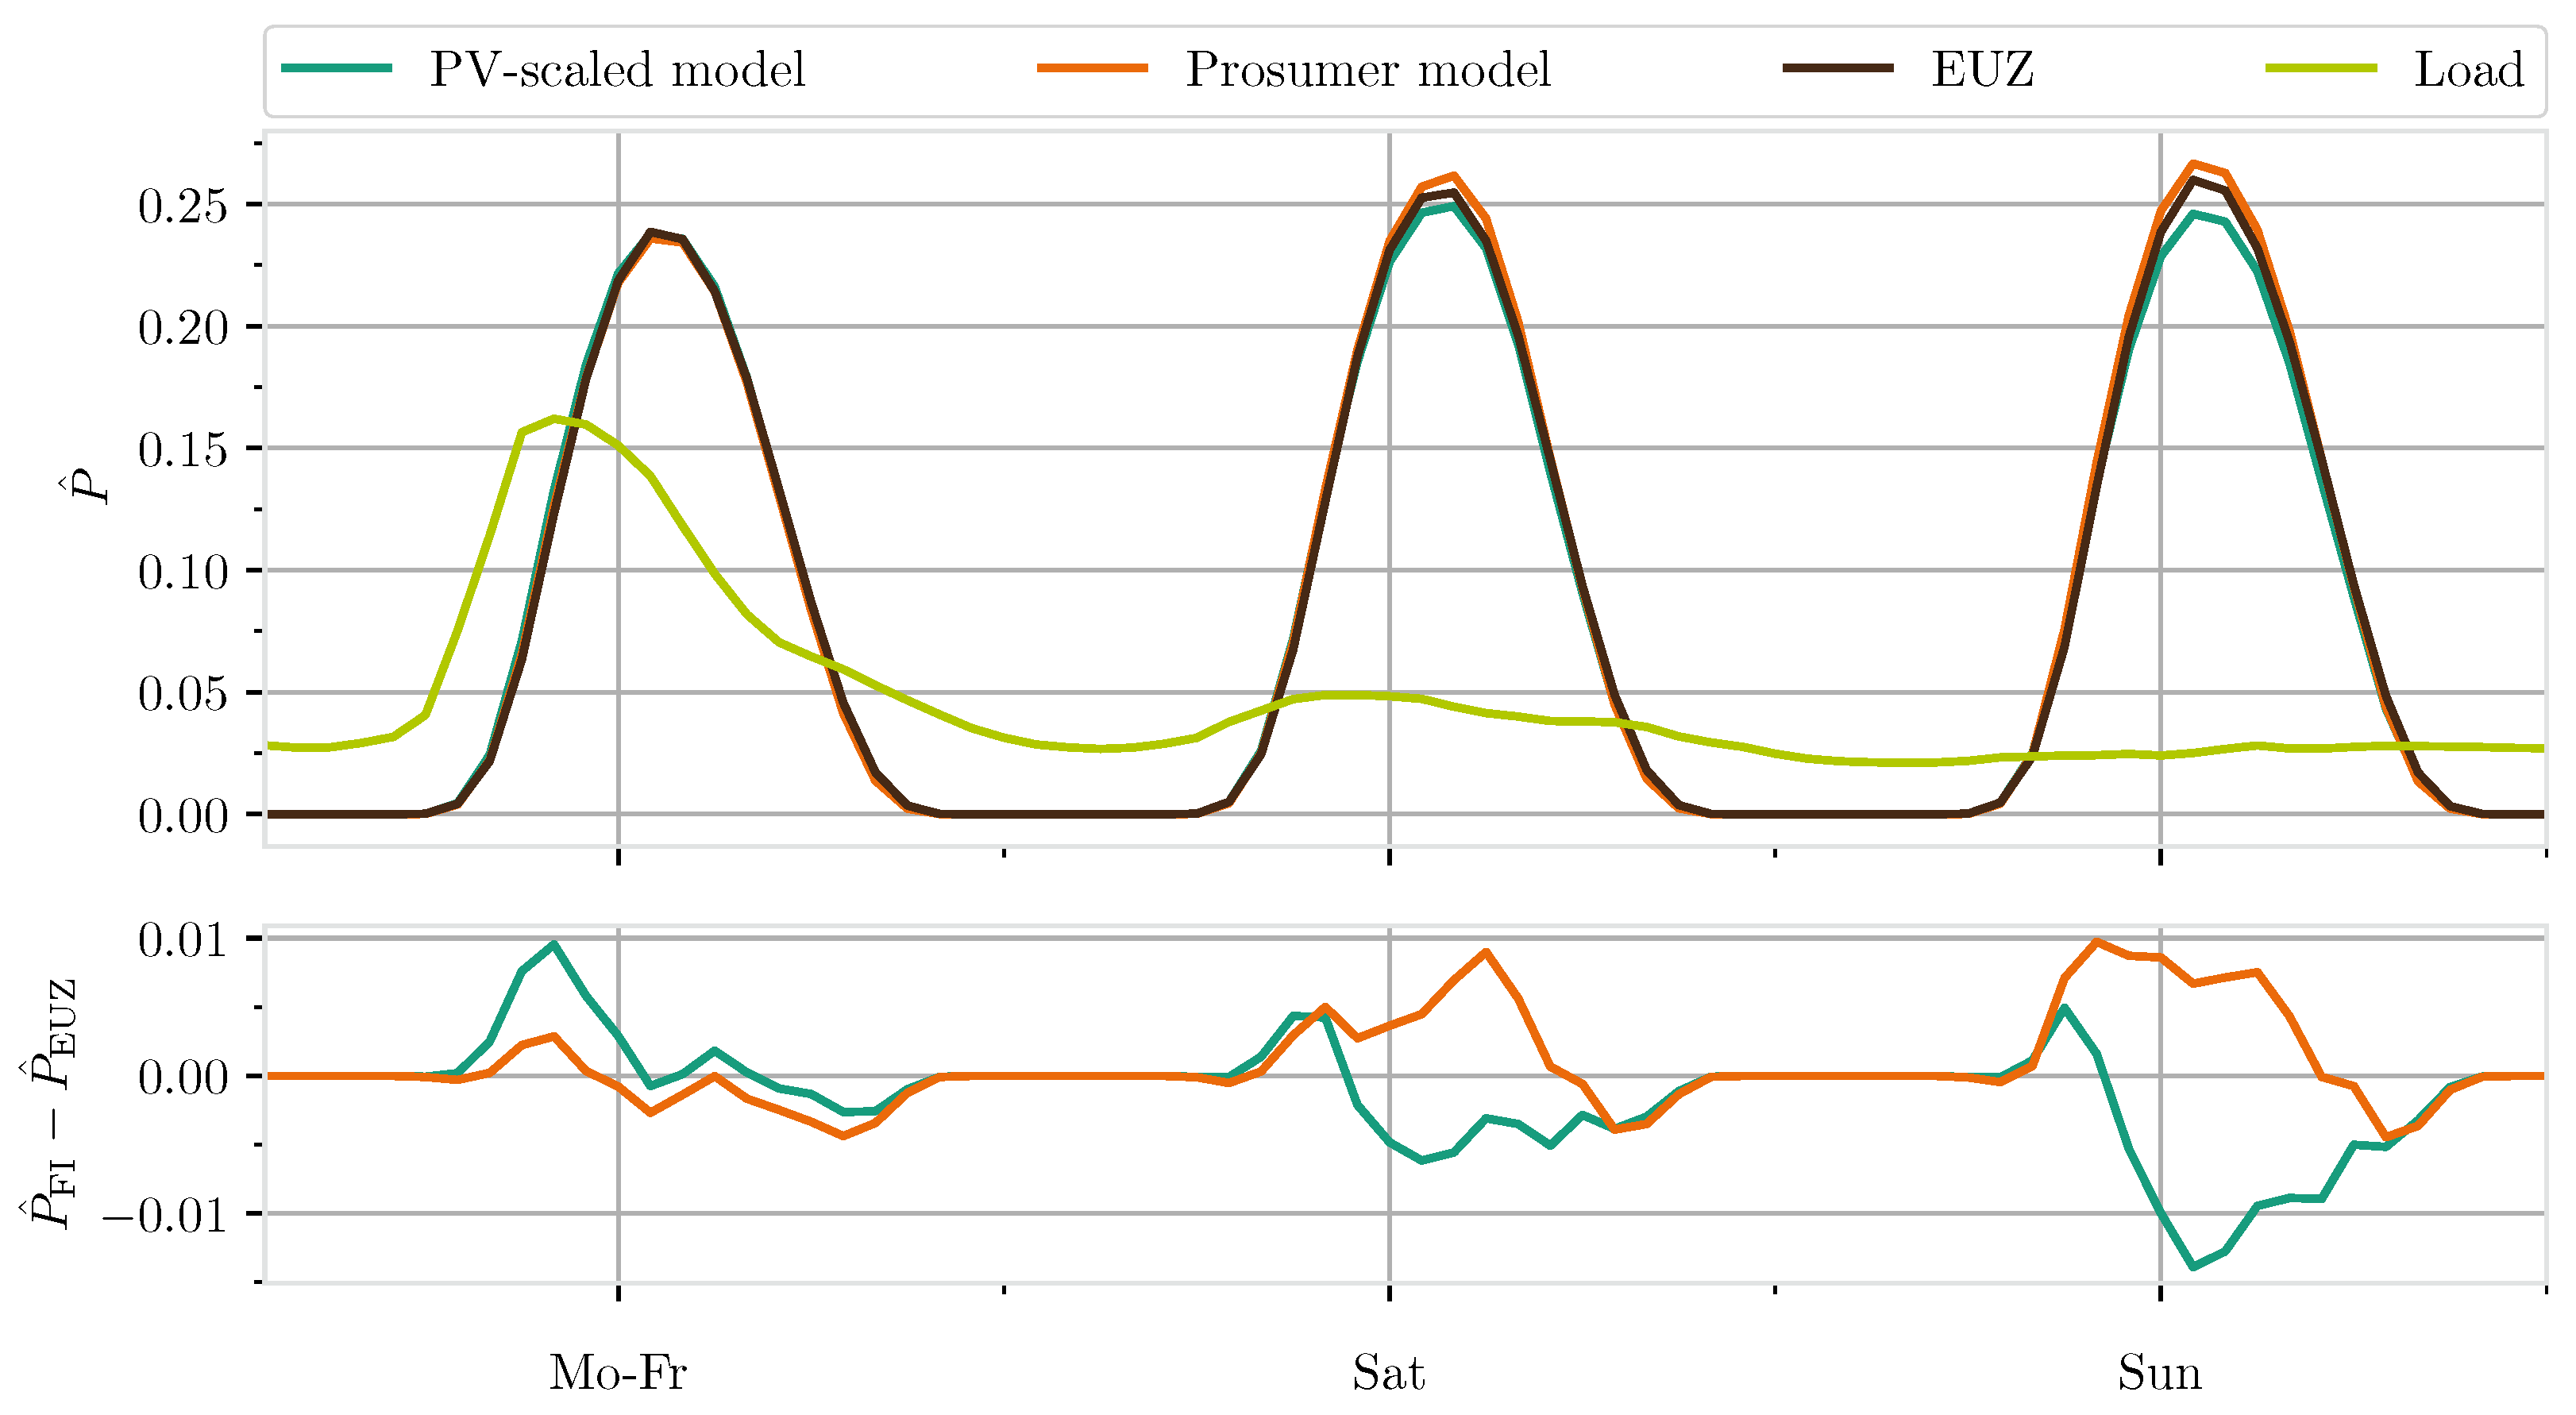
Figure 4 depicts the modelled PV power feed-in to the EUZ in a so-called “type week”. The average daily profiles of the feed-in and load are displayed separately for working days (Monday to Friday), Saturdays and Sundays. The difference in feed-in between the model and the EUZ is shown in the bottom panel. As PV generation evidently does not depend on the day of the week, the profiles for the different type days are very similar in the “PV-scaled” model. In contrast, consumption varies over the course of the week. This is particularly visible here due to the large share of nonresidential prosumers in the SOL validation portfolio (see
Table 4). The significantly lower consumption on weekends results in a higher PV power feed-in which is captured by the prosumer model. Compared to the transfer time series EUZ a slight overestimation on weekends is observed in the prosumer model. This effect is, however, smaller in magnitude than the underestimation observed in the “PV-scaled” model. On workdays, the prosumer model shows significantly smaller deviations from the transfer time series EUZ than does the “PV-scaled” model by taking into account higher consumption during morning hours.
In summary, the evaluations confirmed that the prosumer model is capable of representing temporal patterns of measured PV power feed-in. In the studied situation with a small self-consumption rate of less than 10% on average, the improvement by inclusion of realistic consumption in the model is not very large but clearly visible.
4. Model Results and Discussion
The analysis of self-consumption was carried out on the full prosumer model system (see
Table 2). As before, all PV systems registered as “designed for self-consumption” were chosen as prosumers, for all other systems full feed-in was assumed. The full model portfolio was studied in comparison with the SOL subportfolio comprising all PV systems with time-resolved measurements. This provides some insight into how far the measurement-based knowledge about the SOL systems can be transferred to the full grid and which further effects emerge. We analysed the self-consumption profiles according to the various parameters affecting PV generation and consumption.
4.1. Variations of Self-Consumption over the Year
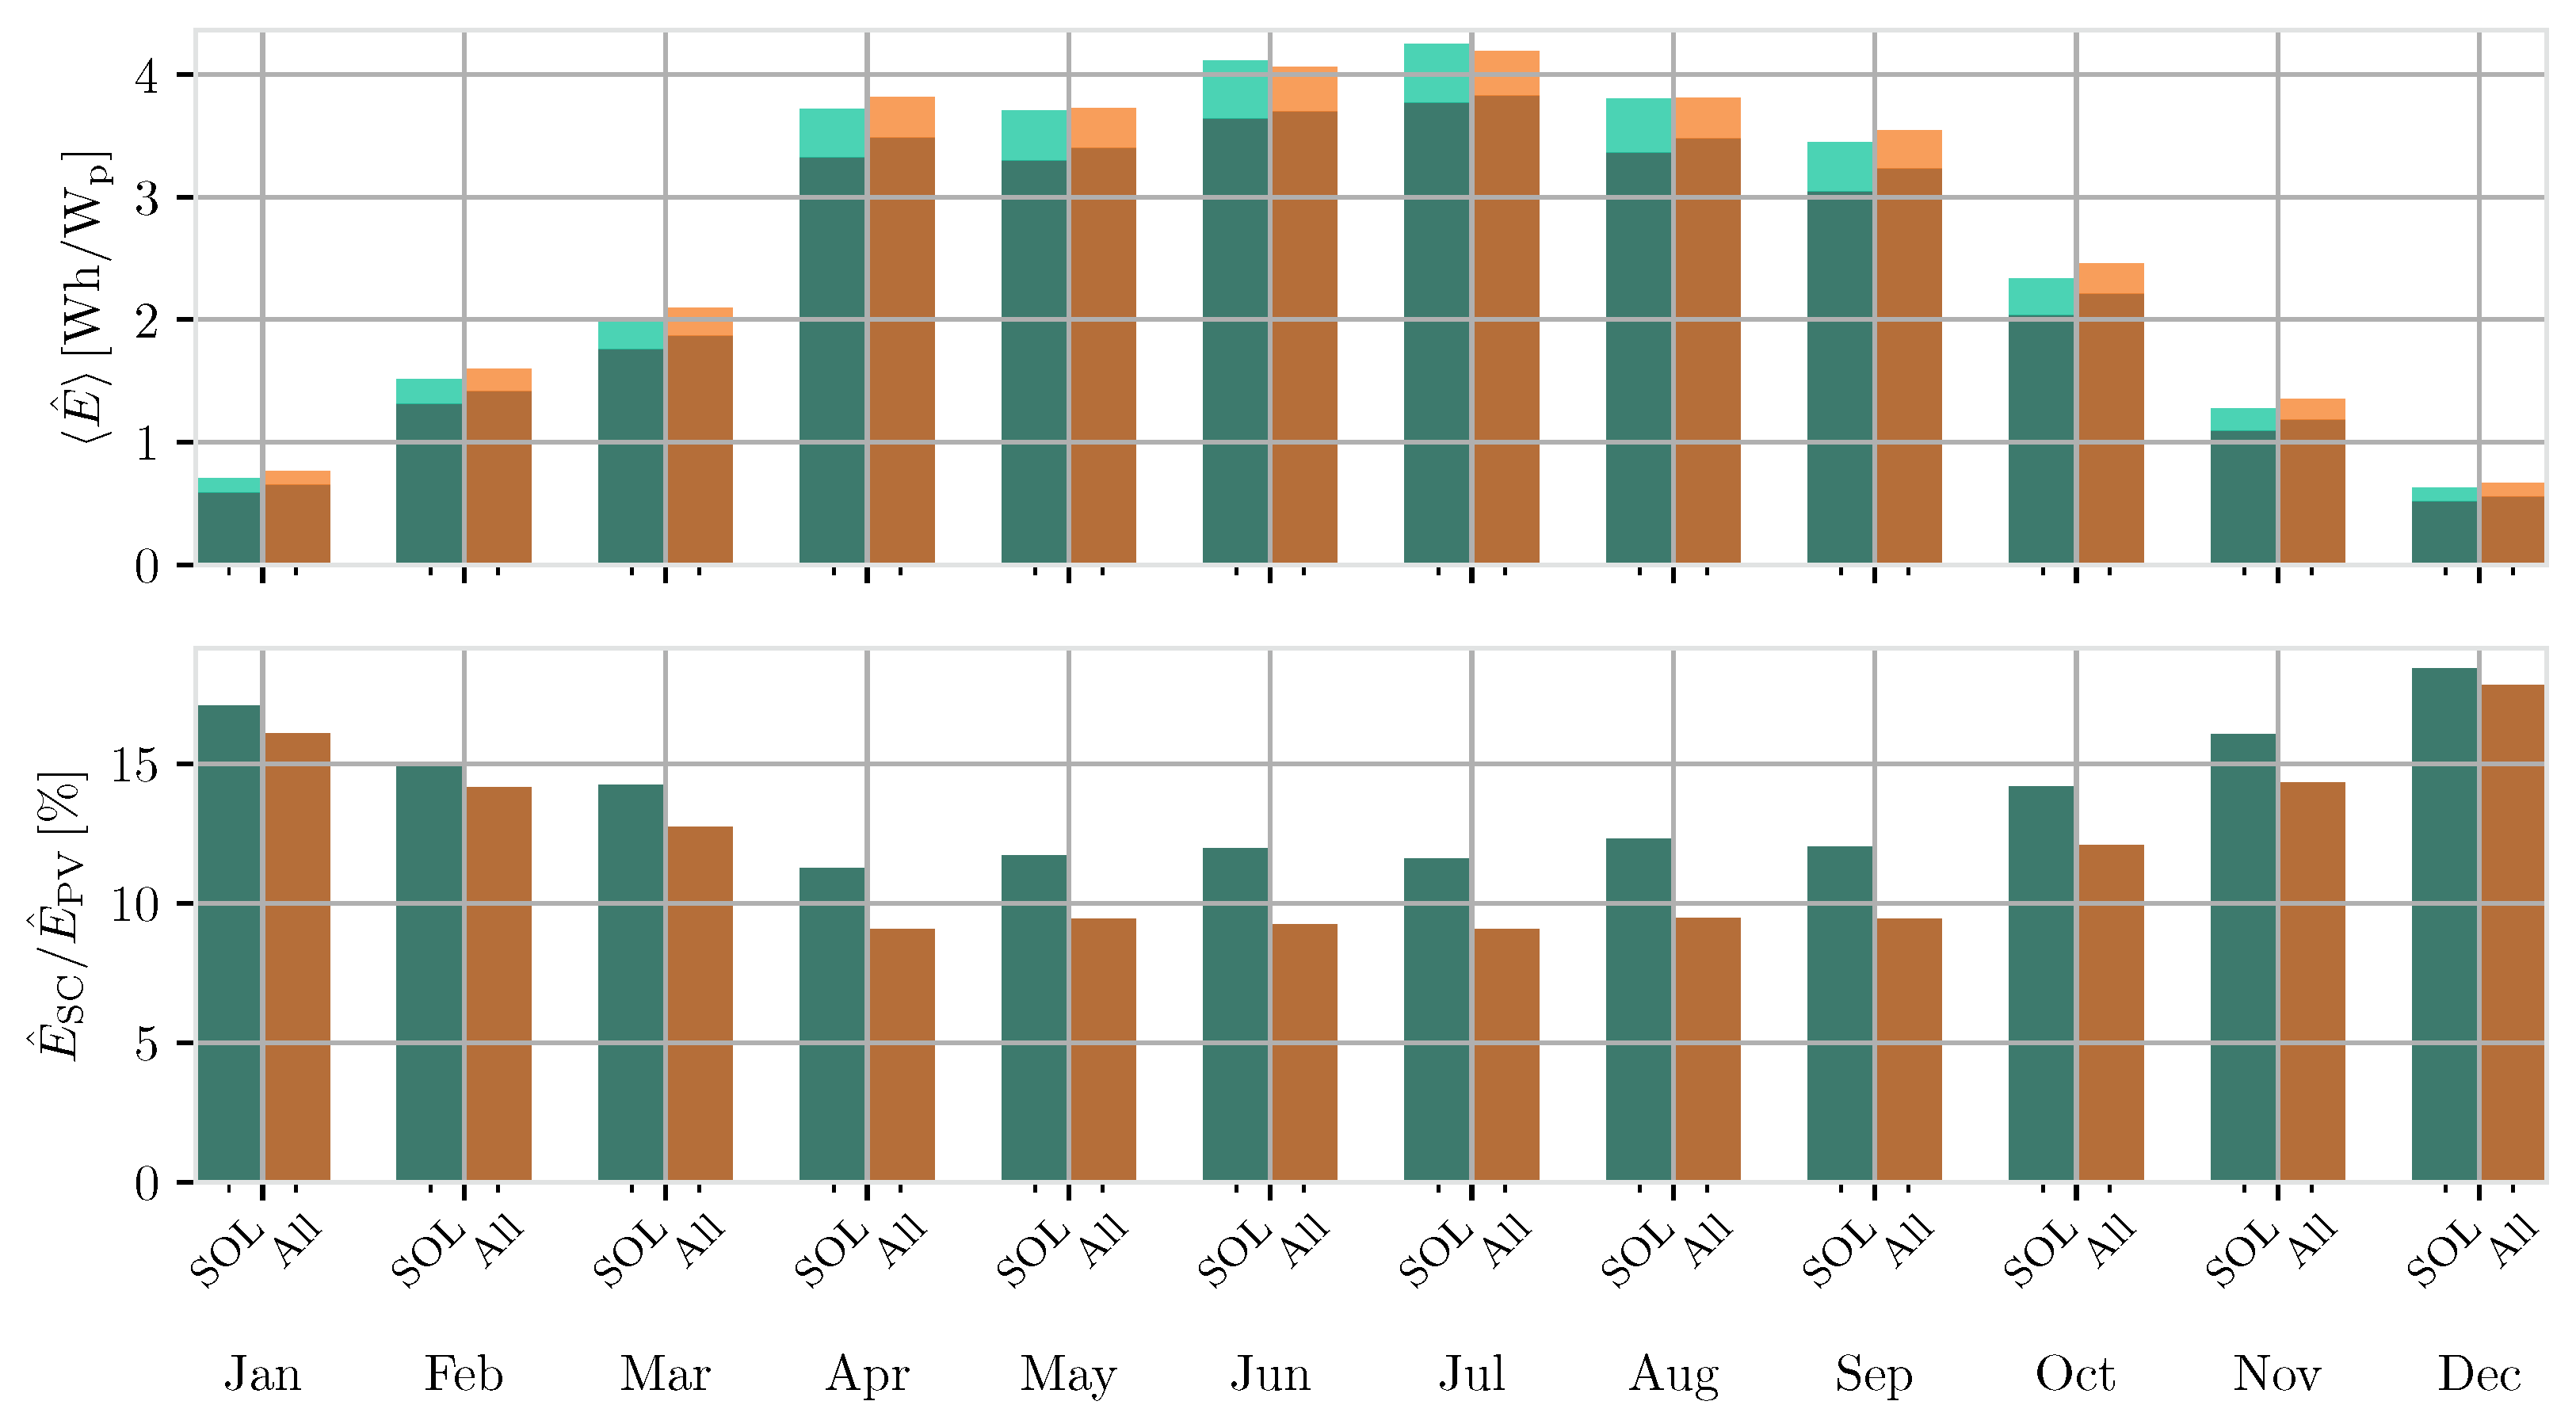
Electricity demand as well as PV generation change during the course of the year, affecting total and relative self-consumption. This seasonal effect is displayed in
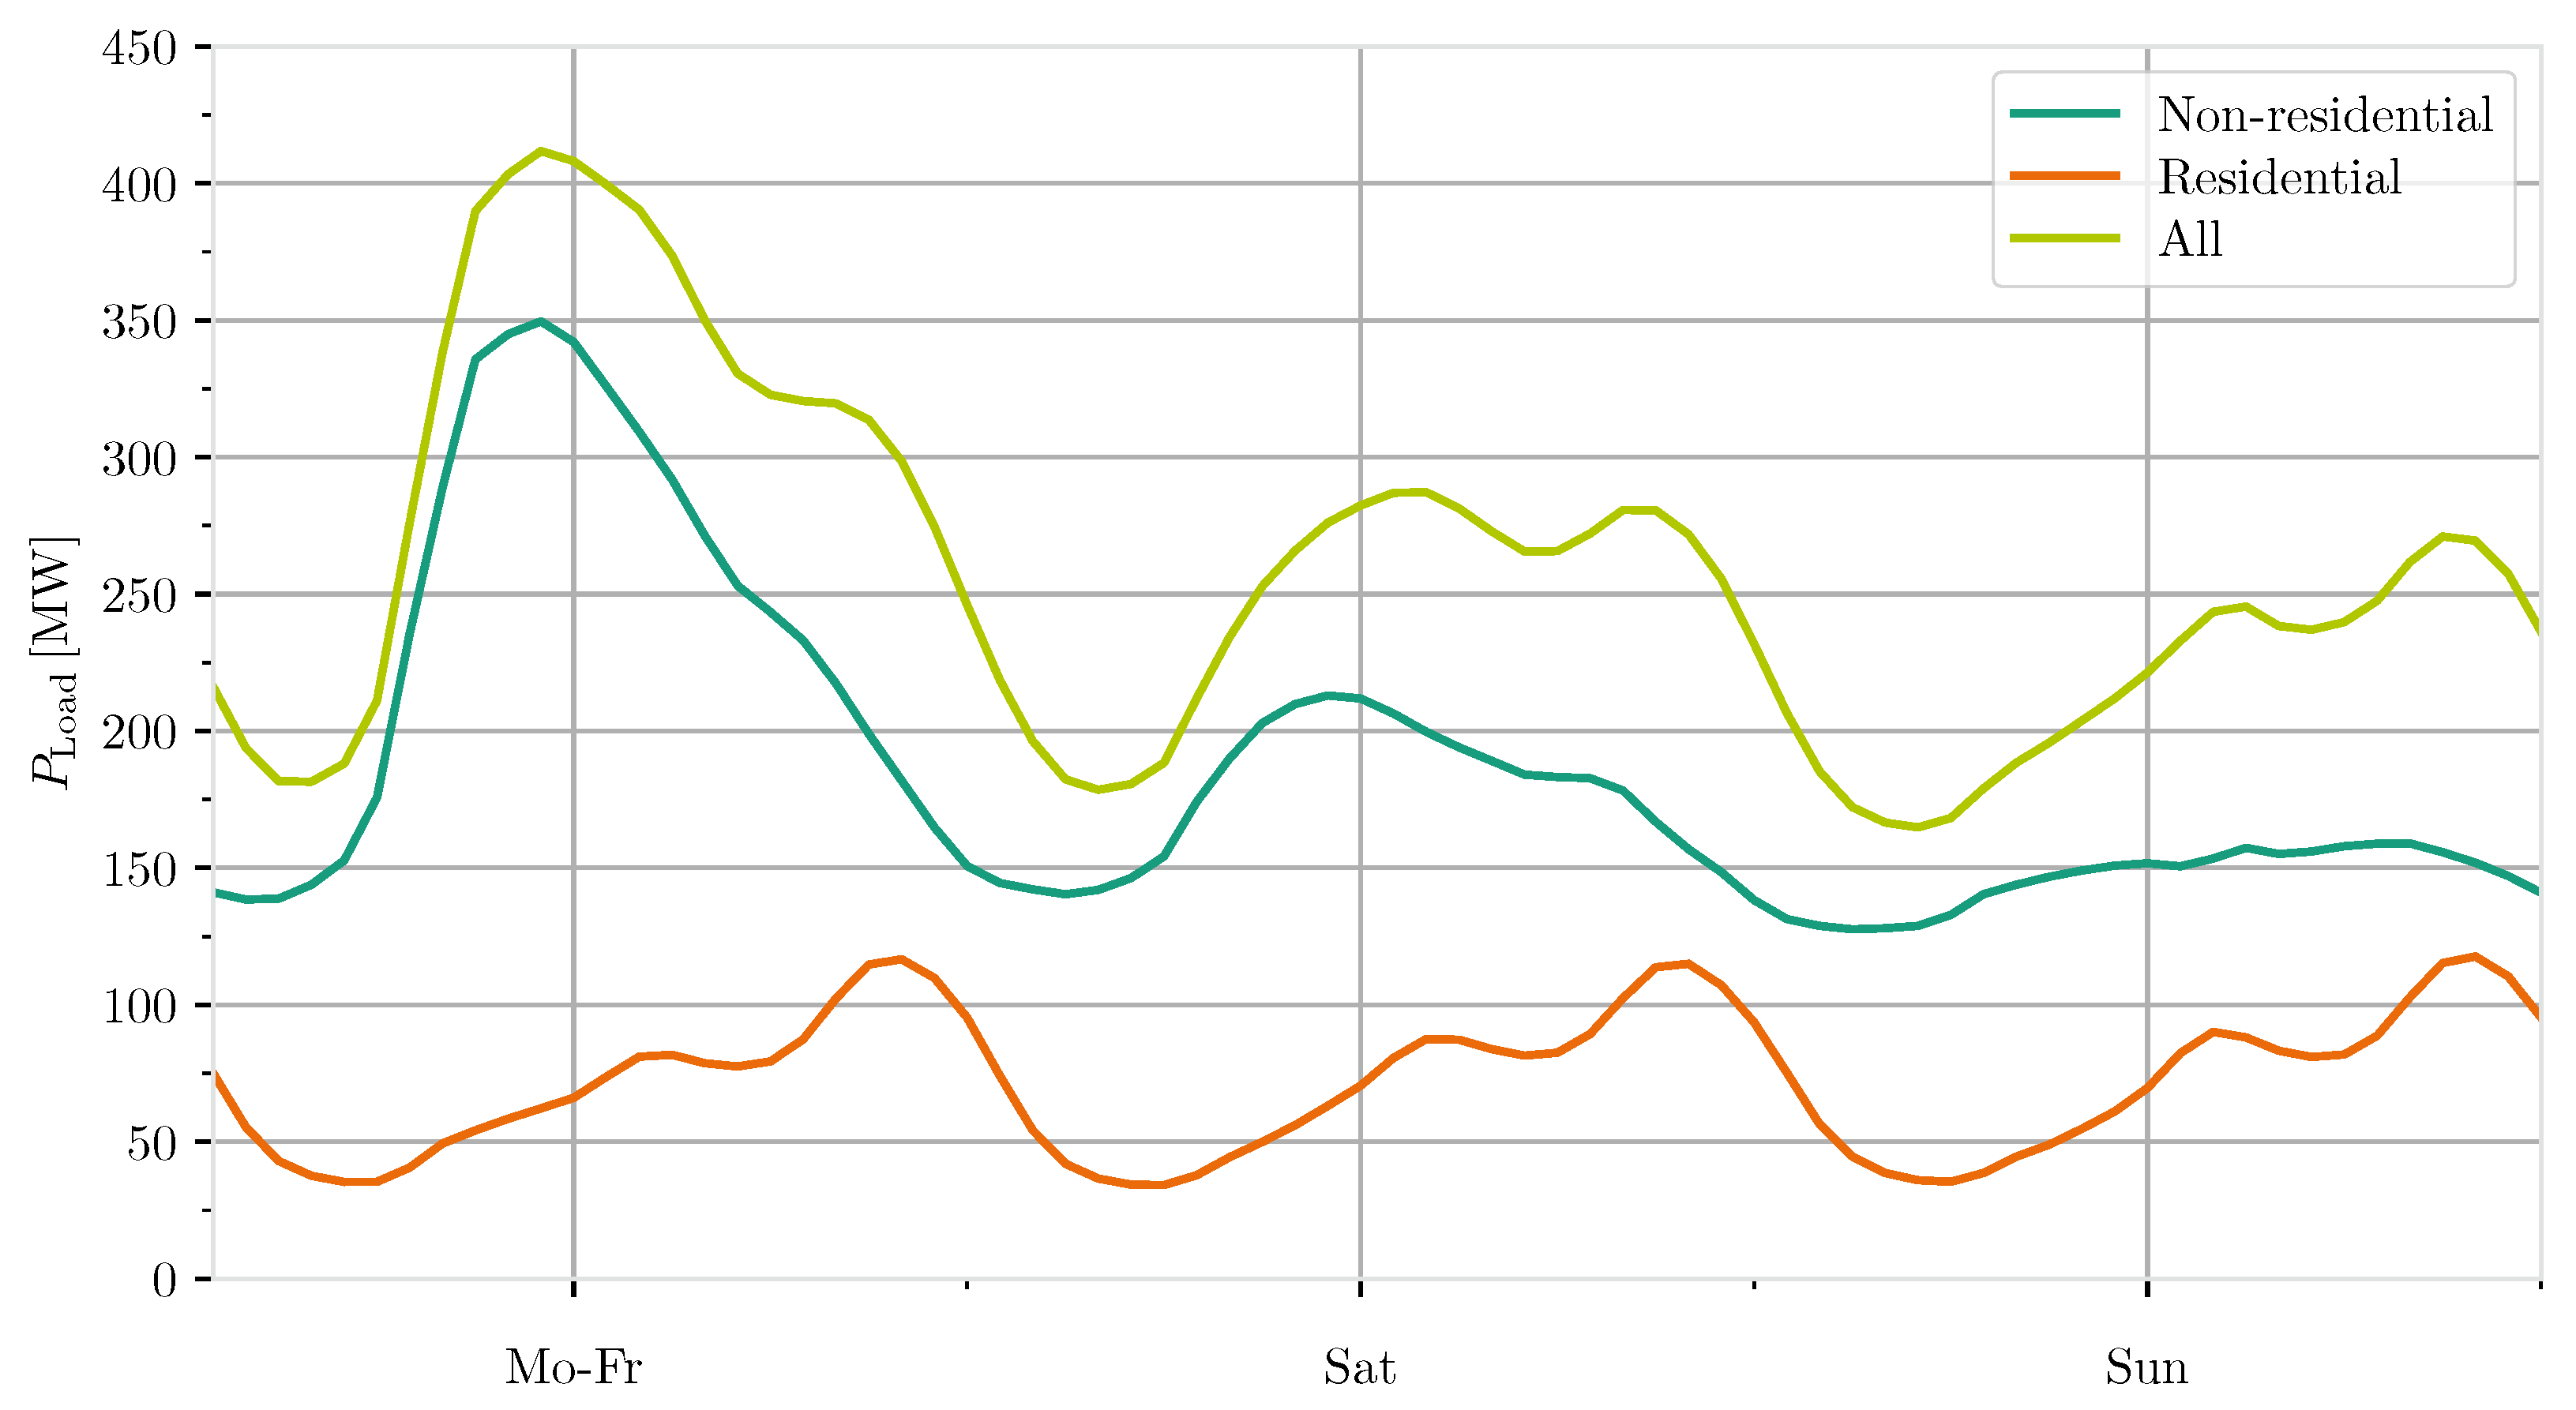
Figure 5 for the SOL subportfolio and for the full portfolio. The top panel shows monthly values of PV generation split into feed-in and self-consumption; in the bottom panel, the corresponding self-consumption rates are displayed. In each month, the SOL subportfolio exhibits higher self-consumption than does the full portfolio. Averaged of the whole year, self-consumption rates amount to 12% for the SOL subportfolio compared to 9.5% for the full portfolio. This can be attributed to the larger share of nonresidential buildings in the SOL subportfolio where the higher electricity demand (see
Figure 2) allows for potentially higher self-consumption.
Higher self-consumption rates during the winter compared to the summer months are observed in both portfolios, reaching more than 17% in the month of December with the least sunlight and, hence, lowest PV generation. In the full portfolio, this is almost twice as high as in the summer months with high PV generation. The seasonal variation is less distinct in the SOL subportfolio where self-consumption rates during summer still reach 10–12%.
4.2. Variation of Self-Consumption with Different Parameters
For insight into the most relevant factors influencing the self-consumption in a portfolio, we examined how its time course correlates with other quantities. This could help identify suitable quantities for a parameterized model of self-consumption based on measurement data.
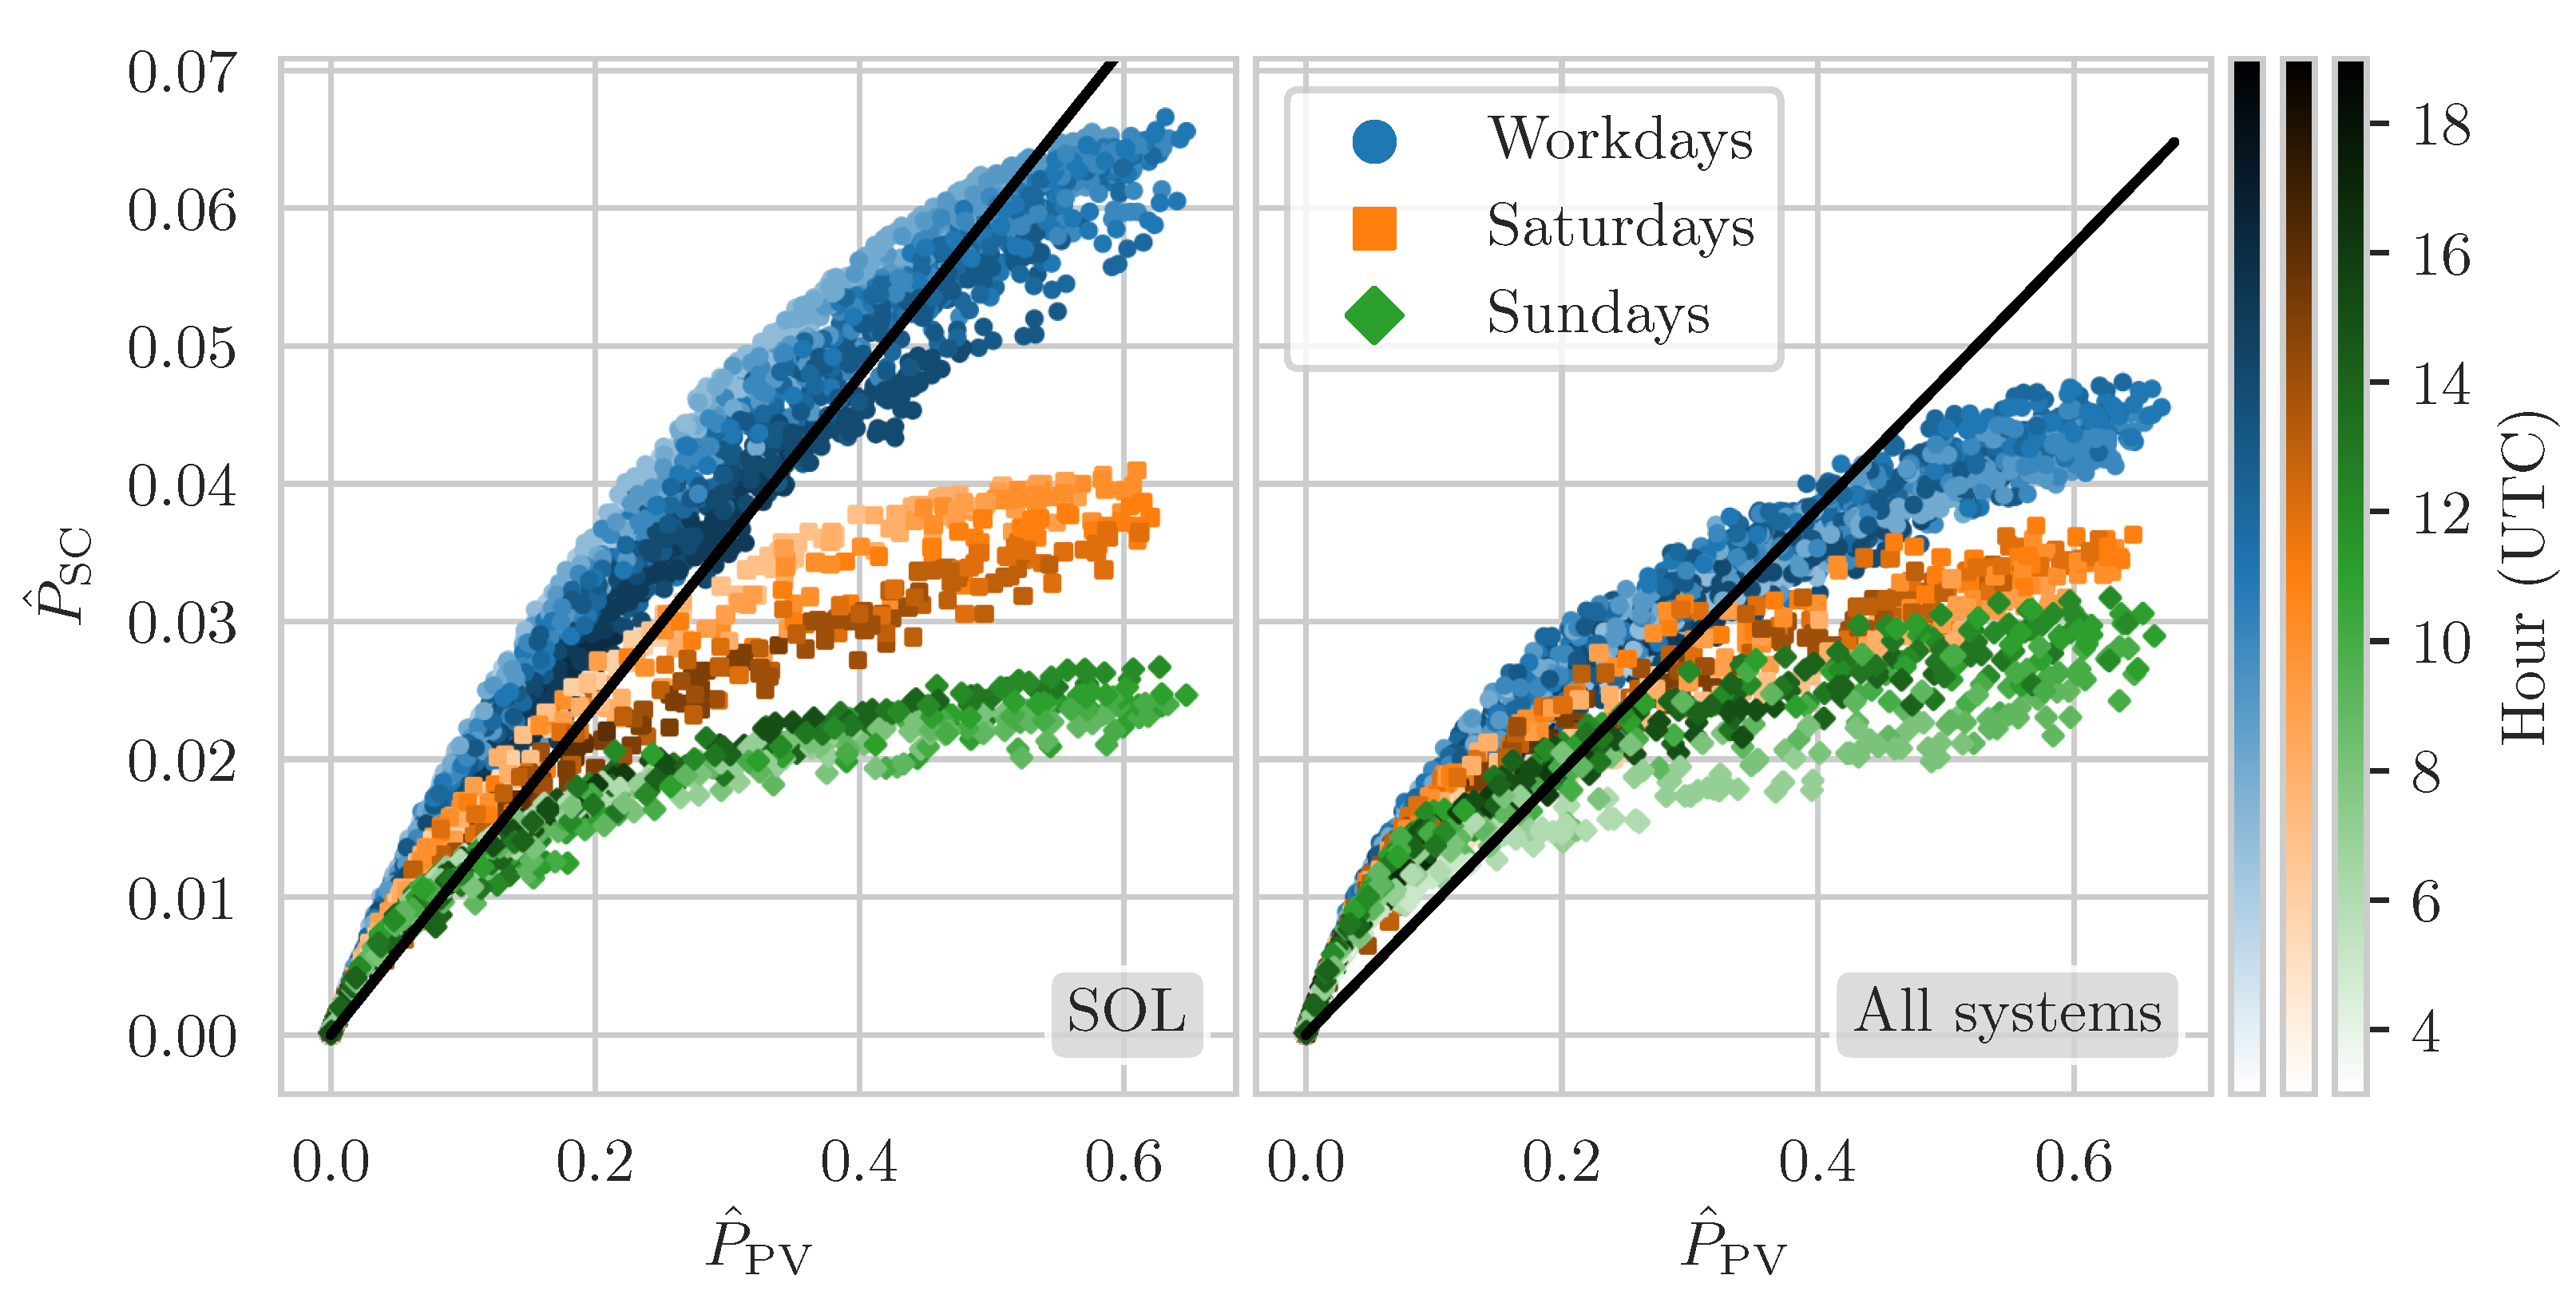
In
Figure 6, it can be seen how the total self-consumption relates to the corresponding PV generation at each time step. With higher PV generation, higher values of self-consumption are observed. For the SOL subportfolio, this increase splits into three distinct branches of higher, medium and lower self-consumption for workdays, Saturdays and Sundays, respectively. Additionally, the amount of self-consumption varies with the time of the day inside each branch. At a given level of PV generation, self-consumption is higher in the morning on workdays and Saturdays, whereas on Sundays, self-consumption is higher in the afternoon. In the full model portfolio, the same branching is observed but the differentiation between the days of the week is less pronounced. The trend towards higher self-consumption in the afternoon on weekends appears even stronger, while on workdays, the time of the day appears to have little influence. These effects can be expected from the different load profiles (
Figure 2), keeping in mind that the SOL subportfolio is dominated by the nonresidentials whereas the situation is more balanced in the full model portfolio.
The increase of the total self-consumption with PV generation in both portfolios exhibits a clearly nonlinear behaviour with a decreasing slope towards higher values of PV generation. An intuitive explanation of this is that for an increasing number of prosumers, the local PV generation exceeds the local demand, prohibiting a further increase of self-consumption at this site. As a result, the “PV-scaled” reference model indicated by the linear relation (black line) in
Figure 6 will generally underestimate self-consumption in situations of low PV generation and overestimate in situations of high PV generation. This was also observable in the validation of both models against measured feed-in (see
Figure 3).
From these observations, we draw three central conclusions. First, the assumption that the two portfolios behave differently is strengthened. A feed-in estimate based on the SOL subportfolio only will not adequately reproduce the effects of self-consumption in the full model portfolio. Second, self-consumption varies significantly with the courses of day and week, particularly in the SOL subportfolio. Hence, the day of the week and the time of the day might be relevant quantities for a parametrization of a refined model for PV self-consumption. Third, in a portfolio of PV/prosumer systems, the total self-consumption does not scale linearly with the total PV generation. An appropriate model capturing this nonlinear relation is very likely to generate more satisfactory estimates of self-consumption and feed-in.
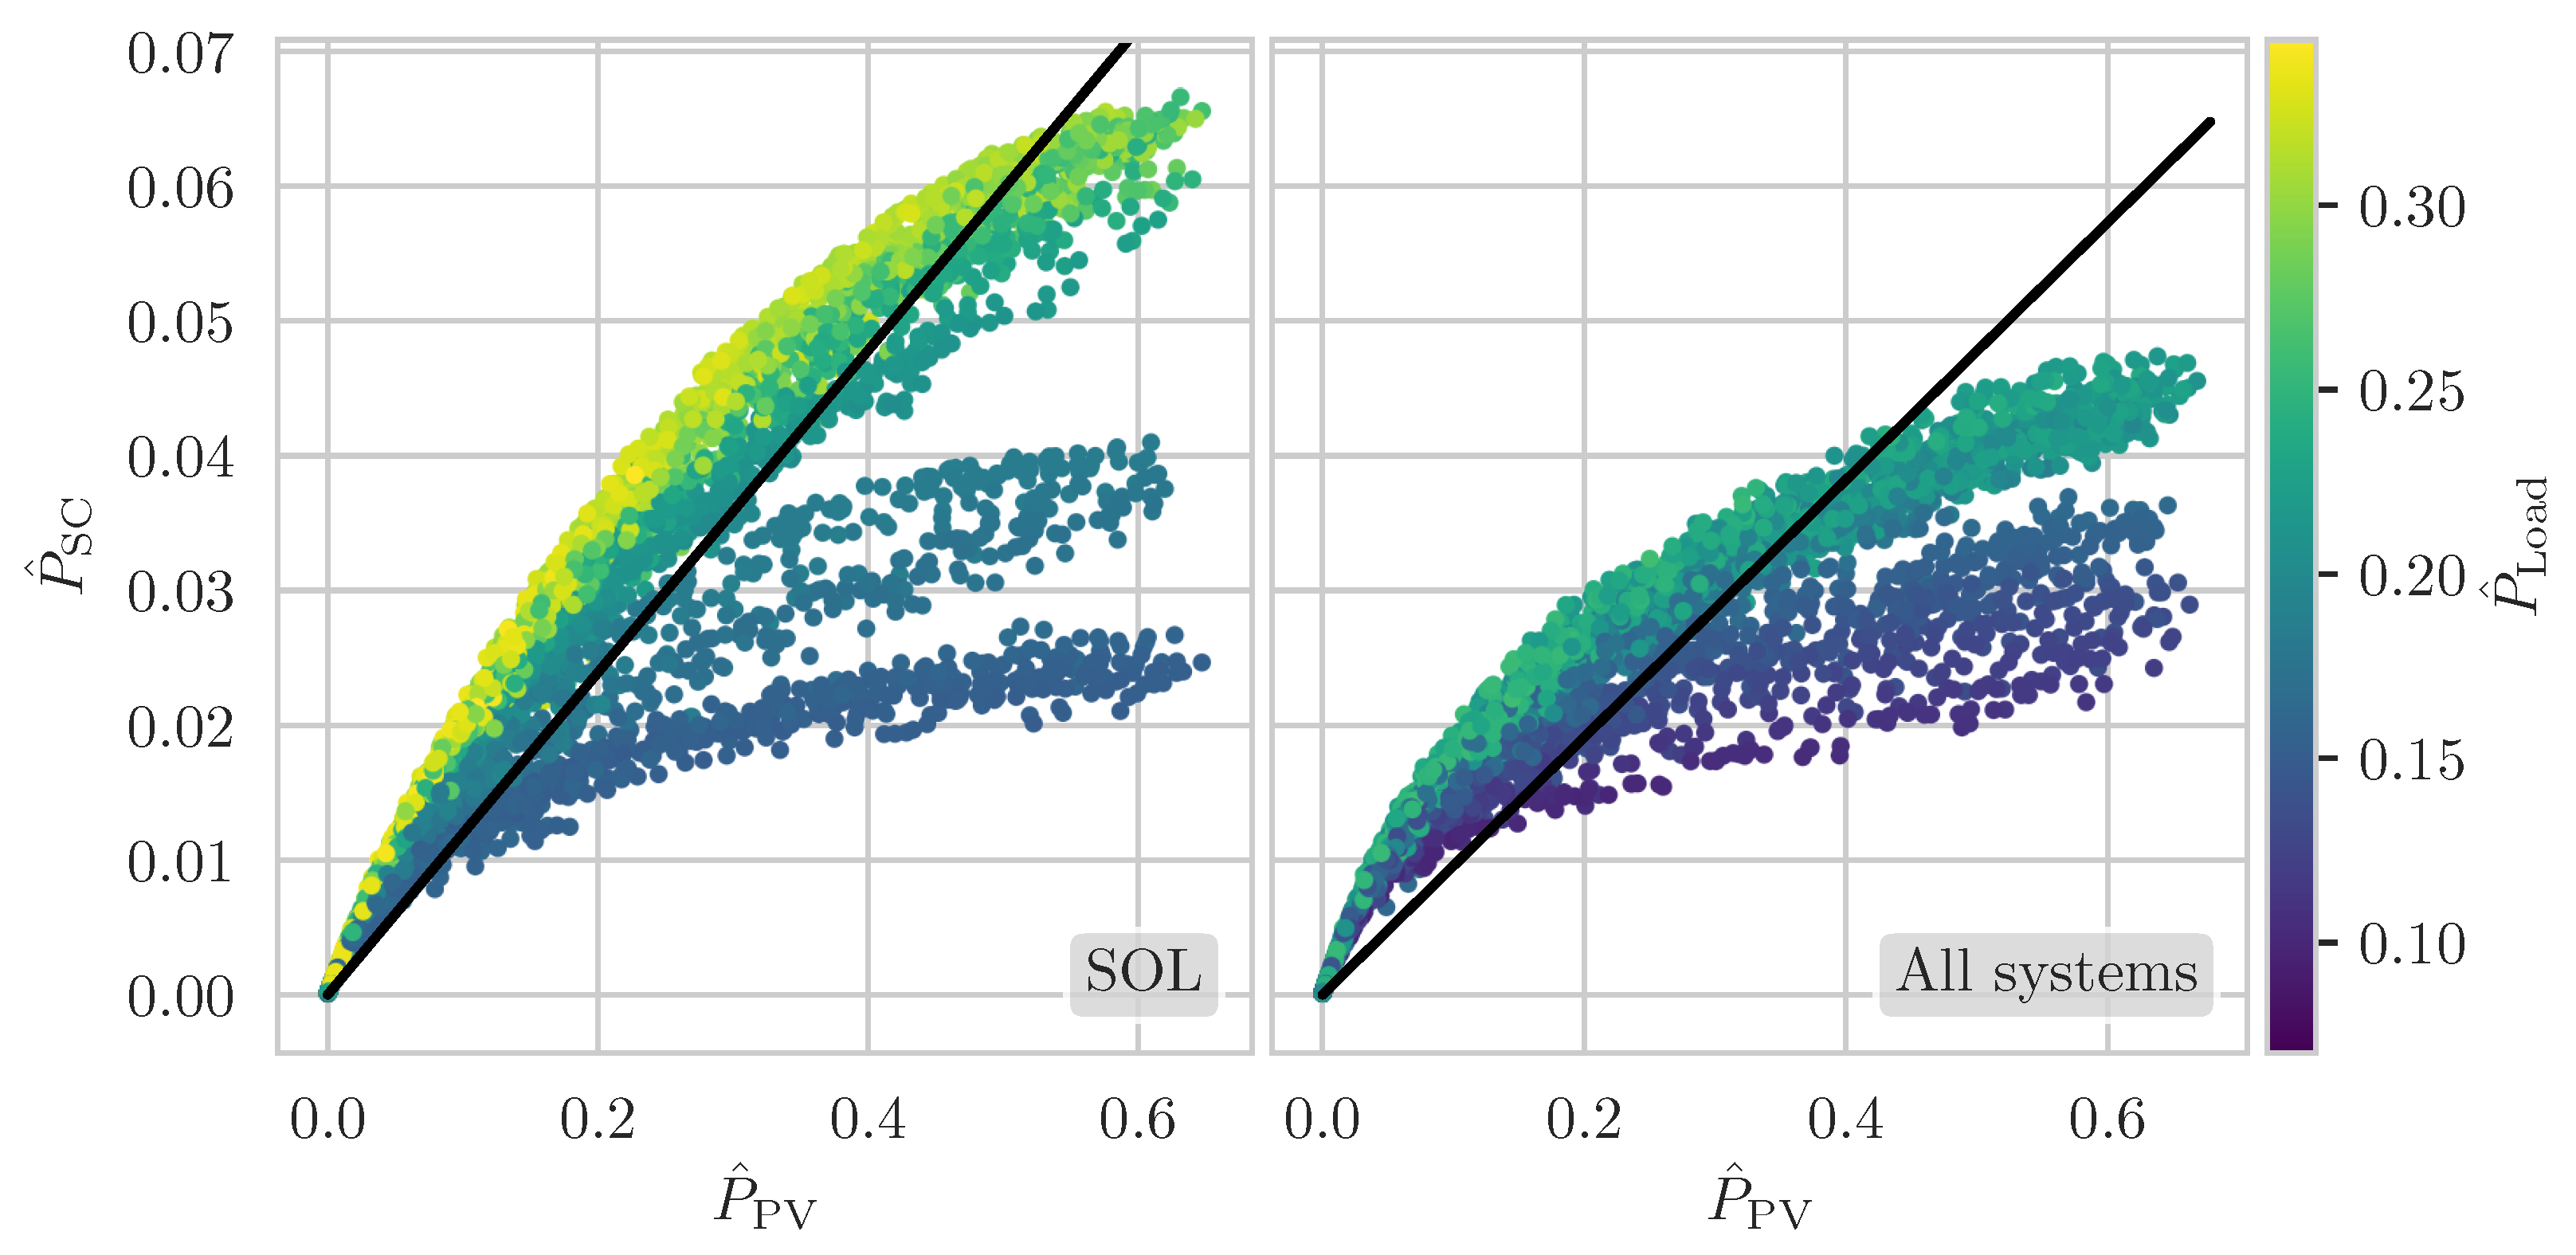
Another natural candidate for the parametrization of a self-consumption model is the total electricity demand of all buildings with PV systems in the grid. In
Figure 7, the same data as in
Figure 6 are shown with different colouring. Instead of day and time, the colour spectrum represents the corresponding specific load
. An overall positive correlation between self-consumption and load is observed for any given value of PV generation. The separation into workdays and weekends appears implicit in this parameter, as the latter exhibit lower load values. Similarly, the observed daily cycles in self-consumption seem to be strongly related to different load levels.
From the definition of self-consumption on an individual system level (Equation (
1)), an increase of the total self-consumption with the total PV generation and load, as observed above, can be expected. The overall behaviour on a grid level is, however, not as trivial as the distribution of the total energy generation among the individual PV systems, and the distribution of the total load among the individual consumers and the share of prosumers in the grid induce strong nonlinearities. As consequence, parameters relating the total self-consumption to the total PV generation or the total demand necessarily have to be calibrated to the specific PV/prosumer system portfolio.
Post-FIT Scenario
It can be expected that with increasing electricity consumption costs and decreasing FITs, self-consumption will become increasingly attractive. In an extreme case, all PV systems associated with a consumer might act as prosumers. If the prosumer systems in the model portfolio form a representative subset of the full PV system portfolio, it can be expected that the overall self-consumption rate increases with the ratio of installed nominal powers (of all PV systems to the systems designed for self-consumption today, see
Table 2) from 9.5% to 29.5%. In a “post-FIT” scenario, we apply the 100% prosumer situation to the model system and examine the effects on the net self-consumption rates. As we keep the PV portfolio constant and do not consider additional technologies like battery storage here, this is not expected to resemble the future reality but rather highlight the possible effects in a certain boundary case. For the simulation of the full system, we find a self-consumption rate of 26.2%, which is in good agreement with the estimate. For the SOL subportfolio, the situation is completely different. The scaling by the installed nominal powers yields a self-consumption rate of 38.0%, while in the simulation, we find 20.4%, indicating that the SOL systems currently designed for self-consumption are not a representative subset of all SOL systems.
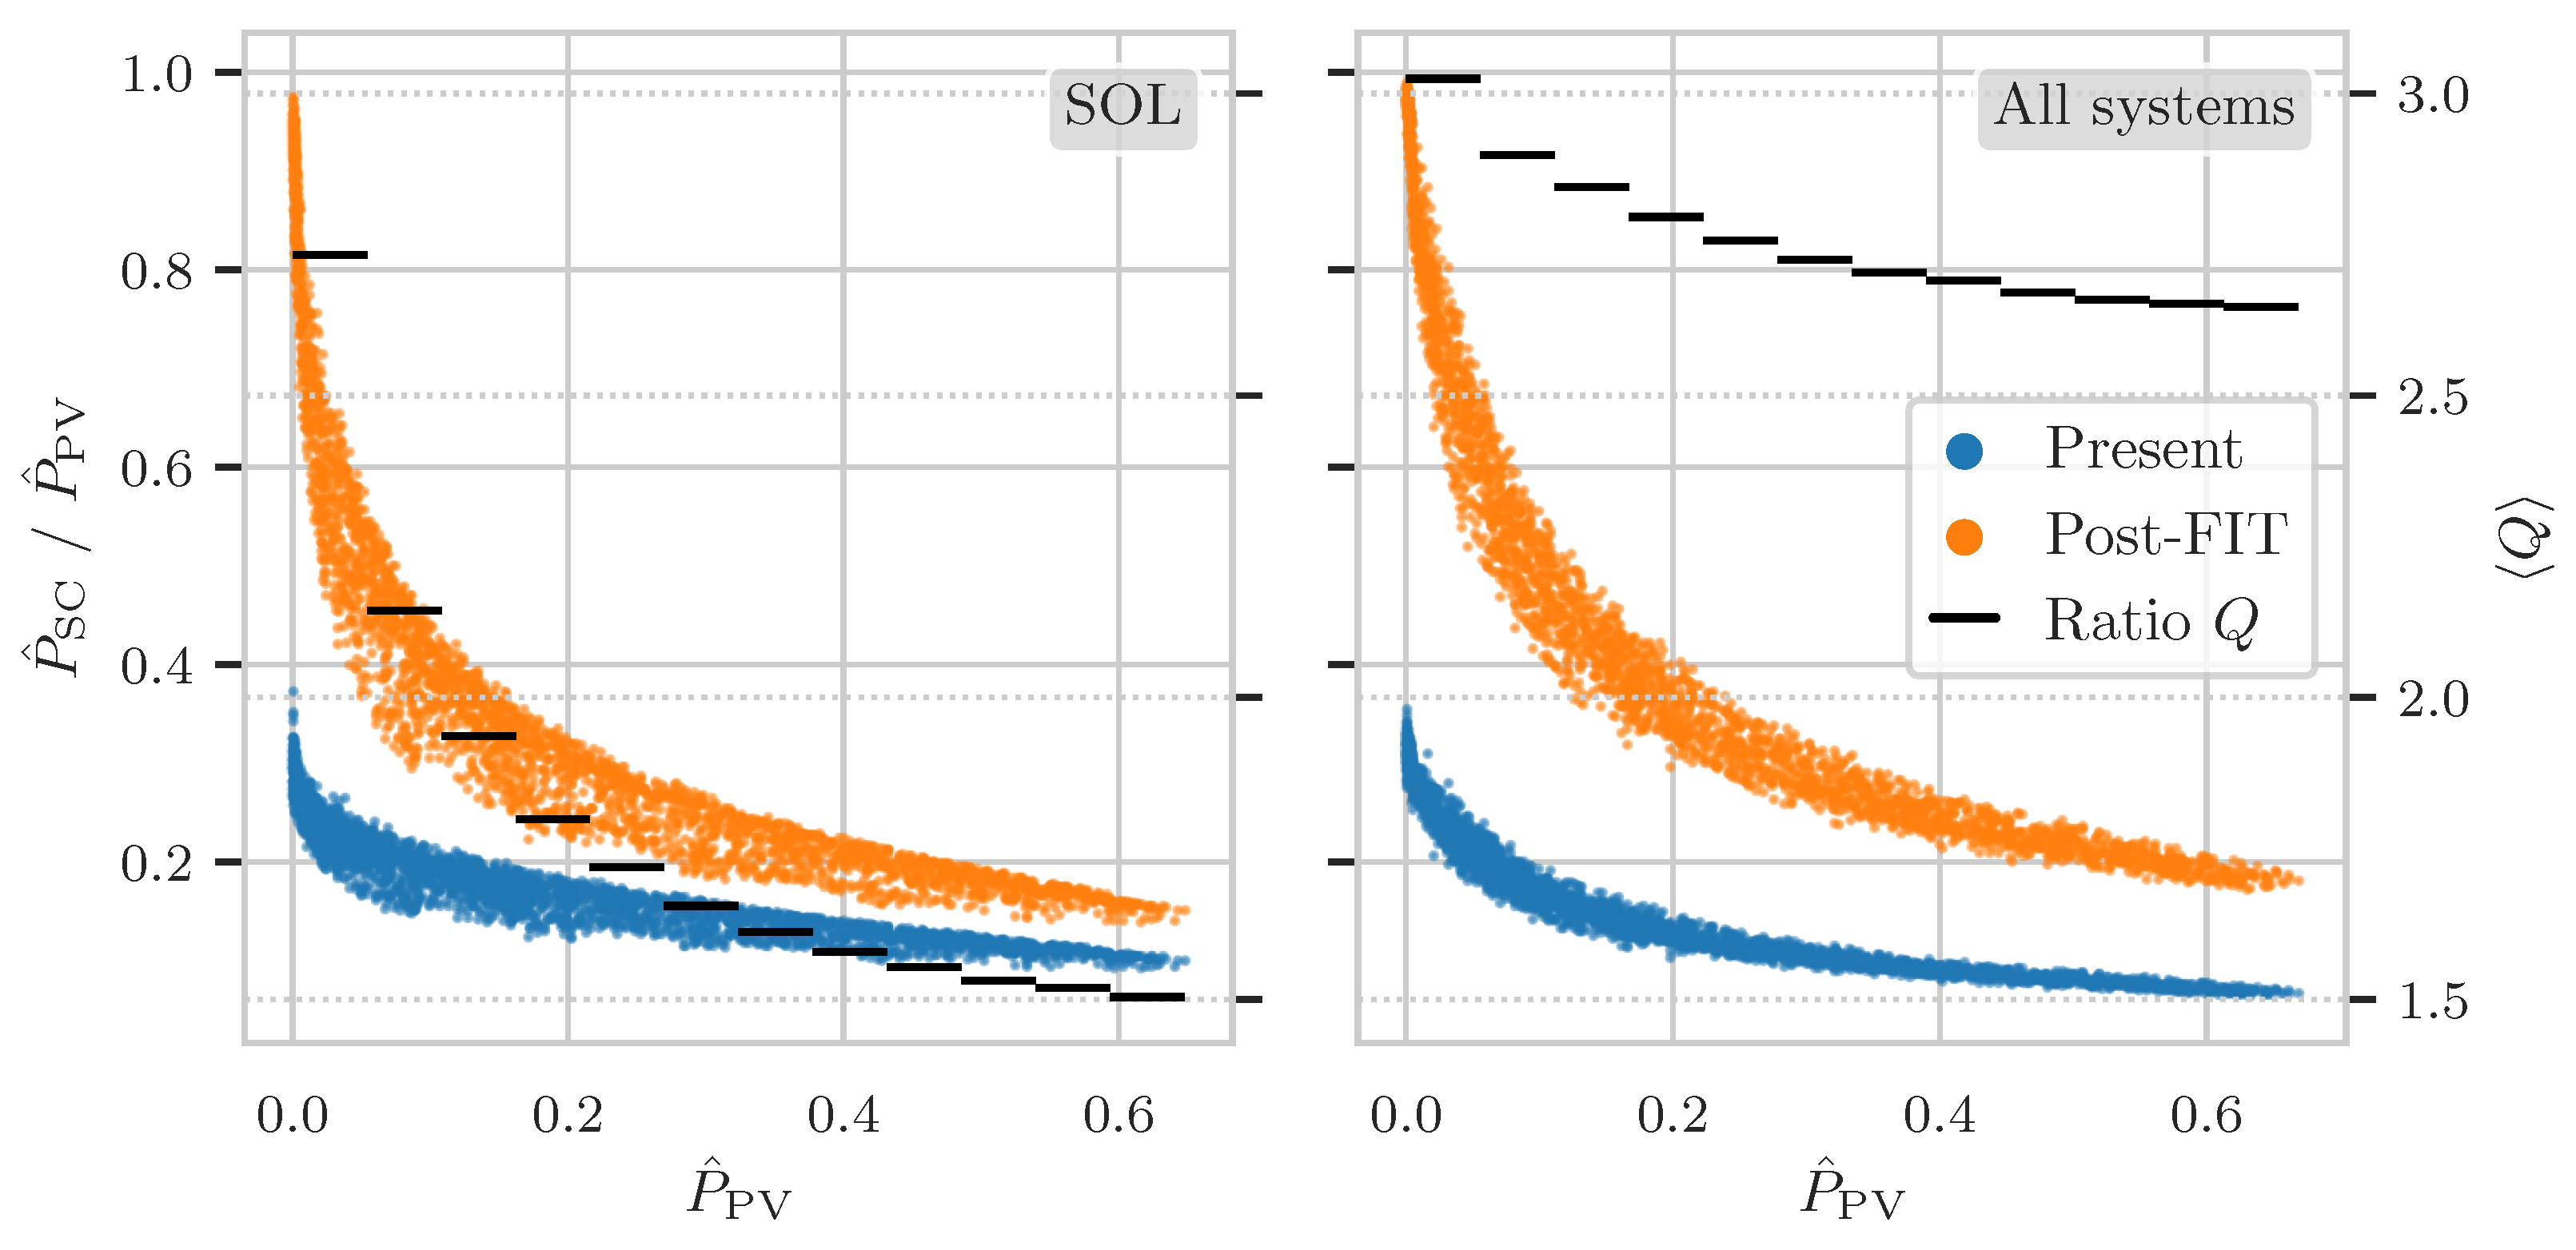
Figure 8 compares the time-dependent self-consumption rate
, for the present state and the post-FIT scenario. The observed overall shape of decreasing self-consumption rates with increasing PV generation is similar in either scenario and portfolio. In the “present” scenario, the self-consumption rate decreases from slightly below 40% to a value between 10 and 20% with increasing PV generation in both portfolios, the SOL systems and the full model. In the post-FIT scenario, almost 100% of the produced energy is taken up by self-consumption at low PV generation. With increasing PV generation, the self-consumption rate initially drops faster in the SOL subportfolio than in the full model but reaches a value slightly below 20% at maximum PV generation in both portfolios. In order to quantify the change in self-consumption behaviour, we also show the ratio
Q of the self-consumption rate in the present to the post-FIT scenario as bin averages over the full range of PV generation. Compared to the simple estimate based on the nominal PV power mentioned above,
Q would be the real scaling factor to predict the future self-consumption from the present state.
decreases from 2.75 for low to around 1.5 for high PV generation values in the SOL portfolio. In the full model, the trend is the same, but the variation is much smaller with all values between 2.5 and 3. This confirms the observation that the linear scaling of self-consumption rates (with the ratio of 3.1 of installed nominal powers) is a viable approach in the full model portfolio but not in the SOL subportfolio. Again, we can conclude that the measurement-based knowledge of the behaviour of the SOL subportfolio cannot simply be extrapolated to the full portfolio.
5. Conclusions
In this paper, we introduced a stochastic bottom-up simulation model of PV generation, self-consumption and feed-in for a portfolio of 118,650 PV prosumers. Although statistic deviations at the individual system level are expected, this provides a realistic representation of the situation in a German transmission system and, thus, a valid description at higher levels of aggregation can be assumed. The model builds on established methods for satellite-derived solar irradiance calculations and PV simulations combined with synthetic load profile generation for households and commercial buildings. In the model validation, a deviation of less than 5% to annual meter readings was reached. Furthermore, a relative RMSE of less than 2% (of the nominal power) was obtained in comparison with the aggregated feed-in time series at the distribution grid level. Compared to a linear reference model in which the time dependence is derived from the time course of PV generation only, a relative improvement of more than 4% was observed.
The variation of self-consumption at different time scales was analysed as was the relation to the grid total of PV generation and electric load. These quantities were identified as candidates for the parametrization of a data-driven self-consumption model. Furthermore, several observations strengthen the assumption that the time-dependent behaviour of a grid-level PV/prosumer portfolio cannot simply be deduced from the currently available measurements. In a post-FIT scenario of 100% prosumers as a limiting case, the overall self-consumption rates that can be expected for different PV system portfolios were identified.
Of course, a number of improvements to the model presented here are possible. The use of real PV module orientations and the inclusion of representative industry load profiles or different prosumer strategies could be fruitful and yield quantitatively more precise results. Nevertheless, we are confident that our model system provides reasonable insight into the problem of self-consumption in the present state. Furthermore, it establishes a solid basis for the integration of additional technologies such as battery storage devices, heat pumps or electric cars. In this way, the impact of future technologies and diversifying usage strategies can be studied systematically in different scenarios.


