
Numerical Analysis of Flow Boiling Characteristics of a Single Channel Heat Sink Subjected to Multiple Heat Sources

Abstract
:1. Introduction
2. Calculation Method
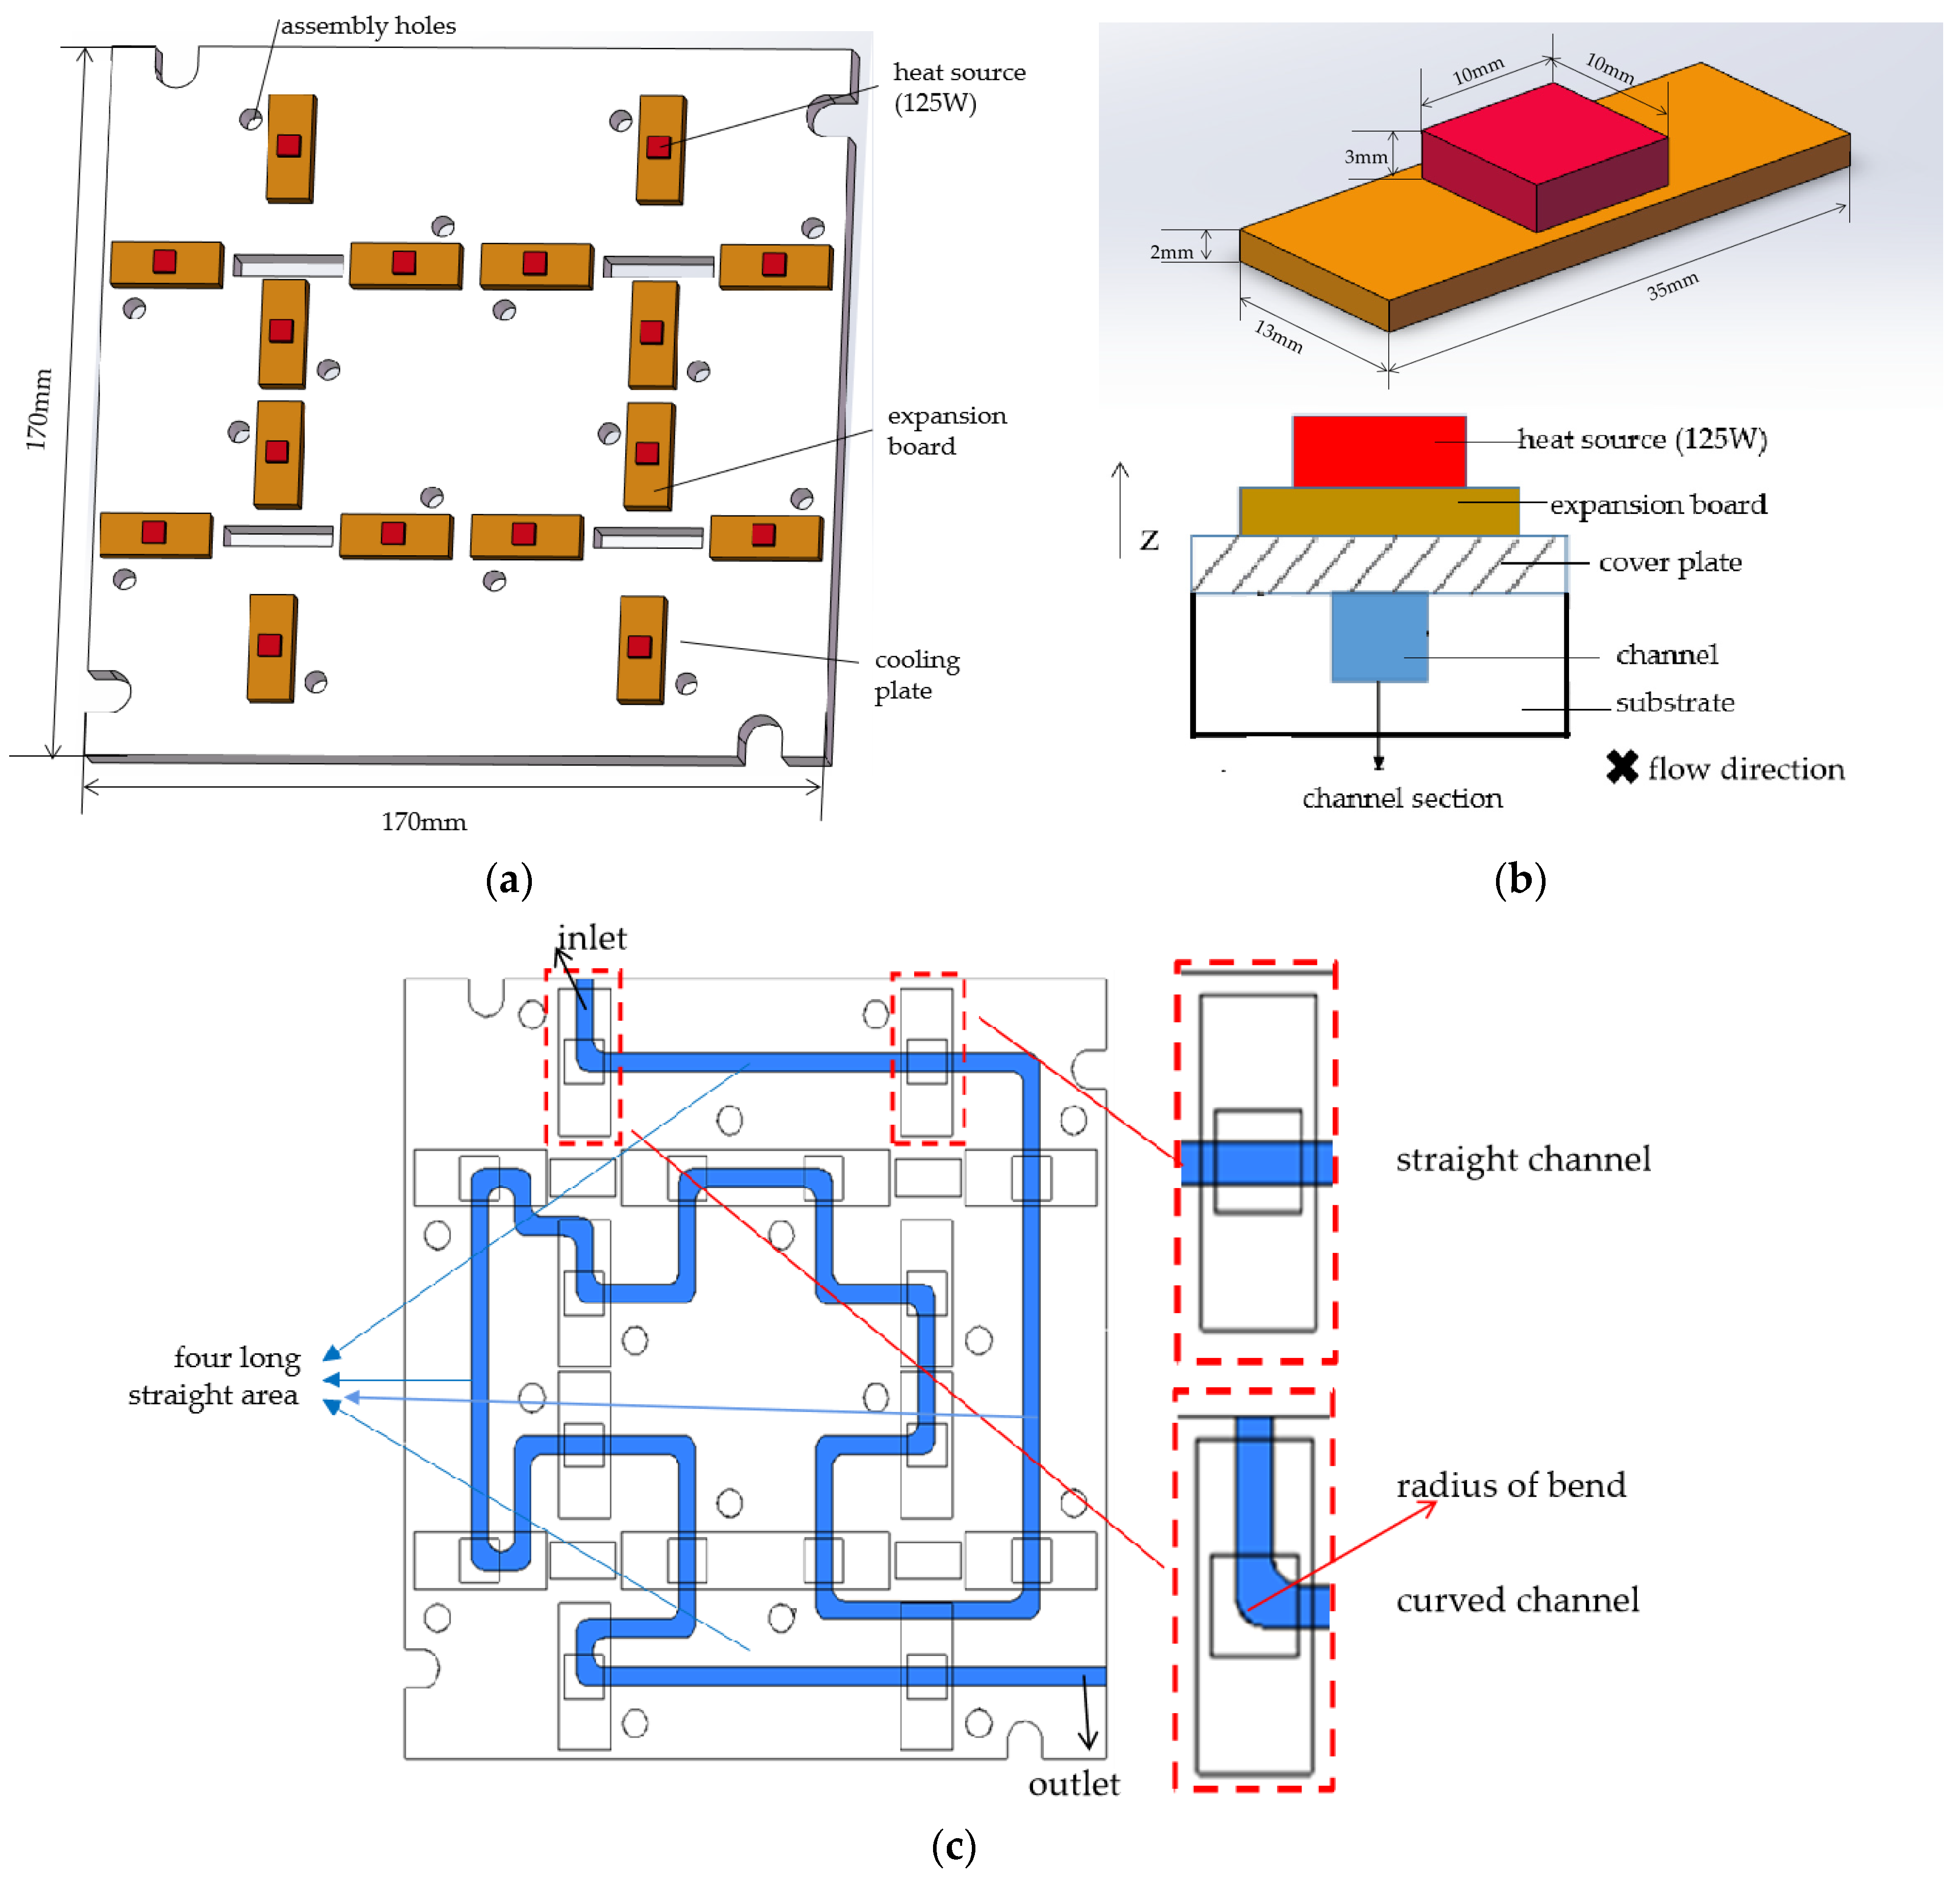
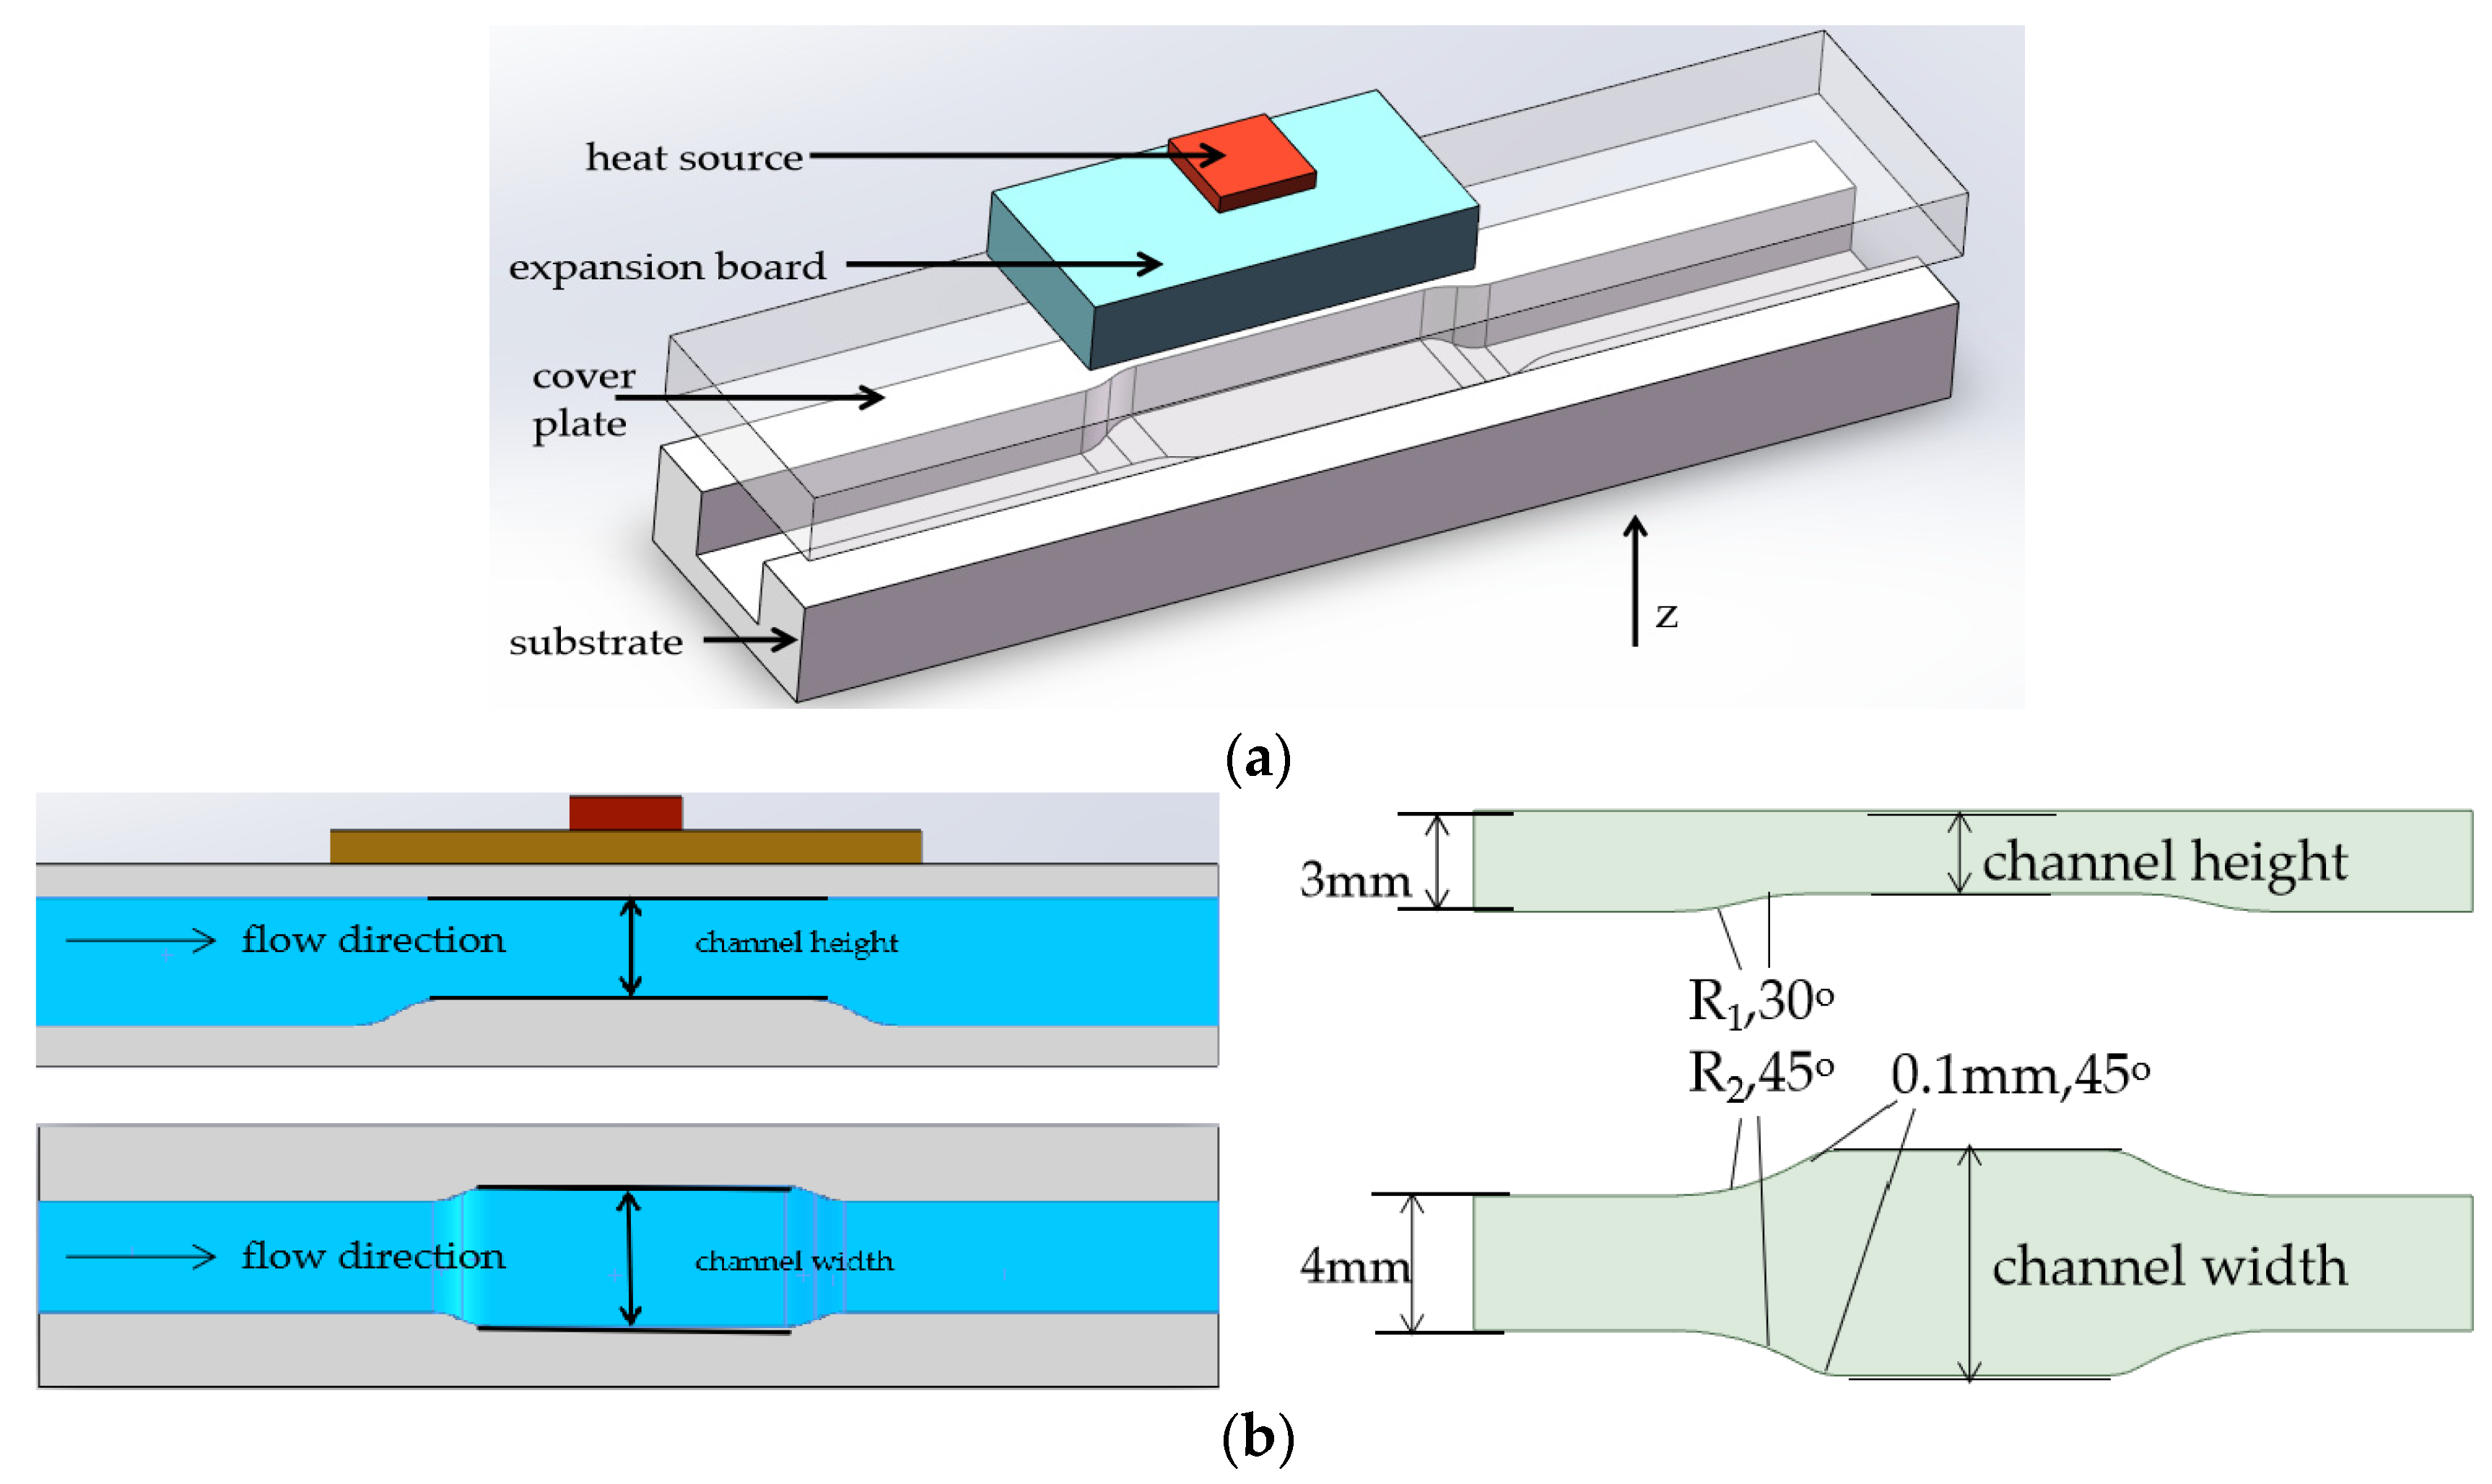
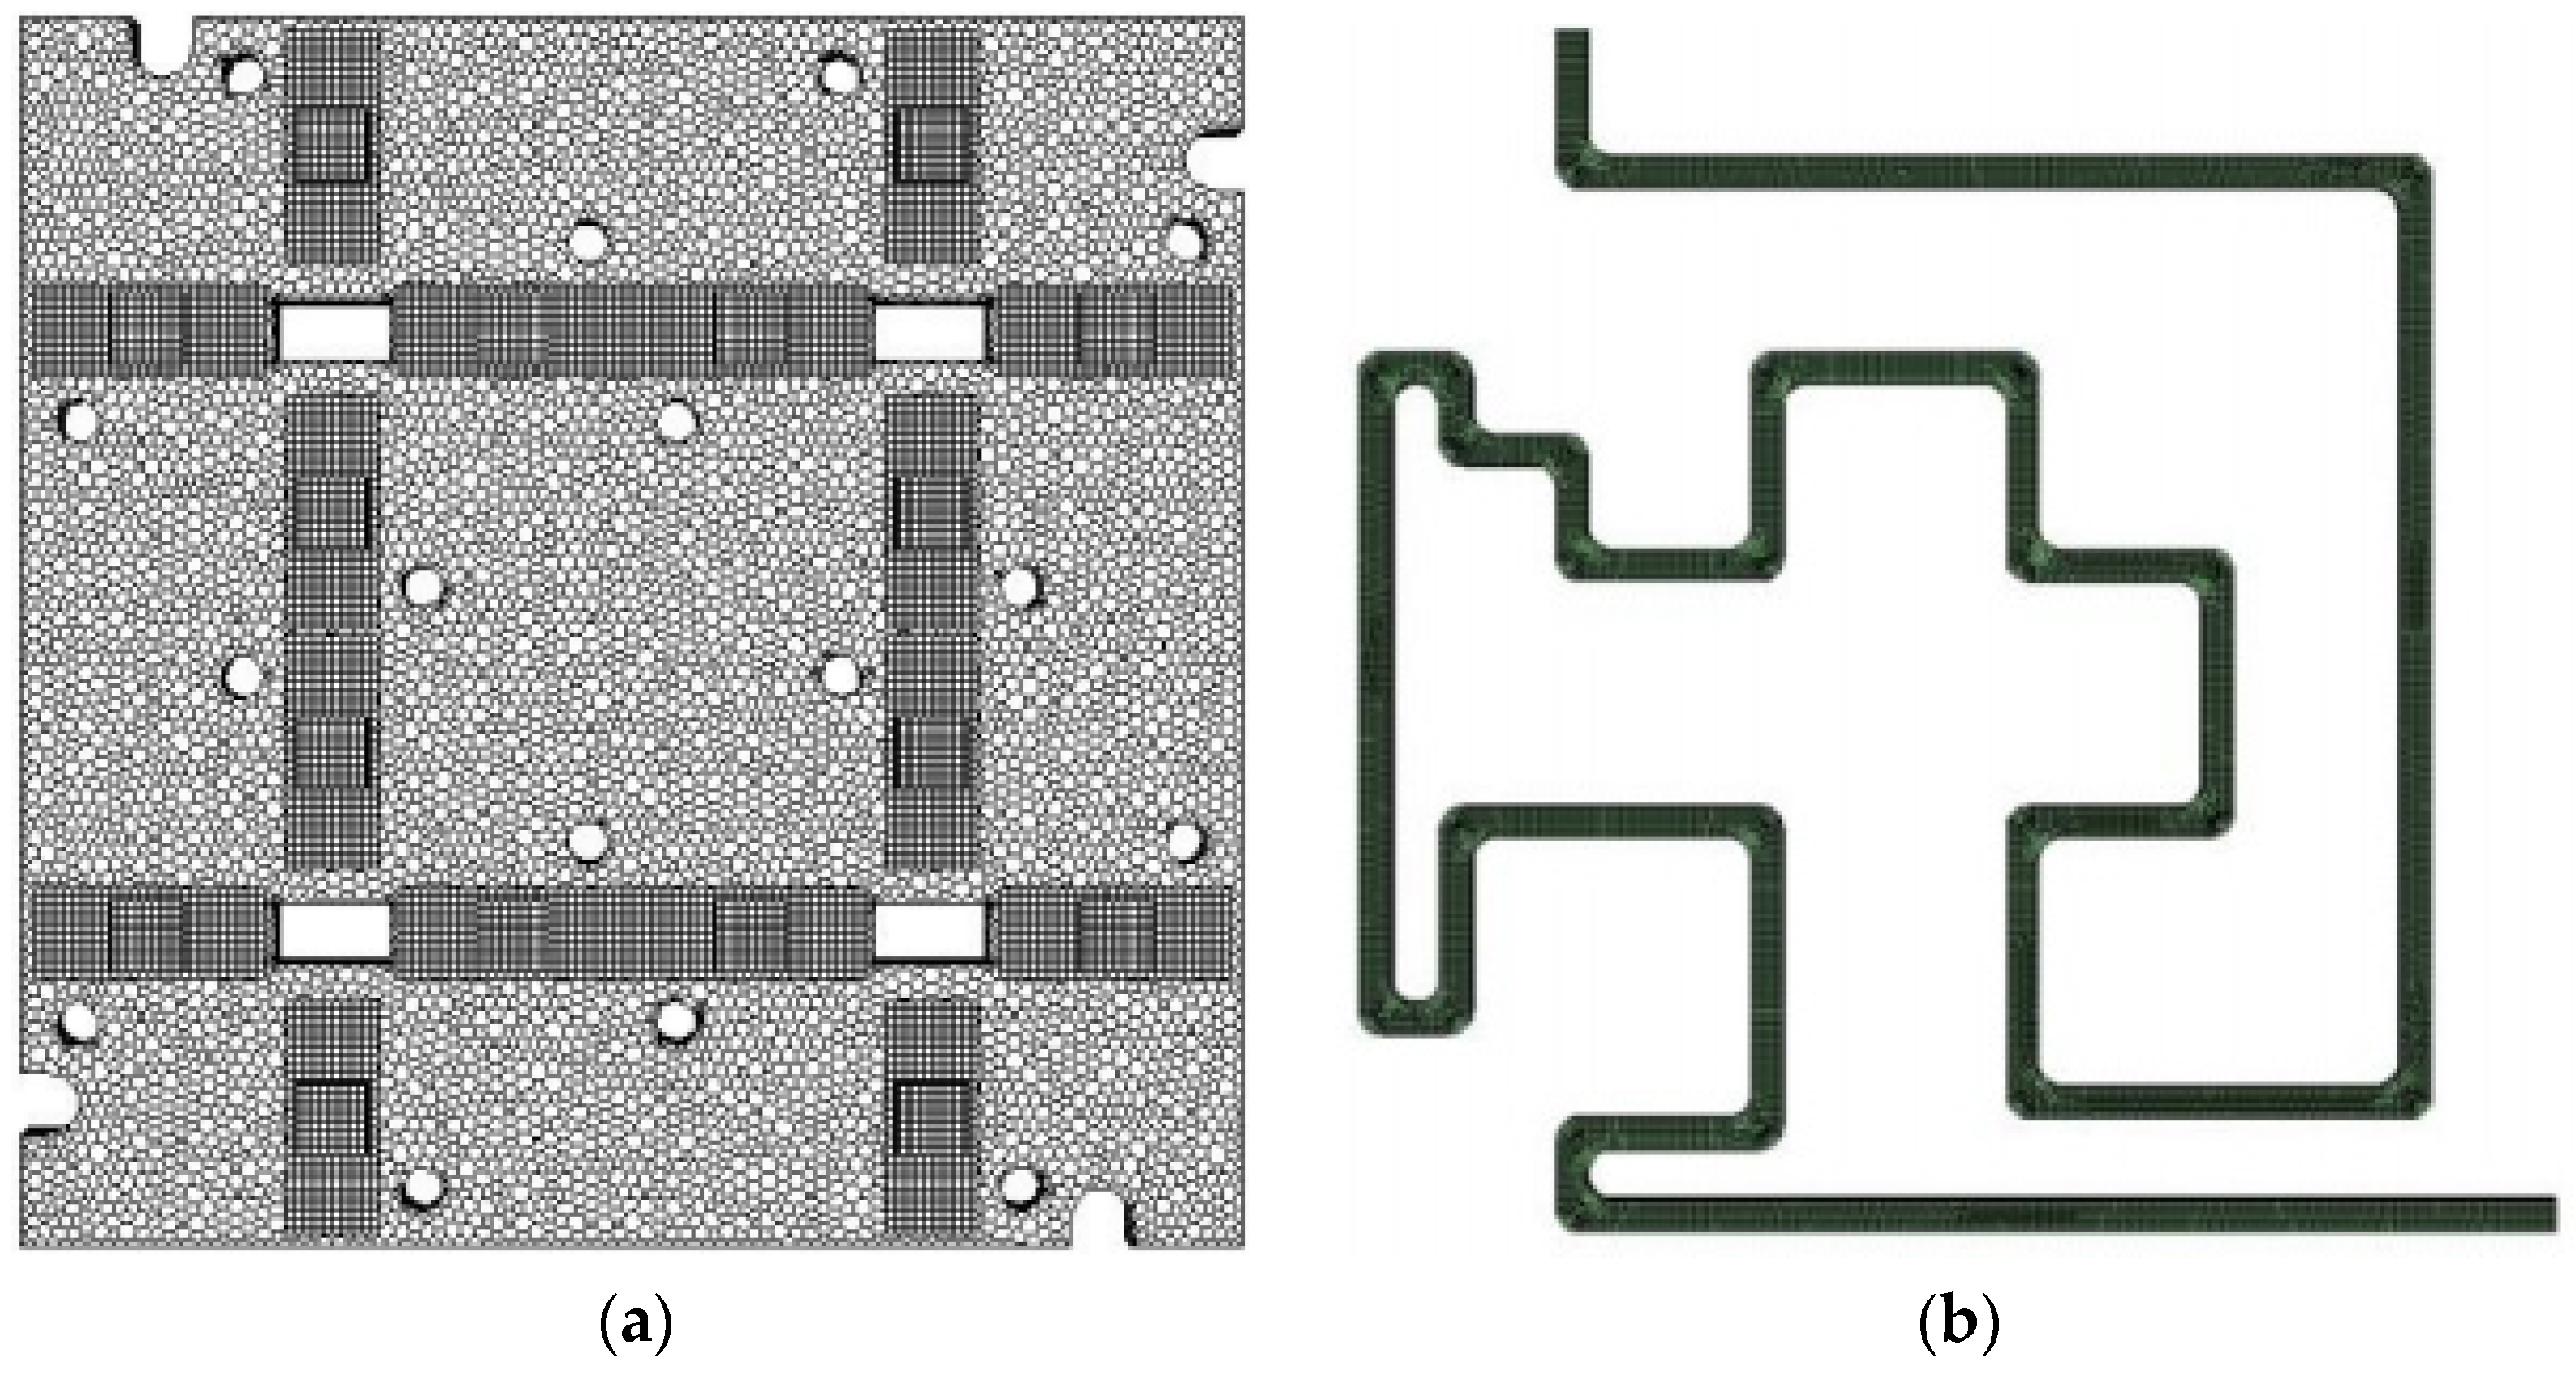
2.1. Physical Model
2.2. Mathematical Models
- (1)
- The mass flow rate is steady.
- (2)
- All energy lost by the bubble due to drag is converted to turbulence kinetic energy of the liquid in the wake of the bubble.
- (3)
- The outer surfaces of the model are all adiabatic.
2.3. Numerical Method and Boundary Conditions
2.4. Grid Generation and Independence Verification
3. Results and Discussion
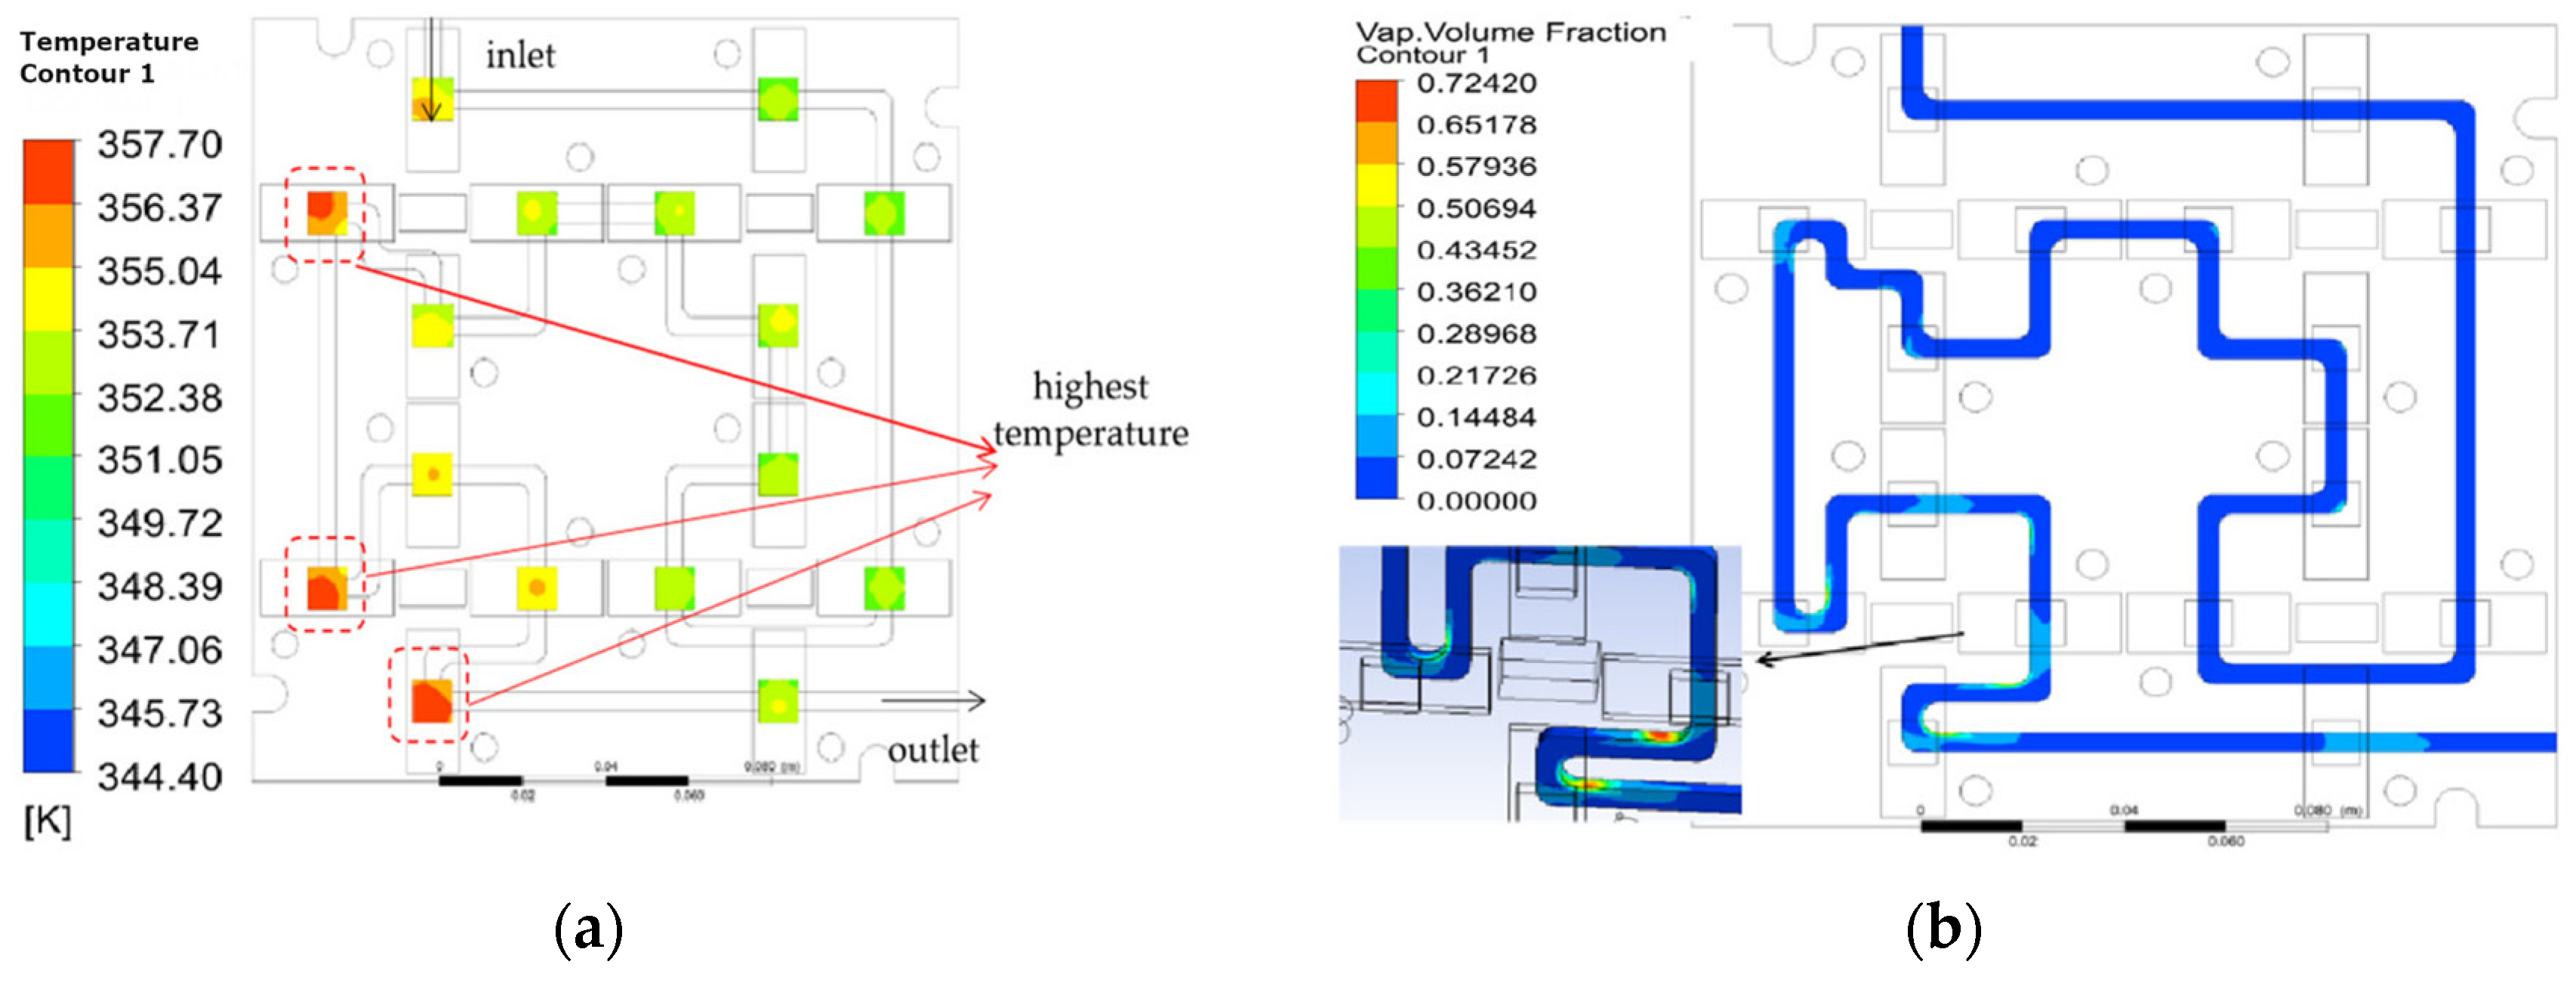
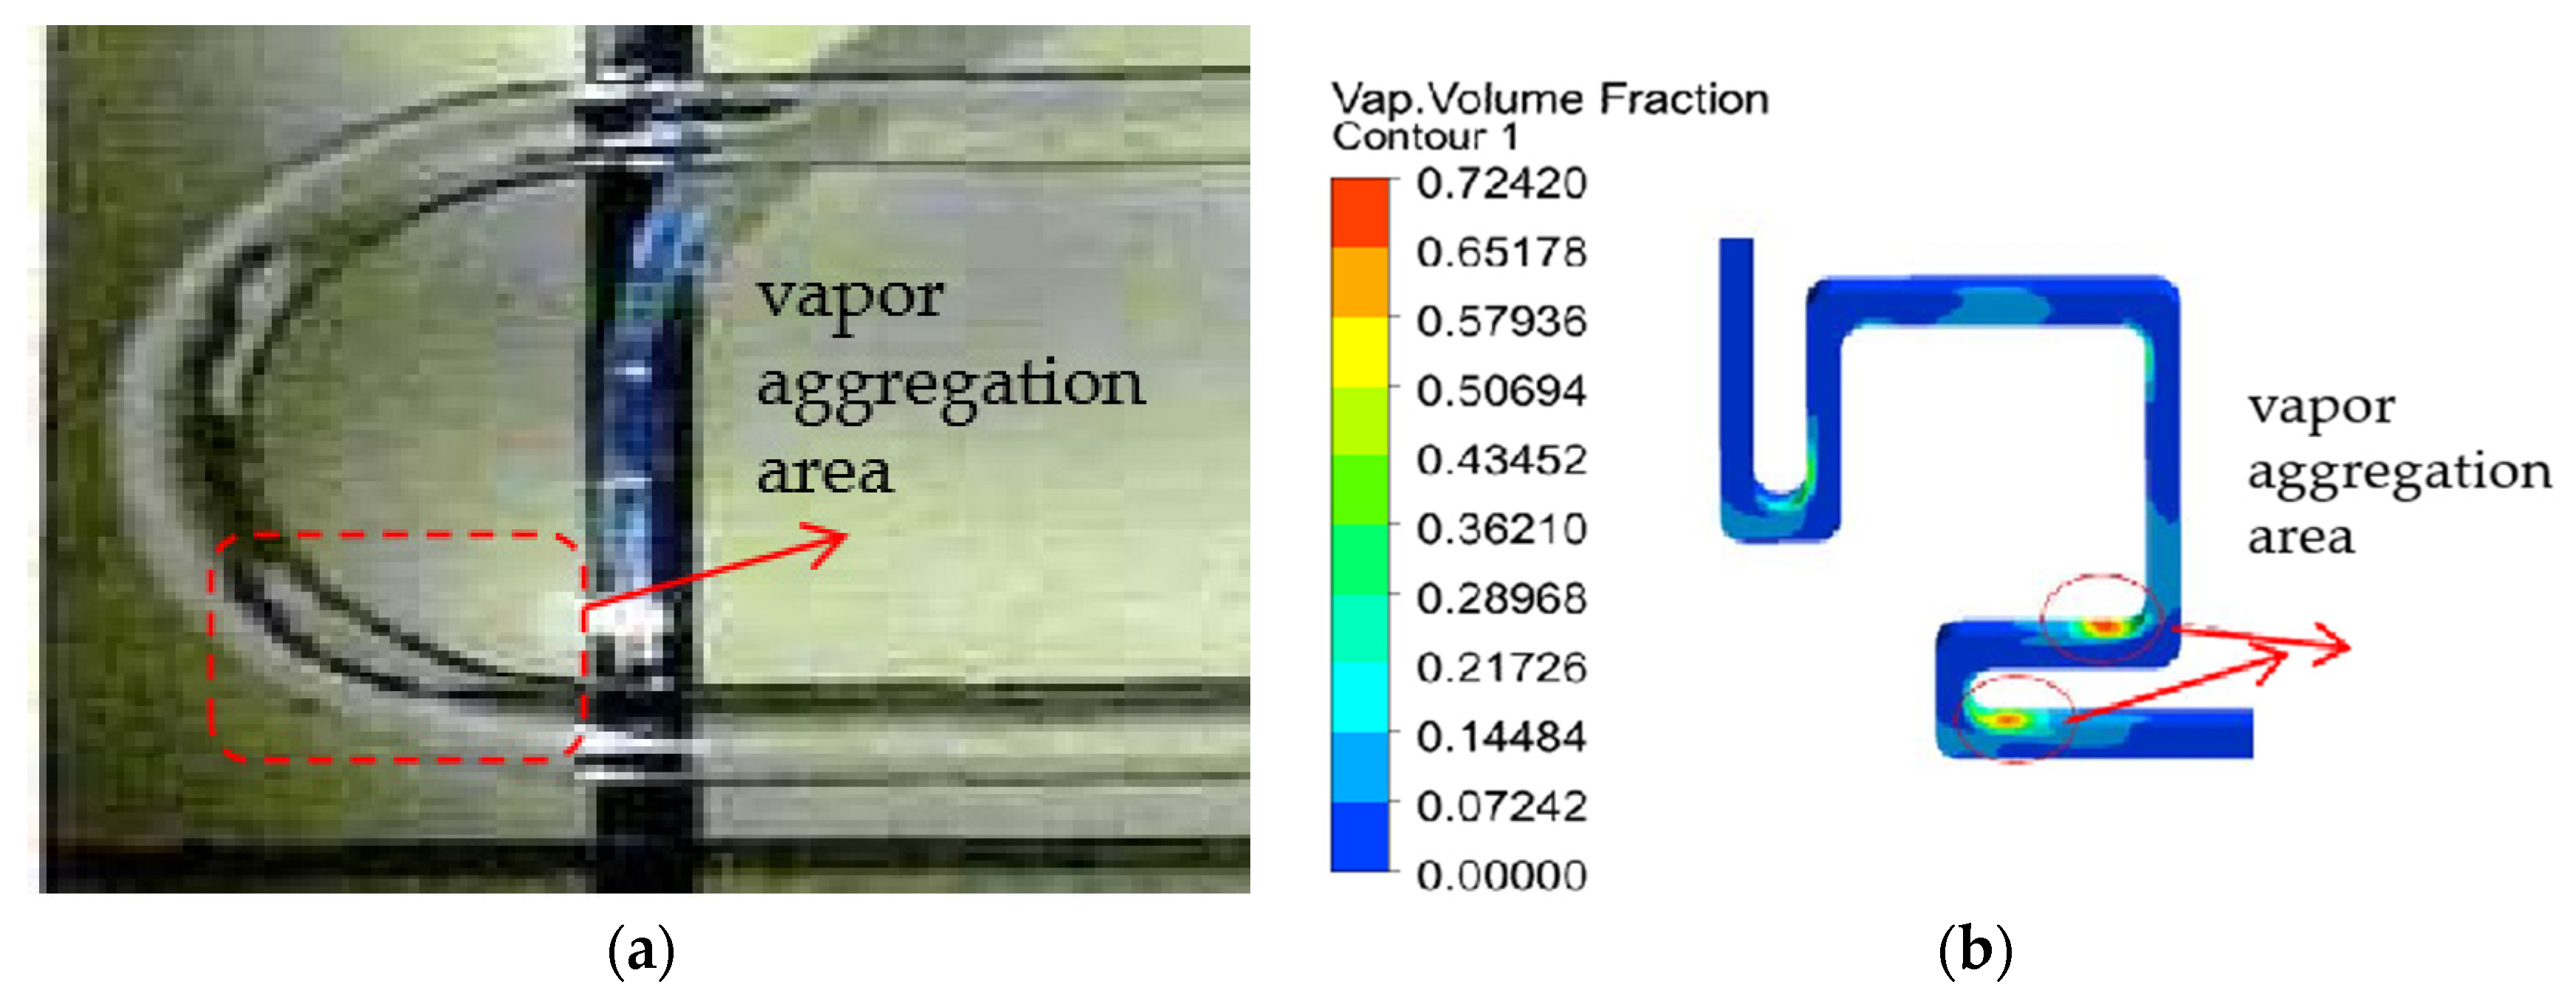
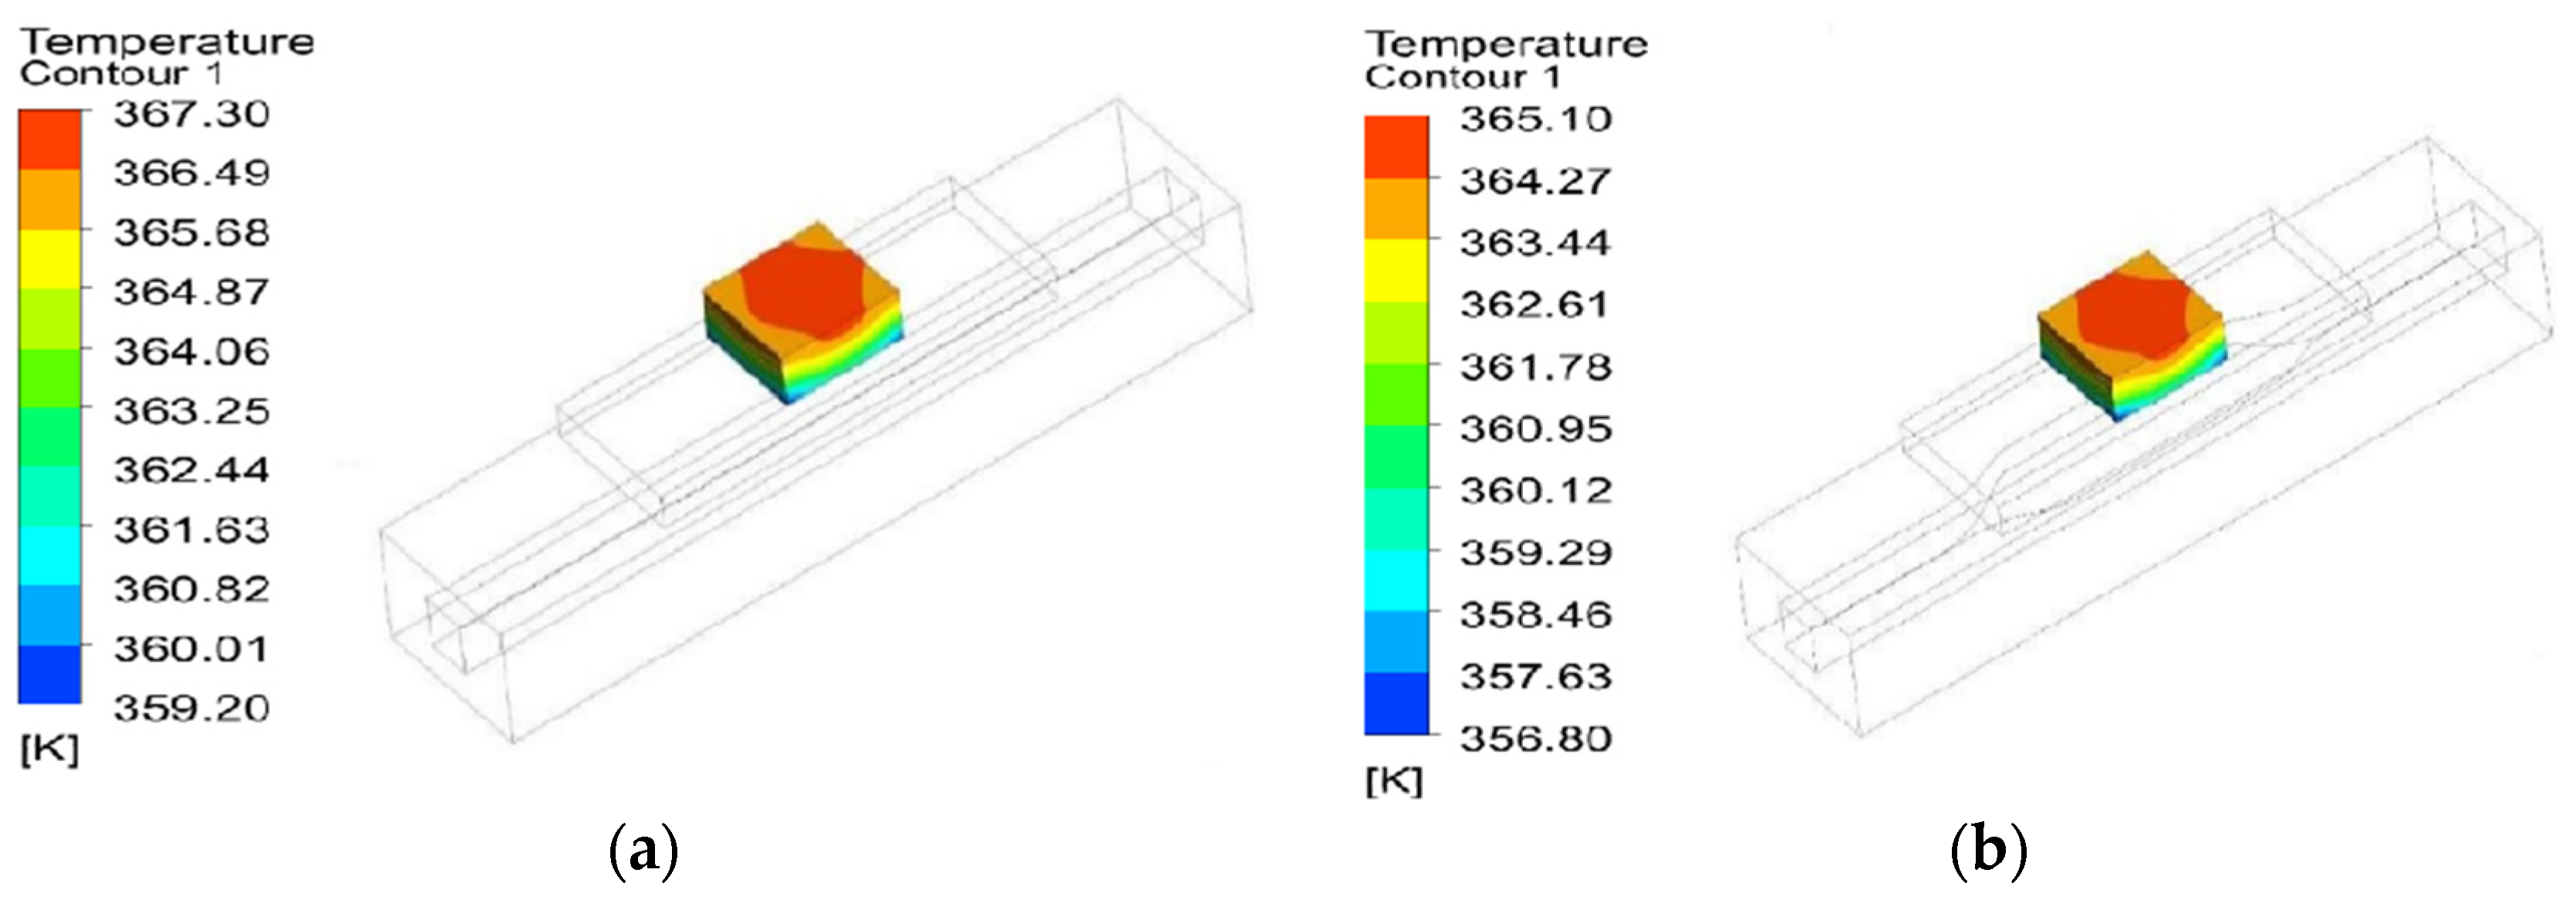
3.1. Temperature and Vapor-Phase Distribution
3.2. Effect of Channel Section on Heat Transfer Performance and Pressure Drop Characteristics
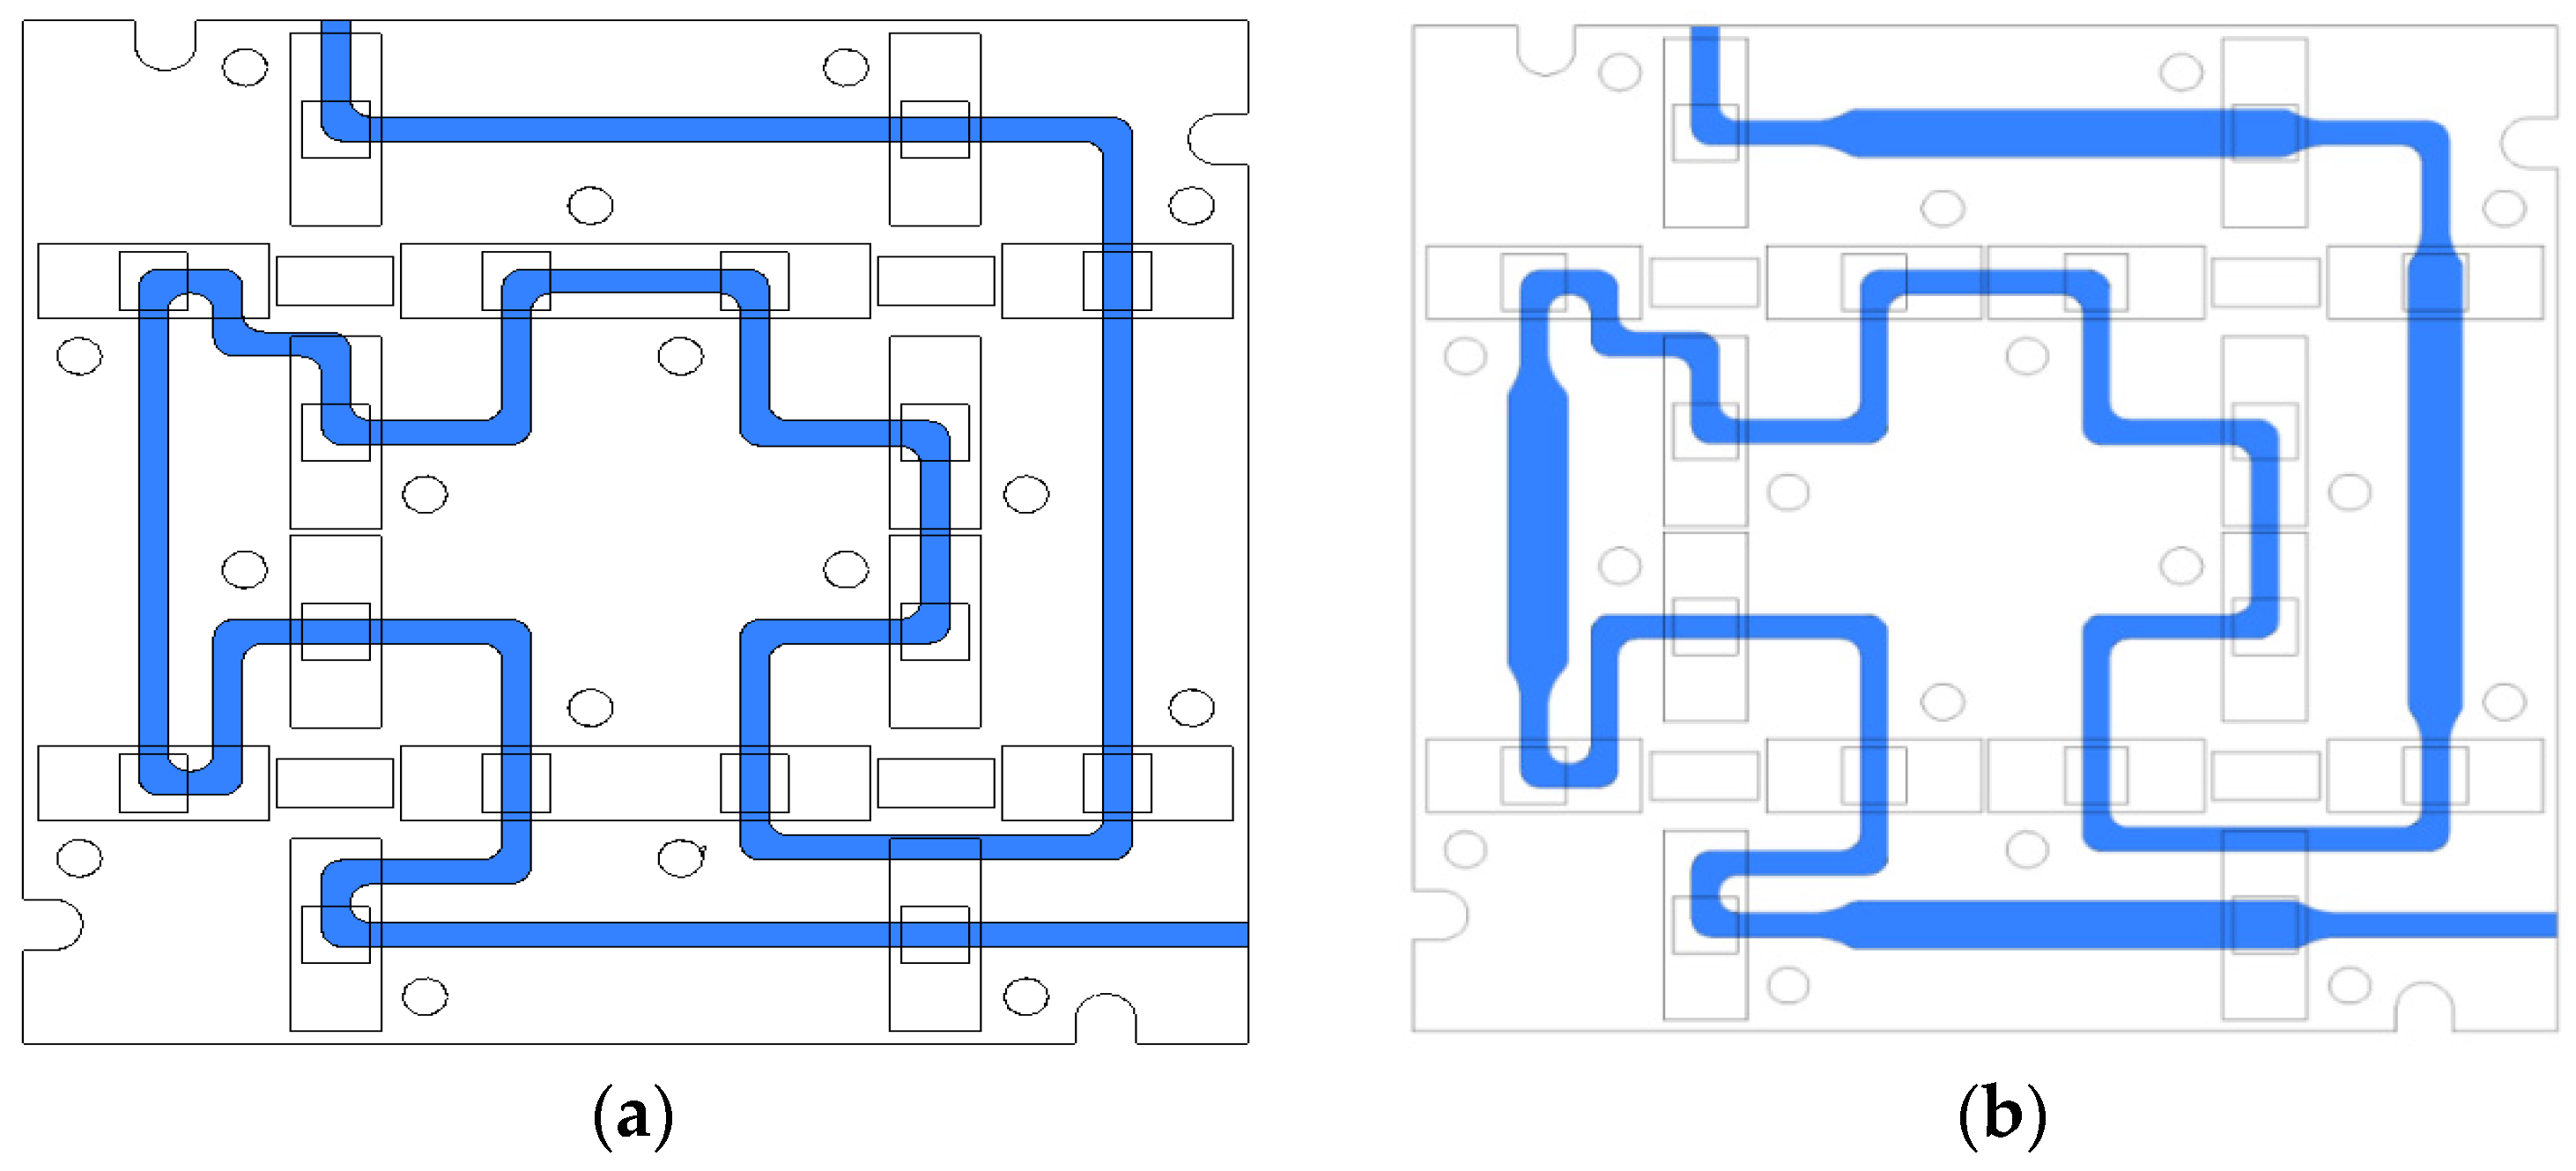
3.3. Effect of Channel Expansion on Heat Transfer Performance and Pressure Drop Characteristics
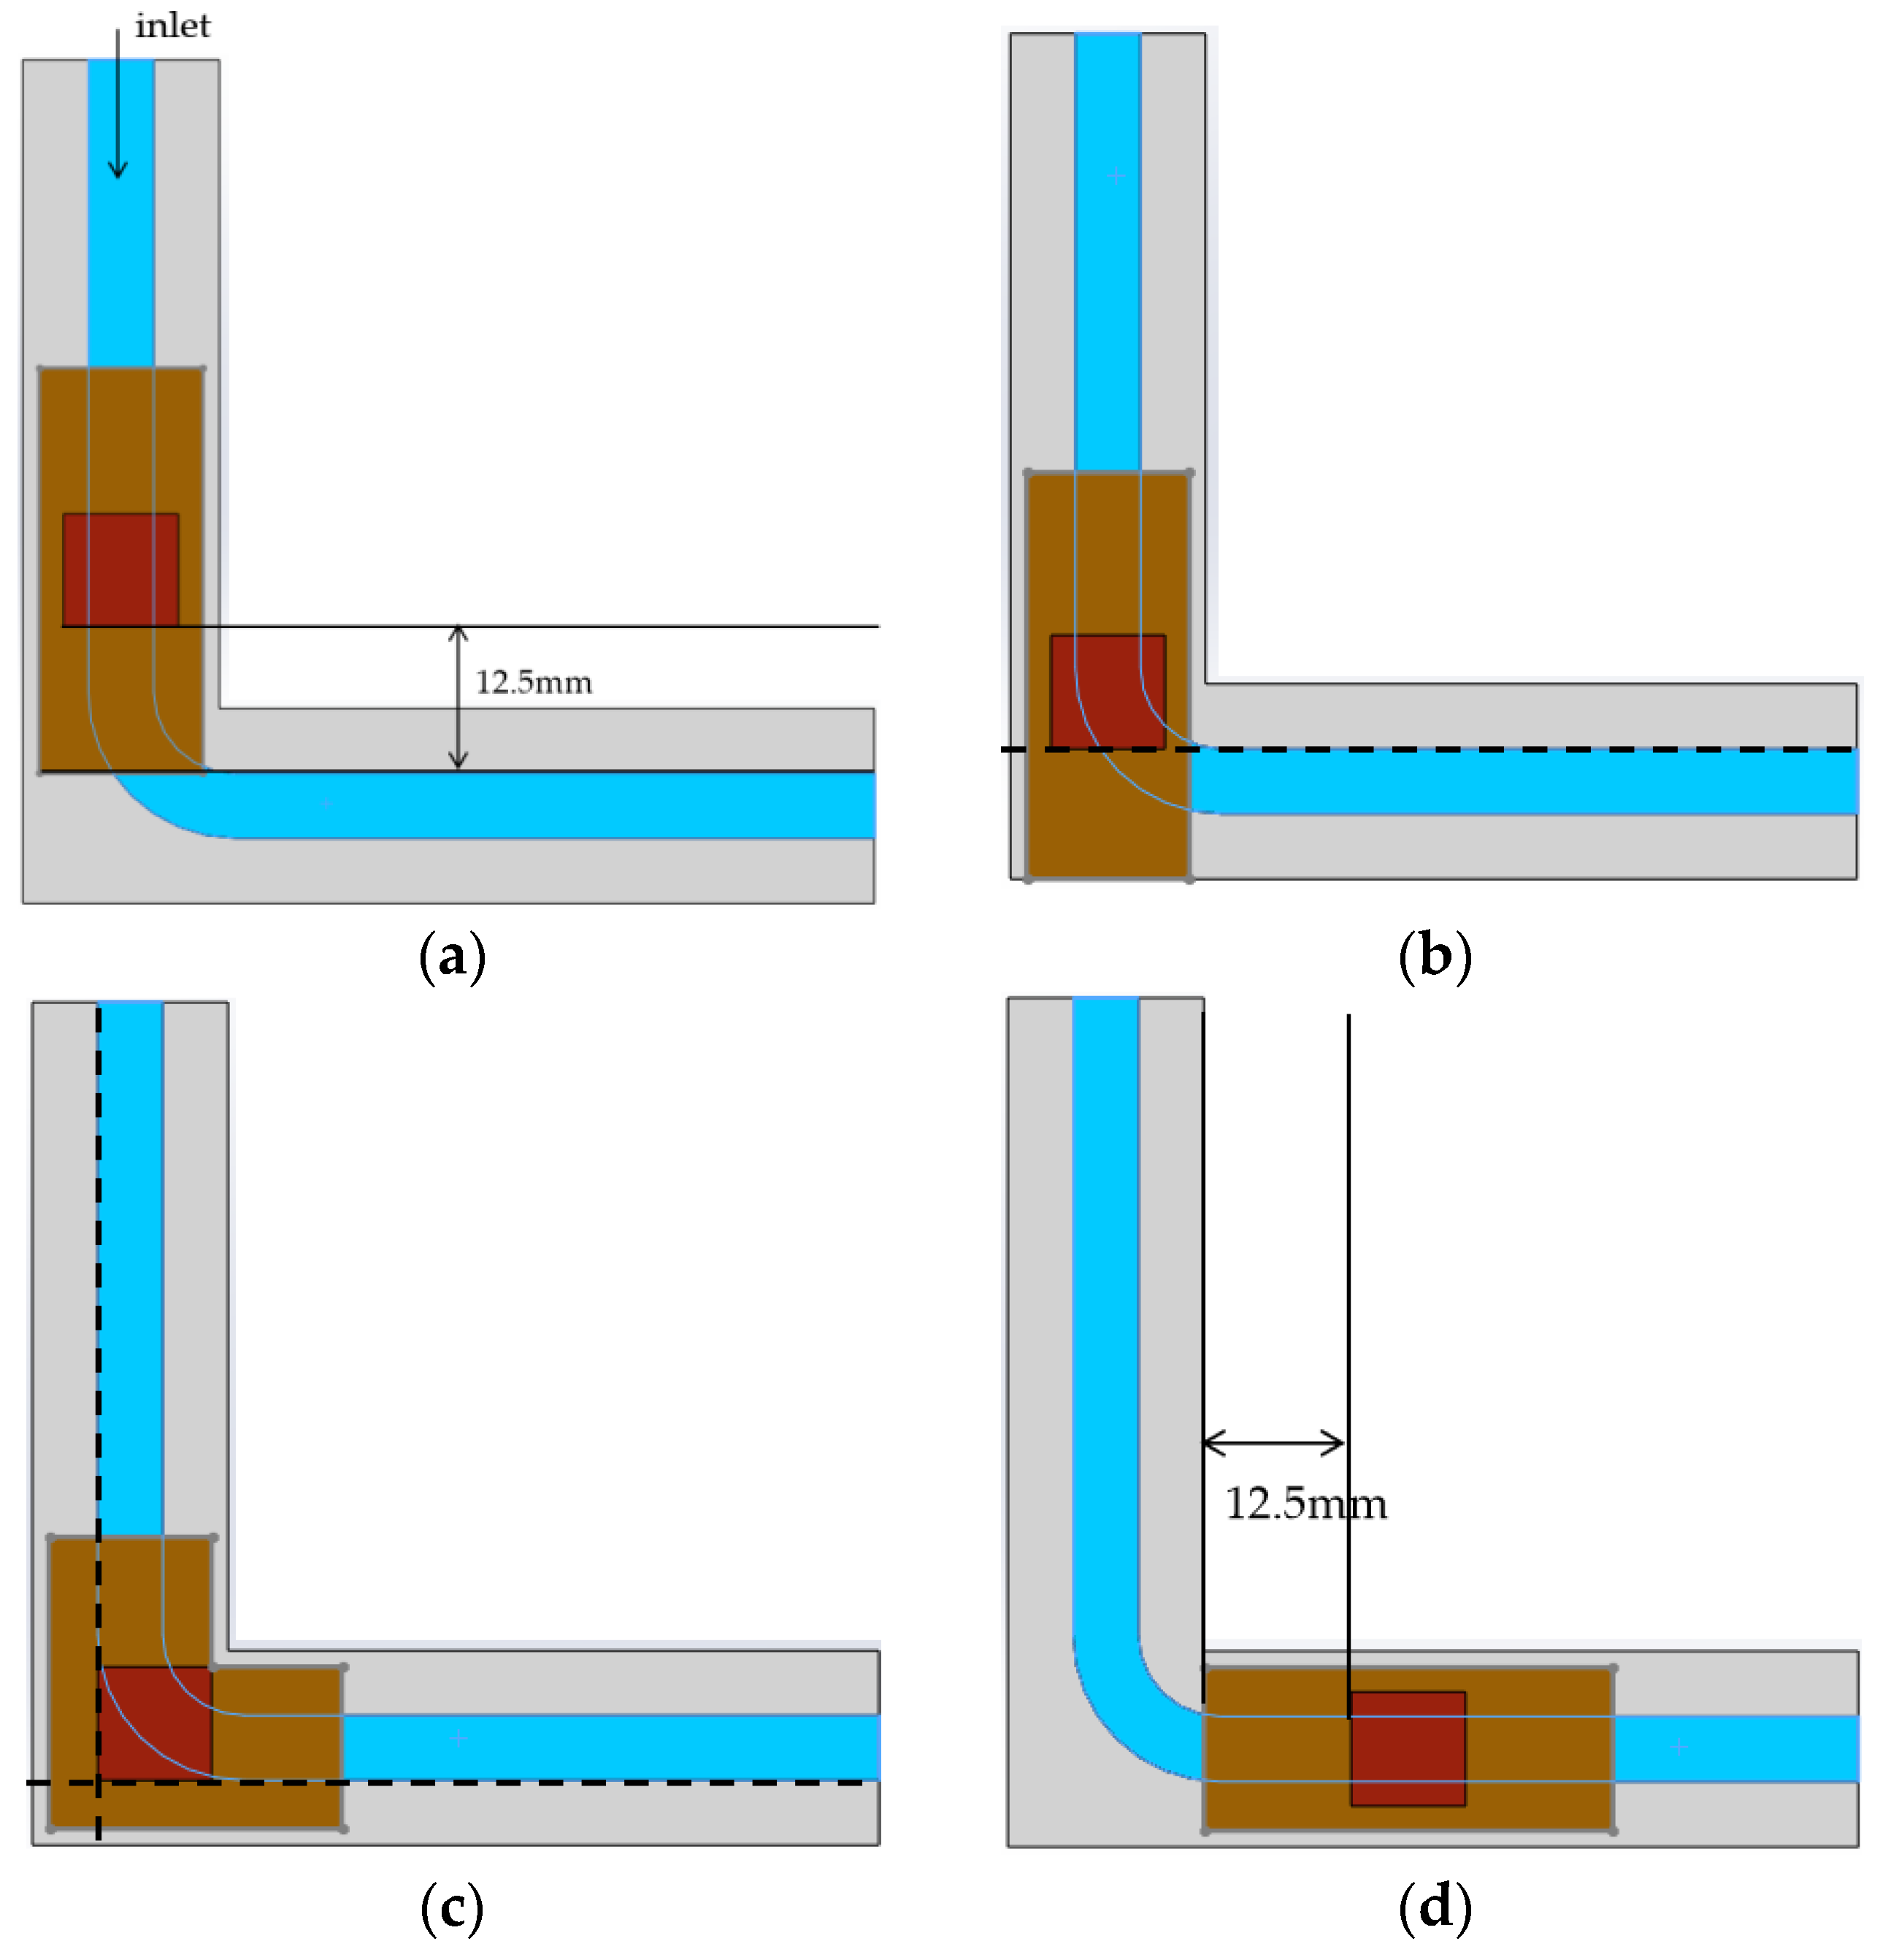
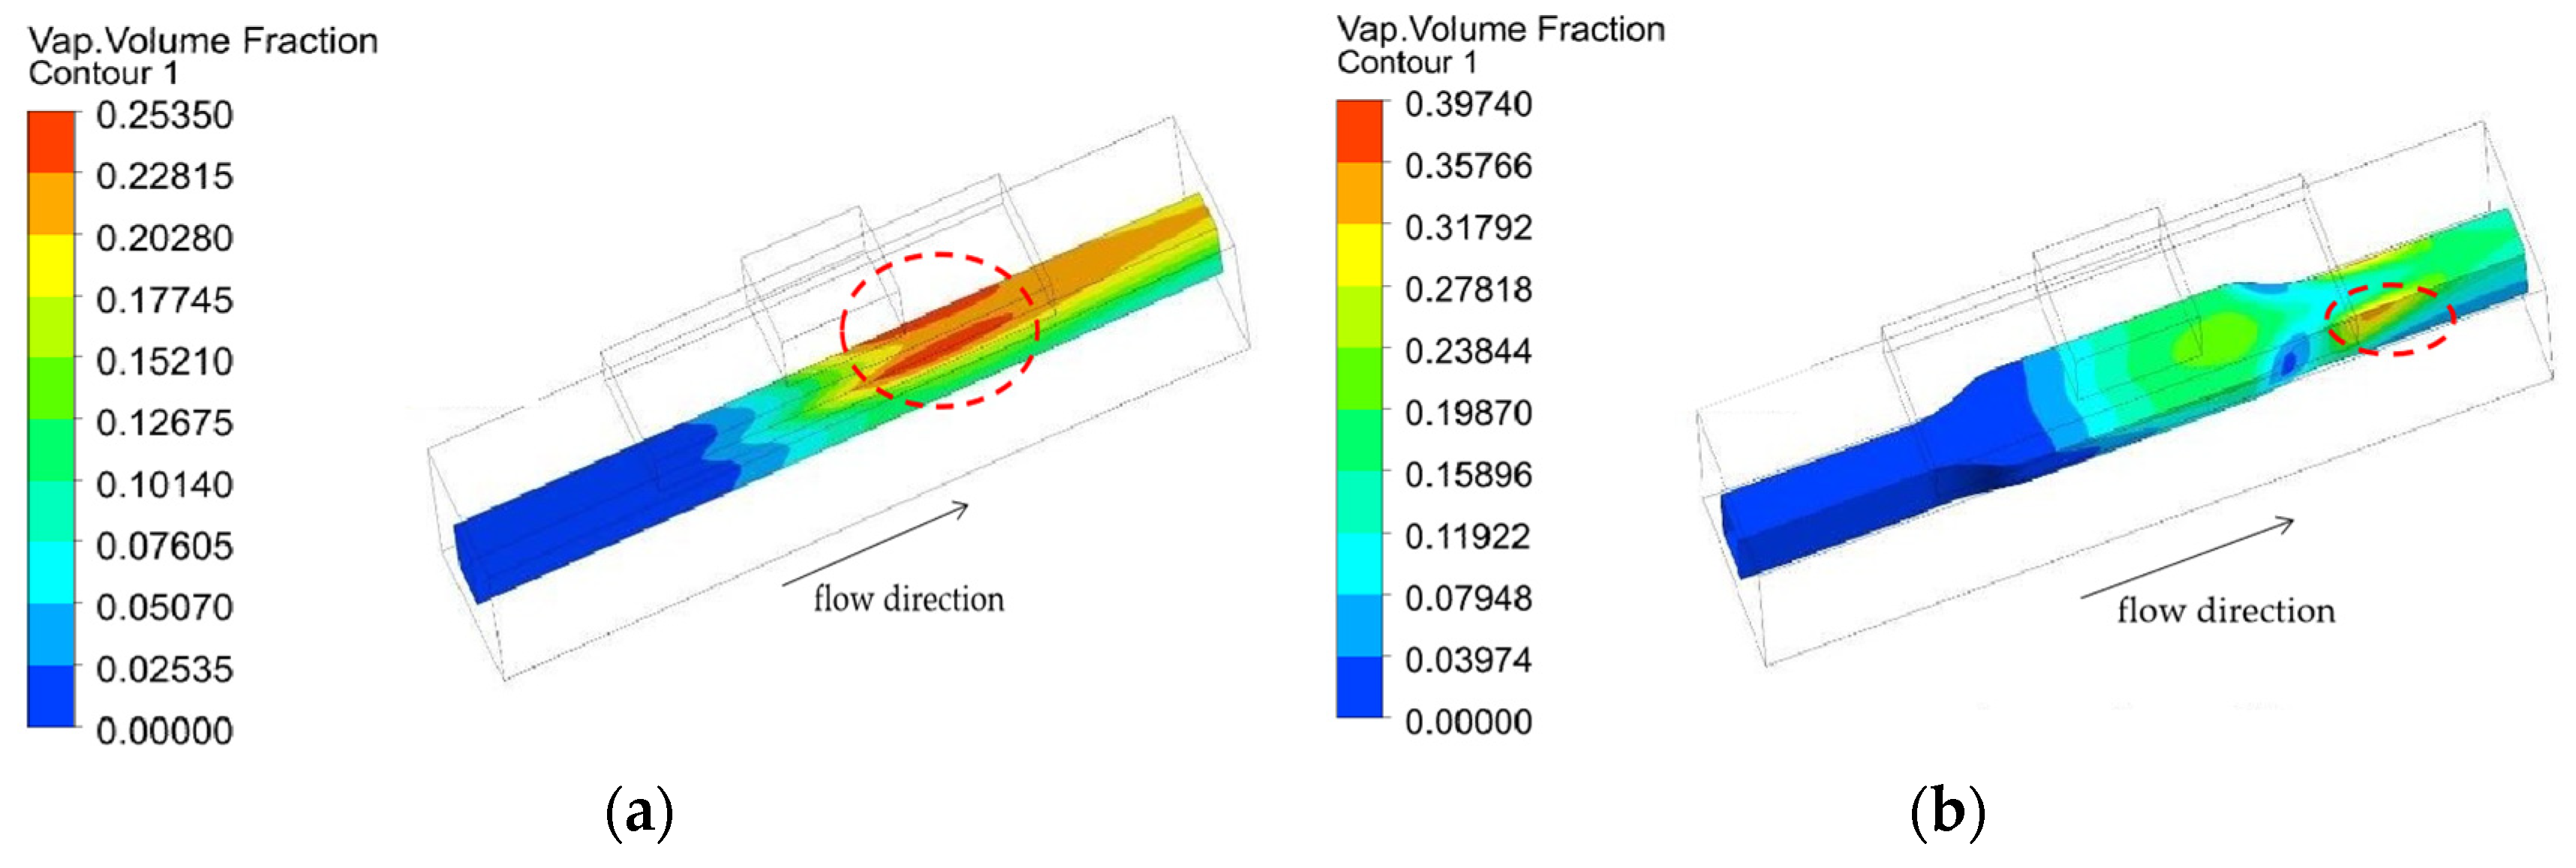
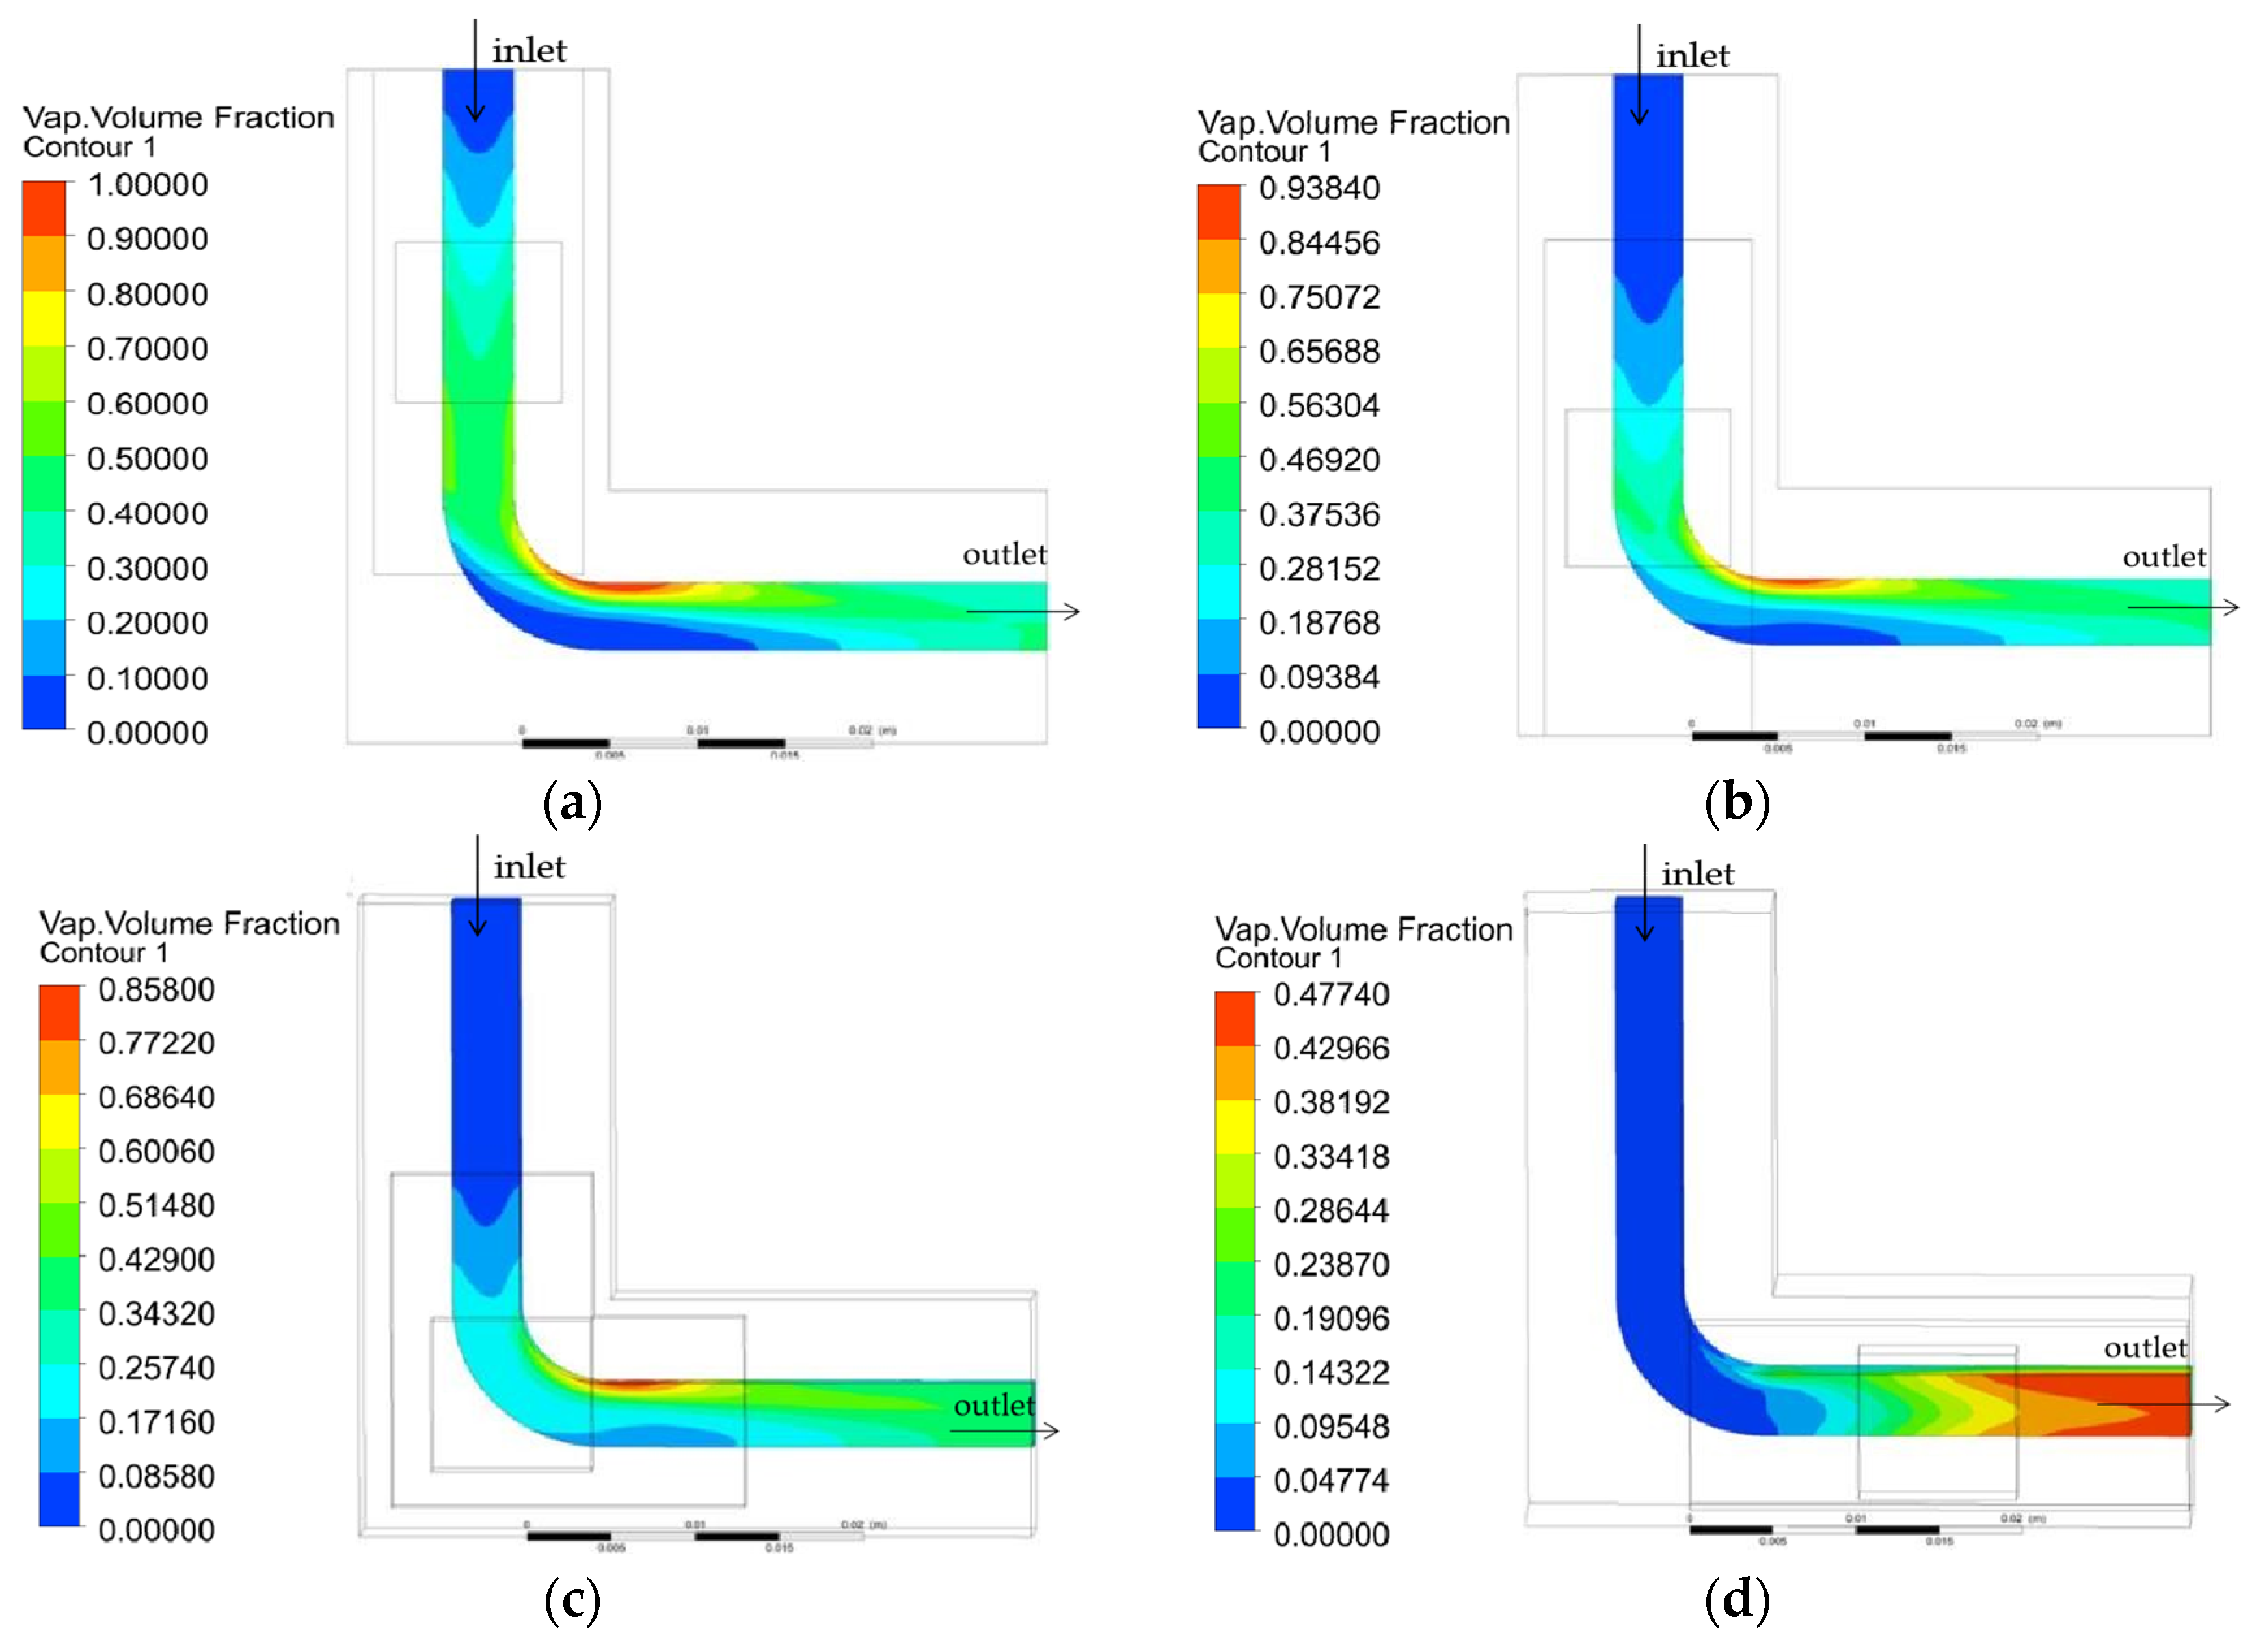
3.4. Effect of the Relative Position of Heat Source and Curved Channel on Heat Transfer Performance and Pressure Drop Characteristics
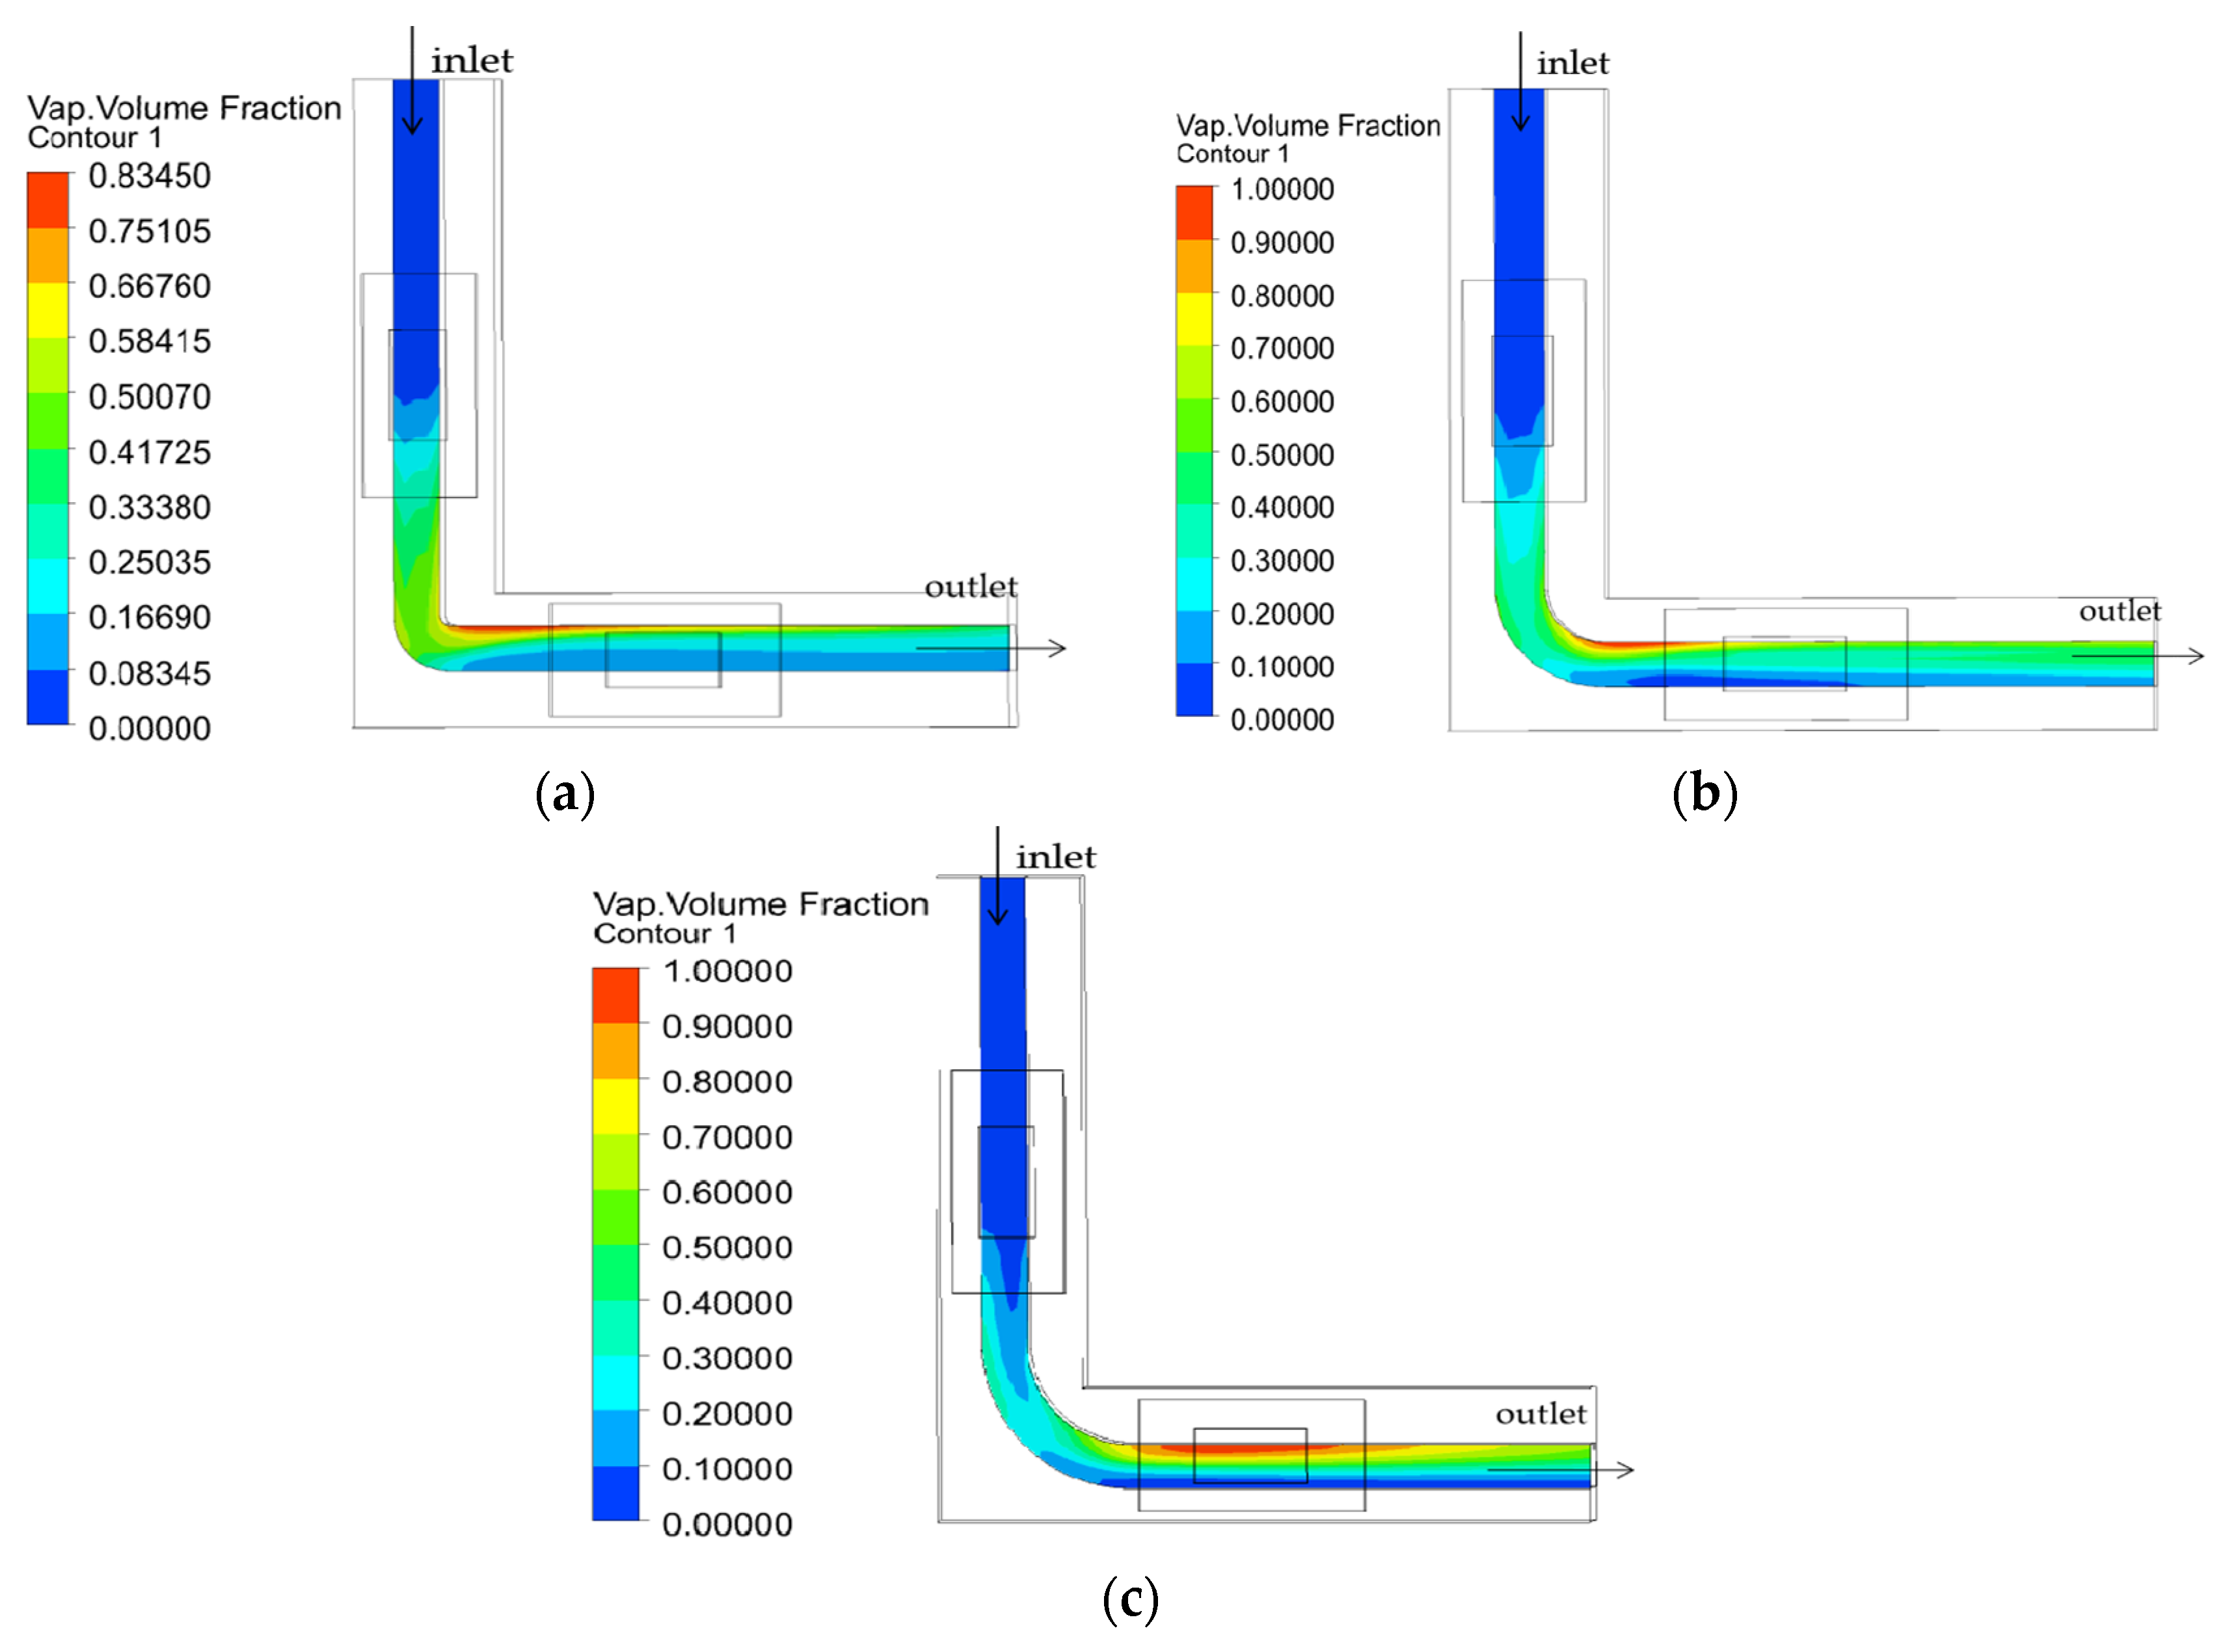
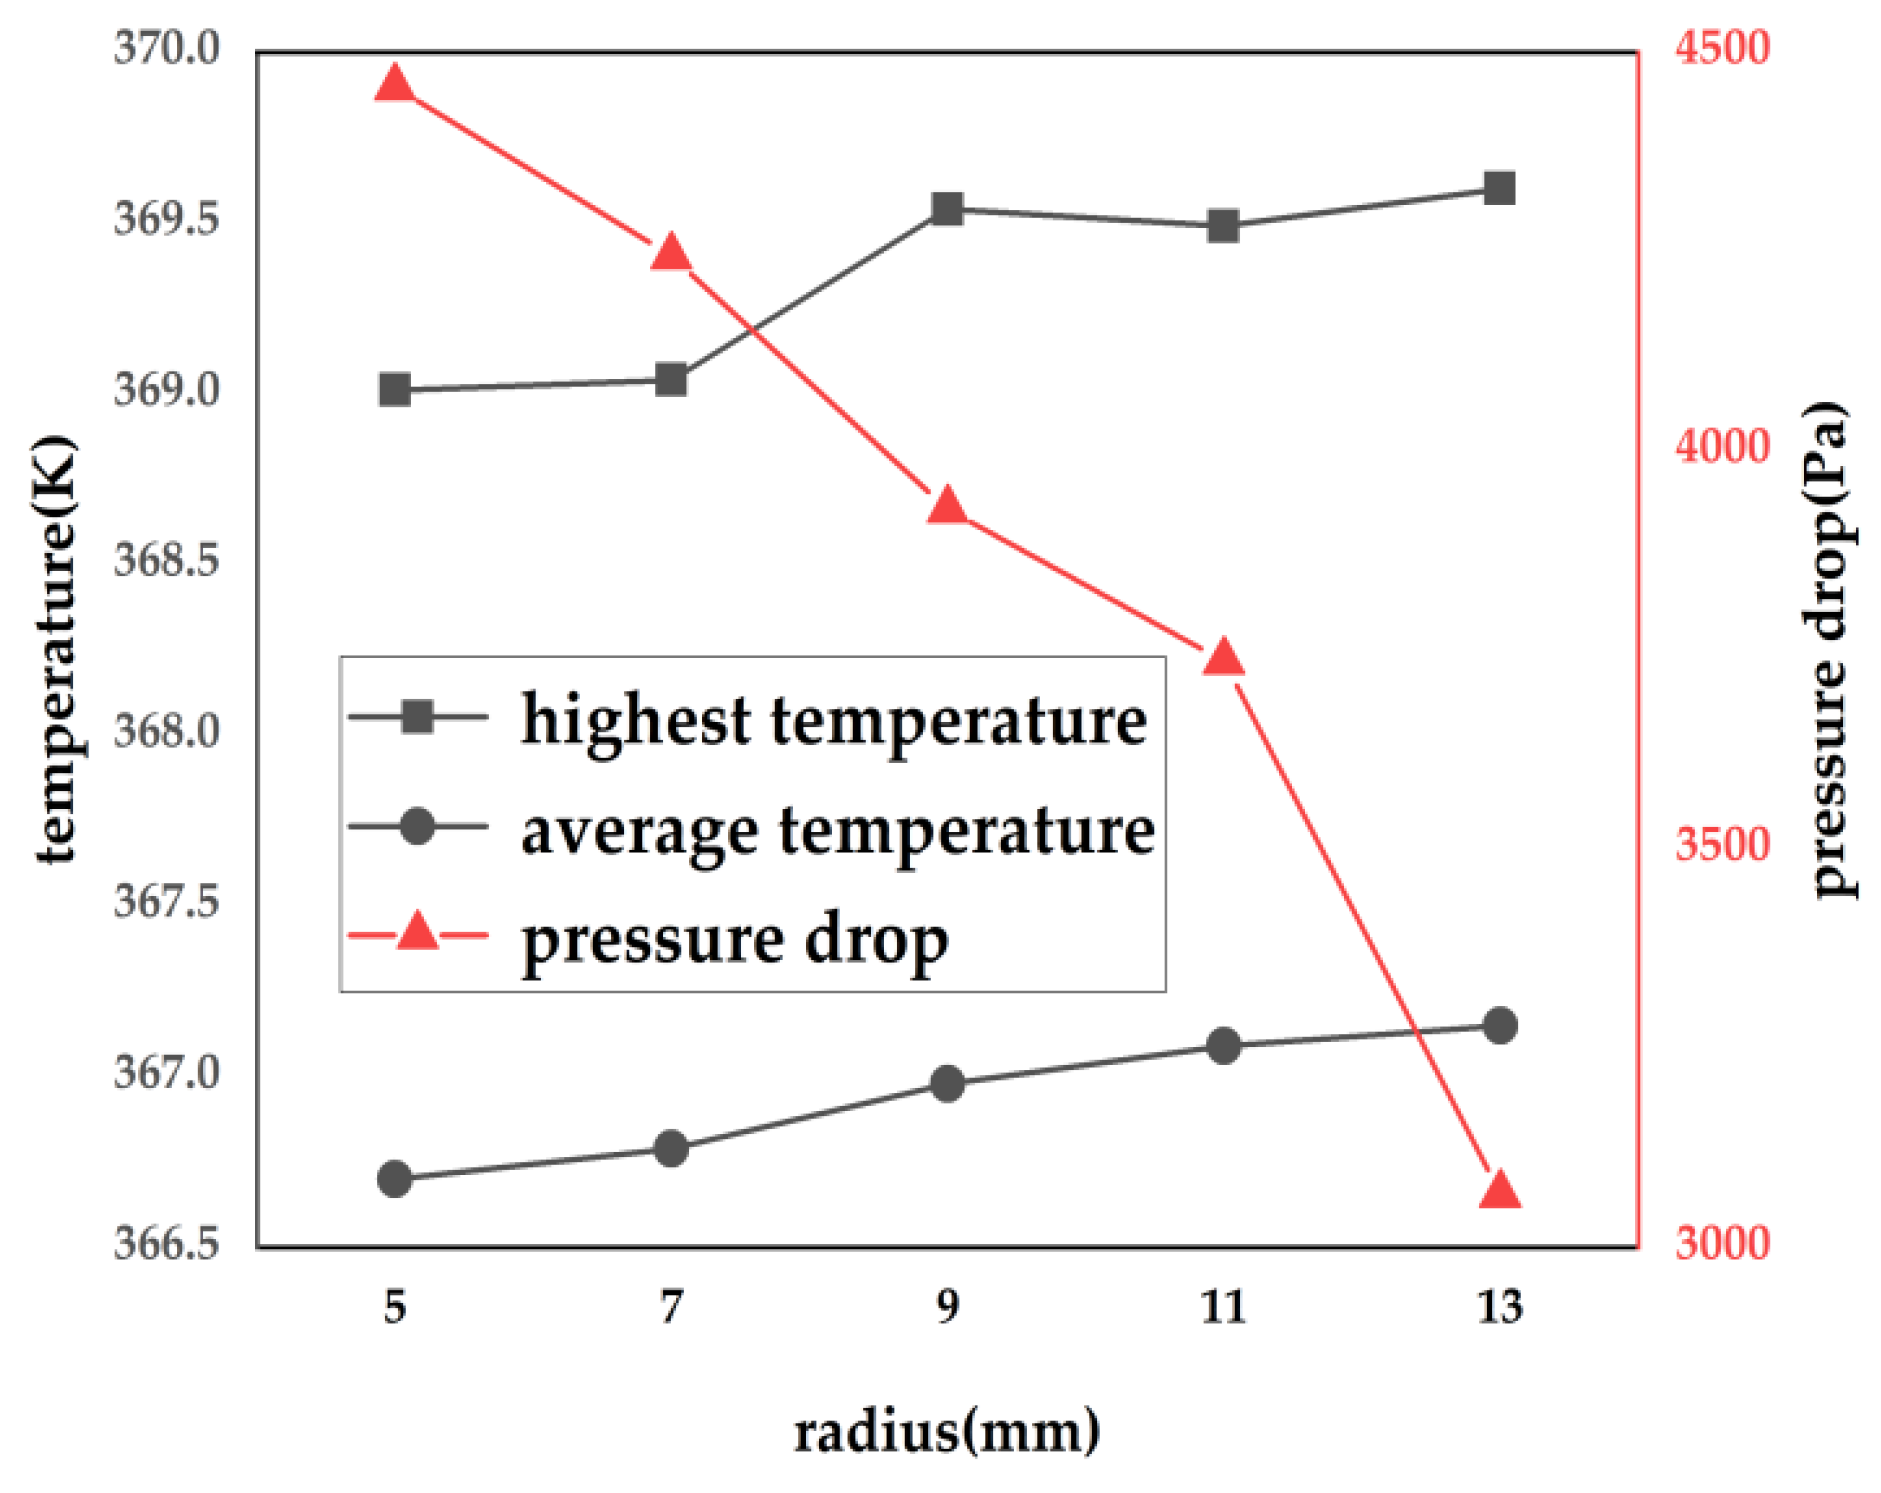
3.5. Effect of the Bend Radius on Heat Transfer Performance and Pressure Drop Characteristics
4. Conclusions
- (a)
- The temperature of the heat sources increases along the flow direction, but the heat sources in a continuous corner position are contrary to this trend. Vapor separation occurs at the corners.
- (b)
- A flat channel under the heat source can effectively reduce the heat source temperature due to the better-mixed flow and disturbance. With the increase in channel width, the temperature of the heat source decreases. Compared with the original channel, the 8 mm × 1.5 mm channel can reduce the temperature of the heat source by more than 2 K.
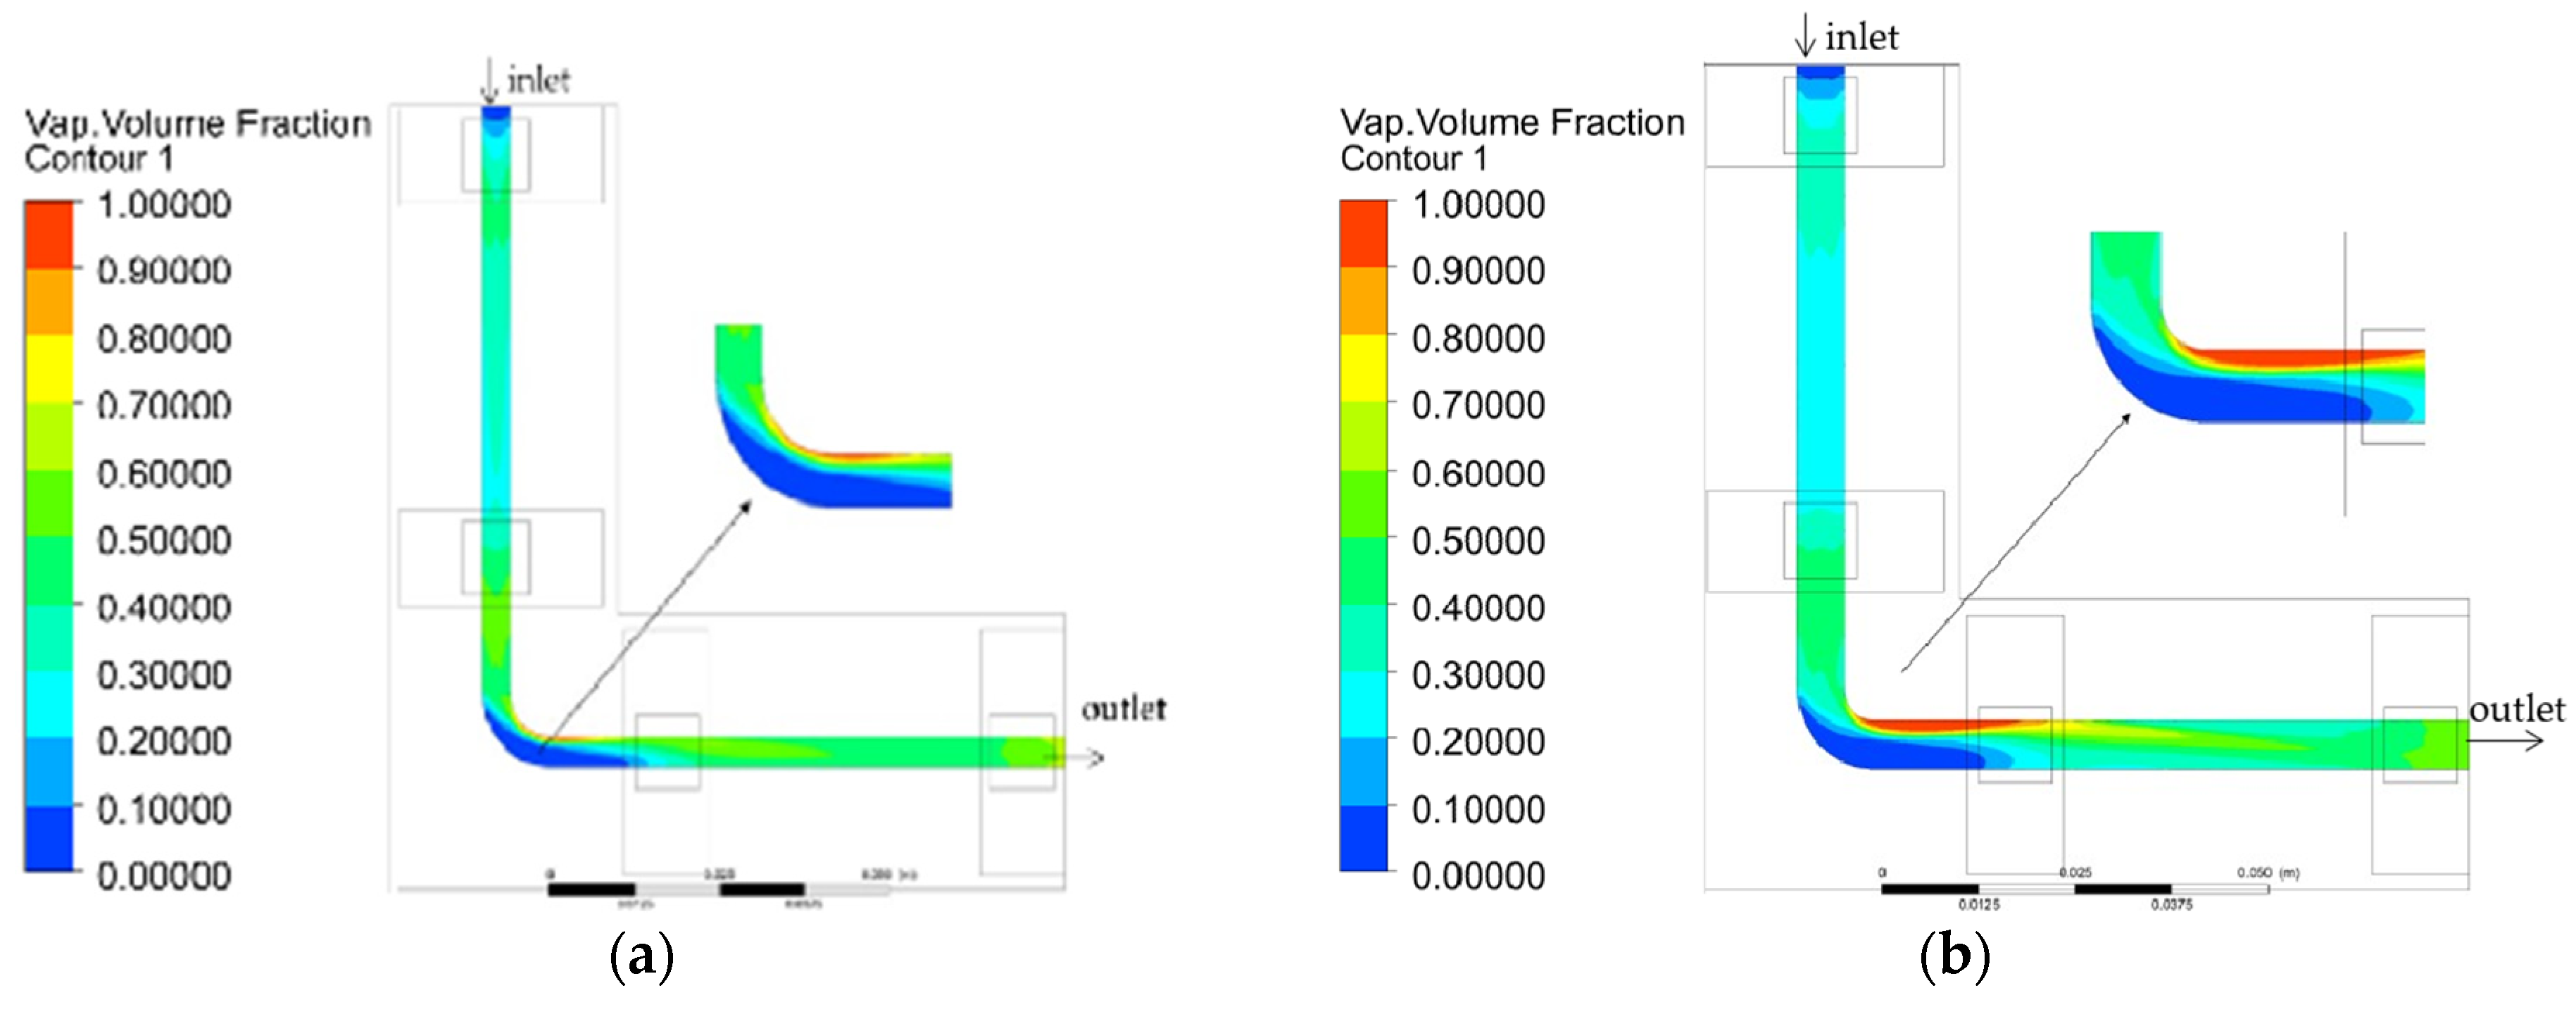
- (c)
- Broadening the straight channel can not only reduce the flow resistance, but also increase the heat exchange area and reduce the heat source temperature. However, widening the channel at the bend may enhance vapor–liquid separation, resulting in local dryness.
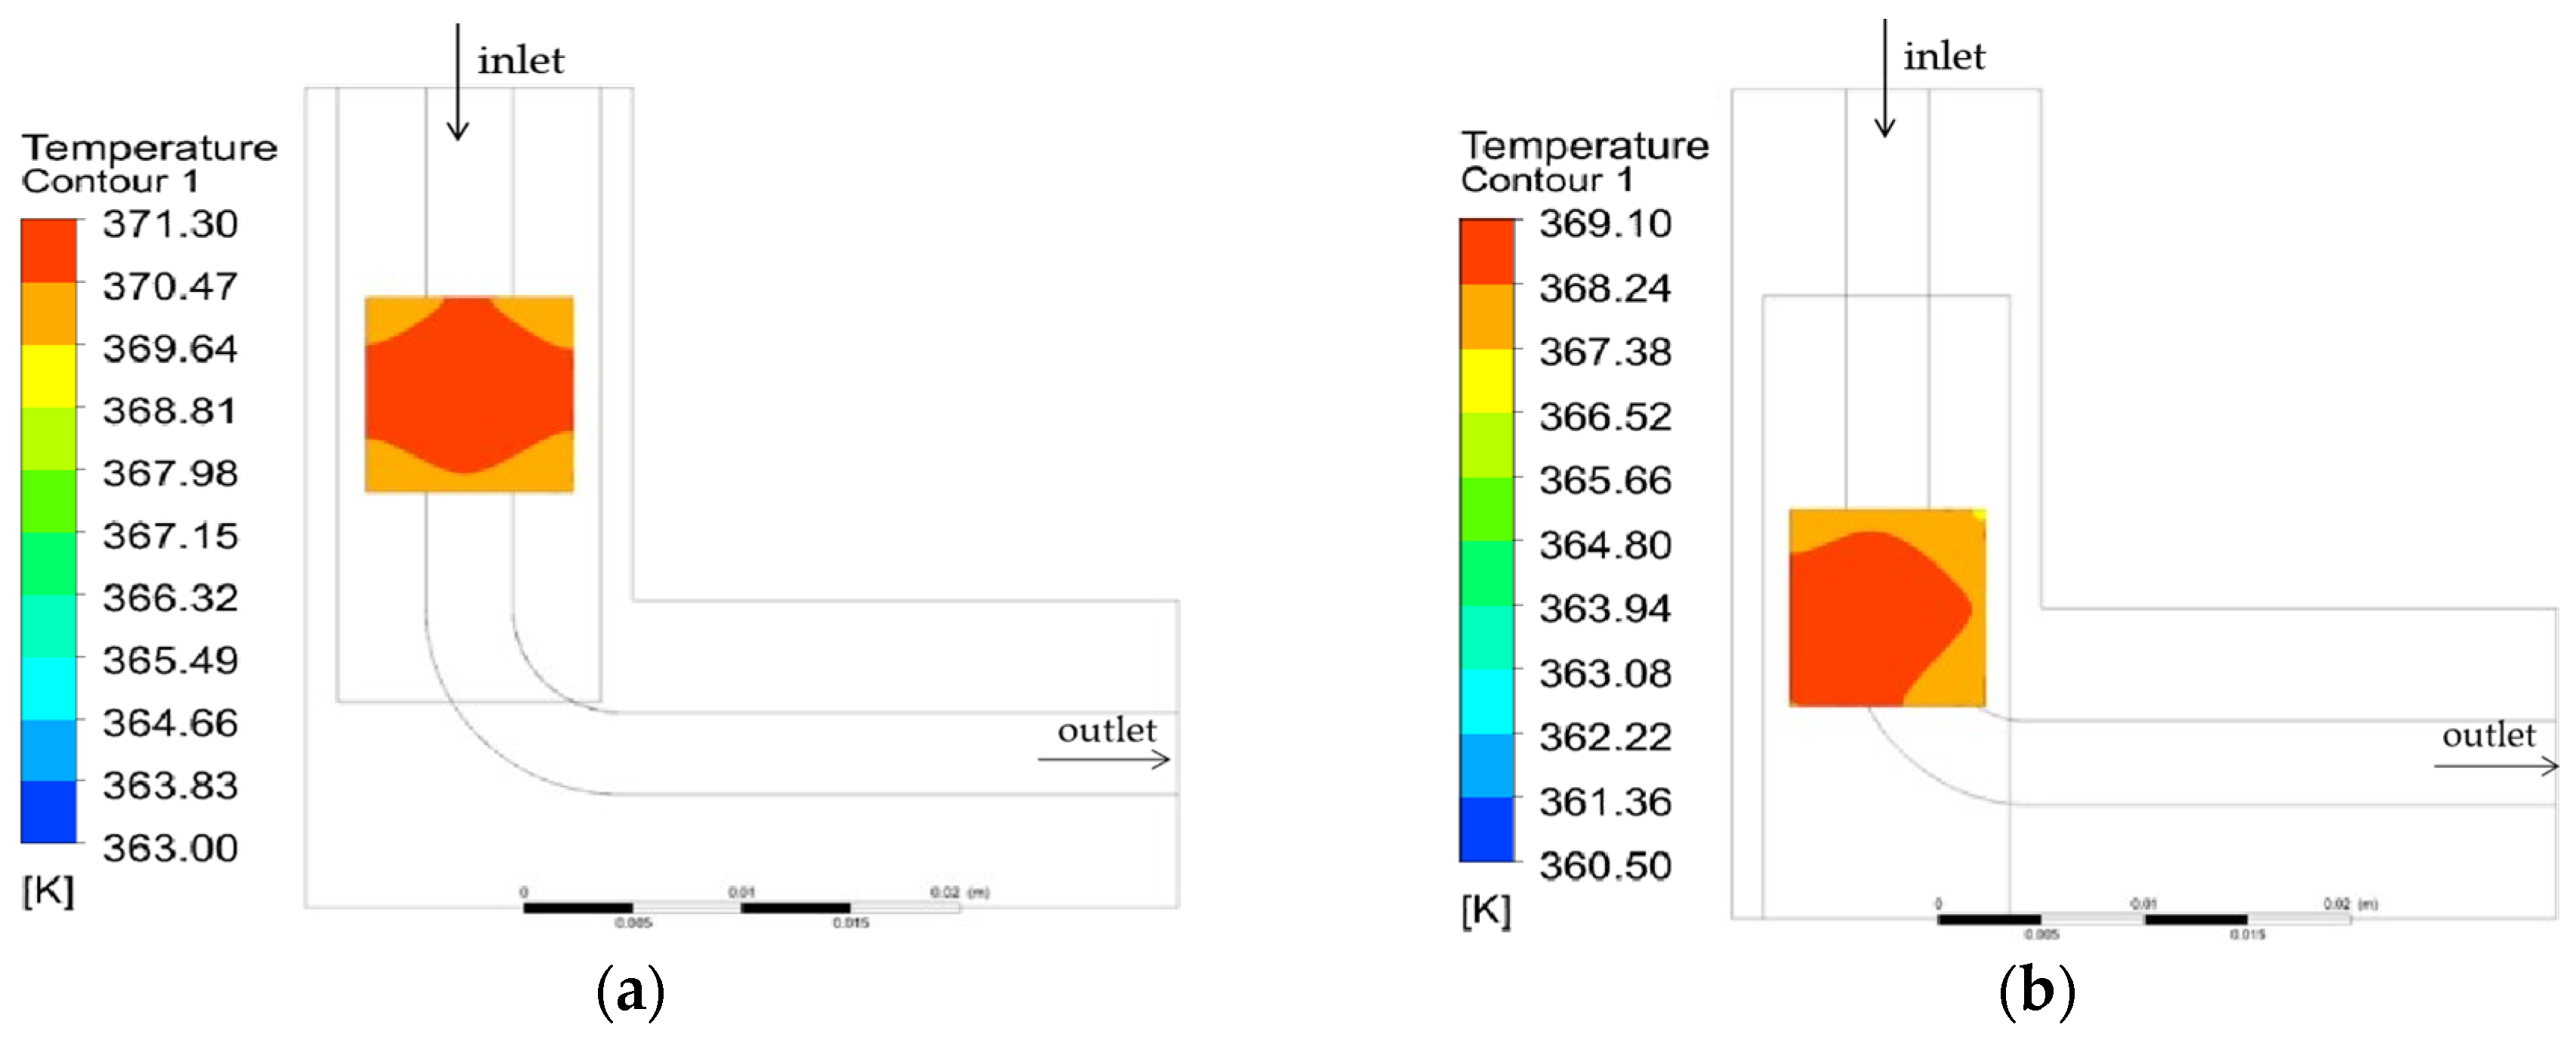
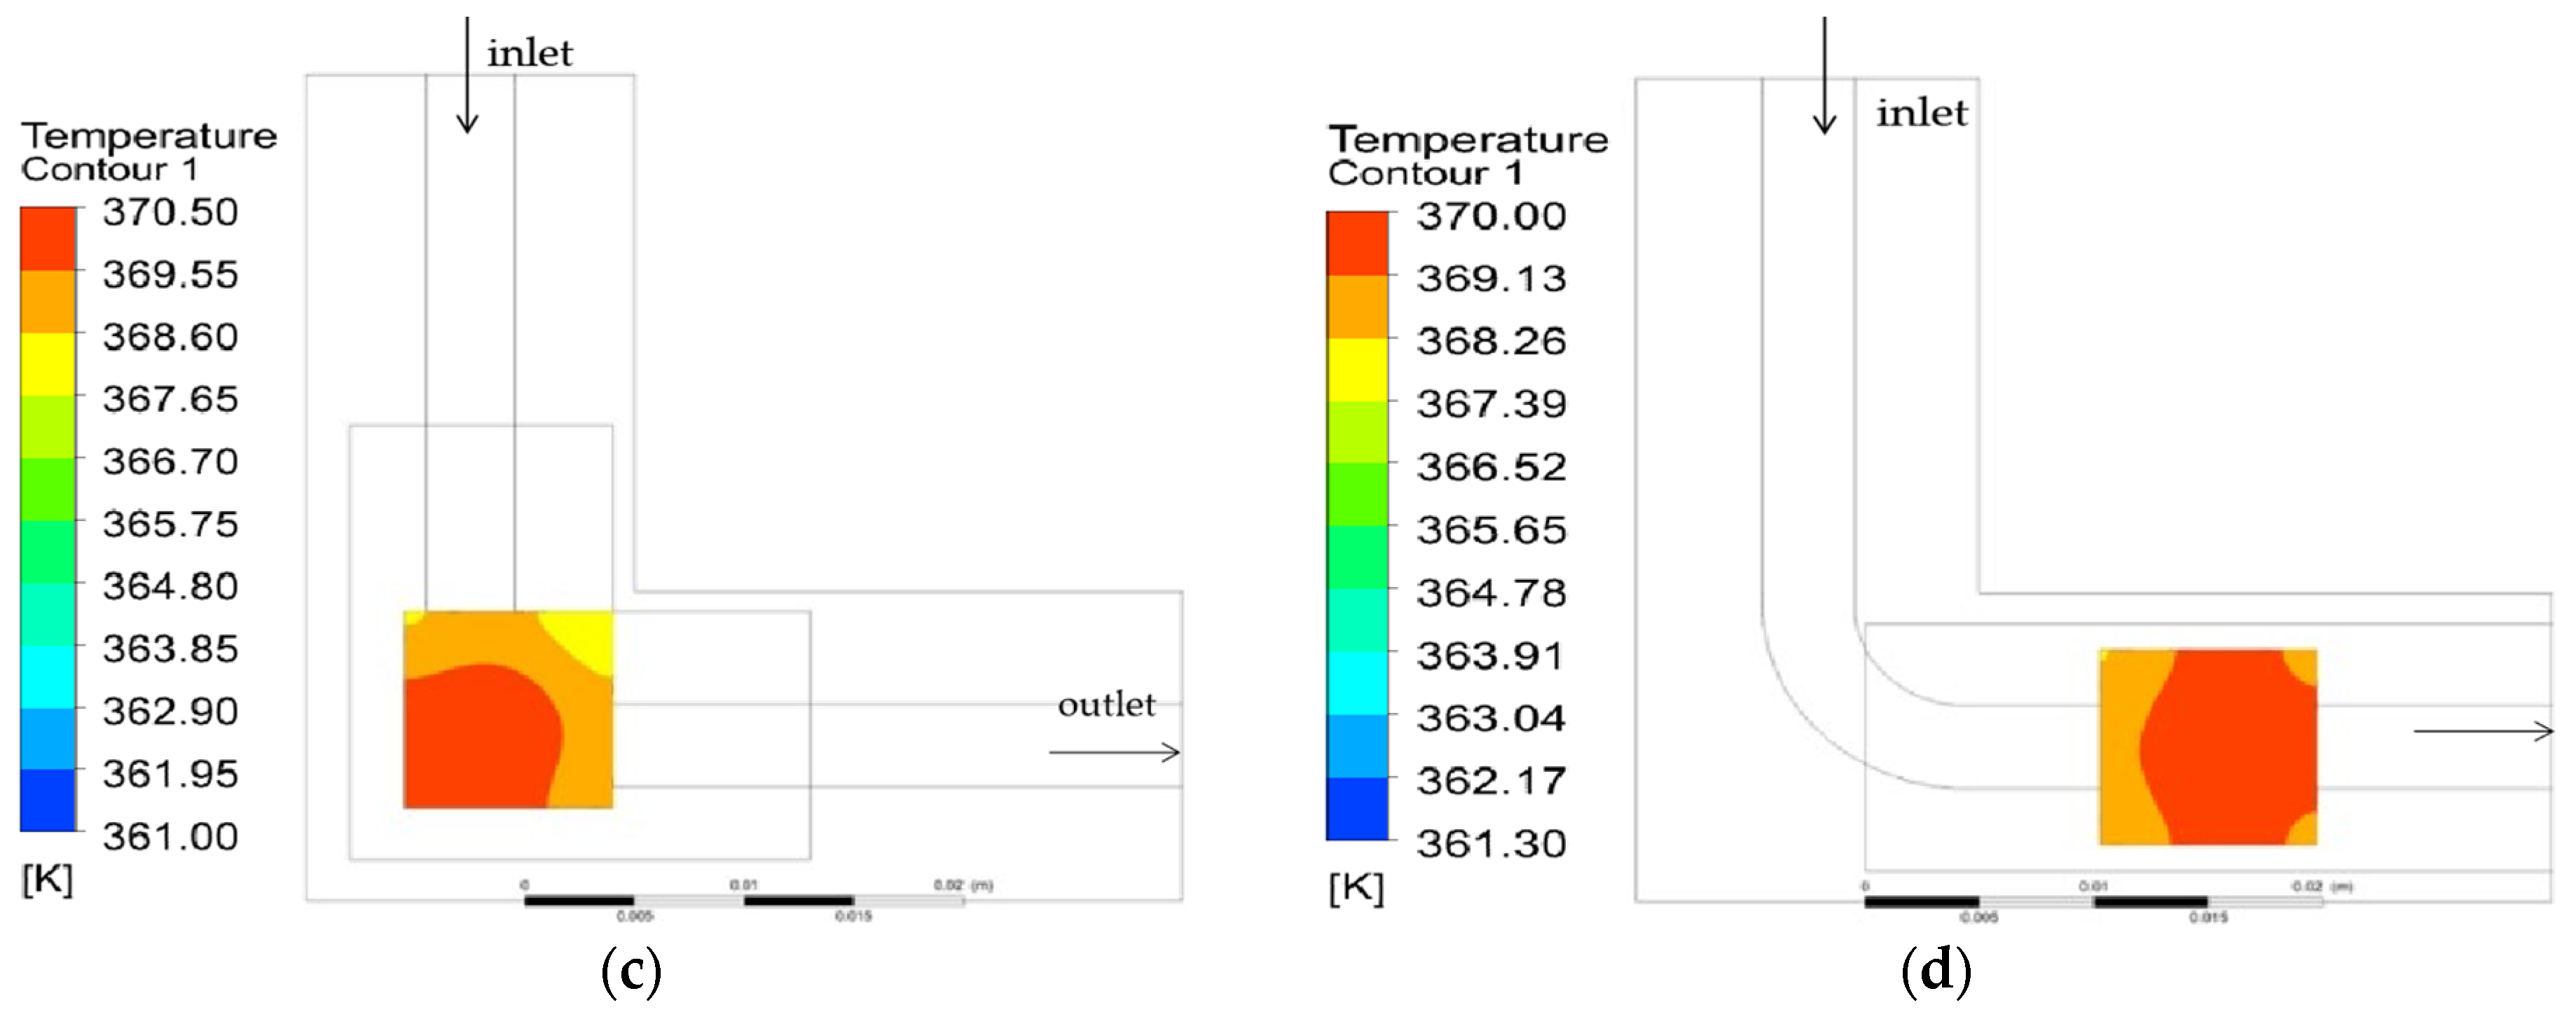
- (d)
- The relative position between the heat source and the bend can affect the heat dissipation effect and the vapor–liquid distribution at the bend. When the heat source is in front of the bend, the vapor–liquid separation is less obvious as it is closer to the bend, and the heat source located behind the bend has little effect on the vapor fraction at the bend. The heat transfer effect of the heat source near the bend is the best, followed by the one behind the bend, and the worst is that in front of the bend.
- (e)
- The radius of the bend affects the vapor–liquid distribution, heat transfer effect, and pressure drop. With the increase in the bend radius, the phenomenon of vapor separation becomes more obvious, the pressure drop of the pipeline decreases, but the heat transfer effect worsens.
Author Contributions
Funding
Institutional Review Board Statement
Informed Consent Statement
Data Availability Statement
Acknowledgments
Conflicts of Interest
References
- Yao, S.G.; Ma, Z.S.; Luo, L. Research status and development of high-efficiency heat pipe technology in electronic and electrical equipment. J. Jiangsu Univ. Sci. Technol. Nat. Sci. Ed. 2003, 17, 9–12. [Google Scholar]
- Xie, Y.C. Development of heat dissipation technology of electronic equipment. Ship Electron. Eng. 2019, 1, 39. [Google Scholar]
- Wang, M.Y. Research on the Topology Structure of Micro-Channel Cooling Plate of Active Phased Array Antenna; University of Electronic Science and Technology of China: Chengdu, China, 2018. [Google Scholar]
- Palm, B. Heat transfer in micro-channels. Micro-Scale Therm. Phys. Eng. 2001, 5, 155–175. [Google Scholar] [CrossRef]
- Zhang, H.Y.; Pinjala, D.; Joshi, Y.K. Fluid flow and heat transfer in liquid cooled foam heat sinks for electronic packages. IEEE Trans. Compon. Packag. Technol. 2005, 2, 272–280. [Google Scholar] [CrossRef]
- Cho, E.S. Experimental study on micro-channel heat sinks considering mass flow distribution with non-uniform heat flux conditions. Int. J. Heat Mass Transf. 2010, 53, 2159–2168. [Google Scholar] [CrossRef]
- Kim, S.Y.; Hwang, K.; Moon, J.; Karng, S.W. Thermal management of liquid-cooled cooling plates for multiple heat sources in a humanoid robot. In Proceedings of the 4th Assembly and Circuits Technology Conference, Beijing, China, 21–23 October 2009. [Google Scholar]
- Mao, Z.M.; Luo, X.B.; Liu, S. Compact thermal model for micro-channel substrate with high temperature uniformity subjected to multiple heat sources. In Proceedings of the 61st Electronic Components and Technology Conference, San Diego, CA, USA, 5 June 2011. [Google Scholar]
- Ma, Z.T.; Wang, X.J.; Zhu, D.Q.; Liu, S. Thermal analysis and modeling of LED array integrated with an innovative liquid-cooling. In Proceedings of the IEEE 6th ICEPT, Shenzhen, China, 30 August–2 September 2005. [Google Scholar]
- Yuan, L.L.; Liu, S.; Chen, M.X.; Luo, X.B. Thermal analysis of high power LED array packaging with micro-channel cooler. In Proceedings of the IEEE 7th ICEPT, Shanghai, China, 26–29 August 2006. [Google Scholar]
- Tan, H. Topology design of micro-channel cooling plate of multi-heat source phased array antenna. J. Univ. Electron. Sci. Technol. China 2019, 48, 150–155. [Google Scholar]
- Wei, T.; Huang, H.; Ma, Y.; Qian, J. Design and fabrication of multi-layer silicone micro-channel cooler for high-power chip array. In Proceedings of the 22nd International Conference on Electronic Packaging Technology, Xiamen, China, 14–17 September 2021; pp. 1–5. [Google Scholar]
- Qian, S.; Wang, W.; Ge, C.; Lou, S.; Miao, E.; Tang, B. Topology optimization of fluid flow channel in cold plate for active phased array antenna. Struct. Multidiscip. 2017, 57, 2223–2232. [Google Scholar] [CrossRef]
- Luo, X.; Mao, Z. Thermal modeling and design for micro-channel cold plate with high temperature uniformity subjected to multiple heat sources. Int. Commun. Heat Mass 2012, 39, 781–785. [Google Scholar] [CrossRef]
- Drummond, K.P.; Back, D.; Sinanis, M.D.; Janes, D.B.; Peroulis, D.; Weibel, J.A.; Garimella, S.V. A hierarchical manifold micro-channel heat sink array for high-heat-flux two-phase cooling of electronics. Int. J. Heat Mass Transf. 2018, 117, 319–330. [Google Scholar] [CrossRef] [Green Version]
- Tan, H.; Du, P.; Zong, K.; Meng, G.; Gao, X.; Li, Y. Investigation on the temperature distribution in the two-phase spider netted micro-channel network heat sink with nonuniform heat flux. Int. J. Therm. Sci. 2021, 169, 107079. [Google Scholar] [CrossRef]
- Cong, B.; Kong, Y.; Ye, Y.; Liu, R.; Du, X.; Yu, L.; Jia, S.; Jiao, B.; Qu, Z. A combined solution of thermoelectric coolers and micro-channels for multi-chip heat dissipation with precise temperature uniformity control. Appl. Therm. Eng. 2022, 219, 119370. [Google Scholar] [CrossRef]
- Laguna, G.; Vilarrubí, M.; Ibañez, M.; Betancourt, Y.; Illa, J.; Azarkish, H.; Amnache, A.; Collin, L.M.; Coudrain, P.; Fréchette, L.; et al. Numerical parametric study of a hotspot-targeted microfluidic cooling array for microelectronics. Appl. Therm. Eng. 2018, 144, 71–80. [Google Scholar] [CrossRef]
- Li, X.; Xuan, Y.; Li, Q. Self-adaptive chip cooling with template-fabricated nanocomposite P(MEO2MA-co-OEGMA) hydrogel. Int. J. Heat Mass Transf. 2021, 166, 120790. [Google Scholar] [CrossRef]
- Yu, Z.; Yuan, H.; Chen, C. Two-phase flow instabilities of forced circulation at low pressure in a rectangular mini-channel. Int. J. Heat Mass Transf. 2016, 98, 438–447. [Google Scholar] [CrossRef]
- Zhang, X.; Yu, T.; Cong, T.; Peng, M. Effects of interaction models on upward subcooled boiling flow in annulus. Prog. Nucl. Energy 2018, 105, 61–75. [Google Scholar] [CrossRef]
- Krepper, E.; Rzehak, R.; Lifante, C.; Frank, T. CFD for subcooled flow boiling: Coupling wall boiling and population balance models. Nucl. Eng. 2013, 255, 330–346. [Google Scholar] [CrossRef]
- Cole, R. A photographic study of pool boiling in the region of the critical heat flux. AICHE J. 1960, 6, 533–542. [Google Scholar] [CrossRef]
- Dai, N. Experimental Study on Flow Characteristics of Gas-Liquid Two-Phase Flow in a Serpentine Tube; Shandong University: Jinan, China, 2021. [Google Scholar]


| Study | Improvement Result |
|---|---|
| H-type bifurcation structure [12] | The average temperature deviation is less than ±5 K. |
| density-based topology optimization [13] | The highest temperature and average temperature are both decreased by 10 °C while the pressure drop is unchanged. |
| fractal tree-like structures [14] | The maximum temperature difference among the heat sources is 1.3 K. |
| hierarchical manifolds [15] | The heat sink with 15 μm × 300 μm channels is shown to dissipate base heat fluxes up to 910 W/cm2 at pressure drops of less than 1.62 bar. |
| spider web-like structures [16] | The optimal structure can meet the requirements of temperature uniformity within 2 K at a higher heat flux of 150 W/cm2. |
| a combined solution of thermoelectric coolers and micro-channels [17] | It can achieve precise temperature control of multiple chips with maximum temperature difference less than 0.3 K and temperature standard deviation less than 0.07 K when the heat flux is 50 W/cm2. |
| a cooling array with self-adaptive micro valves [18] | The tailored micro-channel device reaches a temperature uniformity of 4 K with a pumping power lower than 0.001% of the chip power. |
| self-adaptive chip cooling with template-fabricated nanocomposite hydrogel [19] | A heat flux of 100 W/cm2 can be extracted with a similar increase in temperature, while the coefficient of performance (COP) is improved by an order of magnitude. |
| Typical Element Size/mm | Number of Grids | Tw/K | α |
|---|---|---|---|
| 1 | 158,418 | 333.82 | 0.74% |
| 0.8 | 247,298 | 335.25 | 0.31% |
| 0.5 | 429,389 | 336.00 | 0.09% |
| 0.1 | 830,553 | 336.31 | - |
| Channel Size | Highest Temperature of Heat Source/K | Average Temperature of Heat Source/K | Pressure Drop/Pa |
|---|---|---|---|
| 4 mm × 3 mm | 367.34 | 365.32 | 1548.4 |
| 5 mm × 2.4 mm | 366.49 | 364.47 | 1593.9 |
| 6 mm × 2 mm | 366.19 | 364.14 | 1662.5 |
| 7 mm × 1.714 mm | 365.62 | 363.56 | 1702.4 |
| 8 mm × 1.5 mm | 365.13 | 363.05 | 1836.5 |
| Channel Width | Highest Temperature of Heat Source/K | Average Temperature of Heat Source/K | Pressure Drop/Pa |
|---|---|---|---|
| 4 mm | 357.72 | 352.57 | 236,500 |
| 6 mm | 353.85 | 348.71 | 231,200 |
| 8 mm | 348.91 | 343.74 | 220,600 |
| Model | Highest Temperature of Heat Source/K | Average Temperature of Heat Source/K | Pressure Drop/Pa |
|---|---|---|---|
| 1 | 371.30 | 369.28 | 978 |
| 2 | 368.18 | 366.13 | 851 |
| 3 | 370.50 | 368.16 | 928 |
| 4 | 369.49 | 367.46 | 787 |
Disclaimer/Publisher’s Note: The statements, opinions and data contained in all publications are solely those of the individual author(s) and contributor(s) and not of MDPI and/or the editor(s). MDPI and/or the editor(s) disclaim responsibility for any injury to people or property resulting from any ideas, methods, instructions or products referred to in the content. |
© 2023 by the authors. Licensee MDPI, Basel, Switzerland. This article is an open access article distributed under the terms and conditions of the Creative Commons Attribution (CC BY) license (https://creativecommons.org/licenses/by/4.0/).
Share and Cite
Qian, J.; Wang, R.; Wei, T.; Tang, H.; Hu, D. Numerical Analysis of Flow Boiling Characteristics of a Single Channel Heat Sink Subjected to Multiple Heat Sources. Energies 2023, 16, 3060. https://doi.org/10.3390/en16073060
Qian J, Wang R, Wei T, Tang H, Hu D. Numerical Analysis of Flow Boiling Characteristics of a Single Channel Heat Sink Subjected to Multiple Heat Sources. Energies. 2023; 16(7):3060. https://doi.org/10.3390/en16073060
Chicago/Turabian StyleQian, Jiyu, Rui Wang, Tao Wei, Hao Tang, and Dinghua Hu. 2023. "Numerical Analysis of Flow Boiling Characteristics of a Single Channel Heat Sink Subjected to Multiple Heat Sources" Energies 16, no. 7: 3060. https://doi.org/10.3390/en16073060