Article

Directional Dependency of Relative Permeability in Vugular Porous Medium: Experiment and Numerical Simulation

1
Department of Energy and Resources Engineering, Peking University, Beijing 100871, China
2
School of Petroleum Engineering, China University of Petroleum (East China), Qingdao 266580, China
*
Author to whom correspondence should be addressed.
Energies 2023, 16(7), 3041; https://doi.org/10.3390/en16073041
Submission received: 27 January 2023 / Revised: 8 March 2023 / Accepted: 25 March 2023 / Published: 27 March 2023

Abstract

:
Carbonate reservoirs are a highly heterogeneous type of reservoir characterized by the presence of a large amount of vugs and pores. During two-phase displacement, the two-phase flow regime in the vugs might be gravity segregated. The distribution pattern of two-phase fluid in the vugs would accelerate the water flow in downward and horizontal directions, meanwhile decelerating in an upward direction, resulting in a different oil recovery ratio. This gives rise to the question of whether the relative permeability should be modeled as a directional dependent in a vugular porous medium since it is usually treated as an isotropic quantity. In this study, via both experiment and numerical simulation, we demonstrate that the relative permeability of vugular porous medium is dependent on the angle between the flow direction and the horizontal plane and should be considered for oil recovery estimation for carbonate reservoirs. Using the transmissibility-weighted upscaling method and a single-vug model, the relative permeability curves for different flow directions are obtained by numerical simulation. A directional relative permeability model for a vugular porous medium is also proposed.

1. Introduction

Carbonate reservoirs throughout the world represent over 50% of the world’s conventional and unconventional hydrocarbon resources [1,2,3]. However, carbonate reservoirs usually suffer from a low primary recovery factor [4,5]; therefore, secondary as well as enhanced recovery techniques are frequently required to achieve an ideal ultimate recovery ratio [6]. Accurate numerical modeling of multiphase flow in carbonate reservoirs is highly beneficial to the exploitation of oil and gas from these reservoirs. However, the heterogeneous and multiscale nature of carbonate reservoirs has imposed several difficulties on numerical simulation. Carbonate reservoirs are highly heterogeneous across all scales [7]. F.J. Lucia divided the pore space of carbonate reservoirs into interparticle and vuggy pore space [8]. The interparticle pore space has a length scale of tens to hundreds of microns (10−5–10−4 m). The vuggy pore space consists of a huge amount of vugs, which have length scales ranging from millimeters to several meters (10−3–100 m), as shown in Figure 1. The main difficulty for numerical simulation is the coexistence of Darcy flow in the porous region and free flow in the vug region [9]. As shown by previous researchers, the presence of a free-flow region in the surrounding porous region significantly alters the effective permeability of the media, potentially by orders of magnitude. Another difficulty is the large degree of uncertainty related to the shape and location of the interface between the porous region and the vug region [10]. Due to these difficulties, numerical simulation of fluid flow in carbonate reservoirs has always been a challenging problem.
Three types of numerical models have been proposed in the literature to handle the simulation of fluid flow in carbonate reservoirs. The first type of model is the triple (or multiple) continuum model. In this model, the pore space in carbonate reservoirs is conceptualized as three (or multiple) superimposing and interacting continua, namely the matrix, fracture, and vug. The mass exchange of fluid between different continuas in the same grid block is calculated by a characteristic length between them. The characteristic lengths are calculated analytically for several regular fracture-vug combinations. Liu et al. [11], Camacho-Velázquez et al. [12], and Wu et al. [13] proposed the triple continuum model for single-phase flow in carbonate reservoirs. Kang et al. [14] and Wu et al. [15] further extended the model to simulate multiphase flow. The triple continuum model is computationally efficient. However, its accuracy is heavily reliant on the validity of the characteristic length, which was only derived for regular fracture-vug combinations. In reality, the geometry of vugs and fractures in carbonate reservoirs are highly complex, thus limiting the applicability of the triple-continuum model.
The second type of model is the discrete fracture-vug network model (DFVN) [16,17,18]. In this model, the fractures and vugs are explicitly modeled as distinct elements. Darcy’s law is used to model fluid flow in matrices and fractures, while Navier-Stokes equations are used to model the free flow region in vugs. The two different governing equations are coupled at the vug interface using the Beavers-Joseph-Saffman boundary conditions [19,20]. DFVN was initially derived for single-phase flow. Later, Chen et al. [21,22], Huang et al. [23], and Xie et al. [24] introduced the coupled Cahn-Hilliard and Navier-Stokes equations in the free flow region to simulate two-phase flow in composite models consisting of both a free flow region and porous medium. DFVN provides a more realistic representation of carbonate reservoirs. However, due to the coupled numerical scheme, it is much more computationally expensive and thus is inappropriate for porous medium with a large amount of vugs [25], such as the outcrop of Tahe oilfield, China, shown in Figure 1. Furthermore, the accuracy of the DFVN model is reliant on having a detailed knowledge of the location and geometry of the interface, which is rarely available for underground reservoirs. Recently, Liu et al. [26,27] proposed a hybrid two-phase model where they proposed a simplified vug model to avoid the coupling of Darcy flow and free flow to achieve better computation efficiency. However, this simplified vug model still requires detailed information on the vug geometry.
The third type of model is the equivalent continuum model (ECM). In this model, the vug and pore system is represented by homogeneous representative elementary volume (REV) with averaged parameters. Because of this averaging process, the ECM is well suited to handle the simulation of problems with a large amount of vugs that have a large degree of uncertainty. The key step during modeling with ECM is to determine the appropriate equivalent parameter for the REVs. Much research has been devoted to this subject. Arbogast et al. [28,29] simulated single-phase flow in a vugular porous medium on the microscopic scale via a coupled Darcy-Stokes system. Then, by using the homogenization theory, they proved analytically that the momentum conservation equation for the macroscopic equivalent medium is identical to the form of Darcy’s law. Huang et al. [30] obtained the equivalent permeability tensor for a fractured vuggy porous medium by simulation using the DFVN model. As an alternative approach, Popov et al. [10,31] and Qin et al. [32] used the Stokes-Brinkmann equations instead of the coupled Darcy-Stokes system as the microscopic scale model to obtain the equivalent permeability tensor. Golfier et al. [33] proved that the momentum conservation equation for the macroscopic equivalent medium resulting from this approach is also in the form of Darcy’s law. All of the above studies are focused on obtaining the single-phase flow parameter, i.e., the permeability tensor. In contrast, the appropriate method for obtaining the property of two-phase or multi-phase flow, i.e., the relative permeability, has rarely been discussed in the literature. Pal [34] and Li et al. [35] made no special adjustment for the relative permeability functions in their ECM model for two-phase flow. Huang et al. [36] proposed an analytical method to obtain equivalent relative permeability for ECM. In this method, water is assumed to displace oil from fractures and vugs preferentially before it displaces oil from the matrix. The equivalent relative permeability is a weighted average between the relative permeability of the matrix and fracture-vug system. The resulting relative permeability is isotropic. Recently, Wang et al. [37] presented an efficient two-phase ECM model for carbonate reservoirs where they used flow-based upscaling techniques to obtain anisotropic relative permeability. However, in their model, only the fractures and matrix are included in the equivalent medium; meanwhile, the empty vugs are modeled as constant pressure boundaries. Moreover, the effect of gravity segregation was not explicitly considered in their upscaling technique. As shown by plenty of experiments [38,39,40,41,42,43], gravity segregation of multiple phases inside vugs caused by density difference is one of the most important mechanisms of multiphase flow in carbonate reservoirs. Therefore, it is required to investigate the implication of this mechanism on the relative permeability of the equivalent medium in the ECM model.
In this study, we demonstrate that the effect of gravity segregation of oil and water inside vugs is essential for two-phase flow in a vugular porous medium, and the relative permeability of the equivalent medium is dependent on the angle θ between the flow direction and the horizontal plane. To focus on the effect of vugs, we designed a symmetric single-vug model and conducted a physical experiment and numerical simulation with it. The rest of the paper is organized as follows: in Section 2, we introduce the setup and results of the physical experiment. In Section 3, we introduce and validate the numerical scheme which we used to obtain relative permeability. In Section 4, we adopt the flow-based upscaling approach to calculate the relative permeability curve of the single-vug model in 13 flow directions. Based on the upscaling results, a directional relative permeability model is proposed for a vugular porous medium. We finally draw our conclusions in Section 5.

2. Displacement Experiment for Vugular Porous Media

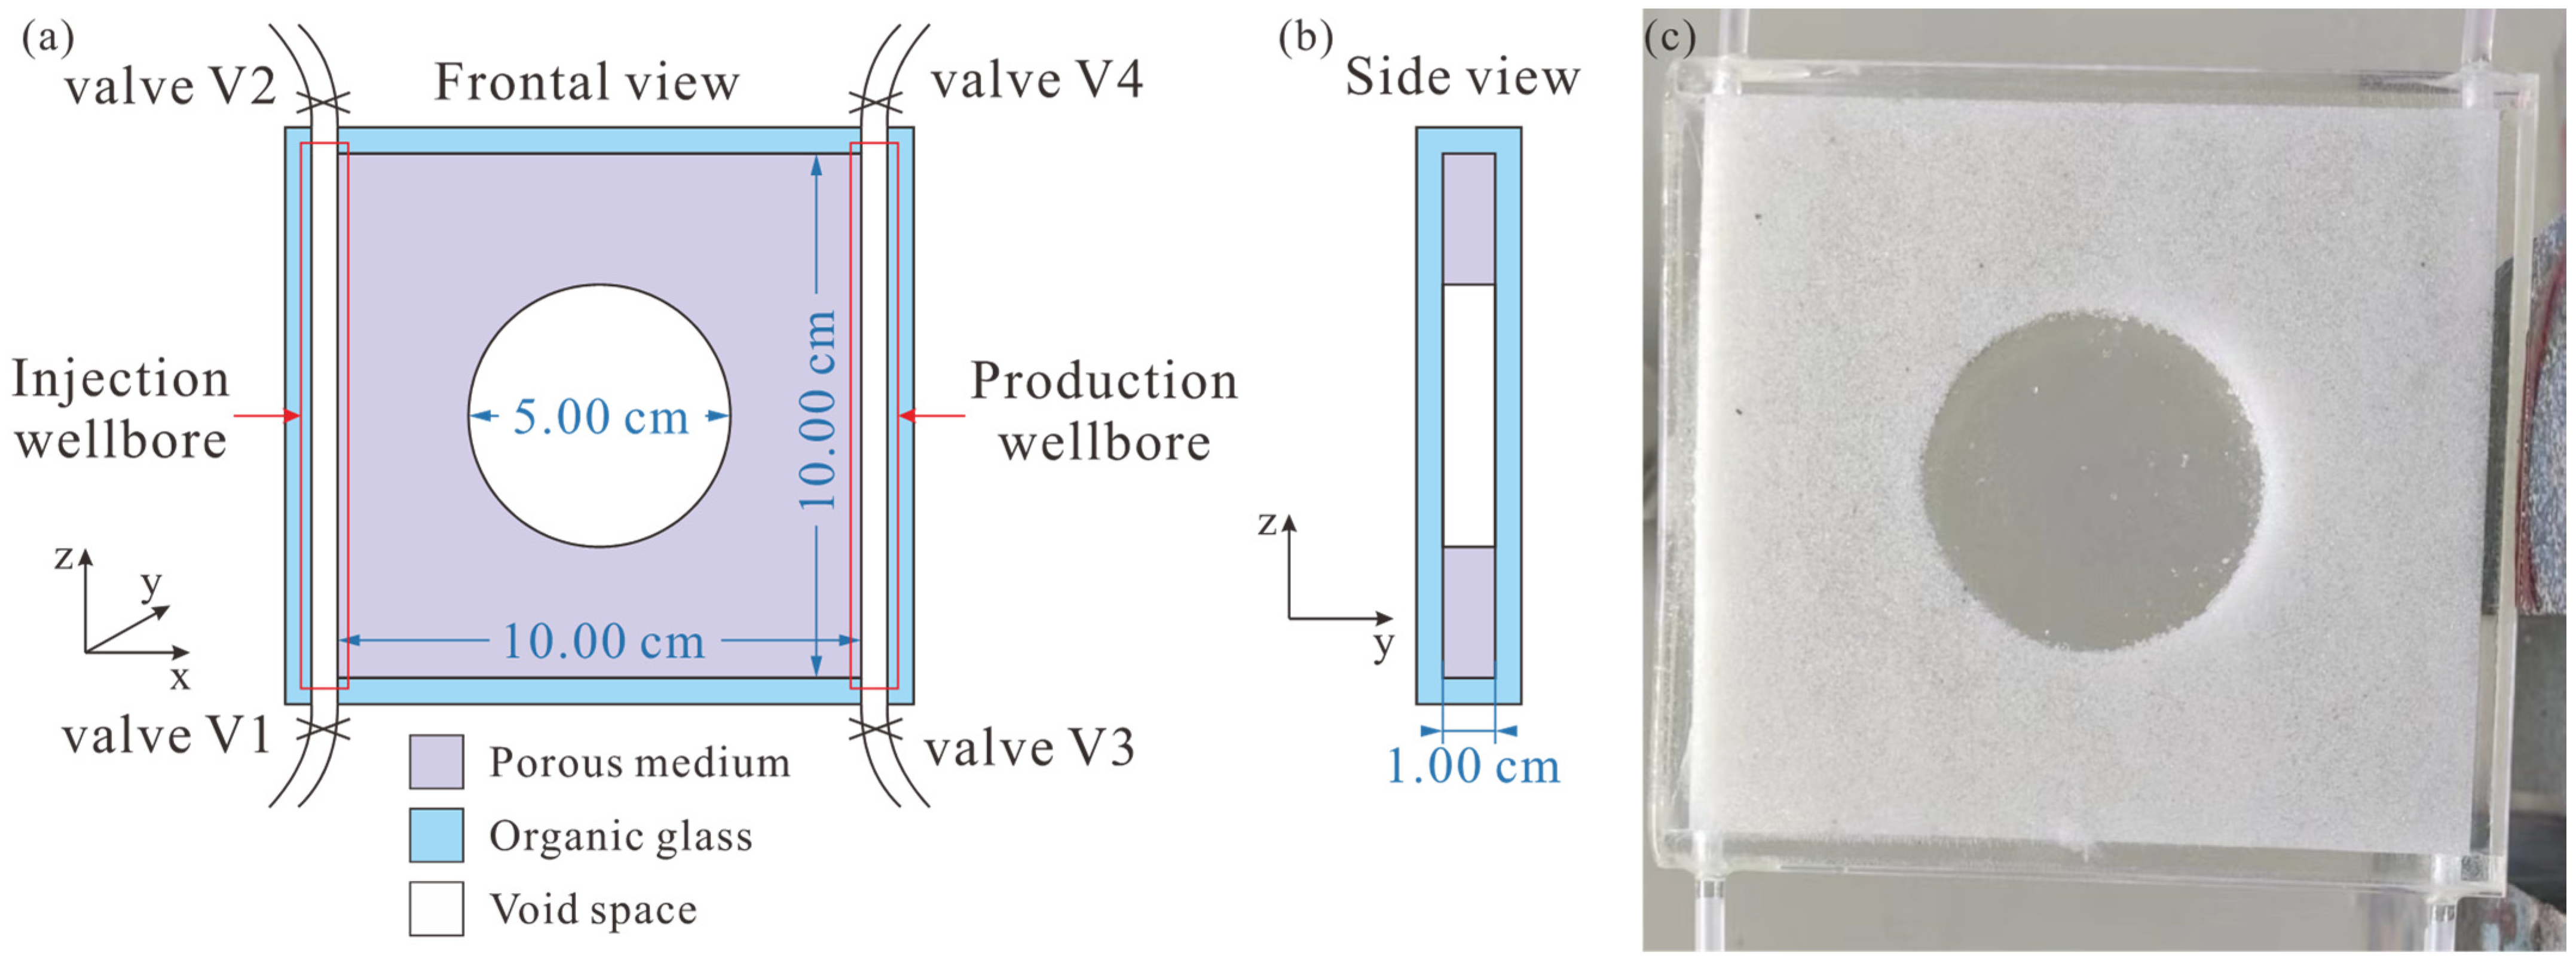
2.1. Physical Model Setup and Fluid Characteristics

The schematic of the single-vug model in the x-z plane is shown in Figure 2. The single-vug model consists of a 10 cm × 1 cm × 10 cm porous medium with a circular vug located at the center. The diameter of the vug is 5 cm. This symmetric geometry eliminates the effect of geometry on two-phase flow dynamics when the flow directions are different. The physical model is coated in transparent organic glass plates with two wellbores (injection and production) located on the opposing side. Both wellbores are connected to two branches of the pipeline with a valve attached to each of them. The volume of a single wellbore, including the pipelines, is about 3.5 cm3. The porous medium is made with 95% glass beads of diameter between 0.2–0.3 mm mixed with 5% epoxy as the cementing material. After the glass beads and the epoxy mixture was filled into an organic glass coating, the model was placed into an oven at 70 °C for 30 min until the epoxy was completely dried. The wettability of the porous medium is controlled by the epoxy and is slightly oil-wet. The ratio between vug volume and total pore volume (which does not include the volume of the two wellbores) is about 0.43. A manufactured sample of the physical model is shown in Figure 2c.
Distilled water is chosen as the water phase in the experiment, which has a density of 1.0 g/cm3 and a viscosity of 1 cp. A mixture of industrial white oil and kerosene is chosen as the oil phase, which has a density of 0.84 g/cm3 and a viscosity of 18 cp, respectively. To make a visual difference between the two phases, the oil phase was colored red with Sudan Ⅲ.

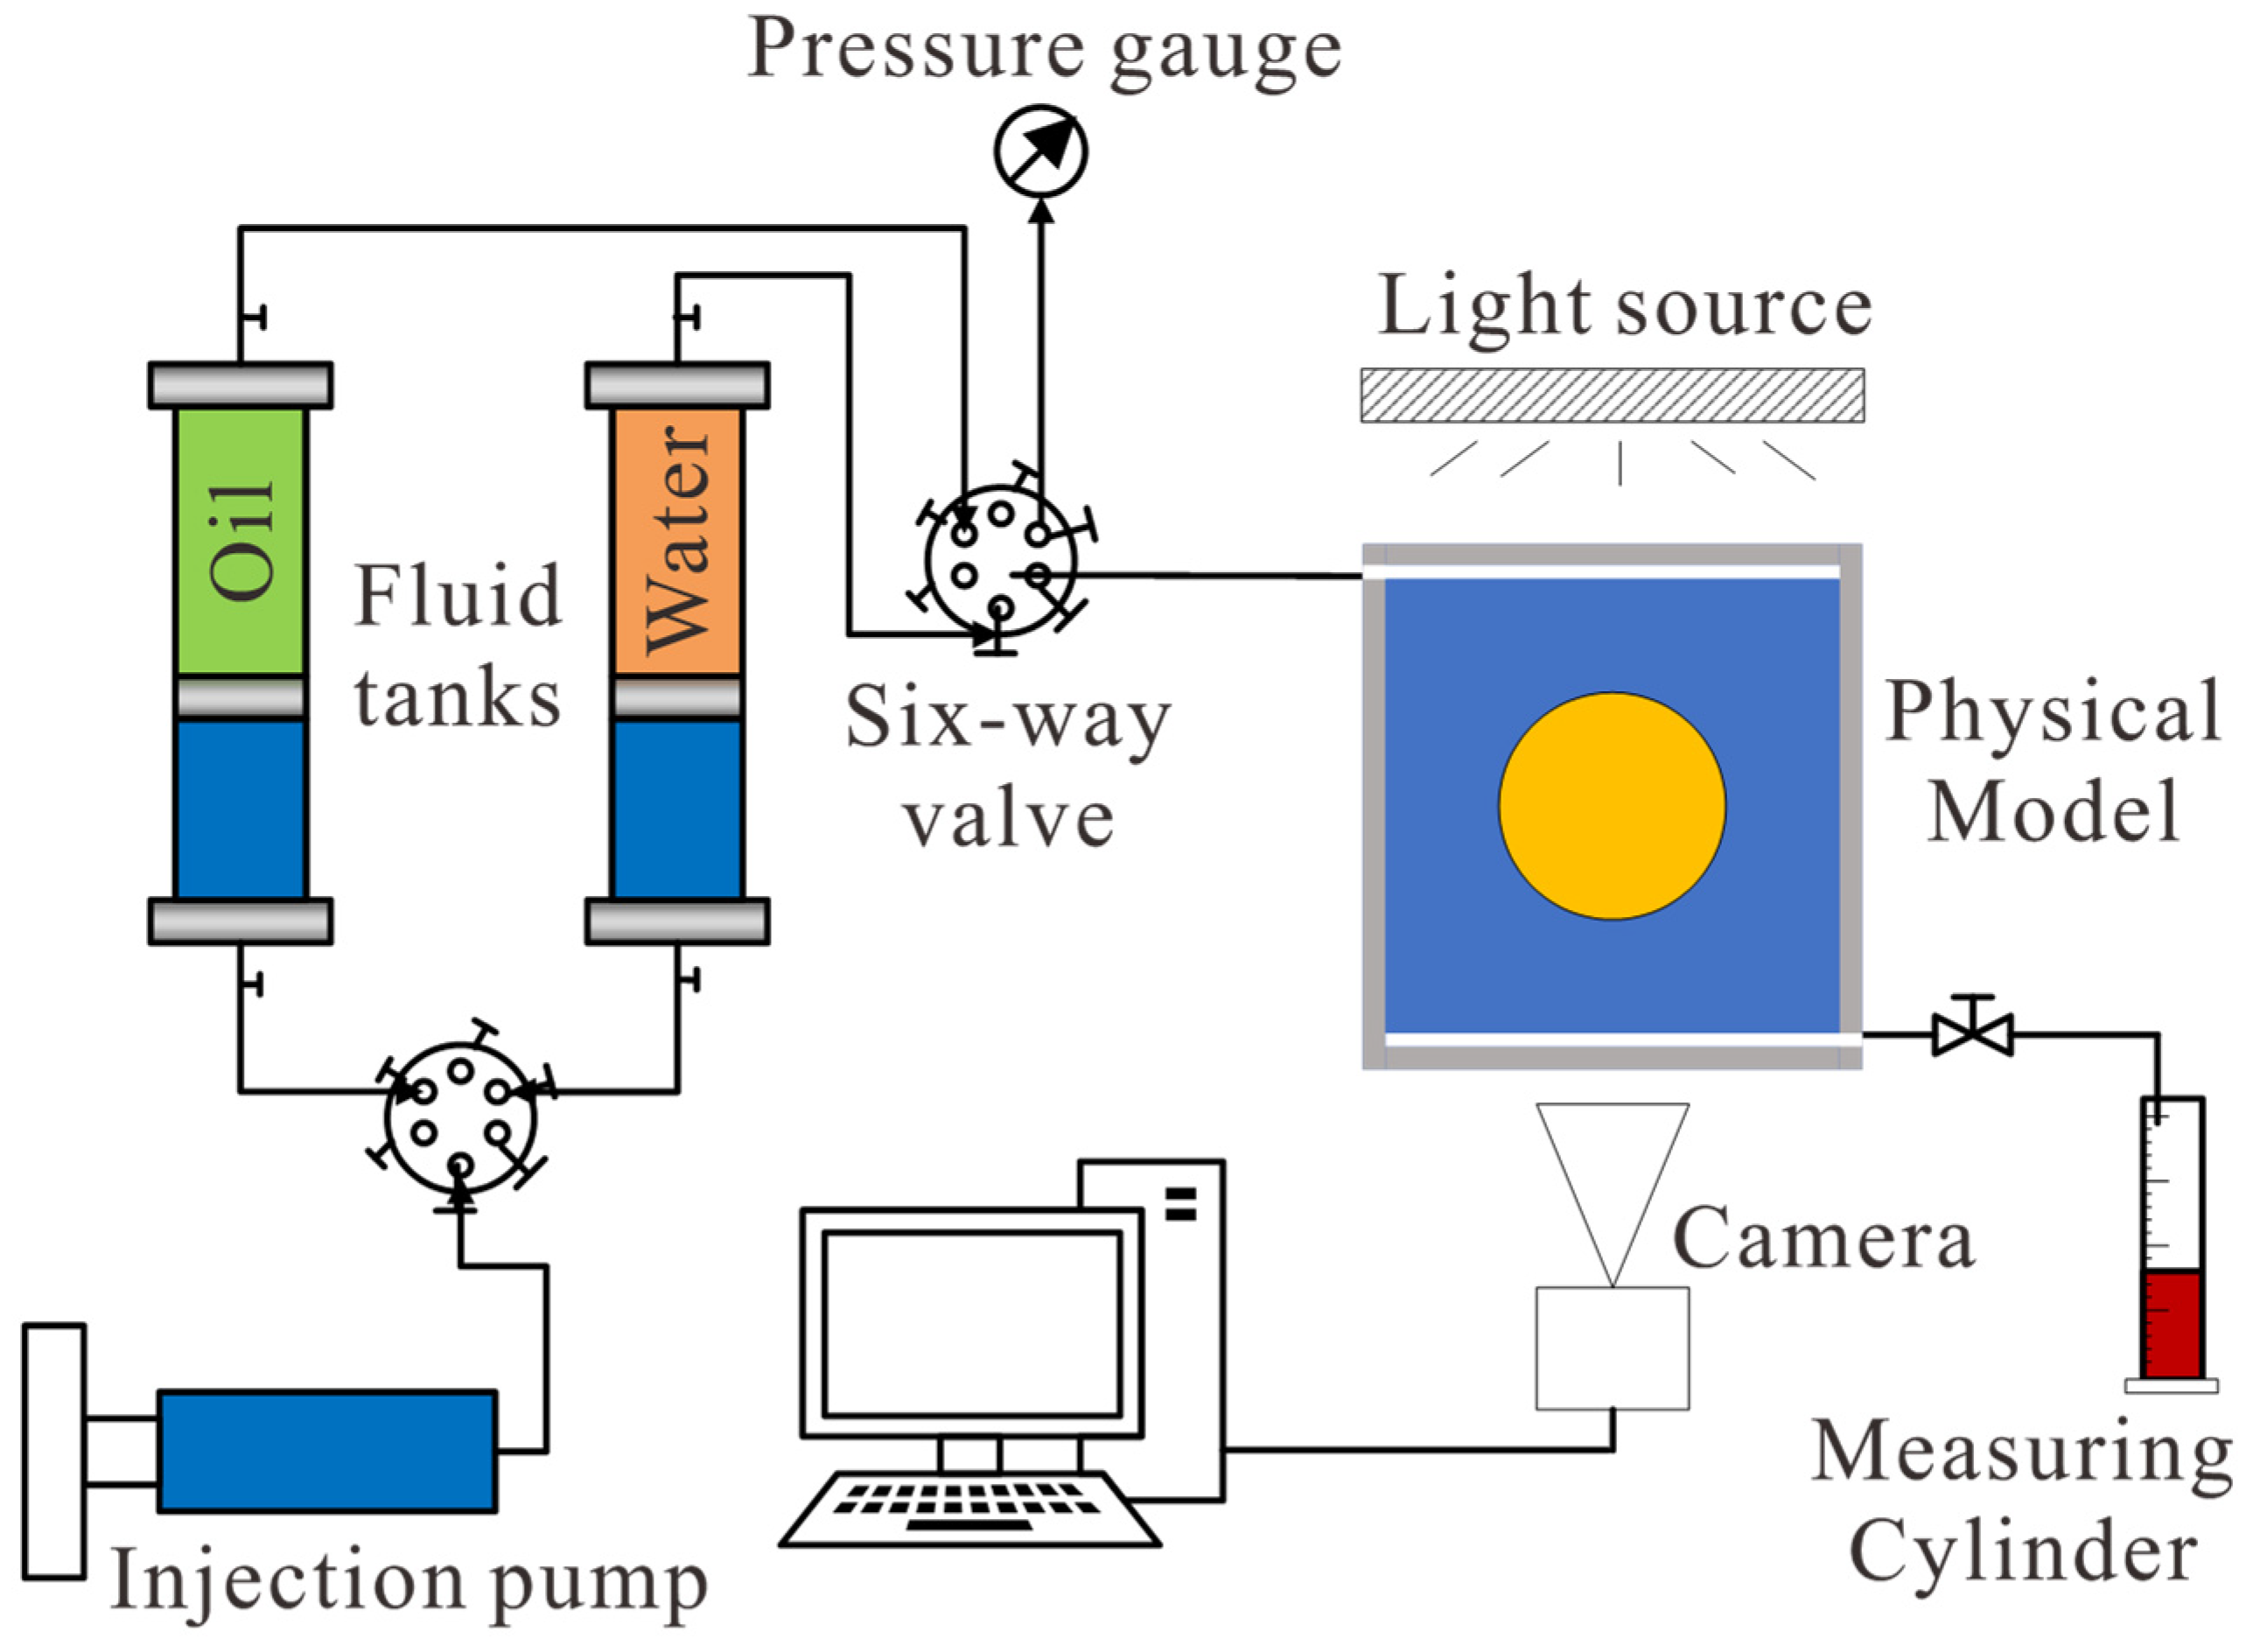
2.2. Experiment Setup and Procedure

The experiments were conducted at atmospheric pressure and room temperature (25 °C). The setup during the experiment is shown in Figure 3, and the experimental procedures are given as follows:
(1)
Fully saturate the model with water, then inject oil from the top of the model until no water is produced.
(2)
Fully saturate the injection wellbore with water by opening valves V1 and V2 only.
(3)
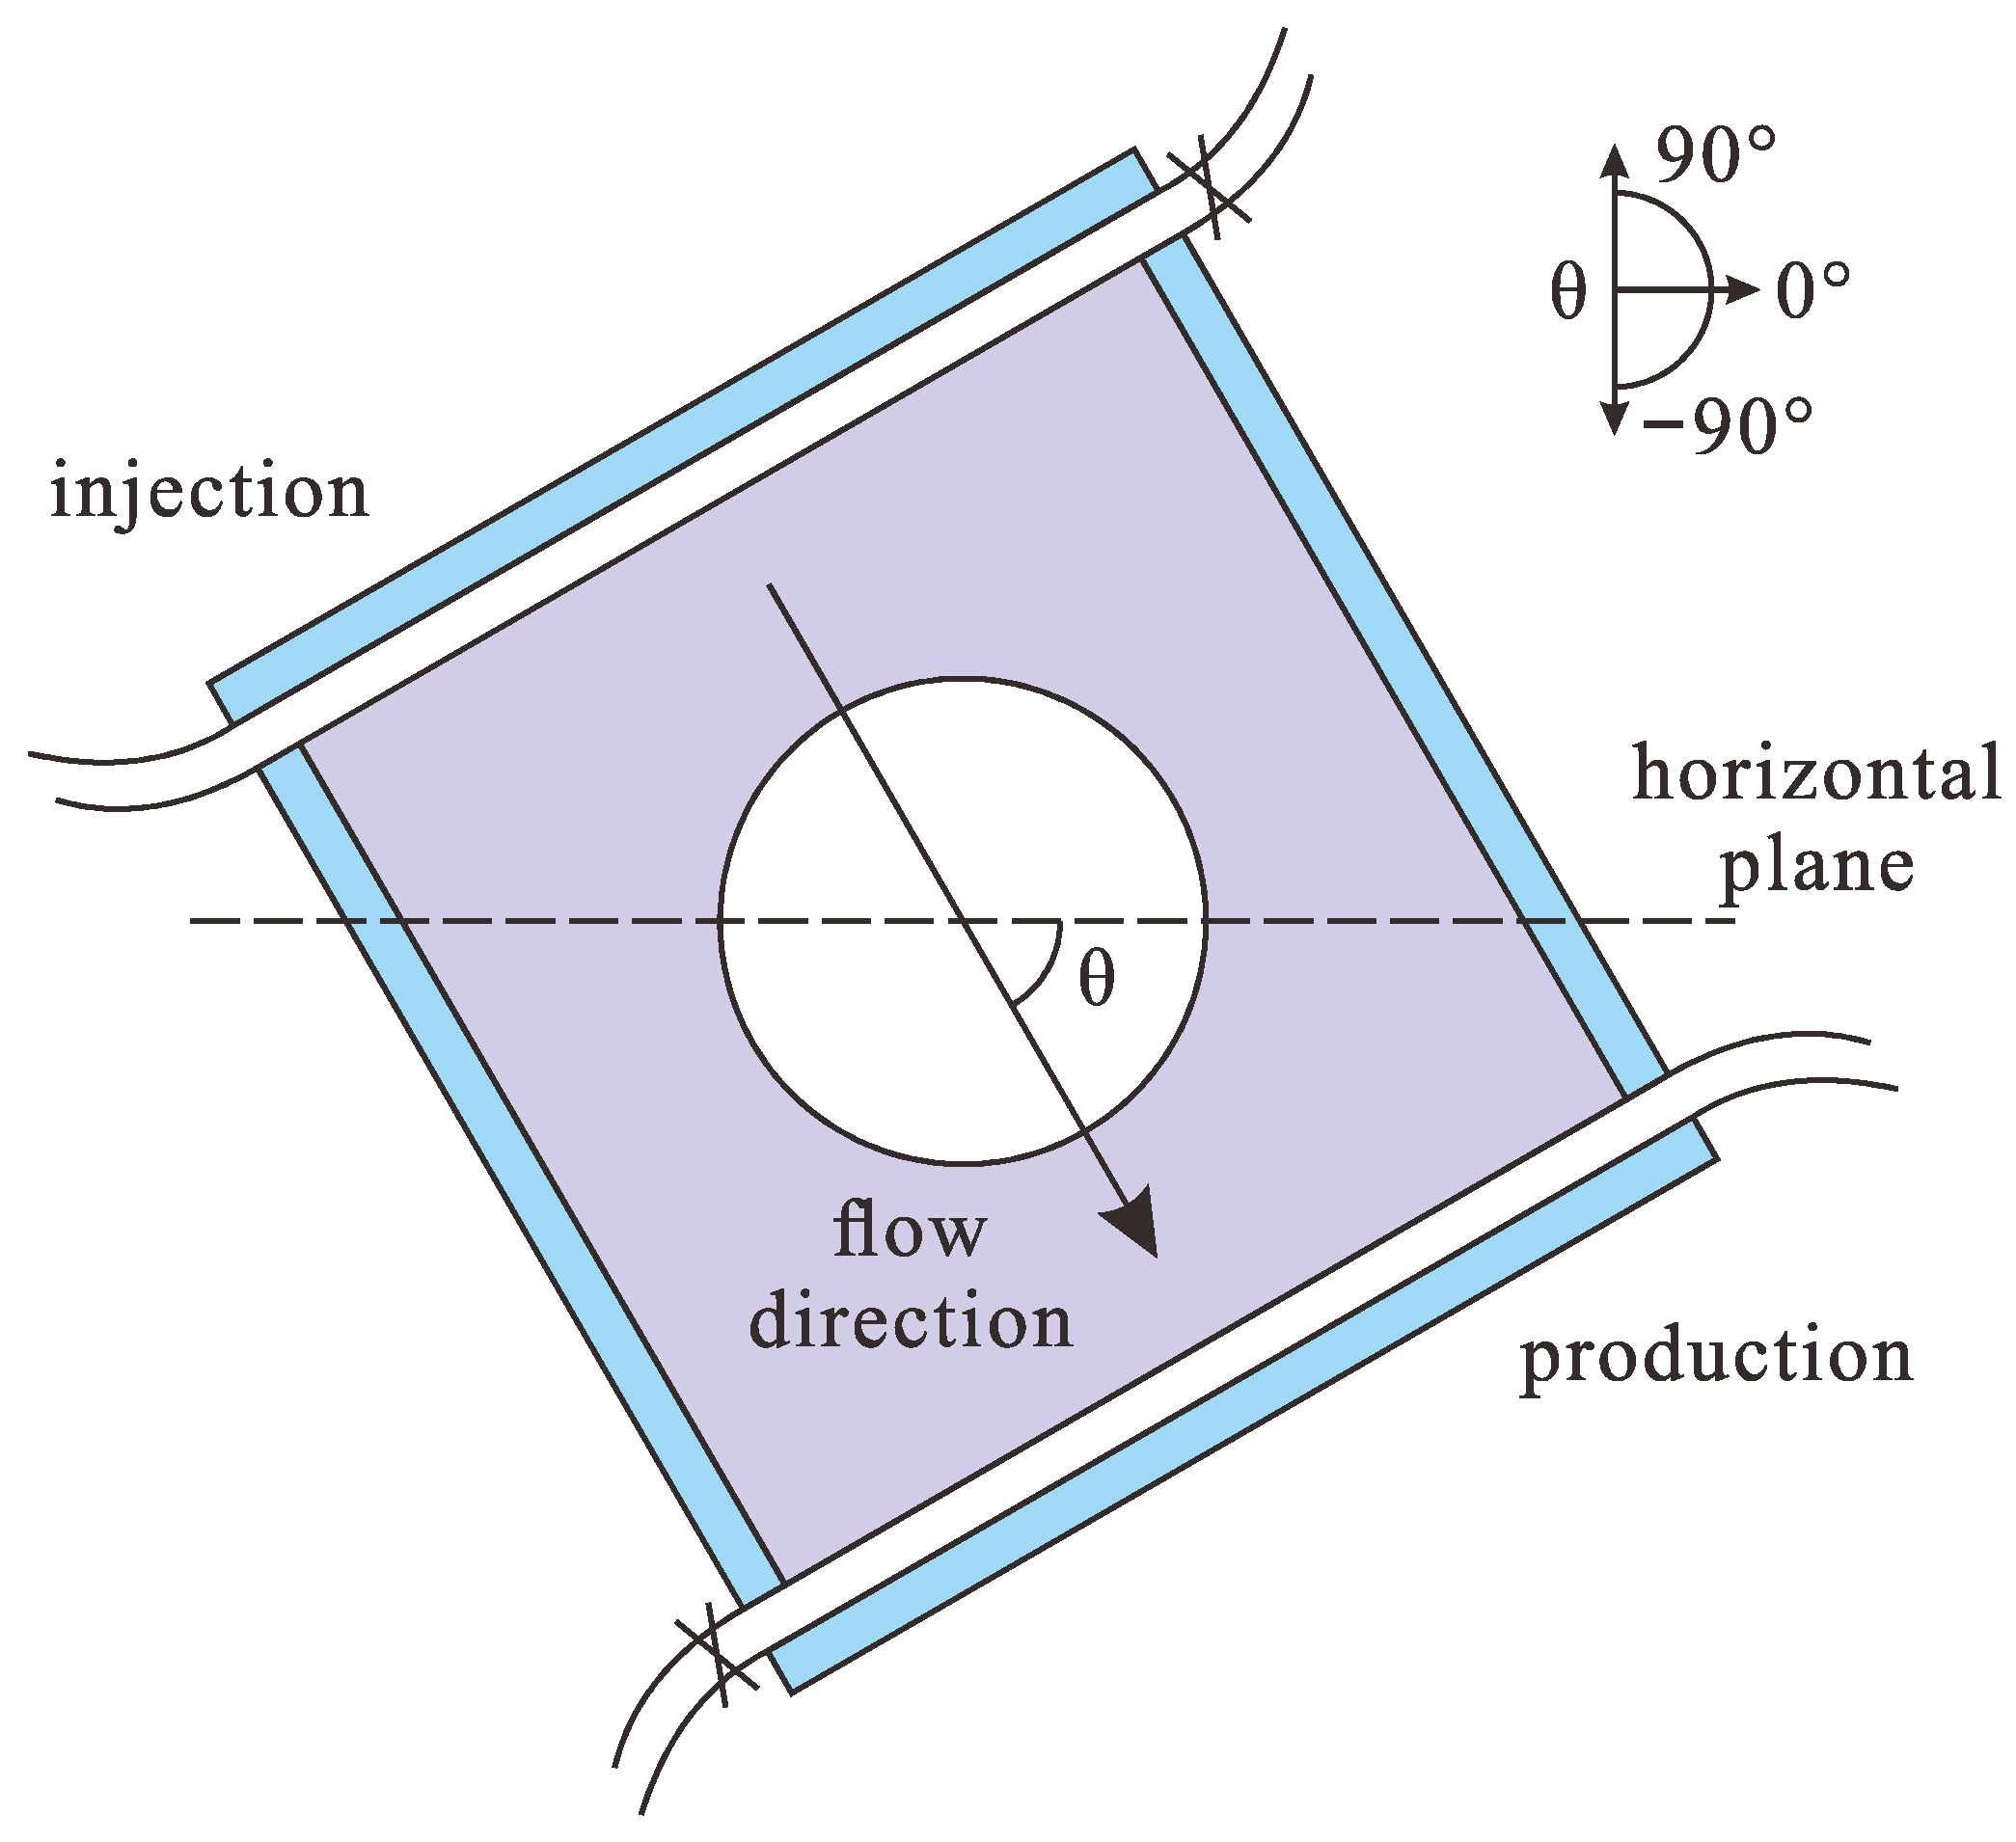
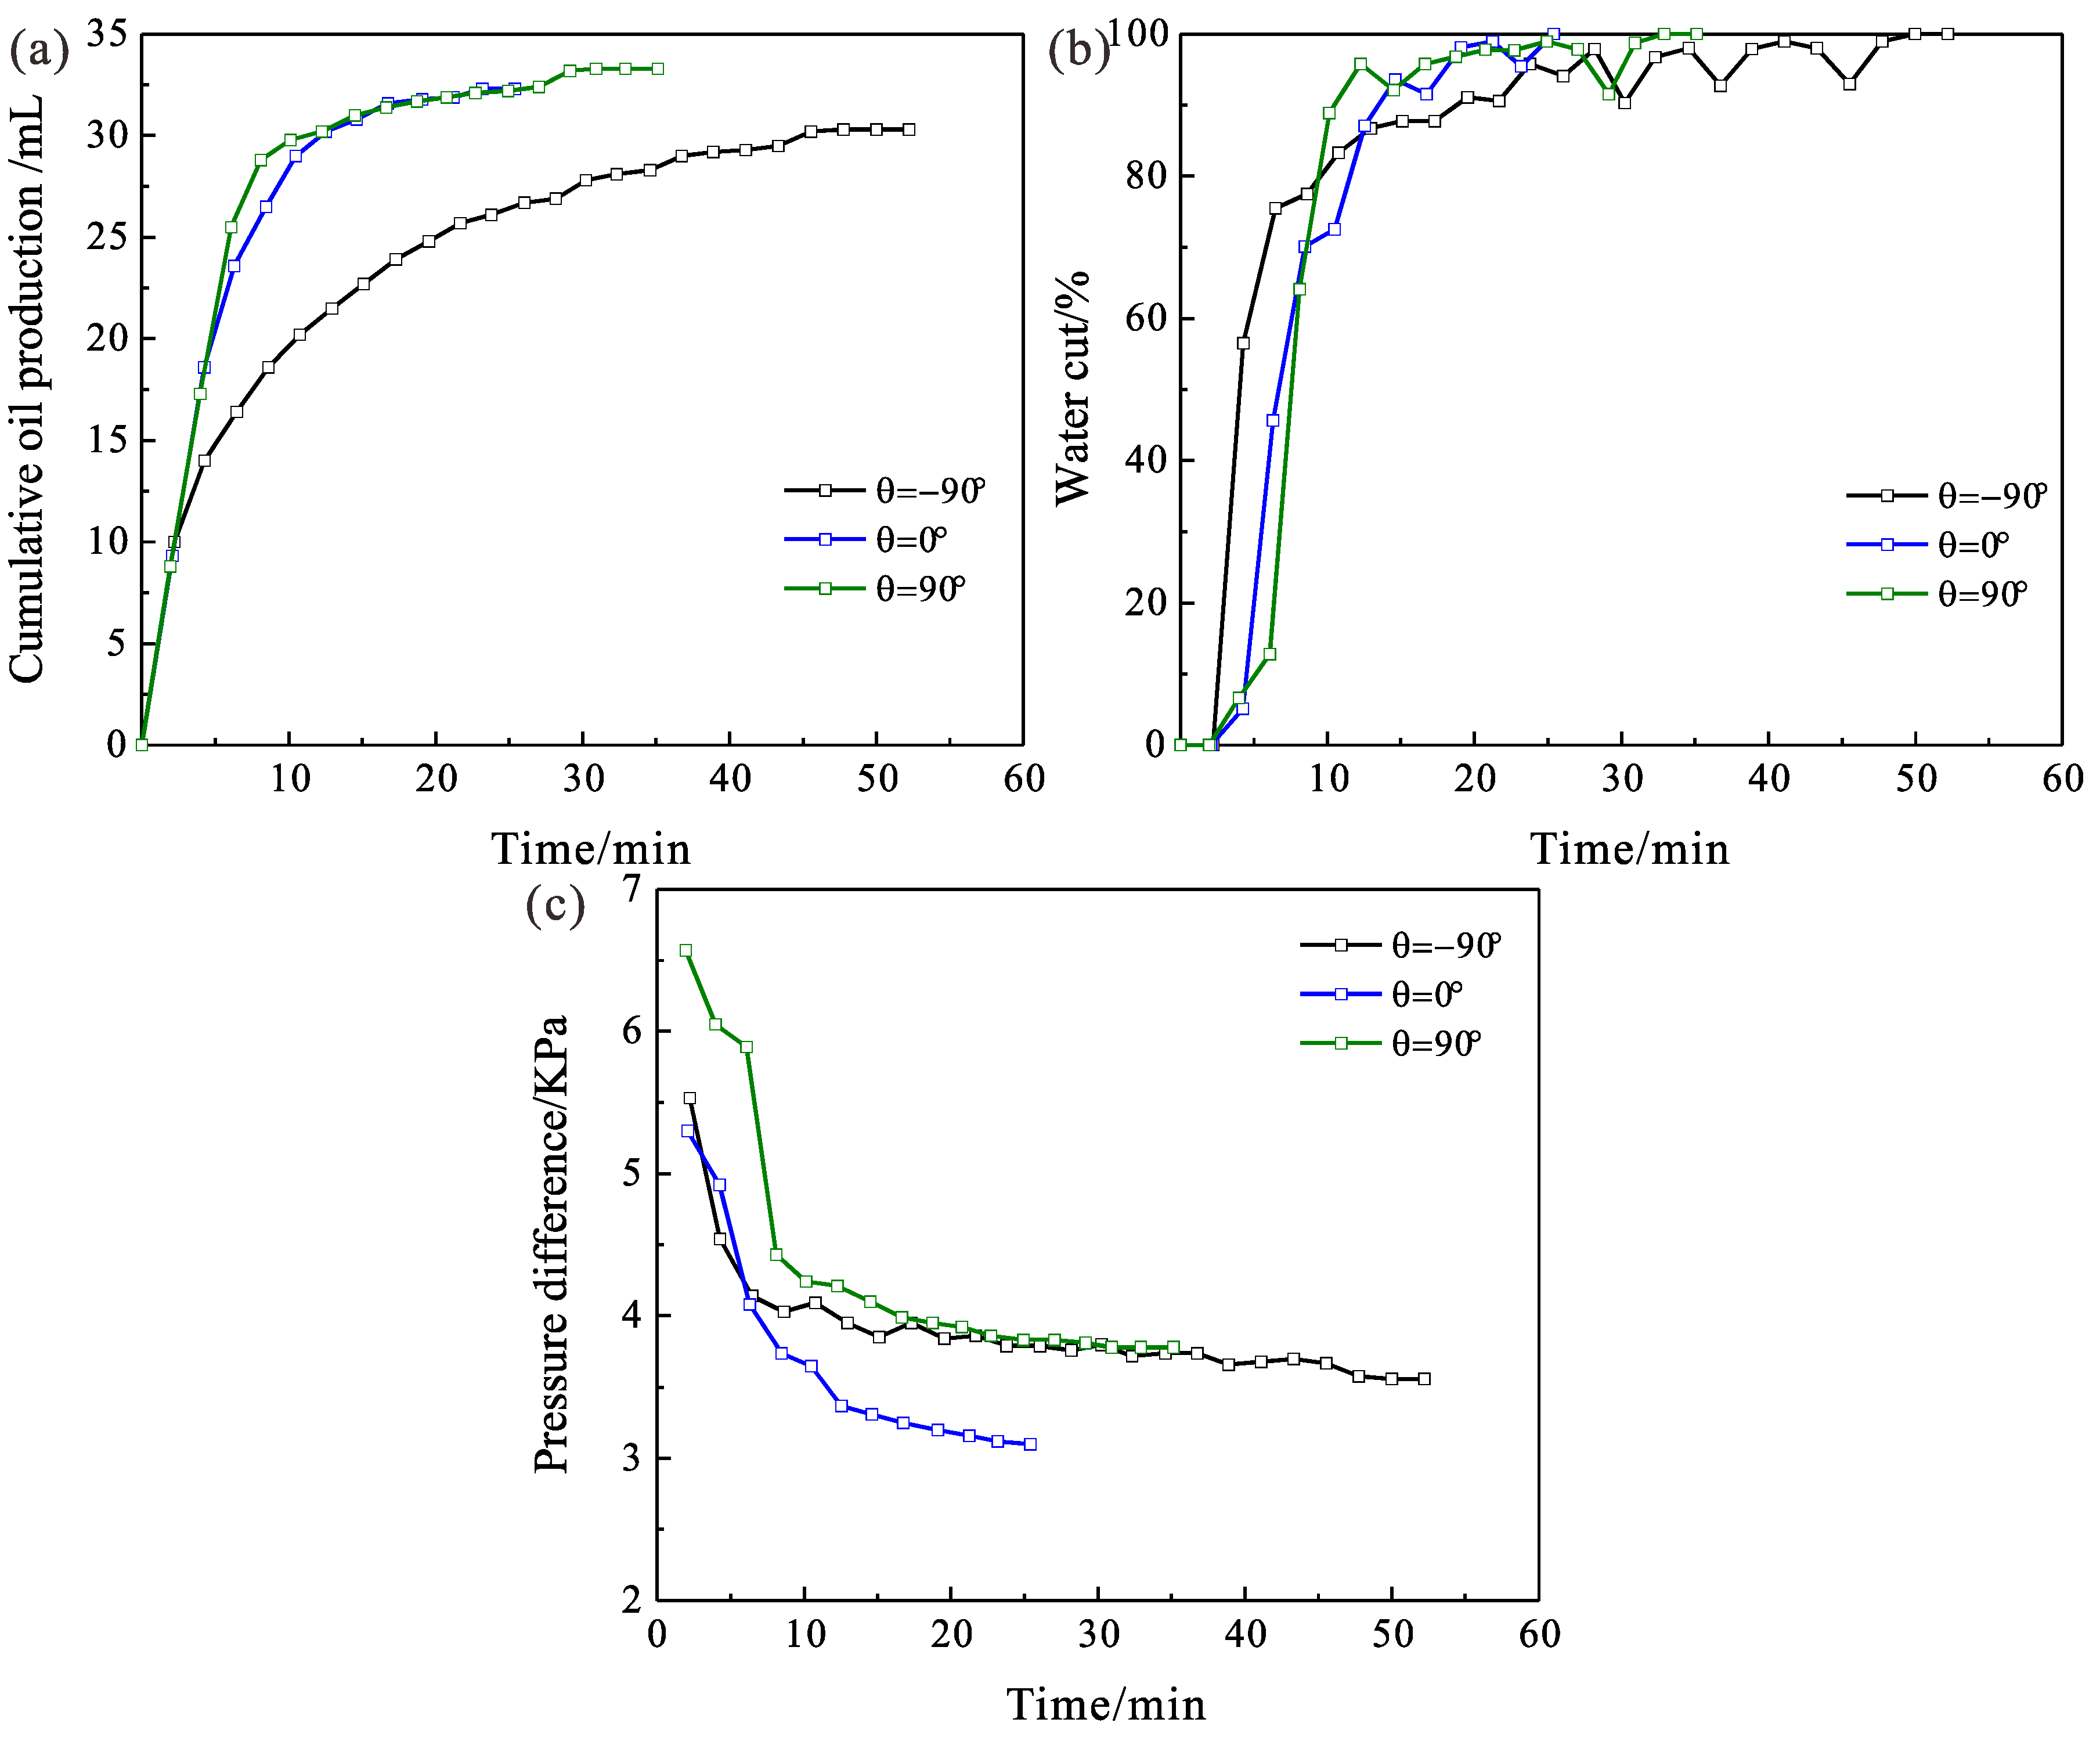
Inject water into the model at a constant rate of 4.5 mL/min by opening valve V1 and one of the valves V3 or V4. This gives an average flow velocity (Darcy velocity) of 6.48 m/day. As shown in Figure 4, the macroscopic flow direction is across the two sides of the wellbores. In this study, we denote the angle between this flow direction and the horizontal plane as θ. For instance, θ equals to −60° in Figure 4. The injection is continued until the water cut reaches 99%, which is usually achieved after 3–5 PV (pore volume) of water is injected.
(4)
During step (3), constantly record phase distribution within the model with a camera, as well as the pressure drop across the model and liquid production.
(5)
Change a new sample. Set θ equal to −90° (vertically downward), 0° (horizontal), and 90° (vertically upward), respectively, and repeat step (1)–(4).

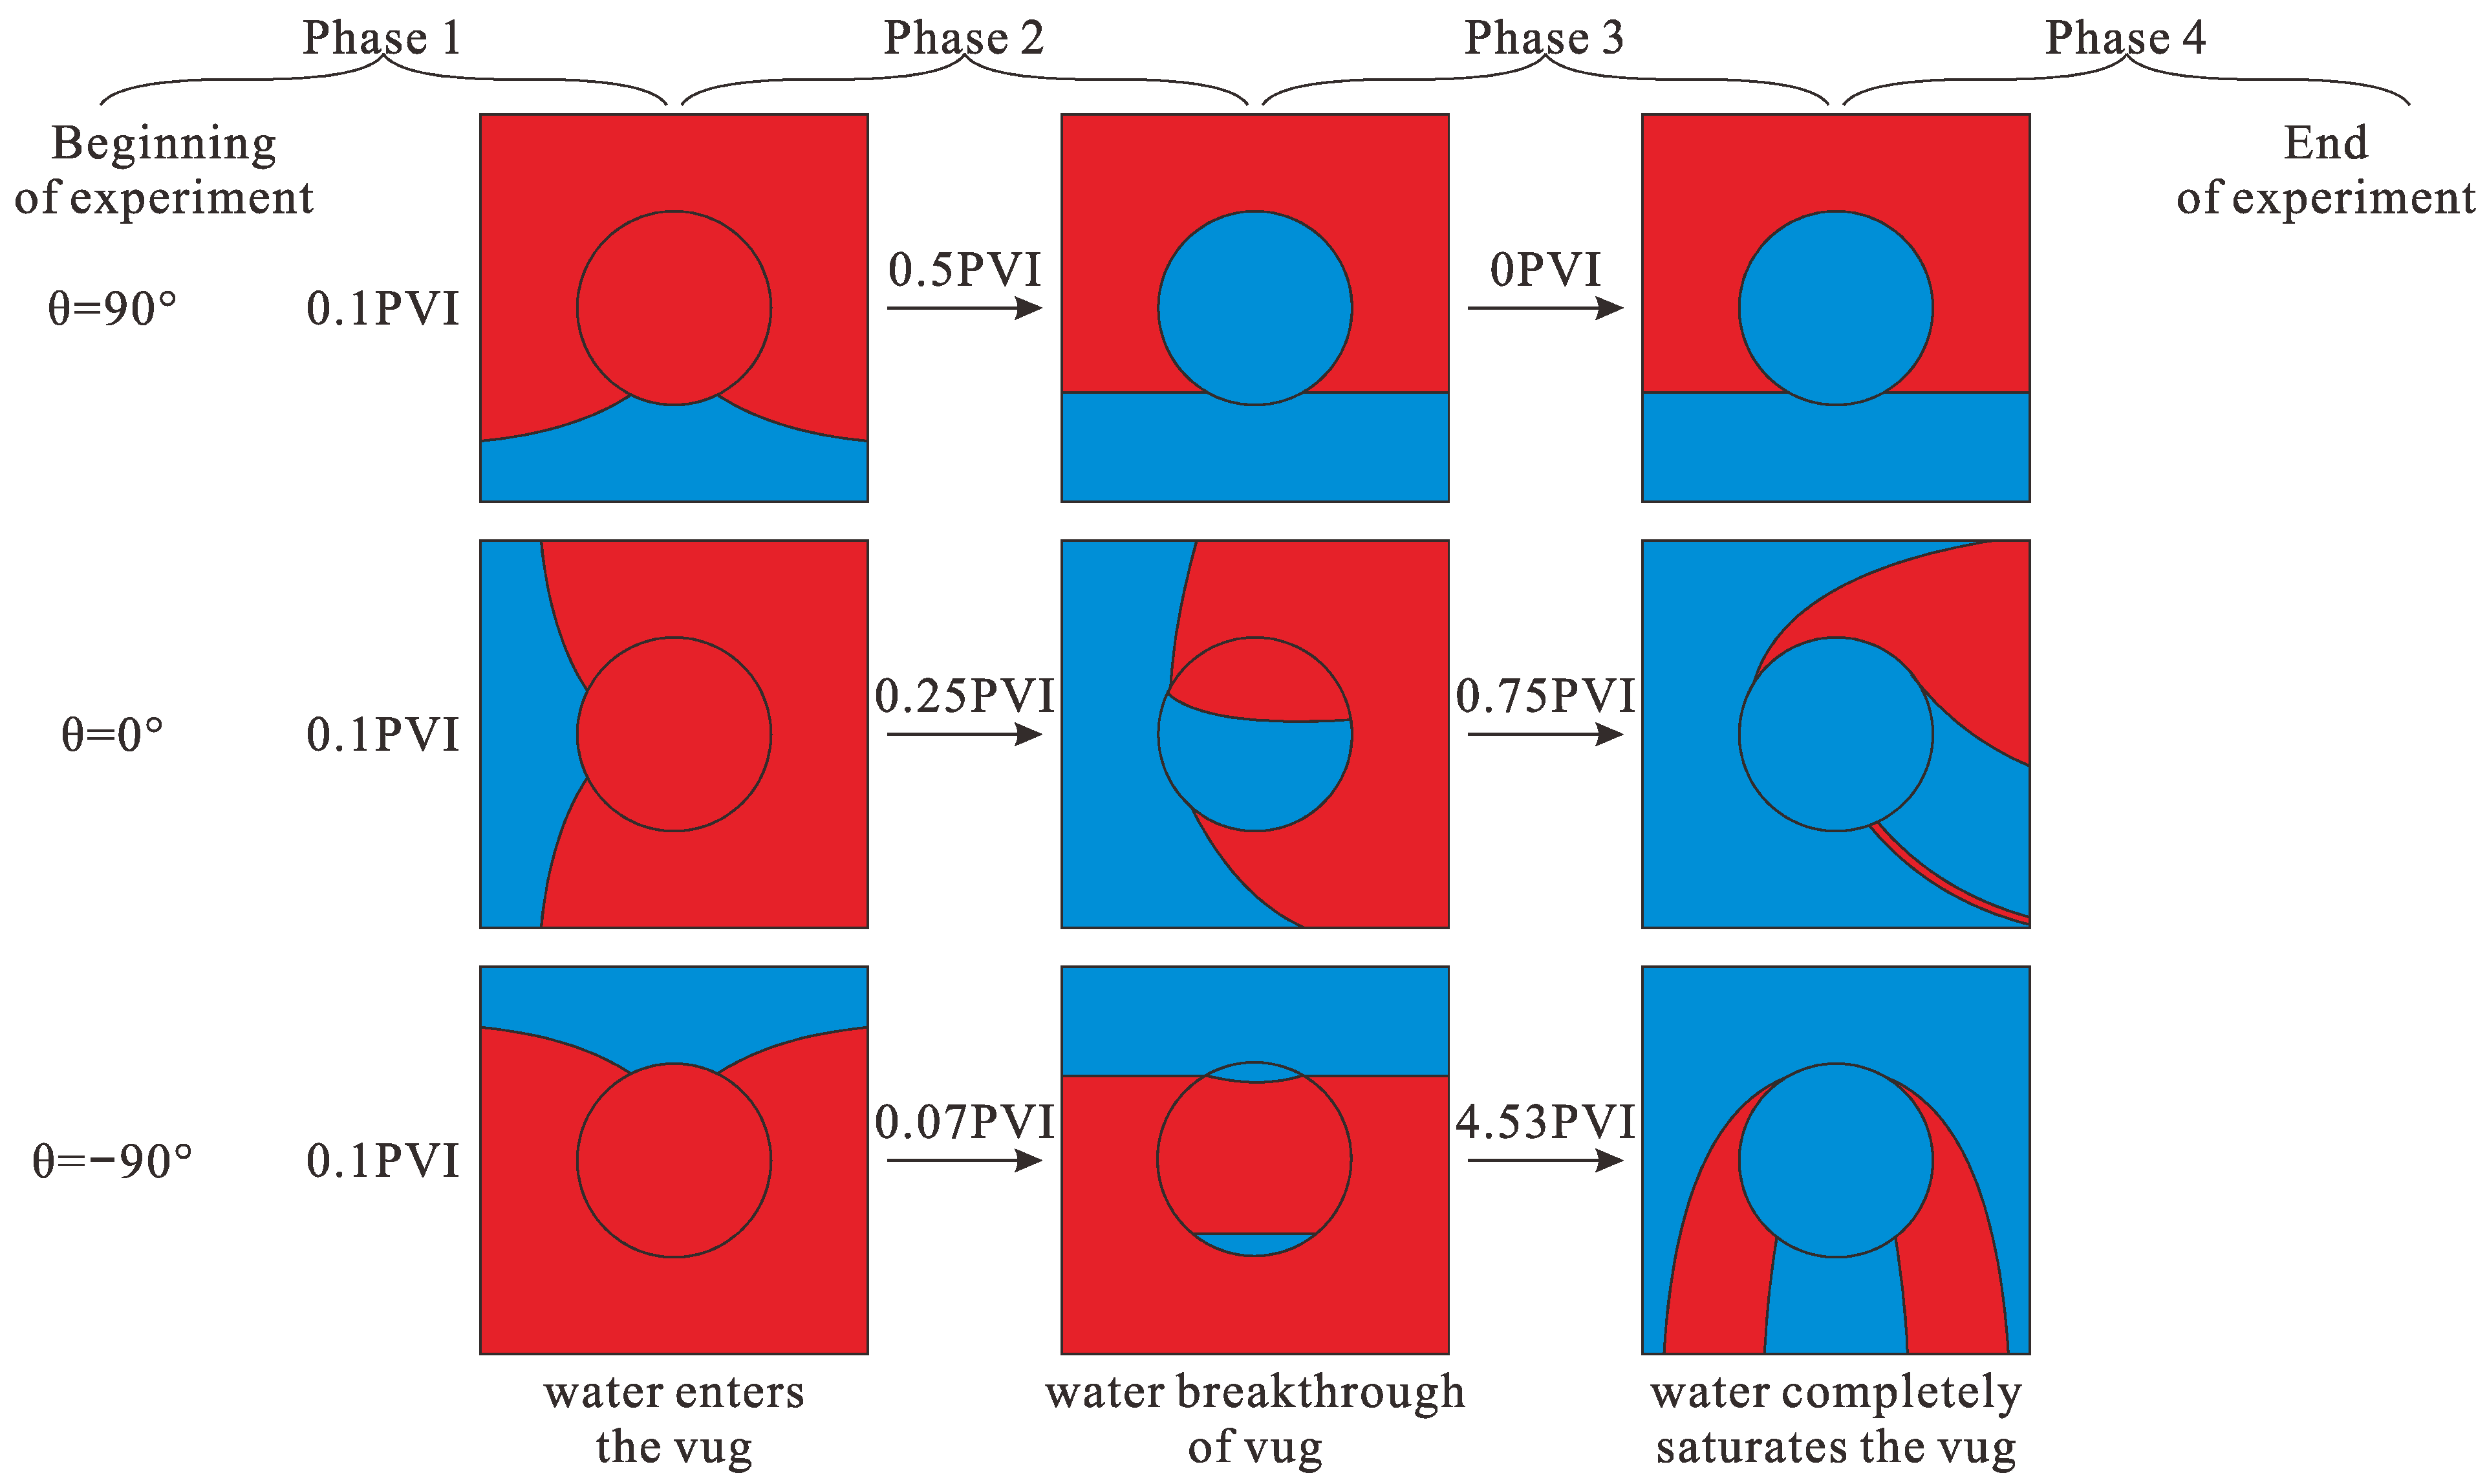
2.3. Experiment Results

The volume of cumulative produced oil, the water cut of the production well, and the pressure drop across the model for displacement experiments for three different flow directions are plotted in Figure 5.

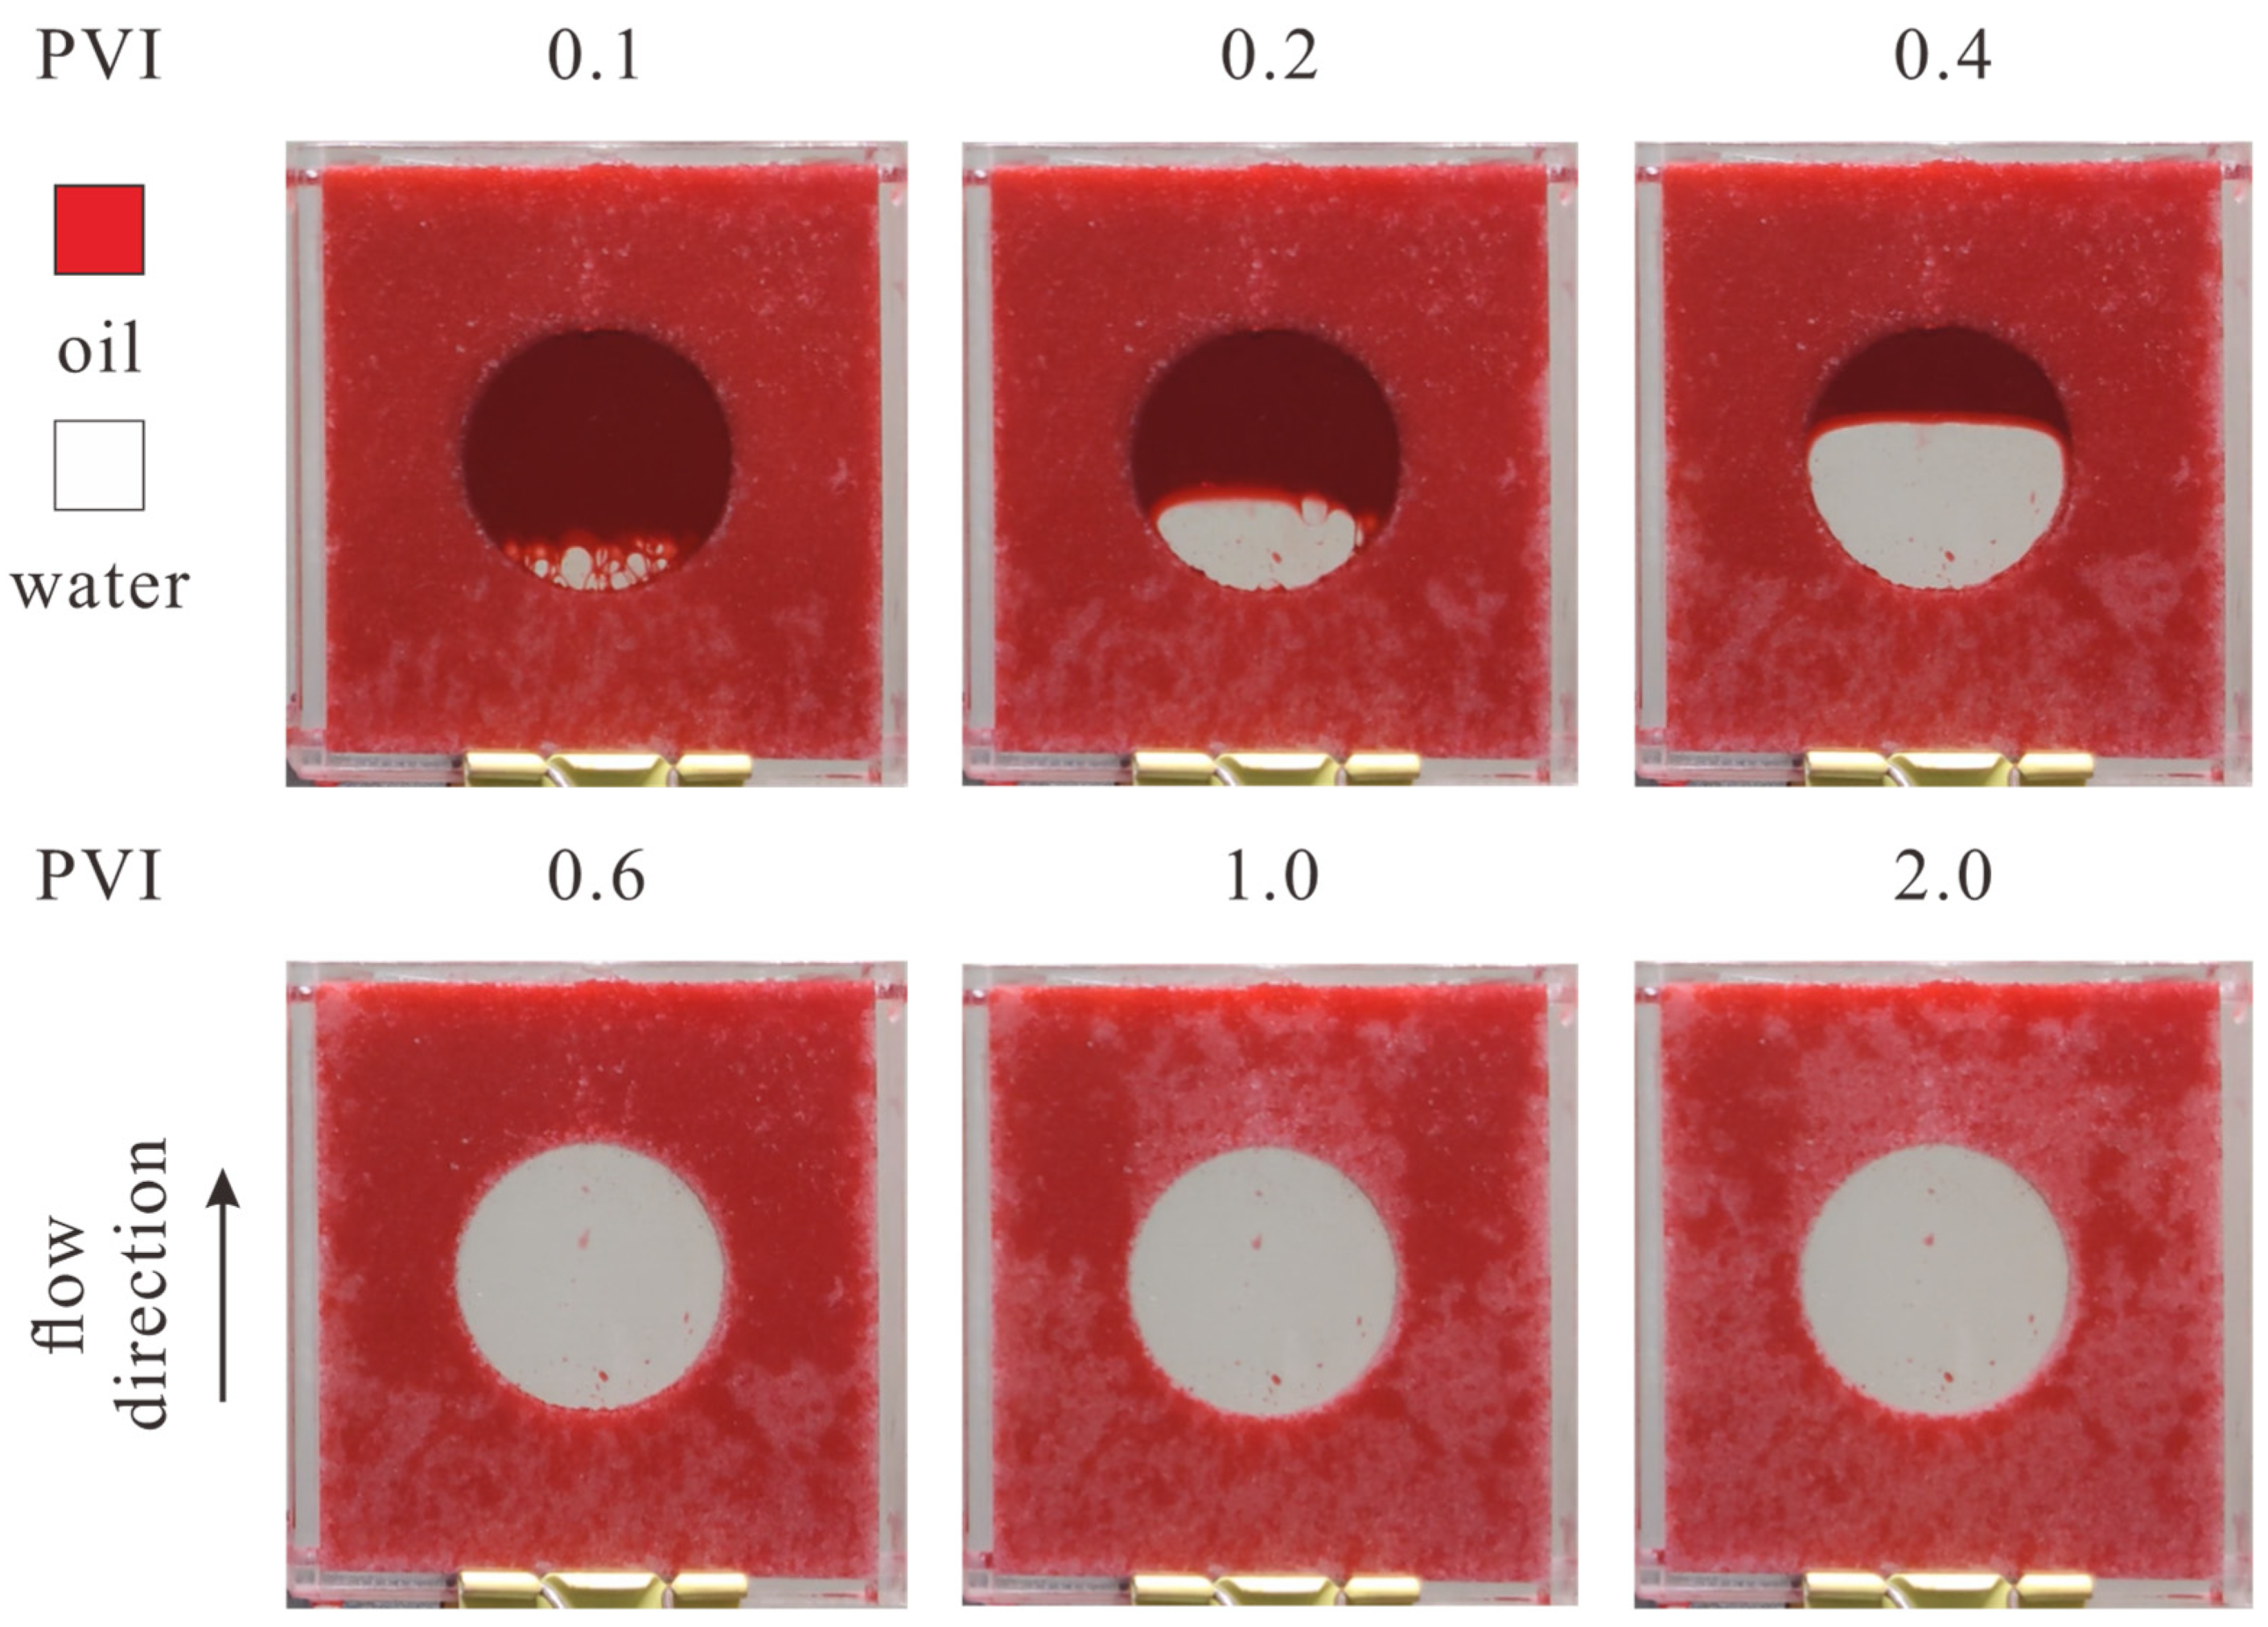
2.3.1. Case 1: Vertically Upwards (θ = 90°)

The oil saturation distribution during the displacement experiment with θ = 90° is shown in Figure 6. At the beginning of water flooding, injected water flows preferentially towards the vug before it enters the vug at 0.1 PVI (pore volume injected). Then, water displaces the oil in the vug steadily upwards in a typical piston-like displacement. The displacement efficiency in the vug is close to 100%. In the meantime, the waterfront in the porous medium remained quasi-immobile since the vug region has much less flow resistance as well as zero capillary pressure compared with the porous medium. Water starts to flow out of the vug at a PVI of 0.6 when the water saturation in the vug is 100%, after which the waterfront above and at both sides of the vug becomes mobile again. The water breakthrough of the production well occurs at a PVI of 0.3; this is likely because there is water channeling along the left and right edges of the model. The real water breakthrough time is estimated to be PVI 0.65 from the recordings of the camera. After the water breakthrough, water displaces oil in the top-left and top-right parts of the model at a very slow rate, and the water cut of the production well stayed over 90% for the rest of the experiment. The oil recovery ratio (volume of produced oil versus original oil in place) at PVI 1.0 is 73.3%.

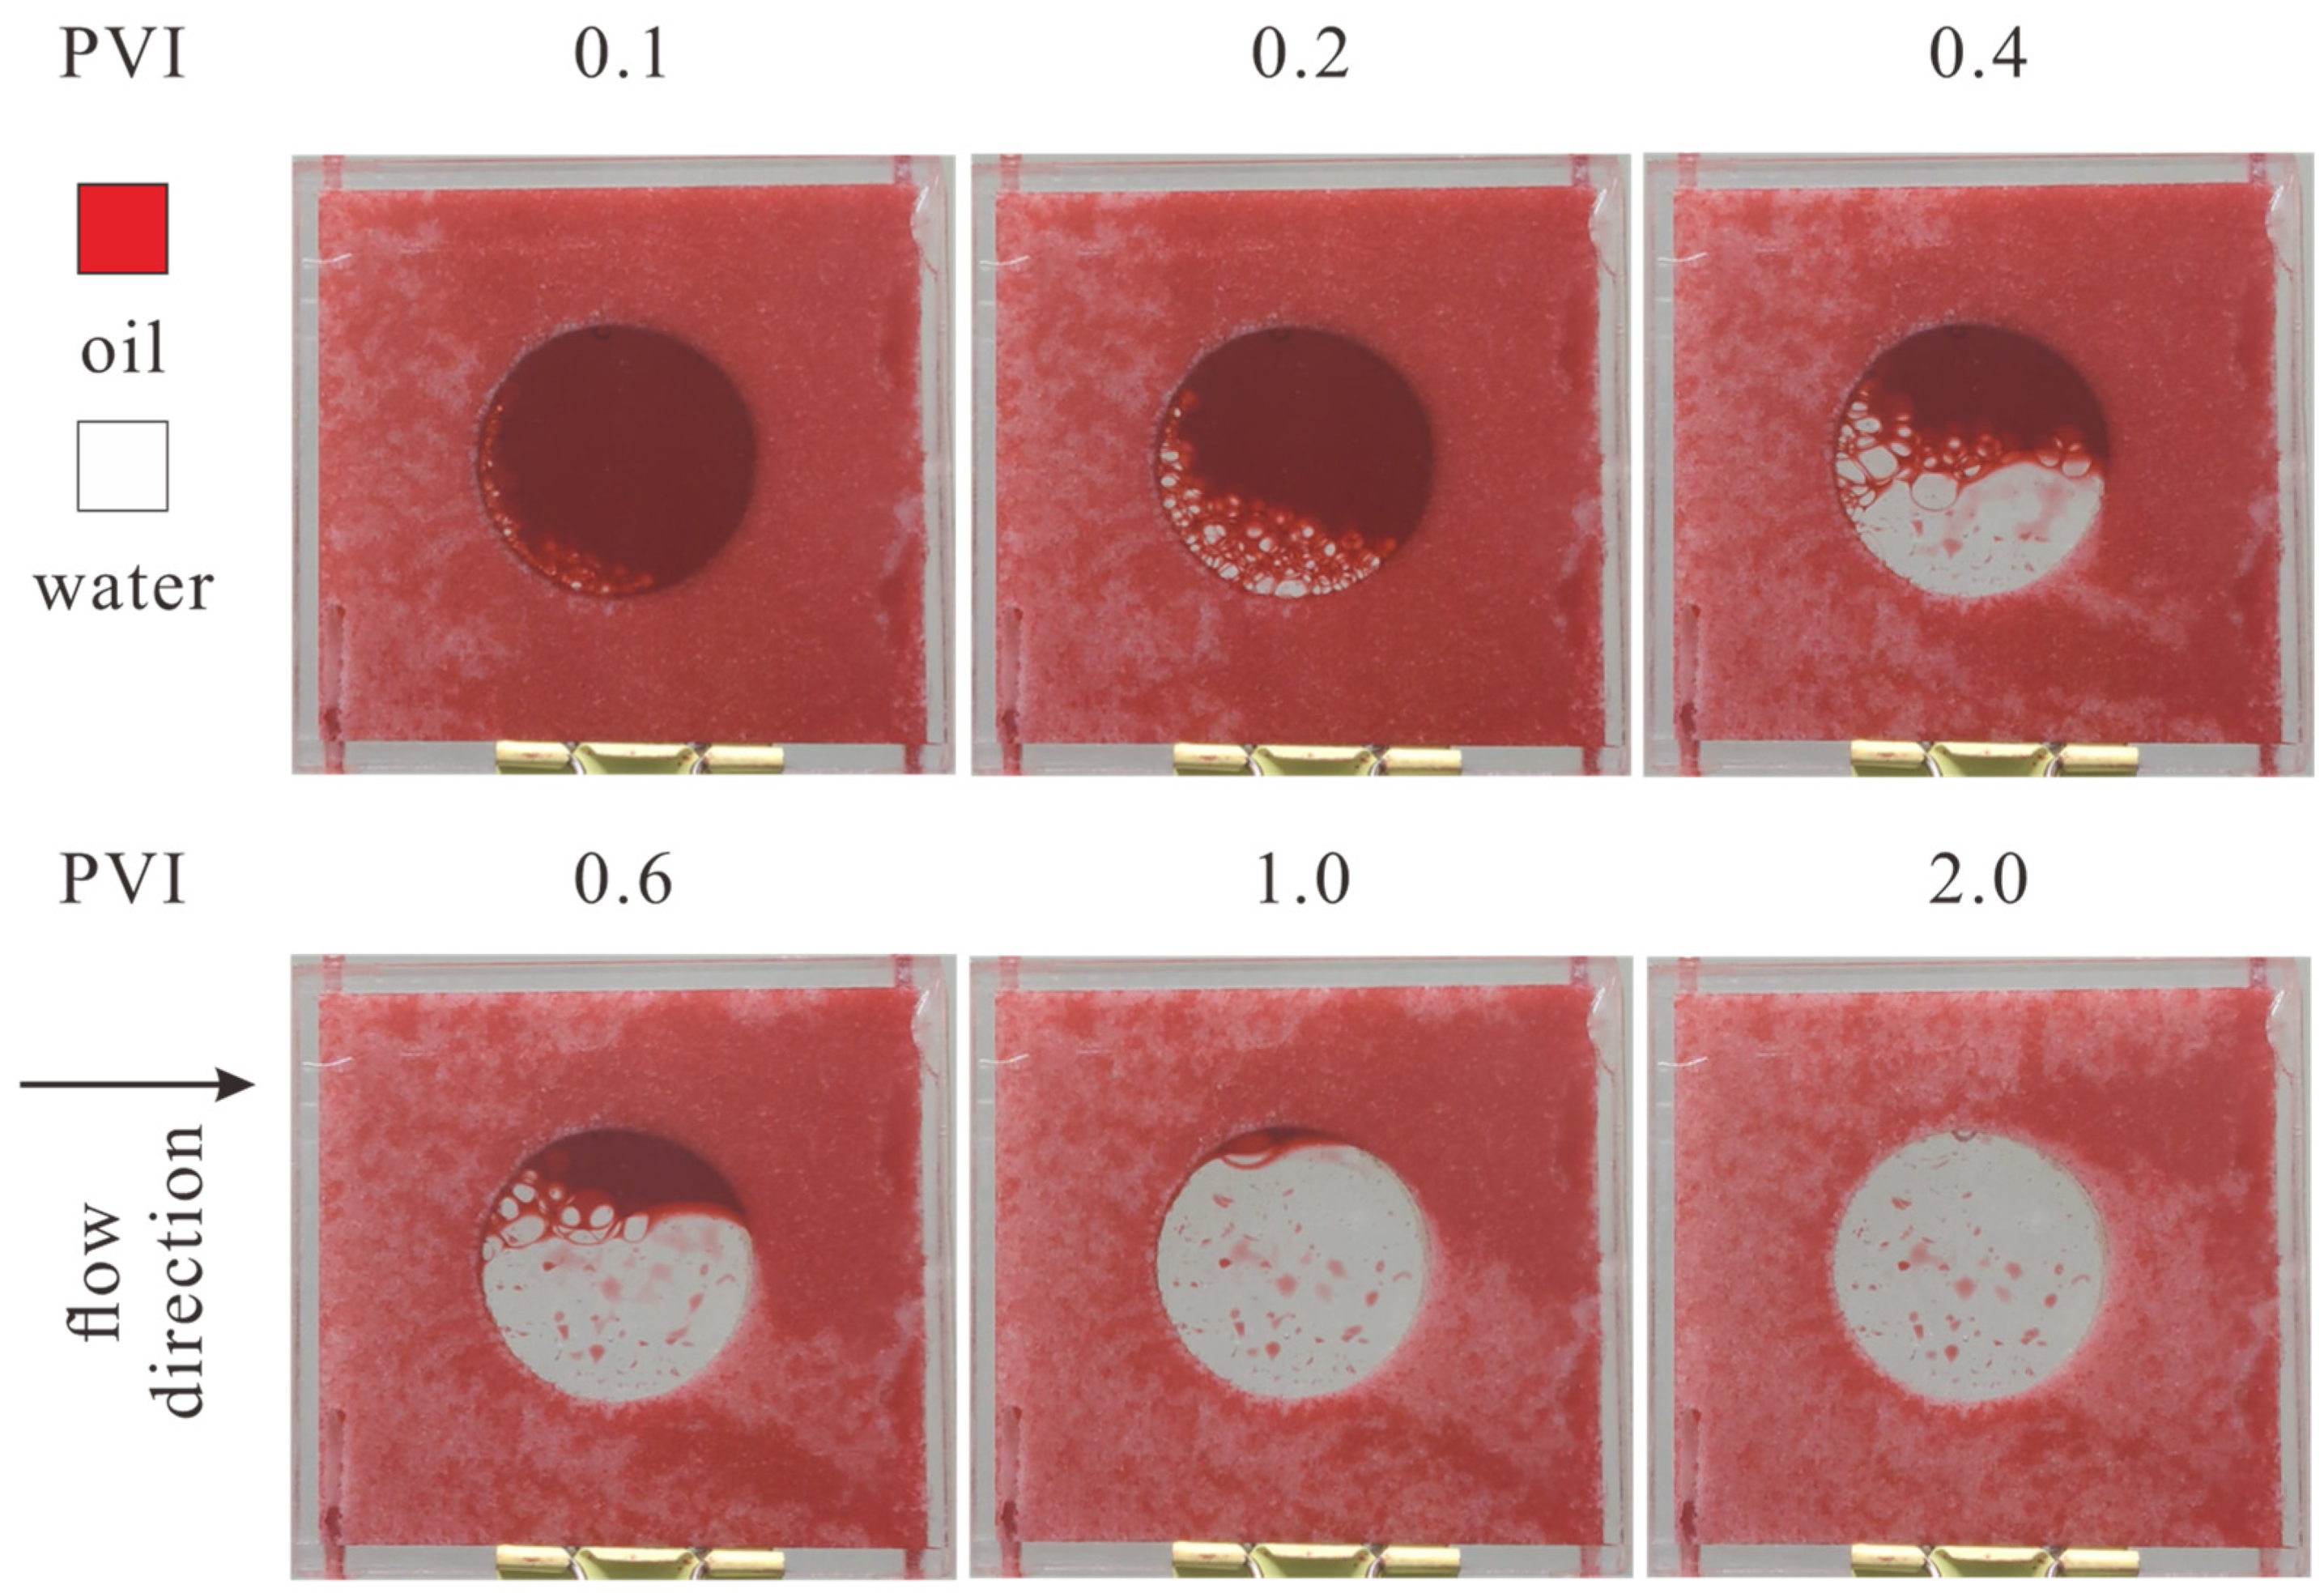
2.3.2. Case 2: Horizontal (θ = 0°)

The oil saturation distribution during the displacement experiment with θ = 0° is shown in Figure 7. Similar to Case 1, water enters the vug at 0.1 PVI. As water flows into the vug, it forms small water droplets. When the droplets gain enough volume, they slide down to the bottom of the vug due to density difference. The oil-water interface inside the vug is inclined at first, then eventually becomes horizontal. During this process, the interface gradually moves upwards instead of moving along the flow direction. Between a PVI of 0.2 and 0.35, the water is kept within the vug by the capillary force. However, water starts to flow out of the vug at a PVI of 0.35 when the water saturation in the vug is only slightly over 50%. The water breakthrough of the production well occurred at a PVI of 0.41. After the water breakthrough of the production well, the waterfront advances below the vug much faster than the waterfront above the vug, and a large amount of oil is left unswept at the top-right of the model. This is because water cannot flow upwards from the vug before it is completely saturated with water, but it is able to flow downwards. Meanwhile, the oil-water interface in the vug moves upwards at a much lower rate before the water breakthrough. Water completely saturates the vug at a PVI of 1.1, which is relatively later than in Case 1. Before this, the water cut of the production well stayed below 90%. The oil recovery ratio at PVI 1.0 is 69.9%, slightly lower than in Case 1.

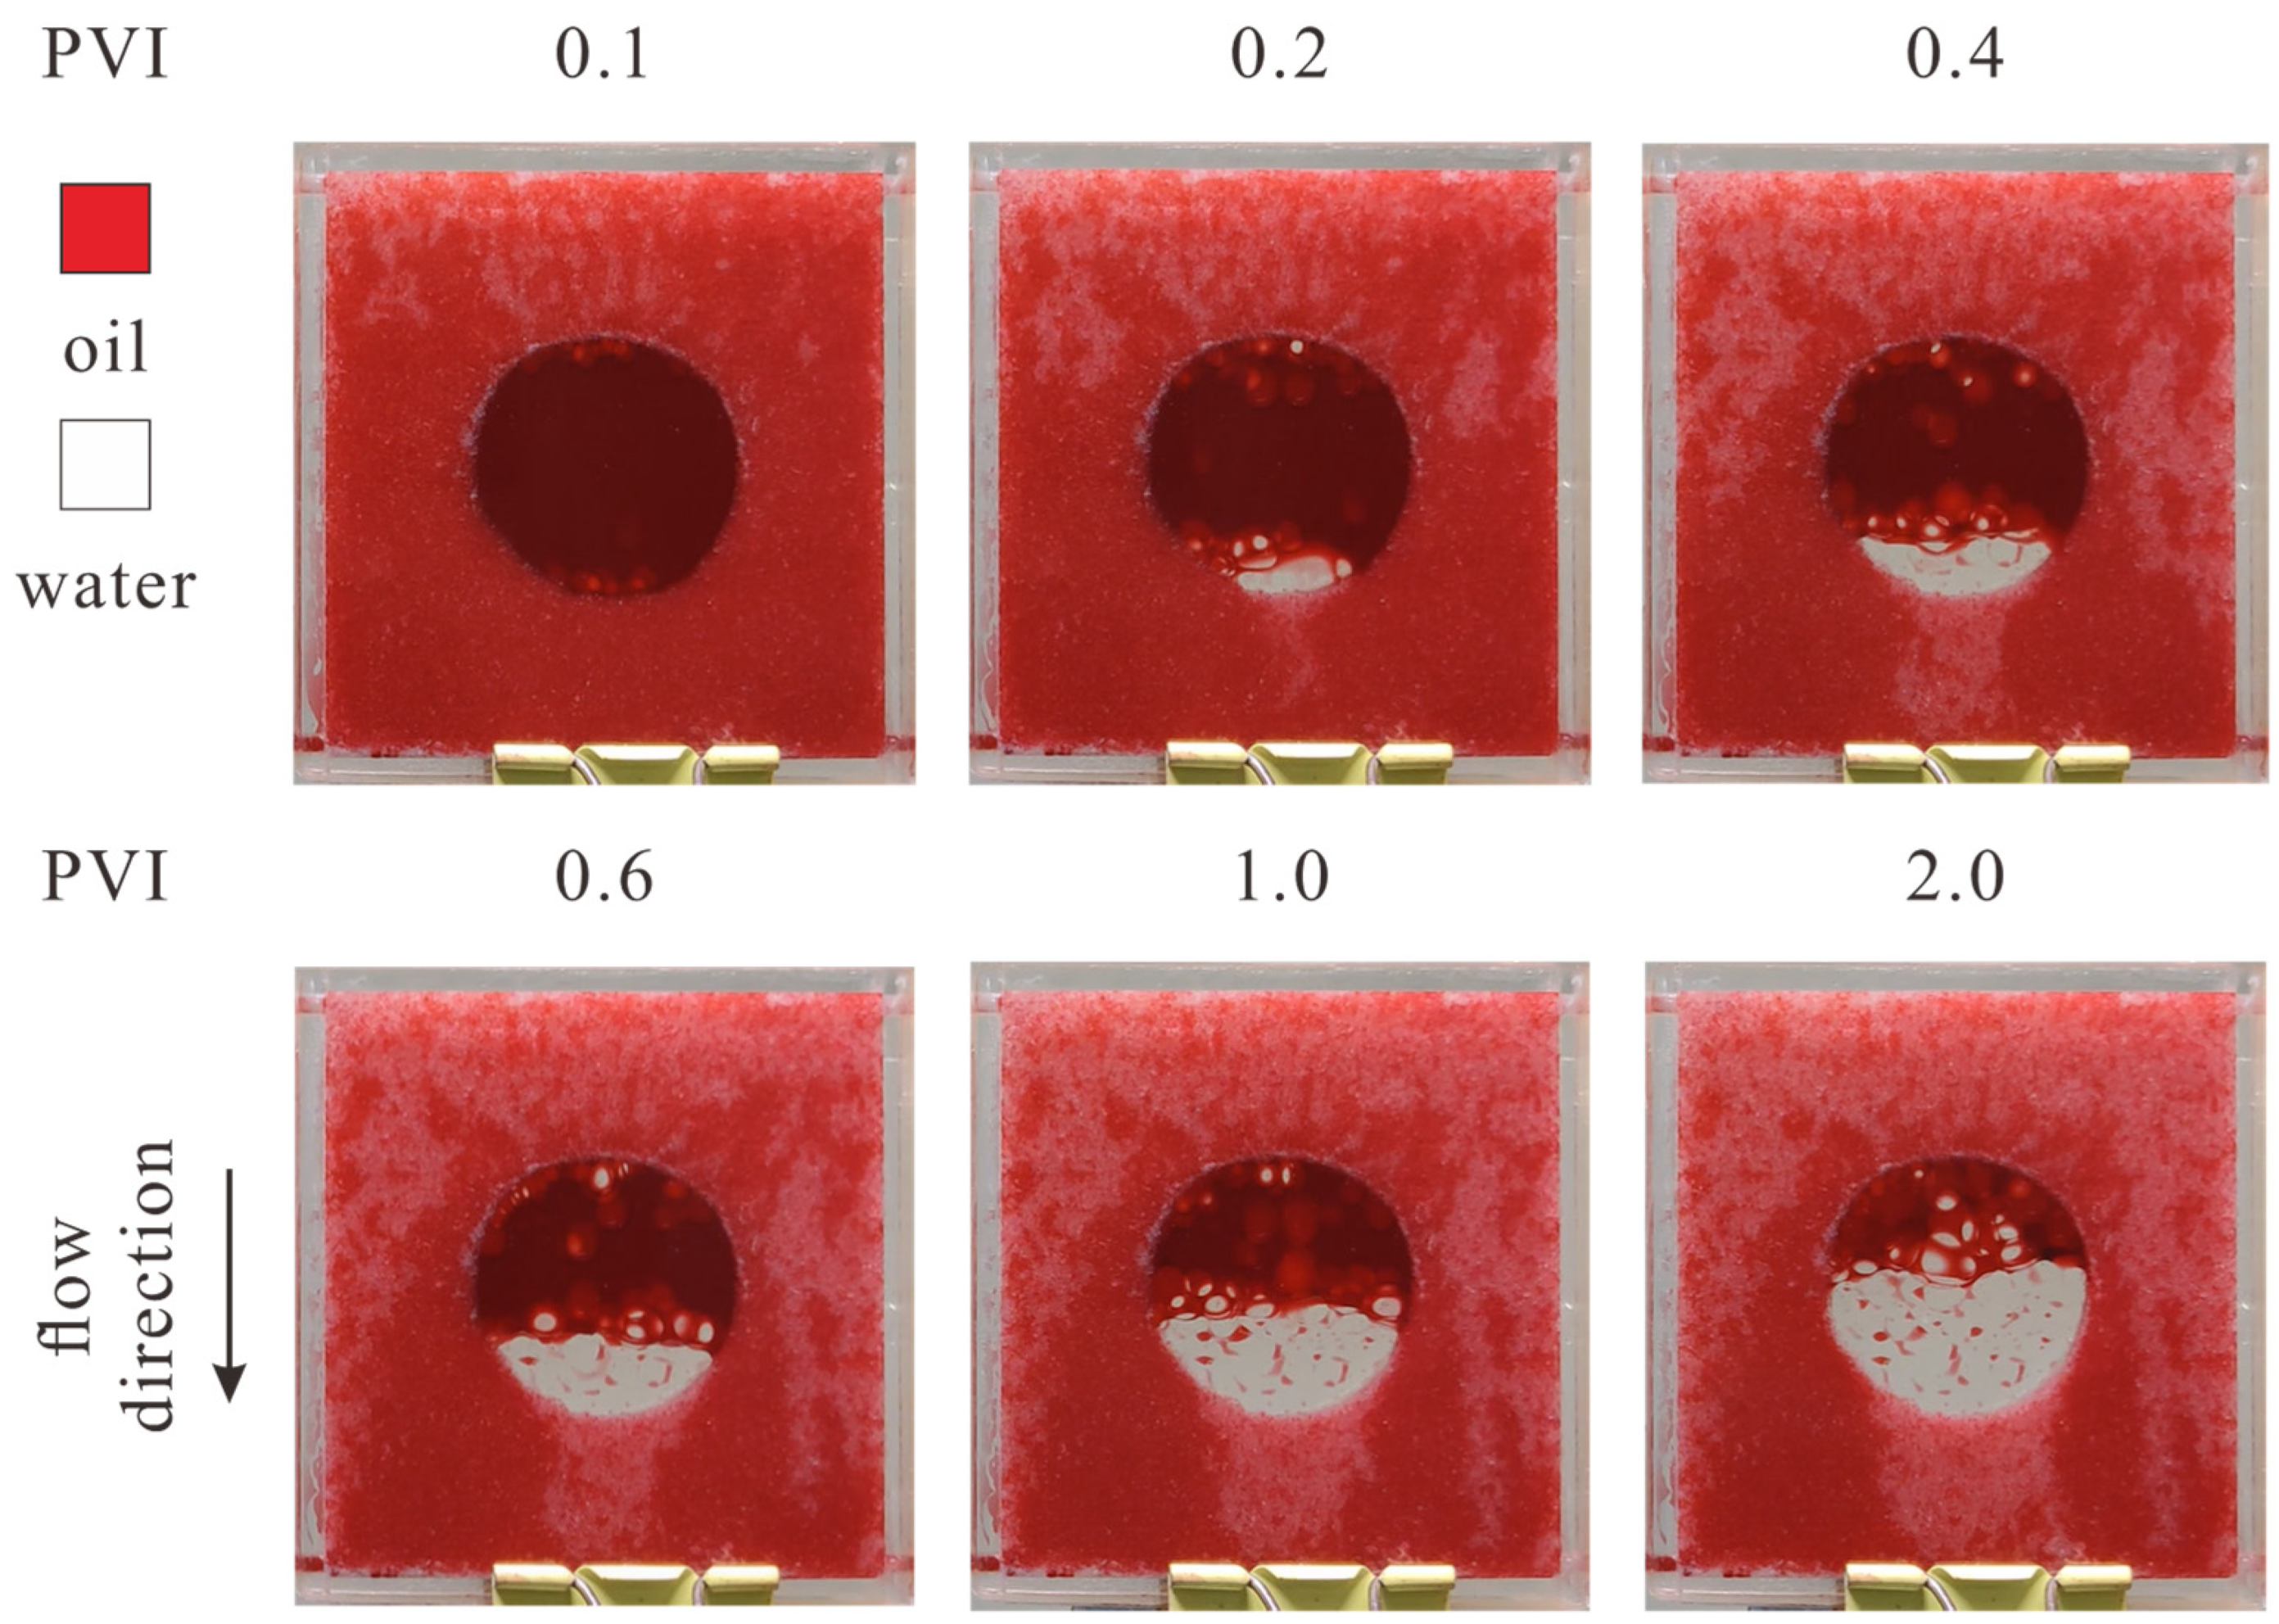
2.3.3. Case 3: Vertically Downwards (θ = −90°)

The oil saturation distribution during the displacement experiment with θ = −90° is shown in Figure 8. Shortly after, water forms droplets and enters the vug; they fall down to the bottom of the vug rapidly due to gravity. Water starts to flow out of the vug at a PVI of 0.17 when the water saturation in the vug is merely 20%. Water breakthrough of the production well is at a PVI of 0.25, significantly earlier than in both Cases 1 and 2. After the water breakthrough, as water continuously flows out of the vug from the bottom, the oil-water interface in the vug moves upwards at an extremely low rate. Oil can only flow out the vug from two sides, creating two oil-saturated zones at the left-bottom and right-bottom of the model, which serves as the main pathway for oil to flow out from the vug to the production well. Water completely saturates the vug at an extremely late PVI of 4.7, before which the water cut of the production well slowly increases from 80% to 90%, then fluctuates between 90% and 100%. The oil recovery ratio at PVI 1.0 is only 46.2%, far less than in Cases 1 and 2.

2.3.4. Discussion

As illustrated by the experimental results in the single-vug model, the dynamic of the two-phase displacement process in vugular porous medium for different flow directions is heavily affected by gravity segregation. The entire displacement process can be divided into four phases, as depicted in Figure 9. Phase 1 is the period before the water enters the vug. The displacement during phase 1 is controlled by the porous medium; therefore, the duration of phase 1 is almost identical for different flow directions. Phase 2 is the period between the water entering and starting to flow out of the vug. During phase 2, the main displacement process is the accumulation of water at the bottom of the vug. As shown by Figure 6, Figure 7 and Figure 8 this process is dominated by gravity segregation and the density difference between oil and water and is irrelevant to the macroscopic flow direction. However, the macroscopic flow direction controls the location where water is able to flow out of the vug. When the flow is vertically downward, water is able to flow out of the vug as soon as it slightly accumulates at the bottom of the vug. When the flow is vertically upwards, water is only able to flow out of the vug after it completely saturates the vug. This results in an obvious difference in the duration of phase 2 for different flow directions. Furthermore, since the water breakthrough of the production well occurs after phase 2, the water cut keeps near zero for the entire phase 2. Therefore, the duration of phase 2 is highly correlated with the oil recovery ratio, as shown in Figure 5a. Phase 3 is the period between water starting to flow out of the vug and complete filling of the vug. The duration of phase 3 is controlled by the initial amount of oil at the beginning of phase 3 and the oil flow rate out of the vug. The initial amount of oil increases with decreasing θ. Furthermore, when θ is less than 0°, the water at the bottom of the vug prevents oil from flowing out of the vug along the flow direction. Because of this, oil can only flow out from the vug horizontally, where the pressure gradient is extremely small. This results in a prolonged duration of phase 3 for θ < 0°, while for θ = 90° the duration of phase 3 is approximately 0. Phase 4 is the period between the water filling of the vug and the end of the experiment. In this phase, as water preferentially flows through the vug, the remaining oil in the porous medium form several zones with high oil saturation. Because of the unfavored mobility ratio, complete oil displacement from the porous medium is extremely slow, and the water cut stayed over 90% for phase 4. To summarize, the dynamic of water displacing oil in vugular porous medium and the oil recovery ratio is correlated with the macroscopic flow direction.

3. Numerical Scheme

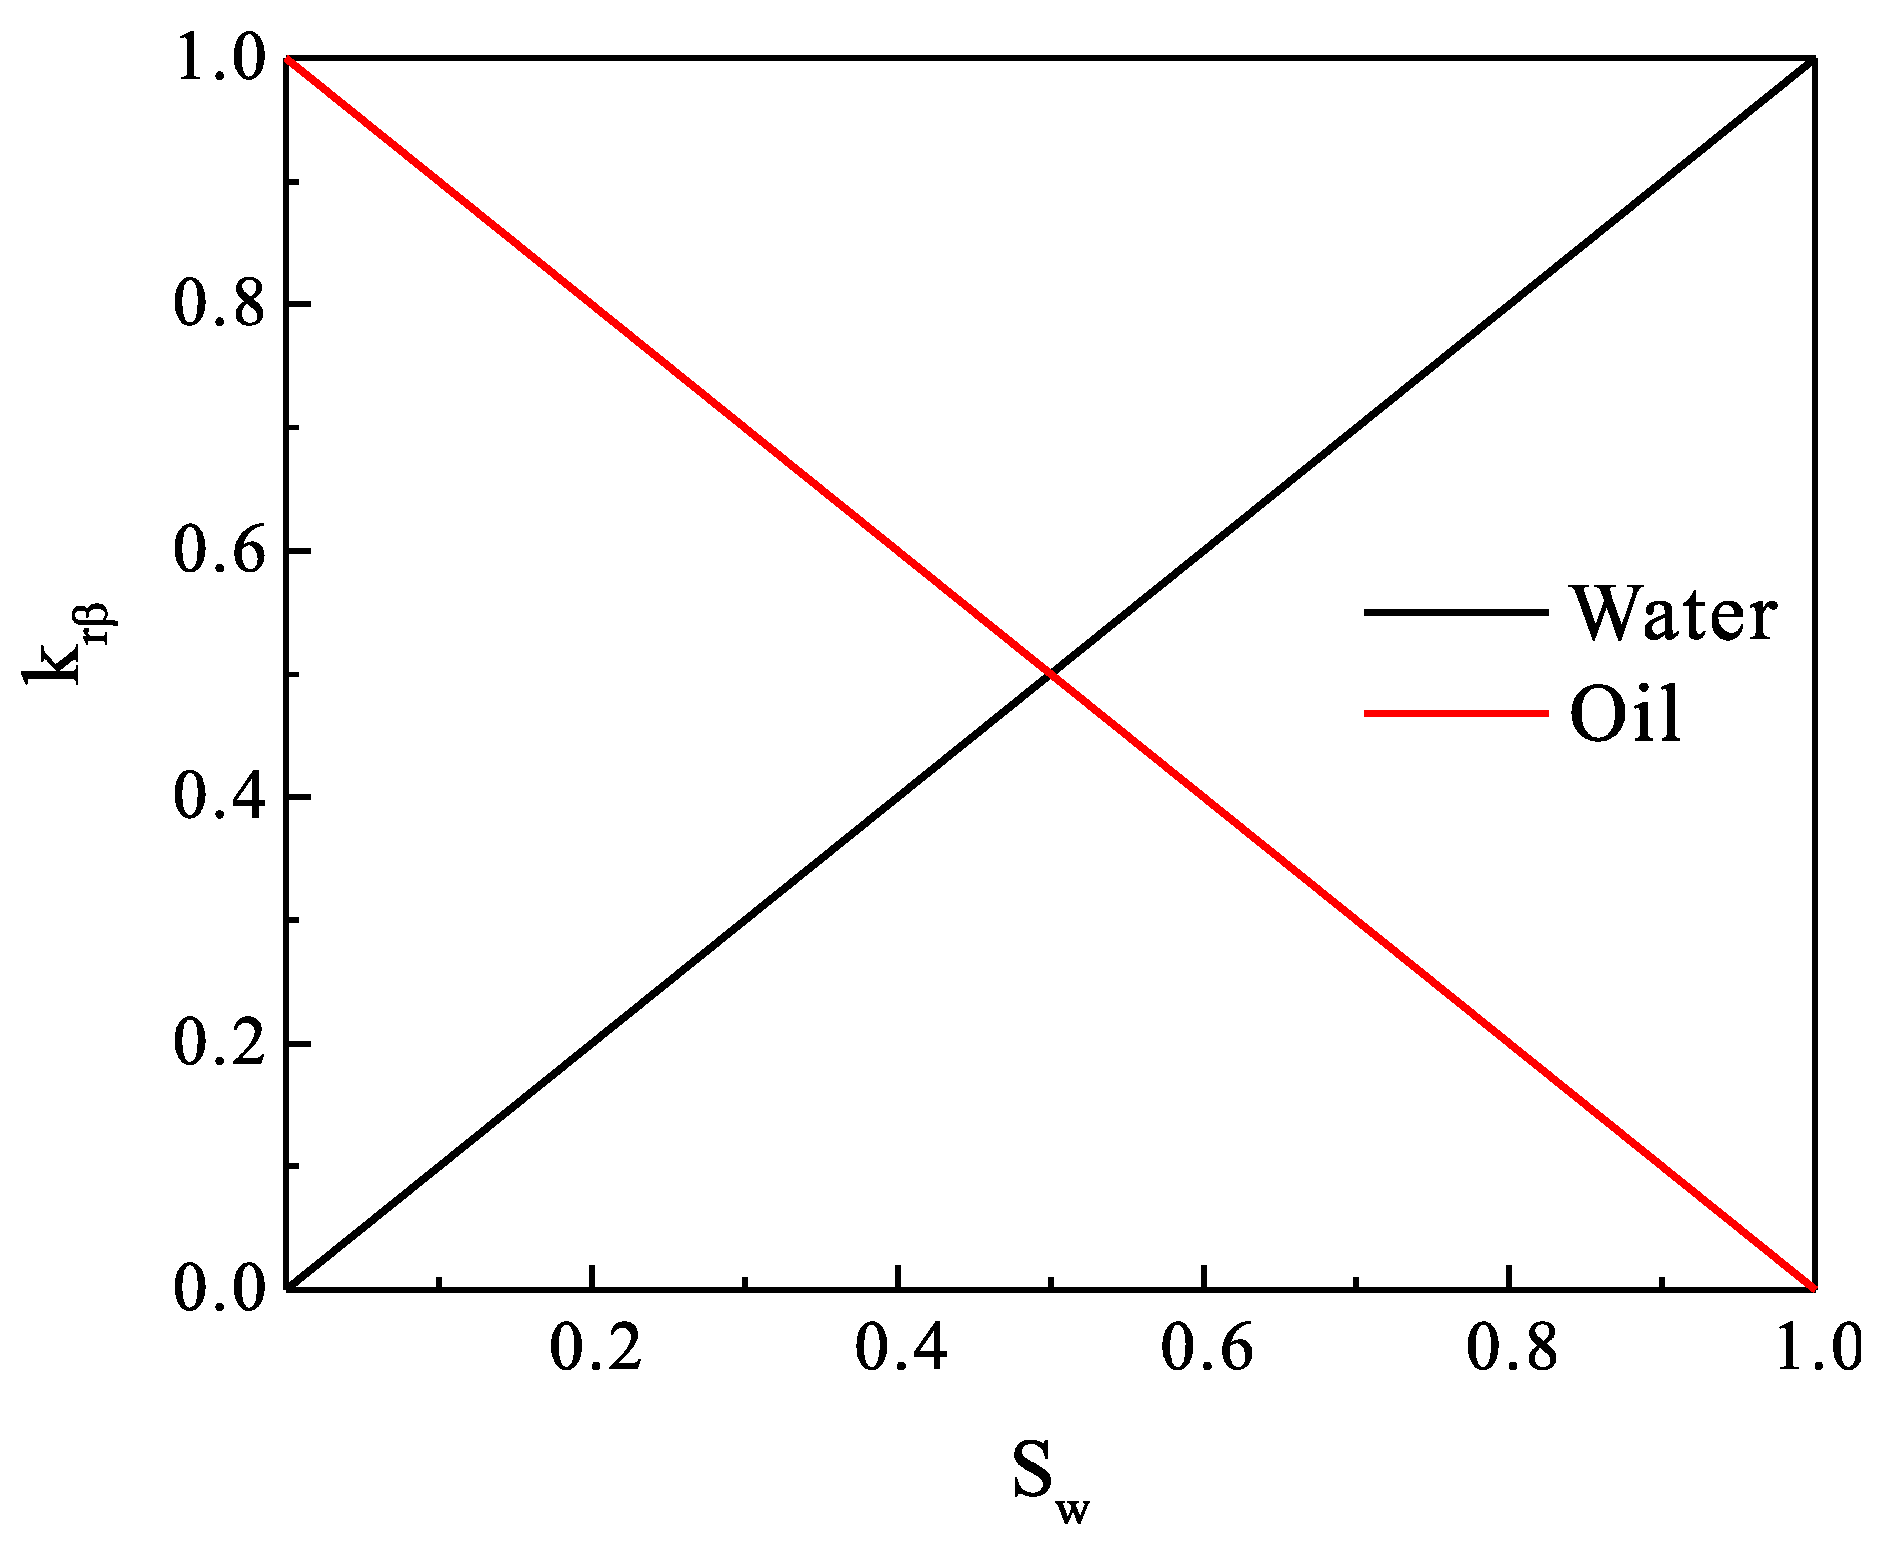
3.1. Mathematical Model

We use a pure Darcy-type solver as our numerical solver for two-phase flow in the single-vug model. Krotkiewski et al. [44] conducted single-phase upscaling for carbonate reservoirs. They compared the results obtained from a pure Darcy-type solver and a solver based on the Stokes-Brinkmann equation and found that the difference between the results of the two solvers is negligible if the permeability of the void space exceeds 104 times the permeability of the matrix. The above large permeability method is adopted and examined in this study, as the permeability of the vug can be estimated by K v = L y 2 / 12 = 8.3 × 10 6   m 2 , which is larger than 104 times the matrix permeability (about 2 × 10⁻¹¹ m2).
An isothermal system consisting of oil and water phase in a vugular porous medium is considered in this study. Both phases are considered immiscible to each other; therefore, mass balance equations for both phases are given by:
ϕ ( ρ β S β ) t = ( ρ β ν β ) + q β
where subscript β = o, w denotes the oil and water phase; ϕ is the porosity; ρ β is the density of phase β; S β is the saturation of phase β; t is the time; q β is the sink/source term of phase β per unit volume; ν β is the Darcy velocity of phase β, given by Darcy’s law:
ν β = K k r β μ β ψ β
where K is the absolute permeability, which we assume to be isotropic and homogeneous for porous medium; k r β is the relative permeability of phase β; μ β is the viscosity of phase β; ψ β is the flow potential of phase β, given by:
ψ β = P β ρ β g D
where P β is the pressure of phase β, g is the gravitational acceleration, and D is the depth.
The mass balance Equation (1) needs to be supplemented by the following constitutive relationships:
S o + S w = 1
P c o w ( S w ) = P o P w
where P c o w is the capillary pressure between the oil and water phases.
The mass balance Equation (1) is discretized in space via the finite volume method and discretized in time via a backward, first-order, finite difference method. The relative permeability term in Equation (2) is dealt with a first-order upwind scheme. The discretized mass balance equation is then solved by the Newton-Raphson iteration method fully implicitly. For the details of the finite volume method and Newton-Raphson iteration method, the readers are referred to references [15,26].

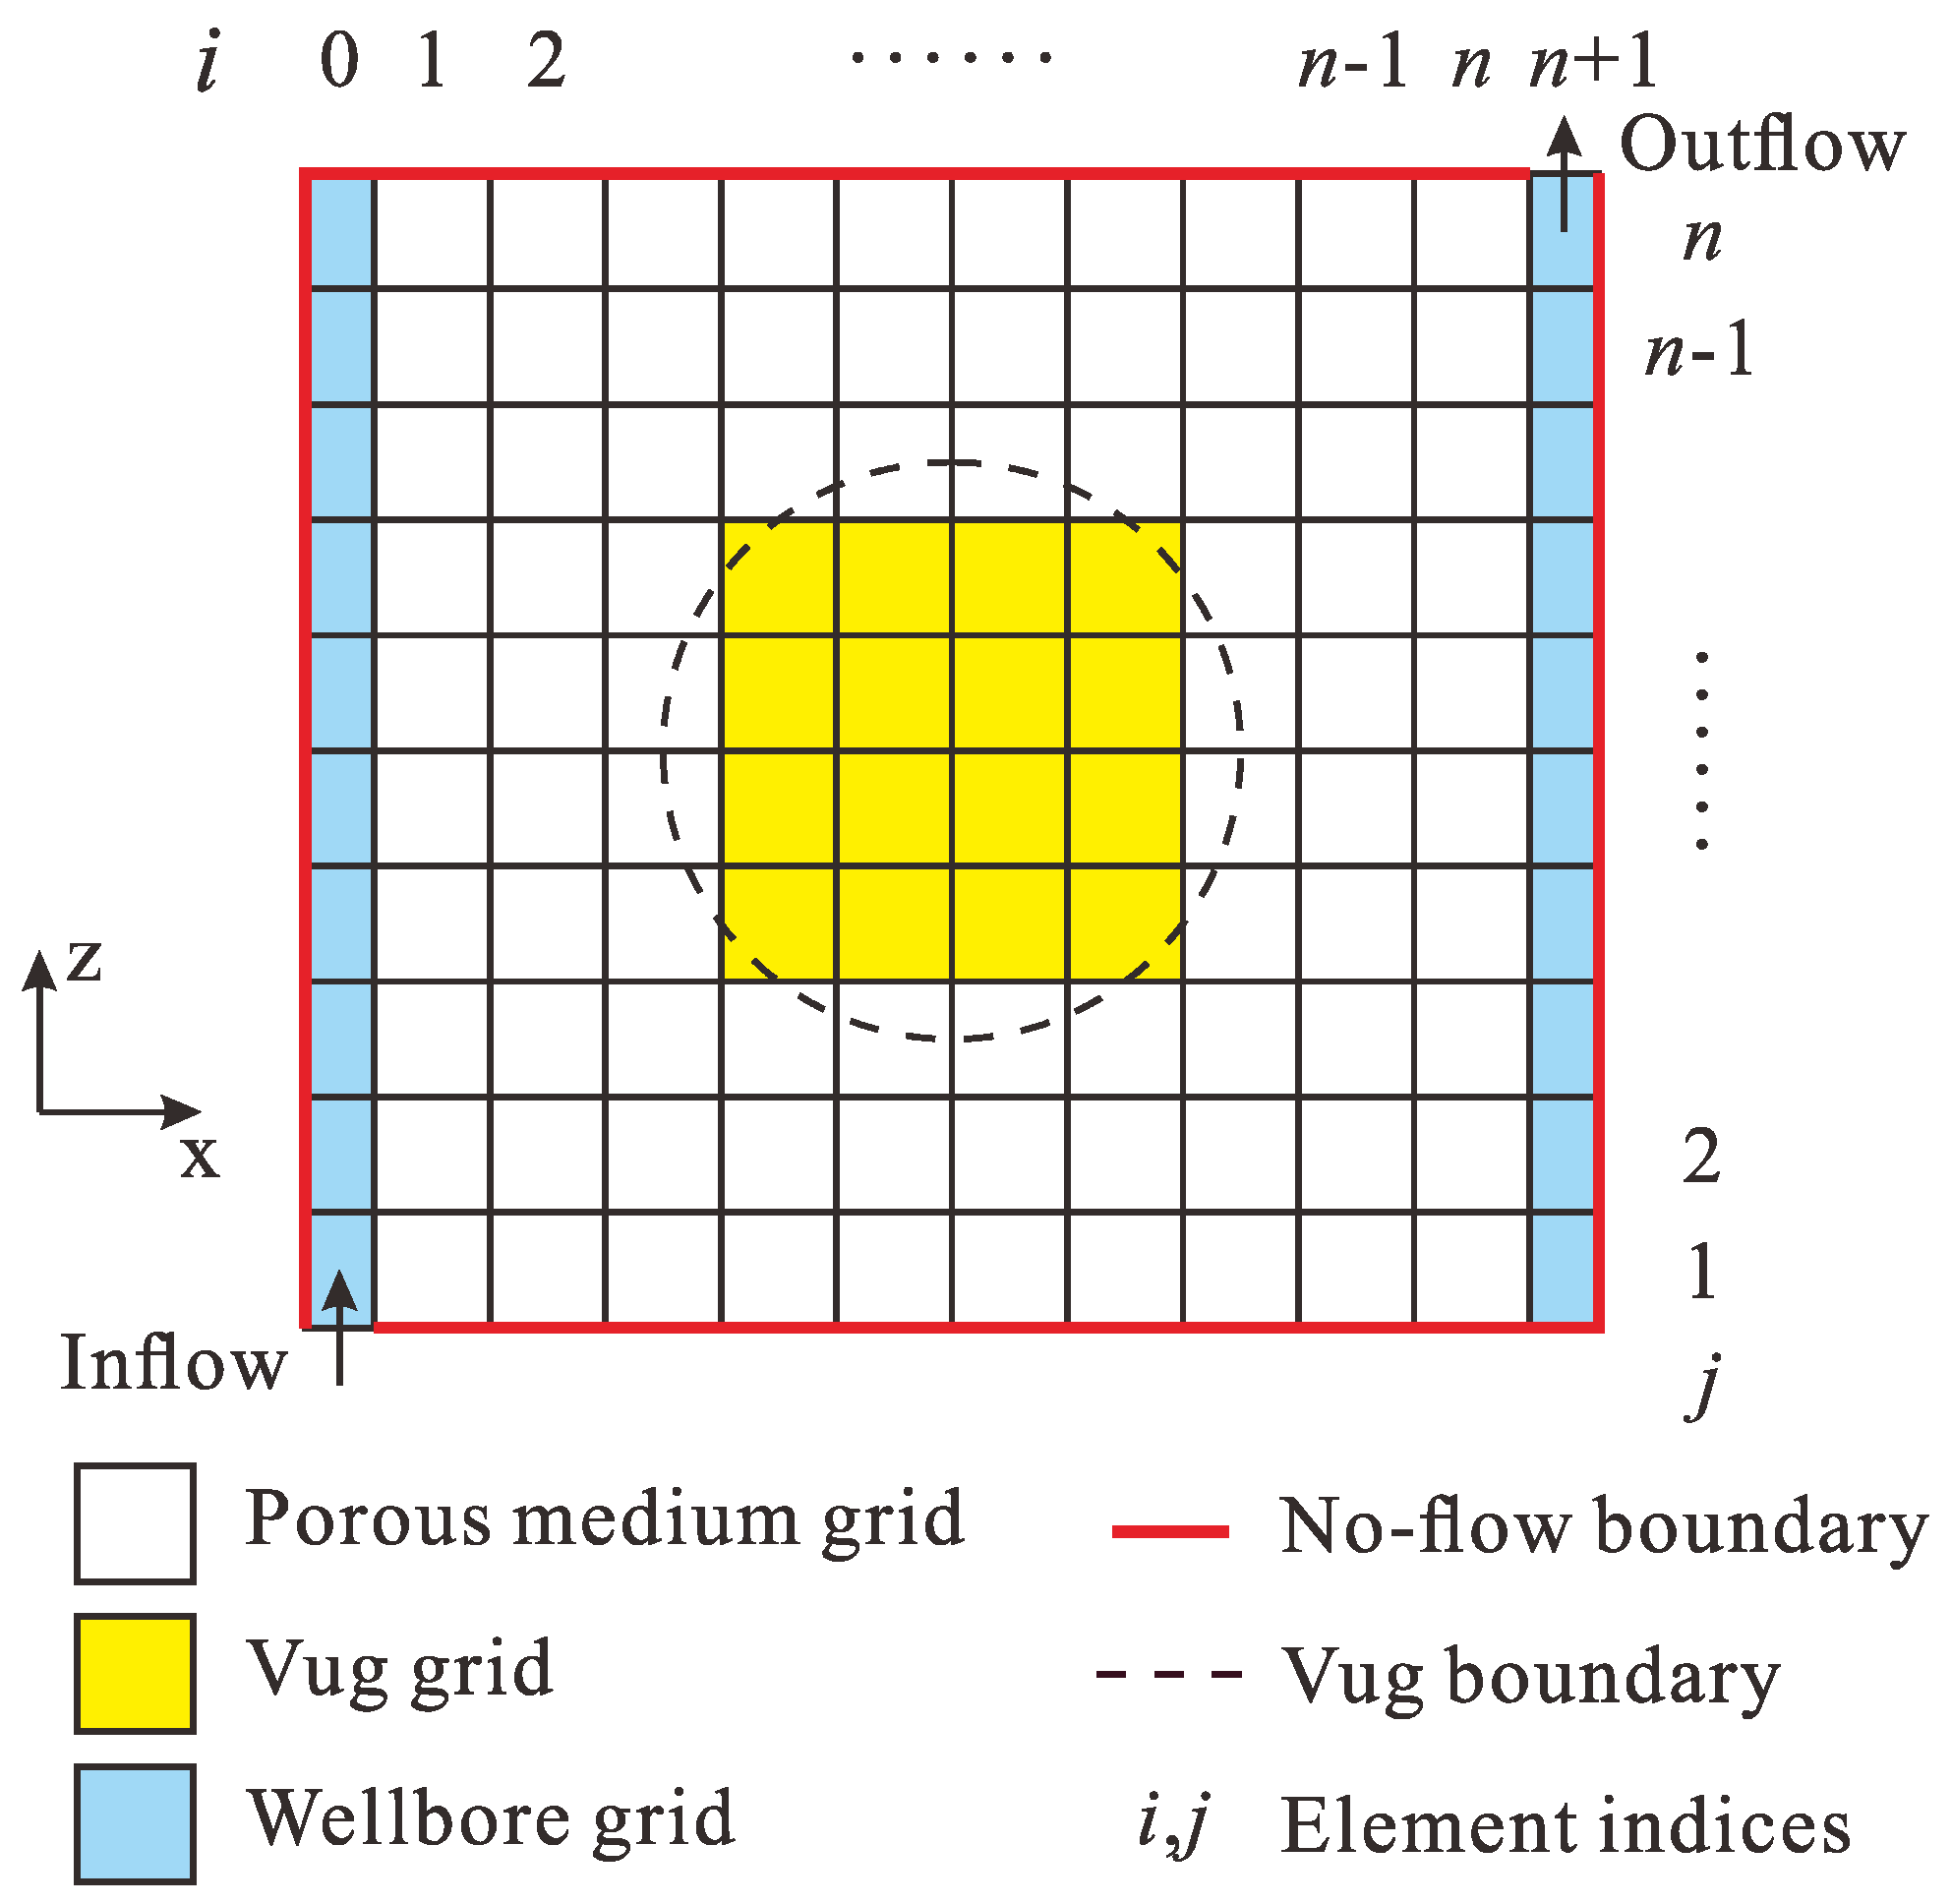
3.2. Model Discretization

The flow domain of the single-vug model is discretized as n × n structural grids, as shown in Figure 10, where n denotes the number of grids on each side of the model. Each grid has a size of 10/n × 1 × 10/n (in centimeters) and is indexed by subscript i and j. For each grid, if the distance between its center and the center of the model is less than the vug radius, the grid is labeled as a vug grid. The vug grids have a permeability of 104 times the permeability of the porous medium and have a porosity of 1.0. These vug grids also have zero capillary pressure, straight line relative permeability, as shown in Figure 11, and zero residual oil, as well as irreducible water saturation. In addition, the two wellbores are also discretized as n × 1 grids, which have parameters identical to the vug grids. Fluid is injected from the bottom of the injection wellbore and is produced from the top of the production wellbore. The other boundaries within the model are all set as no-flow boundaries. Figure 10 shows the case where the flow direction in the model is horizontal. The model can be rotated in the x-z plane by any degree of θ, where −90° ≤ θ ≤ 90°.

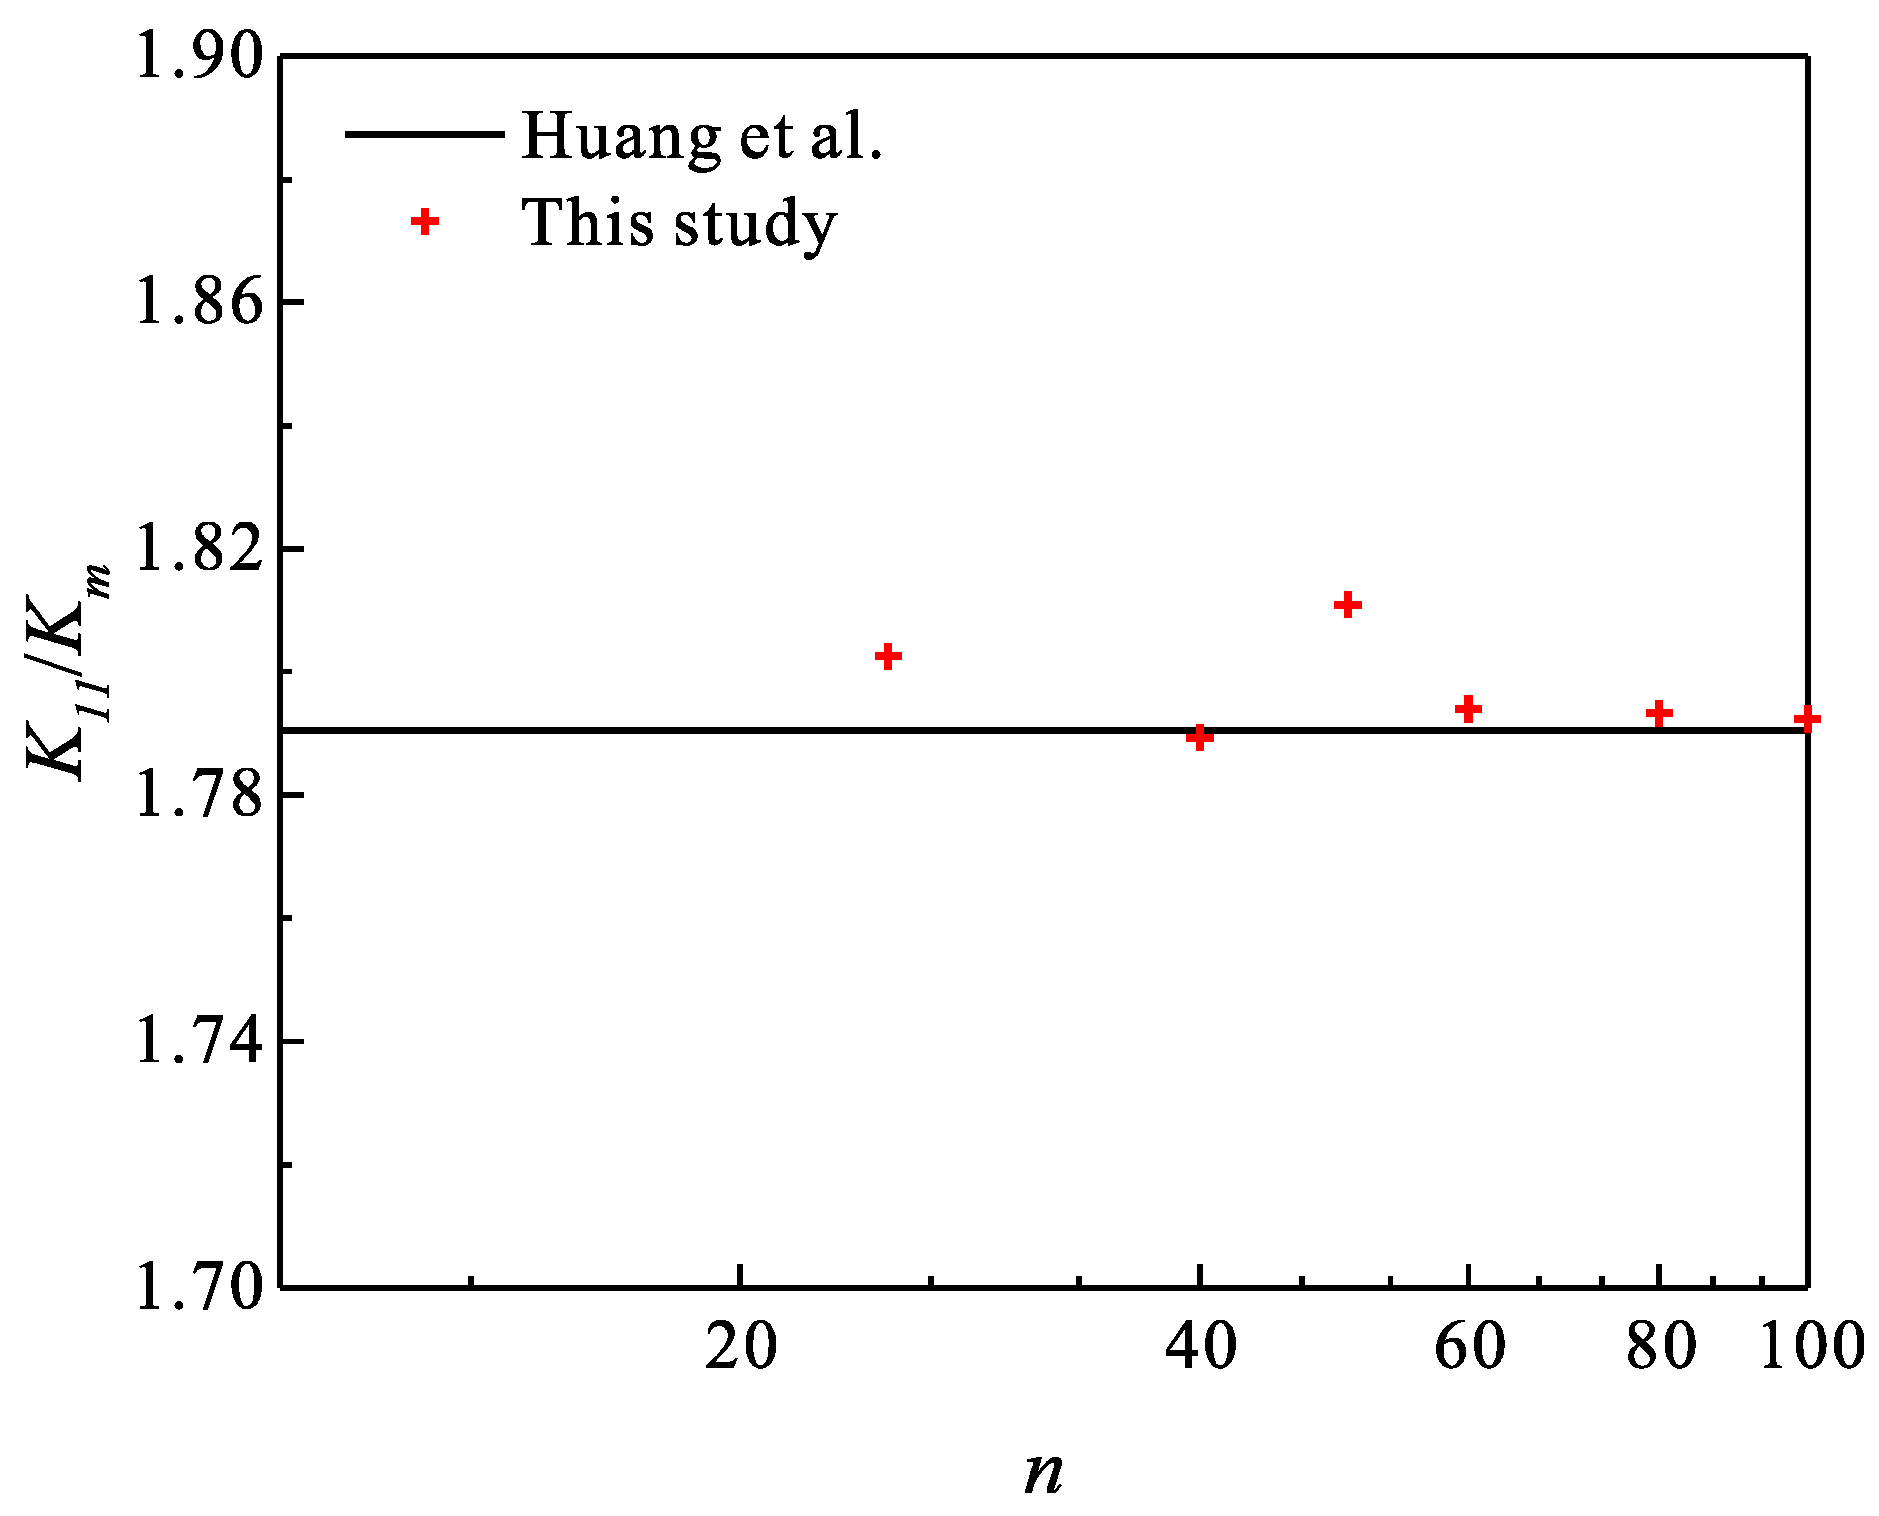
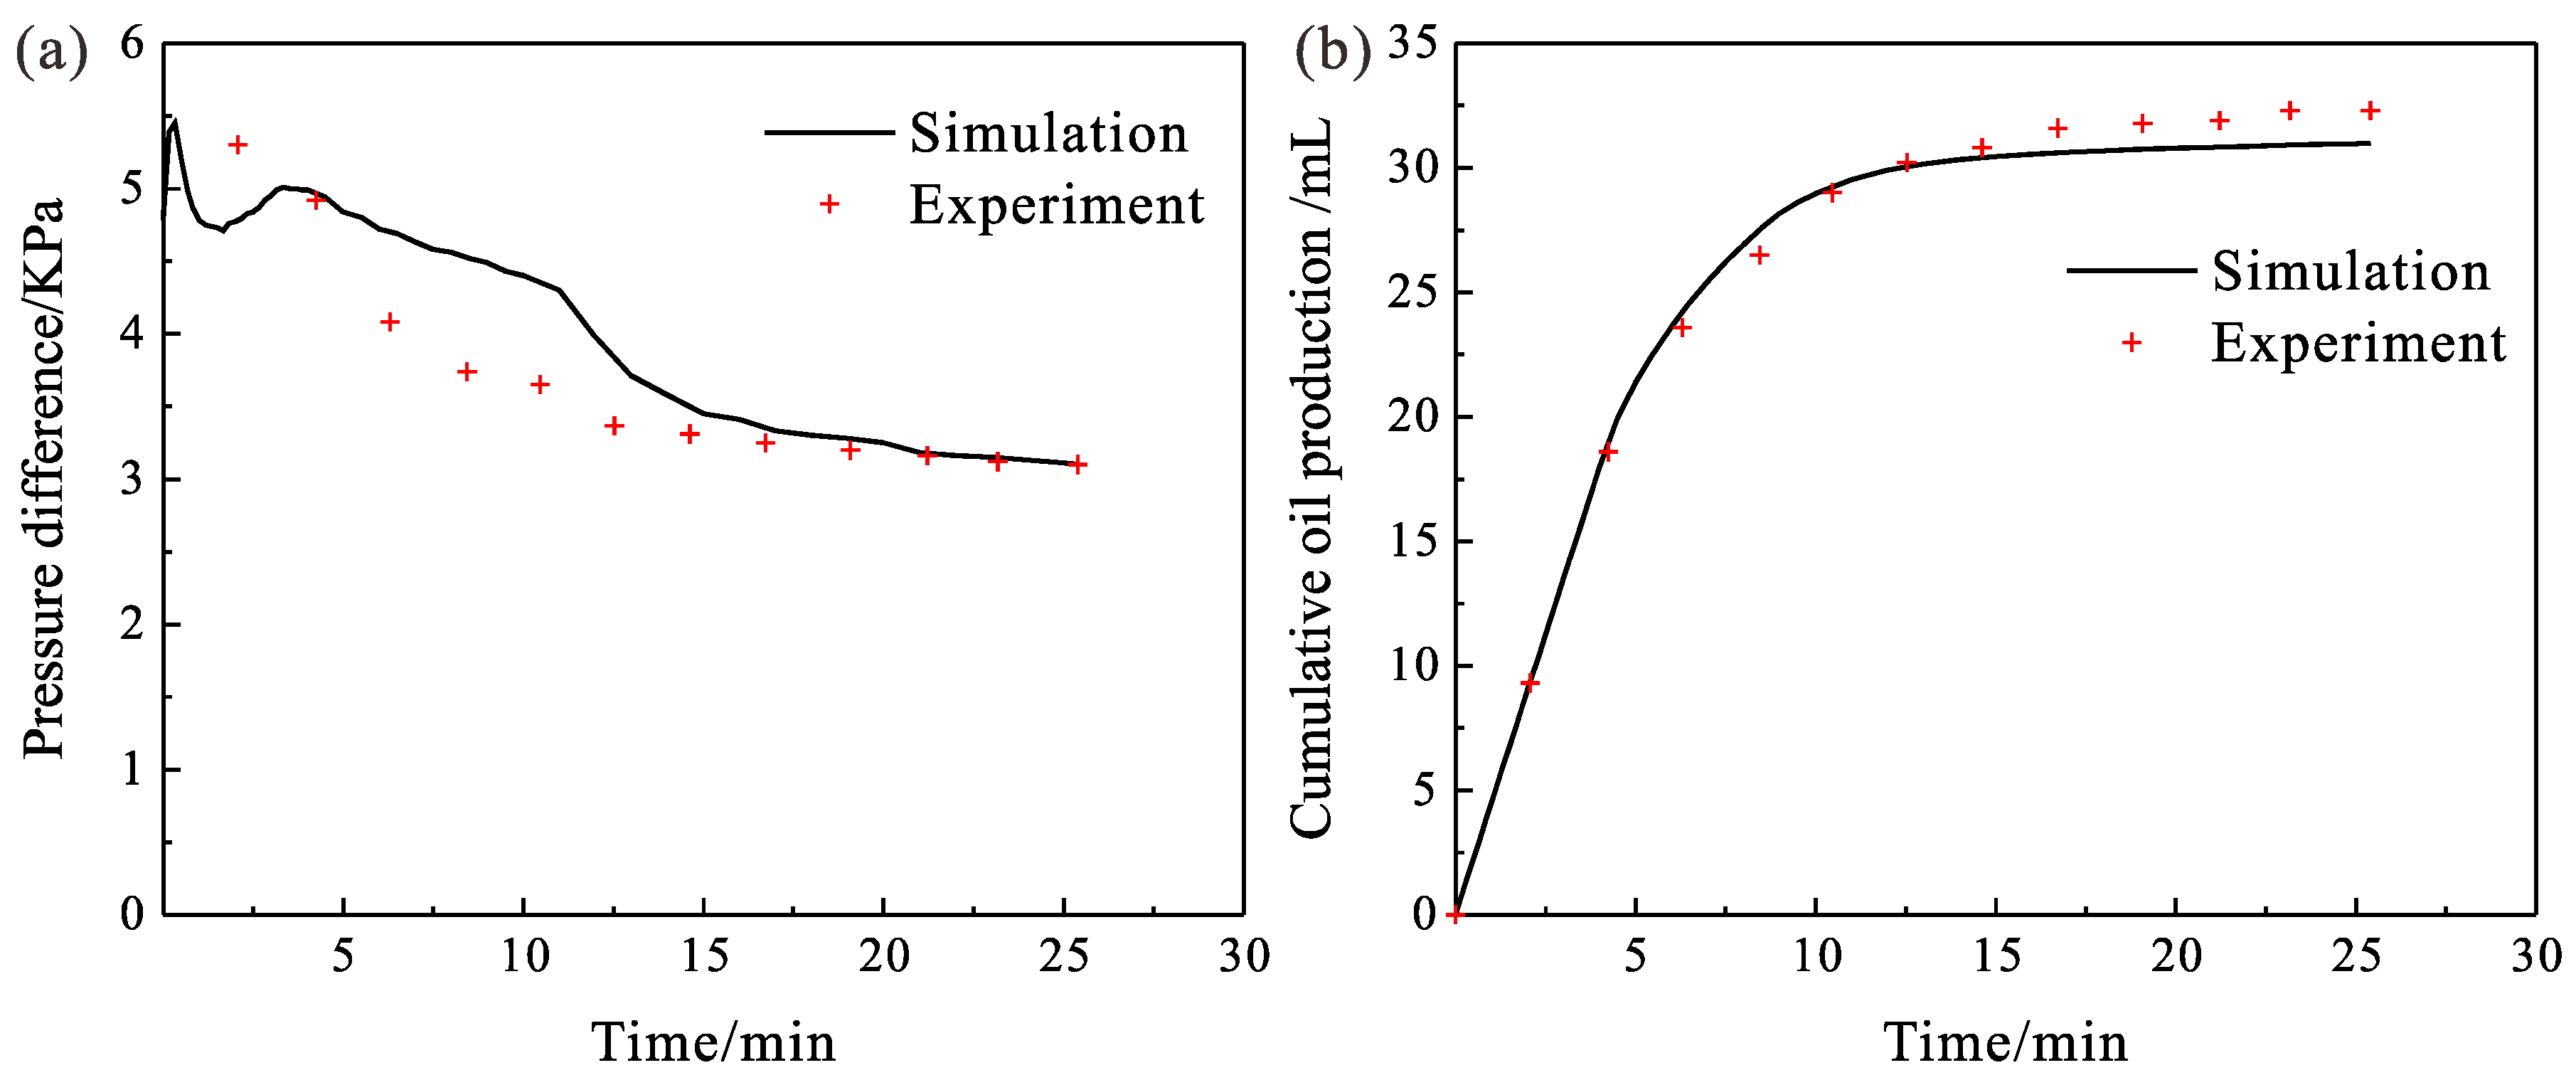
3.3. Model Validation

In this section, we provide two numerical examples to validate the numerical method and the discretization scheme. The first numerical example is single-phase flow in a single-vug model in the x-y plane where the vug diameter is 6 cm instead of 5 cm. Huang et al. [30] performed upscaling for this particular single-vug model and obtained the upscaled permeability tensor. The upscaled permeability tensor is diagonal due to the symmetric nature of the model and has K 11 = K 22 = 1.7904 K m , where K m is the permeability of the porous medium. We simulated steady-state single-phase fluid flow in this model, neglecting gravity, and set n to be 25, 40, 50, 60, 80, and 100, respectively. The porous medium has a permeability of K m = 10 m D . Oil is injected at a constant rate and is produced at constant pressure. After the steady state is established, the upscaled permeability is calculated by using Darcy’s law. The upscaled permeability calculated by our numerical simulation method is given in Figure 12. It is shown that our simulation gives a relatively accurate estimation of upscaled permeability and thus examines its validity. The difference between our result and the result in reference might be attributed to the fact that the smooth vug boundary cannot be precisely represented by our discretization scheme. This is partially compensated by using a sufficiently large n. However, using a larger n would also result in more computation time. To compromise between these two effects, we choose n = 50 in the remainder of this study.
The second numerical example is the simulation of the displacement experiment of Case 2 in Section 2.3.2 (θ = 0°). The following Corey-Brooks type model is adopted for the capillary pressure and relative permeability of the porous medium:
P c o w = P D ( S o S o r 1 S o r ) 1 λ d
k r o = k r o ( S w i ) ( 1 S w * ) 2 [ 1 ( S w * ) 1 + 2 λ ]
k r w = k r w ( S o r ) ( S w * ) 3 + 2 λ
S w * = S w S w i 1 S o r S w i
where P D is the pore entry pressure; S o r is the residual oil saturation; λ d is equal to 1.6; S w i is the irreducible water saturation; S w * is the dimensionless water saturation; λ is a shape factor between 2.0 and 4.0. The boundary and initial conditions are set identically to the conditions in the physical experiment. The fitted parameters are given in Table 1. The volume of cumulative produced oil and the pressure drop between two wells obtained in physical experiment and numerical simulation are given in Figure 13. The oil saturation distribution during displacement is shown in Figure 14.
A dimensional analysis of gravity force, viscous force, and capillary force during the experiment can be taken briefly. We adopt the following two dimensionless numbers, gravity number Gr and capillary number Ca, derived by Zhou et al. [45]:
G r = g r a v i t y   f o r c e v i s c o u s   f o r c e = Δ ρ g K z ¯ L x L y Q μ o
C a = c a p i l l a r y   f o r c e v i s c o u s   f o r c e = P c * K z ¯ L x L y Q μ o L z
where Δ ρ is the density difference between two phases; K z ¯ is the average permeability in the vertical direction, which is set equal to the permeability of the porous medium; Q is the volumetric flow rate; μ o is the oil phase viscosity; L x , L y and L z are the length of the model in respective directions, as shown in Figure 2. P c * in Equation (11) is given by:
P c * = S w i 1 S o r P c ( S w ) d S 1 S o r S w i
Substituting the parameters in Table 1 into Equations (10) and (11) yields Gr = 0.03 and Ca = 0.42. It means that the viscous force in the porous medium region of the model is the dominating force, which is over two times the magnitude of the capillary force. In the meantime, the effect of gravity force can be neglected in the porous medium region. Therefore, the characteristic of two-phase flow and fluid distribution with different displacement directions can be attributed to the gravity segregation in the vug.

4. Directional Dependent Relative Permeability

To study the relative permeability of the vugular porous medium, the two-phase displacement process in the single-vug model is simulated by the numerical scheme in Section 3. Adopting the flow-based upscaling approach [46,47,48], the relative permeability curves for different flow directions are calculated, and a directional relative permeability model is proposed.

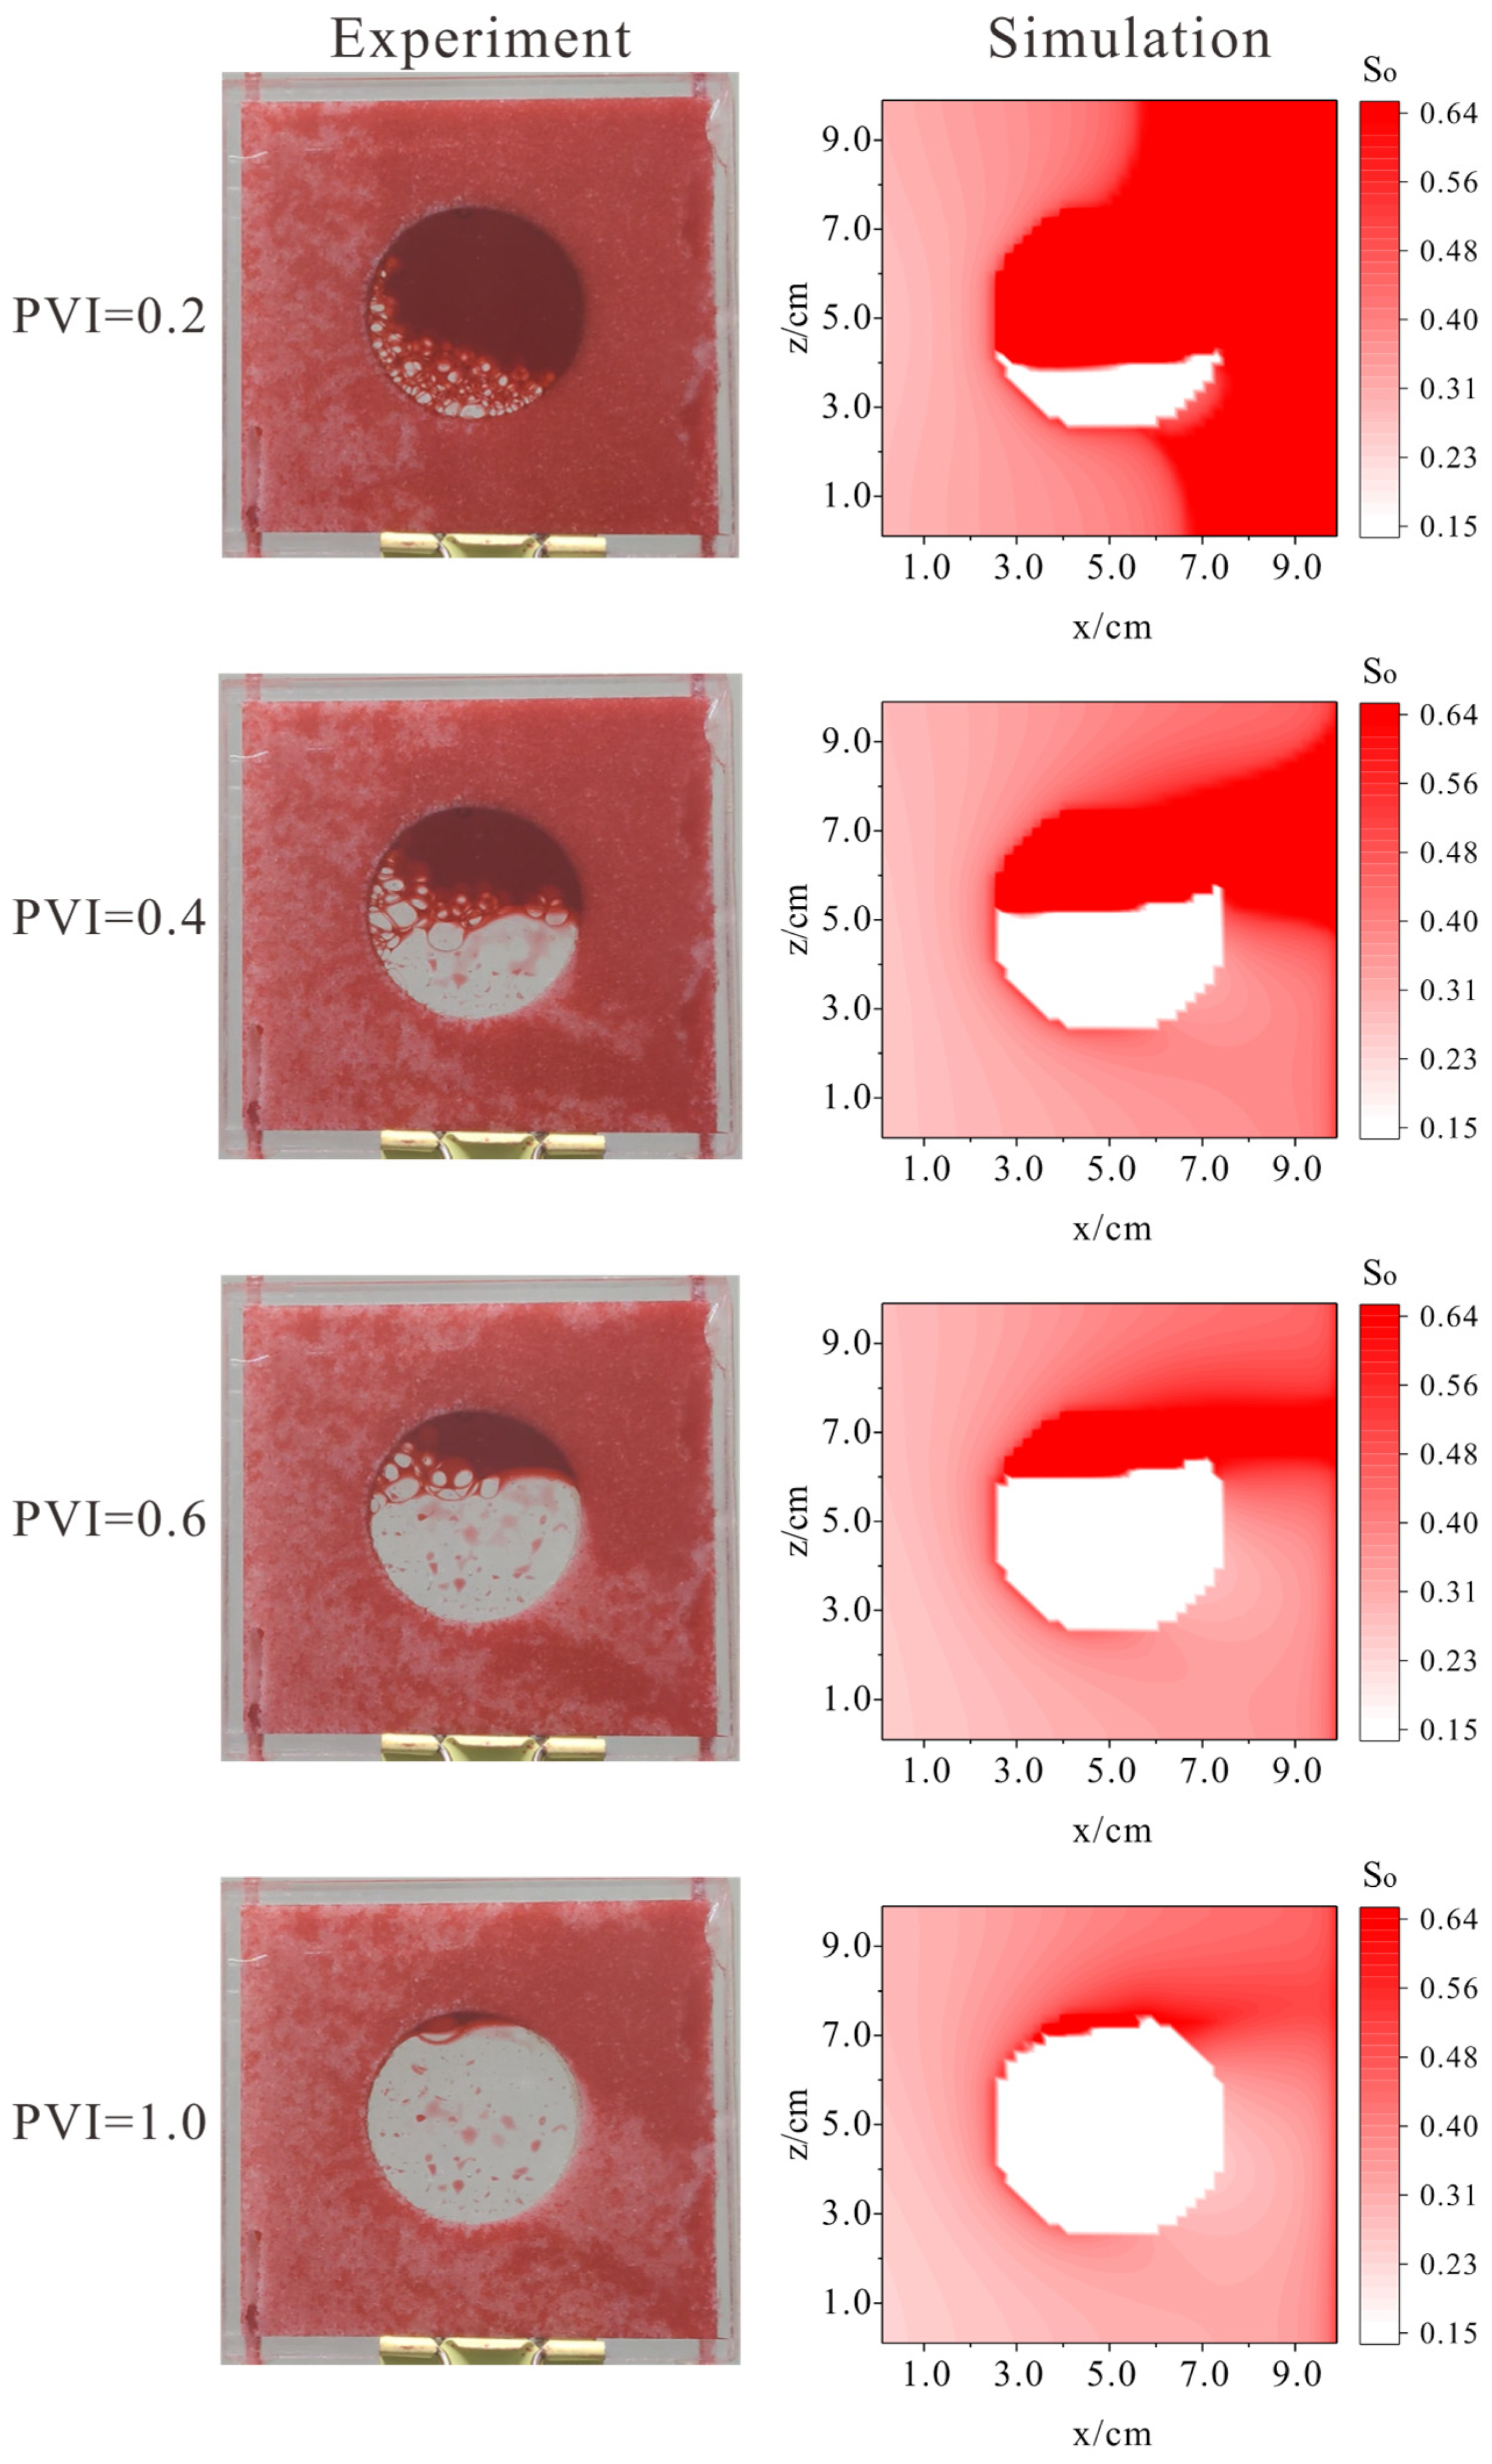
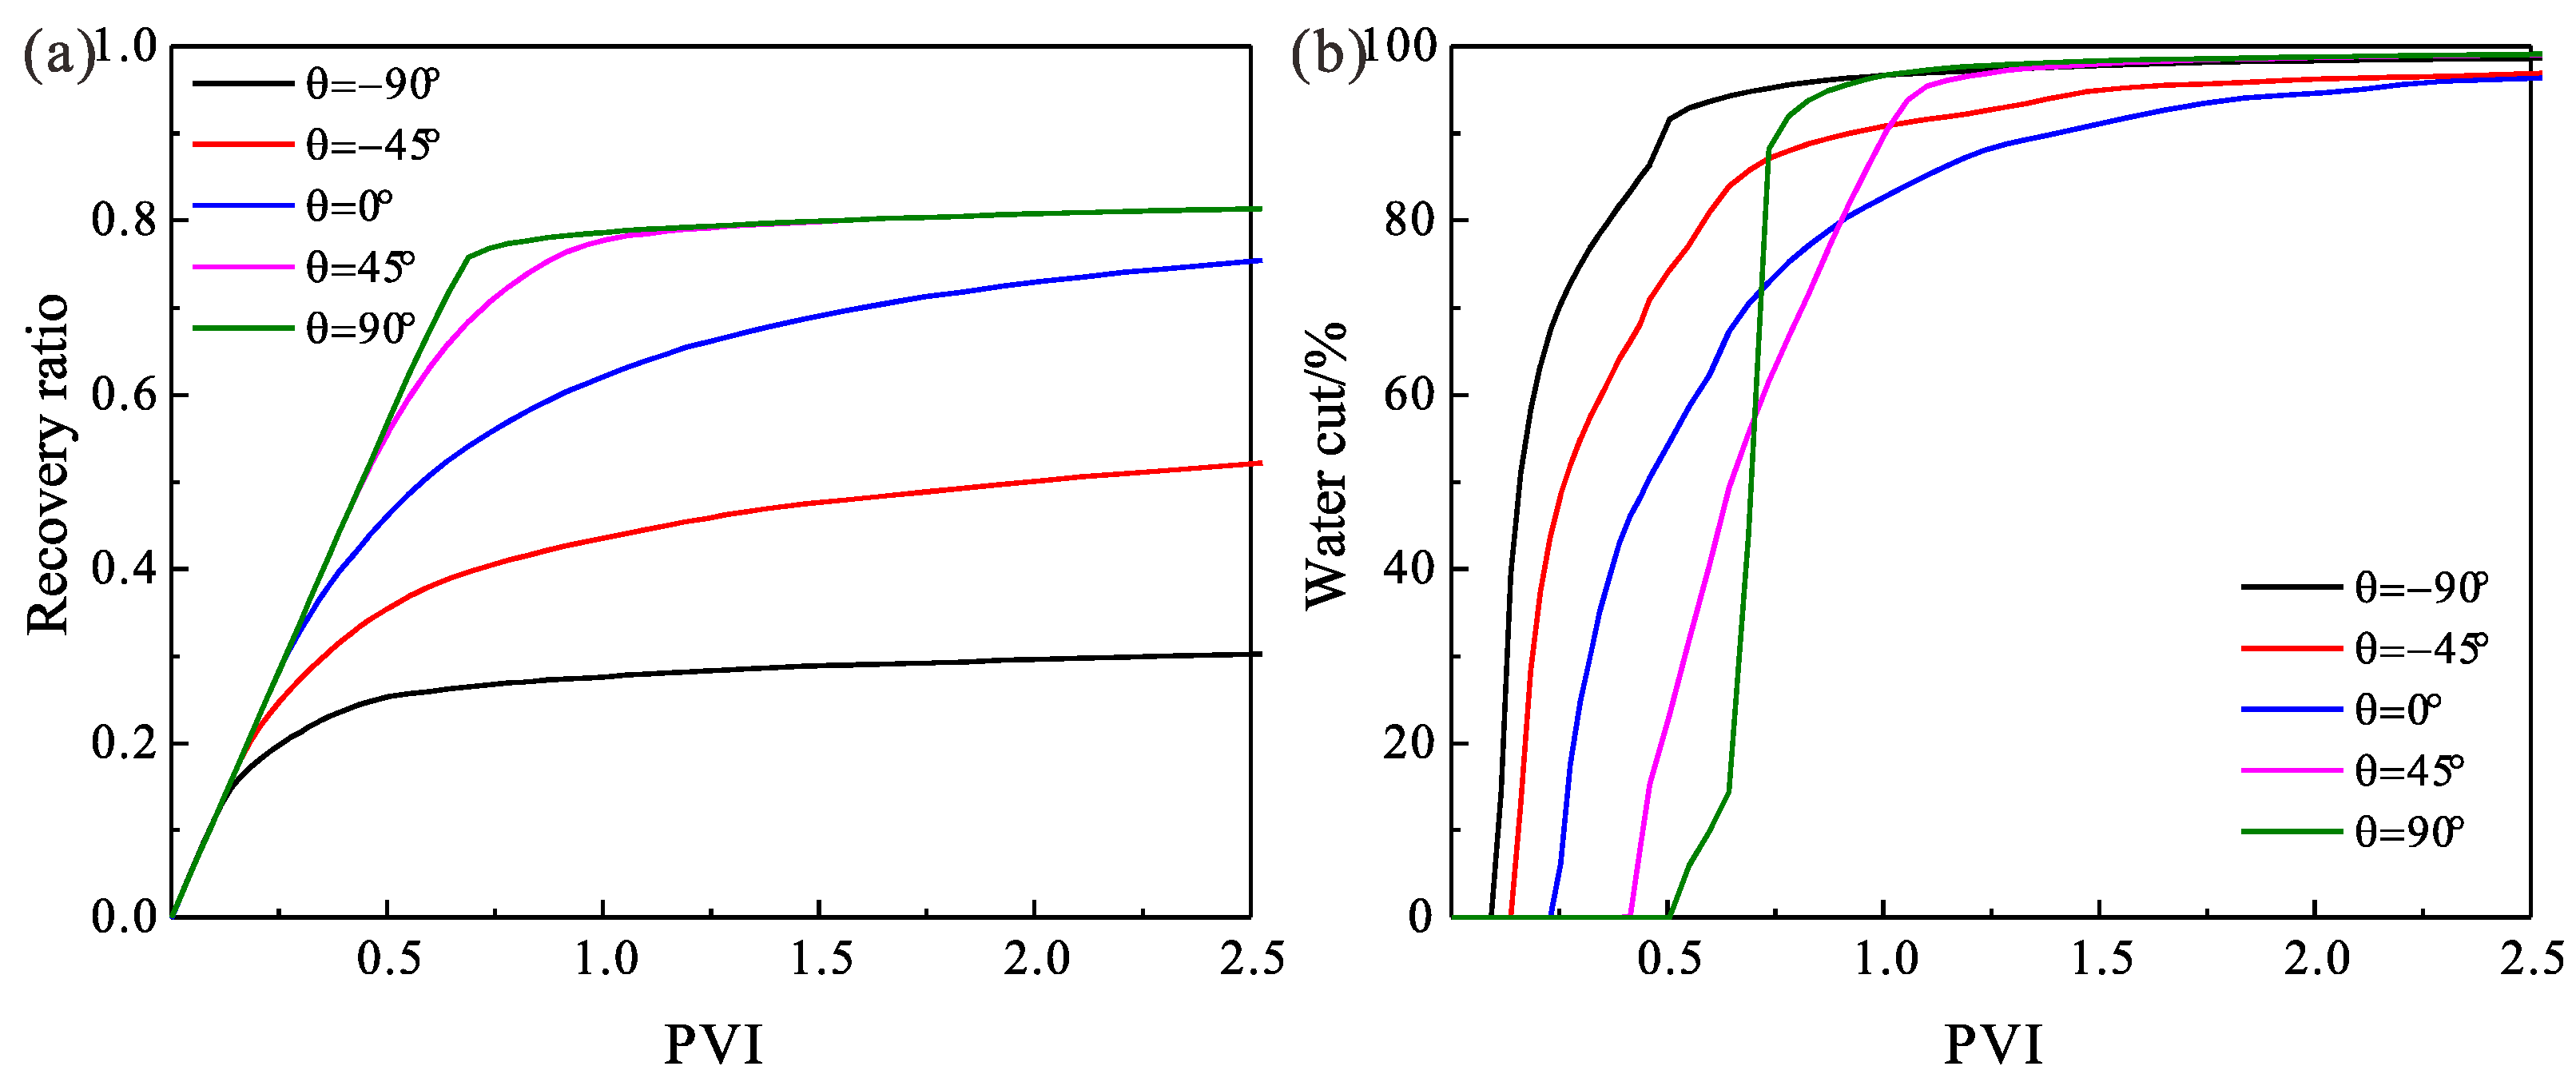
4.1. Numerical Simulation

Using the large permeability numerical scheme in Section 3, the displacement process in the single-vug model is simulated for 13 different values of θ (−90°, −75°, −60°, −45°, −30°, −15°, 0°, 15°, 30°, 45°, 60°, 75°, and 90°) using 2600 grids (n = 50). The parameters used in the numerical simulation are summarized in Table 2. Water is injected into the model for 3 × 10⁵ s; the total injected volume of water is 230 times the pore volume.
The oil recovery ratio and water cut of production well for five different θ are plotted in Figure 15. The oil saturation distributions are plotted in Figure 16. It can be seen that the differences between the results for different flow directions in the single-vug model are as obvious as that of the physical experiment. For the cases with flow direction θ > 0°, the recovery ratio is much higher, and the water breakthrough time is much later than that of θ < 0°. For the cases with flow directions θ < 0°, water breakthrough occurs at significantly lower PVI (less than 0.2), and the water cut of production well rapidly increases to over 80% after breakthrough. For the case of θ = −90°, the recovery ratio at the end of the simulation is only 39.4%, suggesting that there is a large amount of oil trapped inside the vug. In comparison, for the case of θ = 0°, the recovery ratio at the end of the simulation is 88.0%.

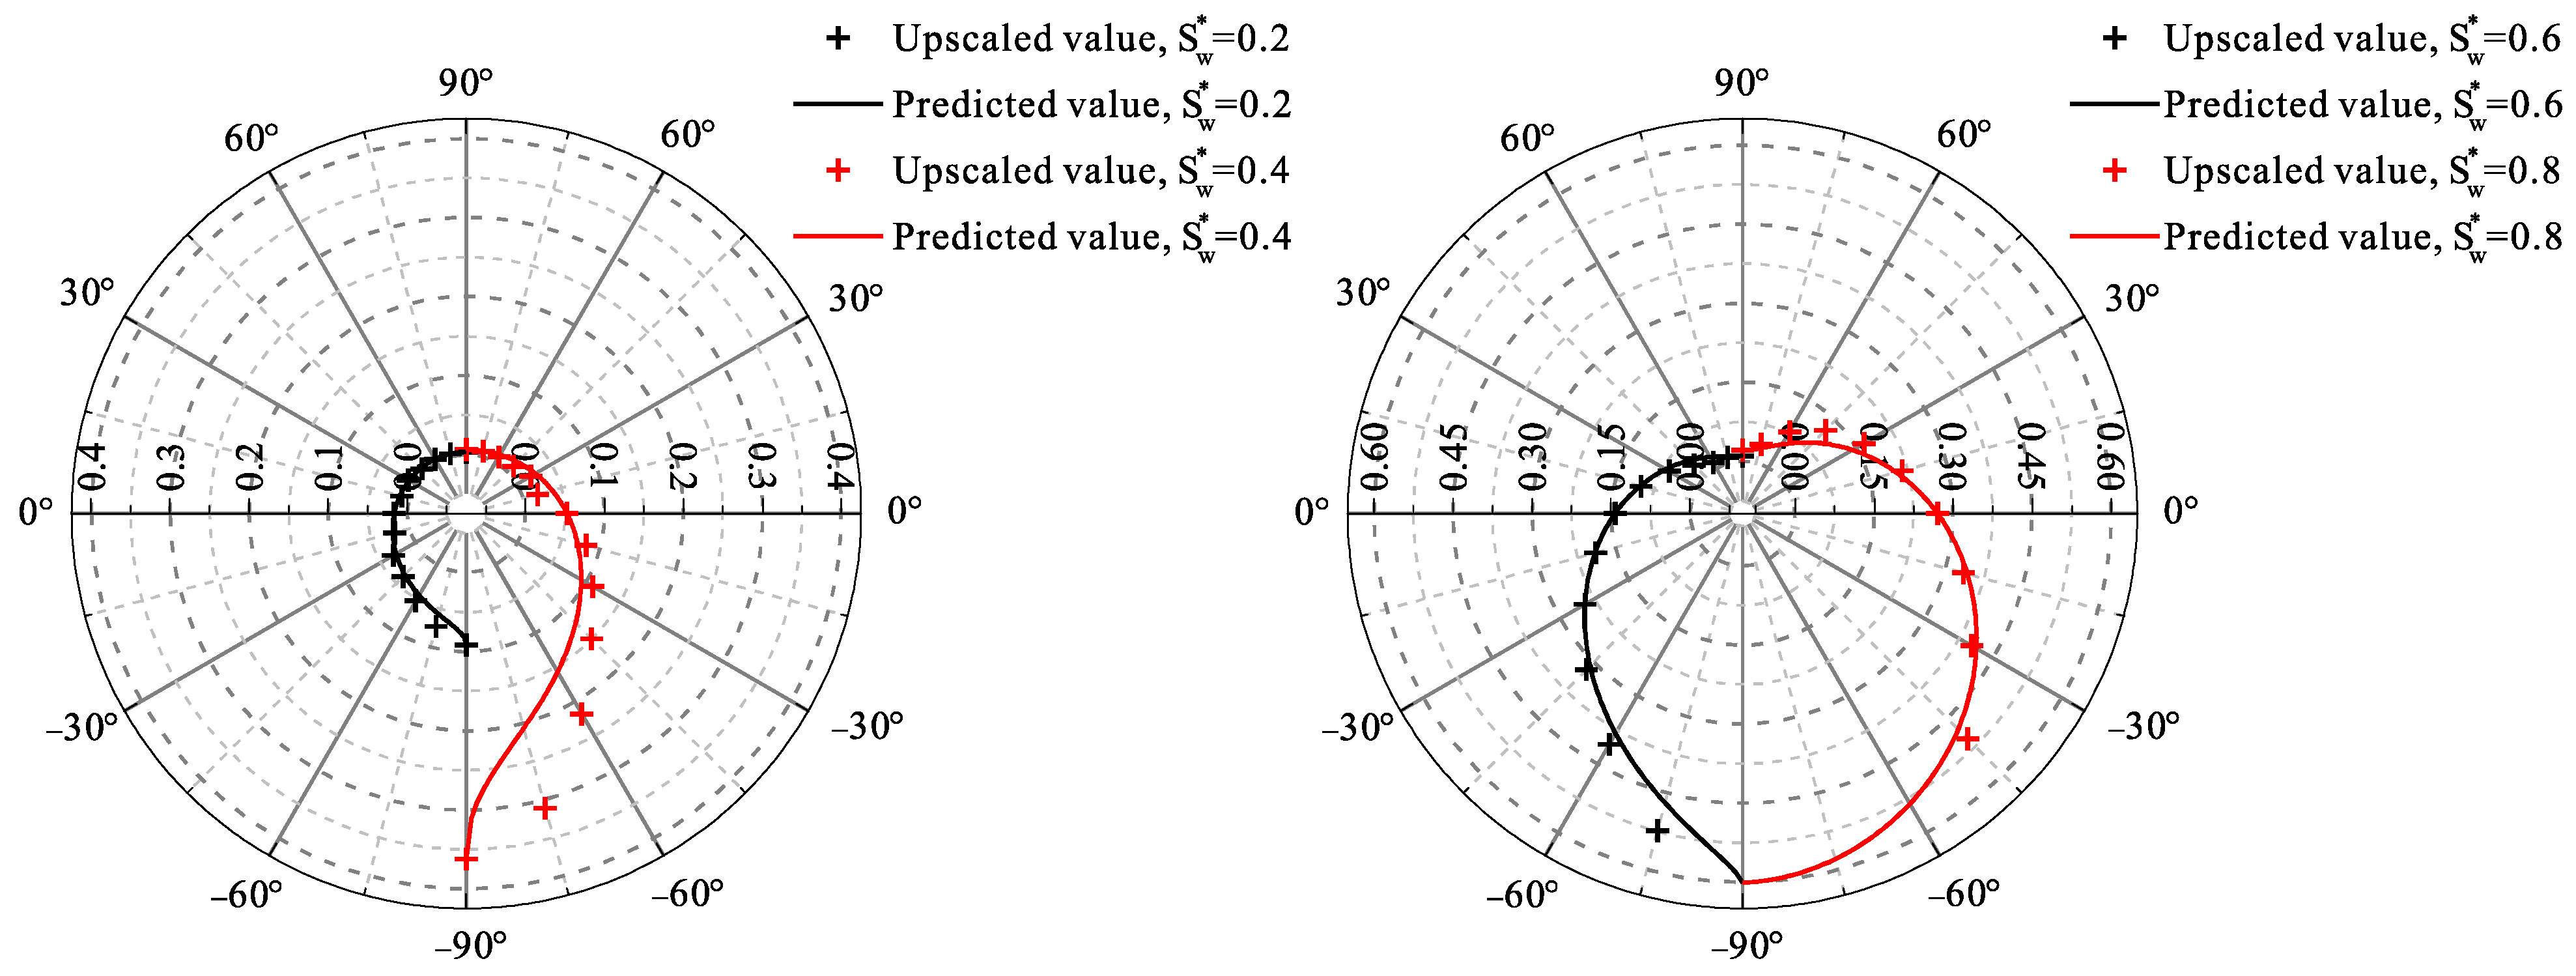
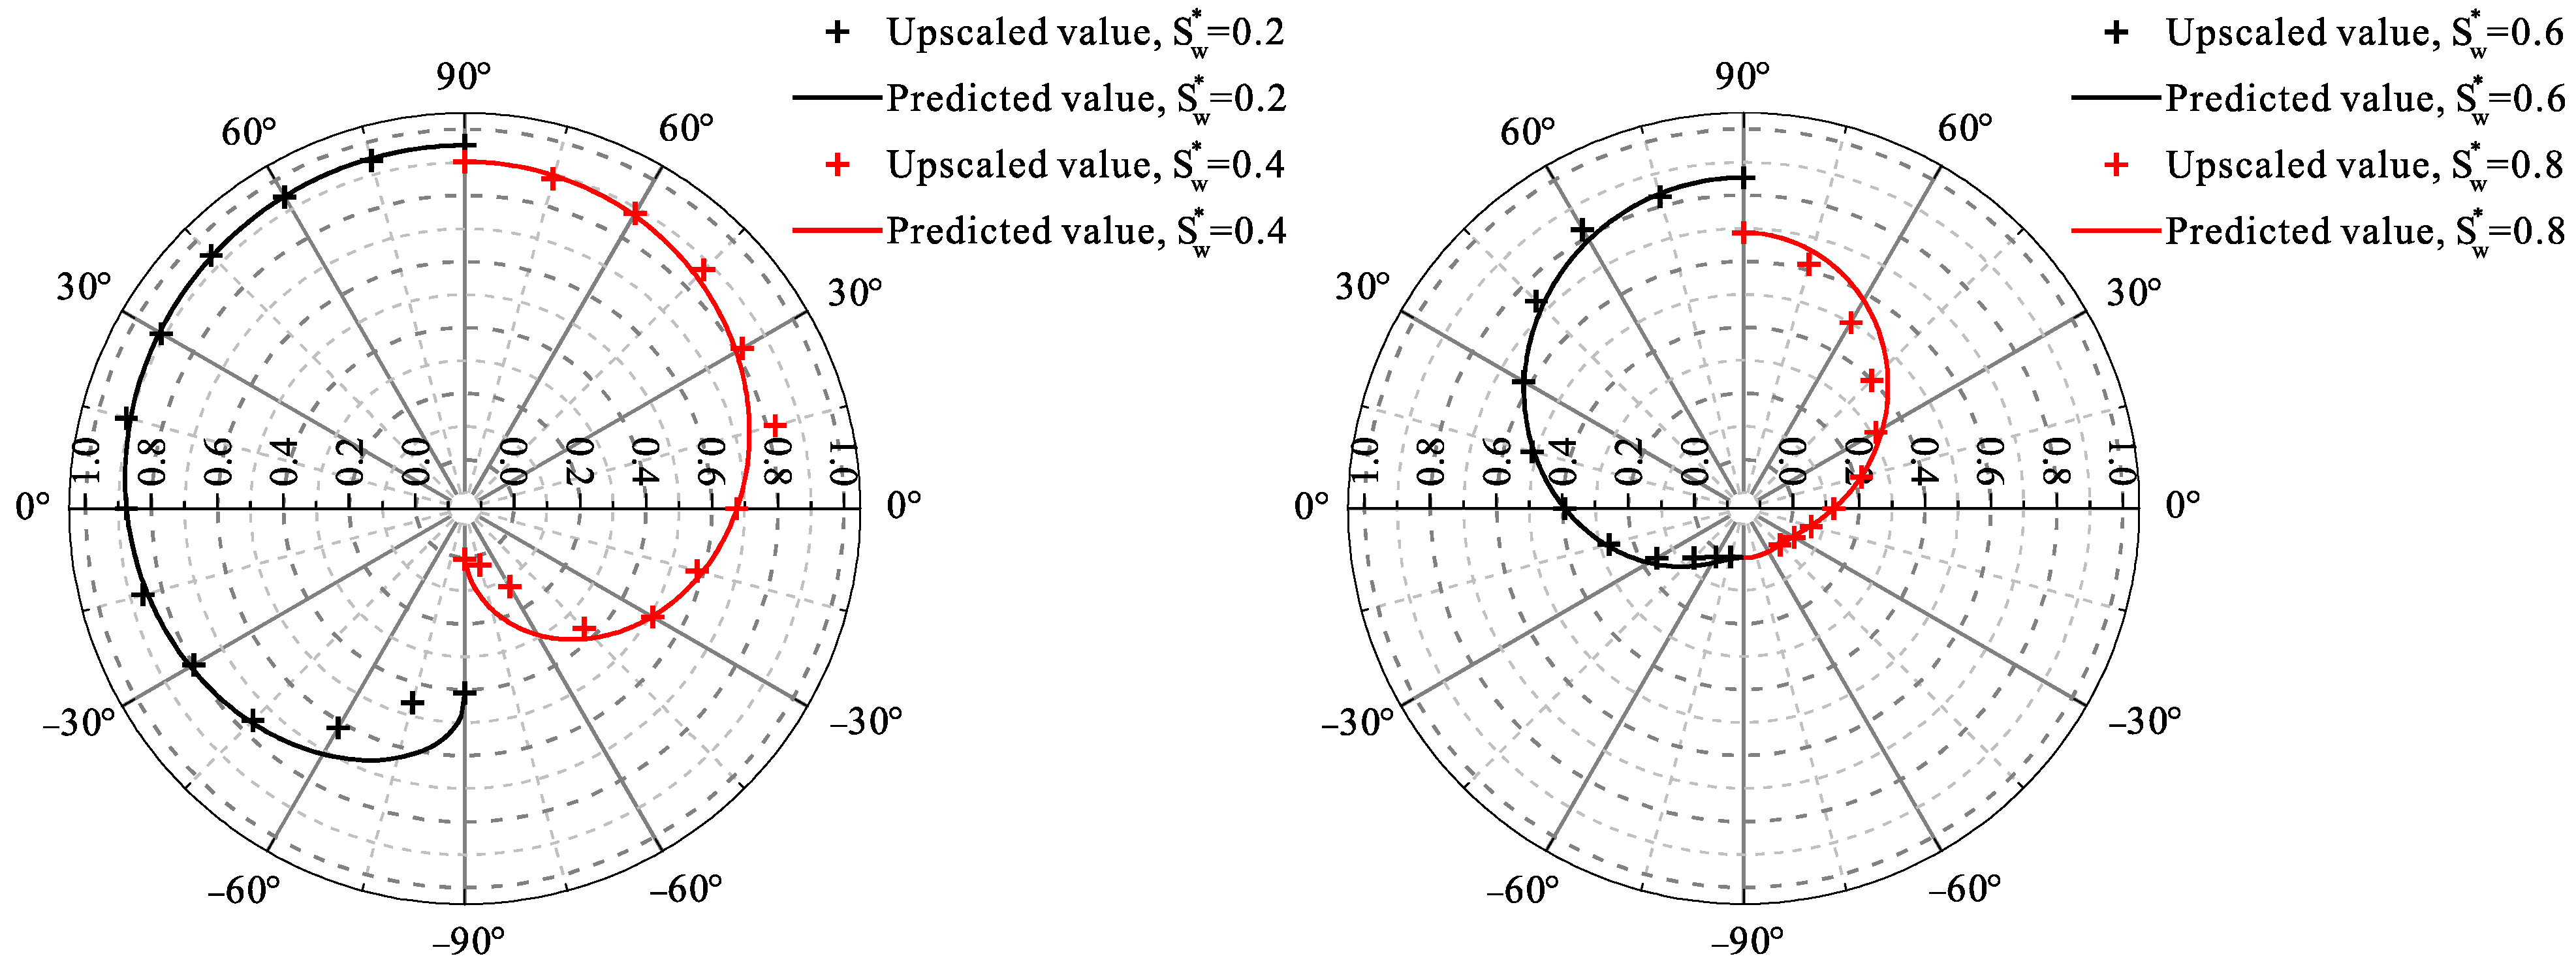
4.2. Transmissibility Weighted Upscaling

Adopting Darcy’s law for the single-vug model, the relative permeability of the single-vug model can be calculated by:
K r β = Q β ¯ μ β L ¯ A ¯ K ¯ Δ ψ β ¯
The parameters in Equation (13), except for the viscosity μ β , denote quantities evaluated for the single-vug model and are calculated by the following equations.
The volumetric flow rate of phase β out of the single-vug model Q β ¯ is given by:
Q β ¯ = j = 1 n Q β , ( n , j )
where Q β , ( n , j ) is the volumetric flow rate of phase β out of the grid with index (n, j), as shown in Figure 10.
The cross-sectional area of the model A ¯ is given by:
A ¯ = j = 1 n A ( n , j )
where A ( n , j ) is the cross-sectional area of the grid (n, j).
The permeability K ¯ is obtained via the single-phase upscaling method described in Section 3.3, which is 1.475 times the permeability of the porous medium.
The transmissibility weighted method was developed specifically to handle cases where there is a significant effect of gravity [49,50,51,52]. Therefore, it is selected as the calculation method for flow potential difference. The flow potential difference of phase β  Δ ψ β ¯ is evaluated between the center of the model and the production wellbore, and transmissibility weighted averaged between each row j:
Δ ψ β ¯ = j = 1 n T ( n / 2 , j ) ( ψ β , ( n / 2 , j ) ψ β , ( n + 1 , j ) ) j = 1 n T ( n / 2 , j )
where T ( n / 2 , j ) is the transmissibility of grid (n/2, j), ψ β , ( n / 2 , j ) is the flow potential of phase β in grid (n/2, j), and ψ β , ( n + 1 , j ) is the flow potential of phase β in production wellbore grid (n + 1, j). L ¯ is then half of the model length.
The corresponding water saturation in the model is given by:
S w ¯ = i , j 1 , n S w , ( i , j ) V ( i , j ) ϕ ( i , j ) i , j 1 , n V ( i , j ) ϕ ( i , j )
where S w , ( i , j ) is the water saturation in grid (i, j), V ( i , j ) and ϕ ( i , j ) are the volume and porosity of grid (i, j), respectively.
For each case with different flow directions θ, the single-vug model is numerically simulated. The simulation results for each grid (i, j) are obtained and substituted into Equations (13)–(17), yielding the upscaled relative permeability curves of the single-vug model.

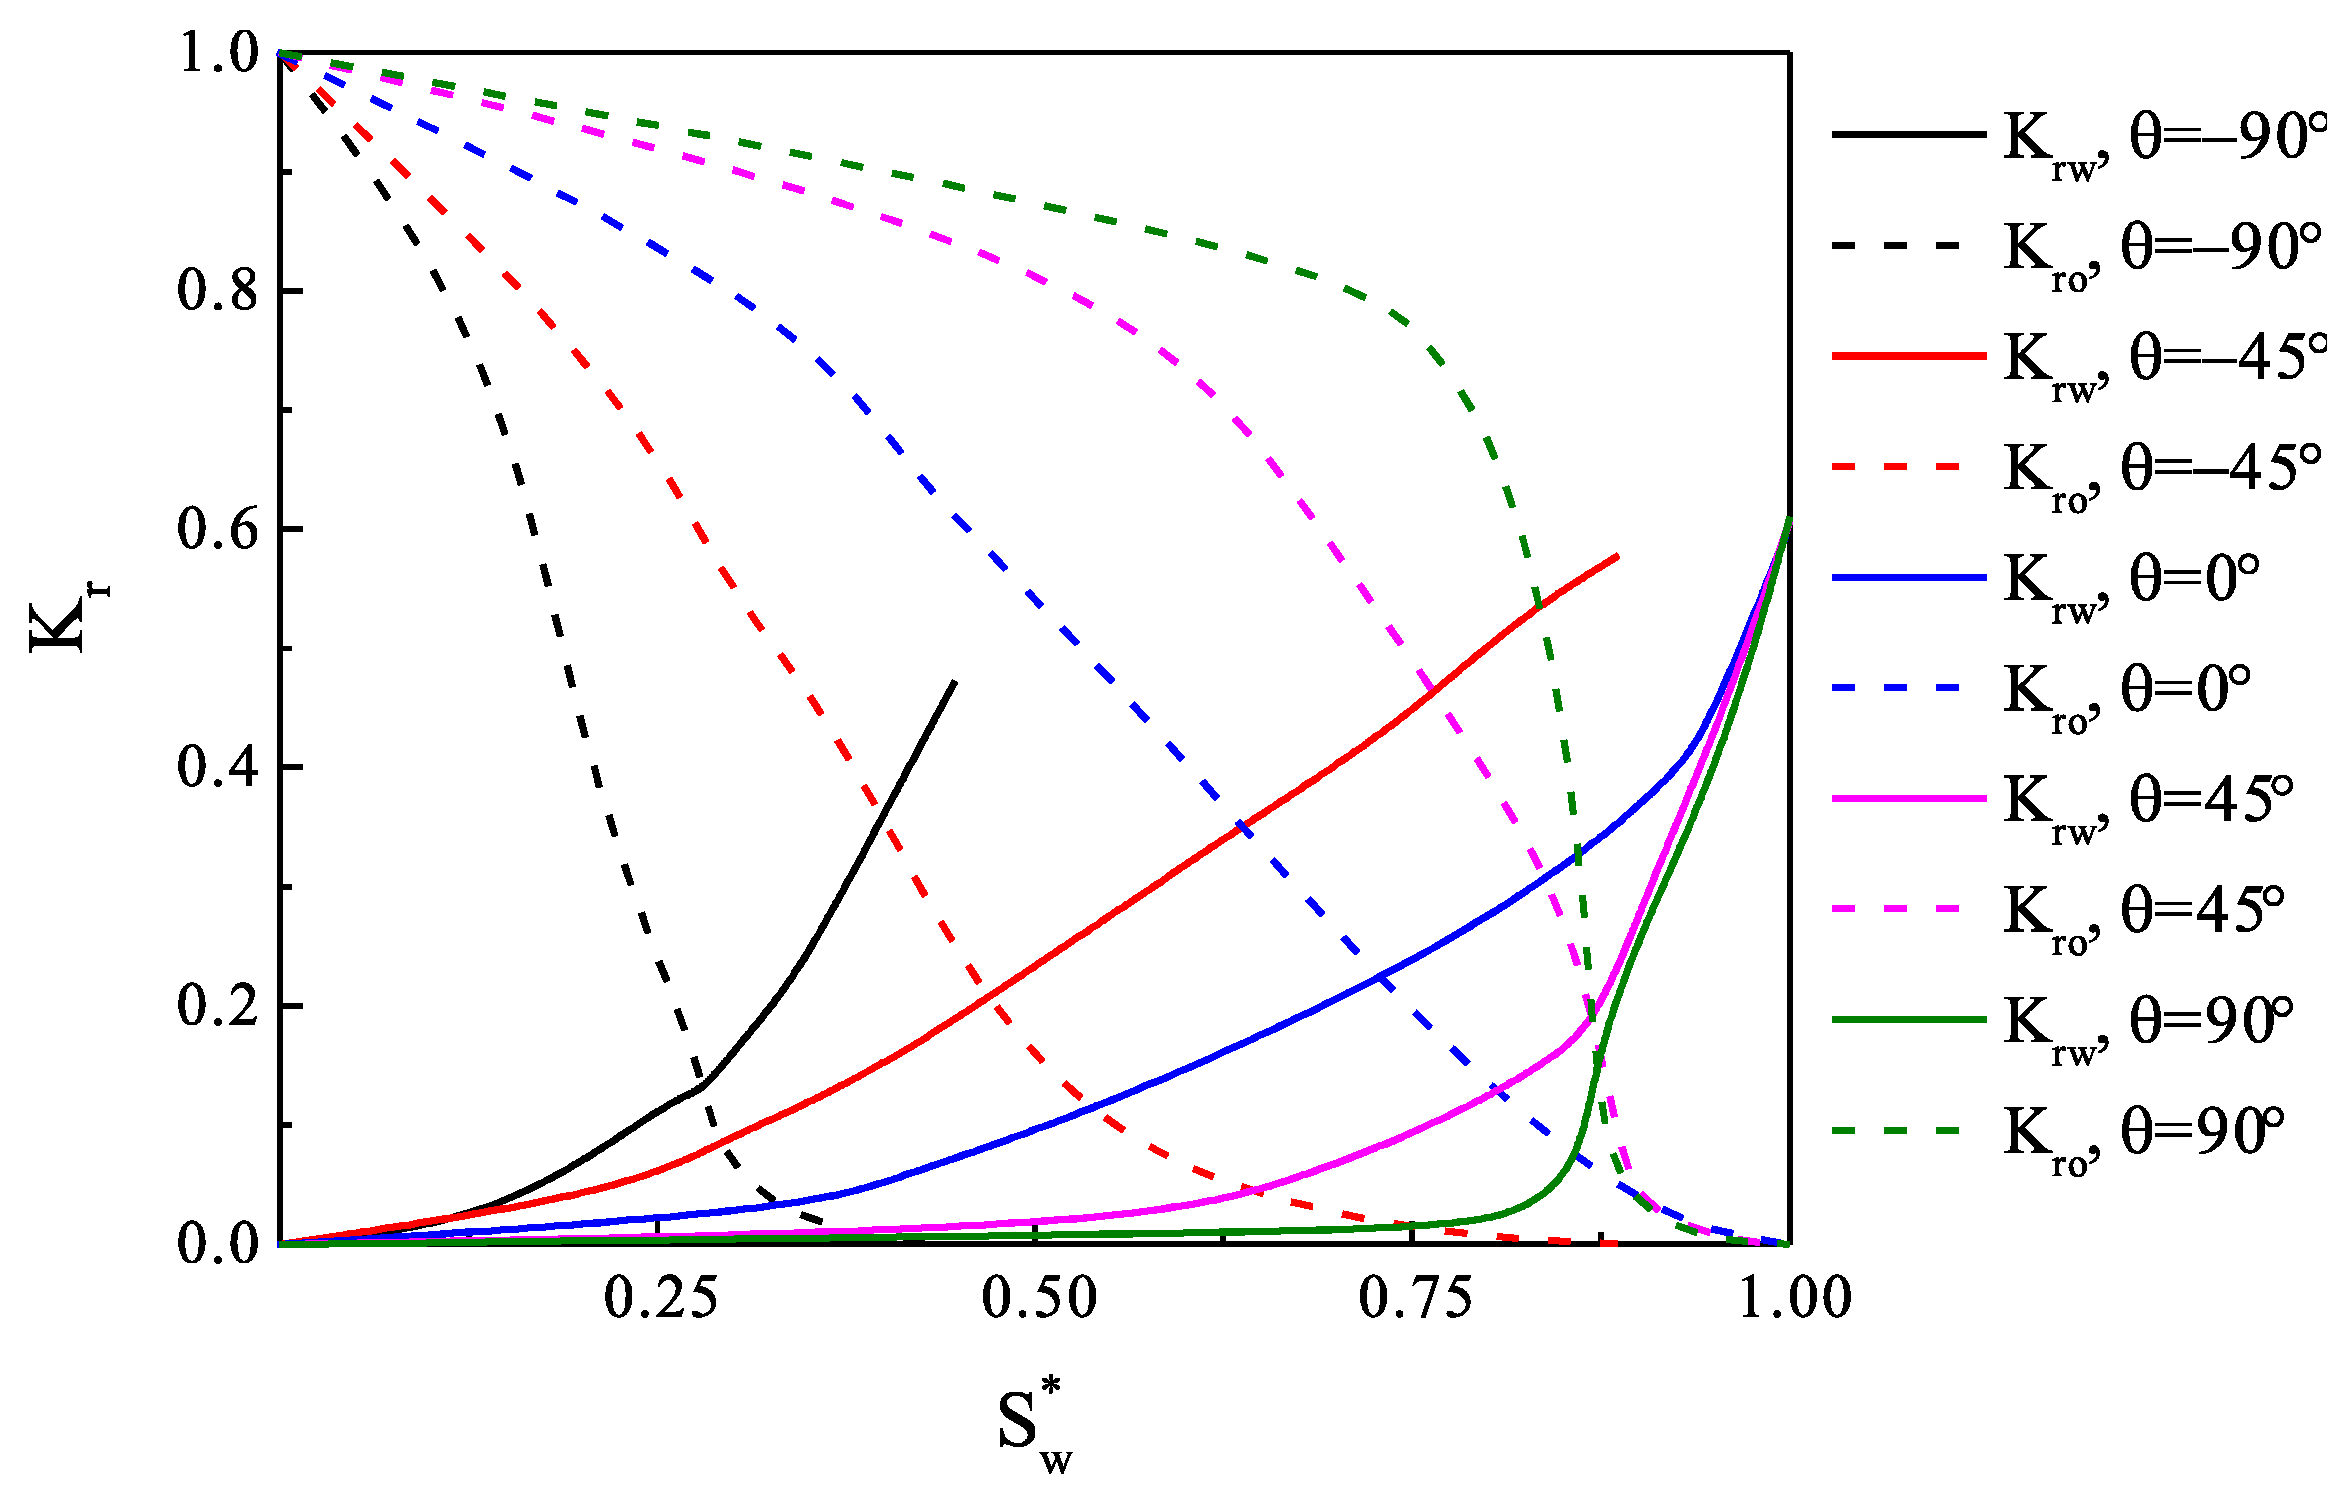
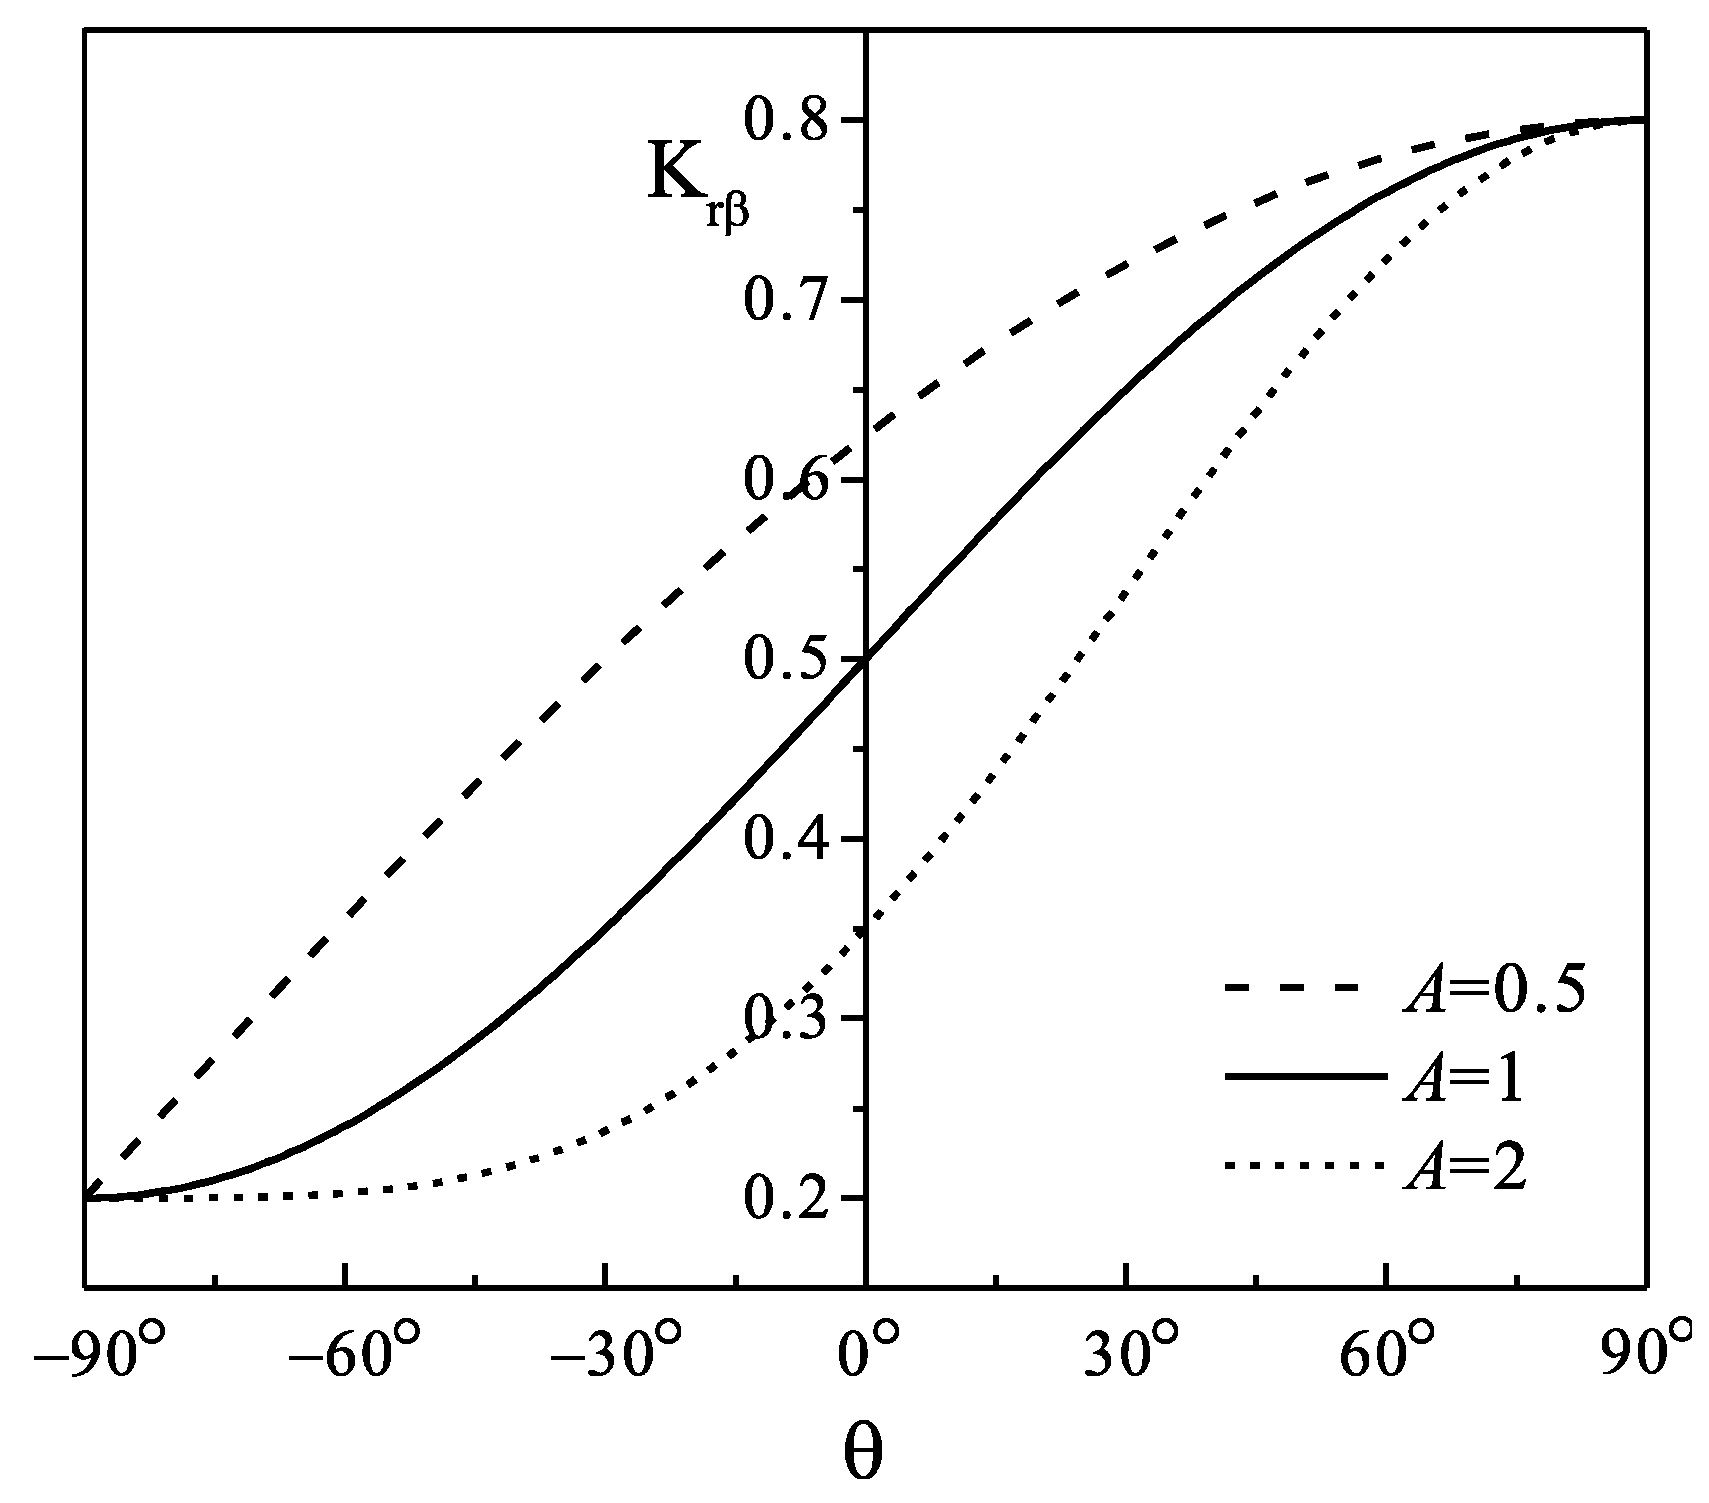
4.3. Directional Relative Permeability Model

The upscaled relative permeability curves for θ = −90°, −45°, 0°, 45°, and 90° are plotted in Figure 17. Figure 17 shows that the relative permeability curves corresponding to a larger θ are heavily shifted towards the direction of a larger water saturation, indicating a higher sweep efficiency and a later water breakthrough as suggested by numerical simulation. Figure 18 shows the upscaled relative permeability at four dimensionless water saturations ( S w * = 0.2, 0.4, 0.6, and 0.8) for different θ in polar coordinates. If the relative permeability is an isotropic quantity, the relative permeability for different θ at any given water saturation should locate on the same circle. For the single-vug model, the oil phase relative permeability increases with an increasing θ for the same saturation, whereas the opposite is true for the water phase. Given the results in Figure 17 and Figure 18, it can be concluded that the relative permeability of the single-vug model exhibits a strong degree of dependency on the fluid flow direction.
From Figure 17, we can see that at any water saturation, the relative permeability values are bound between the relative permeability in the upward direction, K r β u p and the relative permeability in the downward direction, K r β d o w n . Based on this observation, a directional relative permeability model is proposed for a vugular porous medium, which is a sine function modified by a shape factor A. For this model to be valid, we assume that the entire relative permeability curve for direction θ = −90°, 0°, and 90° are known, and the relative permeability of both phases are monotonic in the range of θ [ 90 ° , 90 ° ] at any water saturation, then the relative permeability in any direction θ can be obtained by the following equations:
K r β ( S w * , θ ) = K r β d o w n + ( K r β u p K r β d o w n ) ( 1 + sin θ 2 ) A
where:
A = log 0.5 ( K r β h o r K r β d o w n K r β u p K r β d o w n )
and K r β h o r denote the relative permeability in the horizontal direction. The effect of the shape factor A on Equation (18) is shown in Figure 19, where we assume K r β u p = 0.8 and K r β d o w n = 0.2 .
According to the model, if the relative permeability curves for fluid flow in vertically downward, horizontal, and vertically upward directions (which can be determined either by physical experiment or numerical simulation) were known, the relative permeability curves in any other direction could be predicted by the proposed model. To validate this directional relative permeability model, the relative permeability of the single-vug model at several dimensionless water saturations ( S w * = 0.2, 0.4, 0.6, and 0.8) are predicted and compared to the relative permeability calculated by the upscaling method in Section 4.2. Due to symmetry, only the half curves for the water phase and oil phase are given in Figure 20 and Figure 21, respectively. It can be seen that the proposed model is able to accurately predict the relative permeability value in different directions for the single-vug model.

5. Conclusions

In this study, via both experimental and numerical simulation, we have demonstrated that the relative permeability is directionally dependent and should not be modeled as an isotropic quantity for a vugular porous medium. A symmetric single-vug model was designed, and the physical experiments of its two-phase displacement were carried out in three different flow directions, θ = −90° (vertically downward), 0° (horizontal), and 90° (vertically upward). The results of physical experiments have shown that the two-phase flow regime is gravity segregated in the vug; the distribution pattern of two-phase fluid accelerates the water flow in downward and horizontal directions, meanwhile decelerating in an upward direction. The dynamic of the two-phase displacement process in the vugular porous medium and the oil recovery ratio was heavily affected by the fluid flow directions.
The large permeability method and a Darcy-type solver were adopted for the numerical simulation of the single-vug models with different directions of displacement. The simulation results of pressure drop, cumulative oil production, and the oil saturation distribution agreed well with that of the experiment. The directional dependence of the two-phase displacement in the single-vug model was also addressed by the numerical simulation.
The transmissibility-weighted upscaling method was adopted to obtain the relative permeability curves of the single-vug model for different flow directions based on simulation results. The resulting relative permeability curves showed a strong degree of dependency on the fluid flow directions. Based on the upscaled relative permeability curves, a directional relative permeability model was proposed for the vugular porous medium. With the proposed model, the relative permeability for any flow direction could be predicted if the relative permeability values for the three specific directions (vertically downward, horizontal, and vertically upward) were measured.

Author Contributions

S.S.: Methodology, data curation, formal analysis, validation, visualization, writing—original draft; Y.D.: Conceptualization, methodology, supervision, writing—review and editing, funding acquisition; W.G.: Resources, experiment, data curation. All authors have read and agreed to the published version of the manuscript.

Funding

This work was supported by the National Science and Technology Major Project of China (Grant No. 2016ZX05014).

Data Availability Statement

Not applicable.

Conflicts of Interest

The authors declare no conflict of interest.

References

  1. Wei, C.; Song, H.; Li, Y.; Zhang, Q.; Song, B.; Wang, J. Production Characteristics with Different Superimposed Modes Using Variogram: A Case Study of a Super-Giant Carbonate Reservoir in the Middle East. Energies 2017, 10, 250. [Google Scholar] [CrossRef] [Green Version]
  2. Alzayer, H.; Mehran, S. A New Approach to Simulate Near-Miscible Water-Alternating-Gas Injection for Mixed-Wet Reservoirs. In Proceedings of the SPE Kingdom of Saudi Arabia Annual Technical Symposium and Exhibition, Dammam, Saudi Arabia, 23–26 April 2018. [Google Scholar] [CrossRef]
  3. Tian, F.; Di, Q.; Jin, Q.; Cheng, F.; Zhang, W.; Lin, L.; Wang, Y.; Yang, D.; Niu, C.; Li, Y. Multiscale geological-geophysical characterization of the epigenic origin and deeply buried paleokarst system in tahe oilfield, tarim basin. Mar. Pet. Geol. 2019, 102, 16–32. [Google Scholar] [CrossRef]
  4. Xie, X.; Weiss, W.W.; Tong, Z.; Morrow, N.R. Improved oil recovery from carbonate reservoirs by chemical stimulation. SPE J. 2005, 10, 276–285. [Google Scholar] [CrossRef]
  5. Burchette, T.P. Carbonate rocks and petroleum reservoirs; a geological perspective from the industry. Geol. Soc. Lond. Spec. Publ. 2012, 370, 17–37. [Google Scholar] [CrossRef]
  6. Qing, S.S.; Sloan, R. Quantification of uncertainty in recovery efficiency predictions: Lessons learned from 250 mature carbonate fields. In Proceedings of the SPE Annual Technical Conference and Exhibition, Denver, CO, USA, 5–8 October 2003. [Google Scholar] [CrossRef]
  7. Agada, S.; Chen, F.; Geiger, S.; Toigulova, G.; Agar, S.; Shekhar, R.; Benson, G.S.; Hehmeyer, O.; Amour, F.; Mutti, M.; et al. Numerical simulation of fluid-flow processes in a 3D high-resolution carbonate reservoir analogue. Pet. Geosci. 2014, 20, 125–142. [Google Scholar] [CrossRef]
  8. Lucia, F.J. Carbonate Reservoir Characterization: An Integrated Approach, 2nd ed.; Springer: Berlin/Heidelberg, Germany, 2007; pp. 29–38. ISBN 978-3-540-72740-8. [Google Scholar] [CrossRef]
  9. He, J.; Killough, J.E.; Fadlelmula, M.M.; Fraim, M. A unified finite difference model for the simulation of transient flow in naturally fractured carbonate karst reservoirs. In Proceedings of the SPE Reservoir Simulation Symposium, Houston, TX, USA, 23–25 February 2015. [Google Scholar] [CrossRef] [Green Version]
  10. Popov, P.; Efendiev, Y.; Qin, G. Multiscale modeling and simulations of flows in naturally fractured karst reservoirs. Commun. Comput. Phys. 2009, 6, 162–184. [Google Scholar] [CrossRef]
  11. Liu, J.; Bodvarsson, G.S.; Wu, Y.S. Analysis of flow behavior in fractured lithophysal reservoirs. J. Contam. Hydrol. 2003, 62–63, 189–211. [Google Scholar] [CrossRef] [Green Version]
  12. Camacho-Velázquez, R.; Vásquez-Cruz, M.; Castrejón-Aivar, R.; Arana-Ortiz, V. Pressure-transient and decline-curve behavior in naturally fractured vuggy carbonate reservoirs. SPE Res. Eval. Eng. 2005, 8, 95–112. [Google Scholar] [CrossRef]
  13. Wu, Y.S.; Ehlig-Economides, C.; Qin, G.; Kang, Z.; Zhang, W.; Ajayi, B.; Tao, Q. A Triple-Continuum Pressure-Transient Model for a Naturally Fractured Vuggy Reservoir. In Proceedings of the SPE Annual Technical Conference and Exhibition, Anaheim, CA, USA, 11–14 November 2007. [Google Scholar] [CrossRef]
  14. Kang, Z.; Wu, Y.S.; Li, J.; Wu, Y.; Zhang, J.; Wang, G. Modeling Multiphase Flow in Naturally Fractured Vuggy Petroleum Reservoirs. In Proceedings of the SPE Annual Technical Conference and Exhibition, San Antonio, TX, USA, 24–27 September 2006. [Google Scholar] [CrossRef]
  15. Wu, Y.S.; Di, Y.; Kang, Z.; Fakcharoenphol, P. A multiple-continuum model for simulating single-phase and multiphase flow in naturally fractured vuggy reservoirs. J. Pet. Sci. Eng. 2011, 78, 13–22. [Google Scholar] [CrossRef]
  16. Yao, J.; Huang, Z.; Li, Y.; Wang, C.; Lv, X. Discrete fracture-vug network model for modeling fluid flow in fractured vuggy porous media. In Proceedings of the International Oil and Gas Conference and Exhibition, Beijing, China, 8–10 June 2010. [Google Scholar] [CrossRef]
  17. Zhang, N.; Yao, J.; Xue, S.; Huang, Z. Multiscale mixed finite element, discrete fracture–vug model for fluid flow in fractured vuggy porous media. Int. J. Heat Mass Transf. 2016, 96, 396–405. [Google Scholar] [CrossRef]
  18. Zhang, X.; Huang, Z.; Lei, Q.; Yao, J.; Gong, L.; Sun, S.; Li, Y. Connectivity, permeability and flow channelization in fractured karst reservoirs: A numerical investigation based on a two-dimensional discrete fracture-cave network model. Adv. Water Resour. 2022, 161, 104142. [Google Scholar] [CrossRef]
  19. Beavers, G.S.; Joseph, D.D. Boundary conditions at a naturally permeable wall. J. Fluid Mech. 1967, 30, 197–207. [Google Scholar] [CrossRef]
  20. Saffman, P.G. On the boundary condition at the surface of a porous medium. Stud. Appl. Math. 1971, 50, 93–101. [Google Scholar] [CrossRef]
  21. Chen, J.; Sun, S.; Wang, X. A numerical method for a model of two-phase flow in a coupled free flow and porous media system. J. Comput. Phys. 2014, 268, 1–16. [Google Scholar] [CrossRef]
  22. Chen, J.; Sun, S.; Chen, Z. Coupling two-phase fluid flow with two-phase darcy flow in anisotropic porous media. Adv. Mech. Eng. 2014, 6, 871021. [Google Scholar] [CrossRef] [Green Version]
  23. Huang, Z.; Gao, B.; Zhang, X.Y.; Yao, J. On the coupling of two-phase free flow and porous flow. In Proceedings of the 15th European Conference on the Mathematics of Oil Recovery, Amsterdam, The Netherlands, 29 August–1 September 2016. [Google Scholar] [CrossRef]
  24. Xie, H.; Li, A.; Huang, Z.; Gao, B.; Peng, R. Coupling of two-phase flow in fractured-vuggy reservoir with filling medium. Open Phys. 2017, 15, 12–17. [Google Scholar] [CrossRef]
  25. Yan, X.; Huang, Z.; Yao, J.; Zhang, Z.; Liu, P.; Li, Y.; Fan, D. Numerical simulation of hydro-mechanical coupling in fractured vuggy porous media using the equivalent continuum model and embedded discrete fracture model. Adv. Water Resour. 2019, 126, 137–154. [Google Scholar] [CrossRef]
  26. Liu, L.; Huang, Z.; Yao, J.; Di, Y.; Wu, Y. An efficient hybrid model for 3D complex fractured vuggy reservoir simulation. SPE J. 2020, 25, 907–924. [Google Scholar] [CrossRef]
  27. Liu, L.; Huang, Z.; Yao, J.; Lei, Q.; Di, Y.; Wu, Y.; Zhang, K.; Cui, S. Simulating two-phase flow and geomechanical deformation in fractured karst reservoirs based on a coupled hydro-mechanical model. Int. J. Rock Mech. Min. Sci. 2021, 137, 104543. [Google Scholar] [CrossRef]
  28. Arbogast, T.; Lehr, H.L. Homogenization of a darcy-stokes system modeling vuggy porous media. Comput. Geosci. 2006, 10, 291–302. [Google Scholar] [CrossRef] [Green Version]
  29. Arbogast, T.; Brunson, D.S. A computational method for approximating a darcy-stokes system governing a vuggy porous medium. Comput. Geosci. 2007, 11, 207–218. [Google Scholar] [CrossRef]
  30. Huang, Z.; Yao, J.; Li, Y.; Wang, C.; Lv, X. Numerical calculation of equivalent permeability tensor for fractured vuggy porous media based on homogenization theory. Commun. Comput. Phys. 2011, 9, 180–204. [Google Scholar] [CrossRef] [Green Version]
  31. Popov, P.; Qin, G.; Bi, L.; Efendiev, Y.; Kang, Z.; Li, J. Multiphysics and Multiscale Methods for Modeling Fluid Flow Through Naturally Fractured Vuggy Carbonate Reservoirs. SPE Res. Eval. Eng. 2009, 12, 218–231. [Google Scholar] [CrossRef]
  32. Qin, G.; Bi, L.; Popov, P.; Efendiev, Y.; Espedal, M.S. An efficient upscaling process based on a unified fine-scale multi-physics model for flow simulation in naturally fracture carbonate karst reservoirs. In Proceedings of the International Oil and Gas Conference and Exhibition, Beijing, China, 8–10 June 2010. [Google Scholar] [CrossRef]
  33. Golfier, F.; Lasseux, D.; Quintard, M. Investigation of the effective permeability of vuggy or fractured porous media from a darcy-brinkman approach. Comput. Geosci. 2015, 19, 63–78. [Google Scholar] [CrossRef]
  34. Pal, M. A unified approach to simulation and upscaling of single-phase flow through vuggy carbonates. Int. J. Numer. Methods Fluids 2012, 69, 1096–1123. [Google Scholar] [CrossRef]
  35. Li, Y.; Yao, J.; Li, Y.; Yin, C.; Pan, B.; Lee, J.; Dong, M. An equivalent continuum approach for modeling two-phase flow in fractured-vuggy media. Int. J. Multiscale Comput. Eng. 2017, 15, 79–98. [Google Scholar] [CrossRef]
  36. Huang, Z.; Yao, J.; Wang, Y. An efficient numerical model for immiscible two-phase flow in fractured karst reservoirs. Commun. Comput. Phys. 2013, 13, 540–558. [Google Scholar] [CrossRef] [Green Version]
  37. Wang, L.; Golfier, F.; Tinet, A.; Chen, W.; Vuik, C. An efficient adaptive implicit scheme with equivalent continuum approach for two-phase flow in fractured vuggy porous media. Adv. Water Resour. 2022, 163, 104186. [Google Scholar] [CrossRef]
  38. Pairoys, F.; Lasseux, D.; Bertin, H. An experimental and numerical investigation of water-oil flow in vugular porous media. In Proceedings of the International Symposium of the Society of Core Analysis, Pau, France, 21–24 September 2003. [Google Scholar]
  39. Wang, J.; Liu, H.; Ning, Z.; Zhang, H.; Hong, C. Experiments on water flooding in fractured-vuggy cells in fractured-vuggy reservoirs. Pet. Explor. Dev. 2014, 41, 74–81. [Google Scholar] [CrossRef]
  40. Yuan, D.; Hou, J.; Song, Z.; Wang, Y.; Luo, M.; Zheng, Z. Residual oil distribution characteristic of fractured-cavity carbonate reservoir after water flooding and enhanced oil recovery by N2 flooding of fractured-cavity carbonate reservoir. J. Pet. Sci. Eng. 2015, 129, 15–22. [Google Scholar] [CrossRef]
  41. Wang, Y.; Hou, J.; Tang, Y.; Song, Z. Effect of vug filling on oil-displacement efficiency in carbonate fractured-vuggy reservoir by natural bottom-water drive: A conceptual model experiment. J. Pet. Sci. Eng. 2019, 174, 1113–1126. [Google Scholar] [CrossRef]
  42. Yang, W.; Zhang, D.; Lei, G. Experimental study on multiphase flow in fracture-vug medium using 3D printing technology and visualization techniques. J. Pet. Sci. Eng. 2020, 193, 107394. [Google Scholar] [CrossRef]
  43. Lu, G.; Zhang, L.; Liu, Q.; Xu, Q.; Zhao, Y.; Li, X.; Deng, G.; Wang, Y. Experiment analysis of remaining oil distribution and potential tapping for fractured-vuggy reservoir. J. Pet. Sci. Eng. 2022, 208, 109544. [Google Scholar] [CrossRef]
  44. Krotkiewski, M.; Ligaarden, I.S.; Lie, K.; Schmid, D.W. On the importance of the stokes-brinkman equations for computing effective permeability in karst reservoirs. Commun. Comput. Phys. 2011, 10, 1315–1332. [Google Scholar] [CrossRef]
  45. Zhou, D.; Fayers, F.J.; Orr Jr, F.M. Scaling of multiphase flow in simple heterogeneous porous media. In Proceedings of the SPE/DOE Improved Oil Recovery Symposium, Tulsa, OK, USA, 17–20 April 1994. [Google Scholar] [CrossRef]
  46. Durlofsky, L.J. Numerical calculation of equivalent grid-block permeability tensors for heterogeneous porous media. Water Resour. Res. 1991, 27, 699–708. [Google Scholar] [CrossRef] [Green Version]
  47. Durlofsky, L.J. Coarse scale models of two phase flow in heterogeneous reservoirs: Volume averaged equations and their relationship to existing upscaling techniques. Comput. Geosci. 1998, 2, 73–92. [Google Scholar] [CrossRef]
  48. Chen, Y.; Li, Y. Local-global two-phase upscaling of flow and transport in heterogeneous formations. Multiscale Model. Simul. 2009, 8, 125–153. [Google Scholar] [CrossRef]
  49. Darman, N.H.; Sorbie, K.S.; Pickup, G.E. Development of pseudo functions for gravity-dominated immiscible gas displacements. In Proceedings of the SPE Reservoir Simulation Symposium, Houston, TX, USA, 14–17 February 1999. [Google Scholar] [CrossRef]
  50. Darman, N.H.; Pickup, G.E.; Sorbie, K.S. A comparison of two-phase dynamic upscaling methods based on fluid potentials. Comput. Geosci. 2002, 6, 5–27. [Google Scholar] [CrossRef]
  51. Azoug, Y.; Tiab, D. The performance of pseudofunctions in the upscaling process. In Proceedings of the SPE Production and Operations Symposium, Oklahoma City, OK, USA, 22–25 March 2003. [Google Scholar] [CrossRef]
  52. Hashemi, A.; Shadizadeh, S.R.; Zargar, G. Upscaling of relative permeability using pseudo functions. Energy Sources Part A Recovery Util. Environ. Eff. 2014, 36, 2227–2237. [Google Scholar] [CrossRef]
Figure 1. Outcrop pictures from Tahe carbonate oilfield, China, showing a large amount of isolated vugs of millimeters to decimeters in size embedded in the porous medium.
Energies 16 03041 g001
Figure 2. Schematic of the single-vug model. (a) Frontal and (b) side cross-sectional view, and (c) a manufactured sample of the physical model.
Energies 16 03041 g002
Figure 3. Schematic of the experiment setup.
Energies 16 03041 g003
Figure 4. Definition of the angle θ in this study. The angle is taken between the flow direction in the single-vug model and the horizontal plane and has a range of [−90°, 90°].
Energies 16 03041 g004
Figure 5. Experiment results in downward (θ = −90°), horizontal (θ = 0°) and upward (θ = 90°) direction. (a) Volume of cumulative produced oil, (b) water cut of the production well, and (c) pressure drop across the model.
Energies 16 03041 g005
Figure 6. Oil saturation distribution in the single-vug model during experiments with θ = 90°.
Energies 16 03041 g006
Figure 7. Oil saturation distribution in the single-vug model during experiments with θ = 0°.
Energies 16 03041 g007
Figure 8. Oil saturation distribution in the single-vug model during experiments with θ = −90°.
Energies 16 03041 g008
Figure 9. The four distinct phases of the displacement process during the displacement experiment in the single-vug model in downward (θ = −90°), horizontal (θ = 0°), and upward (θ = 90°) direction.
Energies 16 03041 g009
Figure 10. Discretization scheme of the single-vug model.
Energies 16 03041 g010
Figure 11. Relative permeability of the vug grids for numerical simulation.
Energies 16 03041 g011
Figure 12. Upscaled absolute permeability of the single-vug model (the vug diameter is taken as 0.6 times the model length in accordance with the reference) with different values of n compared to the result obtained by Huang et al. [30] based on homogenization theory.
Energies 16 03041 g012
Figure 13. Comparison of the result of experiment and numerical simulation for Case 2 (flow direction is horizontal): (a) Pressure drop across the model and (b) volume of cumulative produced oil.
Energies 16 03041 g013
Figure 14. Comparison of the oil saturation distributions in the experiment and numerical simulation at four different PVIs for Case 2 in Section 2. Water (transparent) displaces oil (red) from left to right.
Energies 16 03041 g014
Figure 15. Numerical simulation results of the single-vug model for five different flow directions: (a) Oil recovery ratio and (b) water-cut of the production well.
Energies 16 03041 g015
Figure 16. Oil saturation distribution in the single-vug model for five different flow directions.
Energies 16 03041 g016
Figure 17. Upscaled relative permeability of the single-vug model for five different flow directions.
Energies 16 03041 g017
Figure 18. Upscaled relative permeability of the single-vug model at four different dimensionless water saturations in a polar coordinated system. Note that if the relative permeability is isotropic, then the points should be located on the same circle.
Energies 16 03041 g018
Figure 19. The effect of shape factor A in the directional relative permeability model Equation (18).
Energies 16 03041 g019
Figure 20. Comparison of water phase relative permeability of the single-vug model obtained via the upscaling method and predicted by the proposed directional relative permeability model.
Energies 16 03041 g020
Figure 21. Comparison of oil phase relative permeability of the single-vug model obtained via the upscaling method and predicted by the proposed directional relative permeability model.
Energies 16 03041 g021
Table 1. Parameters for the simulation of experiment Case 2.
ParameterDescriptionValueUnit
KAbsolute permeability2.4 × 10−11m2
ϕPorosity0.315-
SwiIrreducible water saturation0.358-
kro(Swi)Oil phase relative permeability at irreducible water saturation1.0-
SorResidual oil saturation0.15-
krw(Sor)Water phase relative permeability at residual oil saturation0.4-
λShape factor for Brooks-Corey relative permeability model Equations (7)–(9)3.0-
PDPore entry pressure0.6KPa
ρoOil density840kg/m3
μoOil viscosity18.0mpa·s
ρwWater density1000kg/m3
μwWater viscosity1.0mpa·s
Table 2. Parameters used in numerical simulation for the single-vug model.
ParameterDescriptionValueUnit
KAbsolute permeability1.0 × 10−11m2
ϕPorosity0.3-
SwiIrreducible water saturation0.2-
kro(Swi)Oil phase relative permeability at irreducible water saturation1.0-
SorResidual oil saturation0.2-
krw(Sor)Water phase relative permeability at residual oil saturation0.6-
λShape factor for Brooks-Corey relative permeability model Equations (7)–(9)3.0-
PDPore entry pressure0KPa
ρoOil density800kg/m3
μoOil viscosity5.884mpa·s
ρwWater density1000kg/m3
μwWater viscosity1.0mpa·s
QInjection rate2.0ml/min
GrGravity number0.1-
CaCapillary number0.0-
Disclaimer/Publisher’s Note: The statements, opinions and data contained in all publications are solely those of the individual author(s) and contributor(s) and not of MDPI and/or the editor(s). MDPI and/or the editor(s) disclaim responsibility for any injury to people or property resulting from any ideas, methods, instructions or products referred to in the content.

