Article

Investigation on Invasion Depth of Fracturing Fluid during Horizontal Fracturing in Low-Permeability Oil Reservoirs with Experiments and Mathematical Models

School of Energy Resources, China University of Geosciences (Beijing), Beijing Key Laboratory of Unconventional Natural Gas Geology Evaluation and Development Engineering, Beijing 100083, China
*
Author to whom correspondence should be addressed.
Energies 2023, 16(13), 5148; https://doi.org/10.3390/en16135148
Submission received: 20 April 2023 / Revised: 21 June 2023 / Accepted: 28 June 2023 / Published: 4 July 2023

Abstract

:
Multistage fracturing in horizontal well has become one of the important techniques for the efficient development of low-permeability sandstone reservoirs. In multistage hydraulic fractured horizontal wells (MHFHWs), the depth of fracturing fluid invasion into the formation is a key parameter evaluating the imbibition enhancement after fracturing. However, few studies have been conducted on the invasion depth of fracturing fluids combining experiments and mathematical models under high-pressure differences in MHFHWs. Therefore, in this work, a mathematical model with experimental validation is proposed for evaluating the fracturing fluids invasion under high pressure. We first conducted a series of displacement experiments under different pressure differences to obtain the breakthrough time and invasion velocity. All core samples are taken from the block X of Xinjiang oilfield. A mathematical model of fracturing fluid injection was then established, considering the two-dimensional filtration of fracturing fluid. Then, the calculated invasion velocity was validated against the experimental data. Afterward, the invasion depth and invasion volume were determined for this typical horizontal well. Results show that at the end of 72 min, the invasion depth reaches 1.516 m when measured by core experiments and 1.434 m when calculated by the proposed model. The total invasion volume of all fracturing stages is estimated as 21,560.05 m3 and the actual total fluid volume injected is 24,019.6 m3. The paper formed a scientific and reasonable evaluation method of fracturing fluid invasion depth during the fracturing of horizontal wells, which provides solid theoretical support for the effective evaluation of fracturing to improve oil recovery.

1. Introduction

Horizontal well combined with multistage hydraulic fracturing has become an important method for developing low-permeability oil reservoirs. Fracturing can greatly enhance the seepage capacity of the reservoir and improve oil recovery [1,2,3,4]. The evaluation of fracturing effect has also become an important branch in the development of low-permeability oil reservoirs [5,6]. Liquid invasion has long been the focus of research, and many scholars are dedicated in determining the effect of liquid invasion. It is commonly admitted that liquid invasion will damage the formation through water blocking in tight gas reservoirs [7,8]; however, it may improve oil recovery by imbibition in some low-permeability oil reservoirs [9,10,11]. The invasion depth of fracturing fluid is not only related to the swept area of fracturing fluid, but is also a parameter that must be considered in subsequent flowback operations [12], and even plays a role in the imbibition area during the shut-in stage [13,14,15]. Therefore, invasion depth is a valuable factor for evaluating the fracturing effect. Since the invasion depth varies with pressure difference or time, it is difficult to accurately calculate. Therefore, a comprehensive and effective solution for obtaining the fracturing fluid invasion depth is required.
In previous studies of liquid invasion, experiments with invasion volume changing over time were performed and equations with various parameters were built to curve-fit experimental data [16,17]; however, most were focused on the loss of acid and drilling fluids, especially for open-hole completed horizontal wells [18,19]. Some experiments and mathematical models are widely used to estimate the liquid invasion of formations, which provides a certain reference for the study of fracturing fluid filtration [20,21,22,23]. Subsequently, the filtration of fracturing fluid was considered, and a larger part of the study was conducted on natural fractures by simulation, but the filtration of natural fractures faced a lack of experimental data [24,25]. Elbel et al. [26] have shown the depth of penetration into the matrix in fracturing zones from experiments and investigated formation permeability reduction to clarify the production effects of fluid loss. Clark [27] analyzed available experimental data to obtain the correlation of cumulative volume and time, and proposed two different models to better fit the data. Crandall et al. [28] conducted experiments to simulate fluid flow through four fracture profiles and estimate the fraction factor for fractures. Guo and Liu [29] developed a new fracturing fluid leak-off model for natural fractures analytically, and analyzed the effect of pressure on the penetration speed. The abovementioned studies range from the experimental studies of invasion velocity to fracture fluid invasion depth, but few experiments have considered high-pressure difference, and investigation on invasion depth rarely considers filtration as the fracture gradually propagates. As fracture depth increases, the fracture pressure difference increases, and an invasion depth experiment under high-pressure difference needs to be established.
In fracturing horizontal wells, it is essential to characterize the pressure distribution around the fracture in calculating invasion depth during fracturing in low-permeability oil reservoirs. The pressure variation directly changes the pressure difference between the fracture and the formation, which affects the invasion rate and invasion depth of the fracturing fluid [30,31]. The pressure and production characteristics of fractured horizontal wells have been investigated with lots of models based on the fluid and formation properties [32,33,34]. Zhang et al. [35] presented a semi-analytical model of a vertically fractured well considering three distinct regions without considering the effect of the injection process of fracture fluid on reservoir pressure. Al-Rbeawi [36] has focused on the fluid flow phenomenon with triple porous media; it is favorable to understand pressure distribution in the outer porous media with existing naturally induced fractures. Wu et al. [37] comprehensively studied a model composed of a fracturing fluid injection model and a flowback and production model, and the pressure variation area was calculated from the fracture after injection. When calculating the pressure redistribution of the fracturing model, the two-dimensional fluid loss model of fracturing fluid should be considered [38]. To calculate invasion depth with numerical simulation, the pressure redistribution of each time step will be updated to construct new pressure differences with fracture pressure. Semi-analytical models were developed to solve the pressure distribution around the fracture; however, most investigated the flow behavior after the fracture is fully formed. The fracture is supposed to expand while filtering during the fracturing time, and the fracturing fluid also flows along the fracture, so we develop a two-dimensional filtering model combined with fracture propagation to calculate the invasion depth.
To determine the invasion depth of fracturing fluid reasonably, this work develops a mathematical model with experimental validation. To simulate the high pressure of the realistic fracture, an experimental equipment that meets the high-pressure conditions is built. Due to the pressure difference between fracture and reservoir varying with time during fracturing, we adjust the pressure in the inlet and outlet to build different pressure differences for experiments, which can obtain the relationship between pressure difference and fracturing fluid invasion velocity. Afterward, a mathematical model of fracturing fluid injection model was established, considering the two-dimensional filtration of fracturing fluid, and the invasion depth of fracturing fluid under various pressure differences was evaluated. Combined with experimental measurement and numerical simulation, a solution for obtaining the invasion depth data was formed, which provides a reference for fracturing effect evaluation and subsequent production.

2. Materials and Methods

2.1. Experiments

In this section, we conducted displacement experiments to investigate the breakthrough time and invasion velocity of fracturing fluid. The experimental data measured can be used to help validate the accuracy of the numerical model. It is also able to evaluate the depth of fracturing fluid invasion into the formation.

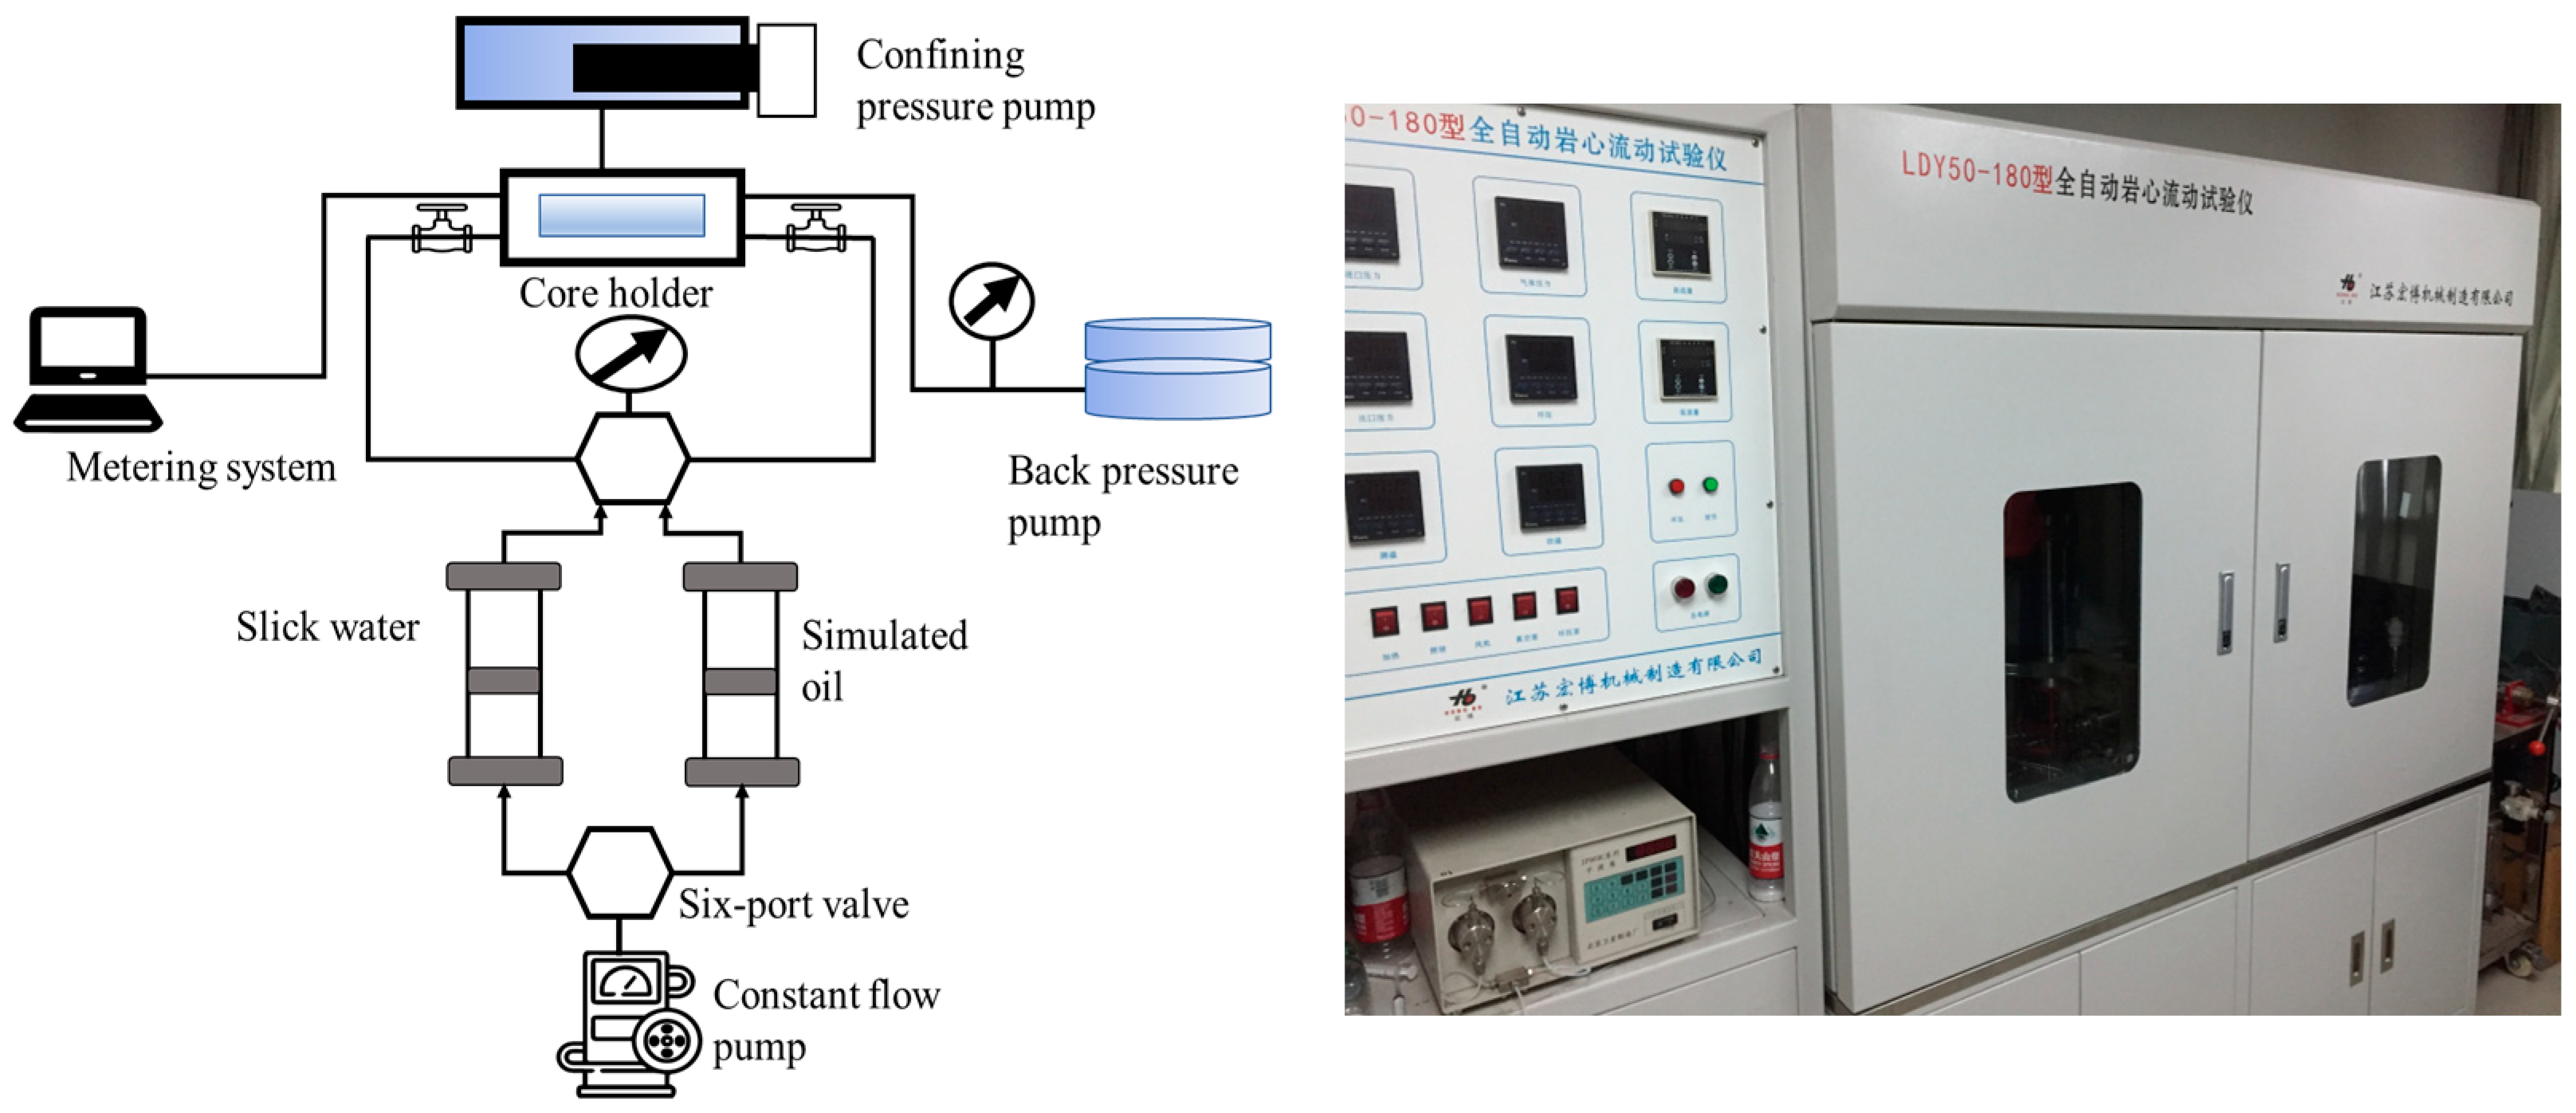
2.1.1. Experimental Apparatus and Material

The actual formation fracture pressure in the fracturing process of low-permeability reservoirs can reach 70 to 90 MPa due to the high in situ stress. In order to satisfy the high-pressure requirements for laboratory experiments, an experimental displacement system with ultra-high temperature and pressure was built.
Figure 1 illustrated the equipment used in the laboratory displacement experiments. A constant flow pump is used to drive fluid into the intermediate container at different speeds, and its maximum flow rate and pressure reach 50 mL/min and 200 MPa, respectively. A core holder is adopted with a maximum pressure of 200 MPa and a test temperature of 200 °C. A back pressure pump with a maximum pressure of 100 MPa is constructed to generate different back pressure at the end of the core holder. The confining pressure pump can provide confining pressure for the core holder to simulate rock pressure with a maximum pressure of 200 MPa. A metering system is employed to record the pressure at both ends of the core holder and the breakthrough time of fluid.
Figure 2 lists the core samples, which are taken from the horizontal section of the well in block X of Xinjiang oilfield. Cylindrical samples with a diameter of 2.5 cm and a length of 5 cm were drilled. The physical properties of the eight cores are shown in Table 1. The experimental fluid adopts simulated oil and slick water. Simulated oil was formulated according to crude oil properties under the reservoir conditions and slick water was prepared by simulating fracturing fluid viscosity with the value 10 mPa·s.

2.1.2. Experimental Procedures

In the process of fracturing construction, the formation pressure gradually increases, and the invasion depth of fracturing fluid in the formation continues to expand. The time when fracturing fluid breaks through the cores is recorded under different differential pressures. The experimental procedures were conducted as follows:
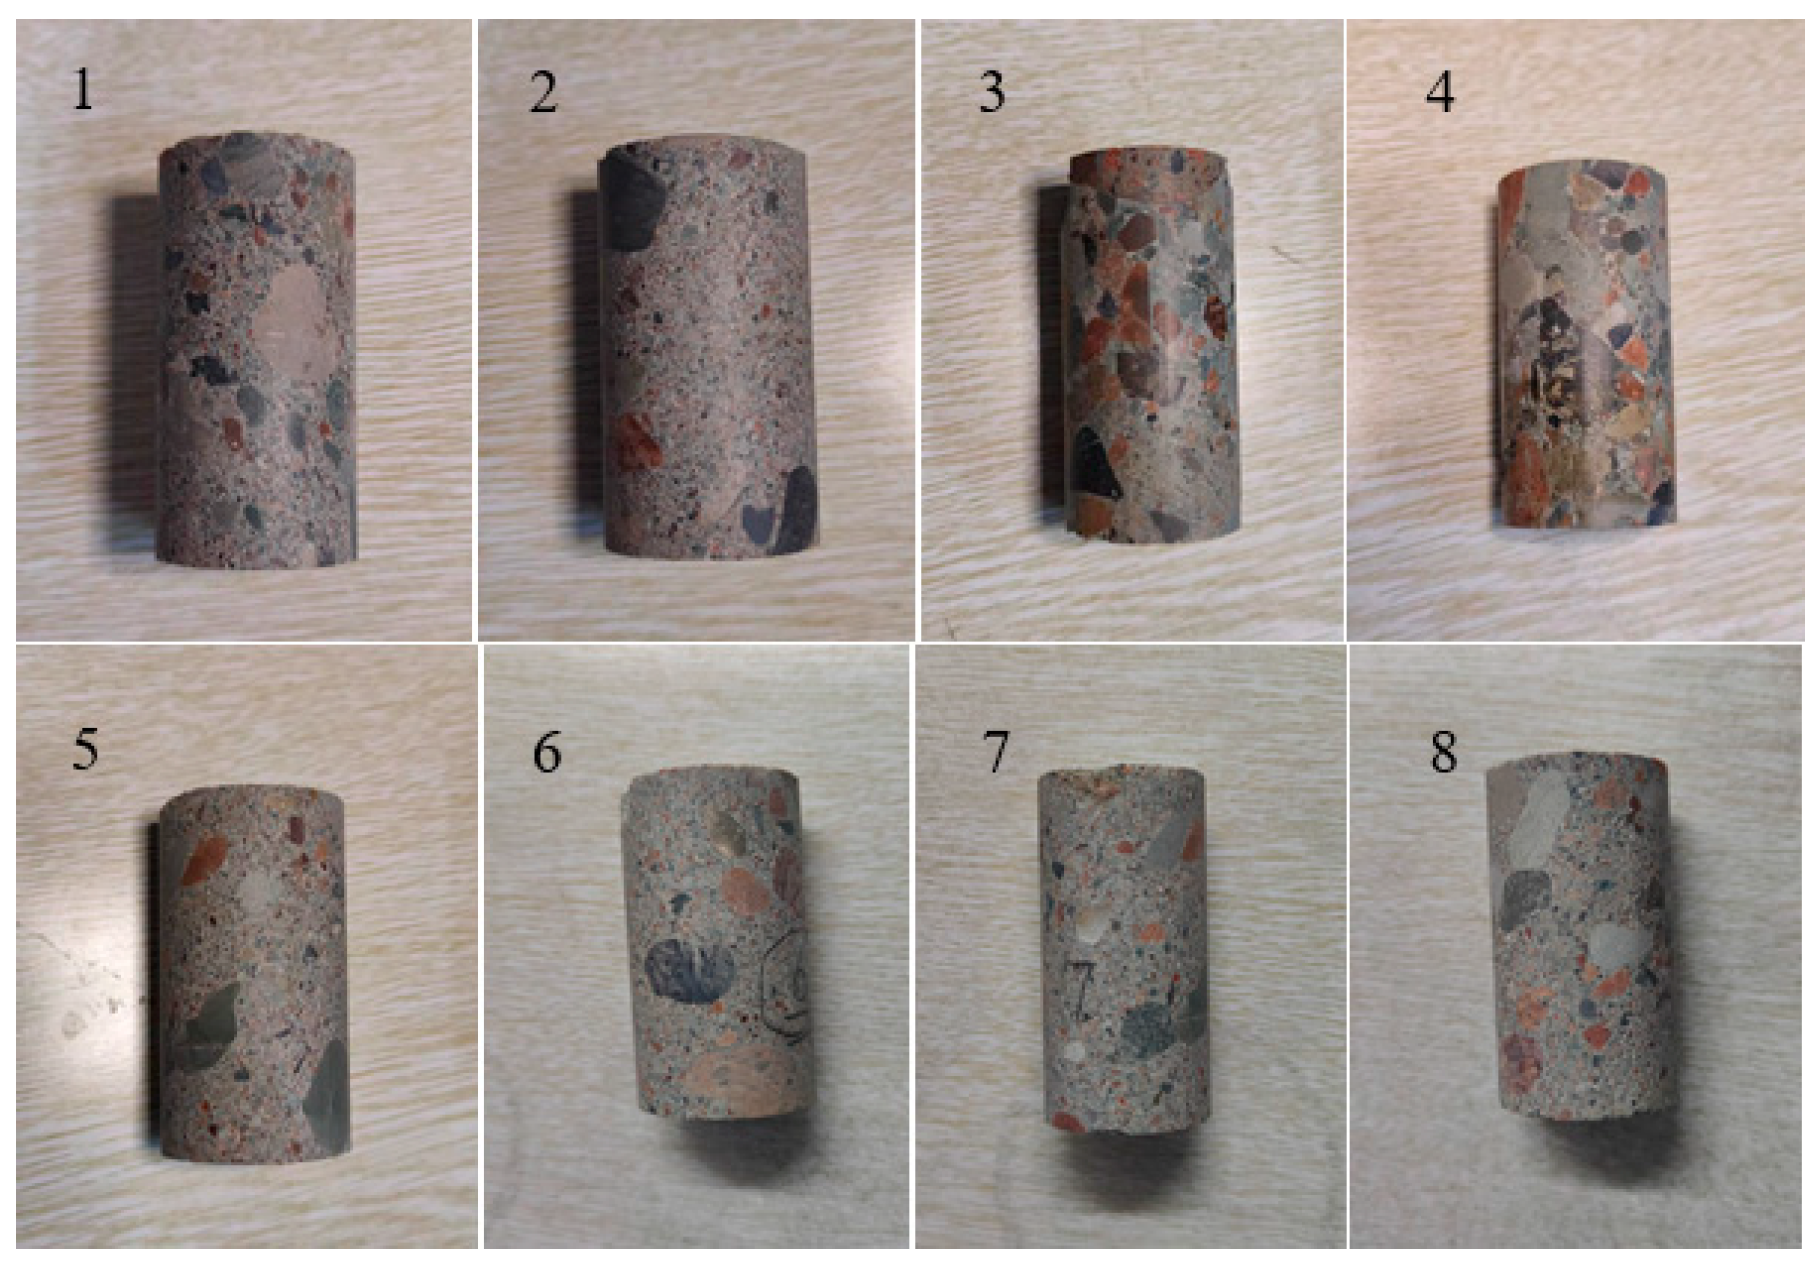
  • The 8 sets of core samples from the block X of Xinjiang oilfield were selected.
  • After washing and drying, the samples were placed into the core holder. The valve at the inlet was shut down, and the outlet was connected to the vacuum pump. The valve at the outlet of the holder was shut down after vacuuming for 24 h, and then the vacuum pump was closed.
  • The core was saturated with oil first at a rate of 0.05 mL/min for 12 h, and then at a rate of 0.1 mL/min for 6 h. The saturation rate was gradually increased and the saturation time was reduced until the core was saturated.
  • Water was injected to initialize the oil saturation similar to the reservoir conditions, and then aging was conducted for 48 h.
  • The confining pressure, the pressure at the inlet, and the pressure of the back pressure pump at the outlet gradually increased. The confining pressure of the core holder should be 2 or 3 MPa higher than the pressure at the inlet.
  • When the pressure at the outlet reaches the designated outlet pressure, the valves at both ends of the holder were kept closed. When slick water was pumped until the pressure reached 70 MPa, the valves at both ends of the holder were open, and breakthrough time was recorded.
  • The procedures above were repeated with the outlet pressure gradually increasing, according to Table 2, and the breakthrough time was recorded.
The experiments were designed using different cores for different pressure differences mainly to prevent the cores from forming dominant water flow channels, and similar experimental cores were selected to avoid other differences. The experiments mainly investigated the invasion depth of cores under high-pressure differences, so the same slick water was provided without considering the influence of fracturing fluid. At the same time, the composition interaction of the slick water with the gravel core can be ignored in the experiments.

2.2. Mathematical Models

Due to the difference between core size, fracture size, and the short experiment time, the pressure distribution at both ends of the core fails to fully characterize the actual situation of invasion into deeper formation and along the fracture. The well-known Carters leak-off model [39]—of which the revised version is commonly used in 2D and even 3D simulations of hydraulic fracturing [40]—is mostly used when the fracture shape is formed. In the fracturing process, the fracture can have different lengths in each time step; therefore, it is necessary to establish a mathematical model to describe the two-dimensional filtration of fracturing fluid. This proposed model can reasonably predict the invasion depth of fracturing fluid under different pressure differences.

2.2.1. Model Assumptions

In the process of fracturing, the fracturing fluid is continuously injected into the formation along the fracture with high pressure. Part of the fracturing fluid injected is remained in the fracture volume, while the other part is filtrated into the formation around the fracture. With the MHFHWs, stress shadow and perforation erosion are two key effects involved, particularly when proppants are pumped at high injection rates during the development of unconventional reservoirs [41,42]. Both effects lead to non-uniform distribution of fracturing fluid among clusters [43,44], and the proposed work is simplified to some extent. Multiple fractures are not fractured simultaneously but one after the other, and we simply investigate one cluster in each stage with a large fracture spacing of 34 m, so the stress shadow and perforation erosion were negligible. Based on the theories of rock mechanics and fluid mechanics, the injection volume of the fracturing fluid is equal to the filtration volume of the fracturing fluid plus the volume change of the fracture. Material balance of fracturing fluid injection, considering the two-dimensional filtration of fracturing fluid, is built with the following assumptions:
  • Injection rate of fracturing fluid is set as 5 m3/min for each cluster during fracturing.
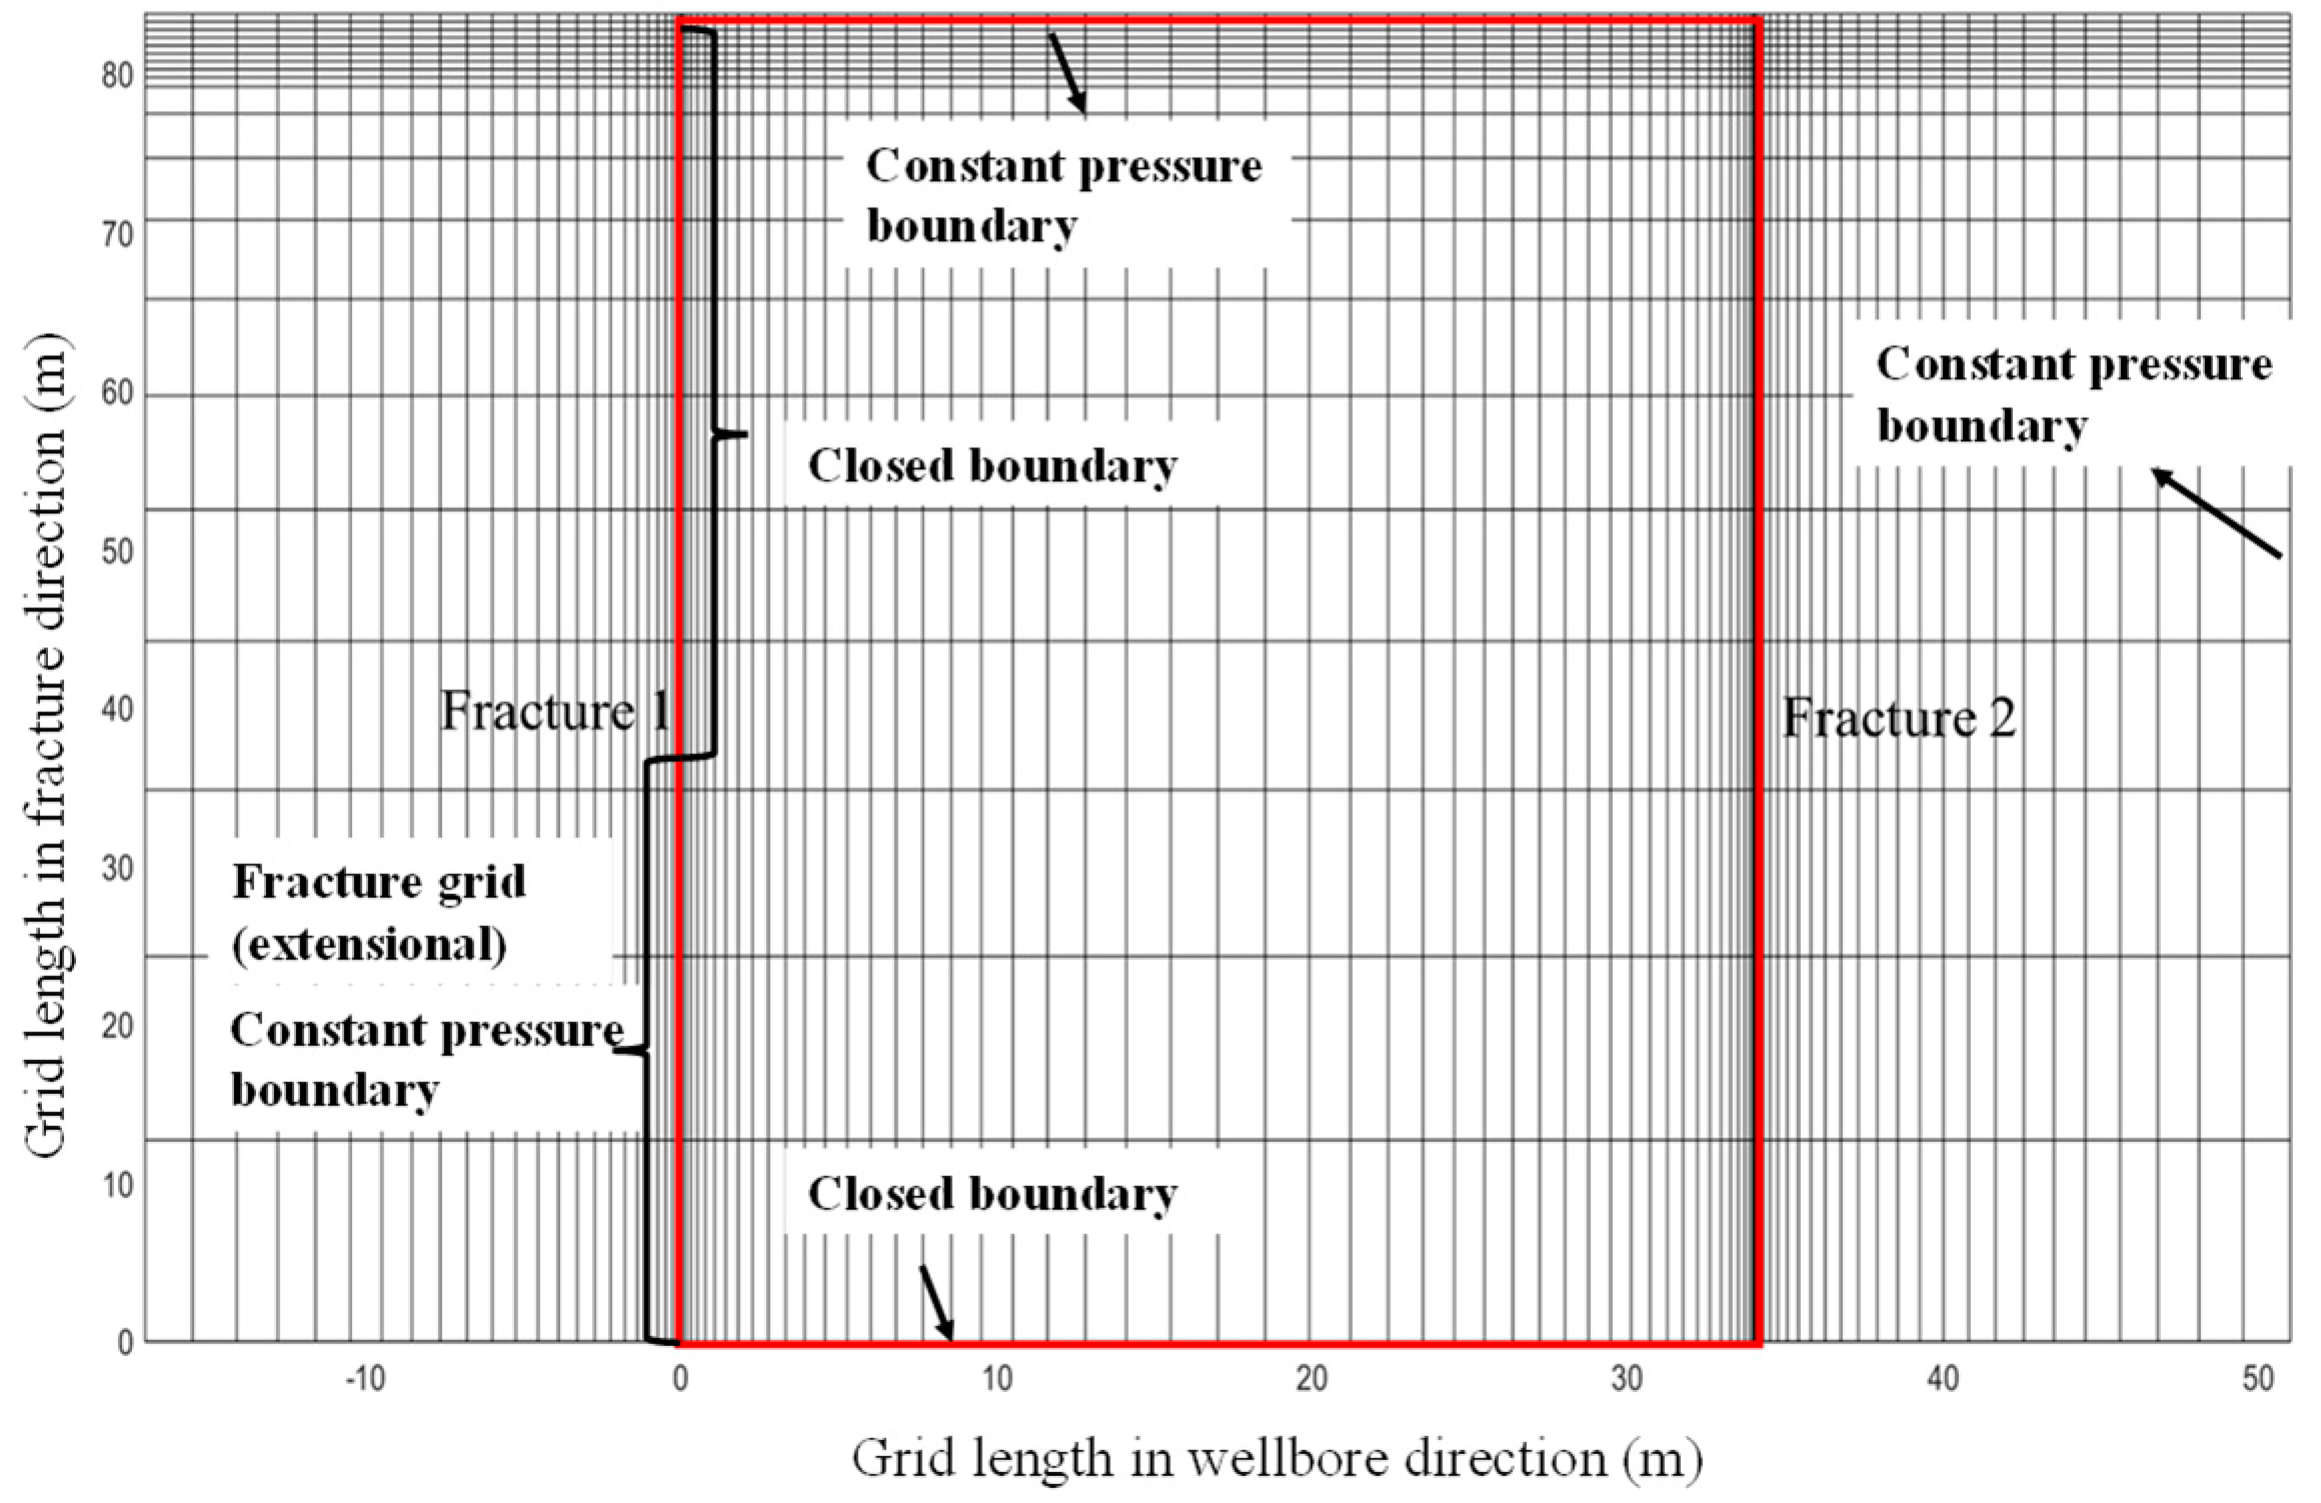
  • Grids are divided into two ways. The grid length in the fracture direction (y direction) adopts a decreasing sequence, whereas the grid length in the horizontal well direction (x direction) is refined around the fracture. As shown in Figure 3, inside the red box is the grid division between two fractures.
  • The fracture pressure is assumed as constant during the fracturing process, and the pressure of the grid near the fracture is equal to the fracture pressure.
  • The fracture expands forward by one grid every 6 min. At every time step, the pressure differences and invasion depth can be calculated.
The proposed model simulates fracture growth by setting the pressure in the fracture grid to constant pressure at each time step. The fracture grid flows as a source to the formation and the fracture grid expands over the fracturing time. The mesh is generated based on the known fracture length and we assume the fracture growing one grid with a proper time step. To simulate the gradual extension of the fracture, the fracture grows according to fracture length and fracturing time with decreasing extension length.

2.2.2. Two-Dimensional Filtration Model of Fracturing Fluid

According to the continuity equation and Darcy’s law [45], the differential equation of fracturing fluid filtration is derived as follows:
[ k d μ ( P - G ) ] + q = C f φ P t
For a quarter of the reservoir model, the outer boundary conditions can be described as closed outer boundary conditions, as shown in Figure 3. The bottom edge parallel to the horizontal well and the left edge that the fracture has not stimulated follows closed boundary conditions [33]:
P y y = 0 = 0 ;   P x x = 0 = 0
and constant pressure outer boundary conditions like the fracture boundary and the top edge as well as the right edge illustrated in Figure 3 are expressed as [38]:
P | y = L y = P i ;   P x = L x = P i
The inner boundary condition and initial condition are written as:
P x l f = P f ( y = 0 )
P t = 0 = P i
The two-dimensional single-phase fluid flow can be written as:
x k d μ ( P x G ) + y k d μ ( P y G ) + q = C f φ P t
and the discretized form is expressed as:
T x , i + 1 / 2 P i + 1 , j n + 1 P i , j n + 1 T x , i 1 2 P i , j n + 1 P i 1 , j n + 1 + T y , j + 1 2 P i , j + 1 n + 1 P i , j n + 1 + T y , j 1 2 P i , j n + 1 P i , j 1 n + 1 + Q v i , j = V p i , j C f Δ t P i , j n + 1 P i , j n .
where, T x , i ± 1 / 2 = k d μ i ± 1 / 2 , j Δ y i h / Δ x i ± 1 / 2 and T y , j ± 1 / 2 = k d μ i , j ± 1 / 2 Δ x i h / Δ y j ± 1 / 2 are defined as the conductivity coefficient of fluid in x and y directions, respectively.
The five diagonal equations composed of differential equations and additional conditions are solved, and the pressure of each grid is obtained using strongly implicit method. The filtration velocity with pressure difference is calculated as:
υ i = k d μ ( P f P i , 1 Δ y 1 G )
and then the fracturing fluid leak-off can be expressed as:
q = 4 i = 0 m k d μ P f P i , 1 Δ y 1 l x i h
Therefore, the total leak-off is derived as:
V l o s s n = V l o s s n 1 + 4 i = 0 m k d μ P f P i , 1 Δ y 1 l x i h
where, φ is rock porosity; µ stands for the viscosity of the fracturing fluid, Pa·s; Pi and Pf denote original formation pressure and fracture pressure, respectively, Pa; Cf indicates rock comprehensive compression coefficient, Pa−1; Δy1 is grid length of the first row in y direction, m; G is the threshold pressure gradient, Pa/m; V l o s s n indicates leak-off volume at time n, m3; m is the number of crack grids; h stands for leak-off height for fracturing fluid, m; kd is formation permeability, m2; and lxi indicates the length of the ith grid in the crack direction, m.
In the two-dimensional filtration model of fracturing fluid, as the fracturing operation progresses, the grid pressure near the fracture also gradually increases. The total time T is divided into N time step with a tiny time period, Δt. Within each time step, pressure distribution will be calculated according to the differential equation of injected fracturing fluid. Formation pressure with new distribution is adopted and fracture pressure Pf is reassigned in grid Y = 1 in a new step. The formation pressure distribution after fracturing and the invasion depth are obtained with iterative calculation. Detailed procedures are listed in Figure 4.

3. Results and Discussions

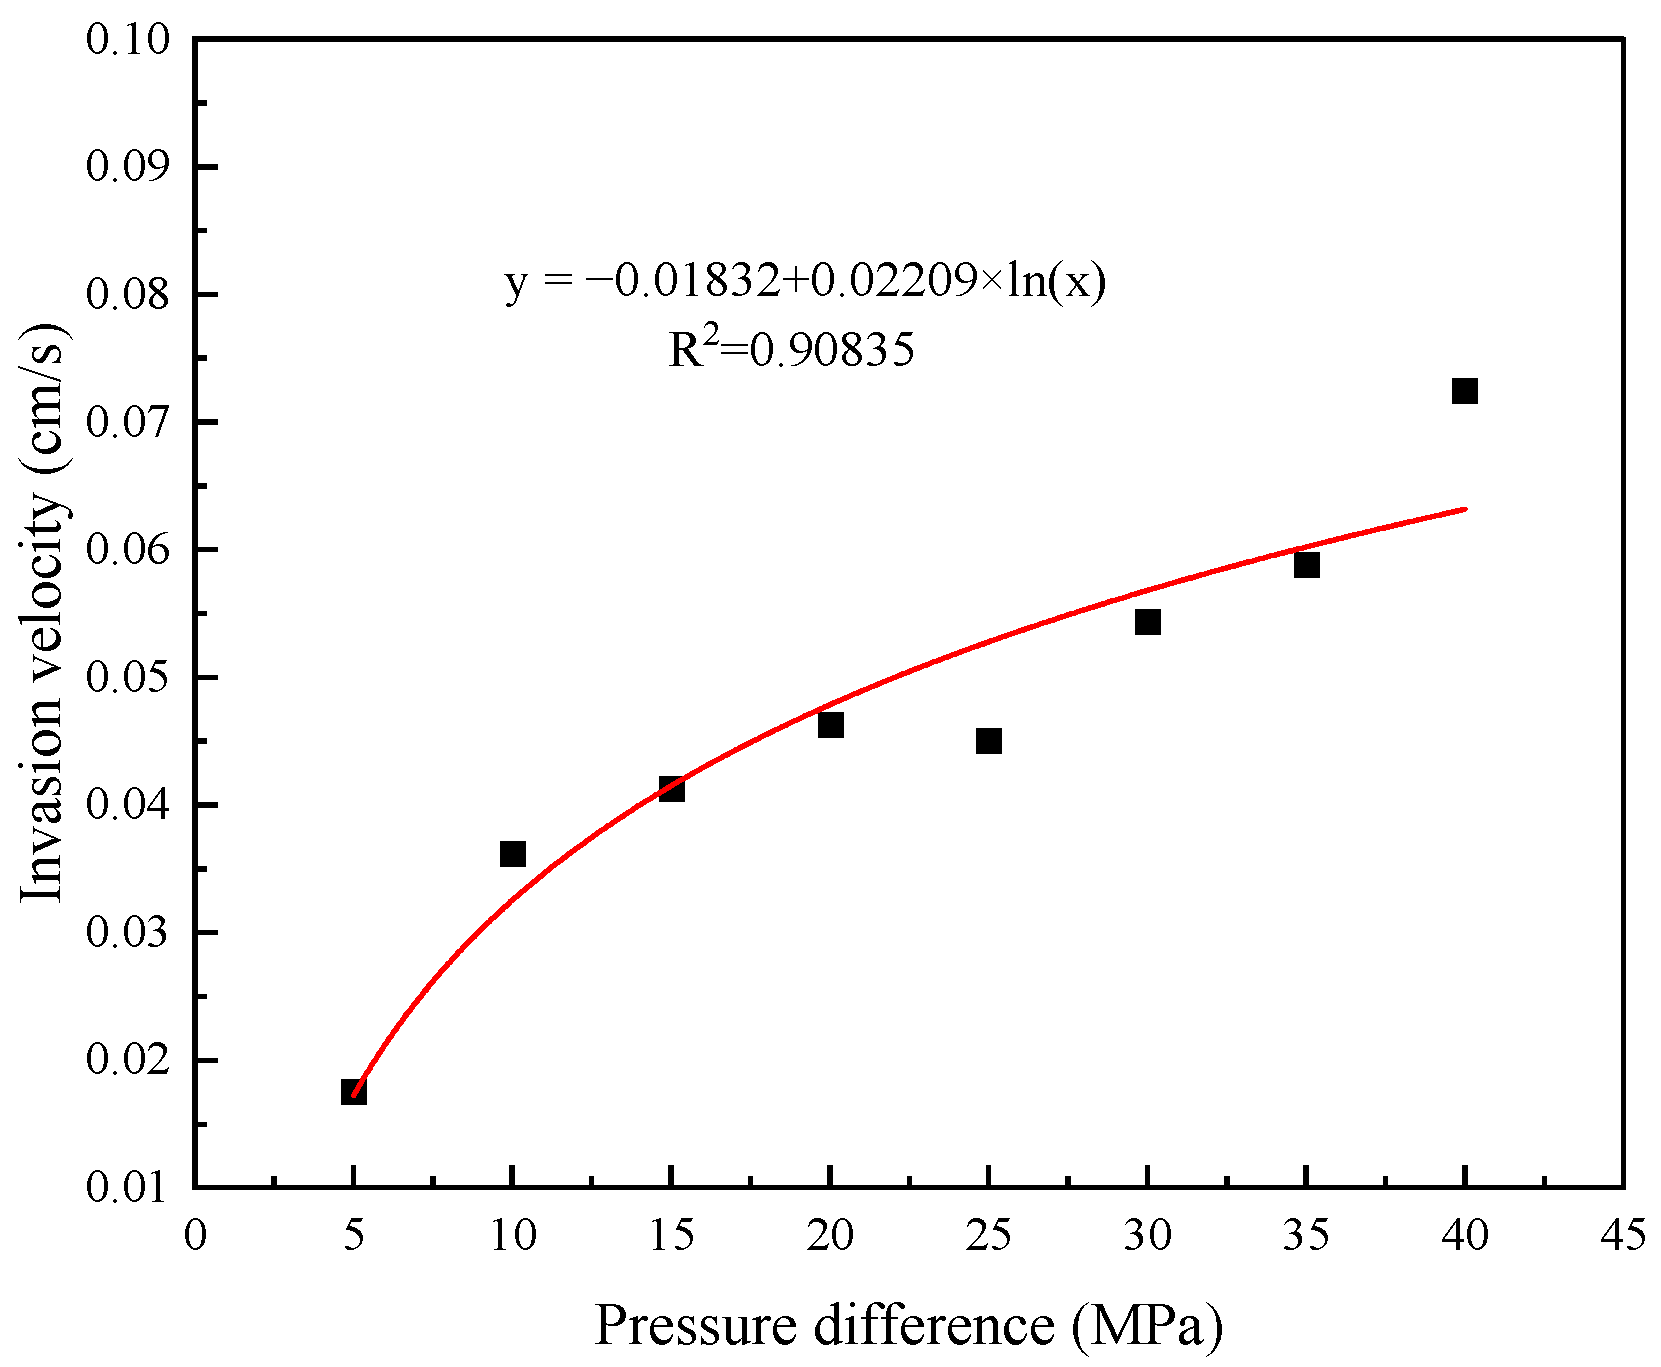
3.1. Experimental Results

The breakthrough time and invasion velocity of fracturing fluid is recorded, as shown in Table 3. The inlet pressure is fixed at 70 MPa for each core, and the outlet pressure changes. Since the length of the experimental core is 5 cm, the invasion velocity under different experimental pressure differences can be calculated. With the designated pressure difference of 40 MPa, 35 MPa, 30 MPa, 25 MPa, 20 MPa, 15 MPa, 10 MPa, and 5 MPa, the breakthrough time varies from 69 to 285 s, and the invasion velocity from 0.017 to 0.072 cm/s. Results indicate that the larger experimental pressure difference leads to a shorter breakthrough time and a higher velocity. Within the designated pressure difference, the fracturing fluid invasion velocity has a smaller variation range.

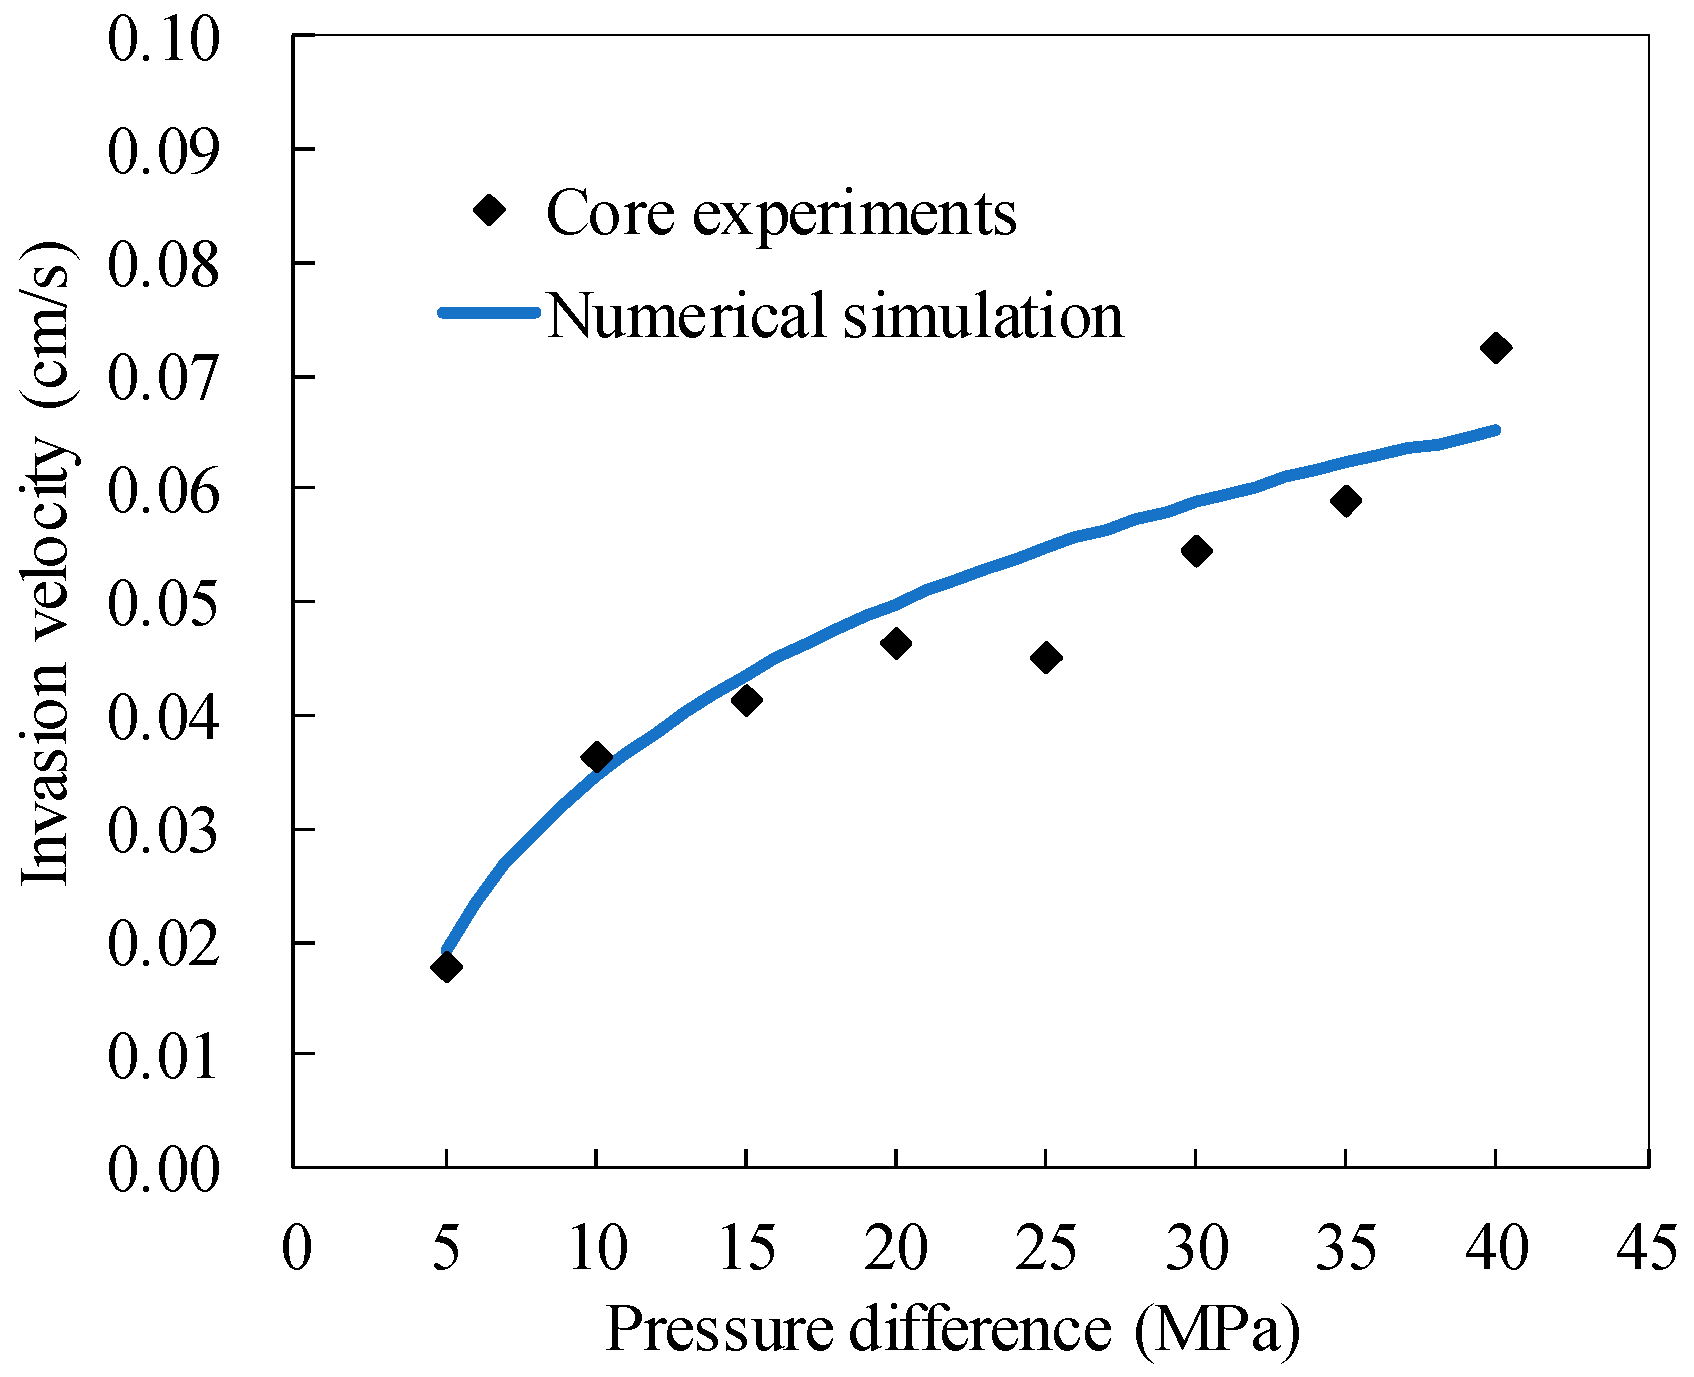
3.2. Model Validation

The basic parameters of well X-1 in block X of Xinjiang oilfield are selected, as listed in Table 4. Hydraulic fracturing with multistage was applied in this well and there are two clusters in this section. The fracture half-length is 80 m and the distance between clusters is 34 m. A grid model of the formation around the fracture was generated considering these parameters. Grids in the horizontal well direction are divided symmetrically since two clusters of fractures are fracturing at the same time. The closer the distance to the fracture, the greater the pressure gradient. The grid length increases sequentially from fracture to inter-clusters. In the fracture direction, the fractures expand outwards and the decreasing grid length is adopted. Twenty grids are divided along the fracture direction and fifty grids in the horizontal well direction, resulting in a thousand grids in total.
Based on the established grid model and two-dimensional filtration model of fracturing fluid, the numerical simulation for invasion velocity under different pressure differences in well X-1 was investigated, and the pressure difference corresponding to the experiments ranging from 5 MPa to 40 MPa in intervals of 1 MPa was adopted. As depicted in Figure 5, the numerical results show good agreement with the experimental data, and the root-mean-squared error (RMSE) of the numerical results corresponding to the experimental data was calculated, resulting in a value of 0.0053. It can be seen from the figure that the error of the numerical results is relatively small and the model has high stability, indicating that the proposed mathematical model can well predict the invasion velocity of the fracturing fluid, and further invasion depth and invasion volume in MHFHWs can be calculated with the established model.
Furthermore, the calculated flow velocity is between 0.02 cm/s and 0.07 cm/s. Compared to values given by Yi and Peden [46] and Li et al. [24], which range from 1 × 10⁻³ m/min to 2 × 10⁻³ m/min and 2 × 10⁻⁵ m/min to 5 × 10⁻⁵ m/min, respectively, the leak-off velocity in this paper is several orders of magnitude larger. This large difference could be due to two main reasons as low fracturing fluid viscosity and high-pressure difference. The fracturing fluid viscosity in our experiment was 10 mPa·s, and in the study by Li et al. [24] was 400 mPa·s. Pressure differences were almost 2.069 MPa and 6 MPa in the two studies, which reached up to 40 MPa in this work. The difference of the two parameters made it reasonable as the velocity has a negative correlation with the viscosity and a positive with the pressure difference.

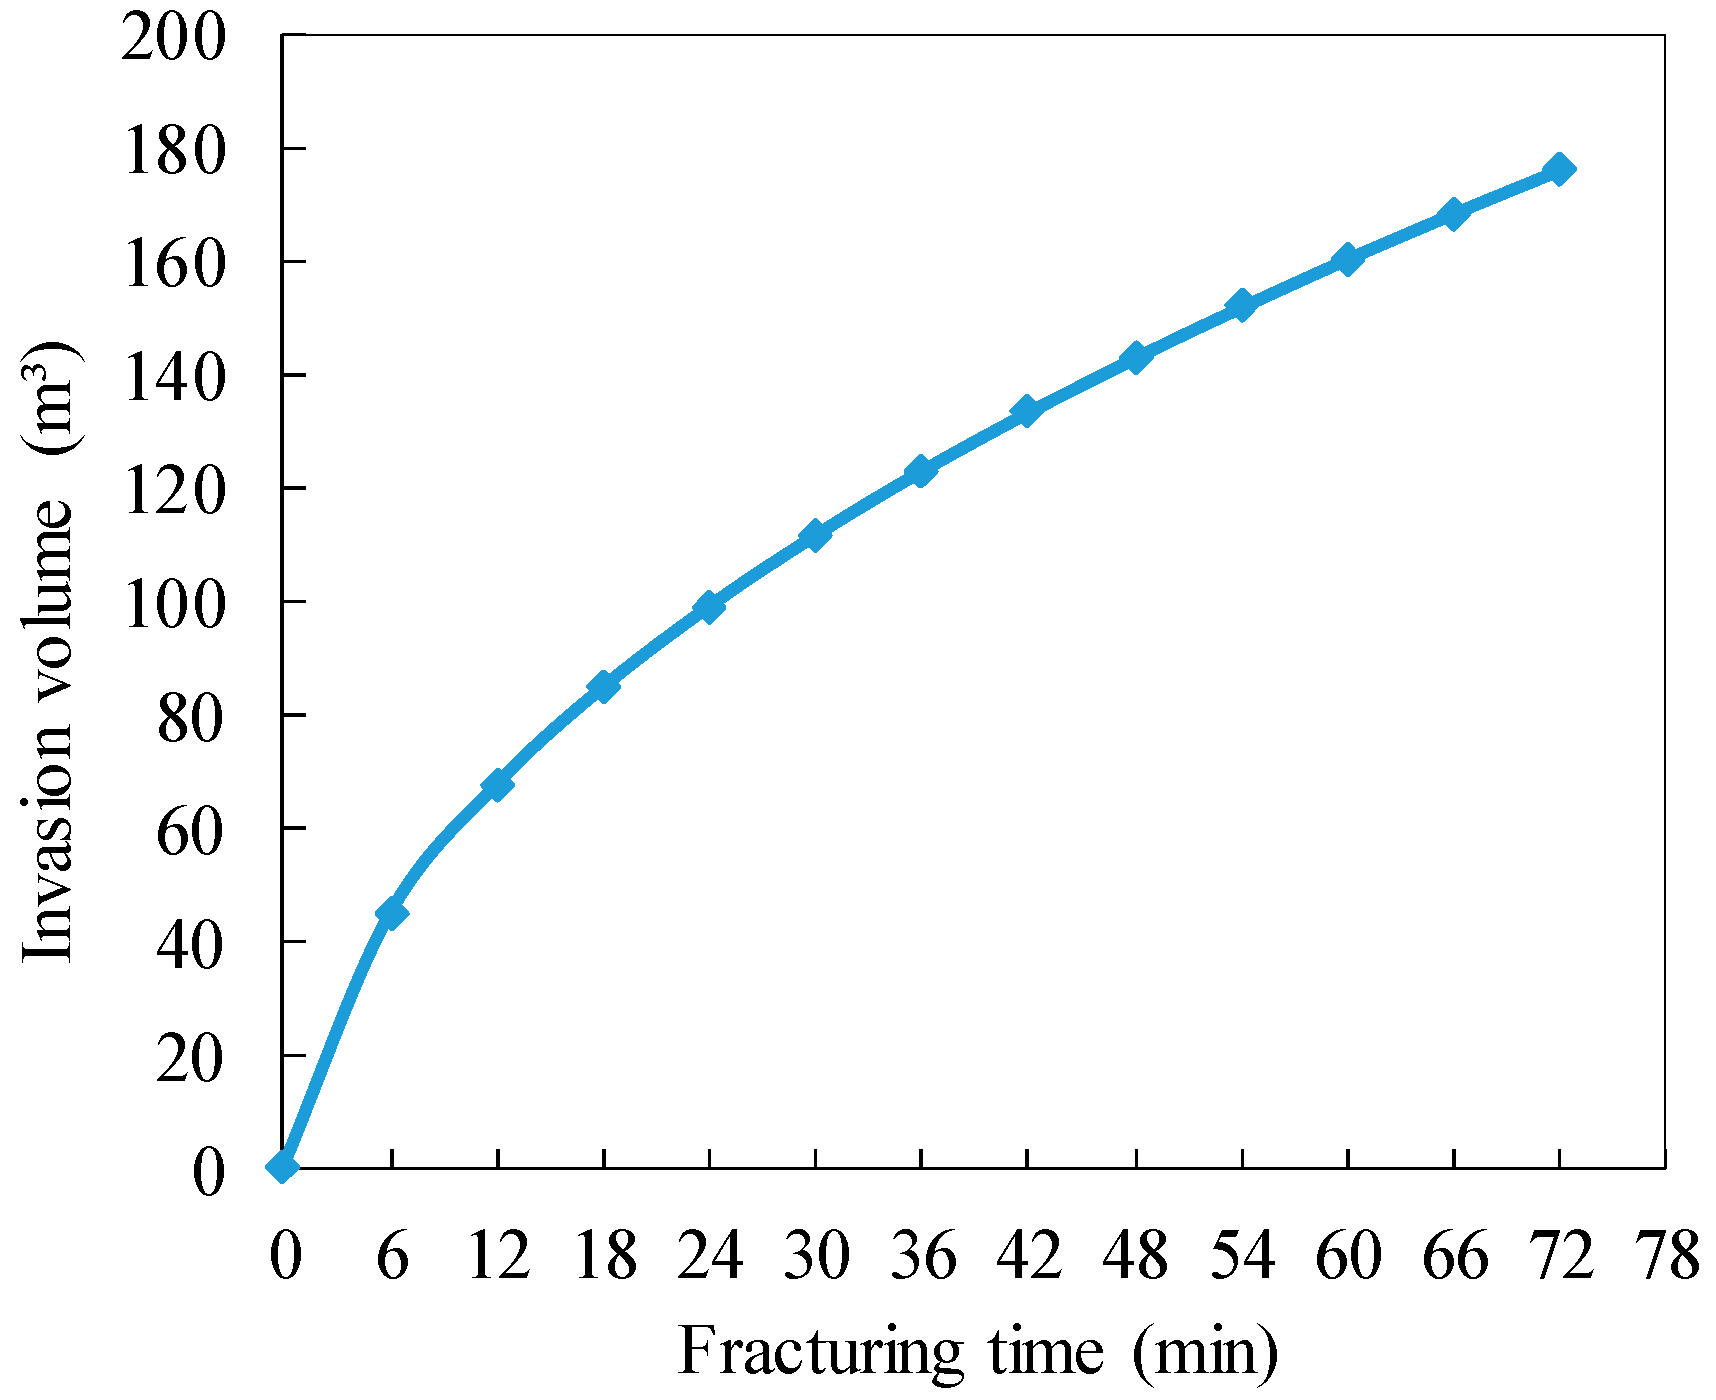
3.3. Invasion Depth and Invasion Volume

Invasion depth and invasion volume of fracturing fluid can also be estimated with invasion velocity obtained by experiments. We noticed that the invasion velocity at a pressure difference of 25 MPa is lower than that at 20 MPa and 30 MPa, and one of the reasons is that the permeability of the core is smaller compared to other cores. The relationship between invasion velocity and pressure difference is fitted in Figure 6, which is expressed as:
v = 0.01832 + 0.02209 × l n Δ P ,   R 2 = 0.90835
The differential pressure ΔP changes over time because pressure distribution differs in each time step, and the functional relationship between velocity and differential pressure can be noted as:
v = f ( Δ P )
In order to obtain the invasion depth, integral calculus is made with invasion time and invasion velocity, and the invasion depth is calculated as an integral formula:
S = v d t = f ( Δ P ) d t
In the two-dimensional filtration model of fracturing fluid, filtration occurred at overall fracture height, whereby the invasion time can be calculated as a cuboid. Therefore, invasion volume is determined as:
V = S × L f × h f × ϕ
where, Lf is fracture length, m; hf is fracture height; and ϕ is porosity.
The fracturing time is set as 72 min, and during this period, the fracturing fluid gradually invades into the formation with an initial differential pressure of 30 MPa, leading to the variation of invasion depth. As shown in Figure 7, the invasion depth reaches 1.516 m at the end of 72 min when calculated by core experiments. We use the invasion velocity to further calculate invasion depth with the proposed model, and the invasion depth at the end of fracturing is about 1.434 m. The relative error between the simulation results and experimental data is 5.41%, and the deviation of length is within 0.1 m. It also illustrates that the mathematical model can reasonably describe and evaluate the invasion depth of fracturing fluid in a single fracture, which can provide a useful reference for the subsequent well shut-in and flowback production.
The invasion volume is another parameter for evaluating the leak-off of fracturing fluid, which is expressed as the product of invasion depth, fracture cross-section, and porosity. The fracture half-length and fracture height in well X-1 is designed as 80 m and 8 m, respectively. Therefore, the invasion volume at different fracturing time is determined using Equation (12), as shown in Figure 8. At the end of 72 min, the calculated invasion volume is about 175.89 m3.

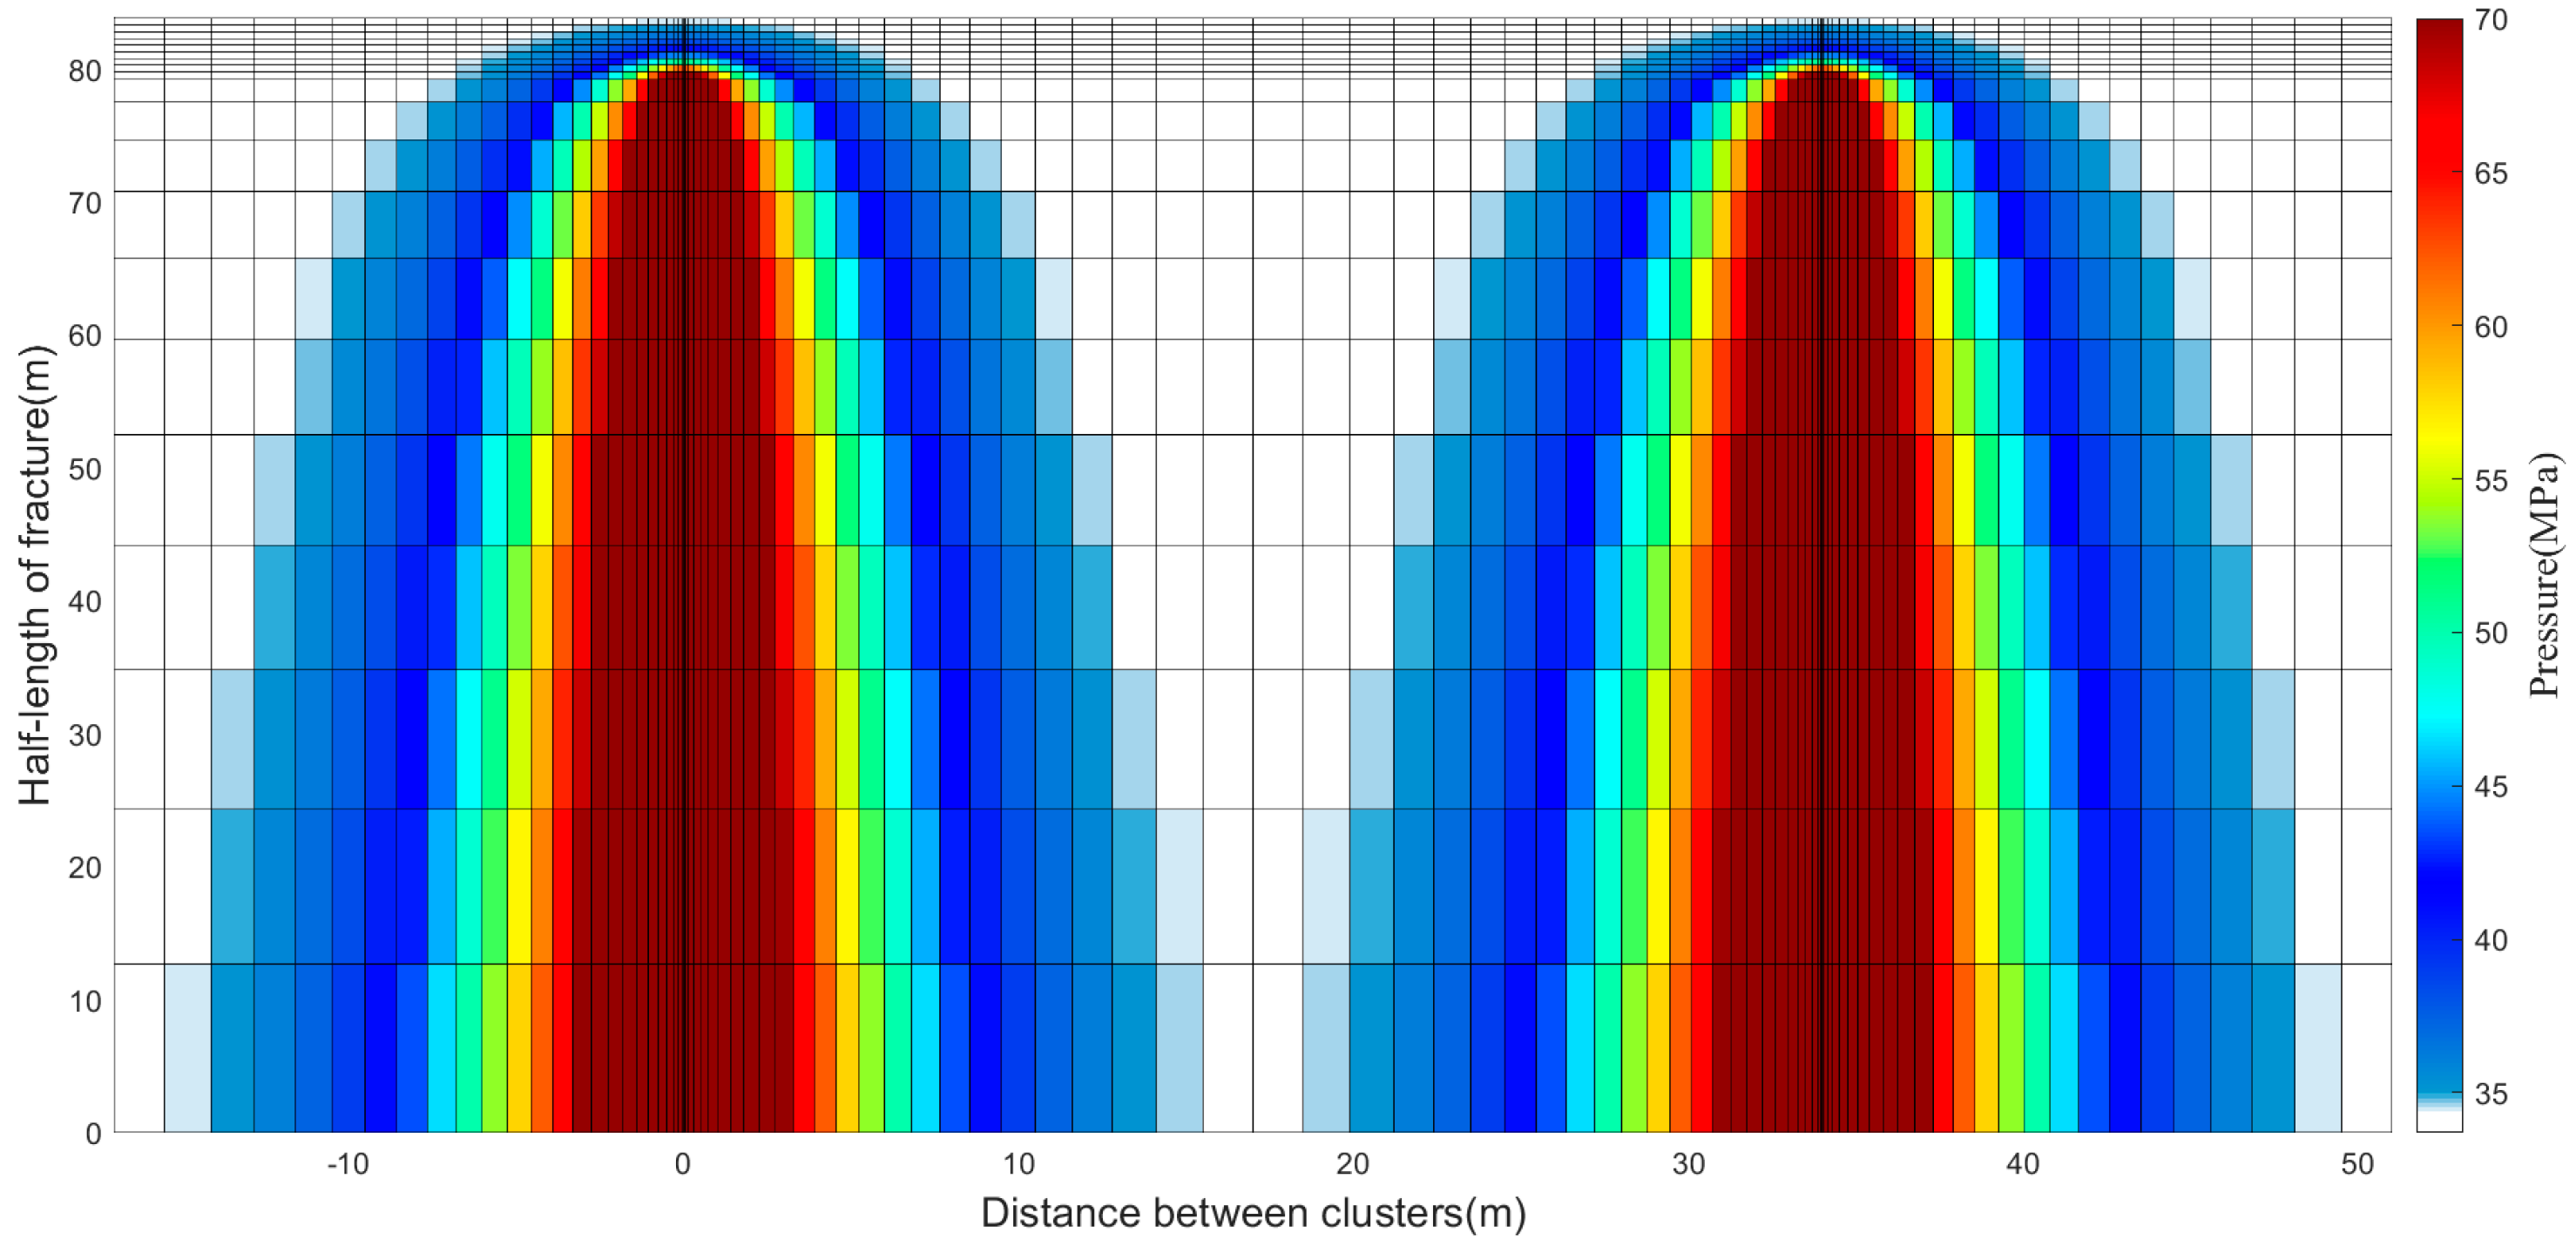
3.4. Pressure Change around Hydraulic Fractures

As the fracture continues to expand forward, the pressure gradually propagates outward along the fracture and on both sides. After fracturing, the inter-cluster pressure changes greatly and the pressure disturbance will spread to the whole inter-cluster region during the injection process when the distance between clusters become small. With the proposed two-dimensional filtration model, the pressure distribution near the fracture can be drawn.
As shown in Figure 9, when the fracture pressure is set as 70 MPa and the original reservoir pressure is 35 MPa, in the case of the simultaneous fracturing of two clusters in a section, the energy is transmitted to the formation and the pressure near the fracture increases. The distance between the two clusters is large enough and, therefore, the pressure disturbance does not overlap. Note that the pressure distribution is different from the fracturing fluid filtrate distribution, the pressure propagation covers the area between clusters, and the pressure distribution is symmetrical on both sides.

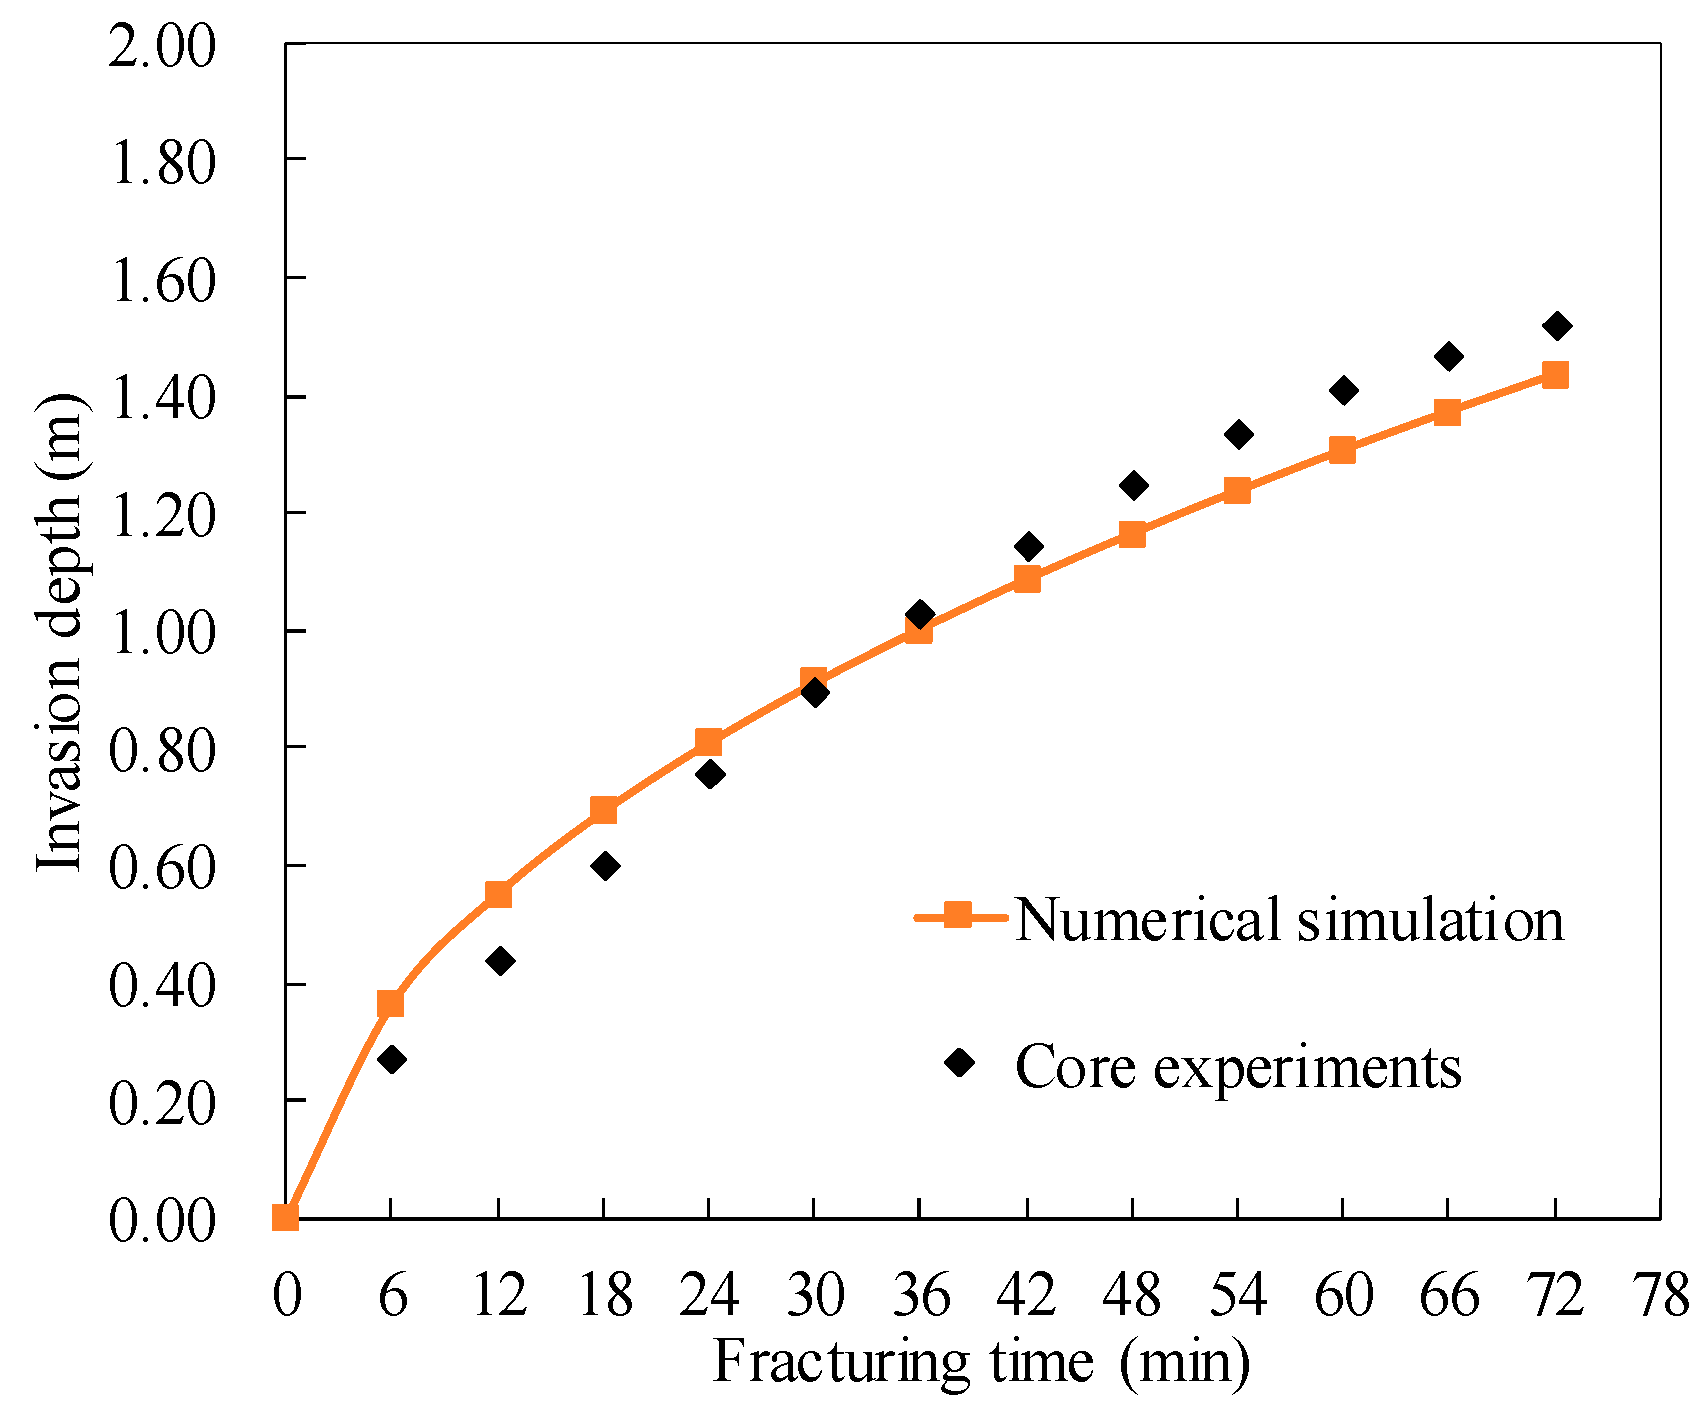
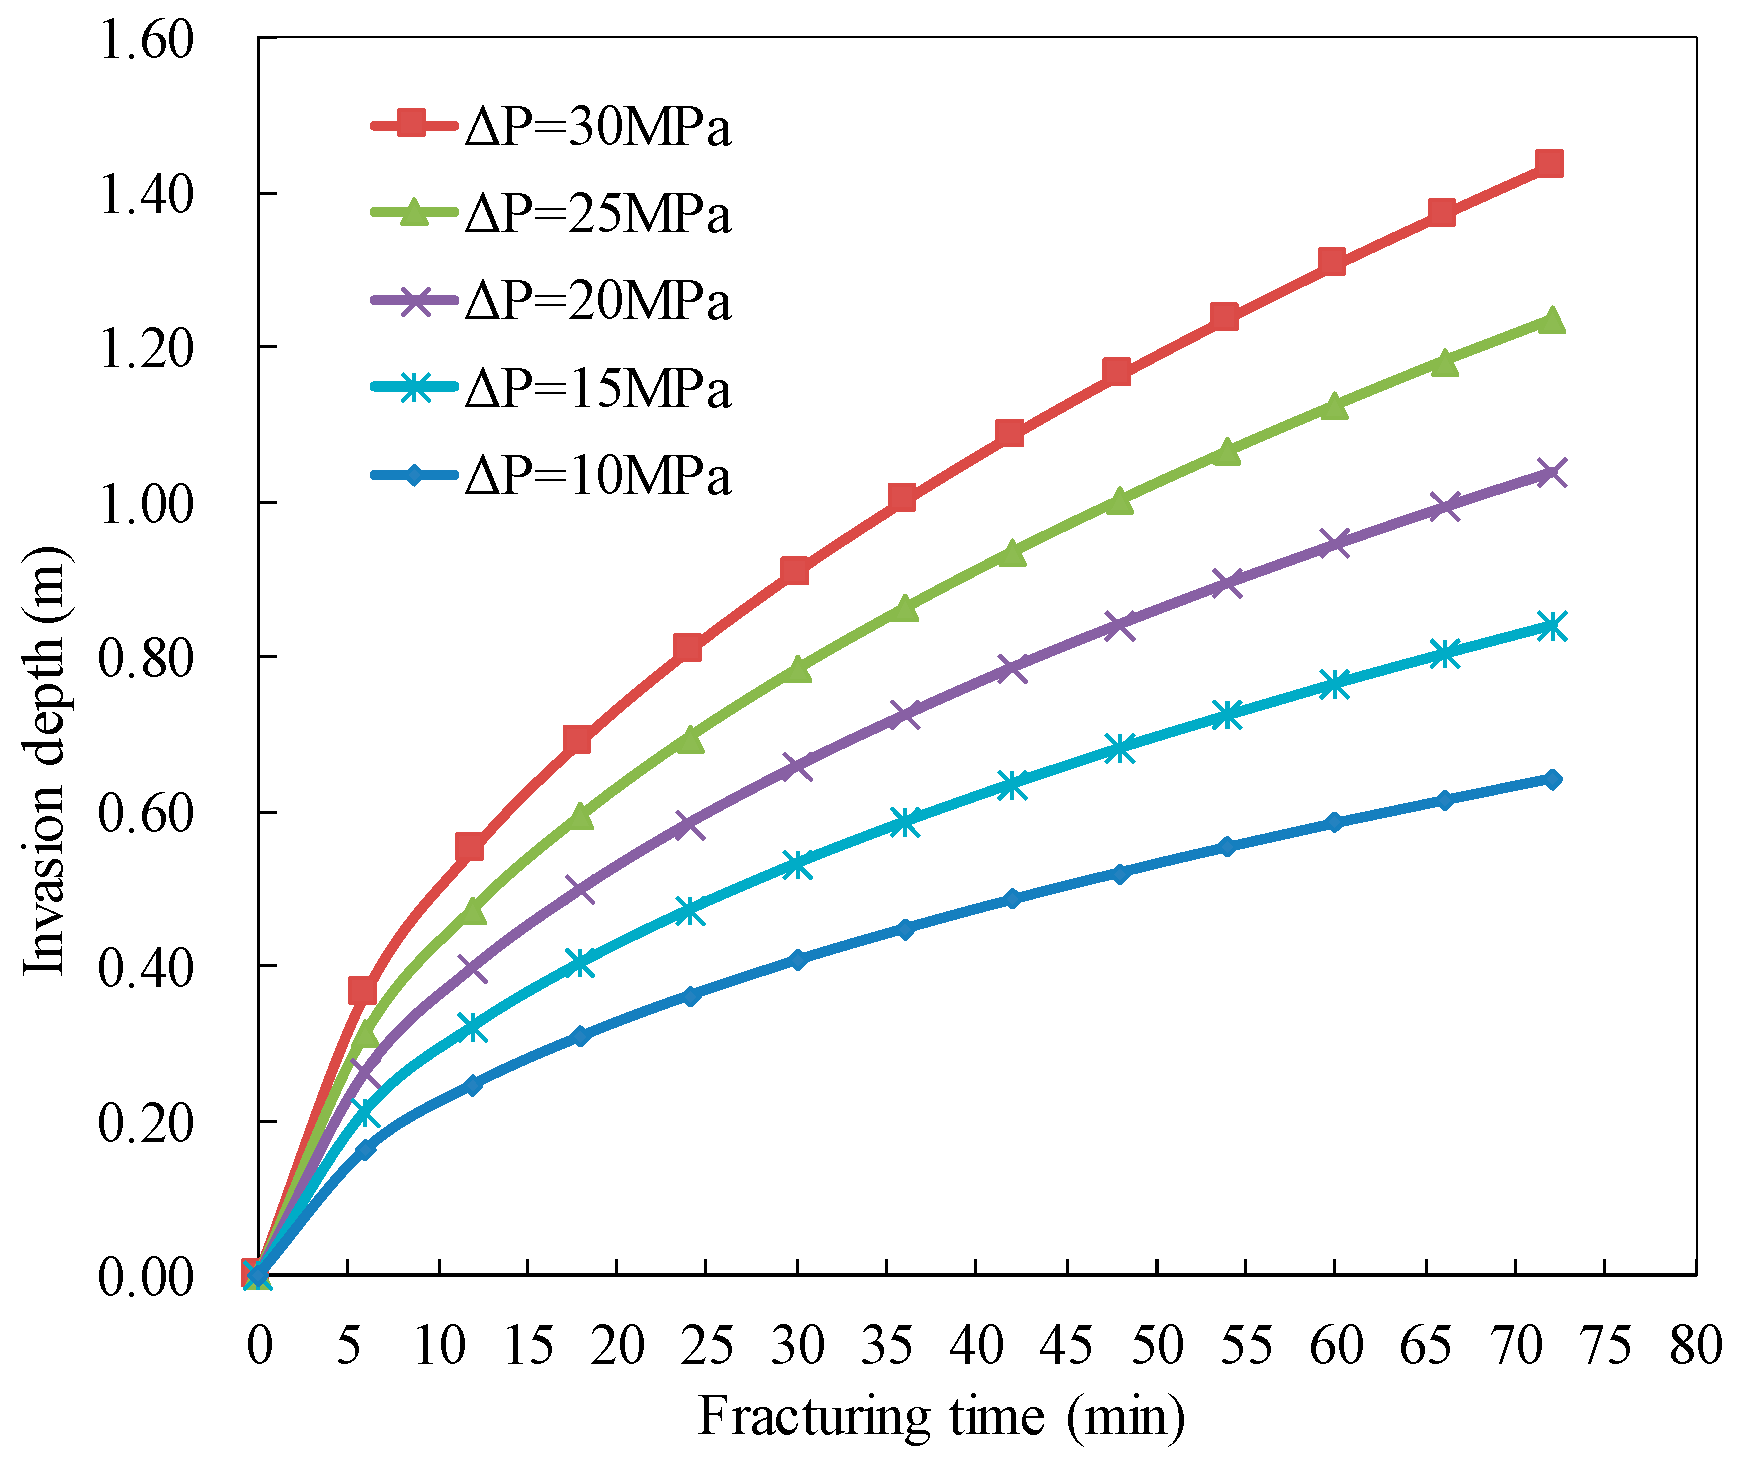
3.5. Invasion Depth with Fracturing Time

The invasion depth under different differential pressure (30 MPa, 25 MPa, 20 MPa, 15 MPa, and 10 MPa) during the fracturing process is calculated. Figure 10 provides the invasion depth at different fracturing times. The invasion depth gradually increases with the fracturing time. In the early stage, the invasion velocity is large, but the increment slows down in the later stage. As shown, a larger pressure difference results in a longer invasion depth at the same fracturing time. When the initial pressure difference is 30 MPa, the invasion depth of the fracturing fluid is about 1.434 m at the end of 72 min of fracturing. When the initial pressure difference drops to 25 MPa, 20 MPa, 15 MPa, and 10 MPa, the invasion depths during the fracturing process reduce to 1.237 m, 1.039 m, 0.841 m, and 0.643 m, respectively.
In hydraulic fracturing, 26 stages were designed for well X-1, and the distances between the stages are within 28–87 m. The proposed mathematical method is used to estimate the invasion depth data of all stages in the horizontal well fracturing. Since the initial pressure of the fracturing stage is affected by the change of the formation pressure in the previous stage of fracturing, the formation pressure after fracturing the previous stage is assigned to the next stage for pressure calculation, and the invasion depth of the fracturing fluid of each stage is various. As listed in Table 5, the invasion depth range of each stage is between 1.158–1.434 m, and the average invasion depth of the later fracturing stages is smaller. The total invasion volume of all fracturing stages is calculated to be 21,560.05 m3, while the actual total fluid volume entering the well is 24,019.6 m3 during the fracturing process, indicating that most of the fracturing fluid is filtrated into the formation.

4. Conclusions

This paper proposed a mathematical model with experimental validation for evaluating the invasion of fracturing fluids. The core samples and operational data of multistage fracturing horizontal wells from block X of Xinjiang oilfield are selected. The conclusions can be drawn as follows:
  • Eight groups of displacement experiments under different pressure differences were conducted under high pressure, indicating that a larger experimental pressure difference leads to shorter breakthrough time and higher velocity.
  • A mathematical model for evaluating the invasion depth was developed and the calculated results of invasion velocity show good agreement with experimental data, illustrating the accuracy of the mathematical model, and further invasion depth in MHFHWs can be calculated.
  • Within 72 min of the fracturing time with an initial differential pressure of 30 MPa, the invasion depth reaches 1.516 m using the core experiments, and it is about 1.434 m with the proposed mathematical model. The error is within 0.1 m, and the invasion volume is further calculated by the invasion depth, which is about 175.89 m3 on one side of the fracture.
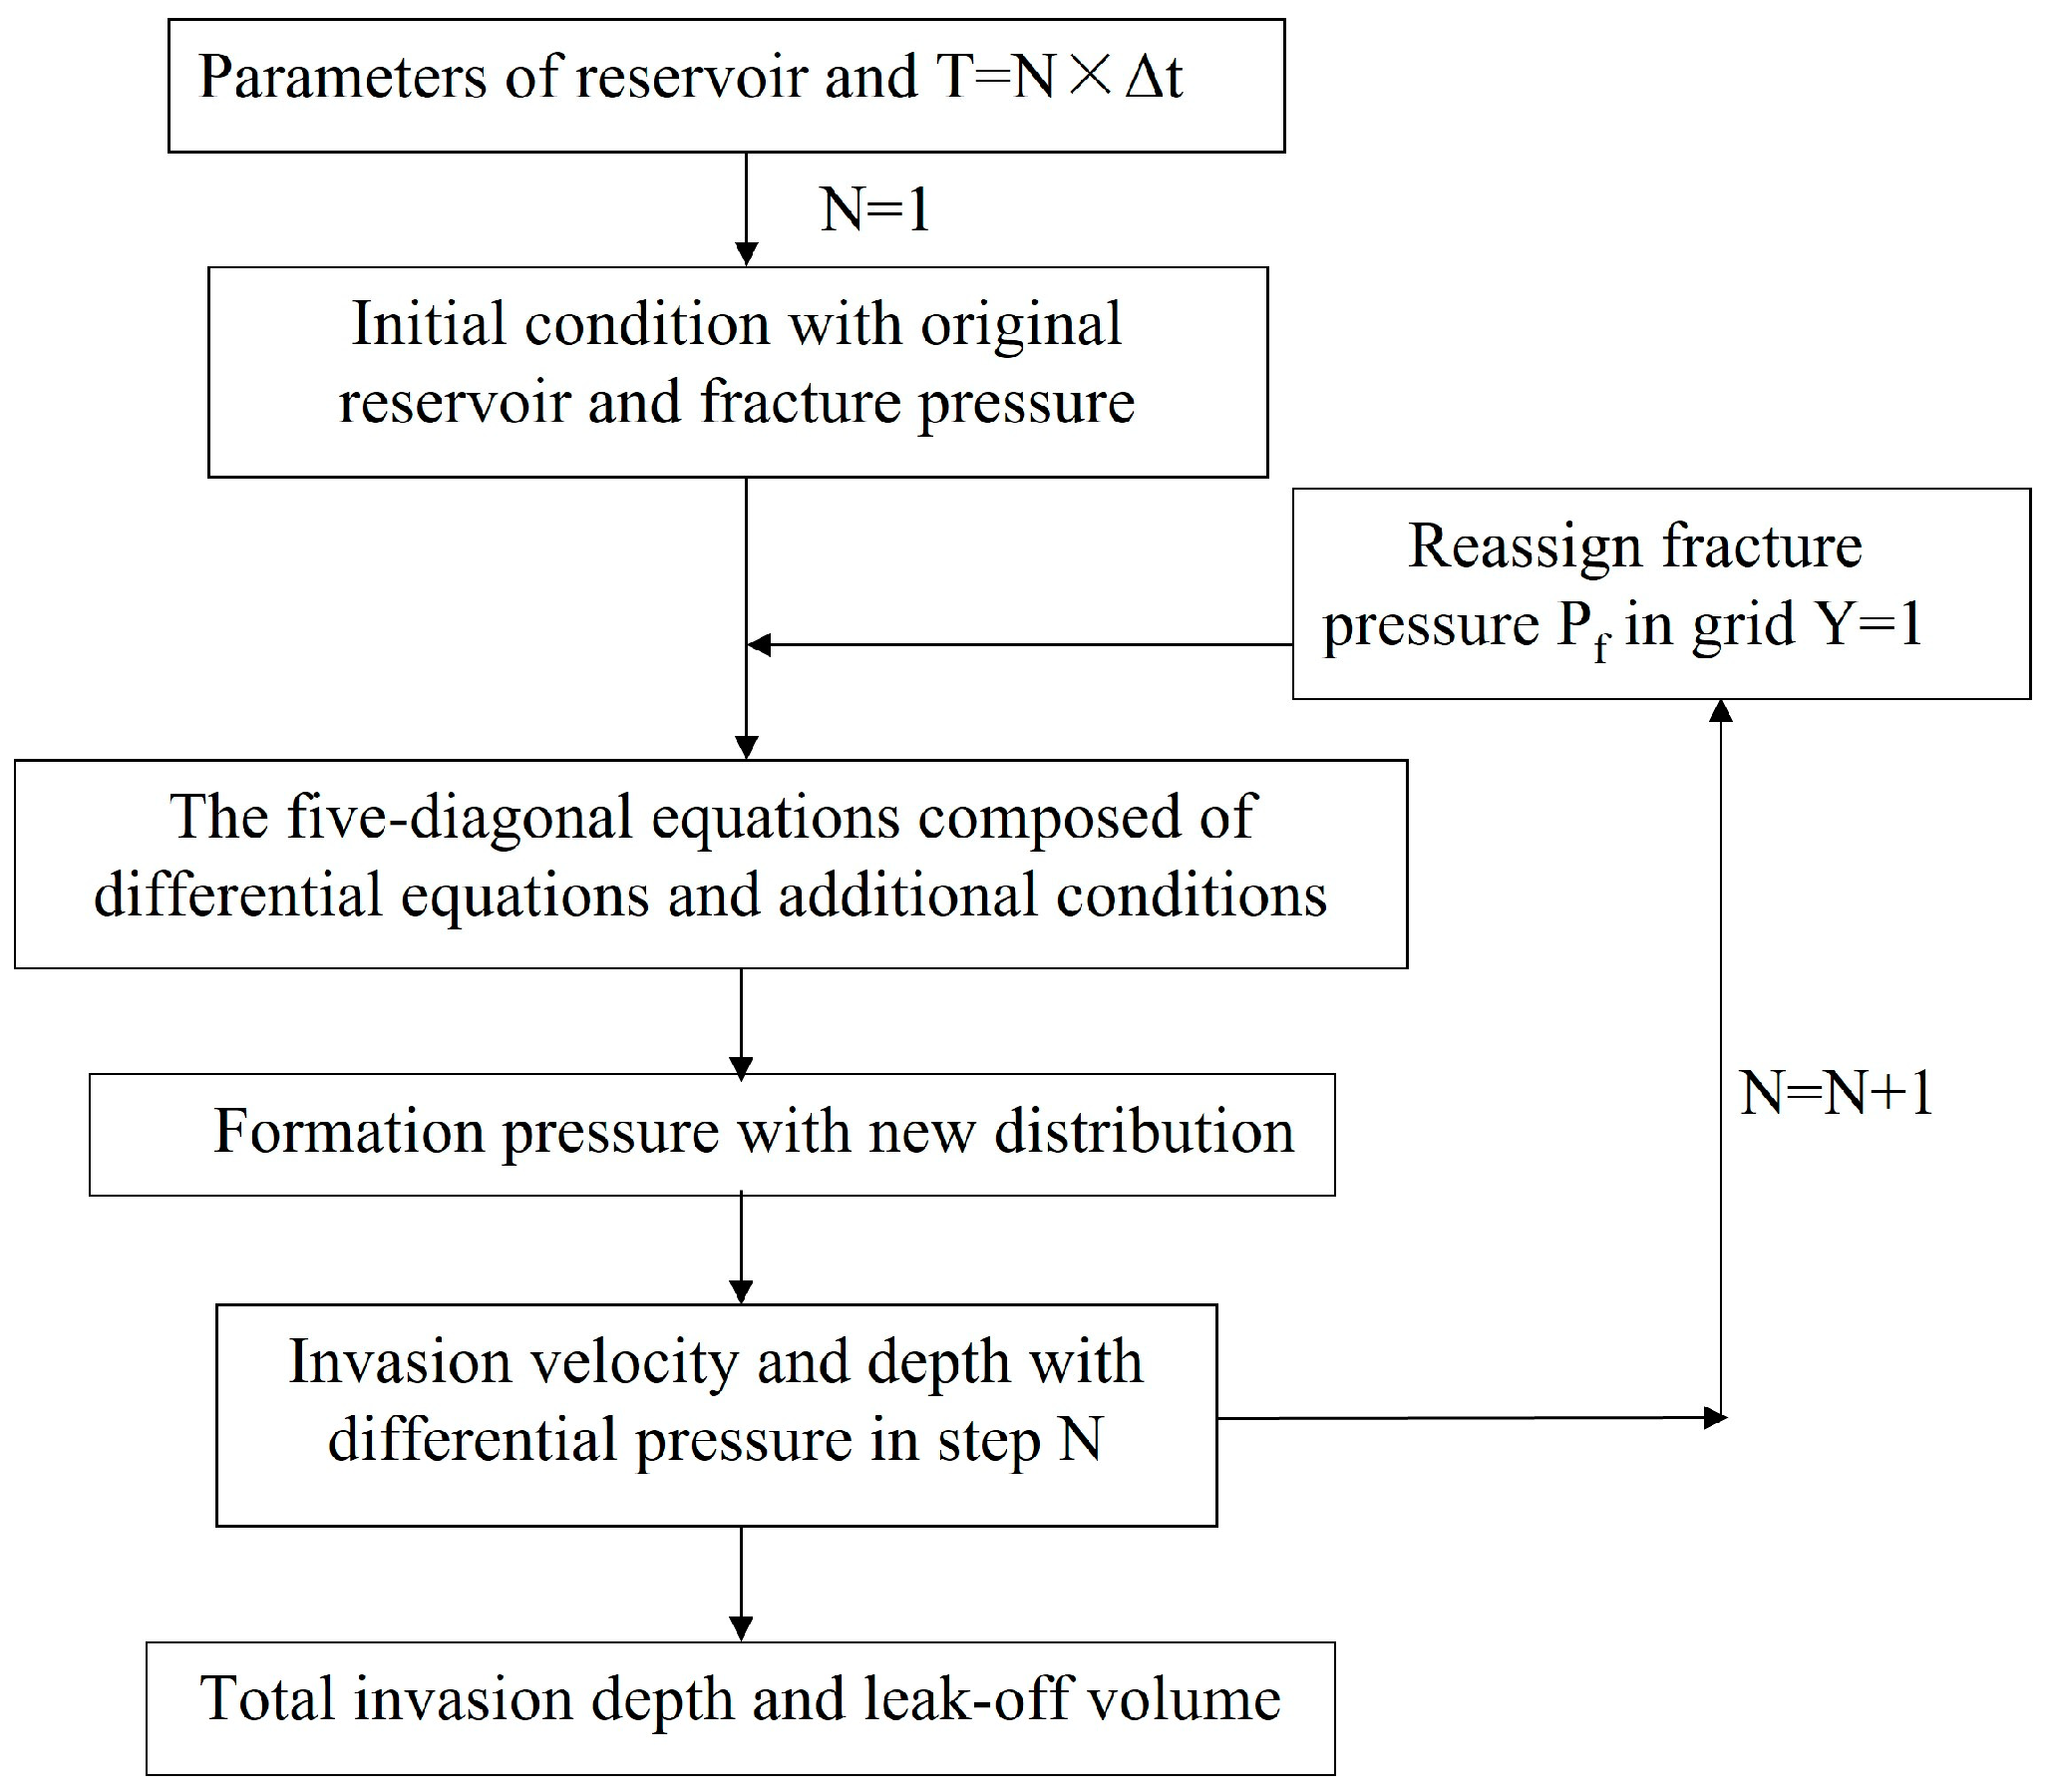
  • The pressure redistribution of each time step was updated to construct new pressure differences with fracture pressure in MHFHWs, and 26 stages were estimated with the invasion depth ranging from 1.158 to 1.434 m. The total invasion volume of all fracturing stages is estimated as 21,560.05 m3 and the actual total fluid volume injected is 24,019.6 m3.
In this work, some assumptions were made to simplify fracture propagation in the work, and the model simulates fracture growth by setting the pressure in the fracture grid to constant pressure at each time step. Therefore, in our future work, coupling geomechanics with flow modeling should be taken into account to calculate pressure change in fracture. The stress shadow among clusters also needs to be valued to make the model more applicable for ordinary MHFHWs.

Author Contributions

Data curation, writing—original draft, H.Z.; methodology and supervision J.H.; conceptualization, writing—review and editing, Y.Z. All authors have read and agreed to the published version of the manuscript.

Funding

This work was supported by the National Natural Science Foundation of China (52074248), Young Elite Scientists Sponsorship Program by BAST (BYESS2023414), and Fundamental Research Funds for the Central Universities (2652022207).

Data Availability Statement

Data is contained within the article.

Conflicts of Interest

The authors declare no conflict of interest.

Nomenclature

µThe viscosity of the fracturing fluid, Pa·s
kdFormation permeability, m2
ΔPPressure difference, Pa
GThreshold pressure gradient, Pa/m
CfComprehensive compression coefficient, Pa−1
φRock porosity
PiOriginal formation pressure, Pa
PfFracture pressure, Pa
qSource or sink flow per unit volume, 1/s
x, y, zDirections of the coordinate axis
Lx, LyBoundary coordinate value in x and y direction, m
LfFracture length, m
viVelocity of the ith grid, m/s
Δy1Grid length of the first row in the y direction, m
V l o s s n Leak-off volume at time n, m3
mTotal number of fracture grids
hLeak-off height for fracturing fluid, m
lxiLength of the ith grid in the fracture direction, m
TTotal time, s
NTotal time step
ΔtTime interval, s
hfFracture height, m
vVelocity of curve fitting, m/s
SInvasion area, m2
VInvasion volume, m3

References

  1. Ozkan, E.; Brown, M.; Raghavan, R.; Kazemi, H. Comparison of Fractured-Horizontal-Well Performance in Tight Sand and Shale Reservoirs. SPE Reserv. Eval. Eng. 2011, 14, 248–259. [Google Scholar] [CrossRef]
  2. Alvarado, V.; Manrique, E. Enhanced Oil Recovery: An Update Review. Energies 2010, 3, 1529–1575. [Google Scholar] [CrossRef] [Green Version]
  3. Yu, L.; Wang, J.; Wang, C.; Chen, D. Enhanced Tight Oil Recovery by Volume Fracturing in Chang 7 Reservoir: Experimental Study and Field Practice. Energies 2019, 12, 2419. [Google Scholar] [CrossRef] [Green Version]
  4. Ren, Z.X.; Yan, R.F.; Huang, X.; Liu, W.Q.; Yuan, S.B.; Xu, J.P.; Jiang, H.Y.; Zhang, J.M.; Yan, R.T.; Qu, Z. The Transient Pressure Behavior Model of Multiple Horizontal Wells with Complex Fracture Networks in Tight Oil Reservoir. J. Pet. Sci. Eng. 2019, 173, 650–665. [Google Scholar] [CrossRef]
  5. Mayerhofer, M.J.; Lolon, E.P.; Youngblood, J.E.; Heinze, J.R. Integration of Microseismic Fracture Mapping Results with Numerical Fracture Network Production Modeling in the Barnett Shale. In Proceedings of the SPE Annual Technical Conference and Exhibition, San Antonio, TX, USA, 24–27 September 2006. [Google Scholar] [CrossRef]
  6. Lin, A.; Ma, J. Stimulated-Rock Characteristics and Behavior in Multistage Hydraulic-Fracturing Treatment. SPE J. 2015, 20, 784–789. [Google Scholar] [CrossRef]
  7. Kang, Y.L.; Xu, C.Y.; You, L.J.; Yu, H.F.; Zhang, B.J. Comprehensive Evaluation of Formation Damage Induced by Working Fluid Loss in Fractured Tight Gas Reservoir. J. Nat. Gas Sci. Eng. 2014, 18, 353–359. [Google Scholar] [CrossRef]
  8. Vatsa, T.; Wang, J. Fracture Height Containment in the Stimulation of Oriskany Formation. J. Energy Resour. Technol. 2013, 135, 022902. [Google Scholar] [CrossRef]
  9. Xu, D.R.; Bai, B.J.; Wu, H.R.; Hou, J.R.; Meng, Z.Y.; Sun, R.X.; Li, Z.; Lu, Y.; Kang, W.L. Mechanisms of Imbibition Enhanced Oil Recovery in Low Permeability Reservoirs: Effect of IFT Reduction and Wettability Alteration. Fuel 2019, 244, 110–119. [Google Scholar] [CrossRef]
  10. Yang, F.; Zheng, H.; Guo, Q.; Lyu, B.; Nie, S.; Wang, H. Modeling Water Imbibition and Penetration in Shales: New Insights into the Retention of Fracturing Fluids. Energy Fuels 2021, 35, 13776–13787. [Google Scholar] [CrossRef]
  11. Eltahan, E.; Rego, F.B.; Yu, W.; Sepehrnoori, K. Impact of Well Shut-in after Hydraulic-Fracture Treatments on Productivity and Recovery of Tight Oil Reservoirs. J. Pet. Sci. Eng. 2021, 203, 108592. [Google Scholar] [CrossRef]
  12. Ghanbari, E.; Dehghanpour, H. The Fate of Fracturing Water: A Field and Simulation Study. Fuel 2016, 163, 282–294. [Google Scholar] [CrossRef]
  13. Wang, M.Y.; Leung, J.Y. Numerical Investigation of Fluid-Loss Mechanisms during Hydraulic Fracturing Flow-Back Operations in Tight Reservoirs. J. Pet. Sci. Eng. 2015, 133, 85–102. [Google Scholar] [CrossRef]
  14. Zhou, Z.; Wei, S.; Lu, R.; Li, X. Numerical Study on the Effects of Imbibition on Gas Production and Shut-In Time Optimization in Woodford Shale Formation. Energies 2020, 13, 3222. [Google Scholar] [CrossRef]
  15. Shaibu, R.; Guo, B.Y. The Dilemma of Soaking a Hydraulically Fractured Horizontal Shale Well Prior to Flowback-A Decade Literature Review. J. Nat. Gas Sci. Eng. 2021, 94, 104084. [Google Scholar] [CrossRef]
  16. Roodhart, L.P. Fracturing Fluids—Fluid-Loss Measurements under Dynamic Conditions. SPE J. 1985, 25, 629–636. [Google Scholar] [CrossRef]
  17. Charles, D.D.; Xie, X.P. New Concepts in Dynamic Fluid-Loss Modeling of Fracturing Fluids. J. Pet. Sci. Eng. 1997, 17, 29–40. [Google Scholar] [CrossRef]
  18. Dong, C.; Zhu, D.; Hill, A.D. Modeling of the Acidizing Process in Naturally Fractured Carbonates. SPE J. 2002, 7, 400–408. [Google Scholar] [CrossRef]
  19. Jia, L.C.; Chen, M.; Hou, B.; Sun, Z.; Jin, Y. Drilling Fluid Loss Model and Loss Dynamic Behavior in Fractured Formations. Pet. Explor. Dev. 2014, 41, 105–112. [Google Scholar] [CrossRef]
  20. Parn-anurak, S.; Engler, T.W. Modeling of Fluid Filtration and Near-Wellbore Damage along a Horizontal Well. J. Pet. Sci. Eng. 2005, 46, 149–160. [Google Scholar] [CrossRef]
  21. Xu, D.; Chen, S.; Chen, J.; Xue, J.; Yang, H. Study on the Imbibition Damage Mechanisms of Fracturing Fluid for the Whole Fracturing Process in a Tight Sandstone Gas Reservoir. Energies 2022, 15, 4463. [Google Scholar] [CrossRef]
  22. Windarto; Gunawan, A.Y.; Sukarno, P.; Soewono, E. Modeling of Mud Filtrate Invasion and Damage Zone Formation. J. Pet. Sci. Eng. 2011, 77, 359–364. [Google Scholar] [CrossRef]
  23. Jiang, Y.; Shi, Y.; Xu, G.; Jia, C.; Meng, Z.; Yang, X.; Zhu, H.; Ding, B. Experimental Study on Spontaneous Imbibition under Confining Pressure in Tight Sandstone Cores Based on Low-Field Nuclear Magnetic Resonance Measurements. Energy Fuels 2018, 32, 3152–3162. [Google Scholar] [CrossRef]
  24. Li, Y.; Guo, J.; Zhao, J.; Yue, Y. A New Model of Fluid Leak-off in Naturally Fractured Gas Fields and Its Effects on Fracture Geometry. J. Can. Petrol. Technol. 2007, 46, 12–16. [Google Scholar] [CrossRef]
  25. Liu, Y.X.; Guo, J.C.; Chen, Z.X. Leakoff Characteristics and an Equivalent Leakoff Coefficient in Fractured Tight Gas Reservoirs. J. Nat. Gas Sci. Eng. 2016, 31, 603–611. [Google Scholar] [CrossRef]
  26. Elbel, J.L.; Navarrete, R.C.; Poe, B.D. Production Effects of Fluid Loss in Fracturing High-Permeability Formations. In Proceedings of the SPE European Formation Damage Conference, The Hague, The Netherlands, 15–16 May 1995. [Google Scholar] [CrossRef]
  27. Clark, P.E. Analysis of Fluid Loss Data II: Models for Dynamic Fluid Loss. J. Pet. Sci. Eng. 2010, 70, 191–197. [Google Scholar] [CrossRef]
  28. Crandall, D.; Ahmadi, G.; Smith, D.H. Computational Modeling of Fluid Flow through a Fracture in Permeable Rock. Transp. Porous. Med. 2010, 84, 493–510. [Google Scholar] [CrossRef]
  29. Guo, J.C.; Liu, Y.X. A Comprehensive Model for Simulating Fracturing Fluid Leakoff in Natural Fractures. J. Nat. Gas Sci. Eng. 2014, 21, 977–985. [Google Scholar] [CrossRef]
  30. Wang, J.H.; Elsworth, D.; Denison, M.K. Hydraulic Fracturing with Leakoff in a Pressure-Sensitive Dual Porosity Medium. Int. J. Rock Mech. Min. Sci. 2018, 107, 55–68. [Google Scholar] [CrossRef]
  31. Liu, J.R.; Sheng, J.J.; Emadibaladehi, H.; Tu, J.W. Experimental Study of the Stimulating Mechanism of Shut-in after Hydraulic Fracturing in Unconventional Oil Reservoirs. Fuel 2021, 300, 120982. [Google Scholar] [CrossRef]
  32. He, Y.; Xu, Y.; Tang, Y.; Qiao, Y.; Yu, W.; Sepehrnoori, K. Multi-Phase Rate Transient Behaviors of the Multi-Fractured Horizontal Well With Complex Fracture Networks. J. Energy Resour. Technol. 2022, 144, 043006. [Google Scholar] [CrossRef]
  33. Hu, J.; Zhao, H.; Du, X.; Zhang, Y. An Analytical Model for Shut-in Time Optimization after Hydraulic Fracturing in Shale Oil Reservoirs with Imbibition Experiments. J. Pet. Sci. Eng. 2022, 210, 110055. [Google Scholar] [CrossRef]
  34. Chen, Z.M.; Liao, X.W.; Zhao, X.L.; Yu, W.; Sepehrnoori, K. A Workflow Based on a Semianalytical Model to Estimate the Properties of Stimulated Reservoir Volume of Tight-Oil Wells. J. Pet. Sci. Eng. 2019, 178, 892–903. [Google Scholar] [CrossRef]
  35. Zhang, Q.; Su, Y.; Wang, W.; Sheng, G. A New Semi-Analytical Model for Simulating the Effectively Stimulated Volume of Fractured Wells in Tight Reservoirs. J. Nat. Gas Sci. Eng. 2015, 27, 1834–1845. [Google Scholar] [CrossRef]
  36. Al-Rbeawi, S. Analysis of Pressure Behaviors and Flow Regimes of Naturally and Hydraulically Fractured Unconventional Gas Reservoirs Using Multi-Linear Flow Regimes Approach. J. Nat. Gas Sci. Eng. 2017, 45, 637–658. [Google Scholar] [CrossRef]
  37. Wu, Z.W.; Dong, L.; Cui, C.Z.; Cheng, X.Z.; Wang, Z. A Numerical Model for Fractured Horizontal Well and Production Characteristics: Comprehensive Consideration of the Fracturing Fluid Injection and Flowback. J. Pet. Sci. Eng. 2020, 187, 106765. [Google Scholar] [CrossRef]
  38. Wang, J.; Hu, J.; Zhang, Y.; Xie, Q.; Shi, Y. Investigation of Imbibition Areas during Well Shut-in Based on Mercury Injection Experiment and BP Neural Network. Fuel 2019, 254, 115621. [Google Scholar] [CrossRef]
  39. Howard, G.; Fast, C.R. Optimum Fluid Characteristics for Fracture Extension. Drill. Prod. Pract. 1957, 24, 261–270. [Google Scholar]
  40. Wu, K.; Olson, J.E. Mechanisms of Simultaneous Hydraulic-Fracture Propagation From Multiple Perforation Clusters in Horizontal Wells. SPE J. 2016, 21, 1000–1008. [Google Scholar] [CrossRef]
  41. Lecampion, B.; Desroches, J.; Weng, X.; Burghardt, J.; Brown, J.E.E. Can We Engineer Better Multistage Horizontal Completions? Evidence of the Importance of Near-Wellbore Fracture Geometry from Theory, Lab and Field Experiments; OnePetro: The Woodlands, TX, USA, 2015. [Google Scholar] [CrossRef]
  42. Long, G.; Liu, S.; Xu, G.; Wong, S.-W.; Chen, H.; Xiao, B. A Perforation-Erosion Model for Hydraulic-Fracturing Applications. SPE Prod. Oper. 2018, 33, 770–783. [Google Scholar] [CrossRef]
  43. Long, G.; Xu, G. The Effects of Perforation Erosion on Practical Hydraulic-Fracturing Applications. SPE J. 2017, 22, 645–659. [Google Scholar] [CrossRef]
  44. Wu, K.; Olson, J.; Balhoff, M.T.; Yu, W. Numerical Analysis for Promoting Uniform Development of Simultaneous Multiple-Fracture Propagation in Horizontal Wells. SPE Prod. Oper. 2016, 32, 41–50. [Google Scholar] [CrossRef]
  45. Darcy, H. Les Fontaines Publiques de la Ville de Dijon; Victor Dalmont: Paris, France, 1856. [Google Scholar]
  46. Yi, T.; Peden, J.M. A Comprehensive Model of Fluid Loss in Hydraulic Fracturing. SPE Prod. Fac. 1994, 9, 267–272. [Google Scholar] [CrossRef]
Figure 1. Schematic diagram (left) and an overall picture (right) of the apparatus employed for experimental fracturing fluid invasion.
Energies 16 05148 g001
Figure 2. Diagram of eight core samples from block X of Xinjiang oilfield.
Energies 16 05148 g002
Figure 3. Grid division between two fractures in different directions.
Energies 16 05148 g003
Figure 4. Flow chart of the proposed mathematical model.
Energies 16 05148 g004
Figure 5. Invasion velocity under different pressure differences in core experiments and numerical simulation.
Energies 16 05148 g005
Figure 6. Invasion velocity fitting and interpolation results of core experiments.
Energies 16 05148 g006
Figure 7. Invasion depth calculated by core experiments and numerical simulation.
Energies 16 05148 g007
Figure 8. The relationship between invasion amount and fracturing time.
Energies 16 05148 g008
Figure 9. Pressure distribution of two clusters of fractures.
Energies 16 05148 g009
Figure 10. Variation of fracturing fluid invasion depth with fracturing time under different pressure differences.
Energies 16 05148 g010
Table 1. Physical properties of eight core samples.
Core NumberPorosity (%)Permeability (mD)Length (cm)Diameter (cm)
111.30.8974.9782.505
29.90.4425.0322.506
37.72.3505.0362.467
49.60.1205.0262.483
510.31.8804.9812.504
610.70.5275.0062.506
79.21.5805.0082.504
87.91.7325.0232.496
Table 2. The designated experimental pressure difference and inlet–outlet pressure.
Core NumberExperiment Pressure Difference (MPa)Inlet Pressure
(MPa)
Outlet Pressure
(MPa)
1407030
2357035
3307040
4257045
5207050
6157055
7107060
857065
Table 3. Breakthrough time and invasion velocity under different pressure differences.
Core NumberPressure Difference (MPa)Breakthrough Time (s)Invasion Velocity (cm/s)
140690.072
235850.059
330920.054
4251110.045
5201080.046
6151210.041
7101380.036
852850.017
Table 4. Reservoir properties and operation parameters of well X-1.
Well NameX-1Well NameX-1
Formation depth (m)2988–3095Half-length of fracture (m)80
Injection speed per stage (m3/min)10–14Liquid inflow per stage (m3)689–1410
Distance between stages(m)28–87Distance between clusters (m)22.2–52.5
Wellbore radius (m)0.062Number of stimulated stages26
Pore compression
coefficient (MPa−1)
0.0017Formation porosity (%)9.58
Density of fracturing fluid (kg/m3)1020Initial formation pressure (MPa)35.0
Poisson’s ratio0.21Young’s modulus (MPa)25,700
Sand body thickness (m)8Permeability (mD)1.44
Fracturing treatment
pressure (MPa)
67–70Pressure at shut-in time (MPa)23–34
Table 5. Numerical simulation invasion depth of each section of 26 stages of the horizontal well.
Fracturing StageInvasion Depth (m)Fracturing StageInvasion Depth (m)Fracturing StageInvasion Depth (m)
11.434101.329191.212
21.426111.306201.205
31.419121.289211.185
41.422131.261221.190
51.404141.258231.172
61.364151.250241.163
71.375161.238251.170
81.346171.241261.158
91.336181.231
Disclaimer/Publisher’s Note: The statements, opinions and data contained in all publications are solely those of the individual author(s) and contributor(s) and not of MDPI and/or the editor(s). MDPI and/or the editor(s) disclaim responsibility for any injury to people or property resulting from any ideas, methods, instructions or products referred to in the content.

