Article

Islanding Detection with Reduced Non-Detection Zones and Restoration by Reconfiguration

by
Sowmya Ramachandradurai
1,
Narayanan Krishnan
2,*,
Gulshan Sharma
3,* and
Pitshou N. Bokoro
3
1
Department of Electrical and Electronics Engineering, Sri Shakthi Institute of Engineering & Technology, Coimbatore 641062, India
2
Department of Electrical and Electronics Engineering, SASTRA Deemed to be University, Thanjavur 613401, India
3
Department of Electrical Engineering Technology, University of Johannesburg, Johannesburg 2006, South Africa
*
Authors to whom correspondence should be addressed.
Energies 2023, 16(7), 3035; https://doi.org/10.3390/en16073035
Submission received: 8 February 2023 / Revised: 14 March 2023 / Accepted: 20 March 2023 / Published: 27 March 2023
(This article belongs to the Special Issue Modern Power Distribution Systems)

Abstract

:
The development and use of PV (Photovoltaic), Wind, and Hydro-based Distributed Generation (DG) is presently on the rise worldwide for improving stability and reliability, and reducing the power loss in the distribution system with reduced emission of harmful gases. A crucial issue addressed in this article, due to the increased penetration of DGs, is islanding operations. The detection of islanding is performed by a proposed v&f (voltage and frequency) index method. The reliability indices of the IEEE-33 and 118 radial bus distribution system after the detection of islanding by the proposed method is evaluated by considering the islanding issue as customer interruption. To mitigate the islanding, a reconfiguration strategy using Particle Swarm Optimization (PSO) is also performed and the proposed strategy is also evaluated with the conventional reconfiguration strategy of the distribution system.

1. Introduction

Distributed Generation (DG) units have attracted more observation from researchers due to the high cost of new power plants, increasing electricity demand, and depleting fossil fuels. DG installation reduces the necessity for grid reinforcement and power losses. The presence of DGs in a radial network changes the voltage magnitude and current. The change in voltage magnitude and current impacts on the operation of protection relays are studied in [1,2,3]. Unintentional islanding is an important problem, which leads to damage to consumer appliances [4,5]. Detection of unintentional islanding can be performed by using the remote method and local methods. The remote method requires a communication signal to detect the islanding, whereas the local method detects islanding without the communication signal [6,7].
The voltage, frequency, and current on the distribution side are measured to detect islanding using the passive method [5,8]. In the active method, internal disturbances are created in the network to detect the islanding based on the system response [9,10,11]. Combining the advantages offered by active and passive methods, hybrid methods have been devised by researchers [12]. The Non-Detection Zones (NDZ) are eliminated in the active method but induce power quality issues, and islanding is not detected when the system is connected with multiple inverters. The NDZ is represented as the failure of detection of islanding events in the system. Therefore, the passive islanding detection method is used to detect the islanding with reduced power quality issues connected with multiple inverters [13,14].
In power loss, islanded buses can be reduced and reliability can be improved by network reconfiguration. The sectionalizing lines and tie lines are the two lines present in the distribution system, where the tie lines are opened lines and sectionalizing lines are closed lines. The change of position of sectionalizing and tie-line switches is achieved by network reconfiguration [3,8]. The reliability indices in the distribution system can be evaluated through customer interruptions. The continuity of power becomes a major competitive factor for grid operators. Therefore, the evaluation of reliability indices is very much important in the distribution system [15,16,17].
The indices are evaluated by sensitivity analysis. This can be divided into two methods: the perturbation method [18], where no analytical calculation is required, and the partial derivative method [19], which involves analytical calculation [20,21]. The improvement in reliability is performed by improving the energy efficiency performance index. The reliability indices such as System Average Interruption Duration Index (SAIDI), System Average Interruption Frequency Index (SAIFI), and Energy Not supplied (ENS) are evaluated with a network reconfiguration using the mixed-integer linear programming method [22,23].

Contributions of the Proposed Method

The present work deals with passive islanding detection in the presence of various DGs using the BFS (Backward and Forward Sweep) method along with network reconfiguration using the PSO (Particle Swarm Optimization) technique. The islanding is detected by measuring the voltage and frequency (v&f) values simultaneously with fixed threshold limits. The reliability indices such as SAIFI, ENS, SAIDI, AENS (Average Energy Not Supplied), and ASAI (Average System Availability Index) are evaluated by considering the islanding issue as an interruption to the system before reconfiguration and after reconfiguration. The results are validated for the IEEE-33 and 118 bus systems.
  • The Non-Detection Zones, the number of islanded buses and detection time are reduced by the proposed technique.
  • A PSO technique is used to perform the reconfiguration by considering the identified vulnerable buses for islanding by the proposed islanding detection method.
  • Reliability indices are evaluated for the proposed reconfigured system.
  • The Real Time Price (RTP) and time of use are not considered in this work. In future, the interruption cost or feasibility studies can be implemented through the cost of electricity based on RTP.

2. Passive Method for Detection of Islanding, Reconfiguration, and Reliability Evaluation

A passive islanding detection method is proposed to detect islanding by measuring the voltage and frequency variation in the radial distribution system. The reliability values are evaluated before and after reconfiguration to prove the network operation is reliable.

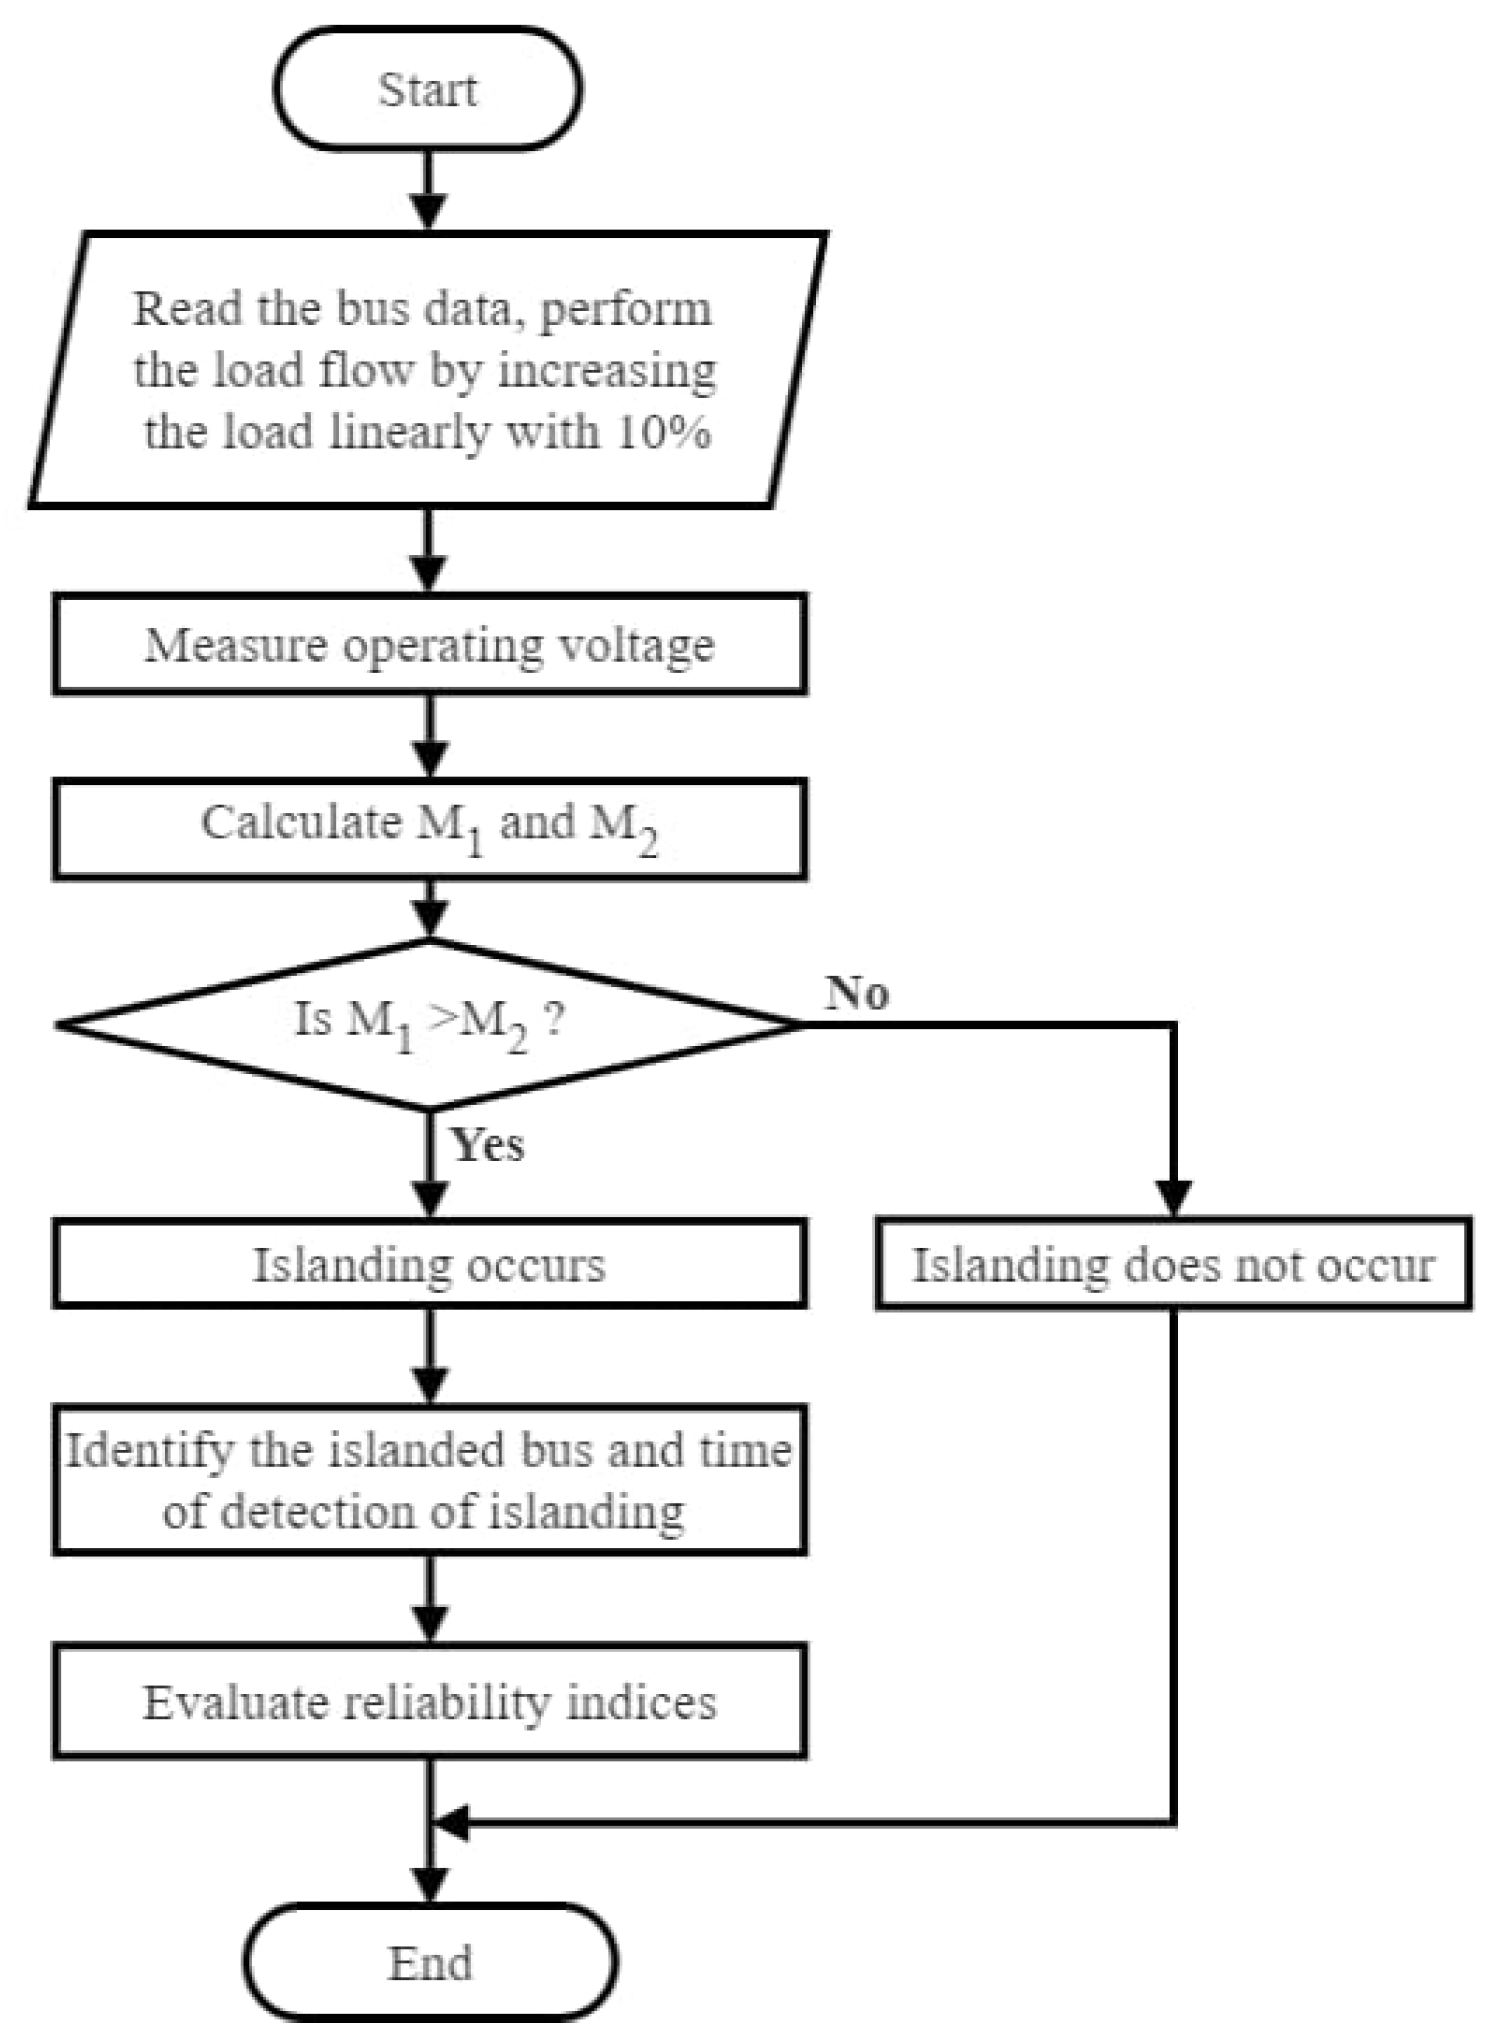
2.1. Proposed Voltage and Frequency (v&f) Variation Technique

The DGs, such as PV (Photovoltaic), Wind, and Hydro are used in proposed method to enhance the reliability with lower losses and also reduces the pollution.

2.1.1. PV

Solar energy converted to electric current is called the PV effect. The solar panels absorb the sunlight. It is an abundant source of energy, and it is a clean and sustainable source of energy. The cost is higher during the starting stage of usage and the cost is reduced gradually with increased efficiency. The power generation depends on solar insolation, the atmospheric temperature, and also the rating of the module itself. The PV output power is given as follows [24]:
O P o w e r ( P V ) = N p a n × F f a c t × V P a n × I P a n
F f a c t = V M N P O × I M N P O V o p e c × I S h c c
V p a n = V o p e c C v o l t
I p a n = S O I R [ I S h c c + K c u r n t ( T s p c 25 ) ]
T s p c = T a m b + S O I R [ ( T o p e r 20 ) / 0.8 ]
The values calculated for PV modeling are explained in Table 1.
O P o w e r ( P V ) —Output power of PV, F f a c t —Fill factor, SOIR- Solar Irradiation of PV model, T s p c —Particular solar cell temperature and T a m b —Ambient temperature of PV, V p a n —Voltage at the particular panel, I p a n —Current at the particular panel and N p a n —No of panels, respectively, [24].

2.1.2. Wind

The wind turbine produces power which is not constant and varies from seconds to seconds, because the turbine speed is not constant. Therefore, the wind power generation profile units are affected due to the intermittency of the wind speed. Modeling of wind speed is framed by the Weibull Probability Distribution Function (PDF). The wind output power is given as follows [24]:
W p o w = 0 , V C i n s p o r V C o u t s p V C i n s p S r a t C i n s p W r p o w , C i n s p V S r a t W r p o w , e l s e
The values calculated for Wind modeling are explained in Table 2.

2.1.3. Hydro

The Hydro energy system requires more space and cost but has very low emissions. Conversion of kinetic energy into electrical energy is executed in the Hydro energy system. It is considered to be a dispatchable generation unit and the hydro power output is given as follows [25]:
H P o w = ϵ H y × ϱ × g a c × P h e
The values calculated for hydro modeling are explained in Table 3.
The proposed method of v&f is modeled as follows:
M 1 = S 2 / b V a n d M 2 = S × V c h
S 2 = 1 3353 ( 1 / N s m p l × a b s ( S 1 ) )
S 1 = 1 3353 ( v o l t ) m a g s i n 2 π N s m p l f t
V c h = b V V o p e r a t i n g ( N ) × S 2
V o p e r a t i n g ( N ) = b V V o p e r a t i n g
S = 0 n ( f c h × 2 π ) / 60
f c h = 60 D f r
D f r = 1 + f × [ ( P l o ( n ) / P a l o ( n ) ) × ( b V / V o p e r a t i n g ) ]
Table 4 shows the variables and ratings of 33 and 118 test systems, which are evaluated by the above equations. The change of frequency at a bus concerning system frequency is calculated by Equation (13). The summation are taken for the number of samples related to phase voltage as expressed in Equation (9); the product of the number of samples, frequency, time with voltage magnitude are expressed in Equation (10). The change in voltage is calculated through taking the difference between the base voltage and operating voltage, as expressed in Equation (11). The new operating voltage of each bus is determined to measure the change in voltage ( V c h ) through Equation (12). If M 1 > M 2 islanding is occurred in a particular bus which is determined with Equation (8) and loads in all buses are varied simultaneously at each hour. Accordingly, the samples/cycle is changed in all the buses. The proposed detection method is compared with two different existing methods. The first existing method [26] uses a change in voltage and the second existing method [27] uses a change in frequency.

2.2. Reconfiguration Using Particle Swarm Optimization (PSO) Technique

Reconfiguration is performed with three rules to verify the radial mode at each stage as follows [28]:
Rule 1: Every candidate switch must belong to its corresponding loop vector.
Rule 2: A single candidate switch alone is chosen from one common branch vector.
Rule 3: All the common branch vectors of a prohibited group vector cannot participate simultaneously to form an individual.
Rule 1, Rules 2, and Rule 3 prevent islanding of exterior, interior, and principle interior nodes. These rules ensure a feasible radial mode.
The objective is resolved with the equality and inequality constraints. The best personal solution is obtained for each and every iteration. Finally, the best global solution is identified by best personal solution [29].
G b = m i n [ P b e t ] o r m a x [ P b e t ]
P b e t + 1 , i = P b e t + 1 , i f F ( y i t + 1 ) > P b e , i t y i t + 1 , i f F ( y i t + 1 ) P b e , i t
V E i j t + 1 = V E i j t + K 1 r 1 j t [ P b e , i t ( y i j t + 1 ) ]
The proposed particle or switch selection can be written as,
y t = S 1 , S 2 , S 3 , . . . . . S β , T g 1 , T g 2 , . . . T g α
ω ( t + 1 ) = ω m a x ω m i n t m a x × t
where G b represents the best global solution and P ( b e ) represents the best personal solution, which are calculated using particle velocity V i j , fitness value, or objective function `F’ and the specific place of the particle y i t + 1 , acceleration ( K 1 ) constant and r 1 j t - random numbers [29].
Opened switches are represented by T g as the variable and `S’ are represented as closed switches, α and β are represented as tie line and number of DG, ω m a x and ω m i n are maximum and minimum inertia weight, t m a x and t m i n are complete number of iterations and present iteration, respectively. The better solution of the system is identified by reconfiguring or rearranging the network to attain the desired improvement in an index. The procedure for reconfiguration using PSO is as follows [29]:
1: The switches will open after the initialization of particles and checking the system working in radial behavior.
2: The number of velocity (particle) and switches (opened) are randomly generated.
3: The random particle generation and switches (closed) are performed by choosing the proper configuration.
4: The best and fitness values of every particle choose the appropriate (particle best) value.
5: The iterations are made to notify the accurate switches for performing the reconfiguration by best values, the velocity values, place of the particles from Equations (17)–(19).
6: In the last stage, the switches are opened as the best global solution.

2.3. Proposed Method for Reliability Evaluation

The indices, such as (ENS)—Energy Not Supplied, (ASAI)—Average System Availability Index, (AENS)—Average Energy Not Supplied, (SAIFI)—System Average Interruption Frequency Index, and (SAIDI)—System Average Interruption Duration Index, are identified by the following equations.
SAIDI = j h j n j j n t
SAIFI = j λ j n j j n t
ENS = L b ( j ) h j
AENS = E N S n t
Here, n j —customer interruption or customer not served, h j —customer hours for available services, failure rate is denoted as λ j , n t —total number of customers served and total demand is represented as L b ( j ) .
Figure 1 represents, in the proposed work, all the bus systems considered with detection of islanding as an interruption. Load flow is performed by increasing the load profile linearly using the Backward and Forward Sweep (BFS) method from base load of the network to 130% of base load. An operating voltage of all the buses are measured, and the variation of v&f index and threshold values are measured using Equation (8). The violation limits are examined with ± 2 % of voltage and frequency values using IEEE std. 1547 [30]. If v&f variation values are higher than the values of threshold limits then that specific bus is considered to be an islanded bus. Along with the determined islanded bus, a strategy of reconfiguration is undertaken to confirm the continuity of the supply. A quantitative indices evaluation is performed before and after reconfiguration to estimate the outcome of strategy of reconfiguration in the network.

3. Results and Discussion

Renewables such as PV, Wind, and Hydro-based DGs installed in all distribution systems reduce the loss and increase the stability which is simulated through MATLAB- 2016b [31]. The loads are varied linearly in steps of 10% of base load to 130% of base load for detection of islanding by the proposed passive method of simultaneous measurement of voltage and frequency for both 33 and 118 bus system. The proposed islanding detection method is compared with the existing methods.

3.1. Islanding Detection

The islanding is performed for the IEEE-33 and 118 bus radial system and results obtained by the proposed technique are compared with existing methods.

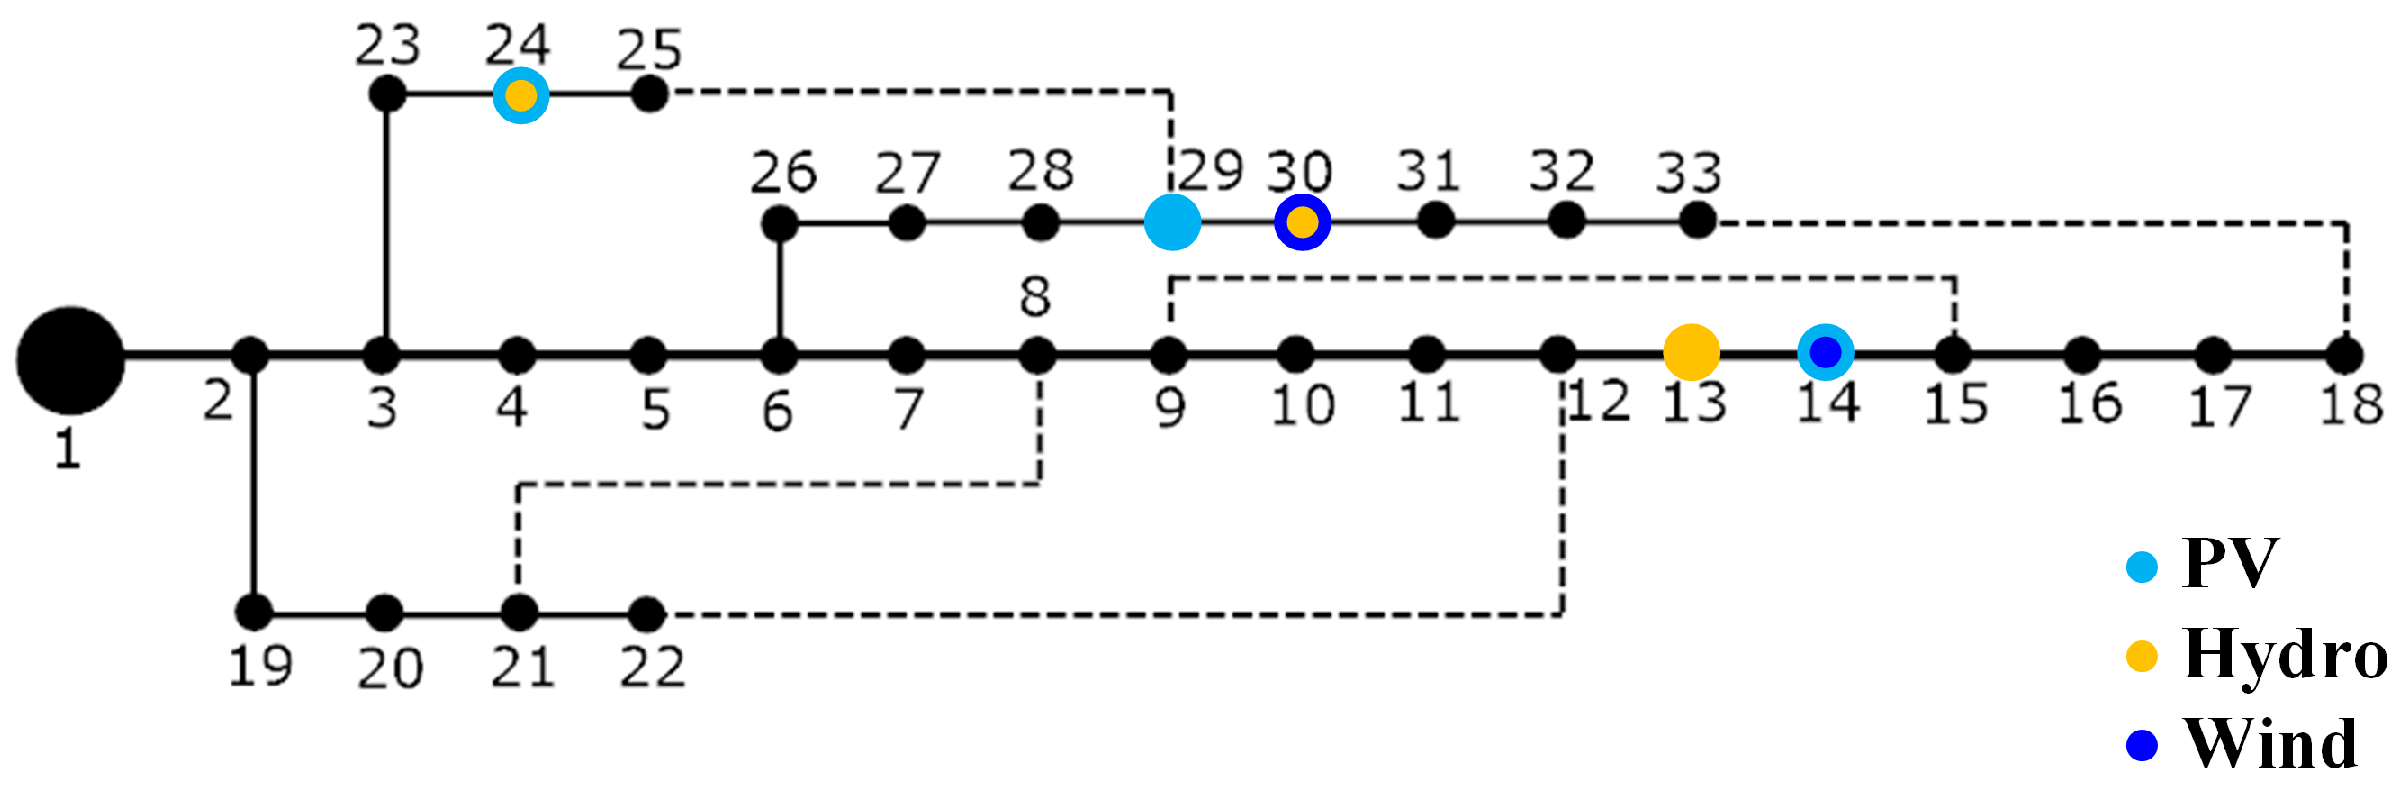
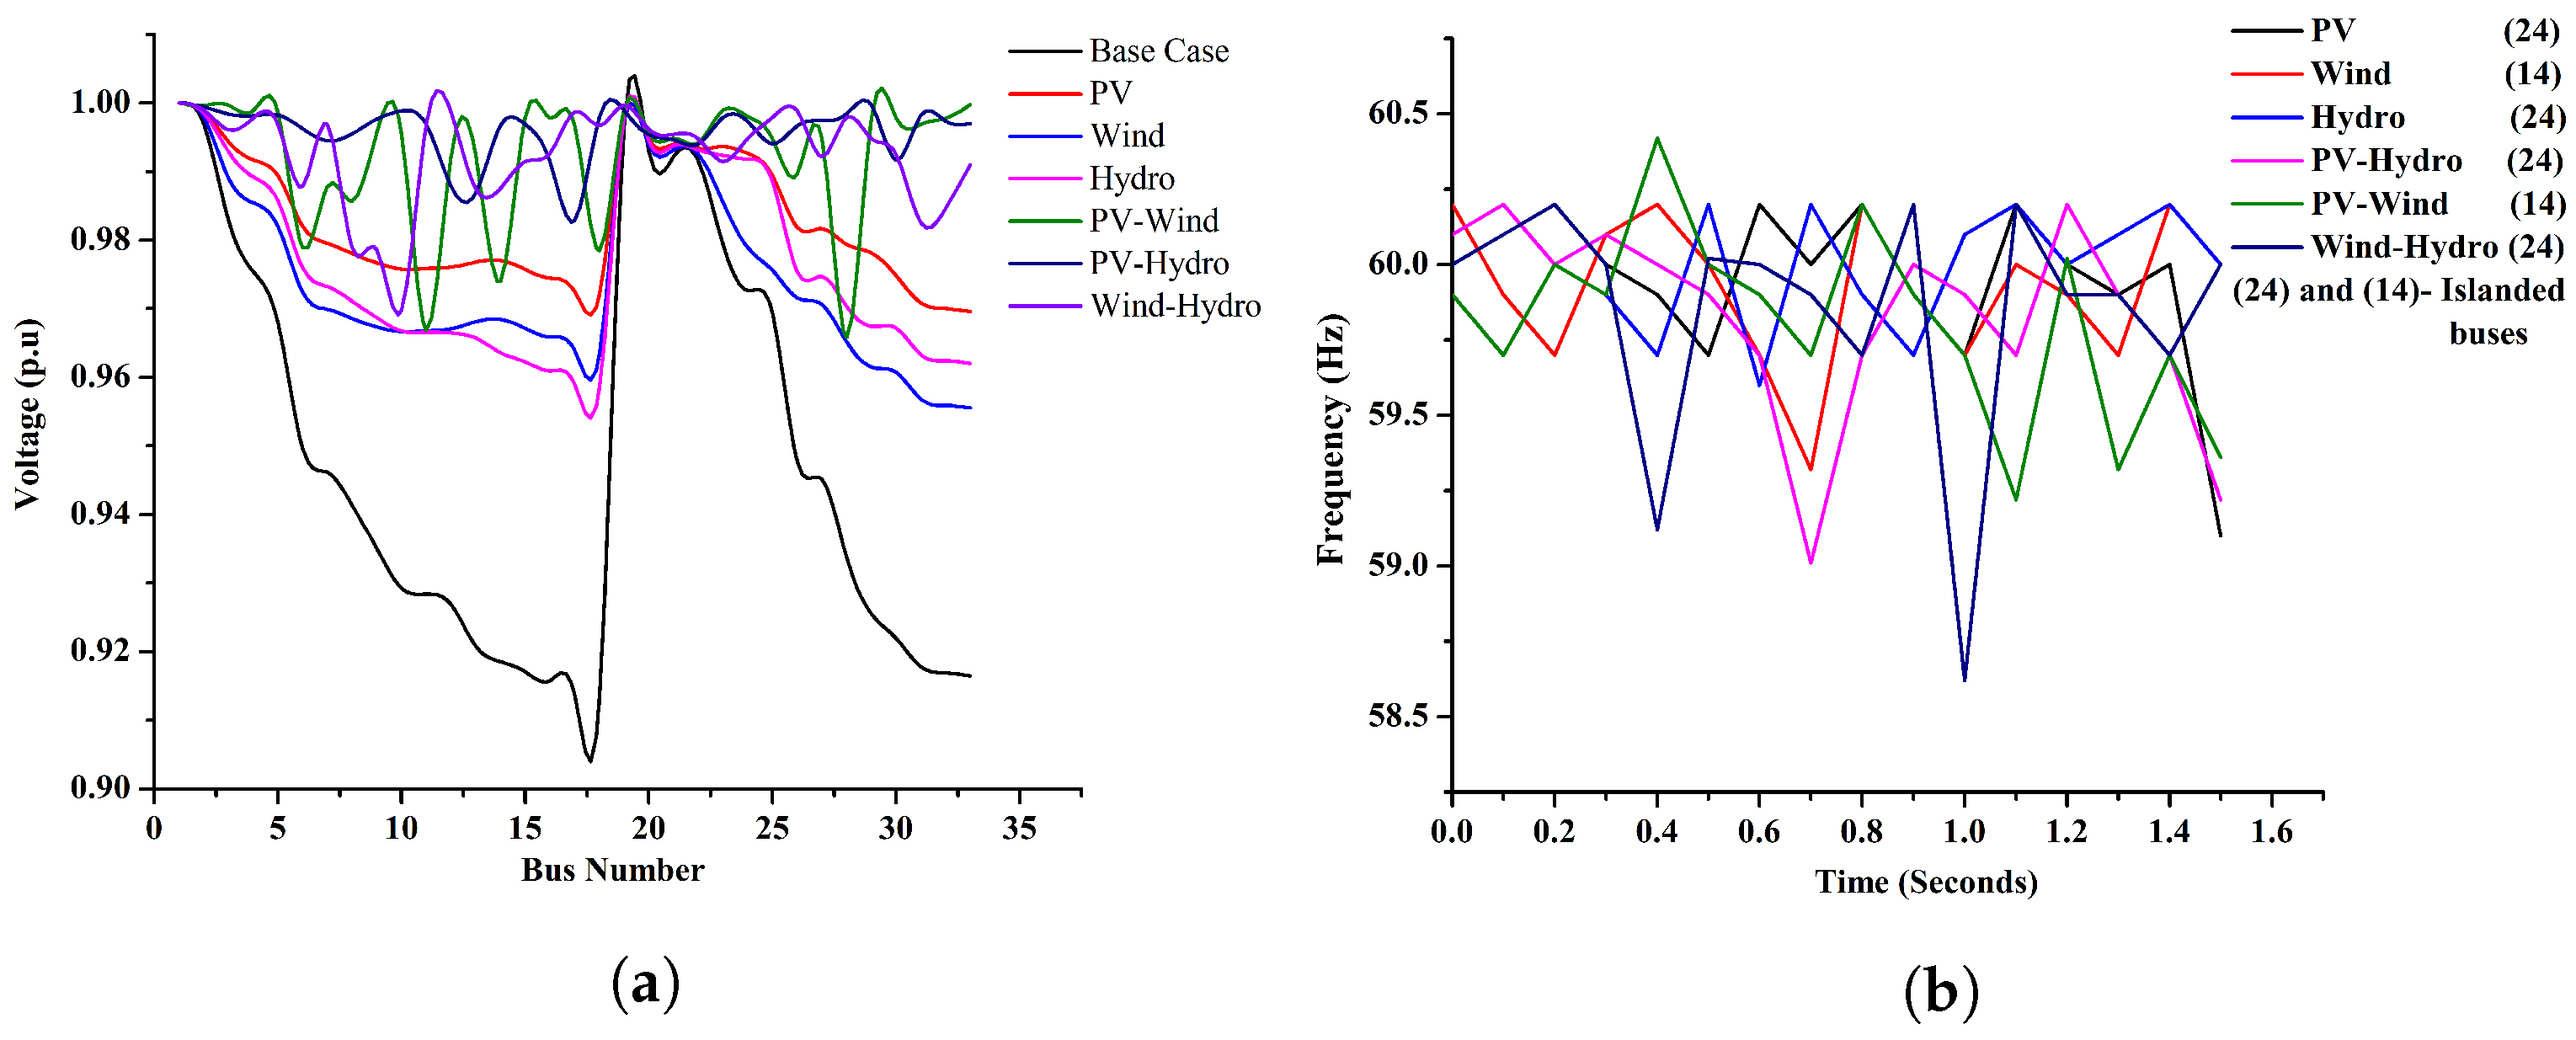
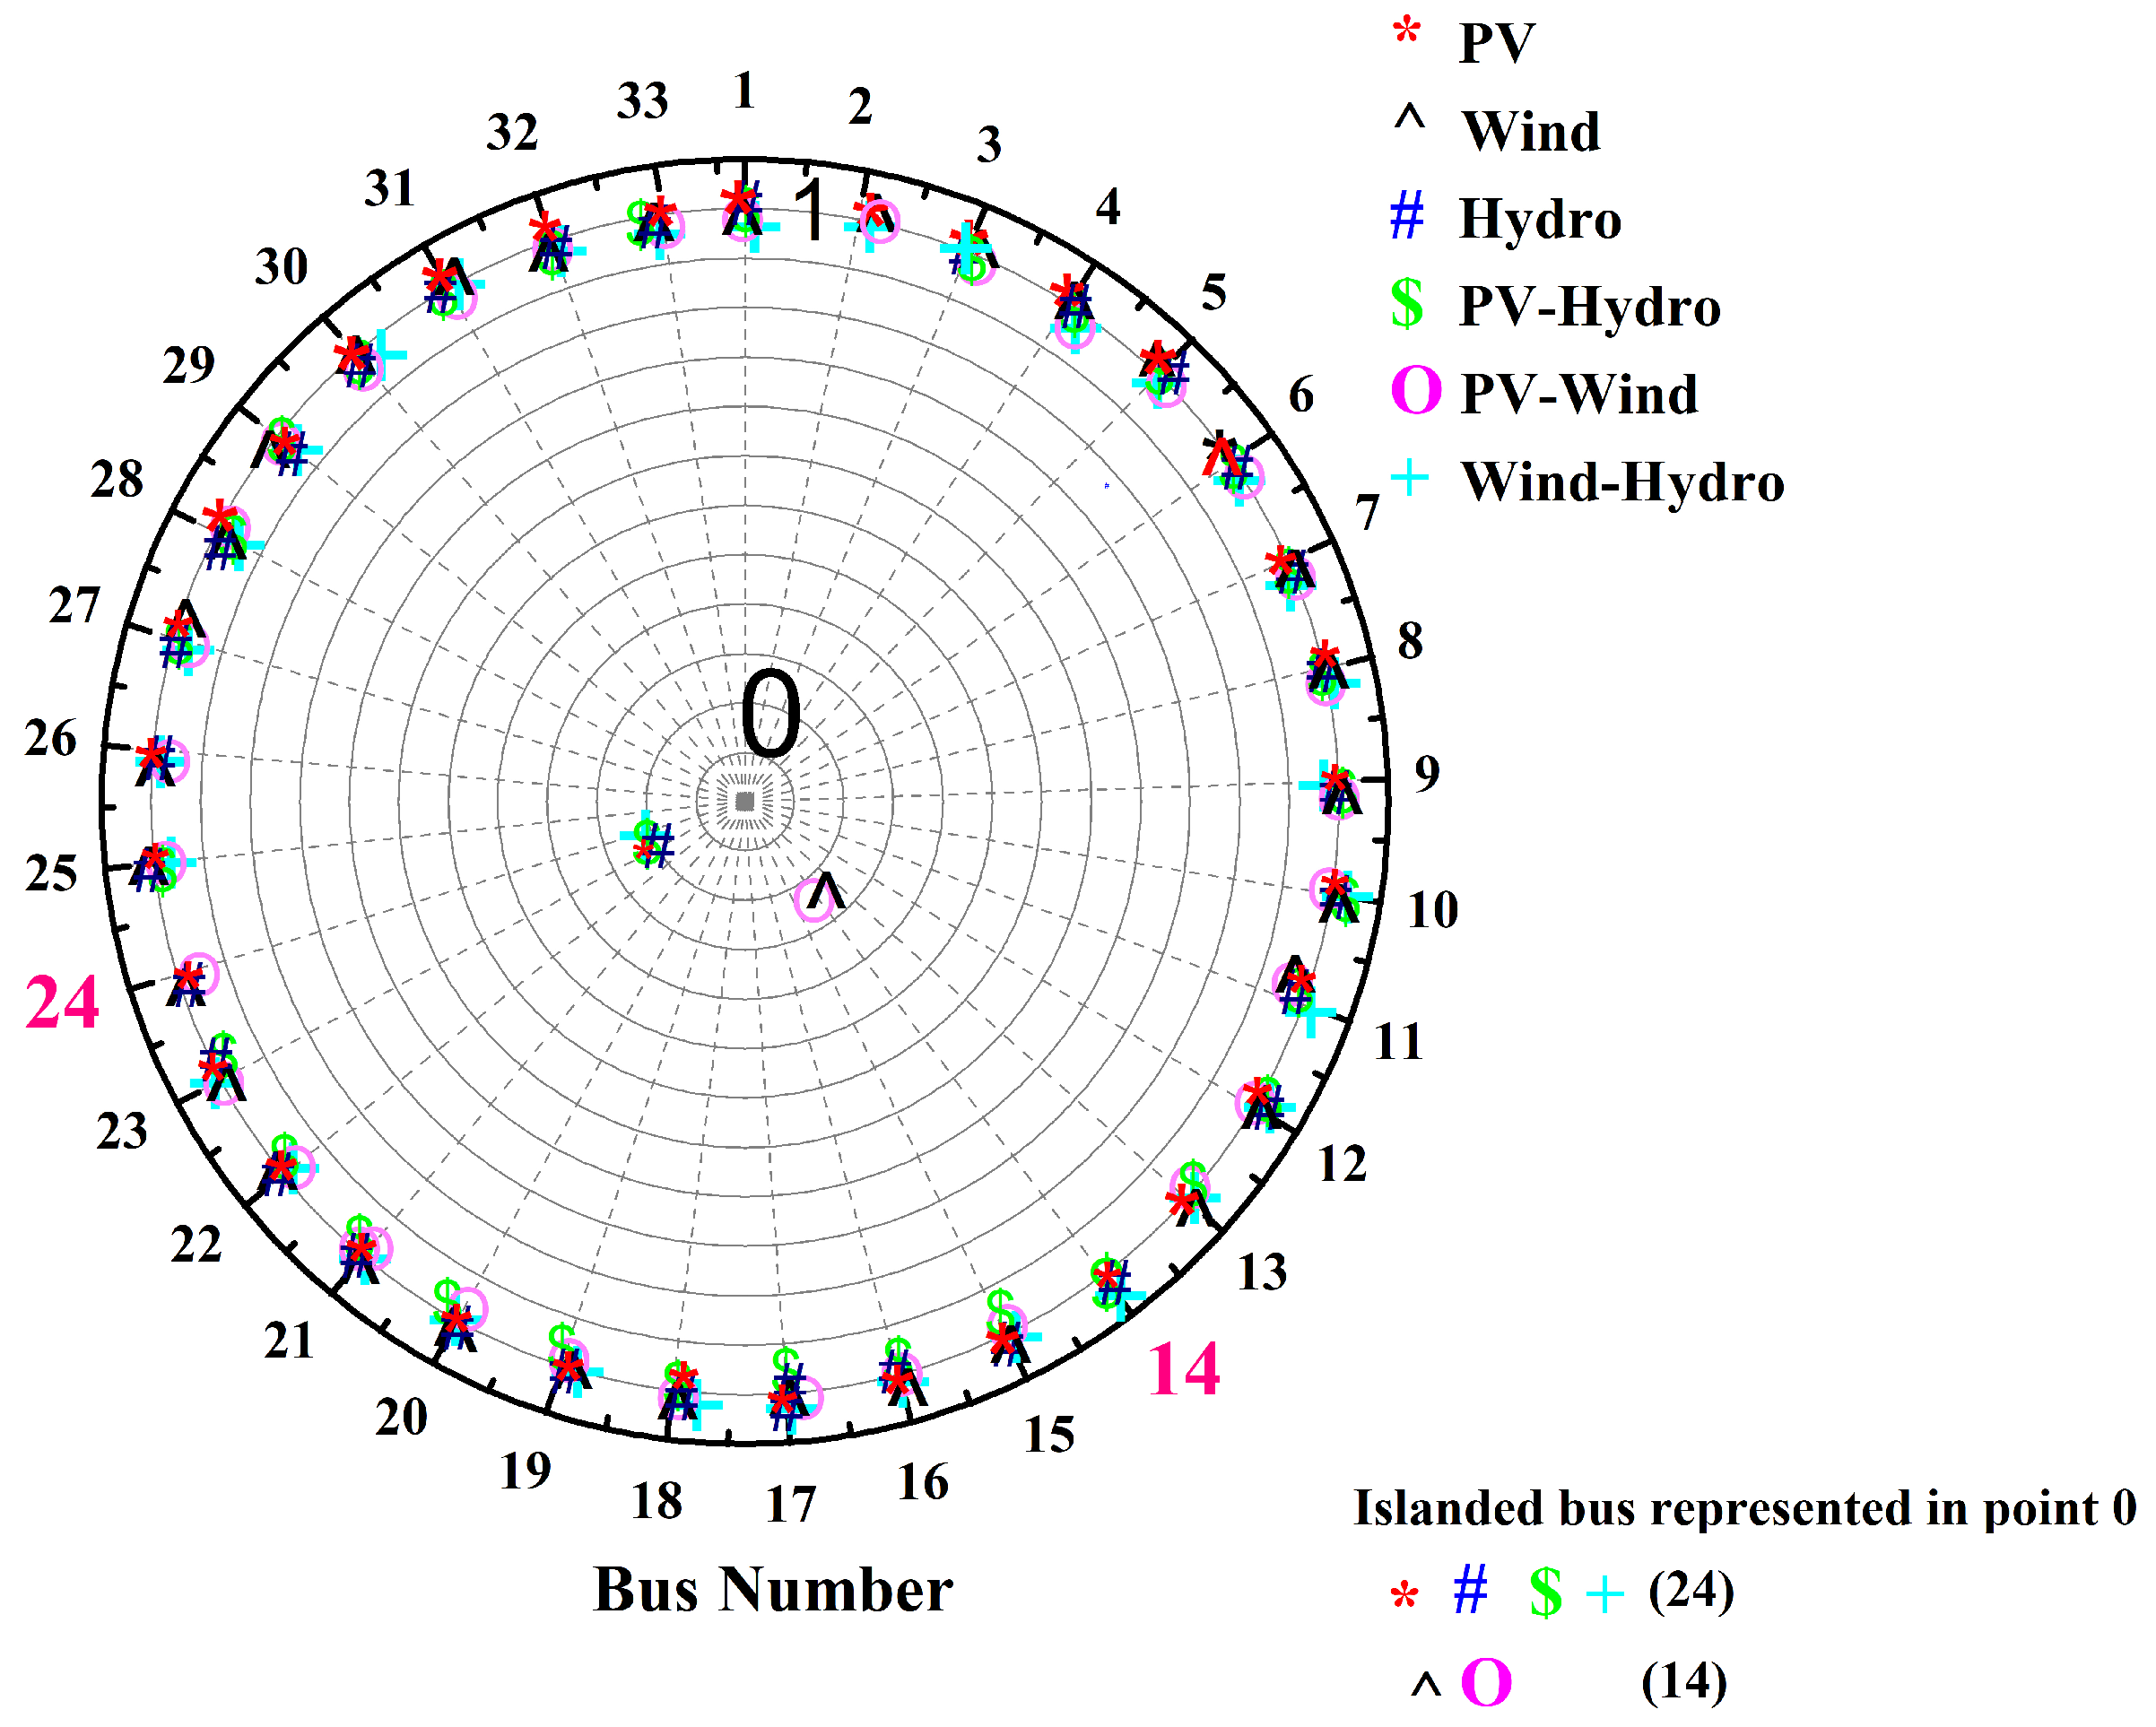
3.1.1. Islanding Detection for the 33 Bus System

The 33 bus system under consideration is shown in Figure 2. The buses 14, 24, and 29 are installed as PV with the rating of 691 kW, 986.1 kW, and 1277.3 kW, respectively [32]. The buses 14 and 30 are installed as Wind with the rating of 722.56 kW and 813.89 kW, respectively [33]. The buses 13, 24, and 30 are installed as Hydro with the rating of 537.8 kW, 1058.9 kW, and 967.7 kW, respectively [32].
Table 5 shows the outcome of the two existing methods with the proposed method for various DG units. The time of detection is determined by the change in voltage and change in frequency at an islanded bus. The loads in various DG combinations are not changed until 0.5 s. After 0.5 s, the loads in all DGs are linearly increased.
While increasing the profile of load, there is a sudden distortion in voltage and frequency at 1.02 s—(PV), 0.75 s—(Wind), 0.6 s—(Hydro), 0.75 s—(PV-Hydro), 0.58 s—(PV-Wind), and 0.75 s—(Wind-Hydro). In the presence of PV, the proposed methodology noticed islanding at the 24th bus at 114.6% of the base load itself. However, by existing methods [26,27], the islanding is noticed at base loads of 116.1% and 129.3%.
In the presence of Wind, the proposed method noticed islanding at 14th bus at 113.1% of the base load itself. However, by existing methods [26,27], the islanding is detected at base loads of 114.3% and 119.2%.
In the presence of Hydro, the proposed method noticed islanding at the 24th bus at 111.9% of the base load itself. However, by existing methods [26,27], the islanding is noticed at base loads of 129.7% and 112.9%.
In the presence of PV-Hydro, the proposed method noticed islanding at the 24th bus at 113.4% of the base load itself. However, by existing methods [26,27], the islanding is noticed at base loads of 124.4% and 124.2%.
In the presence of PV-Wind, the proposed method noticed islanding at the 14th bus at 111.7% of the base load itself. However, by existing methods [26,27], the islanding is noticed at base loads of 112.6% and 129.9%.
In the presence of Wind-Hydro, the proposed method noticed islanding at the 24th bus at 113.4% of the base load itself. However, by existing methods [26,27], the islanding is noticed at the base load of 130%.
In the proposed v&f index (passive islanding) method, voltage and frequency are monitored regularly, M 1 and M 2 are calculated for different DGs from Equation (8). The islanding is detected mostly at the 24th bus. This is because the larger generation in the bus leads to violation of the frequency limits.
Figure 3a,b represents the voltage and frequency deviation of buses in the presence of various distributed generation units. Buses in which the threshold crossed from the fixed voltage (0.99 to 1.05 p.u.) and fixed frequency (±2% of the rated frequency) were considered to be islanded buses. Figure 4 has ‘0’ and ‘1’ which denotes the islanded bus and non-islanded bus, respectively.

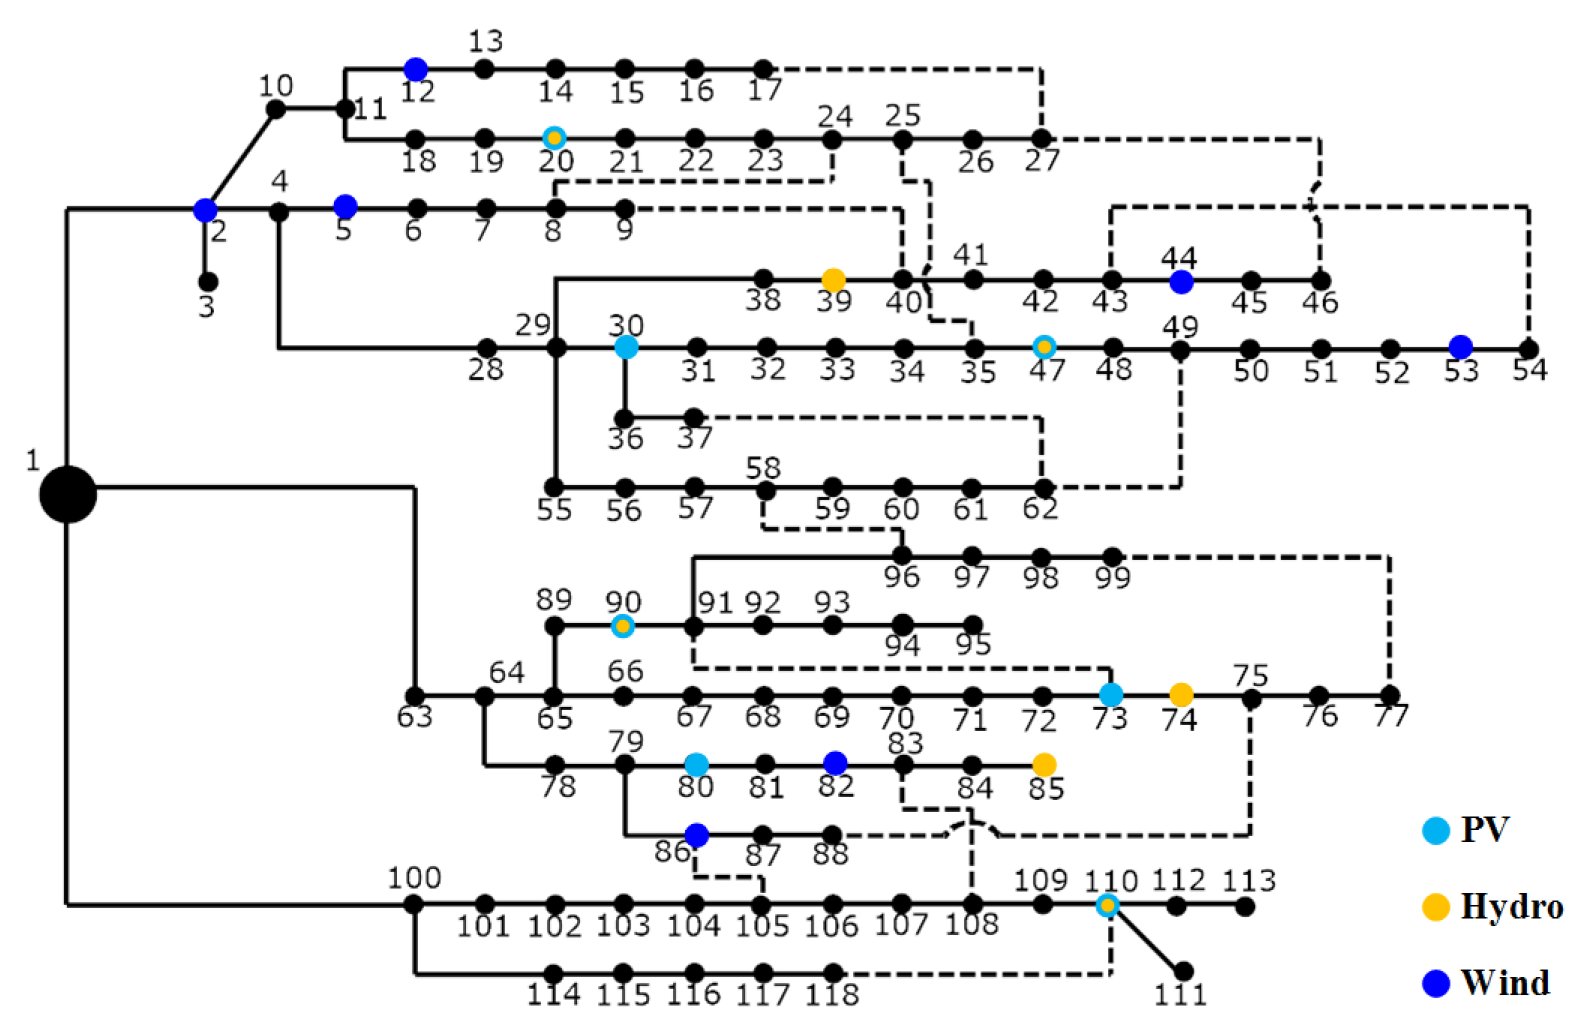
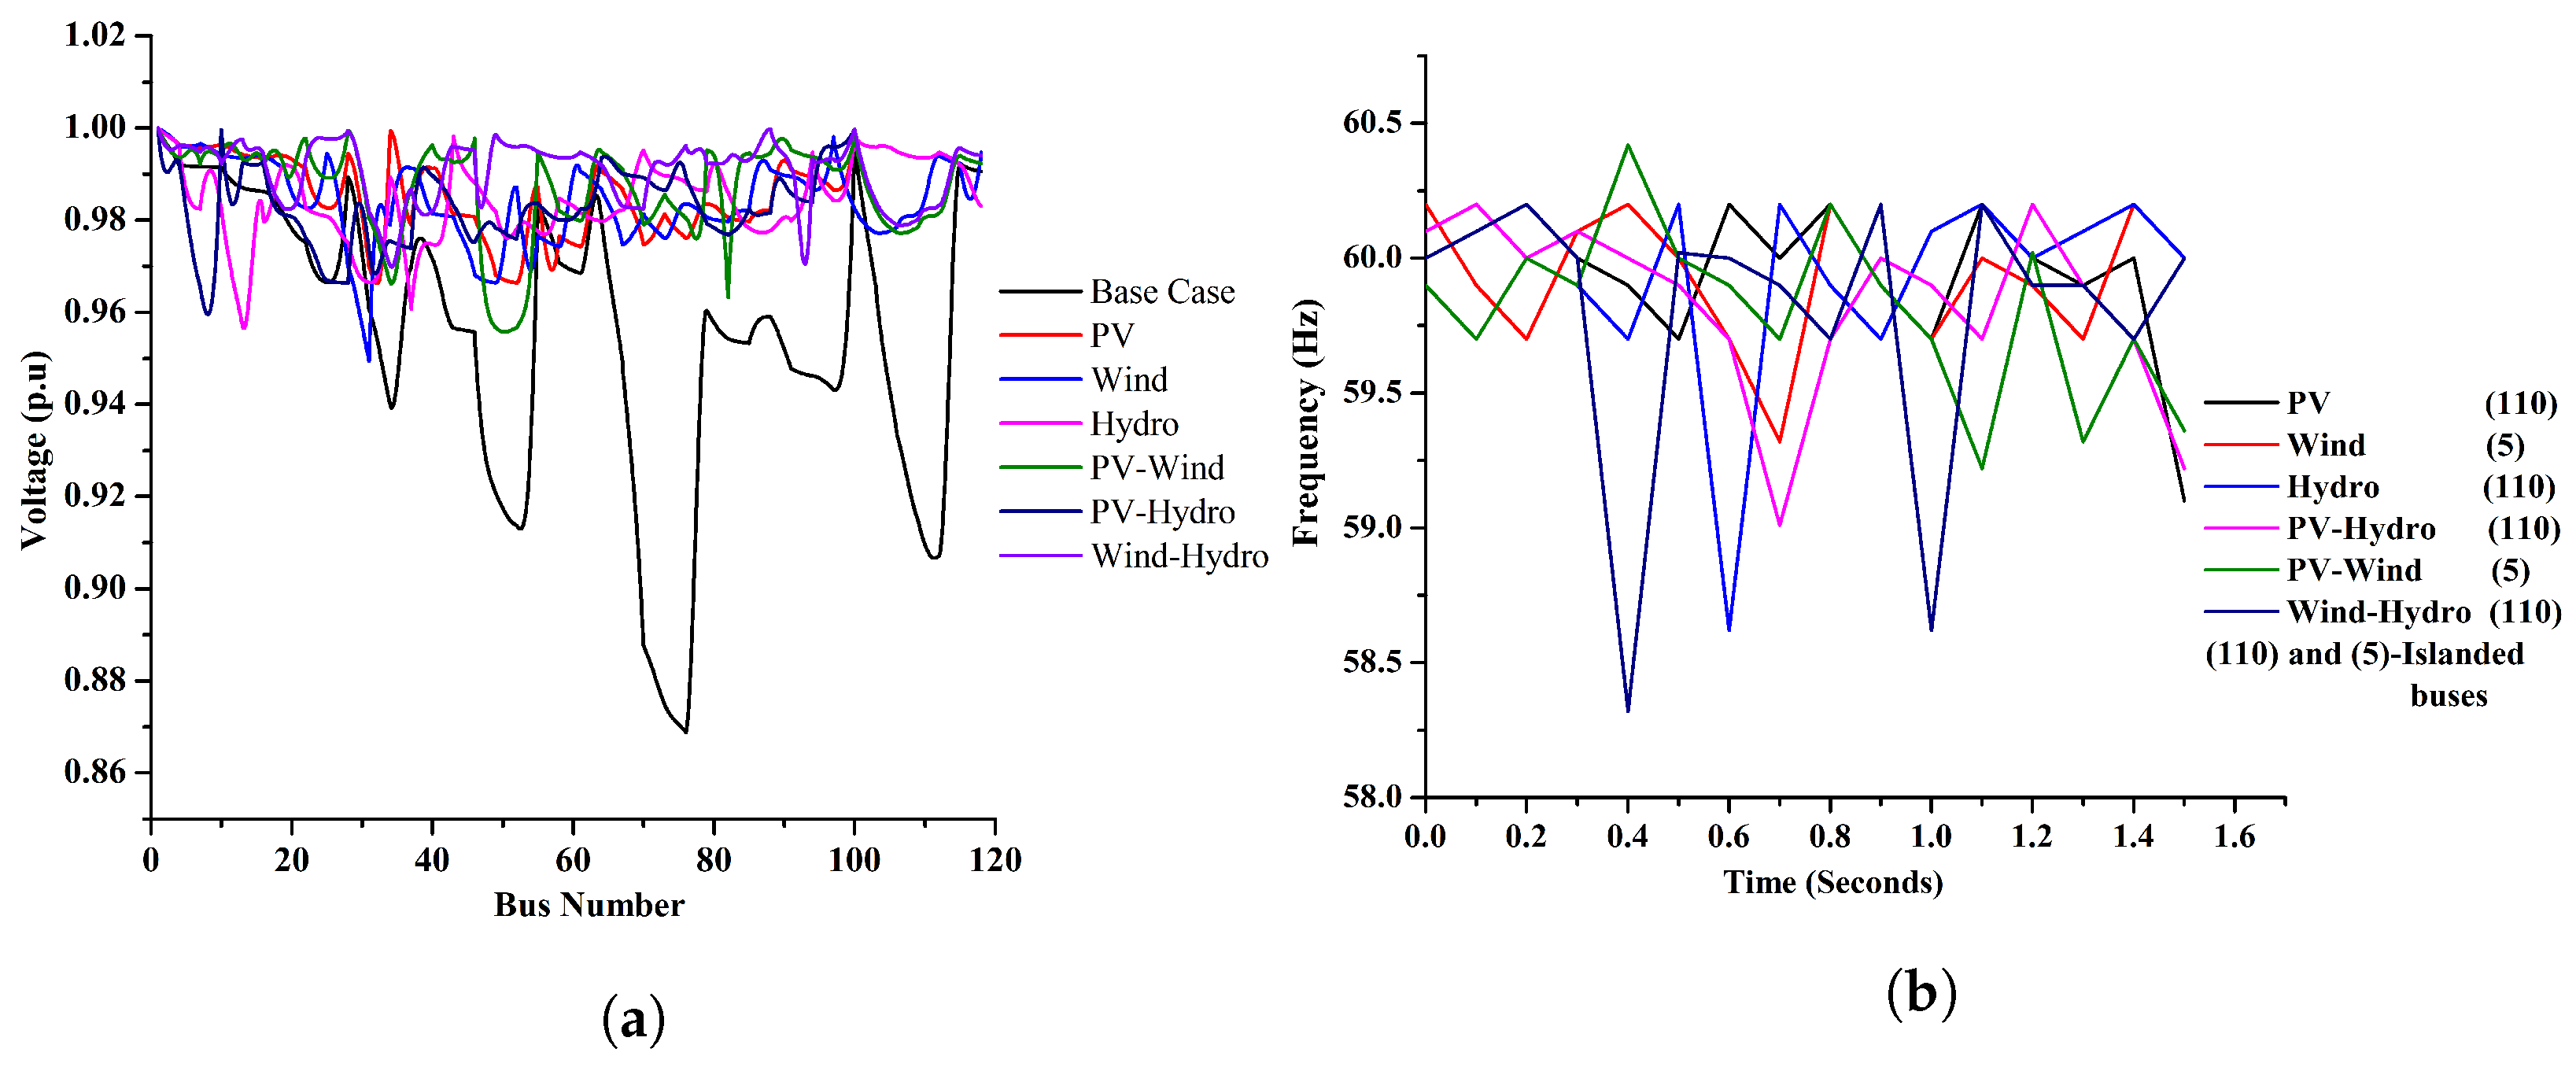
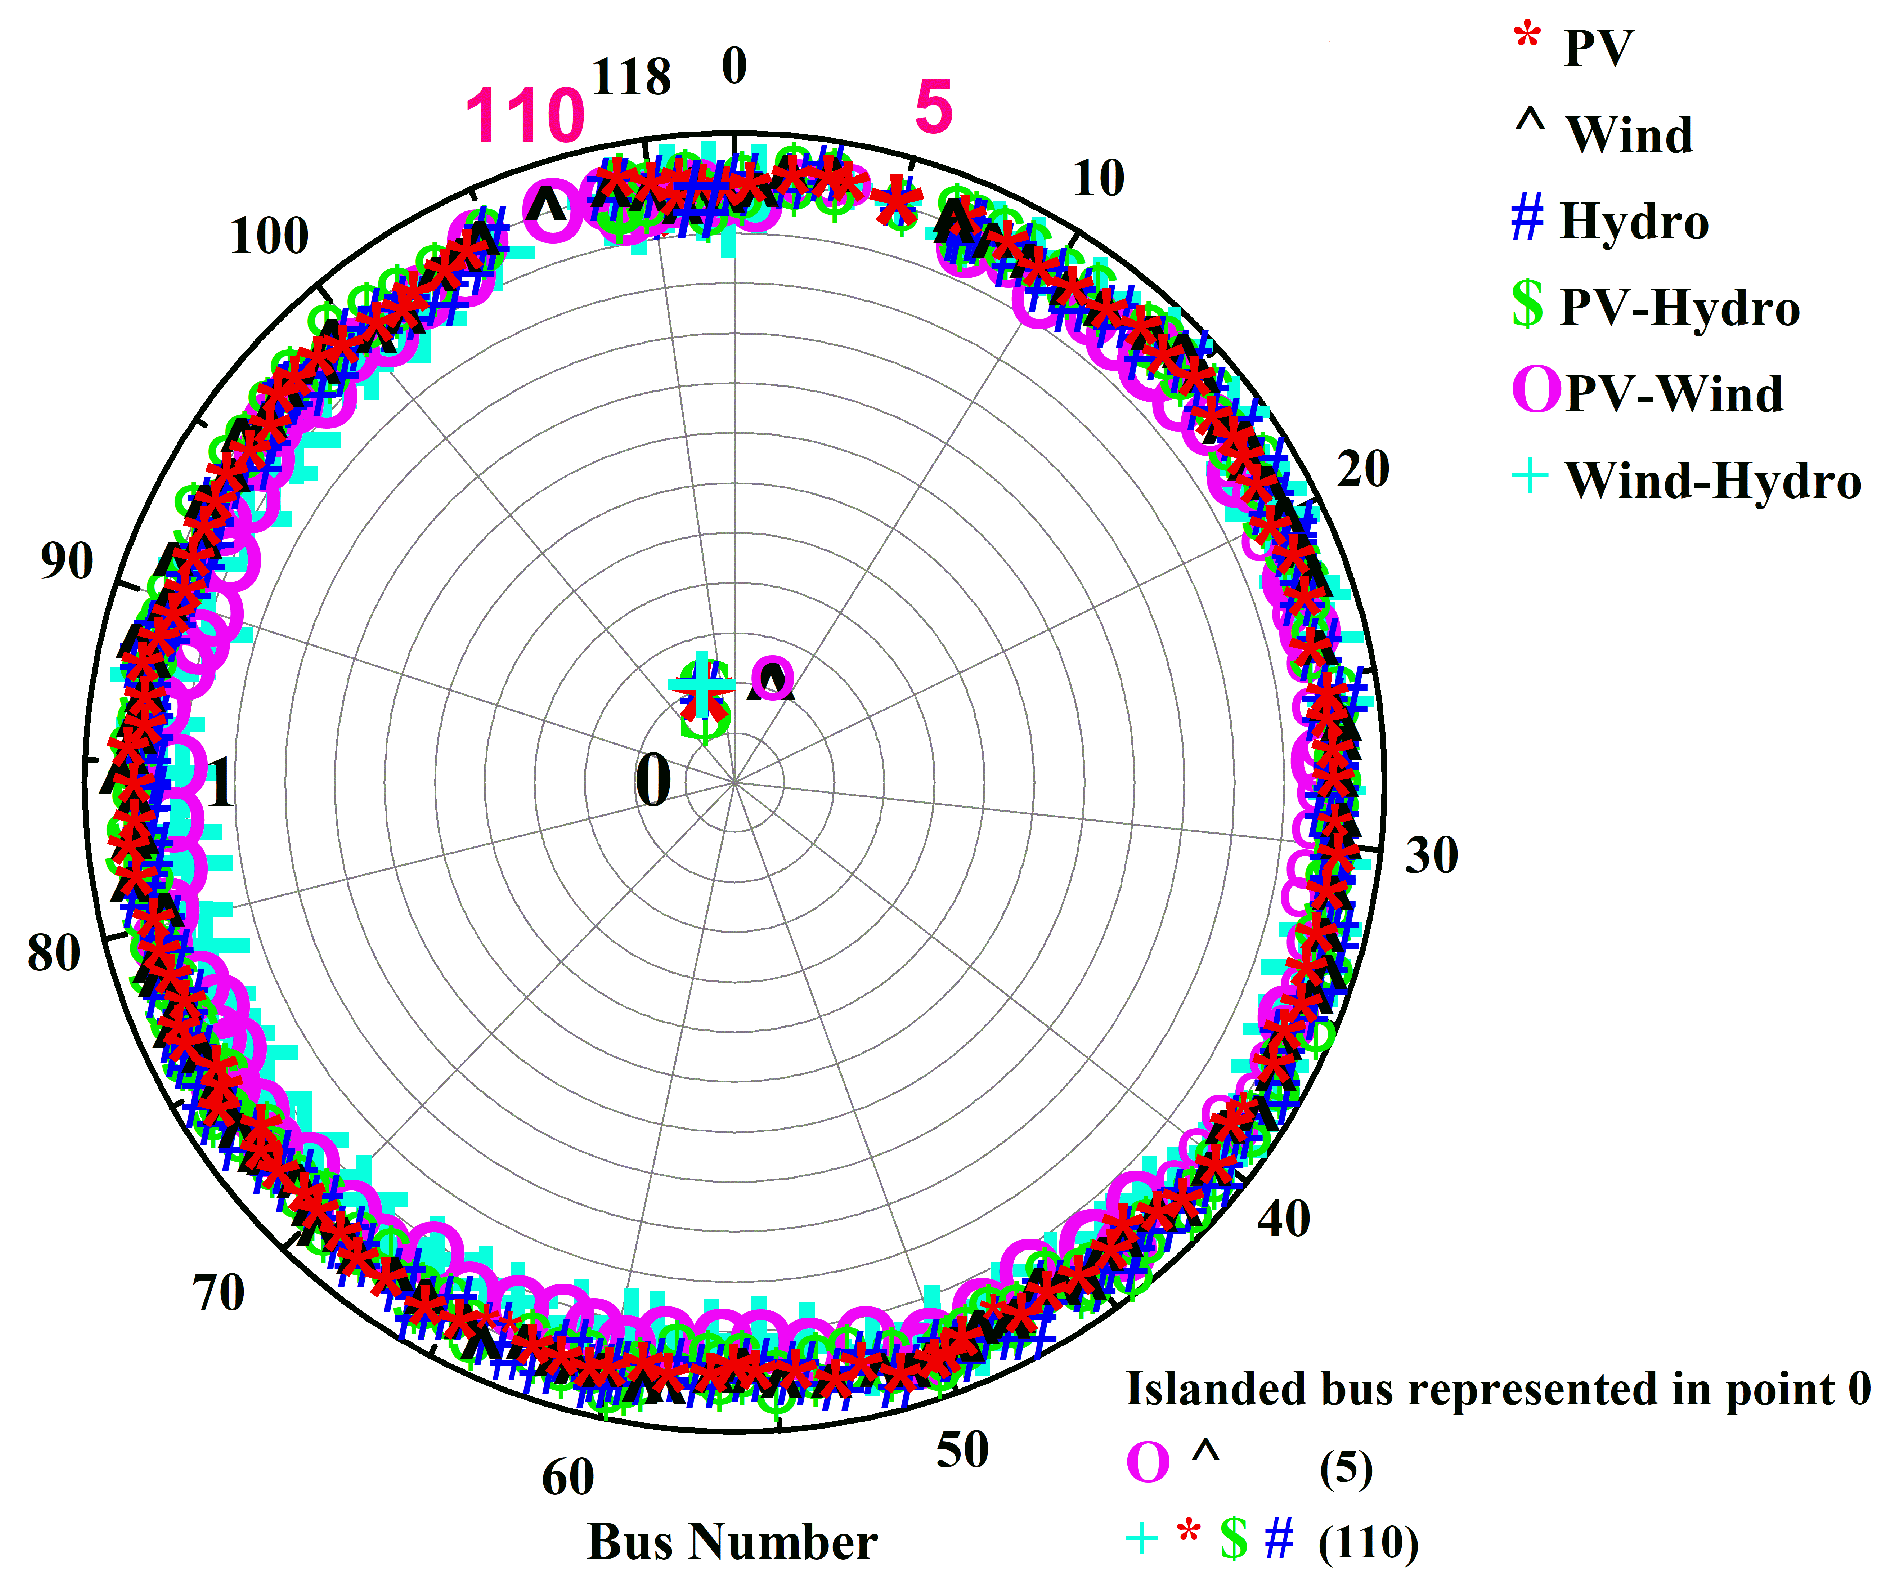
3.1.2. Islanding Detection for the 118 Bus System

The 118 bus system under consideration is shown in Figure 5. The buses 20, 30, 47, 73, 80, 90, and 110 are installed as PV with the rating of 2.0856 MW, 3.3381 MW, 2.1249 MW, 2.794 MW, 2.0369 MW, 2.6069 MW, and 3.1877 MW, respectively [34]. The buses 2, 5, 12, 44, 53, 82, and 86 are installed as Wind with the rating of 2.1 MW, 1.7 MW, 1.65 MW, 2 MW, 1.55 MW, 1.85 MW, and 1.95 MW, respectively [35]. The buses 20, 39, 47, 74, 85, 90, and 110 are installed as Hydro with the rating of 2.0187 MW, 3.2905 MW, 2.0615 MW, 2.4092 MW, 1.7437 MW, 2.5473 MW, and 3.1775 MW, respectively [34].
Table 6 shows comparison results of two existing methods with the proposed method for various DG units. The time of detection is determined by the change in voltage and change in frequency at an islanded buses. The loads in various DG combinations are not changed until 0.5 s. After 0.5 s, the loads in all DGs are linearly increased.
While increasing the profile of load there is a sudden distortion in voltage and frequency at 1.25 s—(PV), 1.30 s—(Wind), 1.50 s—(Hydro), 1.79 s—(PV-Hydro), 0.55 s—(PV-Wind) and 0.93 s—(Wind-Hydro).
In the presence of PV, the proposed method noticed islanding at the 110th bus at 114.9% of the base load itself. However, by existing methods [26,27], the islanding is noticed at base loads of 120.9% and 123.5%.
In the presence of Wind, the proposed method noticed islanding at the 5th bus at 112.5% of the base load itself. However, by existing methods [26,27], the islanding is noticed at base loads of 128.3% and 114.7%.
In the presence of Hydro, the proposed method noticed islanding at the 110th bus at 120.3% of the base load itself. However, by existing methods [26,27], the islanding is noticed at a base load of 125.9%.
In the presence of PV-Hydro and Wind-Hydro, the proposed method noticed islanding at tbe 110th bus at 128.7% (PV-Hydro) of base load and 111.3% (Wind-Hydro) of base load. However, by existing methods [26,27], the islanding is noticed at base loads of 129.5% and 130% for PV-Hydro, and 112% and 113.4% for Wind-Hydro.
In the presence of PV-Wind, the proposed method noticed islanding at the 5th bus at 113.6% of the base load itself. However, by existing methods [26,27], the islanding is noticed at base loads of 130% and 124.3%.
In the proposed v&f index (passive islanding) method, voltage and frequency are monitored regularly, M 1 and M 2 are calculated for different cases of DGs from Equation (8). The islanding is noticed mostly at the 110th bus. This is because the larger generation or load in the bus leads to violation of the frequency limits.
Figure 6a,b denotes the voltage and frequency deviation of buses in the presence of various distributed generation units. Buses in which the threshold crossed from the fixed voltage (0.99 to 1.05 p.u.) and fixed frequency (±2% of the rated frequency) were considered to be islanded buses. Figure 7 has ‘0’ and ‘1’, which represent the islanded bus and non-islanded bus, respectively.

3.2. Reconfiguration and Reliability Evaluation

The PSO technique is used for the reconfiguration. The identified vulnerable switch is opened and the remaining switches which must be opened without forming the loop to perform the reconfiguration. This ensures that the power loss is reduced and voltage profile is improved. The reliability analysis is performed for the IEEE-33 and 118 bus distribution system. Furthermore, the reconfiguration is performed for the vulnerable buses identified by the existing methods of islanding detection. The reliability indices after reconfiguration are calculated by selecting the global best solution with the fitness values using PSO. Each load of the system is considered to be an aggregated number of customers for evaluating the reliability indices.

3.2.1. Evaluation for the 33 Bus System

The reliability indices measurement of the 33 bus system using customer interruption is shown in Table 7. In this bus system, with the presence of distributed generation units, the islanded bus was identified by the proposed v&f index method.
The islanded distribution system can be restored by performing a reconfiguration of the network. The network reconfiguration is performed by identifying the most vulnerable buses. For this 33-bus system, it is necessary to keep five switches open to ensure radiality of the system. The identified vulnerable switch is incorporated by replacing any one (as identified from the results shown in Table 7) of the switches in the opened switches of the bus system and the reliability indices are computed as per Equations (21) to (24). In this bus system, switches 7, 9, 14, 32, and 37 are opened for PV. Similarly, 7, 9, 14, 28, and 32 are opened for Hydro, 7, 9, 14, 28, and 32 are opened for PV-Hydro, and 7, 9, 14, 32, and 37 are opened for Wind-Hydro. The reliability indices are compared in the presence of different DG units with the islanded buses identified by the methods given in [26,27].
In base case topology, the ENS indices are improved by 82.77% and 79.76% using the proposed technique, as compared with the first existing technique [26] and second existing technique [27], respectively. Likewise, AENS indices are improved by 86.08% and 84.43% using the proposed technique compared with the first existing technique [26] and second existing technique [27], respectively; SAIDI indices are improved by 52.72% and 61.39% using the proposed technique compared with the first existing technique [26] and second existing technique [27], respectively; SAIFI indices are improved by 69.21% and 76.66% using the proposed technique compared with the first existing technique [26] and second existing technique [27], respectively; and ASAI indices are improved by 11.64% and 11.19% using the proposed technique compared with the the first existing technique [26] and second existing technique [27], respectively.
In the reconfigured topology with the presence of PV, ENS indices are improved by 82.90% and 80.31% with the proposed technique compared with the first existing technique [26] and second existing technique [27], respectively. Likewise, AENS indices are improved by 85.11% and 82.98% using the proposed technique compared with the first existing technique [26] and second existing technique [27], respectively; SAIDI indices are improved by 53.84% and 60.03% using the proposed technique compared with the first existing technique [26] and second existing technique [27], SAIFI indices are improved by 73.41% and 82.01% using the proposed technique compared with the first existing technique [26] and second existing technique [27] and ASAI indices are improved by 24.48% and 19.78% using the proposed technique compared with the first existing technique [26] and second existing technique [27], respectively.
In the reconfigured topology with the presence of Hydro, ENS indices are improved by 82.91% and 80.37% using the proposed technique compared with the first existing technique [26] and second existing technique [27], respectively. Likewise, AENS indices are improved by 84.56% and 83.24% using the proposed technique compared with the first existing technique [26] and second existing technique [27], SAIDI indices are improved by 57.14% and 62.78% using the proposed technique compared with the first existing technique [26] and second existing technique [27], SAIFI indices are improved by 74.18% and 82.54% using the proposed technique compared with the first existing technique [26] and second existing technique [27] and ASAI indices are improved by 23.27% and 19.70% using the proposed technique compared with the first existing technique [26] and second existing technique [27], respectively.
In the reconfigured topology with the presence of PV-Hydro, ENS indices are improved by 82.84% and 80.30% using the proposed technique compared with the first existing technique [26] and second existing technique [27], respectively. Likewise, AENS indices are improved by 84.43% and 83.44% using the proposed technique compared with the first existing technique [26] and second existing technique [27], SAIDI indices are improved by 62.29% and 67.67% using the proposed technique compared with the first existing technique [26] and second existing technique [27], SAIFI indices are improved by 77.91% and 85.15% using the proposed technique compared with the first existing technique [26] and second existing technique [27] and ASAI indices are improved by 34.20% and 27.41% using the proposed technique compared with the first existing technique [26] and second existing technique [27], respectively.
In the reconfigured topology with the presence of Wind-Hydro, ENS indices are improved by 81.96% and 80.14% using the proposed technique compared with the first existing technique [26] and second existing technique [27], respectively. Likewise, AENS indices are improved by 84.36% and 83.54% using the proposed technique compared with the first existing technique [26] and second existing technique [27], SAIDI indices are improved by 66.66% and 72.50% using the proposed technique compared with the first existing technique [26] and second existing technique [27], SAIFI indices are improved by 80.75% and 81.96% using the proposed technique compared with the first existing technique [26] and second existing technique [27] and ASAI indices are improved by 35.68% and 32.71% using the proposed technique compared with the first existing technique [26] and second existing technique [27], respectively.

3.2.2. Evaluation for the 118 Bus System

The reliability indices measurement of the 118 bus system using customer interruption is shown in Table 8. In this bus system, with the presence of distributed generation units the islanded bus has been identified by the proposed v&f index method.
For this 118-bus system, it is necessary to keep 15 switches open to ensure the radiality of the system. The identified vulnerable switch is incorporated by replacing any one (as identified from the results shown in Table 8) of the switches in the opened switches of the bus system and the reliability indices are computed as per Equation (21) to (24). In this bus system, switches 24, 27, 34, 40, 43, 52, 59, 72, 75, 96, 98, 110, 123, 130, and 131 are opened for PV. Similarly, 9, 23, 35, 43, 52, 60, 71, 74, 82, 96, 99, 110, 120, 122, and 131 are opened for Hydro, 23, 27, 33, 43, 53, 62, 72, 75, 123, 125, 126, 129, 130, 131, and 132 are opened for PV-Hydro, and 9, 23, 35, 43, 52, 60, 71, 74, 82, 96, 99, 110, 120, 122, and 131 are opened for Wind-Hydro. The reliability indices are compared in the presence of different DG units with the islanded buses identified by the methods given in [26,27].
In the base case topology, ENS indices are improved by 39.04% and 38.17% using the proposed technique compared with the first existing technique [26] and second existing technique [27], respectively. Likewise, AENS indices are improved by 59.06% and 56.40% using the proposed technique compared with the first existing technique [26] and second existing technique [27], respectively; SAIDI indices are improved by 48.64% and 34.48% using the proposed technique compared with the first existing technique [26] and second existing technique [27], respectively; SAIFI indices are improved by 96.01% and 95.96% using the proposed technique compared with the first existing technique [26] and second existing technique [27], respectively; and ASAI indices are improved by 33.50% and 32.10% using the proposed technique compared with the first existing technique [26] and second existing technique [27], respectively.
In the reconfigured topology with the presence of PV, ENS indices are improved by 35.93% and 35.68% using the proposed technique compared with the first existing technique [26] and second existing technique [27], respectively. Likewise, AENS indices are improved by 62.08% and 62.29% using the proposed technique compared with the first existing technique [26] and second existing technique [27], respectively; SAIDI indices are improved by 62.85% and 51.85% using the proposed technique compared with the first existing technique [26] and second existing technique [27], respectively; SAIFI indices are improved by 96.56% and 96.57% using the proposed technique compared with the first existing technique [26] and second existing technique [27] and ASAI indices are improved by 28.16% and 23.78% using the proposed technique compared with the first existing technique [26] and second existing technique [27], respectively.
In the reconfigured topology with the presence of Hydro, ENS indices are improved by 34.71% and 34.20% using the proposed technique compared with the first existing technique [26] and second existing technique [27], respectively. Likewise, AENS indices are improved by 70.65% and 71.68% using the proposed technique compared with the first existing technique [26] and second existing technique [27], respectively; SAIDI indices are improved by 65.51% and 56.52% using the proposed technique compared with the first existing technique [26] and second existing technique [27], respectively; SAIFI indices are improved by 96.96% and 96.98% using the proposed technique compared with the first existing technique [26] and second existing technique [27] and ASAI indices are improved by 25.30% and 20.39% using the proposed technique compared with the first existing technique [26] and second existing technique [27], respectively.
In the reconfigured topology with the presence of PV-Hydro, ENS indices are improved by 59.77% and 59.44% using the proposed technique compared with the first existing technique [26] and second existing technique [27], respectively. Likewise, AENS indices are improved by 70.41% and 65.92% using the proposed technique compared with the first existing technique [26] and second existing technique [27], respectively; SAIDI indices are improved by 72% and 66.66% using the proposed technique compared with the first existing technique [26] and second existing technique [27], respectively; SAIFI indices are improved by 97.97% and 97.97% using the proposed technique compared with the first existing technique [26] and second existing technique [27] and ASAI indices are improved by 31.44% and 27.33% using the proposed technique compared with the first existing technique [26] and second existing technique [27], respectively.
In the reconfigured topology with the presence of Wind-Hydro, ENS indices are improved by 59.94% and 59.94% using the proposed technique compared with the first existing technique [26] and second existing technique [27], respectively. Likewise, AENS indices are improved by 72.86% and 68.66% using the proposed technique compared with the first existing technique [26] and second existing technique [27], respectively; SAIDI indices are improved by 82.60% and 80% using the proposed technique compared with the first existing technique [26] and second existing technique [27], respectively; SAIFI indices are improved by 98.61% and 98.95% using the proposed technique compared with the first existing technique [26] and second existing technique [27] and ASAI indices are improved by 32.05% and 28.85% using the proposed technique compared with the first existing technique [26] and second existing technique [27], respectively.

4. Conclusions and Future Scope

The IEEE-33 and 118 electrical bus systems have been analyzed with various DG units. The islanding may occur due to sudden deviation in voltage and frequency at several buses. From the above system results, it is deduced that the proposed v&f index (passive islanding) method is effective for accurate detection of the islanded bus. In the existing methods, the voltage (v) violation and frequency (f) violation are studied separately, which leads to Non-Detection Zone. In the proposed v&f index (passive islanding) method, the changes of voltage and frequency are studied simultaneously, which minimizes the Non-Detection Zone and helps to identify the accurate islanded bus. Furthermore, the proposed method detects the islanded buses quicker than the existing methods and the number of islanded buses are lesser than the existing techniques.
The reliability of the system is improved by altering the topology of the system through reconfiguration. The reconfiguration is performed after detection of the vulnerable buses for islanding by the proposed v&f index (passive islanding) method. In the first stage, the reliability indices of the base case topology are considered. In this stage, the reliability indices of the system identified by different islanding detection techniques are evaluated. In the second stage, the reliability indices of base case topology are compared with the reliability indices in the presence of different DGs by a particular method of islanding detection. In the third stage, the reliability indices of a particular topology of reconfiguration are compared across different islanding detection methods. From these results, it was found that the proposed islanding detection method in combination with the proposed reconfiguration method gives improved reliability of the system. This is due to the proper selection of switches to be opened by reconfiguration using PSO technique.
Due to operational conditions, the interruption cost (penalty) or lost profit from not supplied energy are not considered in this work, as the cost of electricity is not known. If the cost of electricity is known based on Real Time Price or Time of Use, this could be extended in the future.

Author Contributions

Conceptualization, S.R.; Methodology & Writing, S.R. and N.K.; Writing—original draft, N.K.; review & editing, G.S.; Supervision, P.N.B. All authors have read and agreed to the published version of the manuscript.

Funding

This research received no external funding.

Data Availability Statement

Not applicable.

Conflicts of Interest

The authors declare no conflict of interest

Abbreviations

DGDistributed Generation
v&fvoltage and frequency
PSOParticle Swarm Optimization
NDZNon-Detection Zone
ENSEnergy Not Supplied
SAIDISystem Average Interruption Duration Index
SAIFISystem Average Interruption Frequency Index
ASAIAverage Service Availability Index
BFSBackward and Forward Sweep
AENSAverage Energy Not Supplied
N p a n Number of panels
F f a c t Fill Factor
C v o l t Voltage coefficient
K c u r n t Current coefficient
O P o w e r Output power
V p a n Panel voltage
I p a n Panel current
I M N P O The Maximum Net Power Output (MNPO) current
V M N P O The Maximum Net Power Output (MNPO) voltage
W r p o w Power (Rated)
S r a t Rated speed
C i n s p Speed (cut in)
C o u t s p Speed (cut out)
ϵ H y Hydraulic efficiency
ϱ Density
P h e Effective pressure
g a c Acceleration
M 1 and M 2 v&f index and threshold
S 1 and S 2 The phase voltage related to time, frequency and voltage
P l o ( n ) (Real power) difference between first bus to next bus
P a l o ( n ) Actual load
N s m p l Samples (Range)
V o p e r a t i n g ( N ) Operating voltage new
V o p e r a t i n g Operating bus voltage
b V Voltage (base)
f c h Change in (f)-frequency
V c h Change in voltage
D f r Calculated frequency
nNumber of buses
G b and P ( b e ) global best solution and personal best solution
V i j particle velocity
‘F’fitness value or objective function
y i t + 1 specific place of the particle
( K 1 )acceleration constant
r 1 j t random numbers
n j customer interruption or customer not served
h j customer hours available services
λ j failure rate
n t total number of customer served
L b ( j ) total demand

References

  1. Selim, A.; Kamel, S.; Mohamed, A.A.; Elattar, E.E. Optimal Allocation of Multiple Types of Distributed Generations in Radial Distribution Systems Using a Hybrid Technique. Sustainability 2021, 13, 6644. [Google Scholar] [CrossRef]
  2. Mohamed, A.A.; Kamel, S.; Selim, A.; Khurshaid, T.; Rhee, S.B. Developing a Hybrid Approach Based on Analytical and Metaheuristic Optimization Algorithms for the Optimization of Renewable DG Allocation Considering Various Types of Loads. Sustainability 2021, 13, 4447. [Google Scholar] [CrossRef]
  3. Ji, X.; Zhang, X.; Zhang, Y.; Yin, Z.; Yang, M.; Han, X. Three-Phase Symmetric Distribution Network Fast Dynamic Reconfiguration Based on Timing-Constrained Hierarchical Clustering Algorithm. Symmetry 2021, 13, 1479. [Google Scholar] [CrossRef]
  4. Shahid, M.U.; Alquthami, T.; Siddique, A.; Munir, H.M.; Abbas, S.; Abbas, Z. RES Based Islanded DC Microgrid with Enhanced Electrical Network Islanding Detection. Energies 2021, 14, 8432. [Google Scholar] [CrossRef]
  5. Lopez, J.R.; Ibarra, L.; Ponce, P.; Molina, A. A Decentralized Passive Islanding Detection Method Based on the Variations of Estimated Droop Characteristics. Energies 2021, 14, 7759. [Google Scholar] [CrossRef]
  6. Abokhalil, A.G.; Awan, A.B.; Al-Qawasmi, A.R. Comparative Study of Passive and Active Islanding Detection Methods for PV Grid-Connected Systems. Sustainability 2018, 10, 1798. [Google Scholar] [CrossRef] [Green Version]
  7. Bukhari, S.B.A.; Mehmood, K.K.; Wadood, A.; Park, H. Intelligent Islanding Detection of Microgrids Using Long Short-Term Memory Networks. Energies 2021, 14, 5762. [Google Scholar] [CrossRef]
  8. Montoya, O.D.; Arias-Londoño, A.; Grisales-Noreña, L.F.; Barrios, J.Á.; Chamorro, H.R. Optimal Demand Reconfiguration in Three-Phase Distribution Grids Using an MI-Convex Model. Symmetry 2021, 13, 1124. [Google Scholar] [CrossRef]
  9. Bakhshi-Jafarabadi, R.; Sadeh, J.; Rakhshani, E.; Popov, M. High power quality maximum power point tracking-based islanding detection method for grid-connected photovoltaic systems. Int. J. Electr. Power Energy Syst. 2021, 131, 107103. [Google Scholar] [CrossRef]
  10. Yafaoui, A.; Wu, B.; Kouro, S. Improved active frequency drift anti-islanding detection method for grid connected photovoltaic systems. IEEE Trans. Power Electron. 2011, 2, 2367–2375. [Google Scholar] [CrossRef]
  11. Ma, J.; Mi, C.; Zheng, S.; Wang, T.; Lan, X.; Wang, Z.; Thorp, J.S.; Phadke, A.G. Application of voltage harmonic distortion positive feedback for islanding detection. Electr. Power Compon. Syst. 2013, 41, 641–652. [Google Scholar] [CrossRef]
  12. Somalwar, R.; Kadwane, S.G.; Mohanta, D.K. Harmonics-based enhanced passive islanding method for grid-connected system. Electr. Power Compon. Syst. 2017, 45, 1554–1563. [Google Scholar] [CrossRef]
  13. Zarei, M.; Zangeneh, A. Multi-objective optimization model for distribution network reconfiguration in the presence of distributed generations. Int. Trans. Electr. Energy Syst. 2017, V27, e2425. [Google Scholar] [CrossRef]
  14. Mohammadzadeh Niaki, A.H.; Afsharnia, S. A new passive islanding detection method and its performance evaluation for multi-DG systems. Electr. Power Syst. Res. 2014, 110, 180–187. [Google Scholar] [CrossRef]
  15. Sivanagaraju, S.; Visali, N.; Sankar, V.; Ramana, T. Enhancing voltage stability of radial distribution systems by network reconfiguration. Electr. Power Compon. Syst. 2005, V33, 539–550. [Google Scholar] [CrossRef]
  16. Awad, A.S.A.; El-Fouly, T.H.M.; Salama, M.M.A. Optimal distributed generation allocation and load shedding for improving distribution system reliability. Electr. Power Compon. Syst. 2014, 42, 576–584. [Google Scholar] [CrossRef]
  17. Cheng, S.; Wei, Z.; Shang, D.; Zhao, Z.; Chen, H. Charging Load Prediction and Distribution Network Reliability Evaluation Considering Electric Vehicles’ Spatial-Temporal Transfer Randomness. IEEE Access 2020, 8, 124084–124096. [Google Scholar] [CrossRef]
  18. He, J.; Guan, X. Uncertainty sensitivity analysis for reliability problems with parametric distributions. IEEE Trans. Reliab. 2017, 6, 712–721. [Google Scholar] [CrossRef]
  19. Jikeng, L.; Xudong, W.; Ling, Q. Reliability evaluation for the distribution system with distributed generation. Eur. Trans. Electr. Power 2011, 21, 895–909. [Google Scholar] [CrossRef]
  20. Dong, W.; Li, S.; Zhang, H.; Yu, X.; Hu, T. Sensitivity-based reliability coordination for power systems considering wind power reserve based on hybrid correlation control method for wind power forecast error. Int. Trans. Electr. Energy Syst. 2020, 30, e12307. [Google Scholar] [CrossRef]
  21. Zhu, T.X. A new methodology of analytical formula deduction and sensitivity analysis of EENS in bulk power system reliability assessment. In Proceedings of the 2006 IEEE PES Power Systems Conference and Exposition, Atlanta, GA, USA, 29 October–1 November 2006; pp. 825–831. [Google Scholar]
  22. Angel, A.R.; Manuel, S.A.-A. Design optimization for reliability improvement in microgrids with wind–tidal–photovoltaic generation. Electr. Power Syst. Res. 2020, 188, 106540. [Google Scholar]
  23. Paterakis, N.G.; Mazza, A.; Santos, S.F.; Erdinç, O.; Chicco, G.; Bakirtzis, A.G.; Catalão, J.P.S. Multi-objective reconfiguration of radial distribution systems using reliability indices. IEEE Trans. Power Syst. 2015, 31, 1048–1062. [Google Scholar] [CrossRef]
  24. Soroudi, A.; Aien, M.; Ehsan, M. A probabilistic modeling of photo voltaic modules and wind power generation impact on distribution networks. IEEE Syst. J. 2011, 6, 254–259. [Google Scholar]
  25. Bhandari, B.; Poudel, S.R.; Lee, K.-T.; Ahn, S.-H. Mathematical modeling of hybrid renewable energy system: A review on small hydro-solar-wind power generation. Int. J. Precis. Eng.-Manuf.-Green Technol. 2014, 1, 157–173. [Google Scholar] [CrossRef]
  26. Abd-Elkader, A.G.; Saleh, S.M.; Eiteba, M.B.M. A passive islanding detection strategy for multi-distributed generations. Int. J. Electr. Power Energy Syst. 2018, 99, 146–155. [Google Scholar] [CrossRef]
  27. Narayanan, K.; Siddiqui, S.A.; Fozdar, M. Hybrid islanding detection method and priority-based load shedding for distribution networks in the presence of DG units. IET Gener. Transm. Distrib. 2017, 11, 586–595. [Google Scholar]
  28. Nikhil, G.; Anil, S.; Niazi, K.R. Distribution network reconfiguration for power quality and reliability improvement using Genetic Algorithms. Int. J. Electr. Power Energy Syst. 2014, 54, 664–671. [Google Scholar]
  29. Reddy, A.V.S.; Reddy, M.D. Optimization of network reconfiguration by using Particle swarm optimization. In Proceedings of the 2016 IEEE 1st International Conference on Power Electronics, Intelligent Control and Energy Systems (ICPEICES), Delhi, India, 4–6 July 2016; pp. 1–6. [Google Scholar]
  30. Reddy, C.R.; Reddy, K.H. Islanding Detection Techniques for Grid Integrated Distributed Generation—A Review. Int. J. Renew. Energy Res. 2019, 9, 2. [Google Scholar]
  31. Mathworks. Matlab, 2016b; Mathworks: Natick, MA, USA, 2016. [Google Scholar]
  32. Prakash, D.B.; Lakshminarayana, C. Multiple DG placements in distribution system for power loss reduction using PSO Algorithm. Procedia Technol. 2016, 25, 785–792. [Google Scholar] [CrossRef] [Green Version]
  33. Pottukkannan, B.; Suvarchala, K.; Muthukannan, P.; Thangaraj, Y. Optimal Allocation of Renewable Distributed Generation in Radial Distribution Network. J. Adv. Res. Dyn. Control. Syst. 2018, 10, 11. [Google Scholar]
  34. Jamil, M.R.; Sun, Y.; Faisal, A.N.; Haes, A.H.; Siano, P.; Shafie-khah, M. A novel combined evolutionary algorithm for optimal planning of distributed generators in radial distribution systems. Appl. Sci. 2019, 9, 3394. [Google Scholar] [CrossRef] [Green Version]
  35. Fang, X.; Li, F.; Wei, Y.; Azim, R.; Xu, Y. Reactive power planning under high penetration of wind energy using Benders decomposition. IET Gener. Transm. Distrib. 2015, 9, 1835–1844. [Google Scholar] [CrossRef]
Figure 1. Flowchart using v&f index variation method for islanding detection with reconfiguration and reliability evaluation.
Energies 16 03035 g001
Figure 2. Electricalbus system-33.
Energies 16 03035 g002
Figure 3. Voltage and frequency values. (a) Values (Voltage)- 33 bus system. (b) Values (Frequency)- 33 bus system.
Energies 16 03035 g003
Figure 4. Detection of islanded buses- 33 bus system.
Energies 16 03035 g004
Figure 5. Electrical bus system-118.
Energies 16 03035 g005
Figure 6. Voltage and frequency values. (a) Values (Voltage)-118 bus system. (b) Values (Frequency)-118 bus system.
Energies 16 03035 g006
Figure 7. Detection of islanded buses-118 bus system.
Energies 16 03035 g007
Table 1. Parameters of PV.
Variables [24]Ratings
The Maximum Net Power Output (MNPO) current, I M N P O 4.76 A
The Maximum Net Power Output (MNPO) voltage, V M N P O 17.32 V
The voltage coefficient, C v o l t 14.40 mV/ C
Optimal temperature, T o p e r 43 C
The current coefficient, K c u r n t 1.22 mA/ C
Open circuit voltage, V o p e c 21.98 V
Short circuit current, I S h c c 5.32 A
Table 2. Parameters of Wind.
Variables [24]Ratings
Power (Rated), W r p o w 0.5 MW
Rated speed, S r a t 13 m/s
Speed (cut in), C i n s p 3 m/s
Speed (cut out), C o u t s p 25 m/s
Table 3. Parameters of Hydro.
Variables [25]Ratings
Hydraulic efficiency, ϵ H y 75.1%
Density, ϱ 1000 Kg/m 3
Effective pressure, P h e 2.25 m
acceleration, g a c 9.81 m/s 2
Table 4. Parameters of proposed method.
VariablesRatings
(33 Bus System)
Ratings
(118 Bus System)
M 1 and M 2 —v&f index and threshold
limits
0.09684 and
0.10504
0.099243 and
0.2432
S 1 and S 2 —The phase voltage related to time,
frequency and voltage
1.5925 and
1.226
1.6251 and
1.426
P l o ( n ) —(Real power) difference between first bus
to next bus
7.2 kW9.3 kW
P a l o ( n ) —Actual load20 kW23 kW
N s m p l —Samples (Range)33353335
V o p e r a t i n g ( N ) —Operating voltage new11.66 kV9 kV
V o p e r a t i n g —Operating bus voltage0.995 kV0.997 kV
b V —Voltage (base)12.66 kV11 kv
f c h —Change in (f)-frequency0.36 Hz0.39 Hz
V c h —Change in voltage1.226 kV1.121 kV
D f r —Calculated frequency59.64 Hz59.61 Hz
n—Number of buses33118
Table 5. Comparison results of islanding detection for the 33 bus system.
DGsBusesIslanding Detection
Voltage
Based Method
[26]
Frequency
Based Method
[27]
Proposed
Passive Method
(Simultaneous
Measurement of
v&f Variation)
Islanded
Bus No
No of
Buses
Islanded
Time
of
Detection
(Seconds)
Islanded
Bus No
No of
Buses
Islanded
Time
of
Detection
(Seconds)
Islanded
Bus No
No of
Buses
Islanded
Time
of
Detection
(Seconds)
PV14, 24, 2924, 2971.2914, 24, 29101.952421.02
Wind14, 3014, 3090.9914, 3090.981450.75
Hydro13, 24, 3013, 30100.8224, 3060.652420.60
PV-Hydro13, 14, 24,
29, 30
14, 24, 30111.05413, 29111.0322420.75
PV-Wind14, 24,
29, 30
14, 24, 30110.6214, 3090.881450.58
Wind-Hydro31, 14,
24, 30
14, 24, 30111.9814, 3091.992420.75
Table 6. Comparison results of islanding detection for the 118 bus system.
DGsBusesIslanding Detection
Voltage
Based Method
[26]
Frequency
Based Method
[27]
Proposed
Passive Method
(Simultaneous
Measurement of
v&f Variation)
Islanded
Bus No
No of
Buses
Islanded
Time
of
Detection
(Seconds)
Islanded
Bus No
No of
Buses
Islanded
Time
of
Detection
(Seconds)
Islanded
Bus No
No of
Buses
Islanded
Time
of
Detection
(Seconds)
PV20, 39,
47, 73, 80,
90, 110
47, 80141.3980, 110101.5911041.25
Wind5, 82, 865, 82, 86121.755, 8681.32551.30
Hydro39, 47, 11039, 47, 110201.5539, 110121.5511041.50
PV-Hydro20, 80,
90, 110
80, 110101.9280, 110101.9911041.79
PV-Wind5, 39, 44,
47, 82
5, 39, 82220.595, 8290.75550.55
Wind-Hydro74, 82,
86, 110
86, 11071.9986, 11070.9911040.93
Table 7. Comparison results of reliability evaluation for 33 bus system.
33
Bus System
Tie-SwitchesVoltage
Based Method
[26]
Frequency
Based Method
[27]
Proposed
Passive Method
(Simultaneous
Measurement of
v&f Variation)
ENSAENSSAIDISAIFIASAIENSAENSSAIDISAIFIASAIENSAENSSAIDISAIFIASAI
Base case33, 34, 35, 36, 3727,622.031315.330.743.071.9423508.51175.40.904.04951.9384757.41182.9770.350.9451.714
Reconfiguration
(PSO)
PV7, 9, 14, 32, 3723,622.031115.330.652.051.7420508.5975.40.753.02951.6384037.41165.9770.300.5451.310
Hydro7, 9, 14, 28, 3223,544.011055.210.632.031.7120495.3972.10.723.00121.6344021.32162.8770.270.5241.312
PV-Hydro7, 9, 14, 28, 3223,324.031032.010.612.011.6920325.1970.30.712.99111.5324002.11160.6770.230.4441.112
Wind-Hydro7, 9, 14, 32, 3722,122.131011.090.571.981.5720100.5960.50.692.11211.5013990.02158.0700.190.3811.010
Table 8. Comparison results of reliability evaluation for the 118 bus system.
118
Bus System
Voltage
Based Method
[26]
Frequency
Based Method
[27]
Proposed
Passive Method
(Simultaneous
Measurement of
v&f Variation)
ENSAENSSAIDISAIFIASAIENSAENSSAIDISAIFIASAIENSAENSSAIDISAIFIASAI
Basecase29,951.8683.160.373.511.9429,532.3641.50.293.471.9018,257.15279.640.190.141.29
Reconfiguration
(PSO)
PV28,341.9579.360.353.201.7428,231.3582.50.273.211.6418,157.14219.640.130.111.25
Hydro25,620.03572.330.292.971.6225,422.3593.30.232.991.5216,727.3167.970.100.091.21
PV-Hydro20,142.13553.210.252.961.5920,025.1480.30.212.971.508102.11163.6770.070.061.09
Wind-Hydro20,002.01551.010.232.161.5620,000.1477.20.202.861.498011.21149.5440.040.031.06
Disclaimer/Publisher’s Note: The statements, opinions and data contained in all publications are solely those of the individual author(s) and contributor(s) and not of MDPI and/or the editor(s). MDPI and/or the editor(s) disclaim responsibility for any injury to people or property resulting from any ideas, methods, instructions or products referred to in the content.

