
A New Method for Determining Outdoor Humidity Ratio of Natatorium in Transition Season
Abstract
:1. Introduction
2. Weather Data
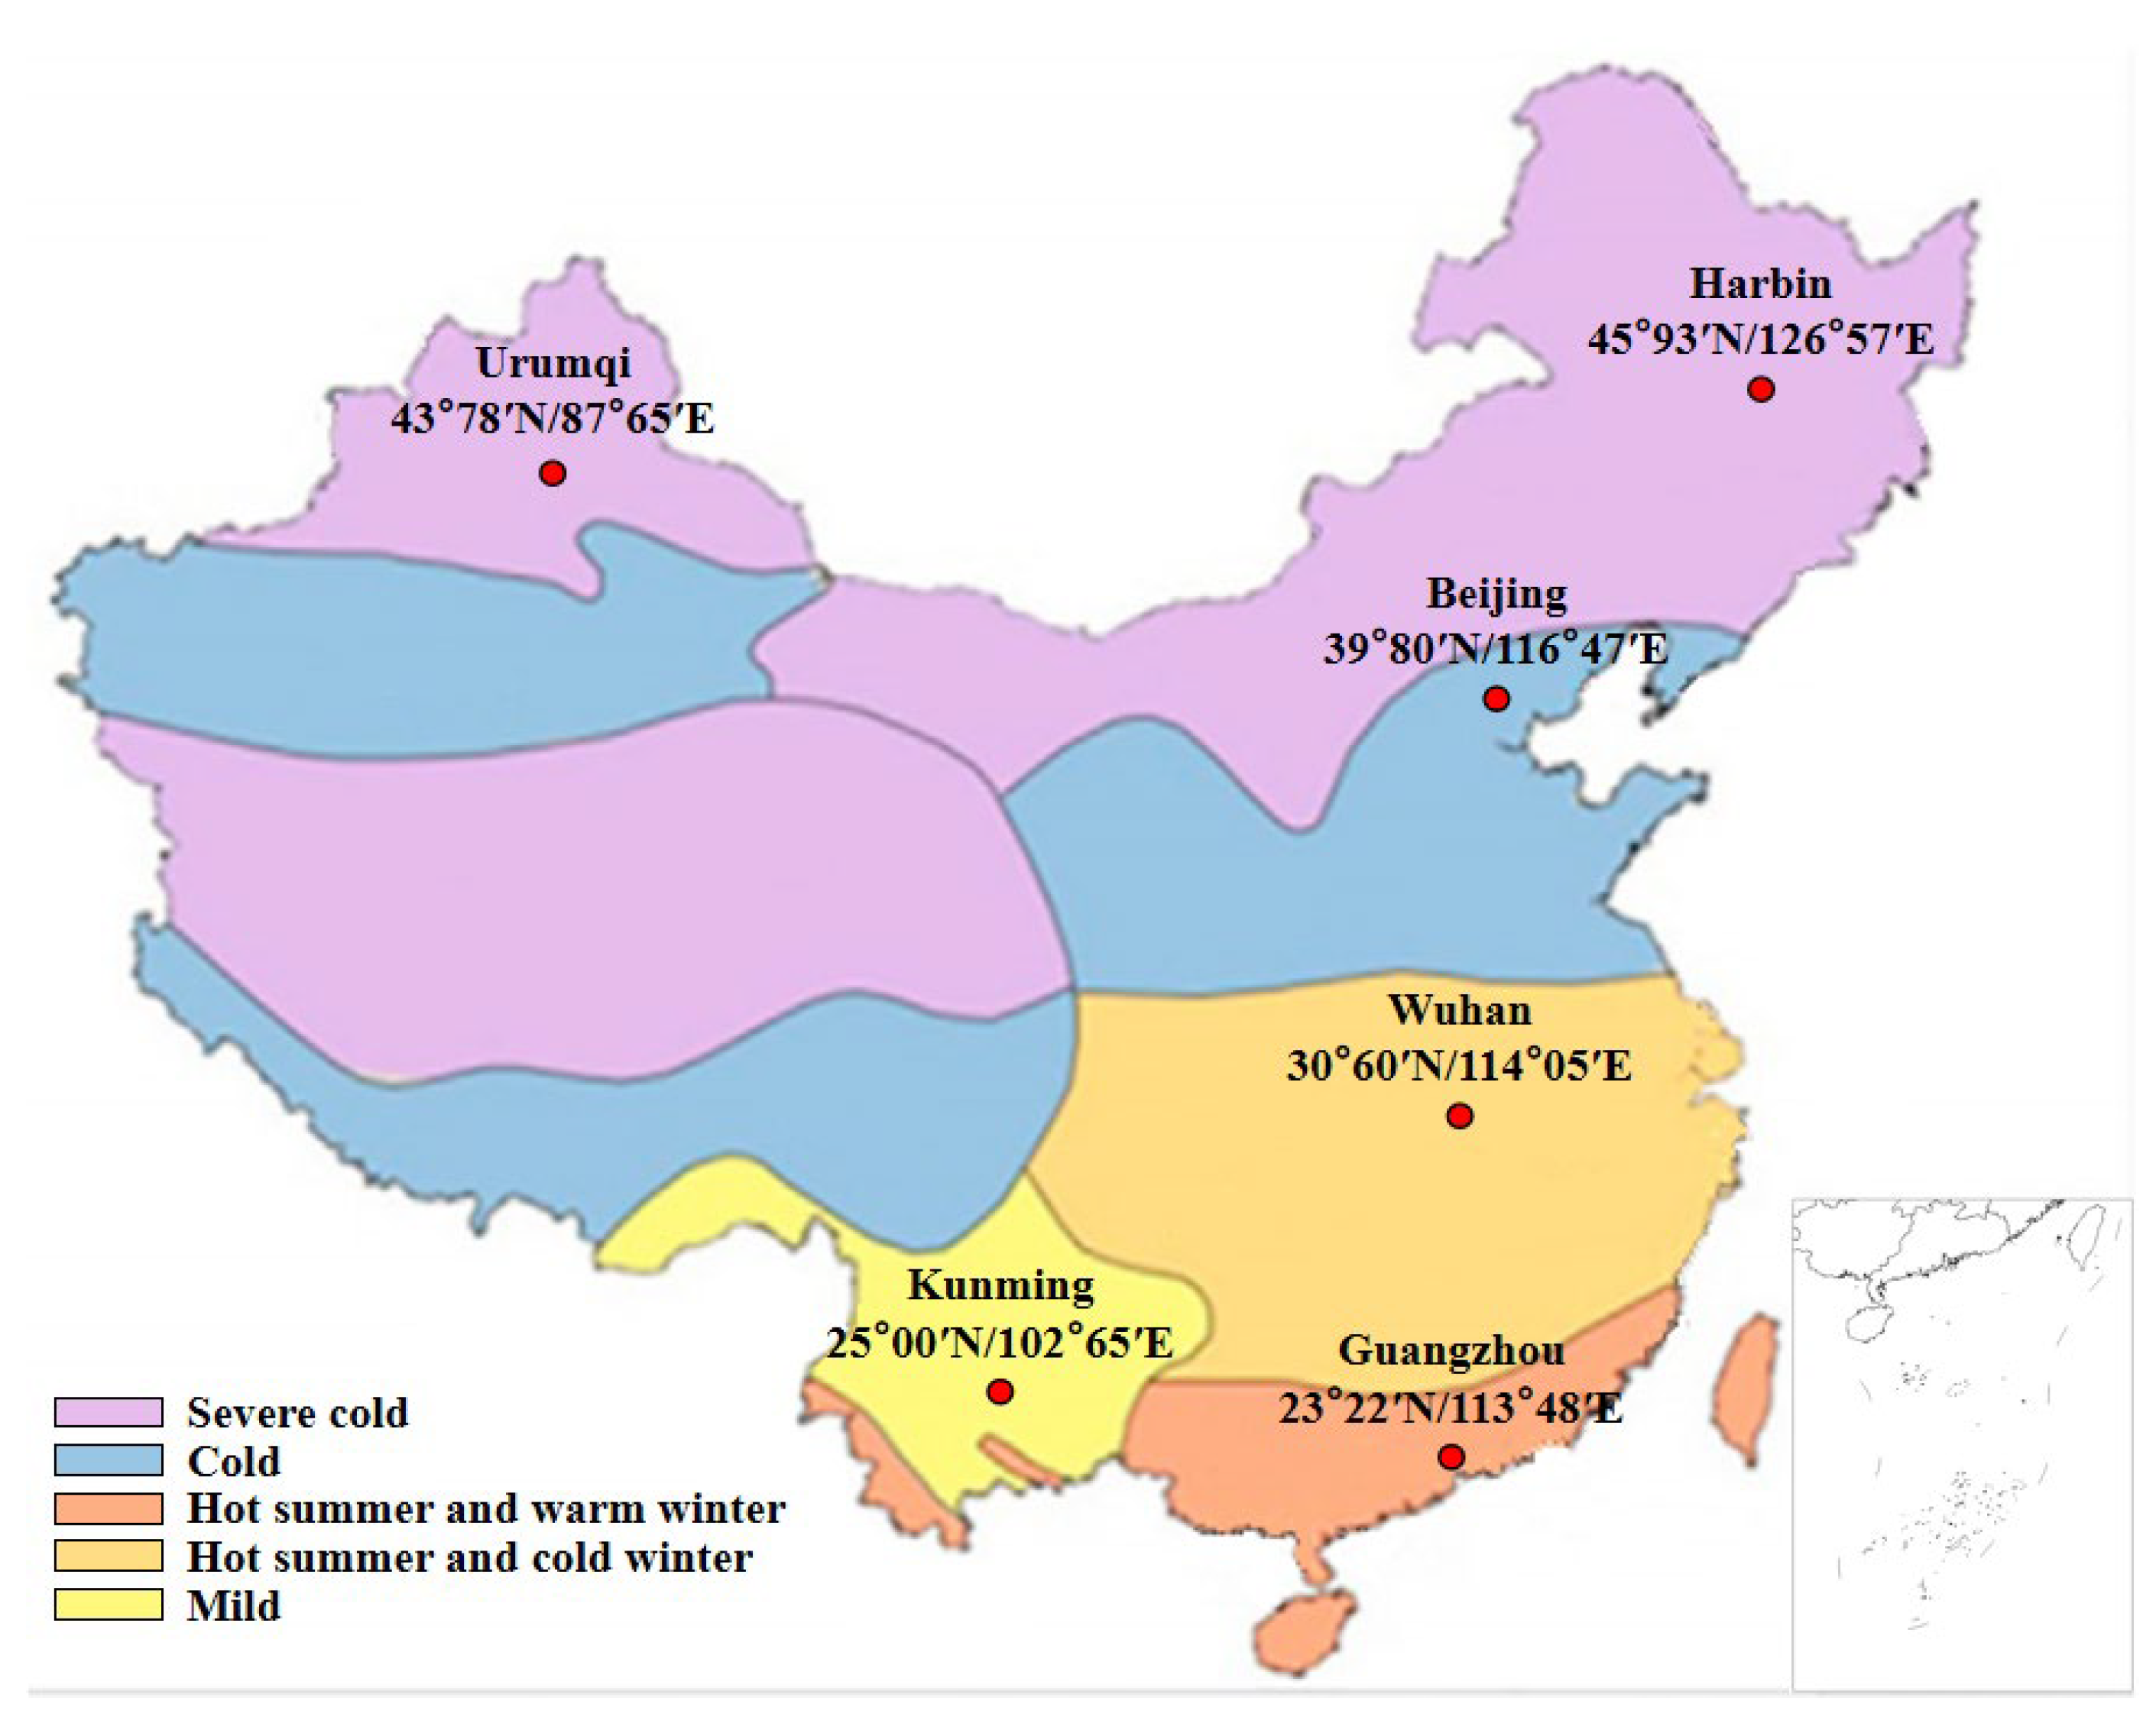
2.1. Basic Data
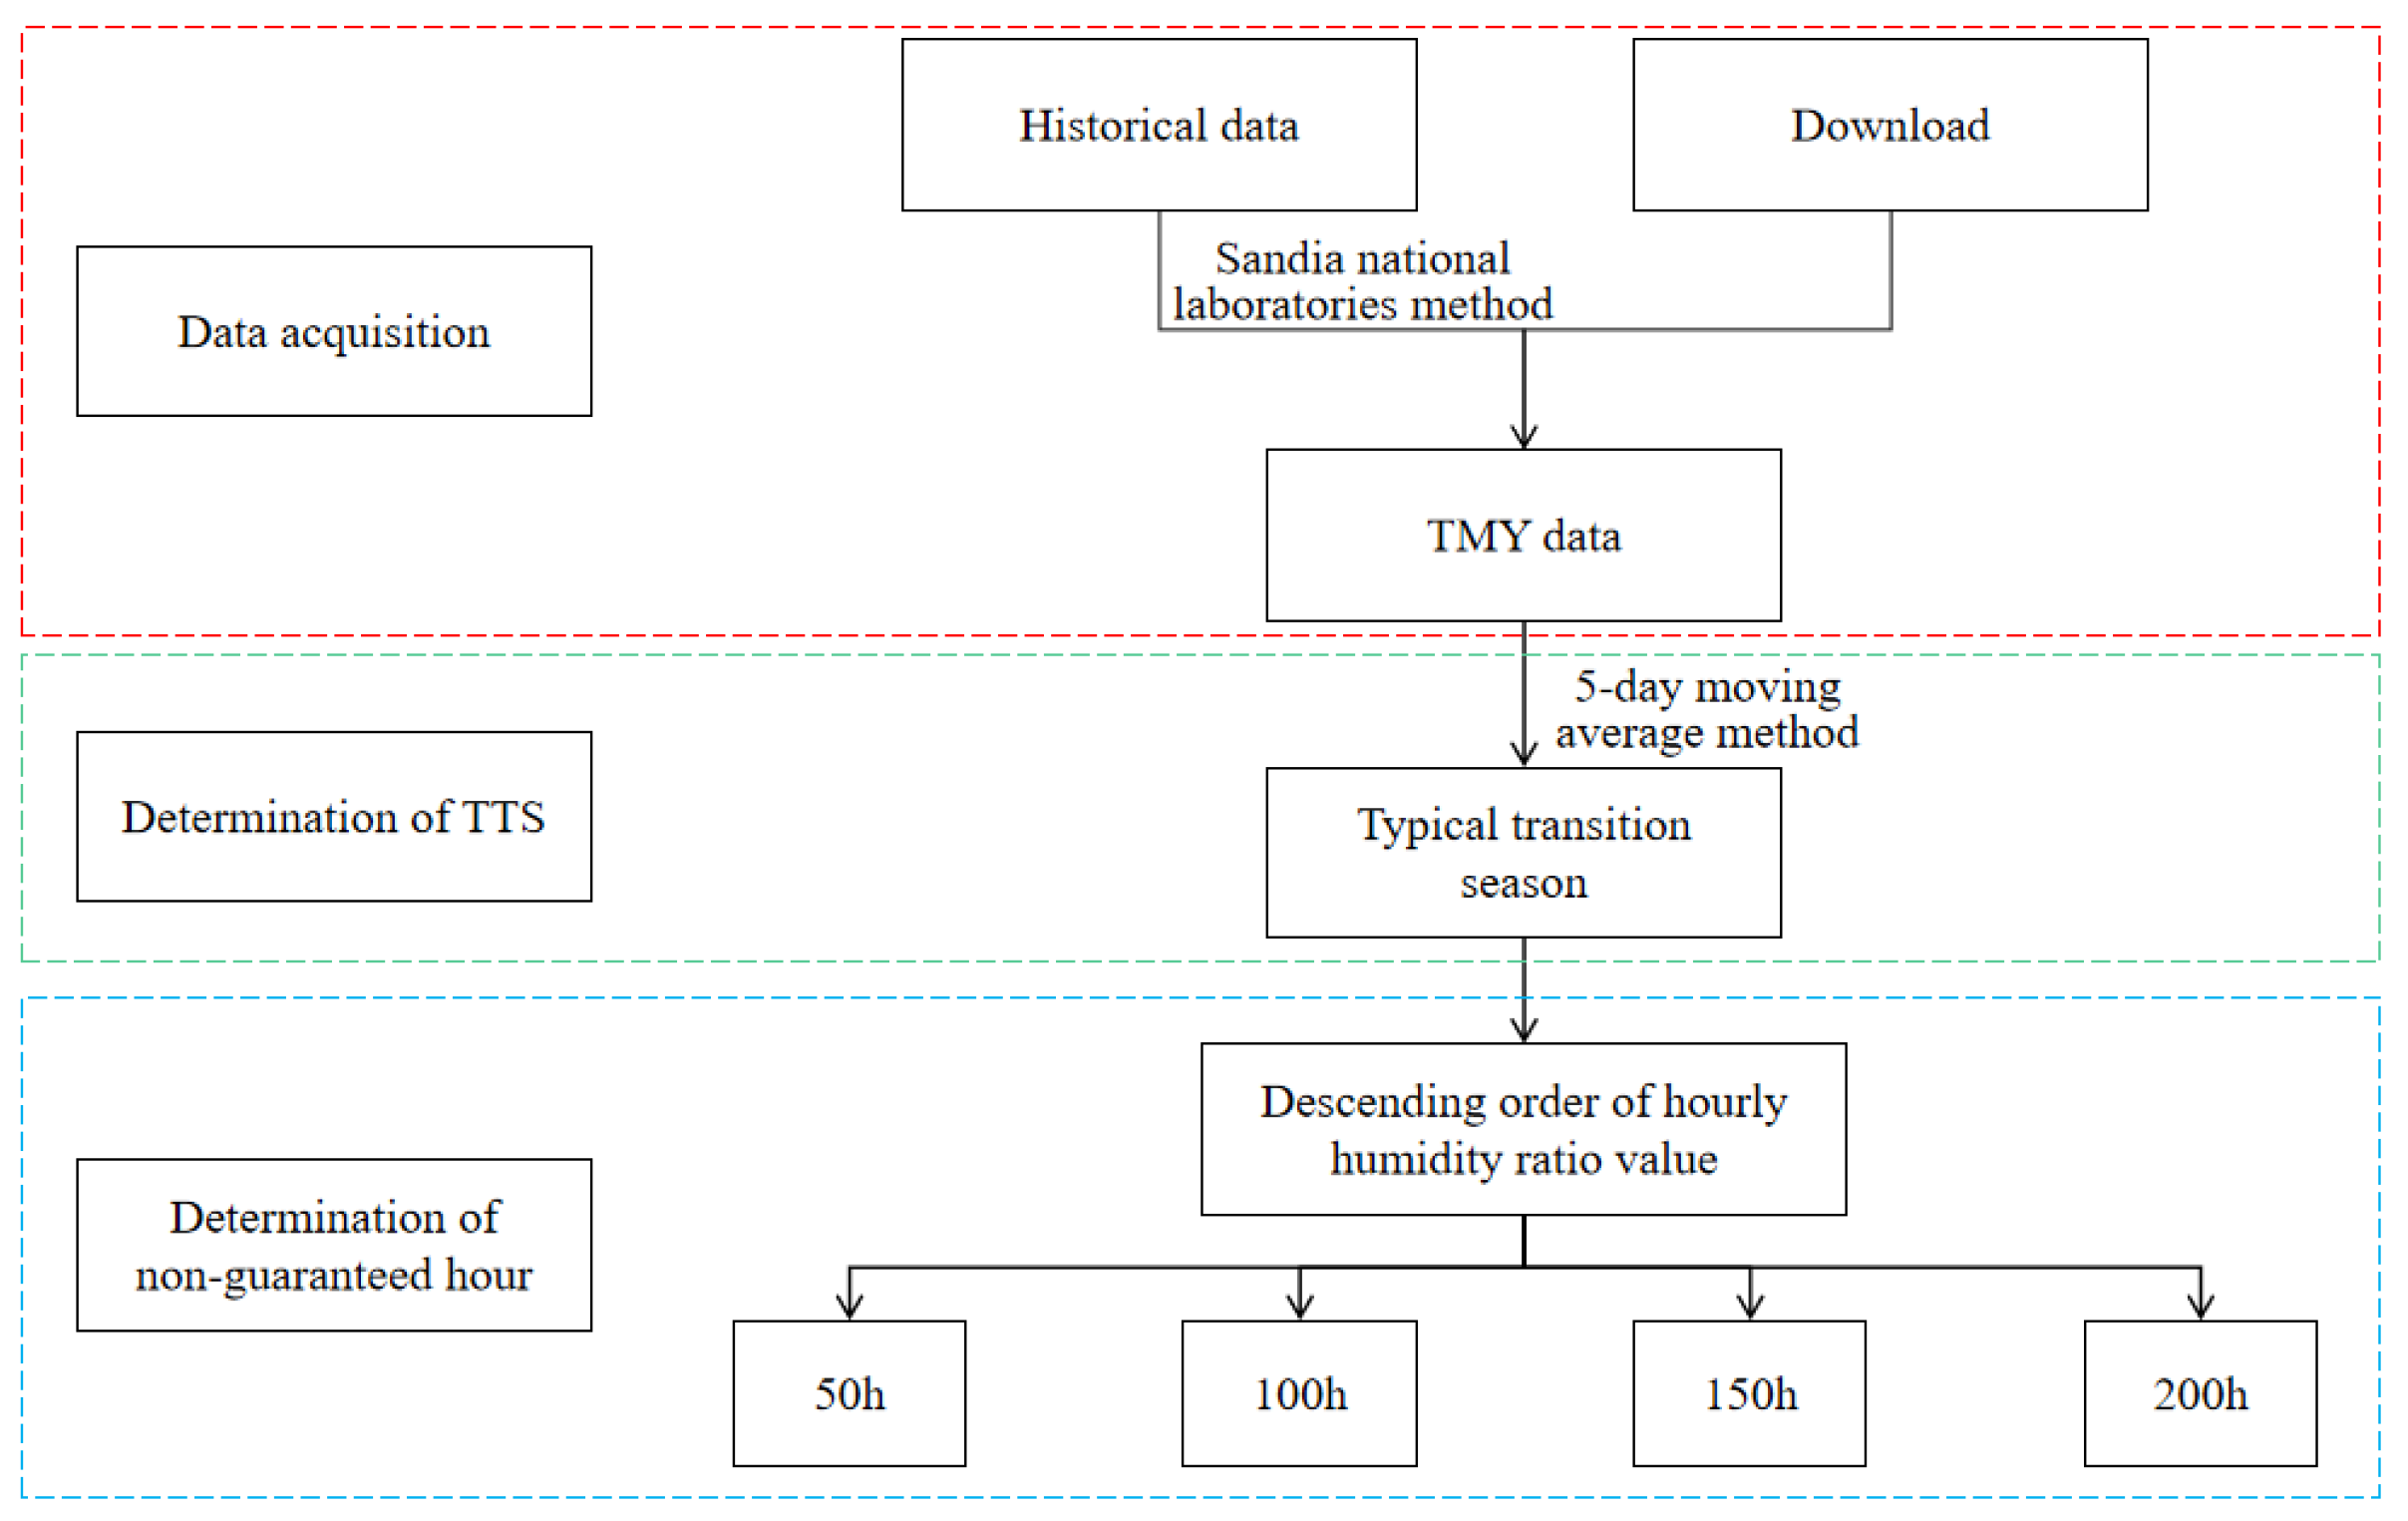
2.2. TMY Data

| Meteorological Parameter | Weight (TMY3) [32] | |
|---|---|---|
| Dry temperature | Max | 1/20 |
| Mine | 1/20 | |
| Mean | 2/20 | |
| Dew-point temperature | Max | 1/20 |
| Mine | 1/20 | |
| Mean | 2/20 | |
| Wind | Max | 1/20 |
| Mine | 1/20 | |
| Solar radiation | Global | 5/20 |
| Direction | 5/20 | |
3. Method
3.1. Ventilation-Curve Method
3.2. TTS Method
3.2.1. Determination of TTS
3.2.2. Determination of Humidity Ratio
3.3. Theory of Ventilation Rate Calculation
- Eliminate indoor redundant moisture;
- Meet the hygienic requirement of chlorine content being less than 1 mg/m3 in the pool air;
- Provide fresh air for personnel to breathe and ensure a minimum of fresh air for personnel activities.
| Type of Pool | Residential Pool | Therapy | Hotel | Public, Schools | Wave Pools, Water Slides |
|---|---|---|---|---|---|
| Typical activity factor | 0.5 | 0.65 | 0.8 | 1 | 1.5 |
4. Results and Discussions
4.1. Use Different Method for Determining Humidity Ratio
4.2. Calculation of Ventilation Rate
5. Conclusions
- The outdoor humidity ratio of the transition season obtained by the V-C method is not guaranteed to be more than 200 h, which cannot meet the requirements of a minimum ventilation rate. It has little reference value for design.
- The outdoor humidity ratio of the transition season obtained by the TTS method can clearly reflect the non-guaranteed hours, and the inspection results of air change rates in 83.3% of cities have met the minimum design requirement of once per hour. It is more accurate and reasonable to use this value for minimum ventilation rate calculations.
- The TTS method uses the TMY data to greatly reduce the demand for data size and the difficulty of data acquisition. Besides, this method well-represents the local multi-year climate characteristics without a complicated calculation process.
Author Contributions
Funding
Data Availability Statement
Acknowledgments
Conflicts of Interest
Abbreviations
| Air change rate in natatorium (times per hour) | v | Air velocity over water surface (m/s) | |
| L | Ventilation volume required to eliminate moisture (m3/h) | Saturation vapor pressure taken at surface water temperature (Pa) | |
| V | Volume of natatorium (m3) | Saturation pressure at room air dew point (Pa) | |
| W | Moisture gain in natatorium (kg/h) | latent heat required to change water to vapor at surface water temperature (kJ/kg) | |
| Moisture gain of pool water (kg/h) | t | Indoor design dry bulb temperature (°C) | |
| Moisture gain of poolside wetlands (kg/h) | Indoor design wet bulb temperature (°C) | ||
| Moisture gain of personnel (kg/h) | Surface water temperature (°C) | ||
| Standard air density (kg/m3) | F | Area of poolside wetlands (m2) | |
| Indoor air humidity ratio (g/kg dry air) | Moisture factor | ||
| Outdoor air humidity ratio (g/kg dry air) | Unit personnel moisture gain (kg/(per person per hour)) | ||
| A | Area of pool surface (m2) | Number of people | |
| Typical activity factor | Clustering coefficient |
References
- Chen, Q. Ventilation performance prediction for buildings: A method overview and recent applications. Build. Environ. 2008, 44, 848–858. [Google Scholar] [CrossRef]
- Persily, A. Field measurement of ventilation rates. Indoor Air 2016, 26, 97–111. [Google Scholar] [CrossRef] [PubMed]
- 62.1-2016; Ventilation for Acceptable Indoor Air Quality. American Society of Heating, Refrigerating and Air Conditioning Engineers, Inc.: Atlanta, GA, USA, 2016.
- EN 13779; Ventilation for Non-Residential Buildings—Performance Requirements for Ventilation and Room-Conditioning Systems. European Committee for Standardization: Brussels, Belgium, 2007.
- MOHURD. Design Code for Heating Ventilation and Air Conditioning of Civil Buildings (GB 50736-2012); China Architecture & Building Press: Beijing, China, 2012. (In Chinese) [Google Scholar]
- Braun, J.M.; Gennings, C.; Hauser, R.; Webster, T.F. What Can Epidemiological Studies Tell Us about the Impact of Chemical Mixtures on Human Health? Environ. Health Perspect. 2016, 124, A6–A9. [Google Scholar] [CrossRef] [Green Version]
- Pandian, A.M.K.; Rajamehala, M.; Singh, M.V.P.; Sarojini, G.; Rajamohan, N. Potential risks and approaches to reduce the toxicity of disinfection by-product—A review. Sci. Total. Environ. 2022, 822, 153323. [Google Scholar] [CrossRef]
- Caro, J.; Gallego, M. Assessment of Exposure of Workers and Swimmers to Trihalomethanes in an Indoor Swimming Pool. Environ. Sci. Technol. 2007, 41, 4793–4798. [Google Scholar] [CrossRef] [PubMed]
- Felgueiras, F.; Mourão, Z.; Morais, C.; Santos, H.; Gabriel, M.F.; Fernandes, E.D.O. Comprehensive assessment of the indoor air quality in a chlorinated Olympic-size swimming pool. Environ. Int. 2019, 136, 105401. [Google Scholar] [CrossRef]
- Lebon, M.; Fellouah, H.; Galanis, N.; Limane, A.; Guerfala, N. Numerical analysis and field measurements of the airflow patterns and thermal comfort in an indoor swimming pool: A case study. Energy Effic. 2017, 10, 527–548. [Google Scholar] [CrossRef]
- Gollwitzer, E.; Peper, S.; Grove-Smith, J. Highly energy-efficient indoor swimming pools—Passive house concept for indoor swimming pools: Measurements and guidelines for planning. Bauphysik 2019, 41, 217–226. [Google Scholar] [CrossRef]
- Lee, C.S.; Lakdawala, N.; Haghighat, F. Effects of Ventilation and Air Cleaning on Indoor Air Quality of a Swimming Pool-Mass Balance Analysis Approach. In Proceedings of the 7th International Cold Climate HVAC Conference, Calgary, AB, Canada, 12–14 November 2012; pp. 152–160. [Google Scholar]
- Ratajczak, K.; Szczechowiak, E. Energy consumption decreasing strategy for indoor swimming pools—Decentralized Ventilation system with a heat pump. Energy Build. 2019, 206, 109574. [Google Scholar] [CrossRef]
- Ciuman, P.; Kaczmarczyk, J. Numerical Analysis of the Energy Consumption of Ventilation Processes in the School Swimming Pool. Energies 2021, 14, 1023. [Google Scholar] [CrossRef]
- Nagy, R.; Košičanová, D. The Minimum Ventilation Intensity Research Using Selected Parameters. Appl. Mech. Mater. 2013, 353–356, 3029–3033. [Google Scholar] [CrossRef]
- Richard, N.; Danica, K. Indoor air quality related to total minimum air ventilation rate, air quality and cfd simulations of pollution distribution. In Proceedings of the 12th International Multidisciplinary Scientific Geoconference (SGEM), Albena, Bulgaria, 17–23 June 2012; pp. 529–536. [Google Scholar]
- Jani, D.B. A review on progressive development in desiccant materials. Int. J. Mater. Sci. Innov. 2020, 2, 73–82. [Google Scholar]
- Jani, D.B. Advances in Liquid Desiccant Integrated Dehumidification and Cooling Systems. Int. J. Environ. Sustain. Dev. 2019, 4, 6–11. [Google Scholar]
- Yin, Y.; Zhang, X.; Chen, Z. Experimental study on dehumidifier and regenerator of liquid desiccant cooling air conditioning system. Build. Environ. 2007, 42, 2505–2511. [Google Scholar] [CrossRef]
- Jani, D.B.; Mishra, M.; Sahoo, P.K. Solid desiccant air conditioning—A state of the art review. Renew. Sustain. Energy Rev. 2016, 60, 1451–1469. [Google Scholar] [CrossRef]
- Dadi, M.J.; Jani, D.B. Solar Energy as a Regeneration Heat Source in Hybrid Solid Desiccant—Vapor Compression Cooling System—A Review. J. Emerg. Technol. Innov. Res. 2019, 6, 421–425. [Google Scholar]
- Wang, J.Y.; Xiao, Y.M. Ventilation design rate calculation in ventilation season for public buildings of Chongqing. HV&AC 2012, 42, 89–92. (In Chinese) [Google Scholar]
- Lu, Y.J. Heating, Ventilation and Air Conditioning; China Architecture & Building Press: Beijing, China, 2015. (In Chinese) [Google Scholar]
- ASHRAE. ASHRAE Handbook-Fundamentals 2017; American Society of Heating, Refrigeration and Air Conditioning Engineers, Inc.: Atlanta, GA, USA, 2017. [Google Scholar]
- Zhang, T.H. Discussion on HVAC design for recreational natatoria. HV AC 2005, 35, 93–97. (In Chinese) [Google Scholar]
- Jia, Y.; Cai, X.H. Air conditioning and ventilation design of natatorium in Hainan. CC AC 2021, 2, 90–93. (In Chinese) [Google Scholar]
- MOHURD. Code for Thermal Design of Civil Building (GB 50176-2016); China Architecture & Building Press: Beijing, China, 2016. (In Chinese) [Google Scholar]
- Li, H.; Huang, J.; Hu, Y.; Wang, S.; Liu, J.; Yang, L. A new TMY generation method based on the entropy-based TOPSIS theory for different climatic zones in China. Energy 2021, 231, 120723. [Google Scholar] [CrossRef]
- Sun, J.; Li, Z.; Xiao, F.; Xiao, J. Generation of typical meteorological year for integrated climate based daylight modeling and building energy simulation. Renew. Energy 2020, 160, 721–729. [Google Scholar] [CrossRef]
- Wang, S.; Liu, Y.; Cao, Q.; Li, H.; Yu, Y.; Yang, L. Applicability of passive design strategies in China promoted under global warming in past half century. Build. Environ. 2021, 195, 107777. [Google Scholar] [CrossRef]
- Li, H.; Yang, Y.; Lv, K.; Liu, J.; Yang, L. Compare several methods of select typical meteorological year for building energy simulation in China. Energy 2020, 209, 118465. [Google Scholar] [CrossRef]
- Wilcox, S.; Marion, W. Users Manual for TMY3 Data Sets (Revised); National Renewable Energy Lab.: Golden, CO, USA, 2008. [Google Scholar] [CrossRef] [Green Version]
- Wei, W.Y. Natatorium Air Conditioning Design; Mechanical Industry Press: Beijing, China, 2004. (In Chinese) [Google Scholar]
- Yu, J.; Kim, S.B.; Bai, J.; Han, S.W. Comparative Study on Exponentially Weighted Moving Average Approaches for the Self-Starting Forecasting. Appl. Sci. 2020, 10, 7351. [Google Scholar] [CrossRef]
- CIBSE. CIBSE Guide. In External Design Data; Chartered Institution of Building Services Engineers (CIBSE): London, UK, 2006. [Google Scholar]
- ASHRAE. ASHRAE Handbook-Fundamentals 2015; American Society of Heating, Refrigeration and Air Conditioning Engineers, Inc.: Atlanta, GA, USA, 2015. [Google Scholar]


| Types of Natatoriums | Competition | Training | Recreational | Therapeutic |
|---|---|---|---|---|
| Air changes per hour | 1–4 | 3–6 | 4–8 | 4–8 |
| Climate Zone | Representative Cities | Transition Season 1 | Transition Season 2 | 100% Ventilation Hours |
|---|---|---|---|---|
| SCZ, 1A | Harbin | 04–12~06–13 | 08–19~10–23 | 163 |
| SCZ, 1B | Urumqi | 04–18~06–07 | 09–04~10–24 | 110 |
| CZ | Beijing | 03–11~05–18 | 09–17~11–13 | 172 |
| HSCWZ | Wuhan | 02–27~05–06 | 09–22~11–30 | 161 |
| HSWWZ | Guangzhou | 01–25~04–08 | 11–16~01–24 | 164 |
| MZ | Kunming | 12–03~07–09 | 07–10~11–30 | 511 |
| Cities | Outdoor Humidity Ratio, g/kg (Transition Season 1) | Outdoor Humidity Ratio, g/kg (Transition Season 2) | Indoor Humidity Ratio, g/kg | ||||||
|---|---|---|---|---|---|---|---|---|---|
| Non-g 50 h | Non-g 100 h | Non-g 150 h | Non-g 200 h | Non-g 50 h | Non-g 100 h | Non-g 150 h | Non-g 200 h | ||
| Harbin | 10.72 | 10.05 | 9.55 | 8.98 | 11.89 | 11.13 | 10.82 | 10.47 | 16.95 |
| Urumqi | 7.79 | 7.13 | 6.71 | 6.42 | 7.00 | 6.41 | 5.98 | 5.71 | 18.57 |
| Beijing | 9.71 | 8.64 | 8.28 | 7.77 | 13.52 | 12.34 | 11.24 | 10.38 | 16.76 |
| Wuhan | 13.78 | 12.98 | 12.30 | 11.72 | 13.66 | 13.33 | 12.85 | 12.53 | 16.71 |
| Guangzhou | 15.24 | 14.68 | 14.23 | 13.93 | 16.14 | 14.13 | 12.70 | 12.16 | 16.78 |
| Kunming | 16.73 | 16.20 | 15.93 | 15.64 | 16.61 | 16.33 | 16.12 | 15.98 | 21.45 |
| Cities | Transition Season 1 | Transition Season 2 | ||
|---|---|---|---|---|
| Outdoor Humidity Ratio (g/kg) | Non-g (h) | Outdoor Humidity Ratio (g/kg) | Non-g (h) | |
| Harbin | 8.0 | 312 | 9.0 | 431 |
| Urumqi | 6.4 | 202 | 6.4 | 104 |
| Beijing | 5.2 | 507 | 8.0 | 266 |
| Wuhan | 10.4 | 354 | 10.4 | 531 |
| Guangzhou | 12.3 | 447 | 9.9 | 278 |
| Kunming | 9.0 | 1821 | 14.0 | 1100 |
| Parameter | Value | Unit | |
|---|---|---|---|
| Building information | Area of pool surface | 1250 | m2 |
| Area of poolside | 1150 | m2 | |
| Area of poolside wetlands a | 316 | m2 | |
| Hall height | 15 | m | |
| Indoor design parameters | Indoor design dry bulb temperature | 28 | °C |
| Indoor design wet bulb temperature | 22.74 | °C | |
| Relative humidity | 65% | - | |
| Surface water Temperature | 26 | °C | |
| Air velocity over Water surface | 0.2 | m/s | |
| Moisture factor | 0.2 | - | |
| Personnel density | 10 | m2/per person |
| Harbin | Urumqi | Beijing | Wuhan | Guangzhou | Kunming | |
|---|---|---|---|---|---|---|
| TTS method | 11.89 | 7.79 | 10.44 | 12.30 | 12.16 | 16.33 |
| V-C method | 9.0 | 6.4 | 8.0 | 10.4 | 12.3 | 14.0 |
Disclaimer/Publisher’s Note: The statements, opinions and data contained in all publications are solely those of the individual author(s) and contributor(s) and not of MDPI and/or the editor(s). MDPI and/or the editor(s) disclaim responsibility for any injury to people or property resulting from any ideas, methods, instructions or products referred to in the content. |
© 2023 by the authors. Licensee MDPI, Basel, Switzerland. This article is an open access article distributed under the terms and conditions of the Creative Commons Attribution (CC BY) license (https://creativecommons.org/licenses/by/4.0/).
Share and Cite
Lei, J.; Li, H.; Li, C.; Xu, M. A New Method for Determining Outdoor Humidity Ratio of Natatorium in Transition Season. Energies 2023, 16, 2990. https://doi.org/10.3390/en16072990
Lei J, Li H, Li C, Xu M. A New Method for Determining Outdoor Humidity Ratio of Natatorium in Transition Season. Energies. 2023; 16(7):2990. https://doi.org/10.3390/en16072990
Chicago/Turabian StyleLei, Jiaxiang, Honglian Li, Chengwang Li, and Minrui Xu. 2023. "A New Method for Determining Outdoor Humidity Ratio of Natatorium in Transition Season" Energies 16, no. 7: 2990. https://doi.org/10.3390/en16072990