Article

Development and Validation of Control Algorithm for Variable Speed Fixed Pitch Small Wind Turbine

1
Department of Integrated Energy and Infra System, Kangwon National University, Engineering Building 6-319, 1 Gangwondaehak-gil, Chuncheon 24341, Gangwon, Republic of Korea
2
Department of Mechatronics Engineering, Kangwon National University, Engineering Building 6-319, 1 Gangwondaehak-gil, Chuncheon 24341, Gangwon, Republic of Korea
3
Geum Poong Inc., Seobusanupdo-ro, Jeongeup 56183, Jeollabuk, Republic of Korea
*
Author to whom correspondence should be addressed.
Energies 2023, 16(4), 2003; https://doi.org/10.3390/en16042003
Submission received: 4 December 2022 / Revised: 10 February 2023 / Accepted: 15 February 2023 / Published: 17 February 2023
(This article belongs to the Special Issue Wind Energy Technologies Development)

Abstract

:
In this study, a power control algorithm of a variable-speed fixed-pitch horizontal-axis lift-type 20 kW small wind turbine (SWT) was proposed and verified through dynamic simulations. The power control algorithm proposed in this study consists of algorithms for Region II to track the maximum power coefficient, for Region II-1/2 to maintain the rated rotor speed, and for Region III to maintain the rated power. To verify the proposed power control algorithm, simulations were performed at the rated wind speed and above the rated wind speed, to which turbulence intensity based on the IEC regulation’s normal turbulence model was applied. As a result, it was confirmed that the proposed controller operates properly in the whole three regions including Regions II, II-1/2, and III. The controller performance was then compared with the variable-speed variable-pitch power controller. Although the performance of the proposed controller was considered good for the target VSVP wind turbine, it was lower than that of the conventional controller applied to the same wind turbine. Compared to the VSVP wind turbine, the VSFP wind turbine with the proposed controller was found to have higher mean loads on the blade and the tower but the fatigue loads in terms of Damage Equivalent Load (DEL) were found to be reduced.

1. Introduction

As the cost of power generation using wind power has decreased over the past decade, wind power generation is attracting attention as an efficient power generation source to achieve carbon neutrality [1,2]. As of the end of 2021, the cumulative installed capacity of wind power generation facilities worldwide was about 837 GW, and 93.6 GW of new wind power generation facilities were installed in 2021 alone [3]. Although large wind power is leading the growth of the wind power generation equipment market, small wind turbines are also showing steady growth especially for small loads and stand-alone systems [4,5].
According to IEC 61400-2, the international design standard for small wind turbines, a small wind turbine is defined as a wind turbine with a rotor swept area of 200 m2 or less and generating electricity at a voltage less than 1000 VAC or 1500 VDC [6]. Various shapes of small wind turbines in addition to the common horizontal-axis lift-type wind turbines with three blades are commercially available including vertical-axis machines [7,8] and horizontal-axis machines with spiral blades [9]. However, such wind turbines of various shapes other than horizontal axis lift type ones are mainly applied to hybrid solar–wind powered streetlights with a rated capacity of 1 kW or less. In the case of grid-connected small wind turbines with a capacity of 10 kW or more, horizontal-axis lift-type wind turbines with three blades are mainly used, similar to general MW-class large wind turbines.
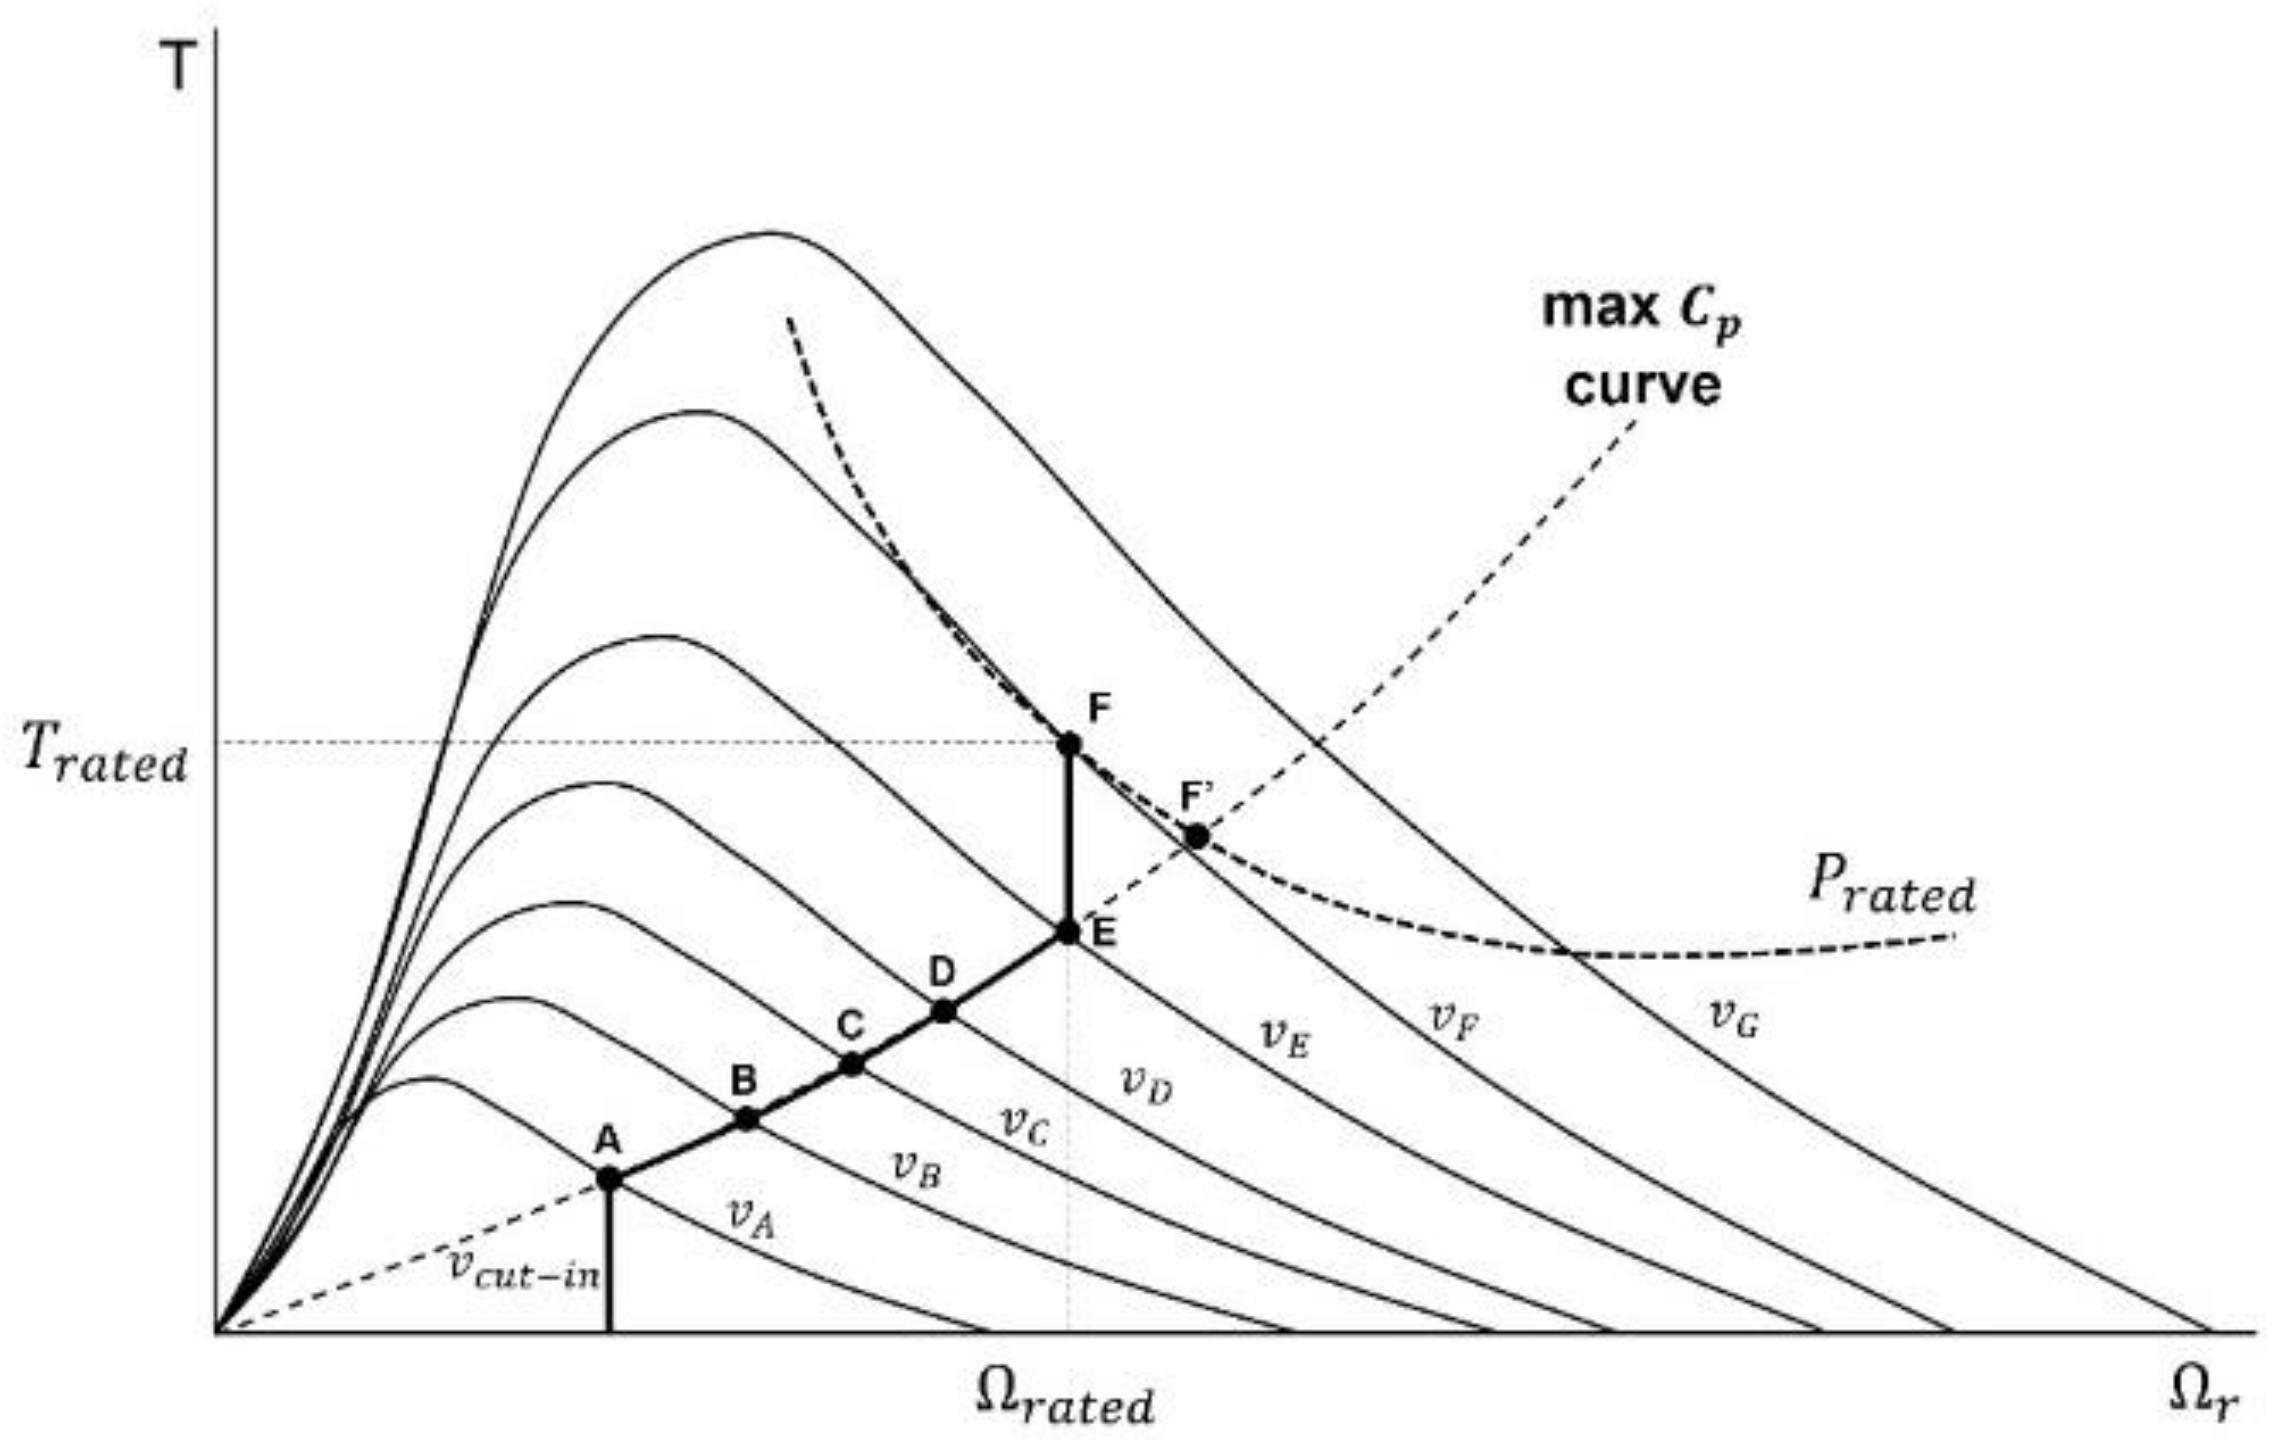
The MW class large-scale wind turbine is a variable speed variable pitch system. Variable speed is required to maximize energy harvesting with varying wind speeds, and variable pitch (of blade) is used to effectively regulate the electrical power not to exceed the rated value. For control of variable-speed variable-pitch wind turbines, in the wind speed lower than the rated wind speed, the blade pitch angle is fixed to the fine pitch angle, and the rotational speed of the wind turbine blades is varied through the generator reaction torque control to achieve the maximum power coefficient. In addition, above the rated wind speed, the rated rotational speed of the generator is maintained by adjusting the blade pitch angle according to the change in wind speed as a strategy for maintaining the rated power using the blade pitch actuator installed in the hub.
Such active pitch control technology is a standard power control method for MW-class wind turbines in the rated power region [10,11], and is gradually being applied to hundreds of kW-class medium-sized wind turbines [12,13] or tens of kW-class grid-connected small wind power. However, in general, small wind turbines with a rated capacity of 20 kW or less mainly adopt fixed pitch systems rather than variable pitch systems for economic reasons and size limitations. The control mechanism for variable-speed variable-pitch wind turbines at a wind speed lower than the rated wind speed are commonly applied to the small variable-speed fixed-pitch wind turbines because no blade pitching is used. It is implemented by measuring the rotational speed of the generator, multiplying the optimal mode gain, and issuing the generator torque command through the open loop controller to achieve the maximum power coefficient [14].
The control mechanism at a wind speed higher than the rated wind speed of the fixed pitch system may be largely divided into a method with side furling and a method with stall control. The control using side furling is a method of implementing a mechanical mechanism so that the rotor and the nacelle parts are folded sideways in a high wind speed and the rotor deviates from the wind direction. However, in order to implement Side Furling so that it does not exceed the desired rated power, some Furling occurs even when the power is lower than the rated power, so the power is degraded, and it needs a relatively high rotational speed above the rated wind speed [15].
Stall control above the rated wind speed of the fixed pitch system is a method of generating an aerodynamic stall phenomenon by increasing the inflow angle of attack of the blade above the stall threshold angle in the high wind speed region without a pitch system. If a stall occurs in the blade, the lift coefficient decreases significantly and the drag coefficient increases significantly, resulting in a decrease in the power of the wind turbine.
Most of the papers on power control of fixed pitch systems are limited to control to maintain maximum efficiency in areas below rated wind speed, and the literature on stall control in areas above rated wind speed is very limited. Muljadi et al. proposed a method, ‘soft stall’ to maximize the power coefficient below the rated wind speed and limit the rotor speed above the rated wind speed through the generator torque control [16]. The result of verifying the controller through ADAMS simulation for wind turbines having a nominal rated power of 275 kW showed that the rotor speed was limited to 62 rpm and the power was limited to 385 kW at high wind speeds. However, as the proposed control strategy was not an active control but used a generator torque schedule to control the generator speed, it could constrain the power in a certain limit but could not control the power to track the rated power in a stalled condition at high wind speeds.
Pierce and Migliore proposed a new control method, ‘active stall’, for a variable-speed fixed-pitch wind turbine, which is similar to ‘soft stall’ but different in that it has a longer range of maximum power coefficient operation, and a different method of limiting rotor speed at high wind speeds [17]. Strategies to maximize the power coefficient, to keep the generator rotational speed constant, and to keep the power constant were applied for different speed regions from low to high wind speeds. They used a closed loop PI control to regulate the rotor speed and did experimental validation in the field with a 275 kW wind turbine. In the validation, they showed good rotor speed regulation performance and energy capture but no demonstration of the maximum power tracking at high wind speeds was possible due to insufficient field data obtained.
Chen et al. proposed a control algorithm that can be applied to the entire below and above the rated wind speed regions similar to previous studies [16,17] as a new control strategy. Adaptive Fuzzy Logic Controller was applied for the current command of the DC-DC converter to minimize the error of the generator-rectification voltage corresponding to the generator rotational speed in each strategy [18]. They validated the proposed algorithm with a 1.2 kW virtual micro wind turbine model using matlab/simulink and a laboratory-scale motor-generator simulator. However, no detailed validation of the proposed controller at turbulent wind using an aeroelastic code such as Bladed and Fast was performed. Although they showed some dynamic results from the motor-generator simulator for 100 s, no clear information of the turbulent wind was provided, and the power tracking performance of the controller at high winds was not analyzed quantitatively for verification.
In another study, Chen et al. proposed an algorithm similar to the previous method for a VSVP wind turbine, but PID controllers with an aerodynamic power observer were applied instead of Adaptive Fuzzy Logic Controller [19]. However, like the previous study, no detailed dynamic performance validation of the proposed controller at turbulent winds was done with any aeroelastic code. They did some experimental validation using a lab scale motor-generator simulator representing a 1.2 kW micro wind turbine and showed some power curves obtained, but no quantitative analysis of the experiments was provided to show the dynamic performance of the controller.
Currently, the validation of the wind turbine controller using aeroelastic codes such as Bladed and Fast at three-dimensional turbulent winds is almost a standard procedure before the algorithm is actually applied to a commercial wind turbine [12,13,20,21,22]. The dynamic simulation results from those codes are considered to be accurate by international certification companies of wind turbines and known to be close to actual results in the field. Although several algorithms have previously been proposed as a power control algorithm for VSFP wind turbines, the algorithms verified with such accurate codes for actual application to a commercial wind turbine are very rare in the literature, and no quantitative analysis of power performance and load analysis was done with the proposed control algorithms.
Therefore, in this study, the power control algorithm for a VSFP wind turbine is revisited and newly proposed like in previous studies but different from those in that it is made to be applicable to a commercial small wind turbine. For this, a 20 kW commercial VSFP wind turbine was targeted, and a new control algorithm which resembles the control algorithm designed and applied to a commercial medium wind turbine was proposed [12]. The proposed algorithm covers the entire wind turbine operating regions similar to previous studies including Maximum Power Coefficient Region (Region II), Transition Region (Region II-1/2), and Rated Power Region (Region III) [23]. The aeroelastic code Bladed was chosen for this study, and a detailed modeling of the target wind turbine was performed by data both provided by the wind turbine manufacturer and obtained by a 3D laser scanning process. The proposed control algorithm was validated in turbulent winds using Bladed, and dynamic performances were analyzed. The dynamic performance of the proposed control algorithm was also compared with the performance of the same wind turbine with a conventional VSVP algorithm.
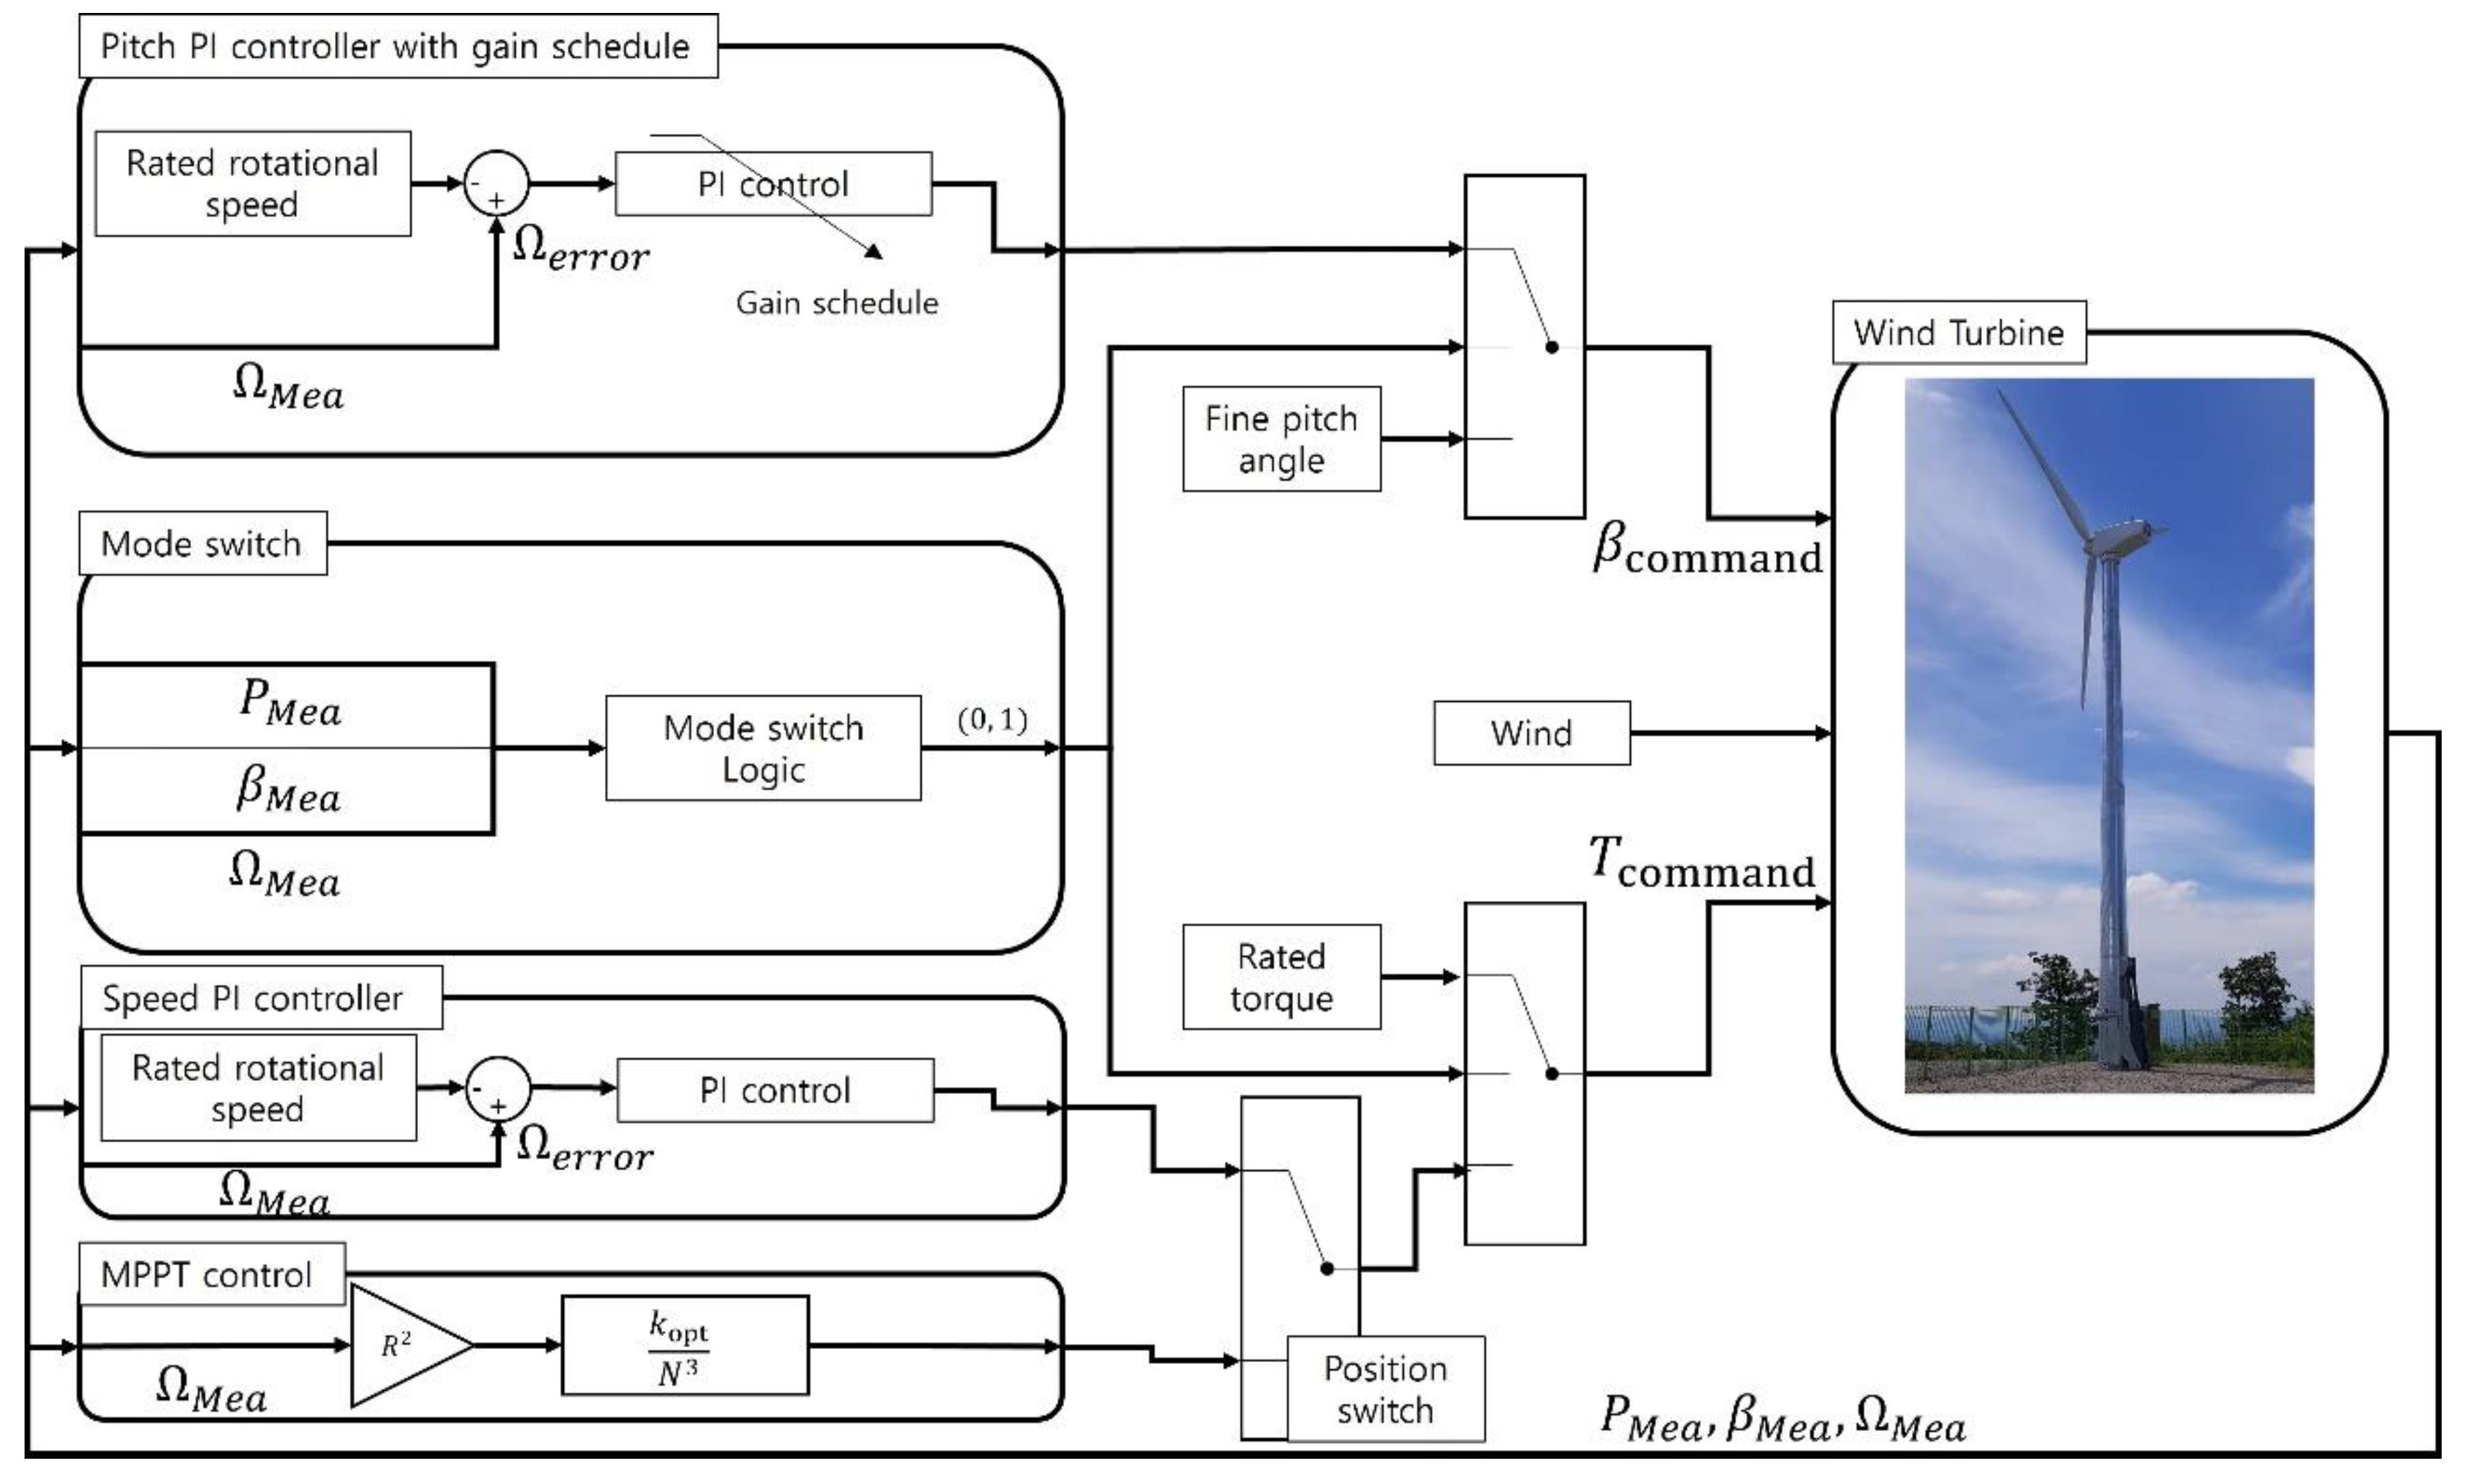
In this study, a power controller was designed and verified for a 20 kW horizontal axis lift-type wind turbine using dynamic simulation in turbulent wind. The blade shape was acquired through 3D laser scanning, and the wind turbine parts were modeled using the Bladed program with the target turbine data. The proposed algorithm consists of a pitch controller and a stall controller, both of which utilize components such as pitch PI control, torque schedule, speed PI control, mode switch, and position switch. The pitch controller aims to set the blade pitch angle to a fixed fine pitch angle for maximum power point tracking (MPPT) control and transition control, while the stall controller aims to maintain the generator torque and speed. The power control algorithm was verified through simulation and compared to a variable-speed variable-pitch wind turbine power controller. The results showed that the proposed controller performed similarly to the variable-speed variable-pitch controller for regions below the rated wind speed but had better rated power tracking performance in Region III. The stall control also demonstrated relatively high stability in rotor speed in high turbulence gusts. However, the average load of the fixed-pitch wind turbine was found to be greater than that of the variable-pitch wind turbine, with a lower fatigue load due to its lack of a pitch system. The study provides insight into the control performance and features of various wind turbine types, but its results may not be applicable to larger wind turbines.

2. Wind Turbine Model

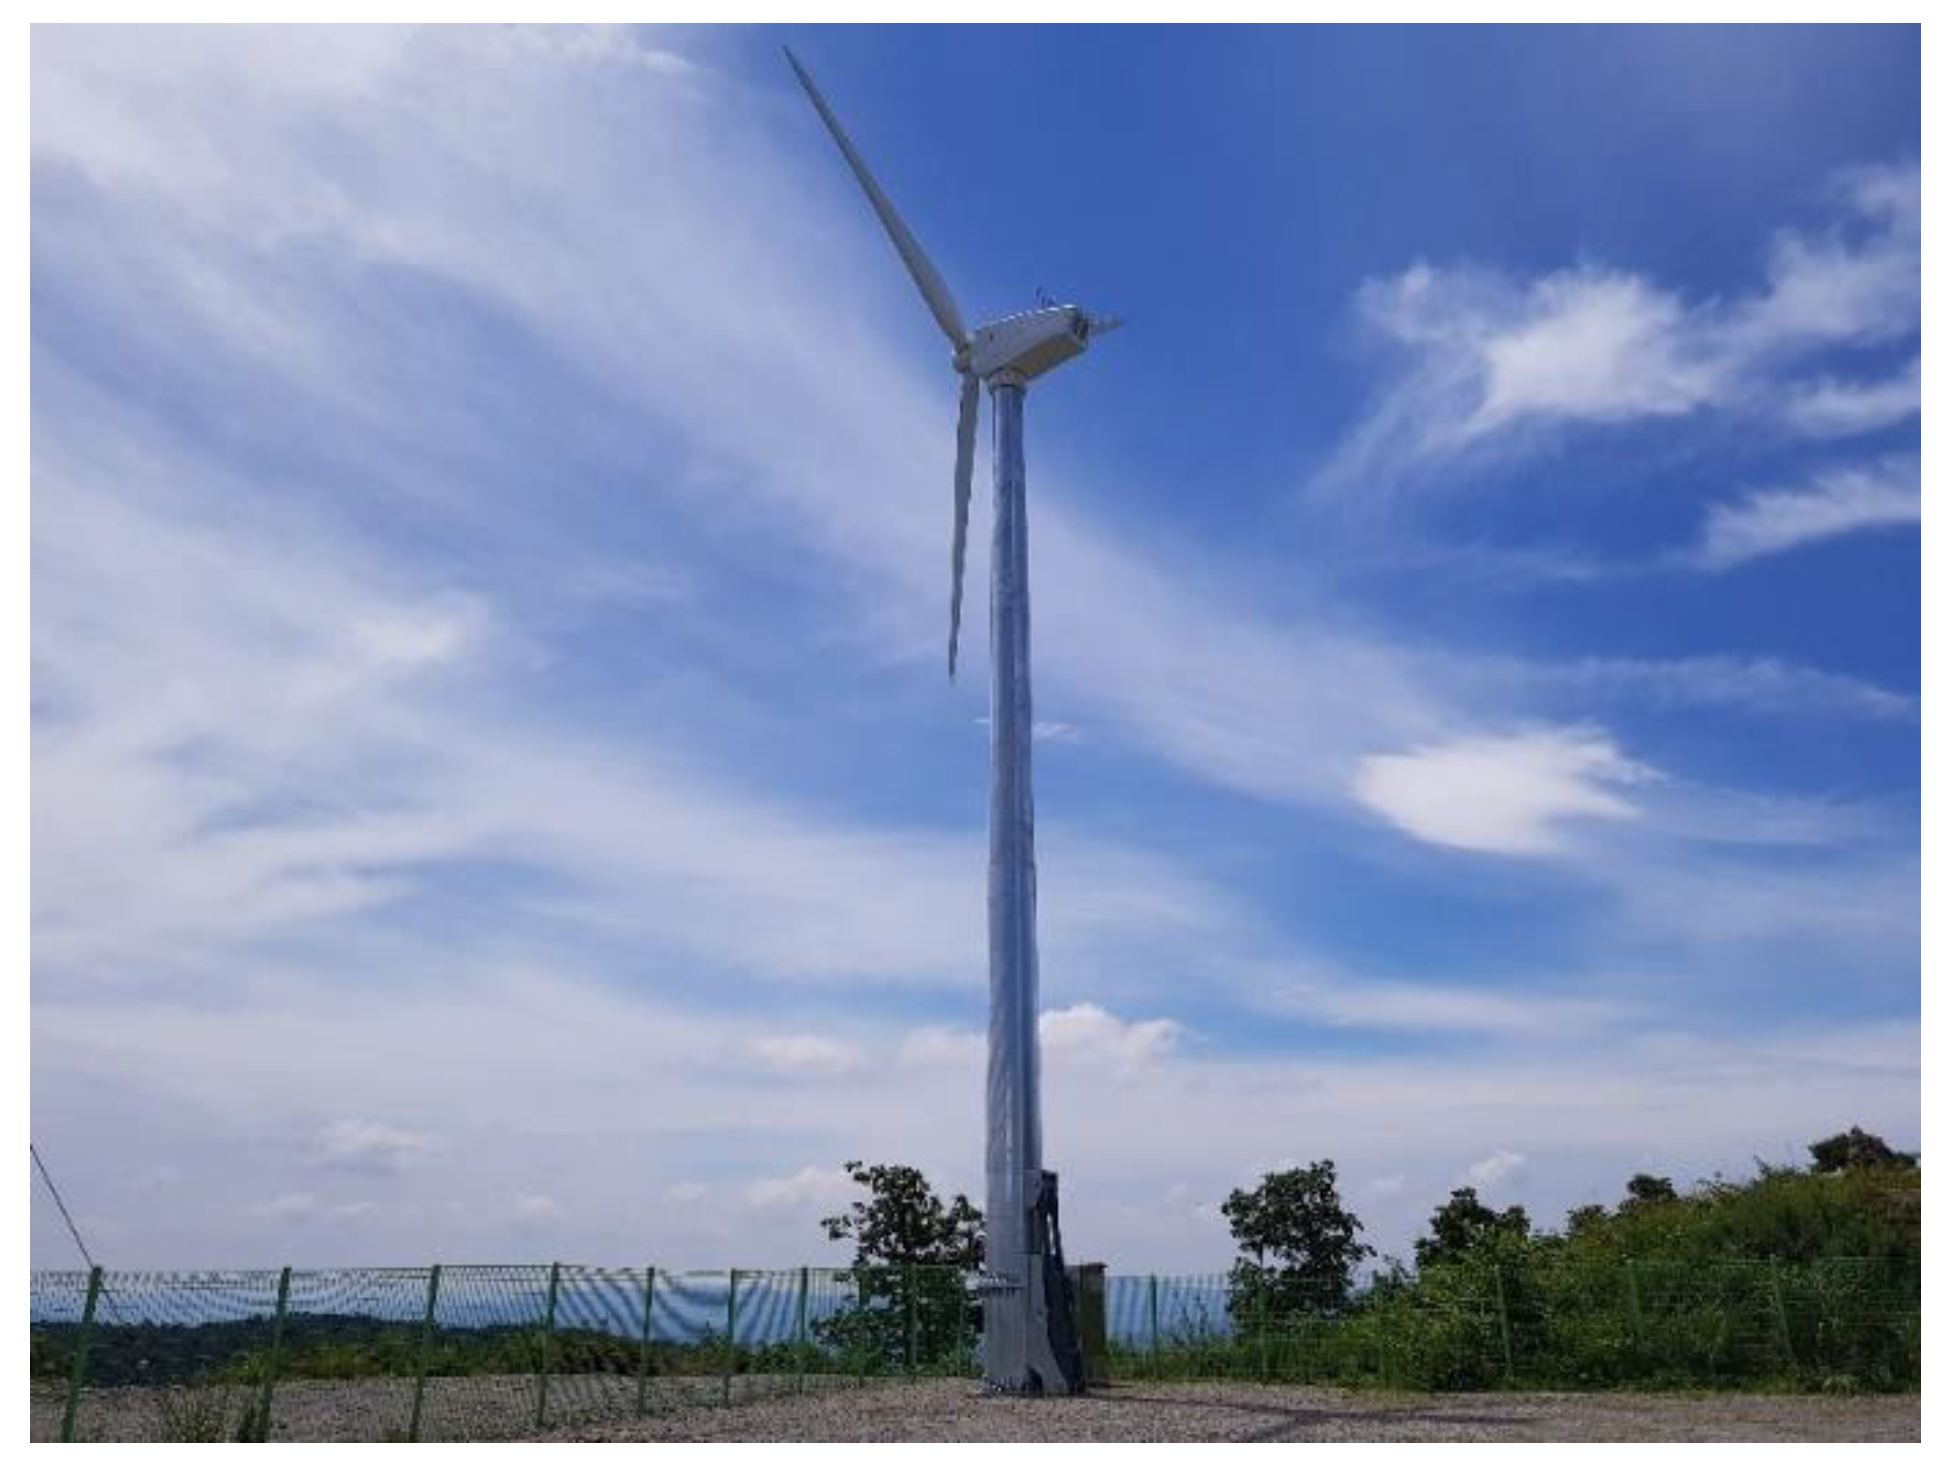
The target wind turbine used in this study is a commercial 20 kW horizontal axis lift type wind turbine. The target wind turbine was modeled for simulations using DNV’s Bladed program, which is an aeroelastic code for wind turbines widely used for dynamic simulations and validation of control algorithms [15]. Detailed specifications and the photo of the target wind turbine are presented in Table 1 and Figure 1, respectively.
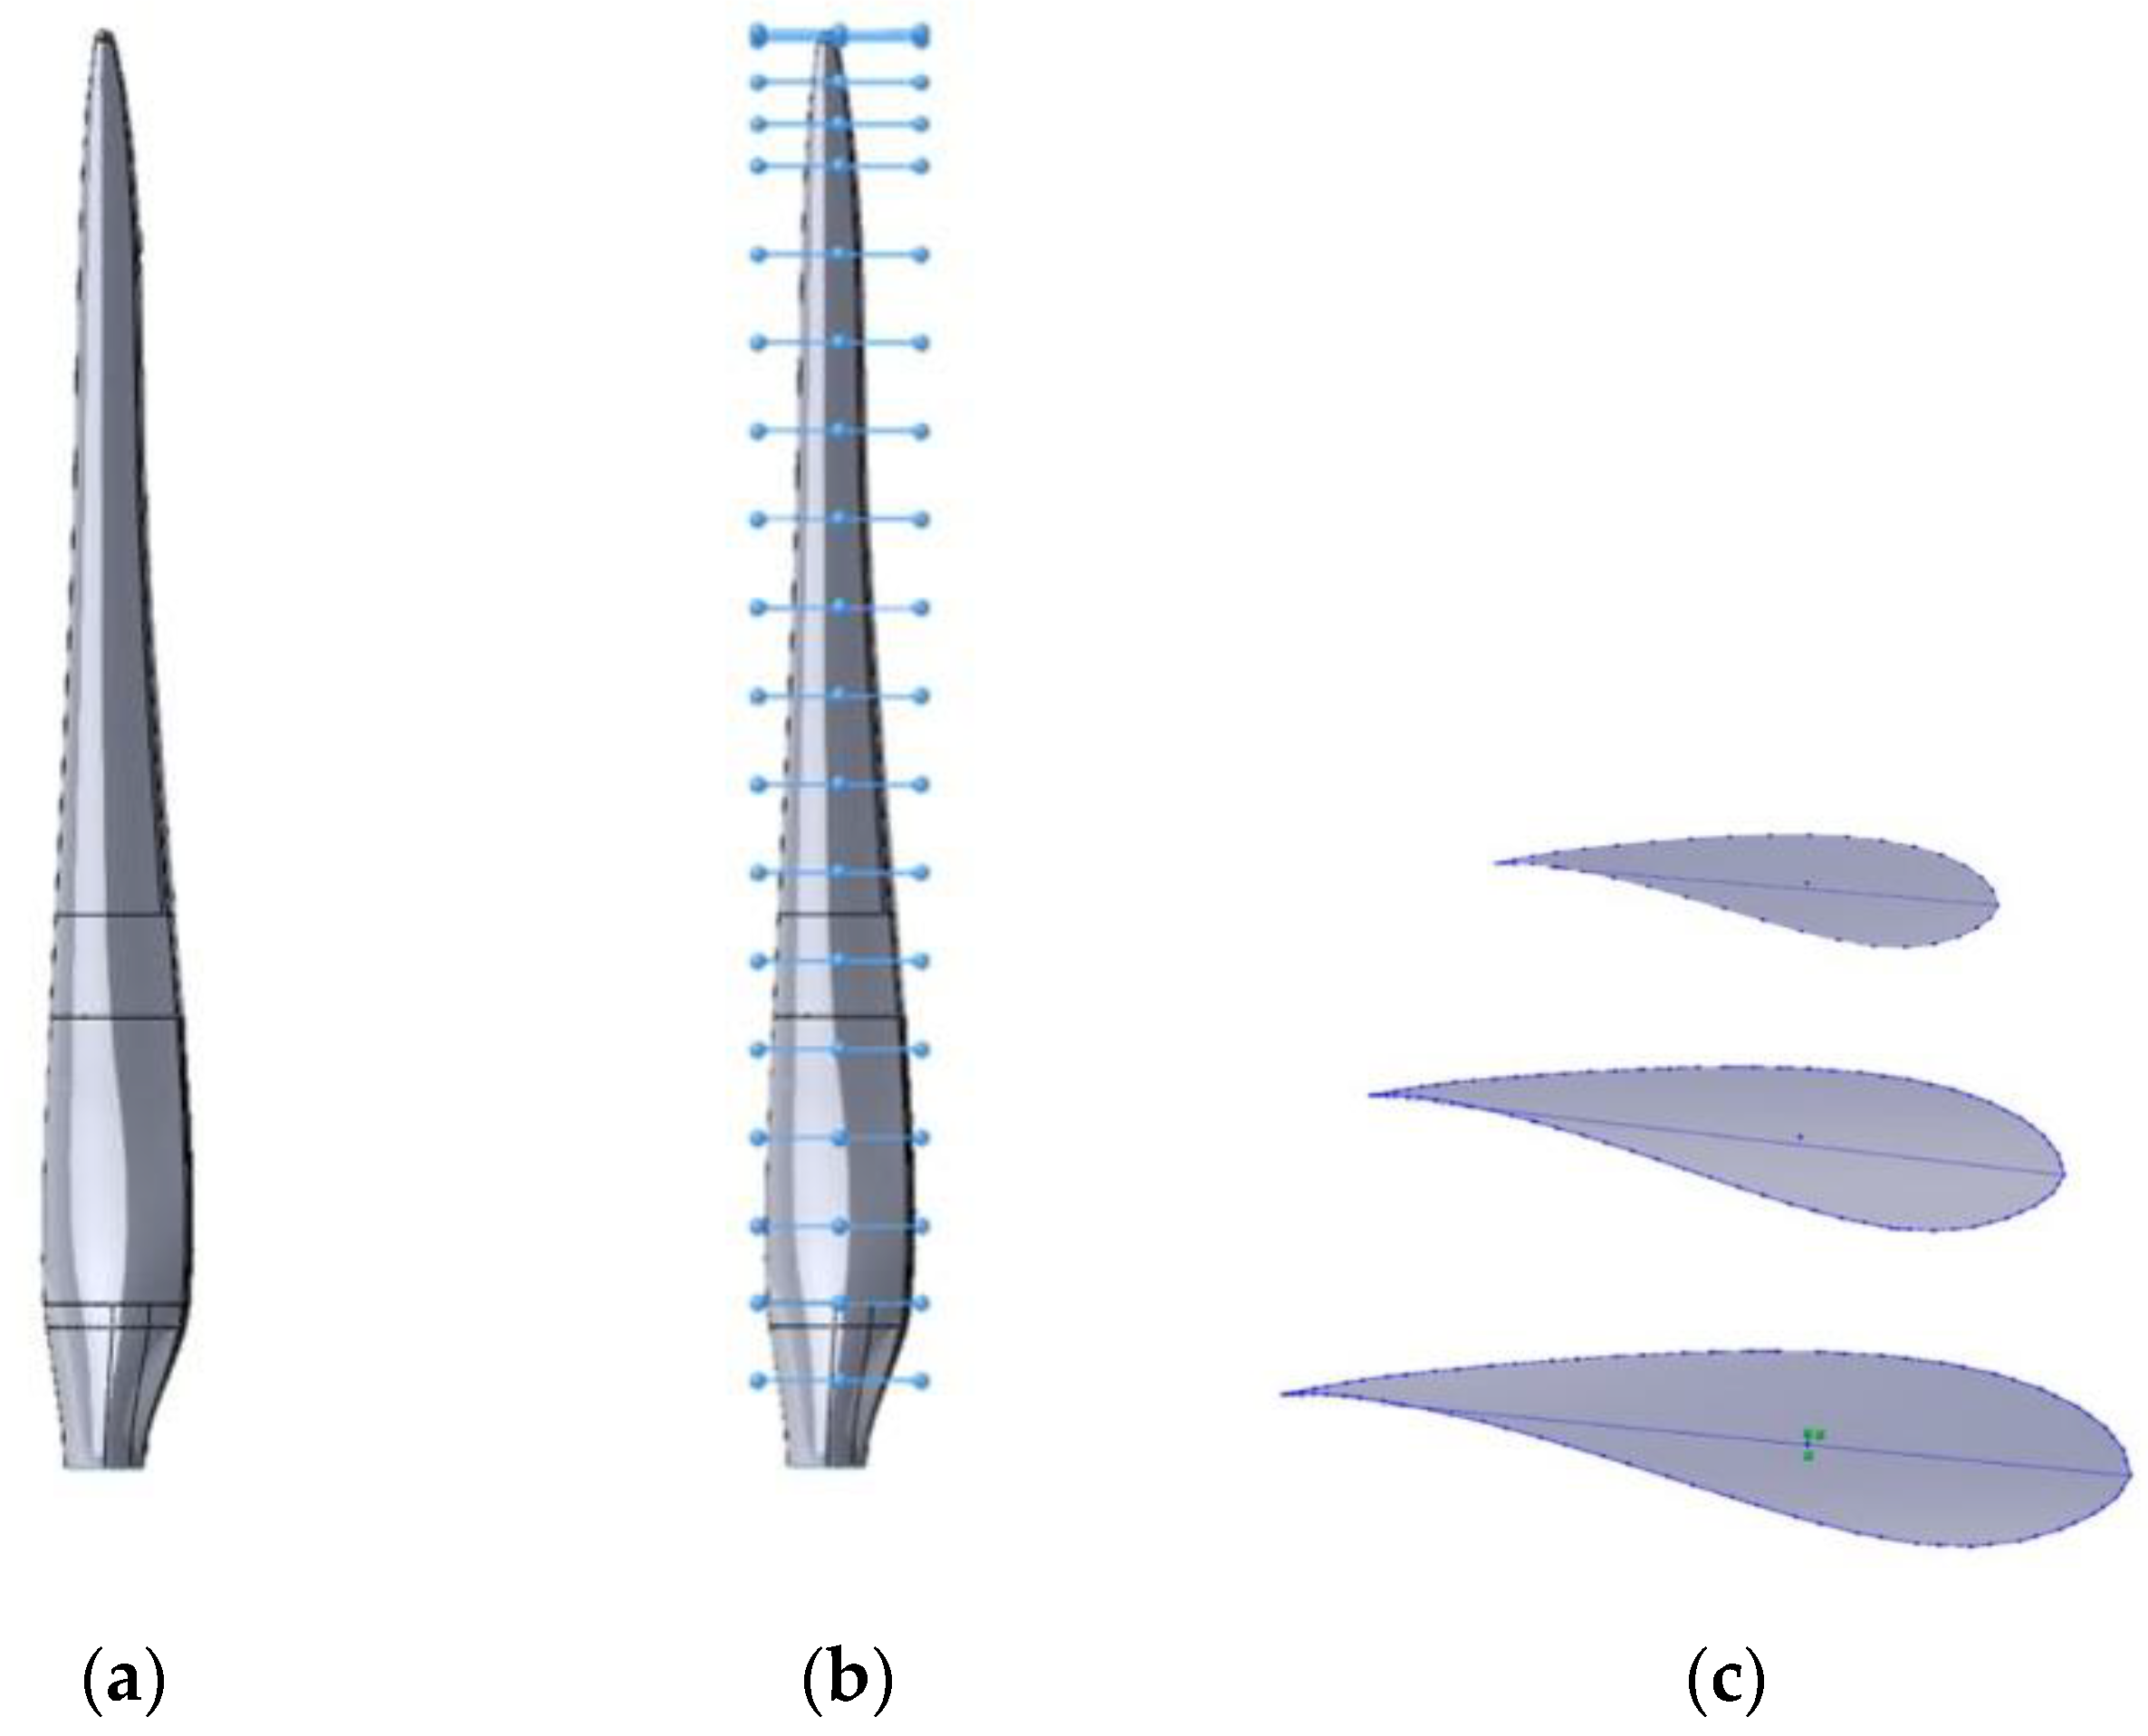
For modeling of the target wind turbine blade, blade shape data were obtained through a 3D scanning process. In addition, the shape data of the acquired blade was applied to a 3D CAD program and used to extract the airfoil shape [24]. As shown in Figure 2, airfoil information for a total of 20 sections was obtained in the spanwise direction of the blade, and aerodynamic analysis was performed using Qblade [25]. Figure 3 shows the process of blade modeling.
With the information of the airfoils, aerodynamic analysis was performed using Qblade and Xfoil. The target wind turbine is a small wind turbine with a capacity of 20 kW and operates in Reynolds numbers much lower than a large wind turbine; therefore, the aerodynamic performance of the blade is affected relatively significantly by the Reynolds number changes compared to a large wind turbine. Therefore, the lift and drag coefficients were obtained for airfoils along the blade span with Reynolds number ranges that will occur in actual operation to be used for the bladed simulation [26]. Equation (5) represents the Reynolds number required for aerodynamic analysis. R e is the Reynolds number, ρ is the air density, c is the chord length, and μ is the coefficient of viscosity.
R e = ρ v r e l c μ
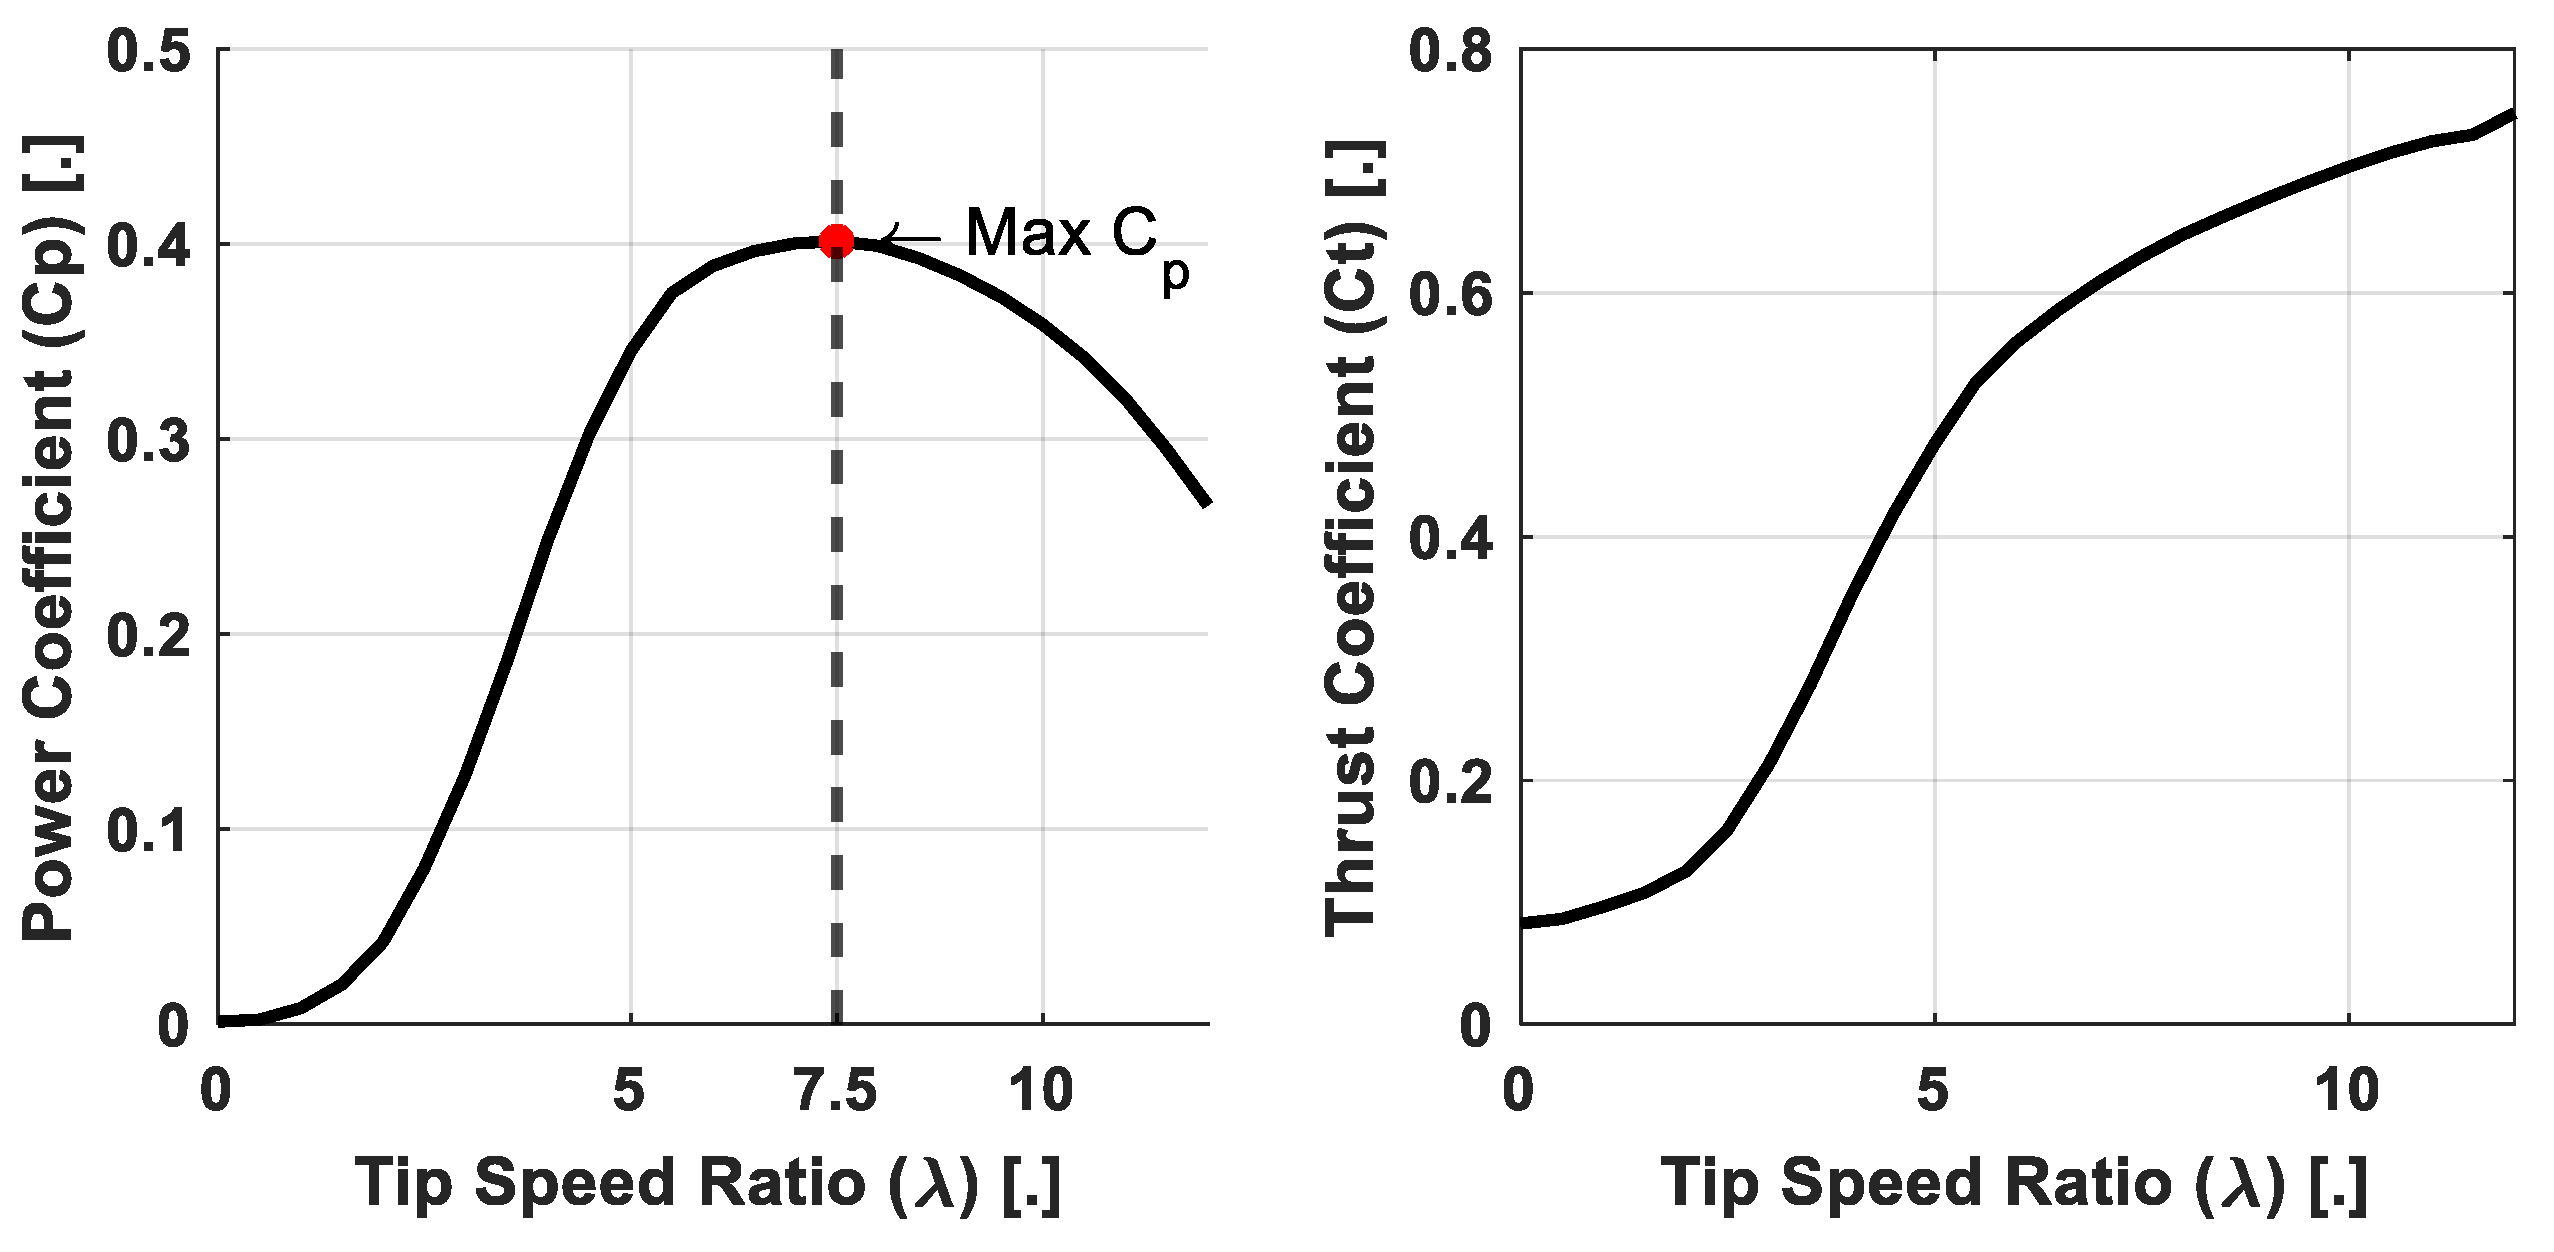
Figure 3 shows the changes in power and thrust coefficient depending on the tip speed ratio change, which is the result of the Qblade simulation of the target wind turbine rotor. In the figure, the power coefficient represents the efficiency of converting the wind power to the mechanical power of the rotor, and the thrust coefficient represents the ratio of the thrust received from the wind divided by the dynamic force of the wind. The power coefficient and thrust coefficient are mathematically defined by Equations (2) and (3), respectively. P is the output power, T is the thrust force of wind turbine, ρ is the air density, A is the rotational area, and V is the wind speed [27].
C P = P 1 2 ρ A V 3
C T = T 1 2 ρ A V 2
In addition, the tip speed ratio is the ratio of the tangential speed of the blade tip to the wind speed, which can be expressed by Equation (4). λ is the tip speed ratio, R is the rotor radius, Ω R is the rotational speed of the rotor, and V is the wind speed.
λ = R Ω R V

3. Control Algorithm

3.1. Control Algorithm for Variable-Speed Variable-Pitch Wind Turbines

Figure 4 shows the power control algorithm of the variable speed variable pitch wind turbine with a mode switch. The algorithm consists of pitch PI control, torque schedule, speed PI control, position switch, and mode switch. The torque schedule is a lookup table for outputting generator torque for maximizing a power coefficient using a generator speed as an input. In other words, control by torque schedule is an open-loop control applied to maintain the optimal tip speed ratio to maximize the power coefficient and is created based on the steady-state rotor analysis using the blade element momentum theory. The position switch is used to combine the maximum power coefficient control and the speed PI control. The position switch receives three inputs. One is the upper limit, which is the maximum generator torque set value, the other is the lower limit, which is the output from the torque schedule look-up table for maximum power coefficient, and the third is the command from the speed PI controller. If the output torque from the speed PI controller is in between the maximum generator torque and the minimum from the torque schedule, the speed PI controller is used to maintain the rated generator speed. If the output torque of the speed PI controller is lower than the lower limit of the position switch, the torque schedule is used to achieve the maximum power coefficient. P M e a is the measured power, Ω M e a is the measured rotational speed, and β M e a is the measured pitch angle.
The mode switch is a logic operator, an S-R Flip-Flop, determining the control mode using signals of generator speed, electrical power, and blade pitch angle. If the mode switch is 0, the blade pitch angle is fixed to the fine pitch angle, and the MPPT (Maximum Power Point Tracking) control of Region II and the transition control of Region II-1/2 are performed using the torque schedule. If the mode switch is 1, the generator reaction torque is fixed to the rated torque and the blade pitch control of Region III is turned on.
To achieve the constant optimal TSR and the maximum power coefficient, the rotational speed of the wind turbine should vary linearly with the wind speed. The rotational speed of the wind turbine is controlled by a torque command. In this case, the torque that is capable of producing the maximum output at the current rotational speed of the wind turbine can be calculated using the optimal mode gain ( K o p t ), which is a unique constant of the wind turbine. K o p t is defined as Equation (5), and the optimal torque command for maximum power coefficient using the optimal mode gain is shown in Equation (6). In Equations (5) and (6), C P m a x is the maximum power coefficient of the rotor, N is the gear ratio, K o p t is the optimal mode gain, T c is the torque command, and Ω g is the rotational speed of the generator.
K o p t = ρ π R 5 C P m a x 2 λ 3 N 3
T c = K o p t Ω g 2
For the Speed PI control in the torque loop, the P gain was selected for the crossover frequency of the frequency response of the loop gain transfer function to become 1 rad/s by considering that most energy component in turbulent wind exists at frequencies lower than 1 rad/s based on the power spectrum of wind speed. The I gain was selected using the Ziegler–Nichols method [28]. For stability, it was confirmed that there was a phase margin larger than 65 deg at the cross-over frequency. Equation (7) represents the torque open loop transfer function. Equation (8) represents the torque control loop gain transfer function. L s is the loop gain of the torque control loop, k p S is the proportional gain, k i S is the integral gain, τ G is the time constant of a generator, δ Ω G is the change in rotational speed, and δ T is the change in generator torque.
G s ( s ) = δ Ω G ( s ) δ T ( s )
L s ( s ) = k p S + k i S s δ Ω G ( s ) δ T ( s ) 1 1 + τ G ( s )
The blade pitch PI control in Region III performs closed-loop control to maintain the rated generator speed. As the generator reaction torque is fixed at the rated value, if the generator speed is controlled to be the rated value, the generator power is also controlled to be the rated value as a result. For the Pitch PI control in the blade pitch loop, the P gain was selected in the same way used for the speed PI controller in torque loop but the sensitivity of generator speed change by blade pitch angle change varies with the wind speed, and, therefore, gain scheduling was applied to have a constant pitch sensitivity in all wind speeds. Moreover, I gain was selected as a 0.5 ratio of P gain based on the Ziegler–Nichols method [28]. For stability of the blade pitch loop, the phase margin at the crossover frequency was found to be 45 deg. Equation (9) represents the pitch open loop transfer function. Equation (10) represents the pitch control loop gain transfer function [29]. L p is the loop gain of the pitch control loop, k g is the scheduled gain, k p is the proportional gain, k i is the integral gain, τ p is the time constant of a pitch actuator, δ Ω G is the change in rotational speed, and δ β is the change in pitch angle.
G P ( s ) = δ Ω G ( s ) δ β ( s )
L p ( s ) = k g ( β ) k p + k i s 1 1 + τ p ( s ) δ Ω G ( s ) δ β ( s )
Figure 5 shows the operating points of a variable-speed variable-pitch wind turbine on the rotor torque and the rotor speed diagram. In the figure, the operating points along the maximum Cp curve (A-B-C-D-E) represents the MPPT control in Region II. The transition control in region II-1/2 can be either E-F or E-F’ by the limitation on the rated rotor speed. If the rated rotor speed is reached before the rated power is achieved at a given wind speed, the path E-F should be used as the operating points. The point E or F’ represents the control in Region III to maintain the rated power.

3.2. Control Algorithm for Variable-Speed Fixed Pitch Wind Turbines

The control algorithm of the variable-speed fixed-pitch wind turbine is the same as that of the variable-speed variable-pitch wind turbine Regions II and II-1/2, which are operating regions below the rated wind speed. However, since the blade pitch angle cannot be adjusted in region III (in wind speeds above the rated wind speed), the power must be controlled by lowering the aerodynamic efficiency of the rotor through the generator torque control. In order to control power by lowering the efficiency of the wind turbine rotor while the blade pitch angle is fixed, the tip speed ratio must be raised or lowered from the optimal value. Increasing the tip speed ratio means increasing the blade rotation speed, and results in safety problems. Therefore, the tip speed ratio is lowered from the optimal value to reduce the efficiency of the wind turbine rotor. Lowering rotational speed of the blade results in the increase of inflow angle of attack of the wind turbine blade. As a result, if the inflow angle of attack of the blade becomes larger than the critical angle (stall angle), the stall phenomenon occurs, and the efficiency of the rotor is greatly reduced.
Figure 6 shows the block diagram of the control algorithm for the variable-speed fixed-pitch wind turbine proposed in this study. Algorithm consists of Power PI control, Generator speed PI control, torque schedule, mode switch, and position switch. The torque schedule is used in the same way as the control algorithm of a variable-speed variable pitch wind turbine with the goal to maximize the power coefficient (aerodynamic efficiency) of the rotor in Region II below the rated wind speed. The mode switch is similar to the mode switch applied to the variable-speed variable-pitch wind turbine, but the blade pitch angle input is replaced by the measured generator torque. The generator torque, electrical power, and generator speed are used as inputs to the mode switch to determine the operating modes of region II (including II-1/2) and region III similar to the mode switch in the variable-speed variable-pitch controller in Section 3.1. In Figure 6, the position switch outputs a larger value out of the input values. The generator speed control outputs a torque command through PI control to maintain the rated generator speed in Region II-1/2. In addition, in the control (Region III) above the rated wind speed, the torque command is determined by the sum of the PI controller output to follow the rated power and the PI controller output to follow the rated rotation speed. For the PI gains of the speed PI controller were the same as the PI gains of the pitch PI controller in the previous section. The gains of the power PI controller were obtained by the Ziegler–Nichols method [28]. The speed PI control gain was selected to have the same value as the pitch control, and the power PI control gain was selected through a step response using wind of a constant wind speed. After selecting the P gain of power PI control, I gain was selected at a ratio of 0.5. P M e a is the measured power, Ω M e a is the measured rotational speed, and T is the measured torque.
The power PI and the speed PI controllers have different control goals, but they complement each other with a suitable weighting to achieve the rated power and also maintains the generator speed to a certain value lower than the rated value. With the speed PI alone, the generator speed can be controlled to the rated value at high winds, but the power becomes much larger than the rated value. If the power PI is used with the speed PI, the positive errors from the power PI loop at high winds adds a positive contribution to the torque command and this results in reducing the generator speed lower than the rated value. This high wind speed and low generator speed condition results in the increase in angle of attack and finally the power is reduced due to stall.
Equation (11) shows the power control loop transfer function above the rated wind speed. L s P is the loop gain of the power control loop, k p P and k i P are the proportional and integral gains of the power PI control, respectively, δ P is the change in power and δ T is the change in generator torque.
L s P ( s ) = k p P + k i P s δ P ( s ) δ T ( s ) 1 1 + τ G ( s )
Figure 7 shows the operating points of a variable-speed fixed-pitch wind turbine on the rotor torque and the rotor speed diagram. In the figure, the operating points along the maximum Cp curve (A-B-C-D-E) represents the MPPT control in Region II and they are the same as the operating points of the variable-speed variable-pitch wind turbine in Section 3.1. The control in the transition region (Region II-1/2) can be either E-F of E-F’, which is also the same as the transition control in the variable-speed variable-pitch control. The transition from D-E to E-F is made smoothly by the position switch. The control in region III is represented by the operating points along F-G and this is different from the control in region III of variable-speed variable-pitch wind turbines. When the mode switch is turned on, the torque is gradually increased, and the rotational speed is reduced. As a result, the power coefficient of the rotor decreases, and the wind turbine is controlled so that the power does not exceed the rated value even at a wind speed higher than the rated wind speed.

3.3. Optimization of the Proposed Algorithm

The proposed algorithm in this study has a generator torque command obtained by summing individual torque commands of the power PI controller and the speed PI controller above the rated wind speed. Since the rotor speed and the output power are individually controlled, a weight of each control loop may be assigned. Therefore, by applying a gain value to the output of the power control loop, a study was conducted to find out an optimal gain, with which the output performance was improved above the rated wind speed. Figure 8 shows a control scheme with a gain to the output of the power PI control loop.
In order to quantitatively confirm the effect of the gain, k g , simulations were performed at an average wind speed of 16 m/s. Looking at Figure 9, it can be seen that the power tracking performance varies depending on the magnitude of the gain, the larger the gain, the lower the rotational speed, and the electrical power. As the gain increases, the mean value of the electrical power seems to approach the rated power. Figure 10 shows the dynamic simulation results to which various gains of k g are applied. The selected gains were 0.1, 0.5, 1 (base), and 1.5.

4. Validation of Control Algorithm

To verify the performance of the proposed variable-speed fixed-pitch wind turbine control algorithm, a dynamic simulation using turbulent wind was carried out. In addition, the same wind turbine was assumed to be variable-speed variable-pitch, and a control algorithm was designed and applied to enable blade pitch control, and the results were compared and analyzed with the case of applying the variable-speed fixed-pitch control algorithm.
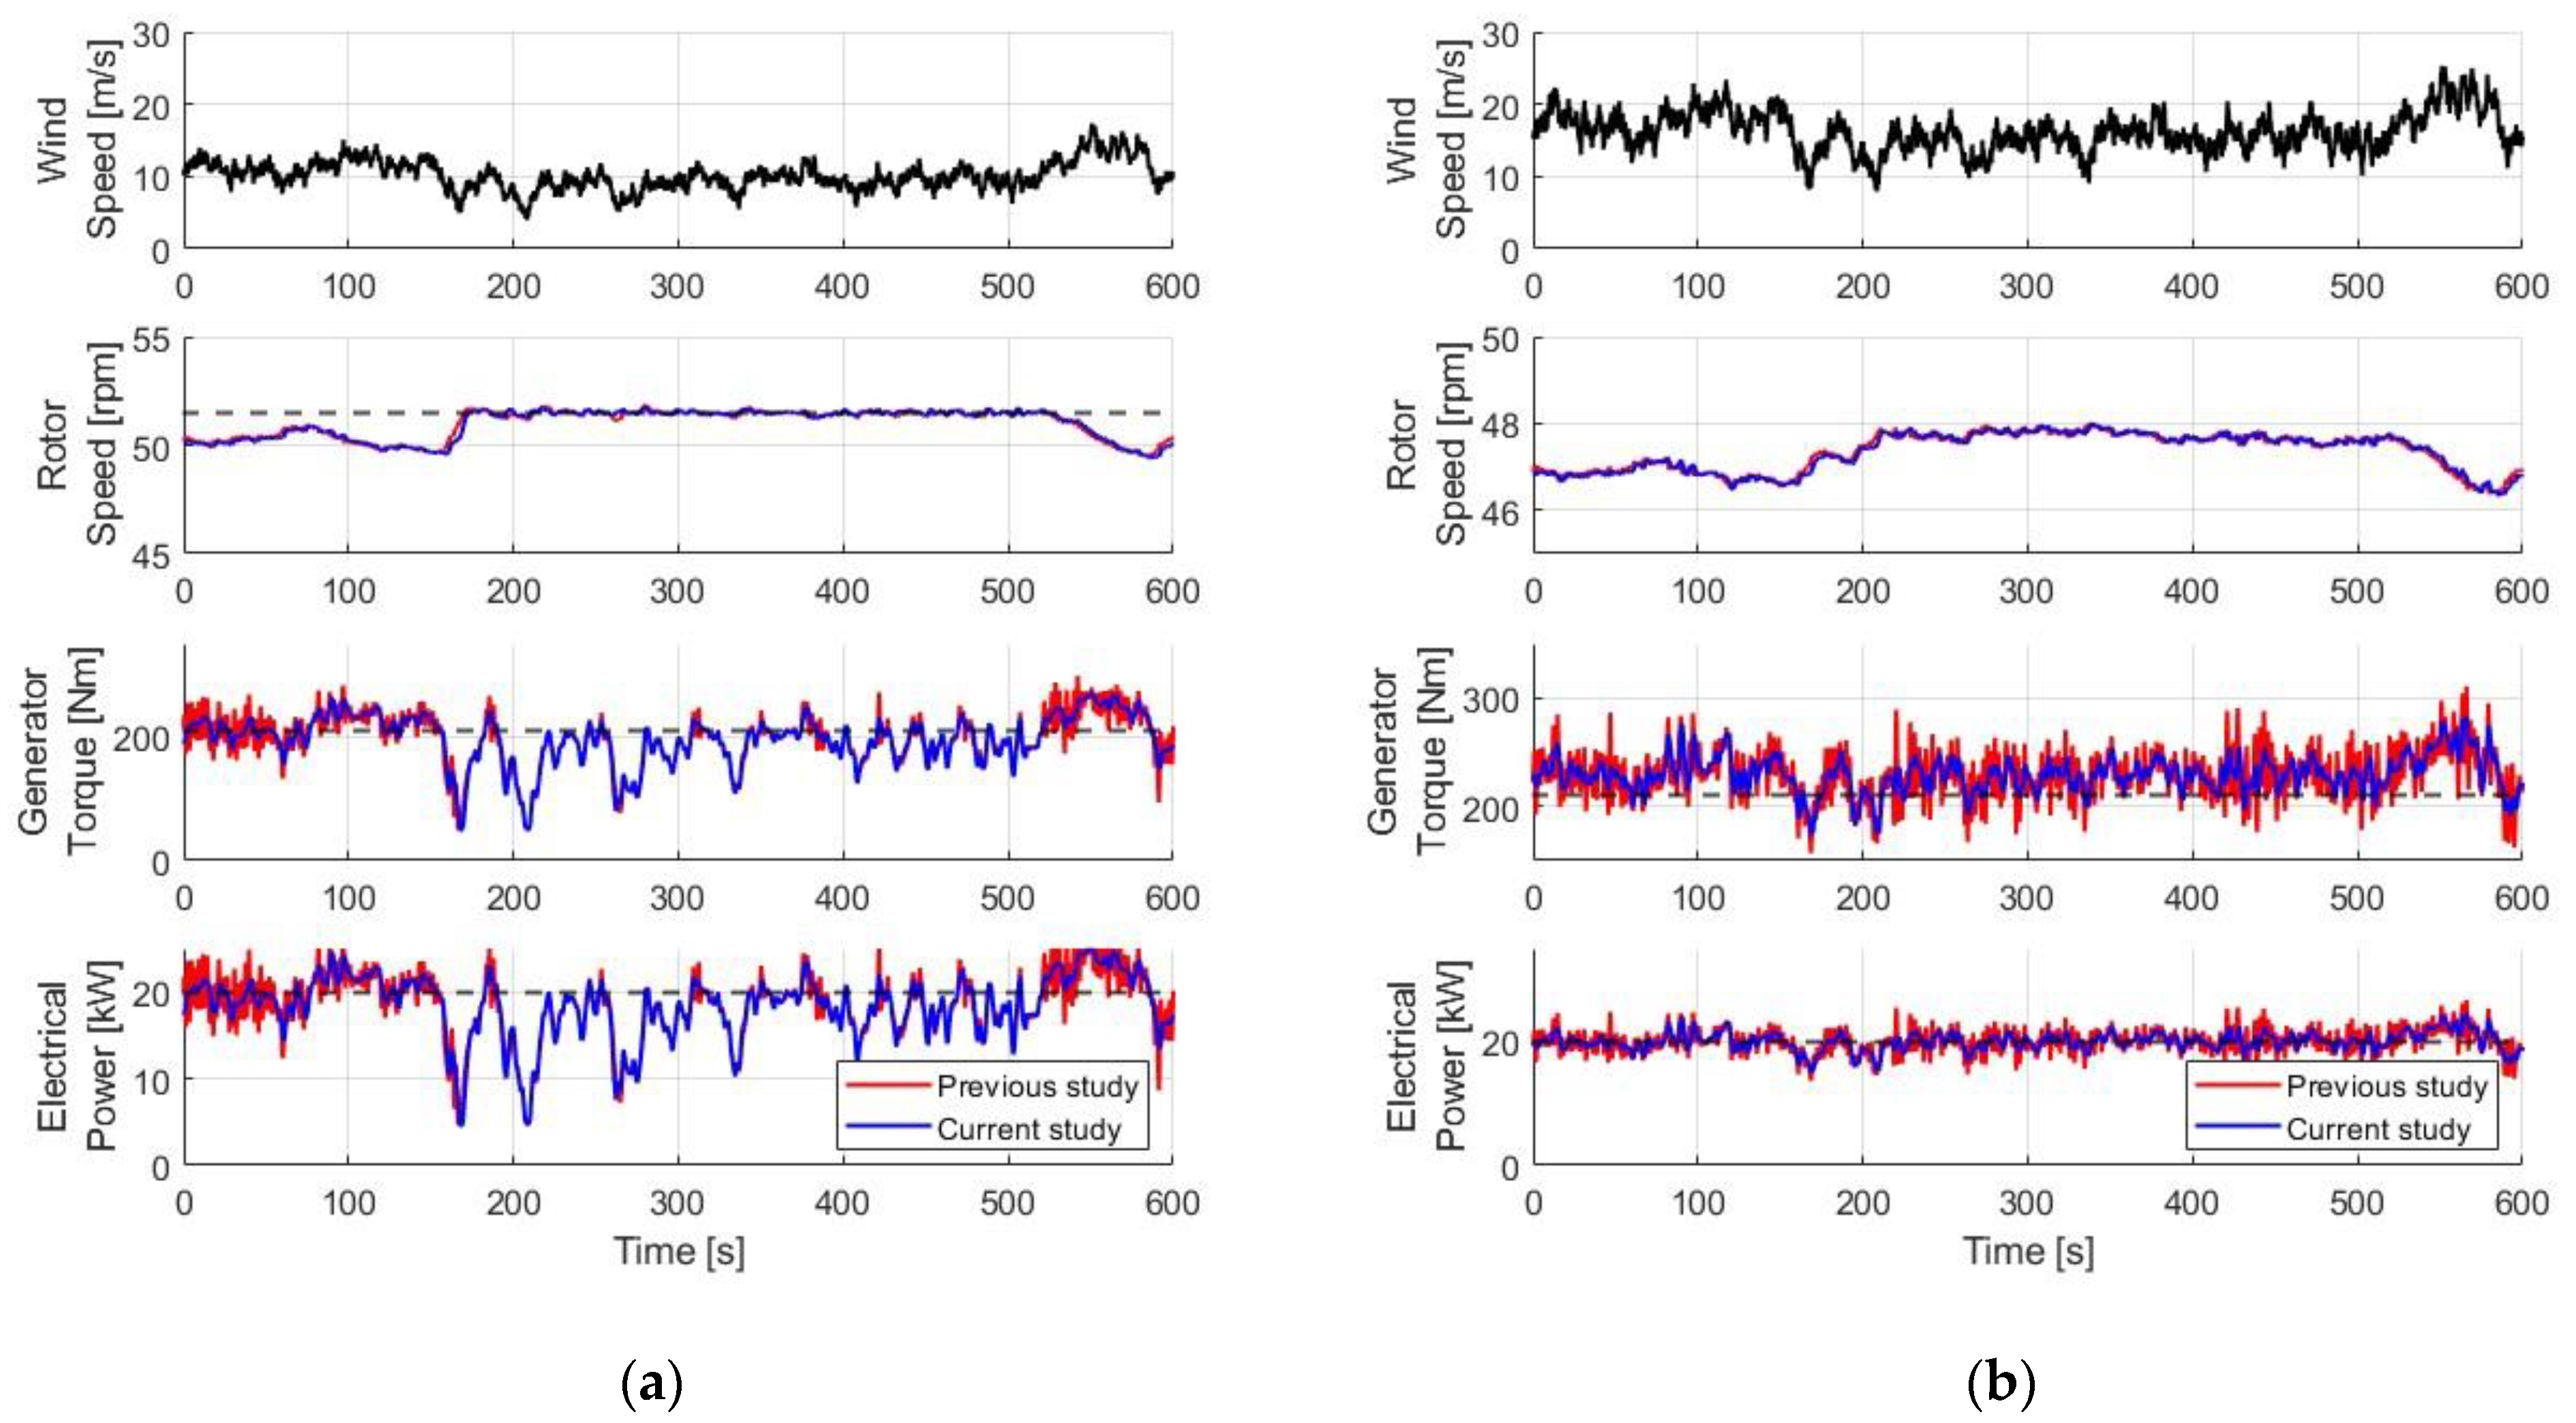
The simulation was performed for 600 s under three-dimensional turbulent wind field using Bladed. The turbulence intensity based on the normal turbulence model specified in IEC-61400-2 was used for different wind speeds. In the case of the low wind speed region (Region II) simulation, the average wind speed and the turbulent wind speed were 10 m/s and 21%, respectively. In the high wind speed region (Region III), the average wind speed was 16 m/s and a turbulence intensity of 17% was applied.
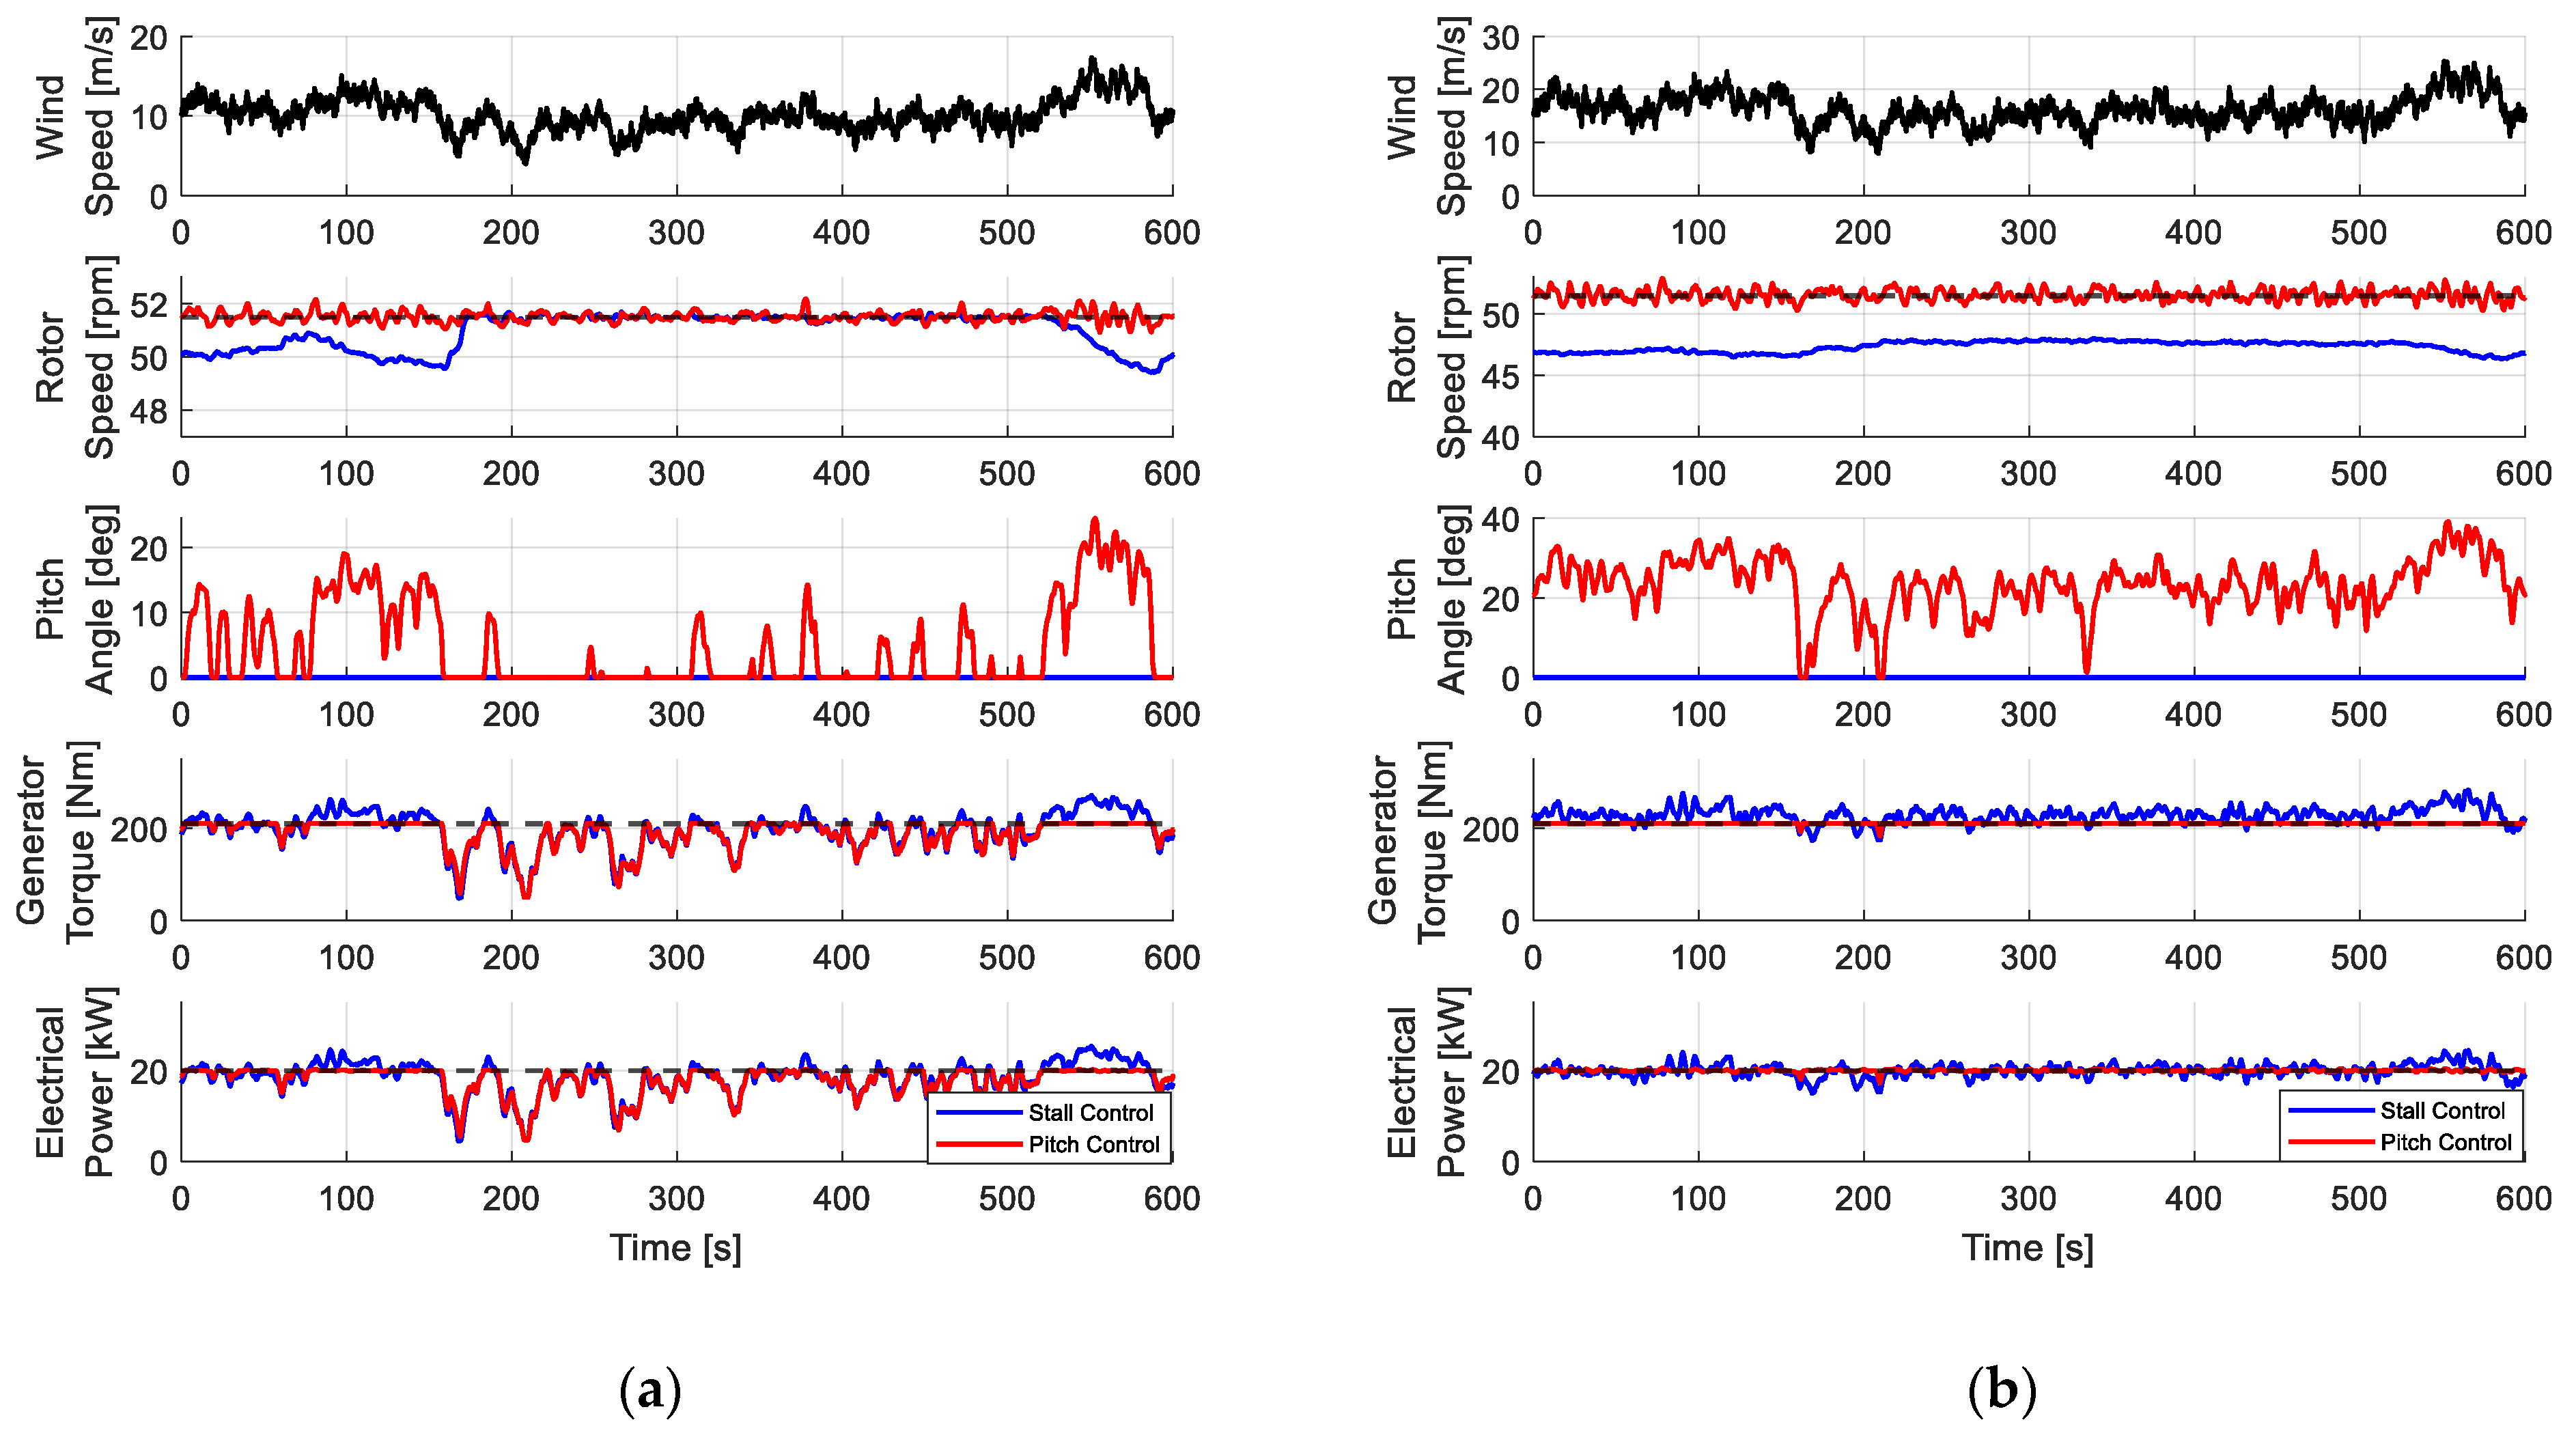
Figure 11a shows the simulation result with an average wind speed of 10 m/s. Basically, in the case of the region below the rated wind speed, the variable-pitch control and the fixed-pitch control show similar results, and it can be seen that the two controllers show a difference in the region above the rated wind speed between 80 and 150 s. Looking at the figure, it can be seen that the pitch control between 80 and 150 s adjusts the blade pitch angle when the electrical power exceeds the rated, maintains the rotor speed close to the rated value, and operates at the rated power through the rated torque output.
On the other hand, in the stall control in the same time range, as the generator torque increases, the rotor speed becomes lower than the rated value. In the case of the section above the rated power, it can be seen that the blade pitch control has better rated power tracking performance than the stall control.
Figure 11b shows the simulation results to which the average wind speed of 16 m/s is applied. It can be seen that the maximum wind speed of the simulation reaches about 25 m/s due to the influence of 17% turbulence intensity. Unlike the 10 m/s simulation, it can be seen that the wind turbine is controlled by the rated power because most of the areas correspond to the rated wind speed or higher.
Looking at Figure 11b, it can be seen that in the case of pitch control, the rotor speed is maintained closely to the rated value and the power is controlled to the rated power, while the blade pitch angles become larger than those in the case of 10 m/s. In the case of stall control, it can be confirmed that the rotation speed becomes lower than in the case of 10 m/s due to the increased wind speed and the power is maintained at the rated power. Comparing the performances of the stall controller in 
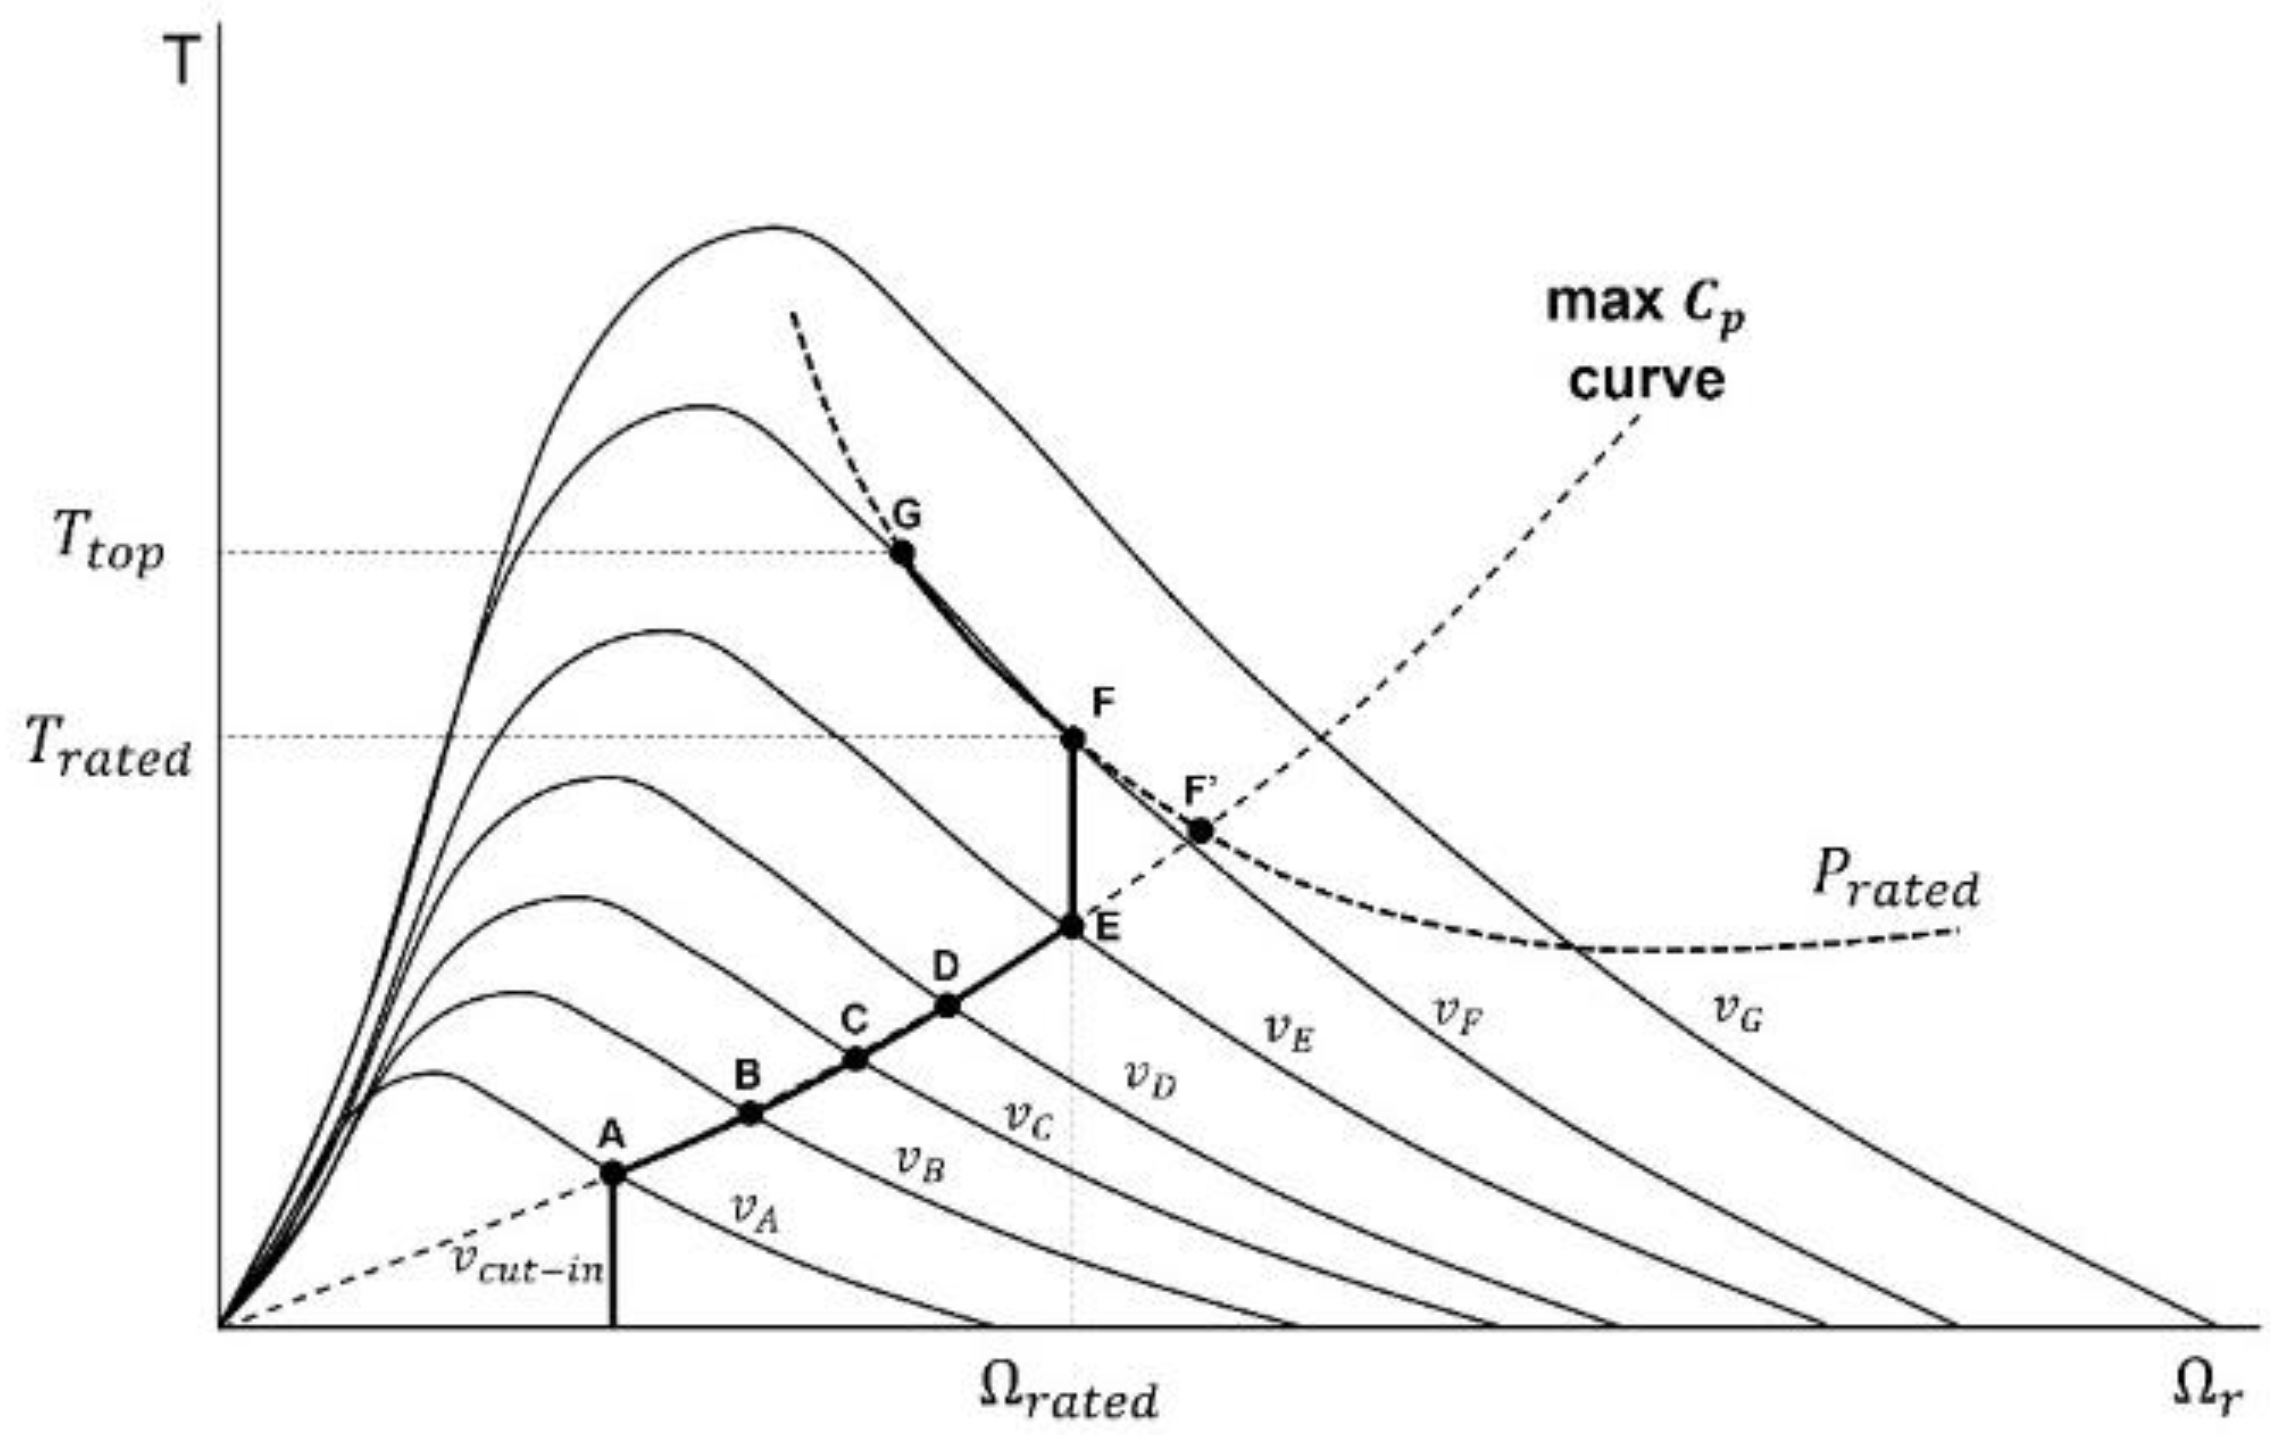
Figure 11a,b, as the wind speed increases, the generator torque increases and the rotor speed decreases while driving. Therefore, it can be confirmed that the wind turbine with a fixed pitch controller is controlled by following line F-G in Figure 7 above the rated wind speed.
Table 2 and Table 3 show the dynamic simulation results of Figure 11 quantitatively. It can be seen in the table that the output power of both controllers is about 2 kW lower than the rated power of 20 kW, and the average value decreases due to sudden power fluctuations in both pitch control and stall control due to mode conversion in the transition region (region II-1/2). The table also shows that the generator torque with the stall control becomes slightly larger than that with the pitch control because it is the only way to reduce the generator speed without blade pitching.
In order to compare the difference in load according to the two control methods of the same wind turbine, it is possible to quantitatively evaluate the degree of fatigue damage using the mean load (ML) of the wind turbine and the damage equivalent load (DEL) based on rain-flow counting method. These are shown in Table 4 and Table 5 for two different wind speeds, 10 m/s and 16 m/s.
Comparing the simulation loads in Table 4 and 
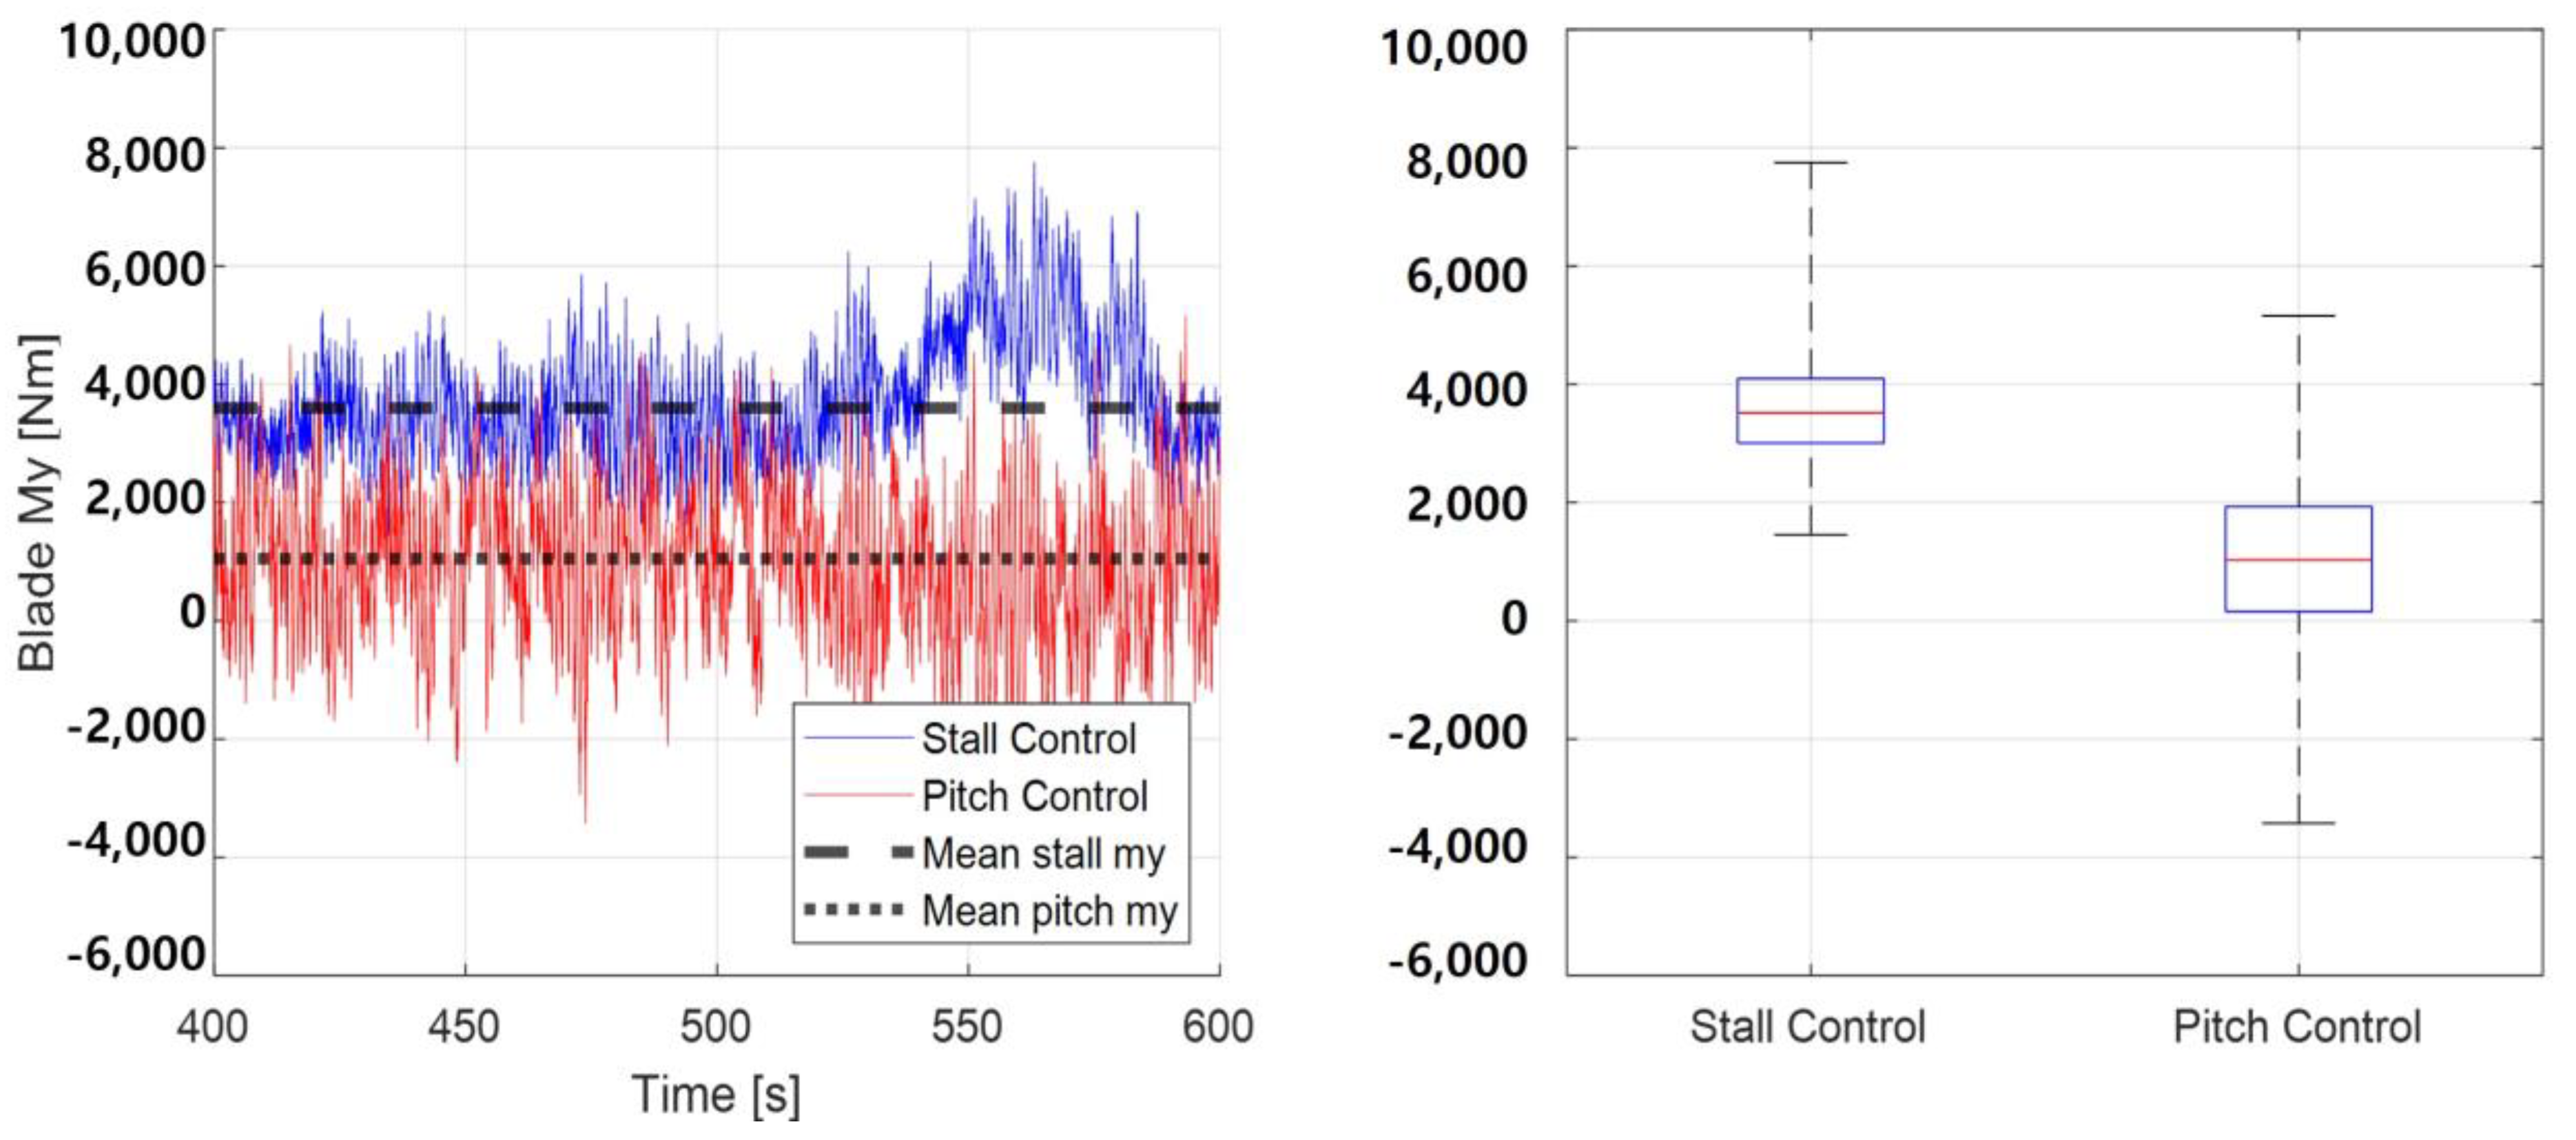
Table 5, it can be seen that the mean load in each wind speed region increases in all parts of the stall control compared to the pitch control, especially up to 242% larger in Blade My (out of plane bending moment at blade root). However, it was confirmed that DEL decreased in all parts except for Blade Mx (in-plane bending moment at blade root), especially in Tower Mx (side-side direction bending moment at Tower bottom). Blade My shows that the mean load of the stall control increases up to 242% based on the pitch control value at 16 m/s, but decreases by 39% in DEL and 59% in Tower Mx DEL.
Figure 12 shows the load fluctuations of Blade My of the pitch control and stall control in the simulation at 16 m/s. Compared to the pitch control, the stall control increased the average load, but the peak-to-peak amplitude of the load fluctuation decreased. The reason why the average load and DEL are different is that the DEL is derived from the rain-flow counting method, which is calculated by applying the maximum and minimum values of vibration to the equation, not the size of the DC component load [30,31].

5. Discussions

In order to verify the proposed VSFP stall control algorithm, a quantitative comparison with the controller proposed in previous studies was performed. The scheme of the controller in the previous study for region III (rated power region) is shown in Figure 13 [32]. The algorithm is similar to that proposed in this study, in that it also uses both a power PI controller and a speed PI controller. It is, however, different in that both PI controllers are connected in series to yield a torque command to the wind turbine generator. This algorithm is imbedded into the bladed program and the PI gains of the controller for the target wind turbine were obtained and provided by the manufacturer of the algorithm [32]. For comparison, the algorithms for regions II and II-1/2 were the same for two different controllers (one proposed from this study, the other available in Bladed).
Figure 14 shows the simulation results using the same wind at mean wind speeds of 10 m/s and 16 m/s. According to the result of Figure 14a, since the same control is carried out from 180 s to 500 s, which is a part below the rated wind speed, it can be confirmed that the same rotor speed and output power are obtained. Figure 14b shows that the proposed stall controller has relatively smaller deviation at torque and output power in the simulation above the rated wind speed. The results of Table 6 and Table 7 show that there is no significant difference when comparing the average values of rotational speed, torque, and power for two cases. However, unlike the rotational speed, the standard deviation differs in the generator torque and output power, and the difference is up to 24% above the rated wind speed. In this case, the difference in rotational speed is not large, but the deviation of output power increases due to the deviation of torque. The two control methods may be the same in function, but it was confirmed that there is a slight difference in torque deviation.

6. Conclusions

A power controller was designed and verified for a 20 kW horizontal axis lift-type wind turbine through dynamic simulation in turbulent wind. The blade shape was acquired through 3D laser scanning. The wind turbine parts were modeled using the target turbine data with the Bladed program.
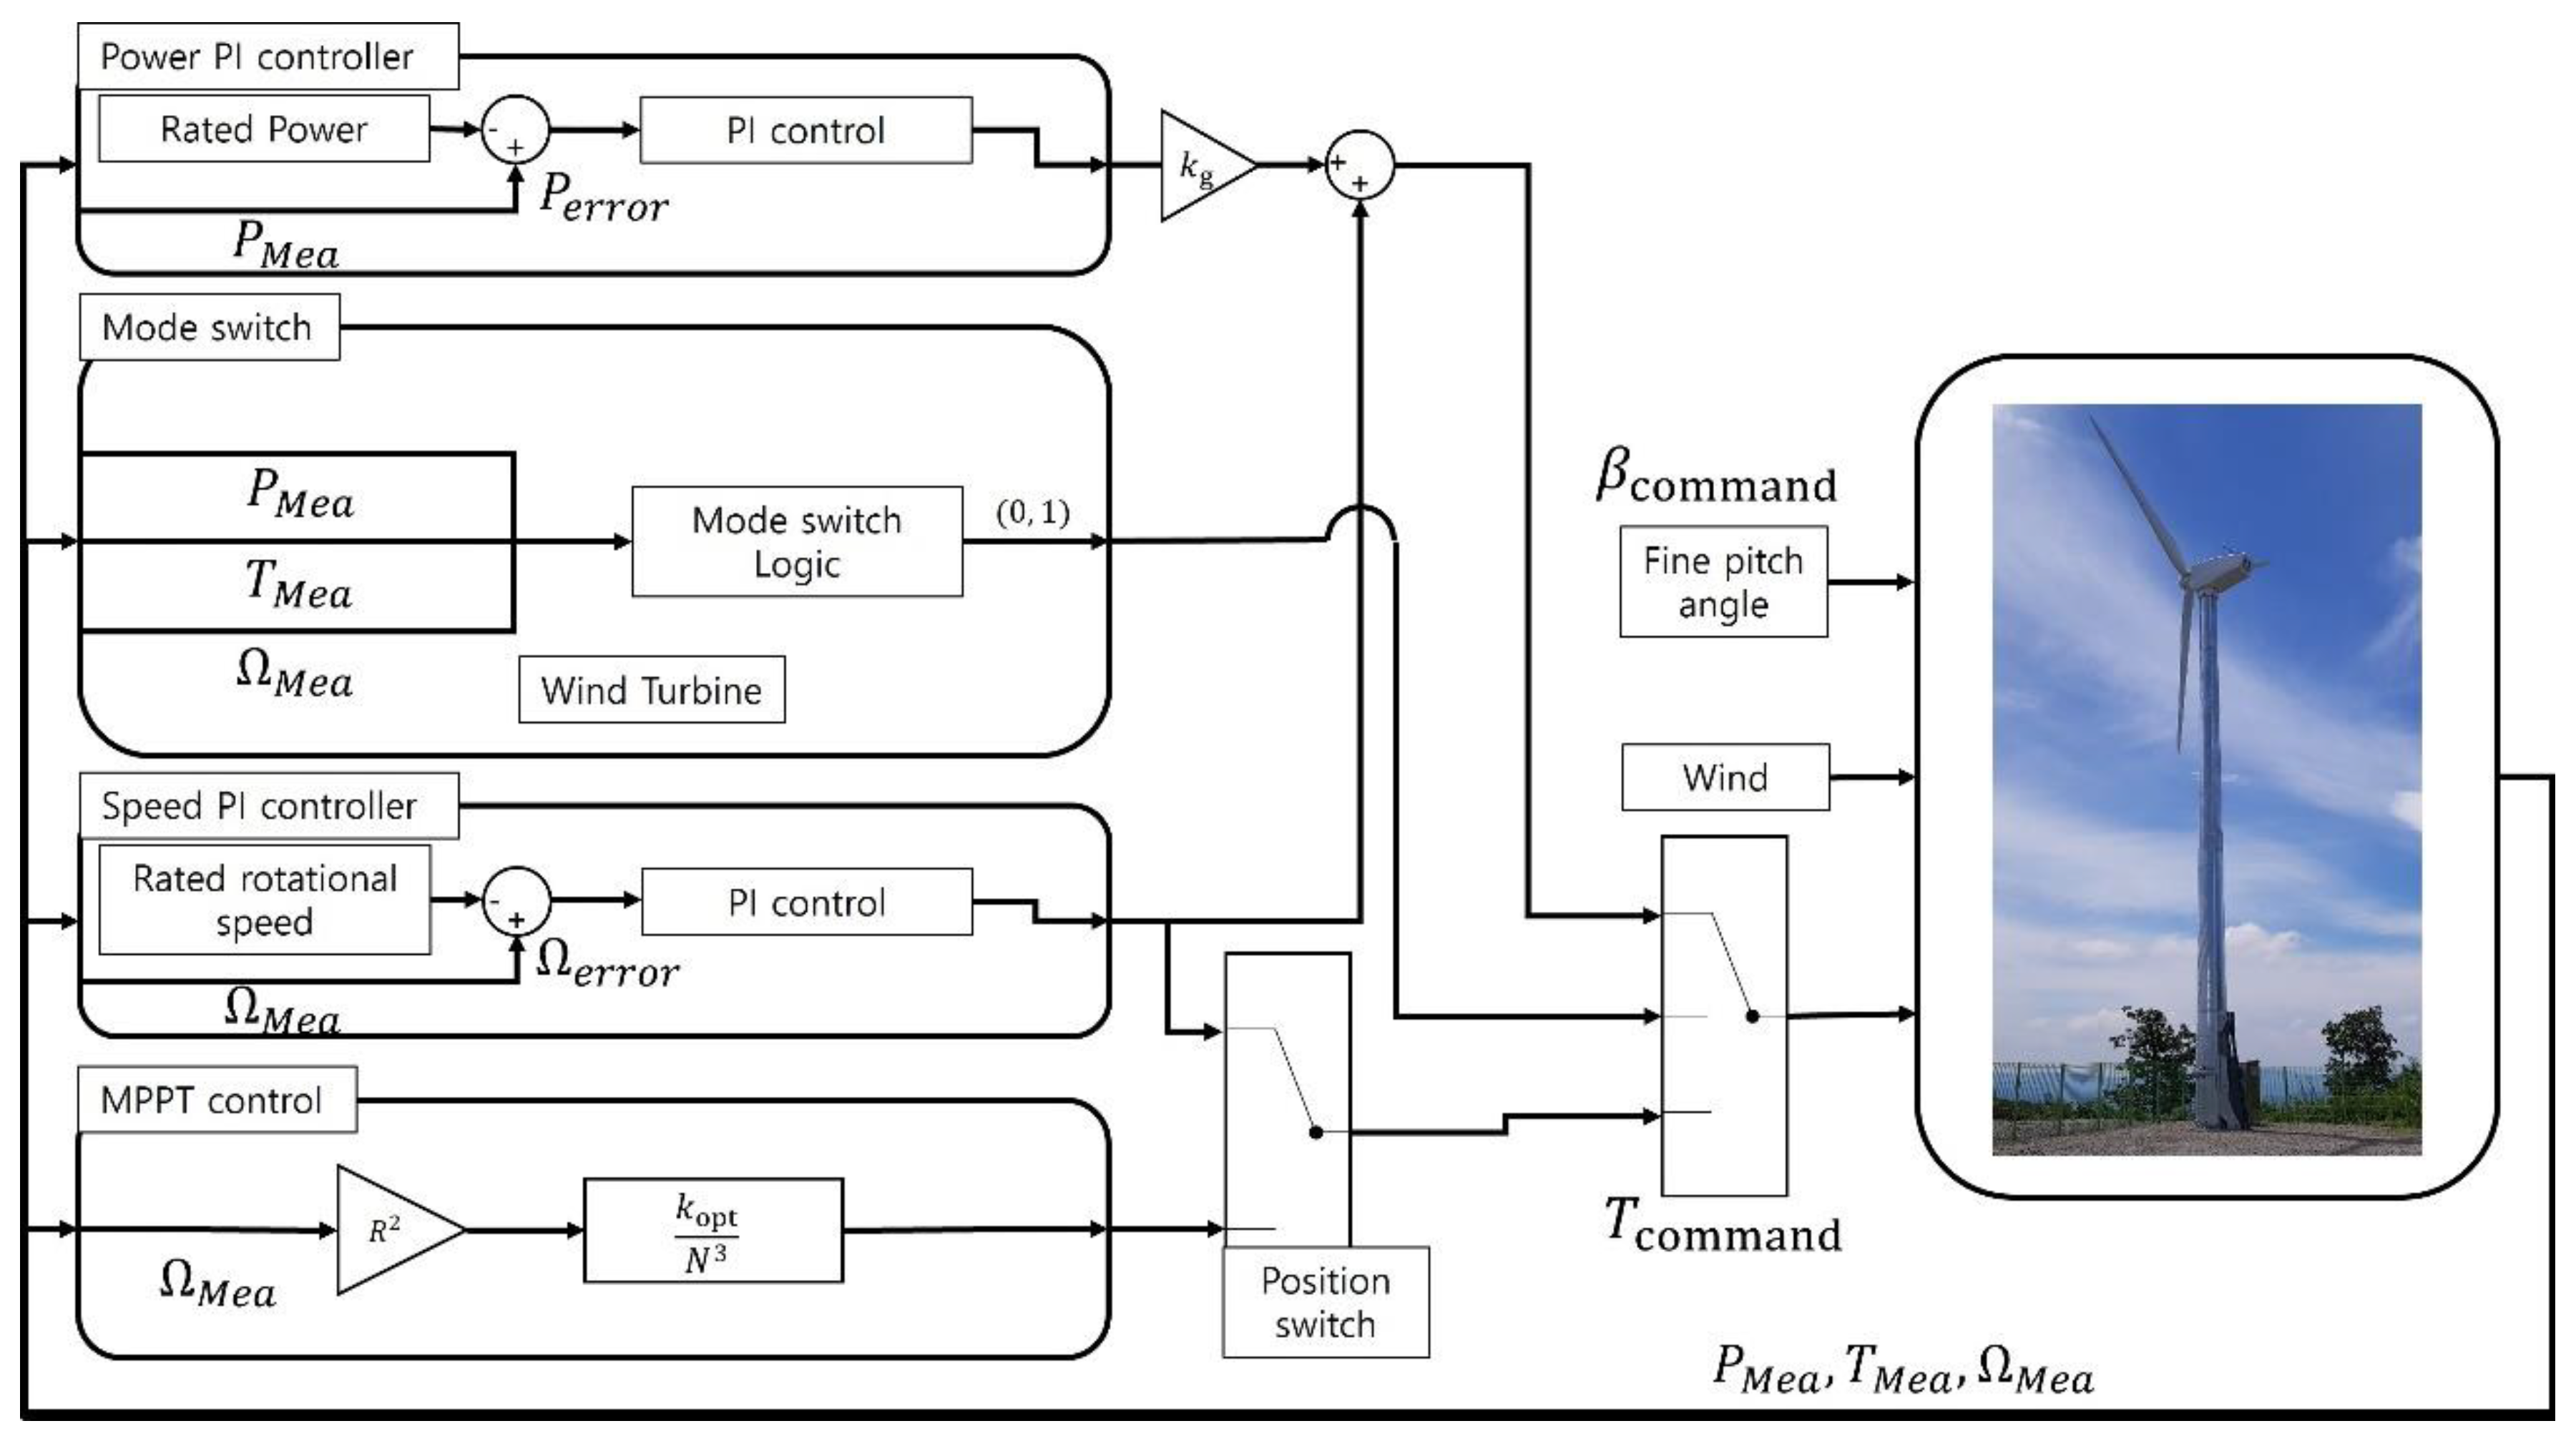
The pitch controller was constructed with pitch PI control, torque schedule, speed PI control, position switch, and mode switch. The torque schedule is an open-loop control that uses generator speed to maximize the power coefficient. The position switch combines maximum power coefficient control and speed PI control, with the mode switch determining the control mode based on generator speed, electrical power, and blade pitch angle. The mode switch can either set the blade pitch angle to a fixed fine pitch angle for MPPT control and transition control or fix the generator reaction torque to the rated torque for blade pitch control in Region III.
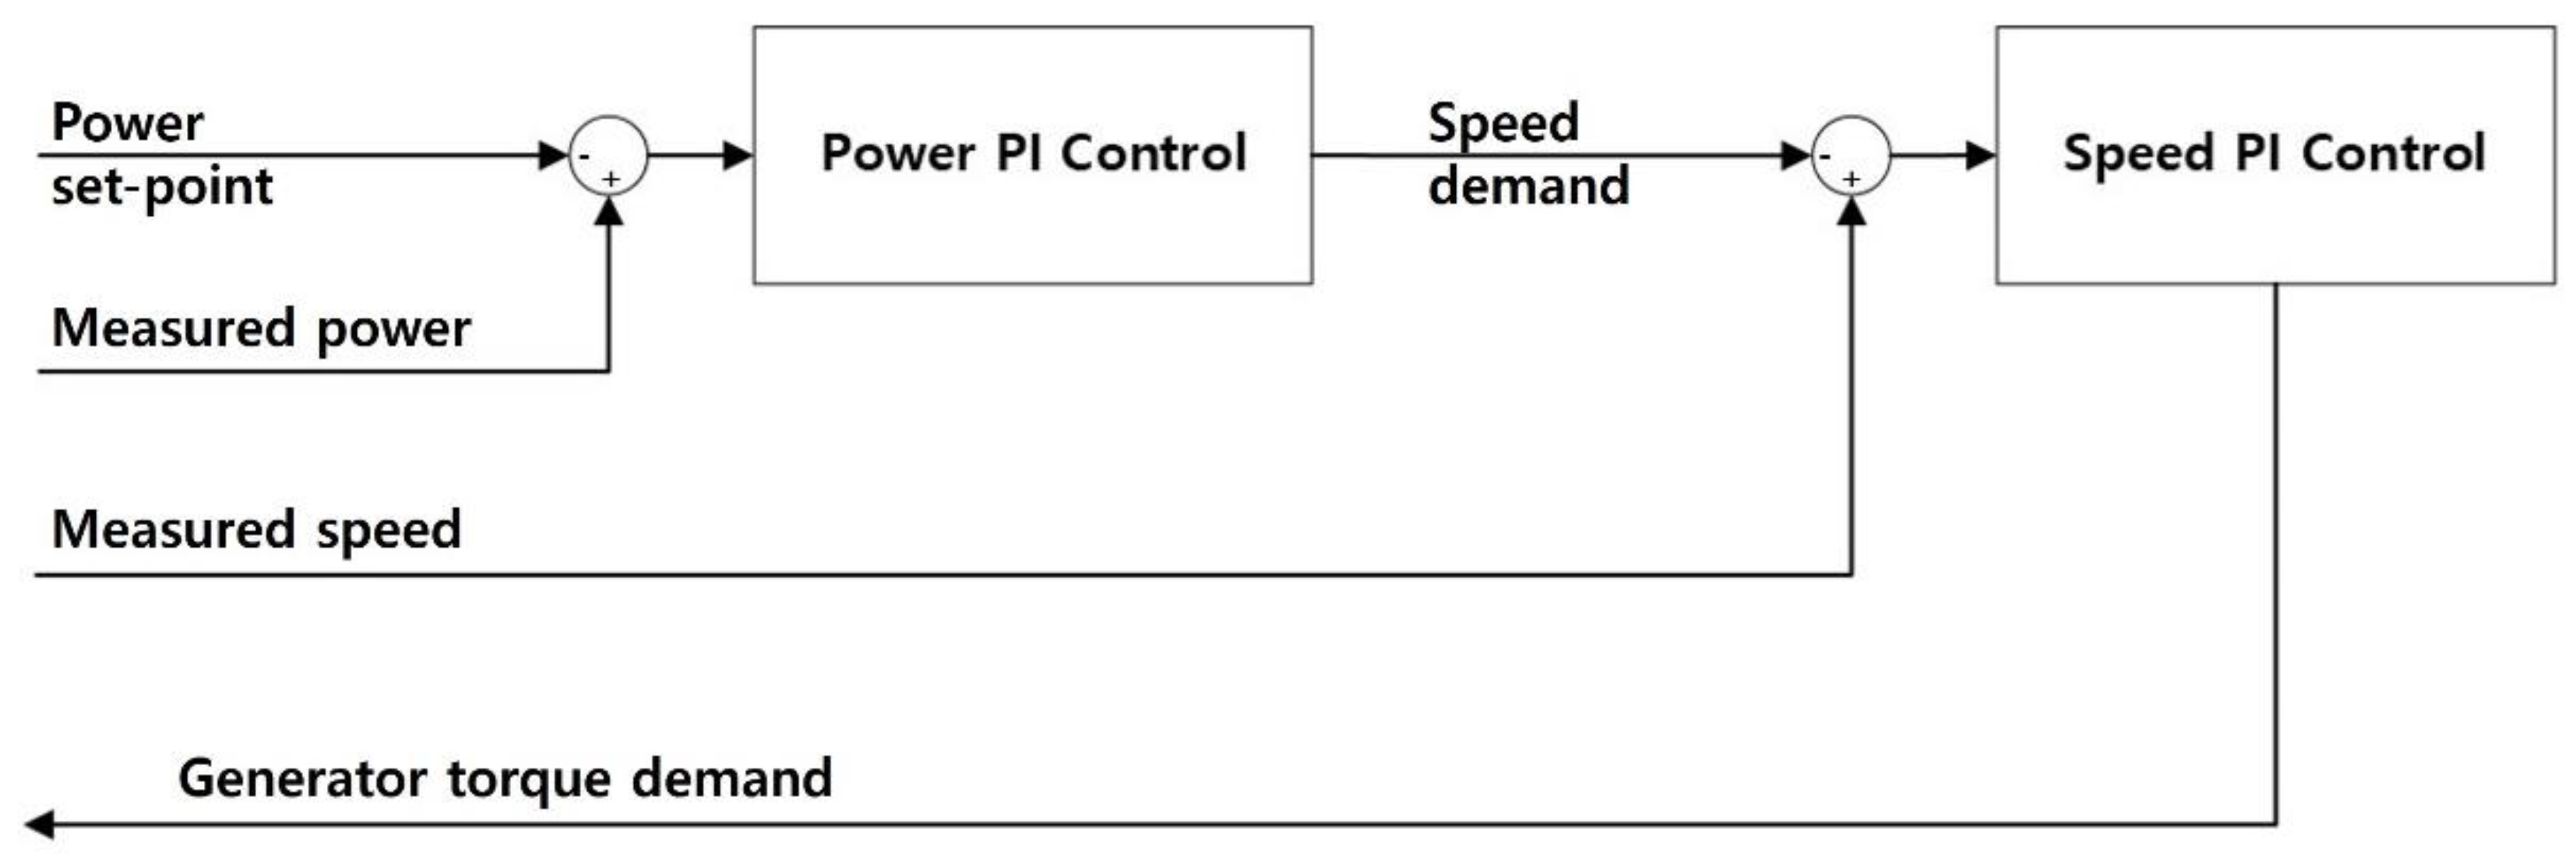
The stall controller was constructed with power PI control, generator speed PI control, torque schedule, mode switch, and position switch. The torque schedule is used to maximize the power coefficient, while the mode switch determines the operating modes based on the generator torque, electrical power, and generator speed. The generator speed is maintained by the speed PI control in Region II-1/2, and the torque command is determined by the sum of the power and speed PI controllers in Region III above the rated wind speed. The PI gains for the power PI controller were obtained through the Ziegler–Nichols method and the speed PI control gain was selected to have the same value as the pitch control.
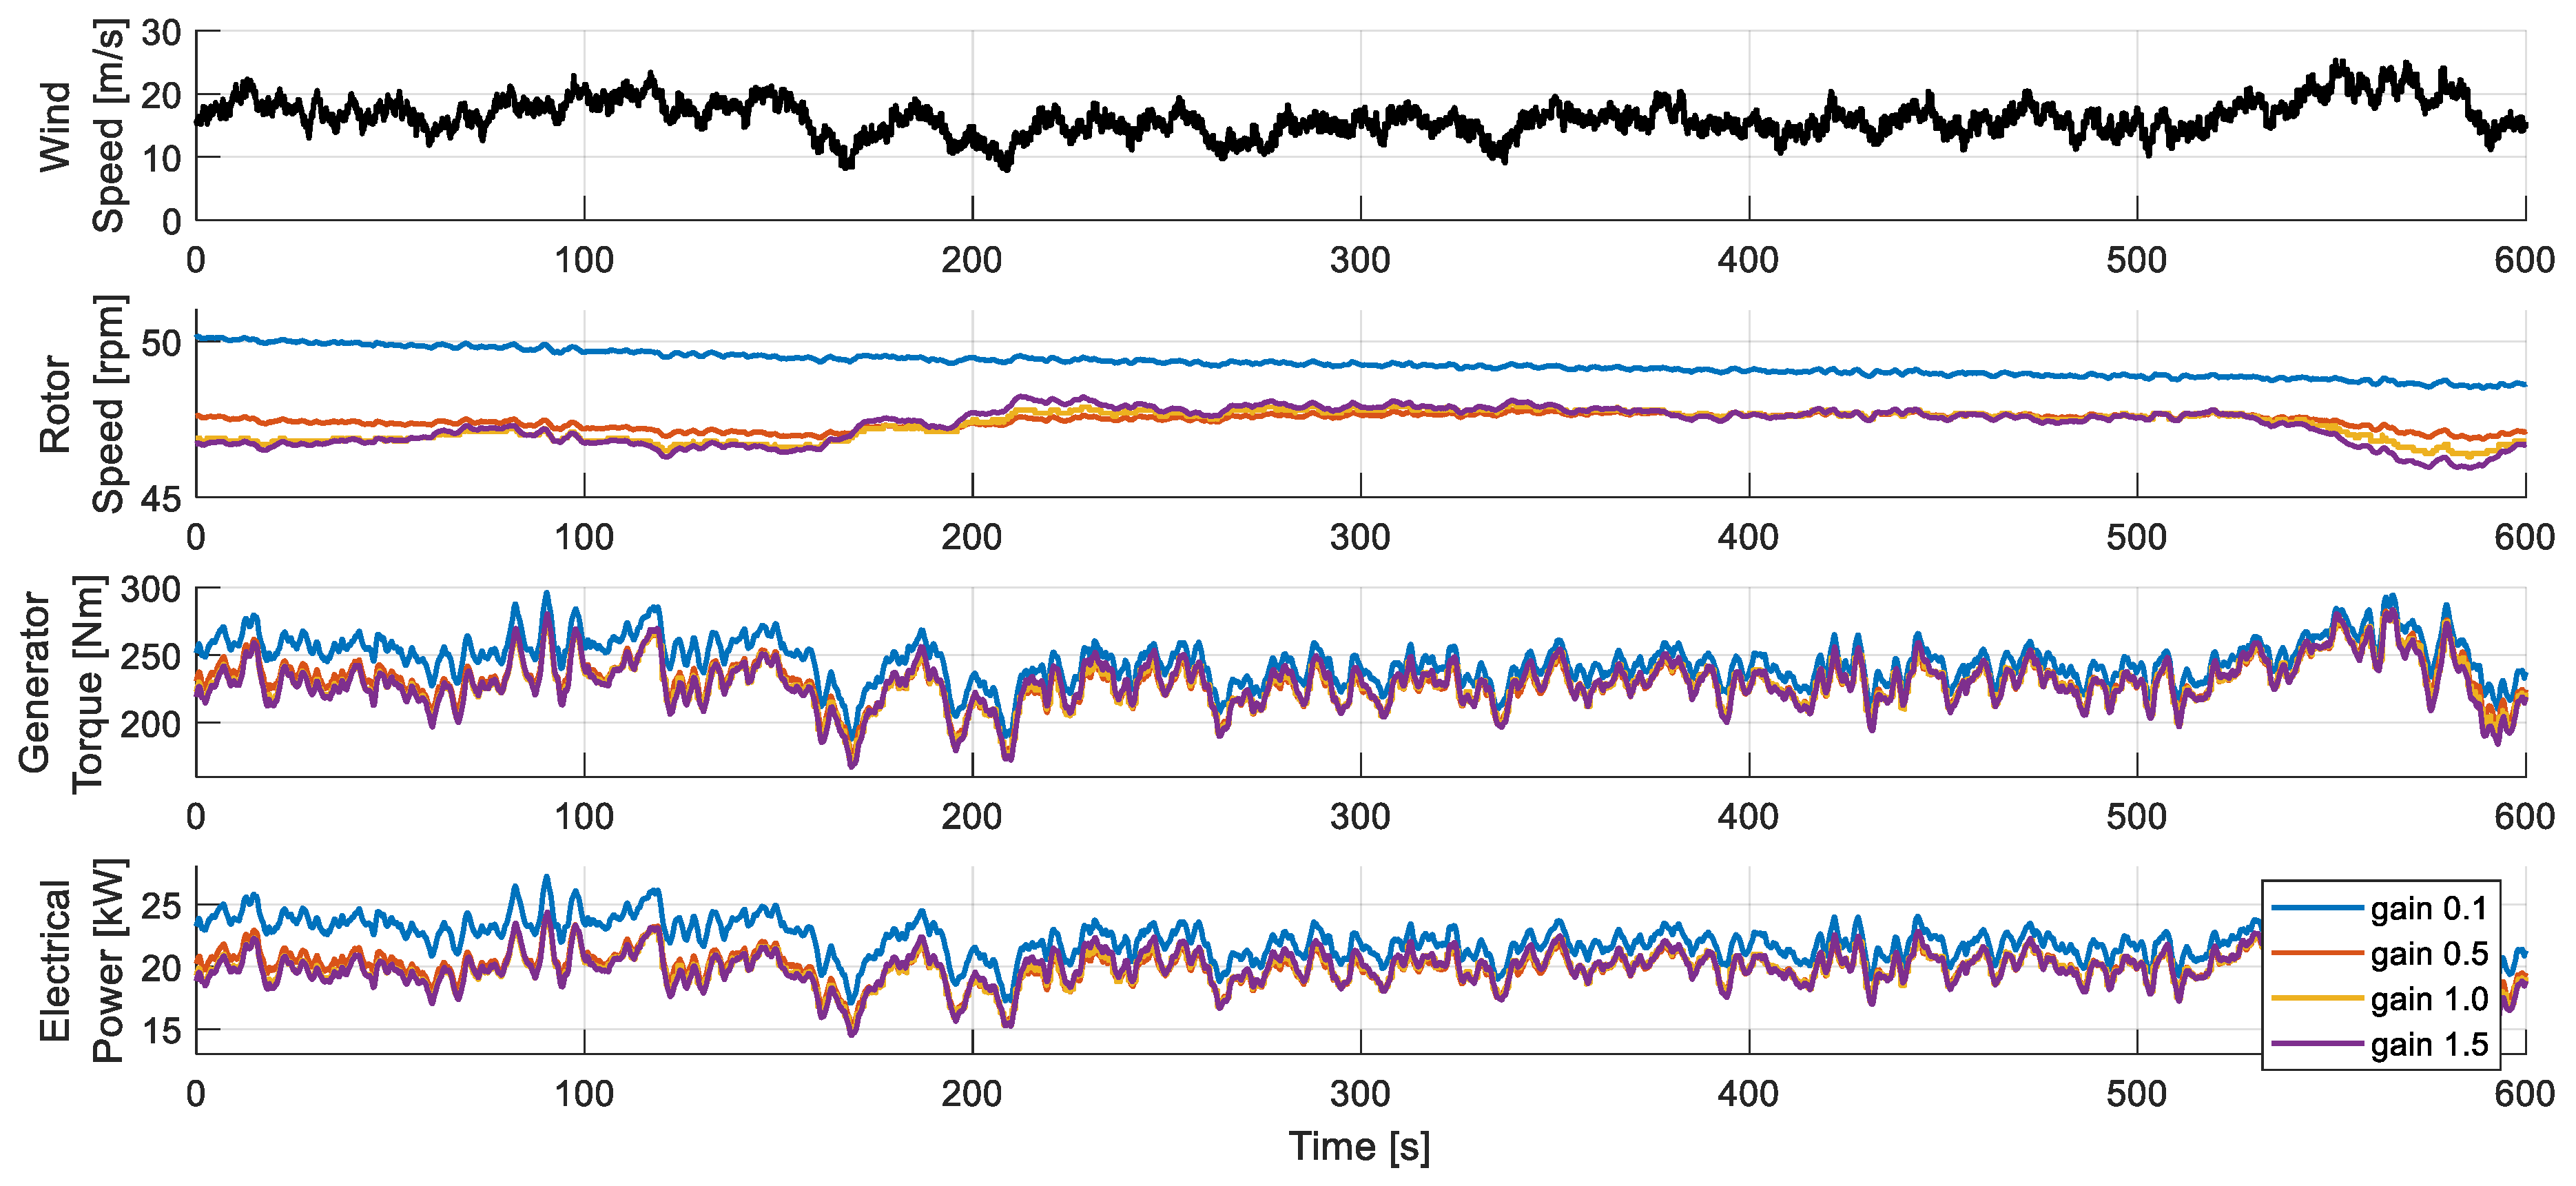
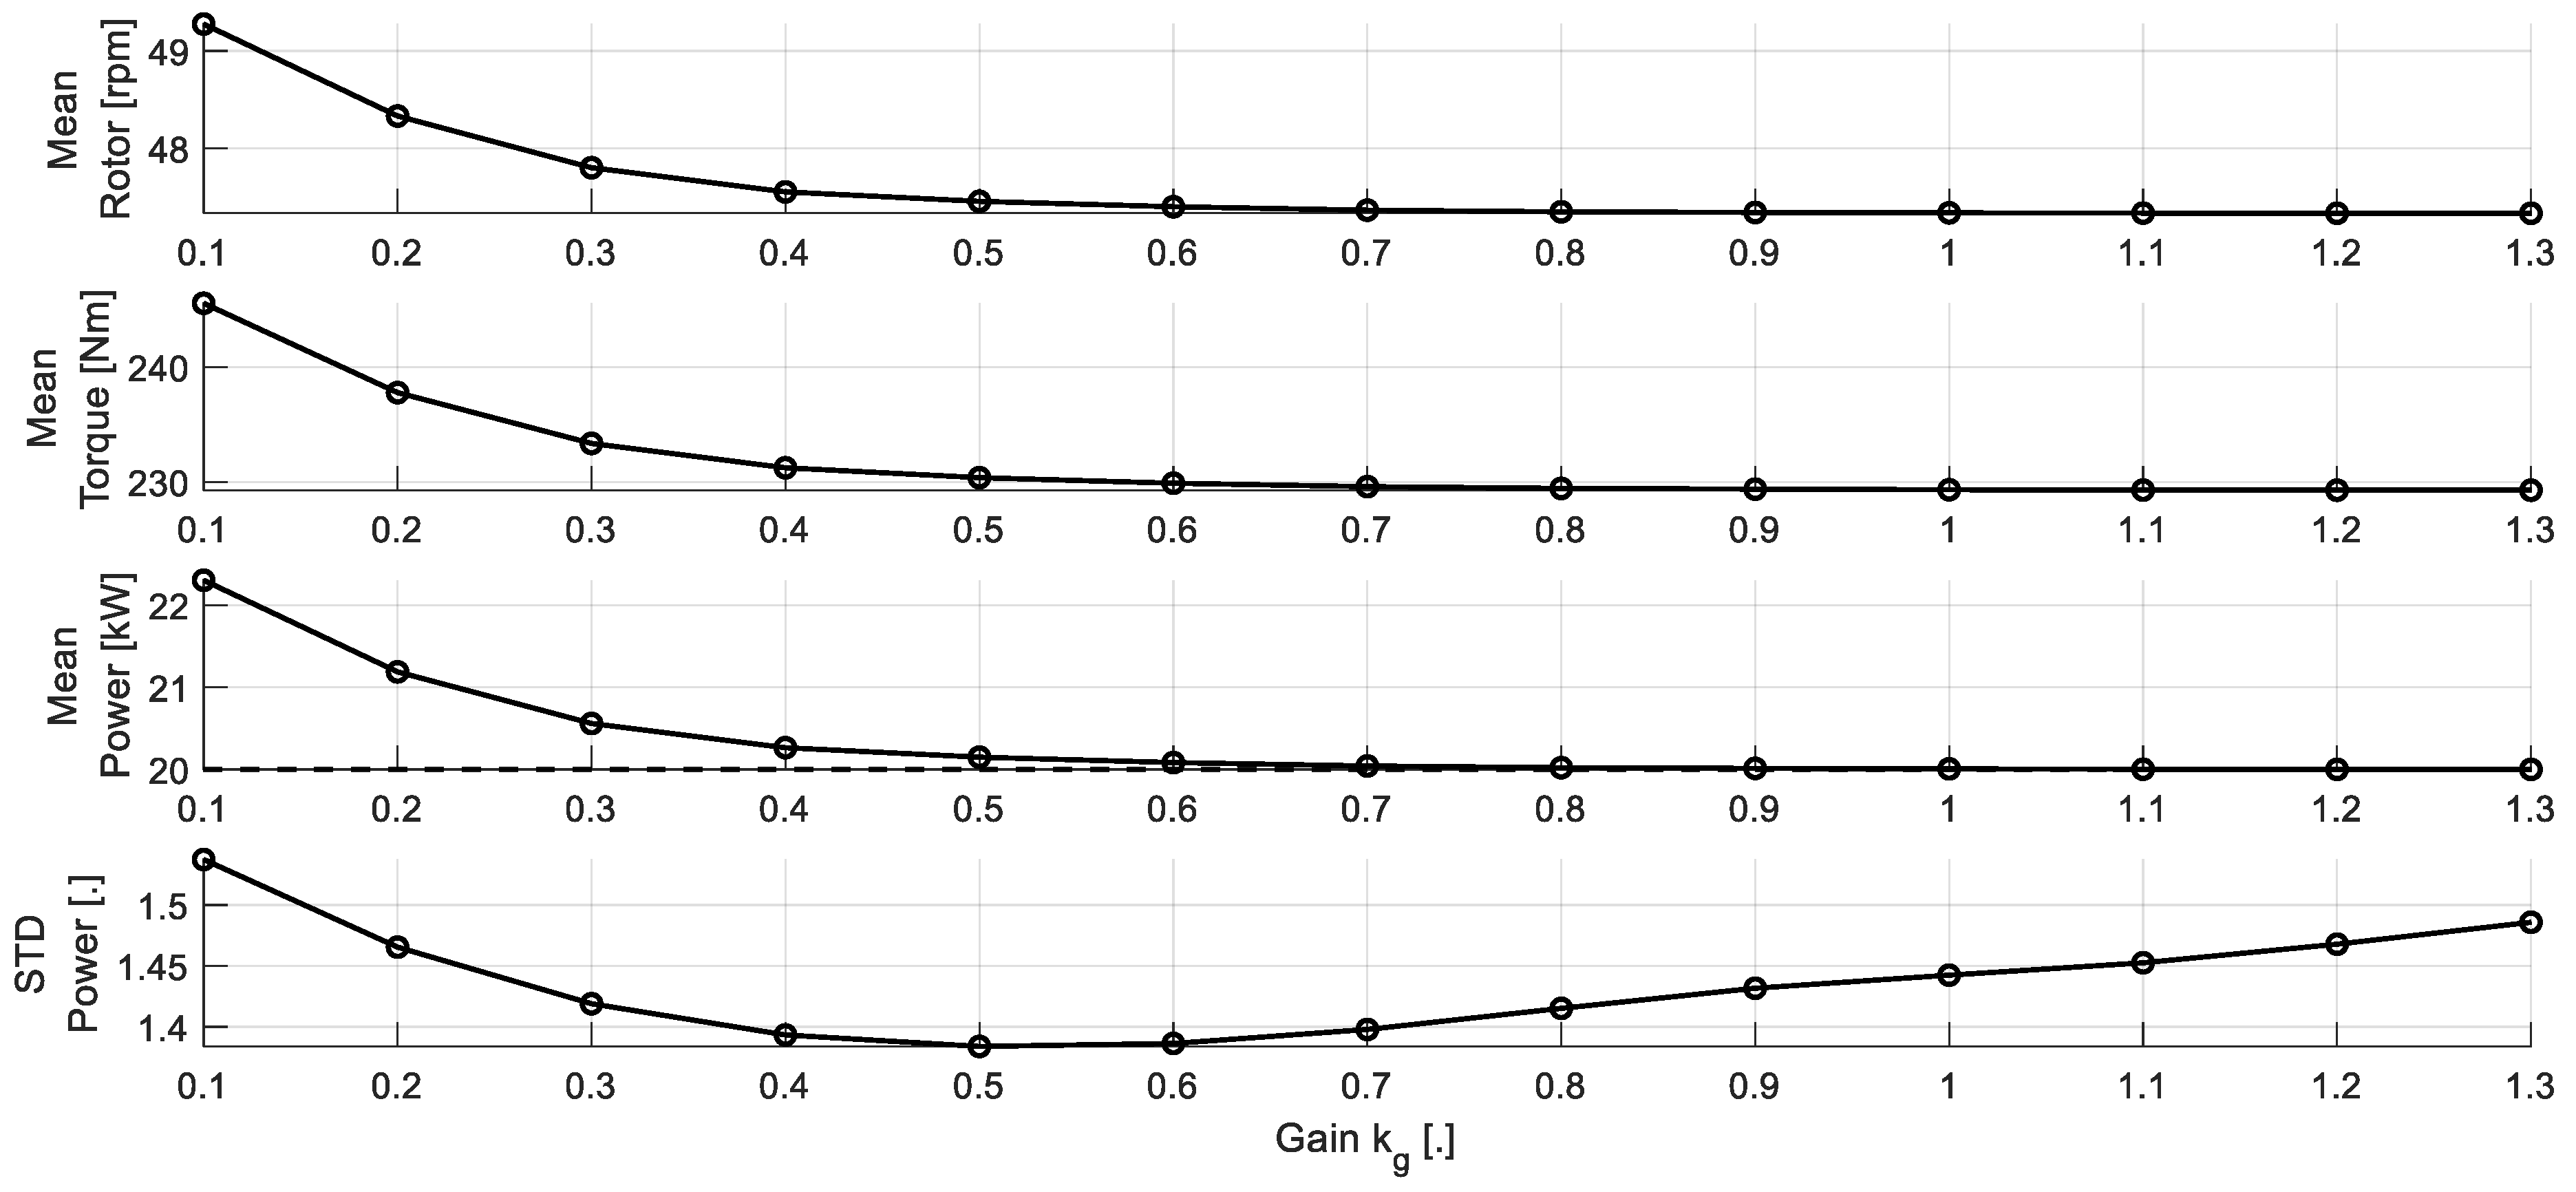
The proposed algorithm uses a generator torque command obtained by combining the outputs of the power and speed PI controllers above the rated wind speed. The output performance was improved by adjusting the gain value of the power PI control loop. Simulations were performed with various gains (0.1, 0.5, 1 (base), and 1.5) and the results showed that the power tracking performance varies with the magnitude of the gain. Larger gains lead to lower rotational speeds and electrical power, with the mean electrical power approaching the rated power.
To verify the power control algorithm of the target wind turbine proposed in this research, a dynamic simulation was conducted in turbulent wind, and two cases were conducted at an average wind speed of 10 m/s and 16 m/s. In addition, in order to compare and analyze the performance of the proposed controller compared to the variable-speed variable-pitch wind turbine power controller, the target turbine was assumed to be a pitch controllable wind turbine, and the power controller was designed and simulated.
Based on the simulation results, the controller proposed in this study showed the same controller performance as the variable-speed variable-pitch controller for Region II and Region II-1/2 below rated wind speed. Although the standard deviation of the electrical power was found to be higher than that of the variable-speed variable-pitch controller, the variable- speed fixed-pitch controller showed well-rated power tracking performance in Region III. In addition, simulation results showed that the stall control has relatively high stability in rotor speed in high turbulence gusts due to SWT’s small rotational inertia because the rotor speed is maintained to a lower value than the rated value in Region III. In addition, it was confirmed that the mean load with the stall control was higher than that with the pitch control, but the fatigue load was smaller with the stall control.
This study analyzed the control performance and features of various VSVP and VSFP wind turbines. Specifically, the optimization process was carried out using a power-weighted gain value for a VSVP wind turbine, and the stable power performance was established. Furthermore, it was found that the average load of the VSFP wind turbine is greater than that of the VSVP wind turbine, but its fatigue load, calculated using the rain-flow counting method, is lower due to its lack of a pitch system. However, in the case of large wind turbines, the impact of the load is significant, thus limiting the applicability of this study.

Author Contributions

Conceptualization, D.J.; resource, D.L.; methodology, D.J.; software, D.J.; supervision, I.P.; validation, D.J. and T.J.; writing—original draft preparation, D.J.; writing—review and editing, I.P. All authors have read and agreed to the published version of the manuscript.

Funding

This work was supported by the Energy Efficiency and Resources Program and the New and Renewable Energy-Core Technology Program of the Korea Institute of Energy Technology Evaluation and Planning (KETEP), with granted financial resources from the Ministry of Trade, Industry and Energy, Republic of Korea (grants numbers 20204030200010 and 20203030020270).

Data Availability Statement

Not applicable.

Conflicts of Interest

The authors declare no conflict of interest.

References

  1. Veers, P.; Dykes, K.; Lantz, E.; Barth, S.; Bottasso, C.L.; Carlson, O.; Clifton, A.; Green, J.; Green, P.; Holttinen, H. Grand challenges in the science of wind energy. Science 2019, 366, eaau2027. [Google Scholar] [CrossRef] [PubMed] [Green Version]
  2. Guterres, A. Carbon Neutrality by 2050: The World’s Most Urgent Mission; United Nations: San Francisco, CA, USA, 2020. [Google Scholar]
  3. Global Wind Energy Council. GWEC Global Wind Report 2021; Global Wind Energy Council: Brussels, Belgium, 2021. [Google Scholar]
  4. Wood, D. Small wind turbines. In Advances in Wind Energy Conversion Technology; Springer: Berlin/Heidelberg, Germany, 2011; pp. 195–211. [Google Scholar]
  5. Simic, Z.; Havelka, J.G.; Vrhovcak, M.B. Small wind turbines–A unique segment of the wind power market. Renew. Energy 2013, 50, 1027–1036. [Google Scholar] [CrossRef]
  6. International Electrotechnical Commission. IEC 61400–2: Wind Turbines—Part 2: Small Wind Turbines; IEC: Geneva, Switzerland, 2013. [Google Scholar]
  7. Jang, H.; Paek, I.; Kim, S.; Jeong, D. Performance prediction and validation of a small-capacity twisted Savonius wind turbine. Energies 2019, 12, 1721. [Google Scholar] [CrossRef] [Green Version]
  8. Jang, H.; Hwang, Y.; Paek, I.; Lim, S. Performance evaluation and validation of H-darrieus small vertical axis wind turbine. Int. J. Precis. Eng. Manuf.-Green Technol. 2021, 8, 1687–1697. [Google Scholar] [CrossRef]
  9. Jang, H.; Kim, D.; Hwang, Y.; Paek, I.; Kim, S.; Baek, J. Analysis of Archimedes spiral wind turbine performance by simulation and field test. Energies 2019, 12, 4624. [Google Scholar] [CrossRef] [Green Version]
  10. Bossanyi, E.A. The design of closed loop controllers for wind turbines. Wind. Energy 2000, 3, 149–163. [Google Scholar] [CrossRef]
  11. Bossanyi, E. Wind turbine control for load reduction. Wind. Energy 2003, 6, 229–244. [Google Scholar] [CrossRef]
  12. Kim, K.; Paek, I.; Kim, C.-J.; Kim, H.-G. Design of power and load reduction controller for a medium-capacity wind turbine. J. Korean Sol. Energy Soc. 2016, 26, 1–12. [Google Scholar] [CrossRef] [Green Version]
  13. Kim, K.; Kim, H.; Paek, I.; Kim, H.-G.; Son, J. Field validation of demanded power point tracking control algorithm for medium-capacity wind turbine. Int. J. Precis. Eng. Manuf.-Green Technol. 2019, 6, 875–881. [Google Scholar] [CrossRef]
  14. Haque, M.E.; Negnevitsky, M.; Muttaqi, K.M. A novel control strategy for a variable speed wind turbine with a permanent magnet synchronous generator. IEEE Trans. Ind. Appl. 2008, 46, 331–339. [Google Scholar] [CrossRef] [Green Version]
  15. Kim, D.; Paek, I.; Kim, J. Analysis and Validation of a Small Capacity Wind Turbine with a Side Furling System. J. Korean Soc. Precis. Eng. 2019, 36, 505–514. [Google Scholar] [CrossRef]
  16. Muljadi, E.; Pierce, K.; Migliore, P. A conservative control strategy for variable-speed stall-regulated wind turbines. In Proceedings of the 2000 ASME Wind Energy Symposium, Reno, NV, USA, 10 January–13 January 2000; p. 31. [Google Scholar]
  17. Pierce, K.; Migliore, P. Maximizing energy capture of fixed-pitch variable-speed wind turbines. In Proceedings of the 2000 ASME Wind Energy Symposium, Reno, NV, USA, 10 January–13 January 2000; p. 32. [Google Scholar]
  18. Chen, J.; Chen, J.; Gong, C. New overall power control strategy for variable-speed fixed-pitch wind turbines within the whole wind velocity range. IEEE Trans. Ind. Electron. 2013, 60, 2652–2660. [Google Scholar] [CrossRef]
  19. Chen, J.; Wen, C.; Song, Y. Power control strategy for variable-speed fixed-pitch wind turbines. In Proceedings of the 2014 13th International Conference on Control Automation Robotics & Vision (ICARCV), Singapore, 10–12 December 2014; pp. 559–564. [Google Scholar]
  20. Kim, K.; Kim, H.-G.; Paek, I. Application and validation of peak shaving to improve performance of a 100 kW wind turbine. Int. J. Precis. Eng. Manuf.-Green Technol. 2020, 7, 411–421. [Google Scholar] [CrossRef]
  21. Jeon, T.; Paek, I. Design and verification of the LQR controller based on fuzzy logic for large wind turbine. Energies 2021, 14, 230. [Google Scholar] [CrossRef]
  22. Jeon, T.; Kim, D.; Paek, I. Improvements to and Experimental Validation of PI Controllers Using a Reference Bias Control Algorithm for Wind Turbines. Energies 2022, 15, 8298. [Google Scholar] [CrossRef]
  23. Fingersh, L.; Johnson, K. Baseline results and future plans for the NREL controls advanced research turbine. In Proceedings of the 42nd AIAA Aerospace Sciences Meeting and Exhibit, Reno, Nevada, 5–8 January 2004; p. 347. [Google Scholar]
  24. Lombard, M. SolidWorks 2013 Bible; John Wiley & Sons: Hoboken, NJ, USA, 2013. [Google Scholar]
  25. Marten, D. QBlade Guidelines v0.95; Technical University of Berlin: Berlin, Germany, 2016. [Google Scholar]
  26. Singh, R.K.; Ahmed, M.R.; Zullah, M.A.; Lee, Y.-H. Design of a low Reynolds number airfoil for small horizontal axis wind turbines. Renew. Energy 2012, 42, 66–76. [Google Scholar] [CrossRef]
  27. Burton, T.; Jenkins, N.; Sharpe, D.; Bossanyi, E. Wind Energy Handbook; John Wiley & Sons: Hoboken, NJ, USA, 2011. [Google Scholar]
  28. Ziegler, J.G.; Nichols, N.B. Optimum settings for automatic controllers. Trans. Am. Soc. Mech. Eng. 1942, 64, 759–765. [Google Scholar] [CrossRef]
  29. Nam, Y. Wind Turbine System Control; GS Intervision: Seoul, Republic of Korea, 2013. [Google Scholar]
  30. Samani, A.E.; Kayedpour, N.; De Kooning, J.D.; Vandevelde, L. Performance and Structural Load Analysis of Small and Medium Wind Turbines Operating with Active Speed Stall Control versus Pitch Control. In Proceedings of the 2019 IEEE 2nd International Conference on Renewable Energy and Power Engineering (REPE), Toronto, ON, Canada, 2–4 November 2019; pp. 241–247. [Google Scholar]
  31. Endo, T.; Mitsunaga, K.; Takahashi, K.; Kobayashi, K.; Matsuisht, M. Damage evaluation of metals for random or varying loading. Proc. Symp. Mech. Behav. Mater. 1974, 1–2, 371–380. [Google Scholar]
  32. DNV. Bladed User Manual Version 4.9; DNV: Bristol, UK, 2018. [Google Scholar]
Figure 1. Photo of 20 kW wind turbine.
Energies 16 02003 g001
Figure 2. (a) Blade models acquired through scanning; (b) sectional segmentation for airfoil extraction; (c) blade airfoil for each section acquired.
Energies 16 02003 g002
Figure 3. Wind turbine blade aerodynamic analysis.
Energies 16 02003 g003
Figure 4. Block diagram of the power control algorithm of variable-speed variable-pitch wind turbine.
Energies 16 02003 g004
Figure 5. Pitch control wind turbine torque, rotational speed diagram.
Energies 16 02003 g005
Figure 6. Block diagram of the power control algorithm of variable-speed fixed-pitch wind turbine.
Energies 16 02003 g006
Figure 7. Stall control wind turbine torque, rotational speed diagram.
Energies 16 02003 g007
Figure 8. Block diagram of power controller for VSFP wind turbine with a gain, k g .
Energies 16 02003 g008
Figure 9. Dynamic simulation results of proposed stall control with a gain, k g .
Energies 16 02003 g009
Figure 10. Output performance of proposed controller with different gains of k g .
Energies 16 02003 g010
Figure 11. Dynamic simulation results of pitch control and stall control: (a) average wind speed of 10 m/s (mostly Region II and II-1/2); (b) average wind speed of 16 m/s (mostly Region III).
Energies 16 02003 g011
Figure 12. Load distribution of pitch control and stall control at an average wind speed of 16 m/s (mostly Region III).
Energies 16 02003 g012
Figure 13. Block diagram of the power controller of the VSFP wind turbine proposed in a previous study.
Energies 16 02003 g013
Figure 14. Dynamic simulation results of proposed stall control (current study) and stall control in a prior study (previous study): (a) average wind speed of 10 m/s (mostly Regions II and II-1/2); (b) average wind speed of 16 m/s (mostly Region III).
Energies 16 02003 g014
Table 1. Specifications of the target wind turbine.
SpecificationsUnitsValues
Number of bladesea3
Rotor diameterm13.8
Hub heightm18.8
Fine pitch angledeg0
Rated rotor speedrpm51.5
Rated powerkW20
Wind speed (cut-in/rated/cut-out)m/s3/10/25
gear ratio.17.6
Table 2. Quantitative comparison of controller performance at an average wind speed of 10 m/s (mostly Region II and II-1/2).
10 m/s (Region II)Performance DataDifference (%)
MeanPitch Control (A)Stall Control (B)(B − A)/A × 100
Turbulence intensity (%)21-
Rotor speed (rpm)51.512450.9726−1.04
Pitch angle (deg)4.84130-
Generator torque (Nm)189.4914195.98293.43
Power (kW)17.99418.3932.22
Table 3. Quantitative comparison of controller performance at an average wind speed of 16 m/s (mostly Region III).
16 m/s (Region III)Performance DataDifference (%)
MeanPitch Control (A)Stall Control (B)(B − A)/A × 100
Turbulence intensity (%)17-
Rotor speed (rpm)51.541847.3383−8.16
Pitch angle (deg)23.35370-
Generator torque (Nm)210.5767229.32948.91
Power (kW)20.00320.0070.01
Table 4. Quantitative comparison of load according to controller at rated wind speed (Region II).
10 m/s
(Region II)
Blade Mx ML (Nm)Blade My ML (Nm)Tower Mx ML (Nm)Tower My ML (Nm)Blade Mx DEL (Nm)Blade My DEL (Nm)Tower Mx DEL (Nm)Tower My DEL (Nm)
Pitch (A)930.3842468.663404.0438,647.77555.944241.8522,40741,267.2
Stall (B)1107.892966.793412.5144,4387712.743102.7814,364.436,219.7
(B − A)/A × 10019.0787920.178150.24882214.982262.075189−26.8531−35.8932−12.2313
Table 5. Quantitative comparison of load according to controller at above rated wind speed (Region III).
16 m/s
(Region III)
Blade Mx ML (Nm)Blade My ML (Nm)Tower Mx ML (Nm)Tower My ML (Nm)Blade Mx DEL (Nm)Blade My DEL (Nm)Tower Mx DEL (Nm)Tower My DEL (Nm)
Pitch (A)865.5781050.473624.5333962.46903.186059.2255,228.980,337.4
Stall (B)1271.593598.614057.3564,751.27921.063642.3922,407.972,613.2
(B − A)/A × 10046.90646242.571411.9414190.6555514.74509−39.8868−59.4272−9.6147
Table 6. Quantitative comparison of controller performance at an average wind speed of 10 m/s with a turbulence intensity of 21% (mostly Regions II and II-1/2).
Performance DataDifference (%)
MeanPrevious study (A)Current study (B)(B − A)/A × 100
Rotor speed (rpm)50.985850.9727−0.025
Generator torque (Nm)195.902195.97950.039
Power (kW)18.388618.3930.023
StdPrevious study (A)Current study (B)(B − A)/A × 100
Rotor speed0.6727880.6932183.036
Generator torque41.337940.0924−3.012
Power3.793543.68393−2.889
Table 7. Quantitative comparison of controller performance at an average wind speed of 16 m/s with a turbulent intensity of 17% (mostly Region III).
Performance DataDifference (%)
MeanPrevious study (A)Current study (B)(B − A)/A × 100
Rotor speed (rpm)47.347747.3328−0.031
Generator torque (Nm)229.323229.330.003
Power (kW)20.00920.0073−0.008
StdPrevious study (A)Current study (B)(B − A)/A × 100
Rotor speed0.4379040.4494372.633
Generator torque21.874116.6104−24.063
Power1.888021.44054−23.701
Disclaimer/Publisher’s Note: The statements, opinions and data contained in all publications are solely those of the individual author(s) and contributor(s) and not of MDPI and/or the editor(s). MDPI and/or the editor(s) disclaim responsibility for any injury to people or property resulting from any ideas, methods, instructions or products referred to in the content.

