Article

A Study on the Improved Power Control Algorithm for a 100 kW Wind Turbine

1
Department of Integrated Energy and Infra System, Kangwon National University, Chuncheon-si 24341, Gangwon, Republic of Korea
2
Department of Mechatronics Engineering, Kangwon National University, Chuncheon-si 24341, Gangwon, Republic of Korea
3
Department of Electrical Engineering, Faculty of Engineering, Rajamangala University of Technology Thanyaburi, Pathum Thani 12110, Thailand
4
Department of Electronics and Communication Engineering, National University of Mongolia, Ulaanbaatar 14200, Mongolia
*
Author to whom correspondence should be addressed.
Energies 2023, 16(2), 619; https://doi.org/10.3390/en16020619
Submission received: 18 November 2022 / Revised: 29 December 2022 / Accepted: 30 December 2022 / Published: 4 January 2023
(This article belongs to the Special Issue Wind Energy Technologies Development)

Abstract

:
In this study, a power compensation control algorithm was designed and validated for commercial 100 kW medium wind turbine models for power compensation due to additional generator loss. Generally, torque control considering generator efficiency is applied to a controller of a medium wind turbine; however, a control corresponding to a decrease in generator efficiency due to the surrounding environment is not possible. There is a possibility that an additional generator loss may occur due to the surrounding environment of the wind turbine already installed, and accordingly, a power compensation control algorithm is required because power is expected to decrease. The power compensation control algorithms may be divided into three methods according to a control strategy, and three power compensation control algorithms were explained and designed. The proposed power compensation control algorithms were validated using DNV’s Bladed program. The simulation conditions were selected at an average wind speed of about 18 m/s and normal turbulence model (NTM) Class A, and the additional generator loss was assumed to be 15%. The simulation comparison showed that the original power control algorithm had a deviation of 15.00% from the rated power due to a 15% generator loss, and the designed three power compensation control algorithms had a deviation of up to 0.05%.

1. Introduction

The cumulative installation capacity of wind turbines is constantly increasing and reached about 837 GW at the end of 2021 [1]. As the cumulative installation capacity of the wind farm increases, the unit capacity of the installed wind turbine increases, and research is continuously being conducted to improve the operating performance of the wind turbine along with the increase in the capacity of the wind turbine. The wind turbine control algorithm is one of the factors directly related to the operation performance of the wind turbine and can be largely divided into a supervisory control algorithm and a control algorithm in a normal operation state. The wind turbine control algorithm in normal operation can be divided into a basic power control algorithm to maximize power efficiency according to the wind speed change, maintaining the rated power, and the load reduction control to reduce the load generated during the wind turbine operation.
The basic power control algorithm of the wind turbine includes generator torque control and blade pitch control and is carried out with different strategies in variable wind speed, including Regions 2, 2-1/2, and 3 [2,3]. Torque control is performed in Region 2 and is used as a strategy to maximize the power of the wind turbine based on the maximum power point tracking (MPPT) algorithm. Pitch control is performed in Region 3 and is used as a strategy to maintain the rated power by maintaining the generator speed using a pitch [2,3,4]. The load reduction control is designed by applying an additional control loop to the basic power control algorithm to reduce the magnitude of the load in the wind turbine, and the load reduction control includes peak shaving, tower damper, drivetrain damper, individual pitch control, feedforward, etc. [5,6,7,8,9,10,11,12,13].
The wind turbine control algorithm described above is generally applied to large MW-class wind turbines but is also recently applied to medium wind turbines. Medium wind turbines have similar shapes and functions to large MW-class wind turbines and have been continuously developed for micro-grids or independent power plants [14,15,16,17,18]. Medium wind turbines are divided either into a model that can perform power control with a stall control method using fixed blades or a model that can perform power control with an active pitch control method using blade pitching. Medium wind turbines capable of blade pitching have a similar mechanism to MW-class large wind turbines, and an applied power control algorithm is also designed to have a similar structure. In an empirical case of a commercially available medium wind turbine, controller upload and performance validation were performed through the linkage between a commercial programmable logic controller (PLC) and a medium wind turbine [5,19,20].
Medium wind turbines can be used to build a micro-grid for special facilities such as mine and fish farm in areas with a weak power system [14]. In the case of medium wind turbines, transportation is relatively convenient compared to MW-class large wind turbines, so it has the advantage of being easy to build for areas where transportation facilities are old. However, medium wind turbines have the disadvantage of a weak cooling system due to the size of the small nacelle, and the loss of wind turbines may increase due to various causes, such as climate, environment, or nacelle temperature increases [21,22,23]. In particular, when the installed area is a tropical area, the medium wind turbine may experience a decrease in power due to a decrease in the generator efficiency and an increase in temperature.
Since the wind turbine’s basic power control algorithm is designed based on the performance and specifications of the manufactured wind turbine generator, it cannot compensate for power due to the reduced generator efficiency according to environmental changes. In this case, the torque schedule prepared for torque control is applied to the generator efficiency of the wind turbine, and the experimental value obtained through the generator test is used. As a result, since the basic power control algorithm of the wind turbine is difficult to respond to the changed generator efficiency, the power decreases if the generator efficiency decreases due to external factors. This is generally caused by two reasons applied in the design phase of the basic power control algorithm. The first reason is that the torque schedule for torque control described above is prepared in consideration of the known generator efficiency. Second, the proportional integral (PI) control algorithm for pitch control is designed to perform control using the error value of the generator speed and the rated generator speed. This means that control is performed to maintain the rated generator speed regardless of the power decrease caused by the generator efficiency decrease. Research related to the wind turbine power control algorithm was introduced with the results [24,25,26].
Vidal et al. analyzed and designed the original pitch PI control algorithm of wind turbines. Simulations were performed in a variable wind speed environment. The pitch PI control algorithm was used to maintain the rated generator speed in the wind speed that is higher than the rated speed, and the error between the rated and the measured generator speeds was used as a control input parameter. The simulation results showed that it is possible to maintain the rated power in the wind speed that is higher than the rated speed, but no quantitative result of the performance was presented [24]. Hawari et al. proposed a robust tuning method for full-load pitch control by deriving a new design formula for the PI pitch controller of wind turbines. This research uses the error between the rated and the measured generator speeds as a control input parameter similar to the original pitch PI control, but this has a difference in the gain tuning method. The gain tuning method using the collective flap mode and the low pass filter was applied. The proposed control was found to reduce standard deviation of the power by 63% compared with the original control due to the improved pitch response rate [25]. Ren et al. proposed a PI pitch control algorithm that estimates uncertain nonlinearity and external disturbances based on the two mass nonlinear wind turbine model. The proposed control algorithm reduces the standard deviation of the rotor speed due to the improved response rate and decreases by up to 30% compared to the original PI pitch control algorithm. This had a significant effect on reducing the standard deviation of power and rotor speed [26].
The PI pitch control algorithm in the literature was able to reduce the standard deviation of the power and rotor speed. However, research on the control algorithm for power compensation could not be confirmed in relation to additional generator loss. Therefore, in this paper, a power compensation control algorithm for the wind speed that is higher than the rated wind speed was designed and applied to compensate for the loss of power generation due to a decrease in generator efficiency after installing a medium wind turbine. The power compensation control algorithm was designed by dividing it into three strategies. The first strategy was a pitch PI control algorithm using power feedback, and the second strategy involved applying both the pitch PI control algorithm and the torque compensation control algorithm using power feedback. The final strategy aimed to apply both the pitch PI control algorithm and the torque compensation control algorithm using generator speed feedback. The performance validation of the control algorithm was performed on the Wind Rose 100 kW model, and simulation was performed using Bladed. The performances of the original power control algorithm and three power compensation control algorithms of the target wind turbine were compared using simulation results, and the power compensation control algorithm with the best performance was selected based on the analysis results.
The rest of the article consists of the following. Section 2 presents the target wind turbine model and the control algorithm proposed in this study. Section 3 presents simulation results for performance validation. The simulation results due to variable generator loss are shown in Section 4. Finally, the article concludes in Section 5.

2. Design of Power Compensation Control Algorithm

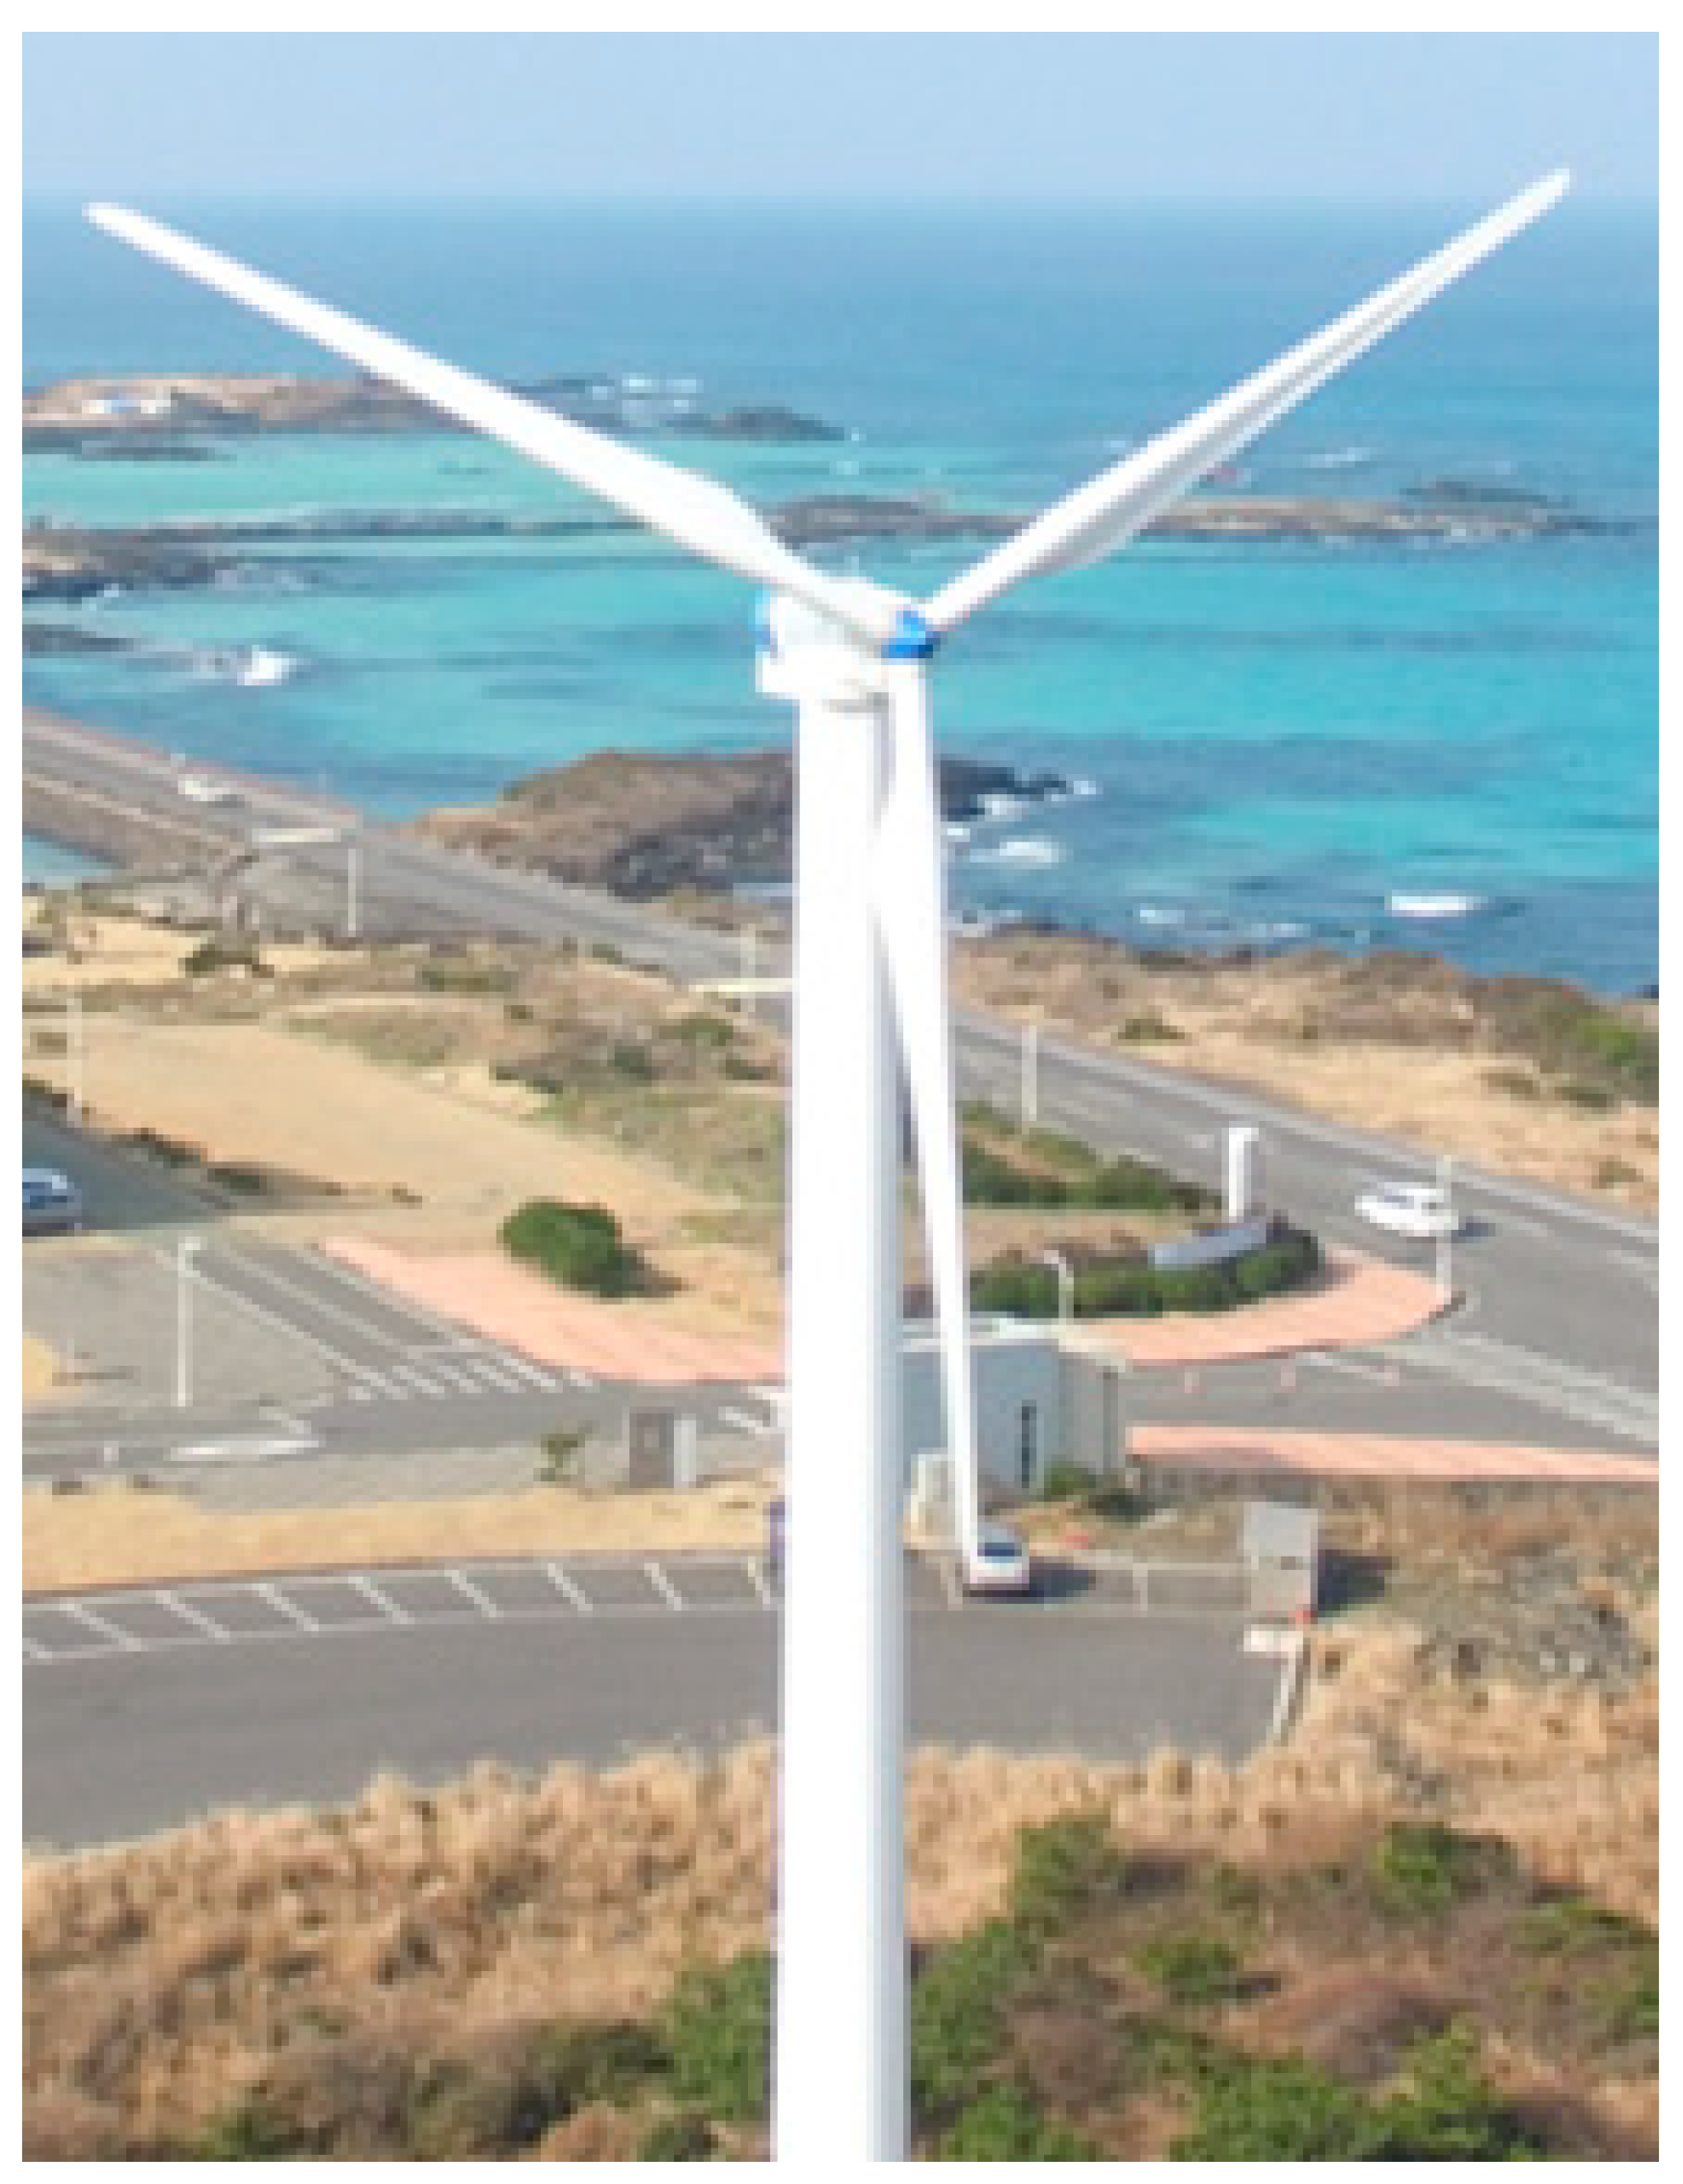
2.1. Target Wind Turbine (Wind Rose 100 kW)

The target wind turbine of this study was selected as a Wind Rose 100 kW model designed for commercial use. The target wind turbine was modeled using a commercial program to validate the simulation of the power compensation control algorithm. The target wind turbine, medium horizontal-axis lift-type wind turbine with a rated power of 100 kW, was designed and developed by Seoltech, a Korean company. In addition, the target wind turbine completed on-site validation in Korea, and performance improvement is currently underway in consideration of the environment of countries in low-wind and tropical climates such as Thailand. The target wind turbine had three blades, and a pitch system was applied to enable pitch control. The target wind turbine had a hub height of 36 m and a rotor diameter of 24.4 m. In addition, the rated speed was 50 rpm, and the maximum power factor was about 0.45, in a tip speed ratio of 7.3. Figure 1 shows the shape of the target wind turbine, and Table 1 shows the brief specifications.

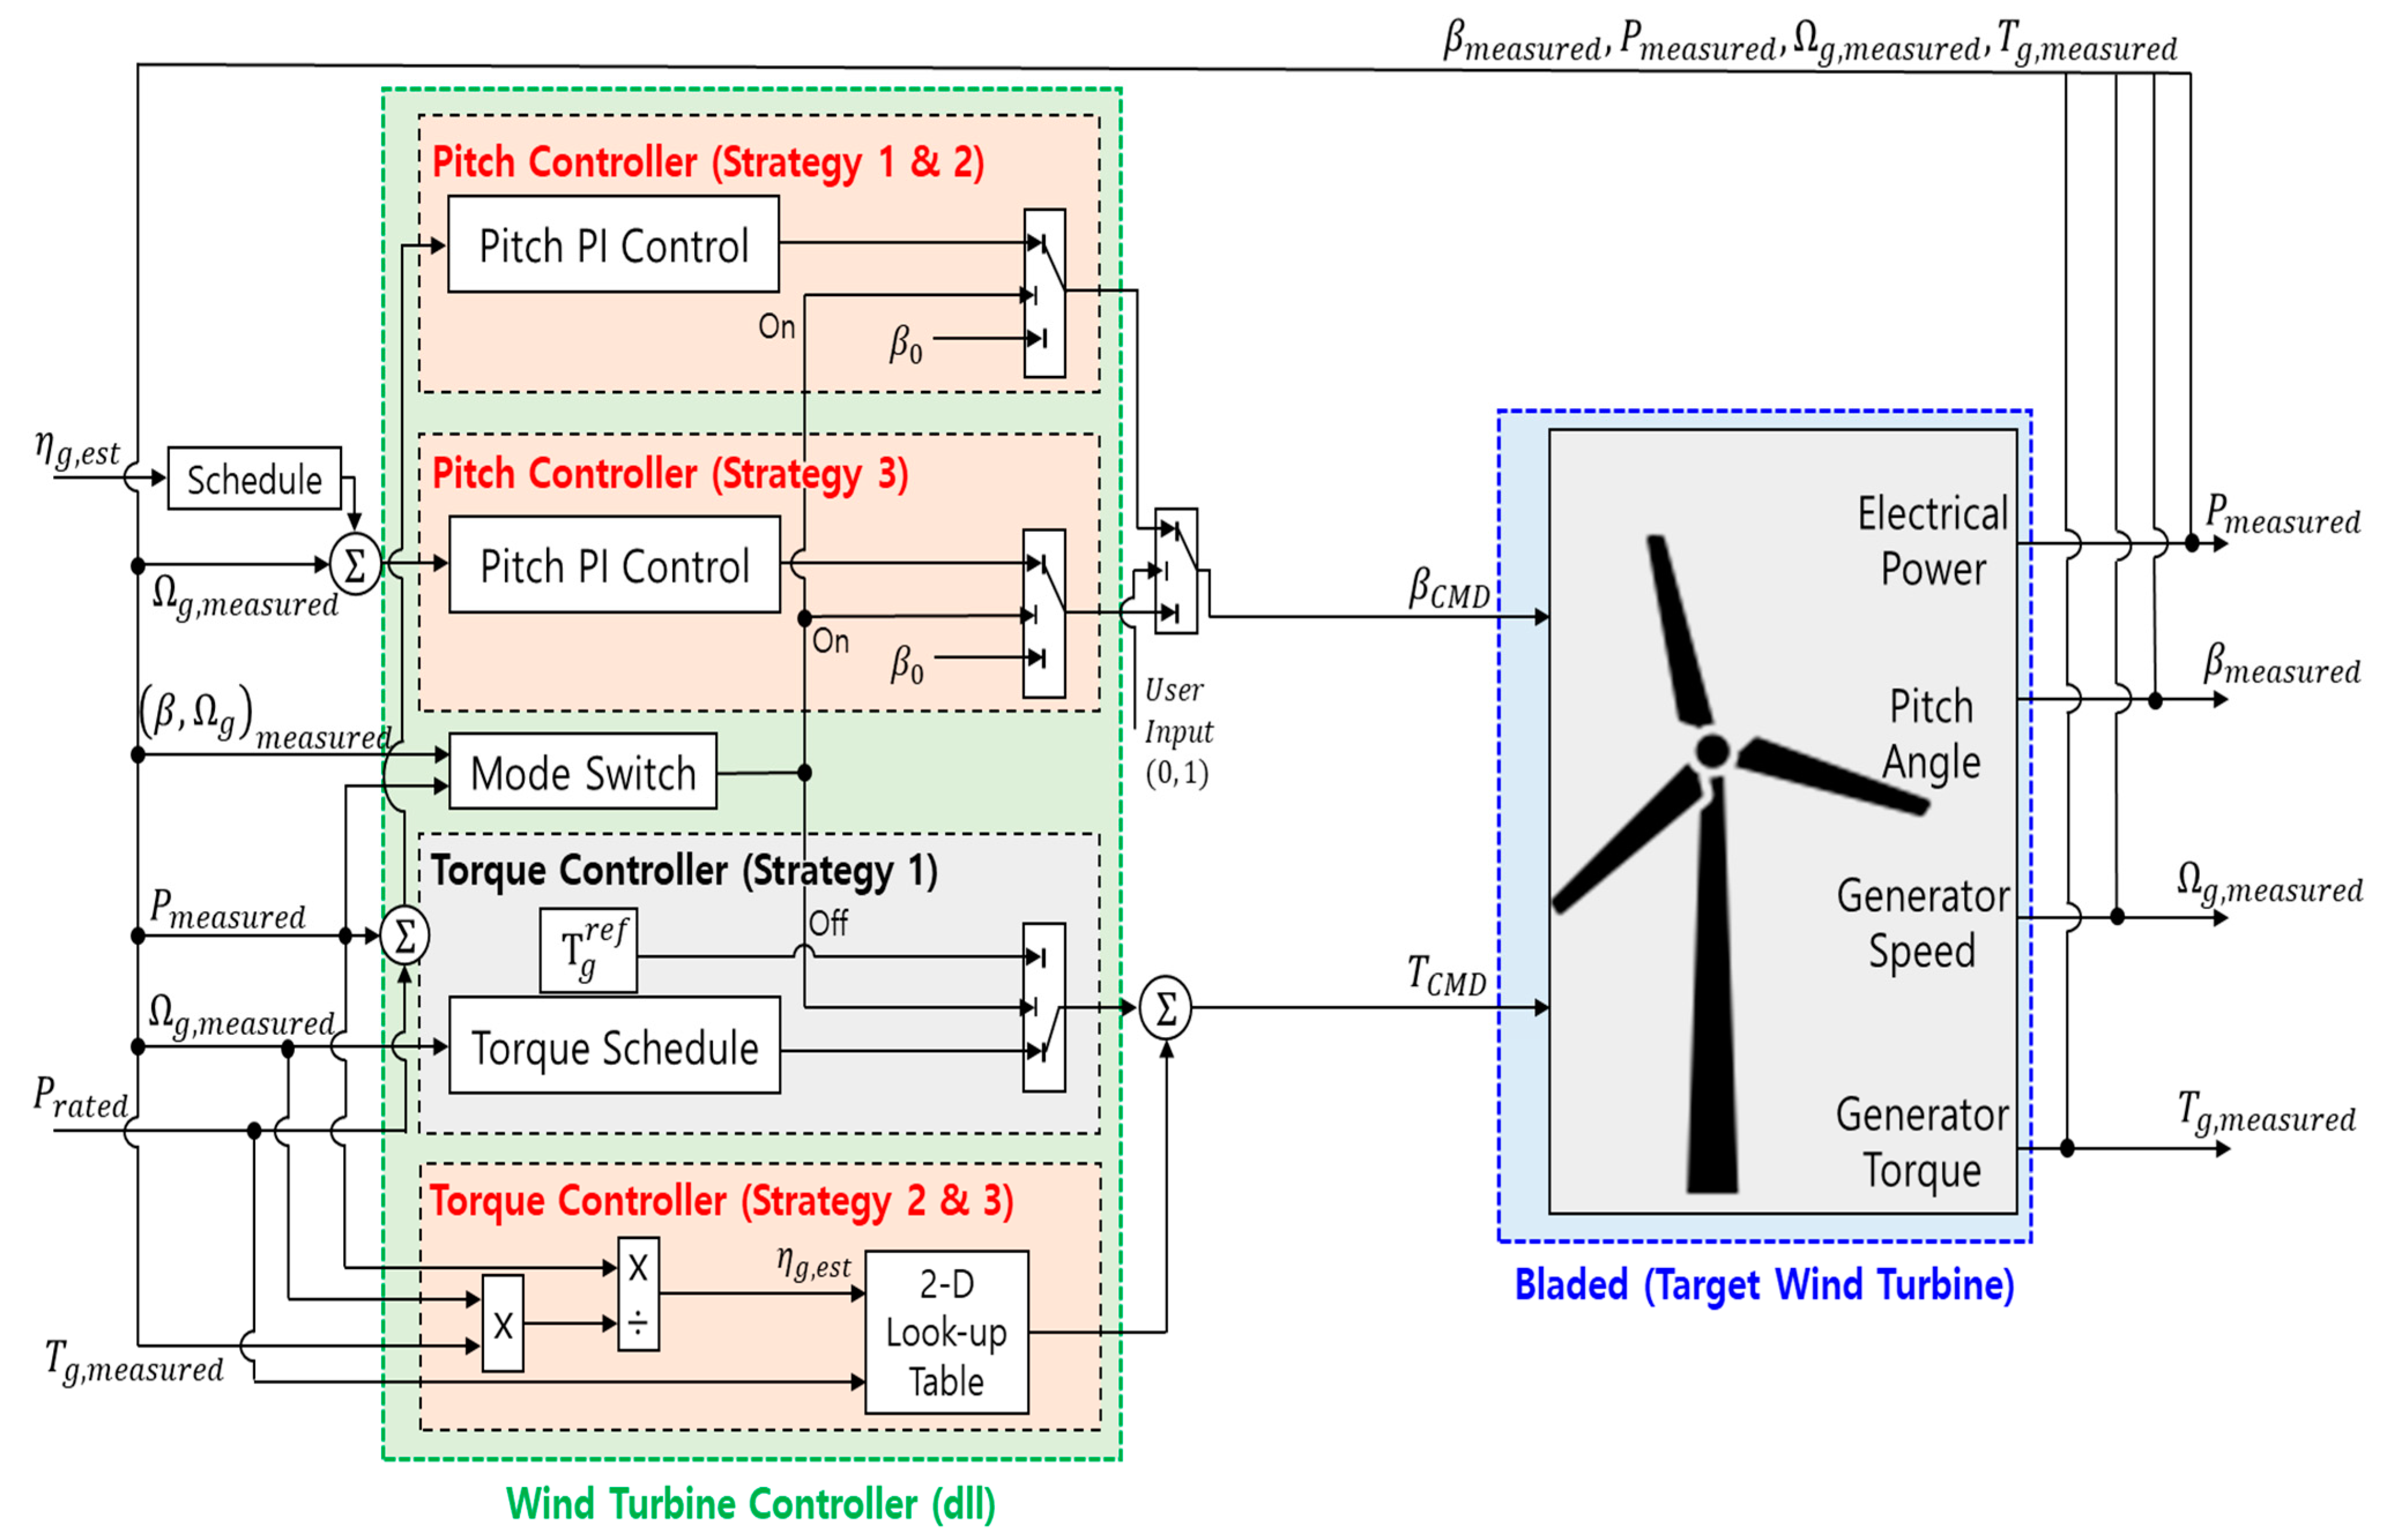
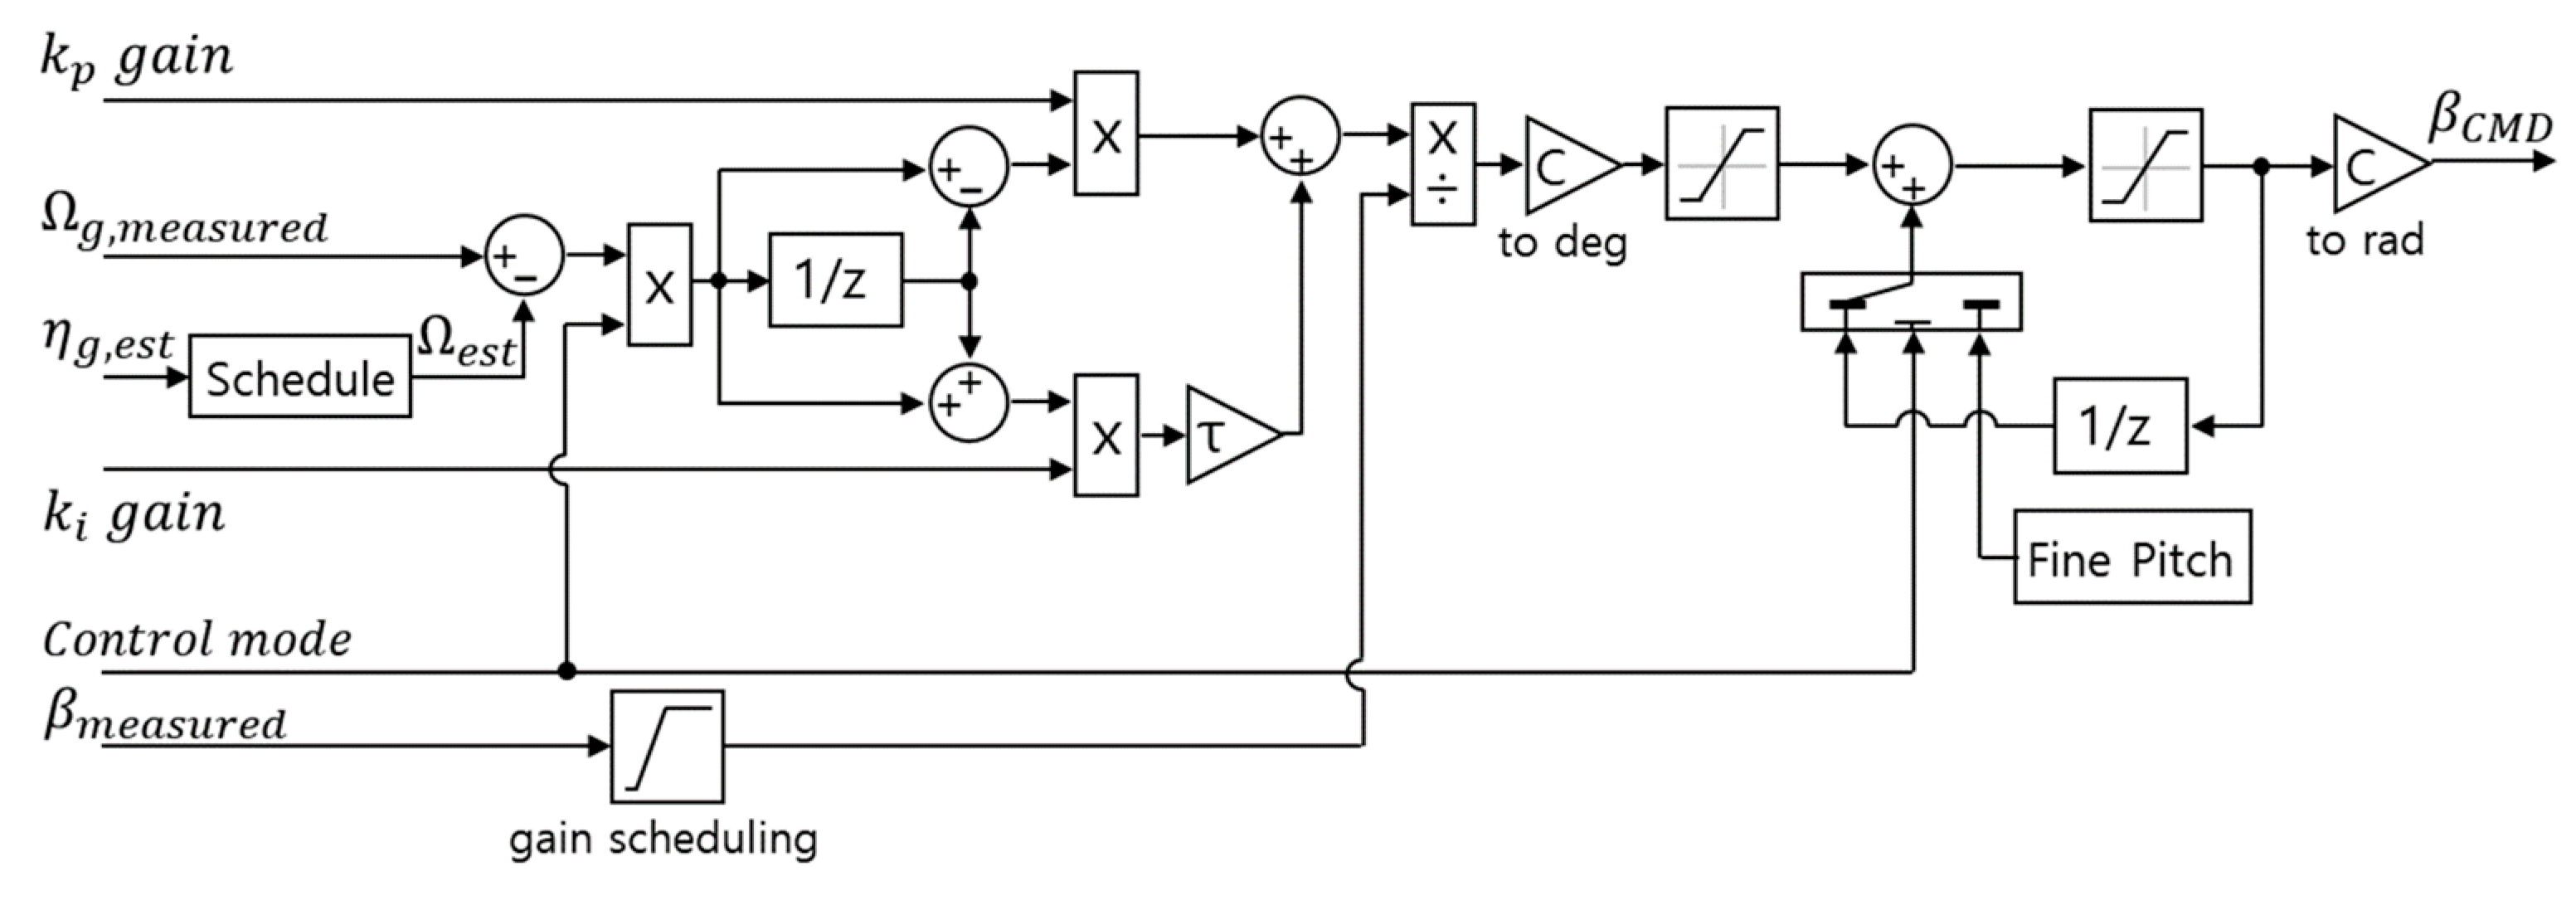
2.2. Control Algorithm

The three control algorithms proposed to compensate for the power of the wind turbine were designed for the Wind Rose 100 kW model. For power compensation, the power feedback PI control algorithm and the estimated generator speed PI control algorithm were applied to replace the original pitch control. In addition, the torque control for torque compensation was designed. Figure 2 shows a schematic diagram of the overall control algorithm used for performance validation in this study. The area marked with red shading is the control algorithm designed in this study and the area marked with gray shading is an original algorithm. The control algorithm converted to a dynamic linking library (DLL)-type external controller for DNV’s Bladed program simulation validation is shown in green. The description related to the design of the control algorithm is described in the later chapter.

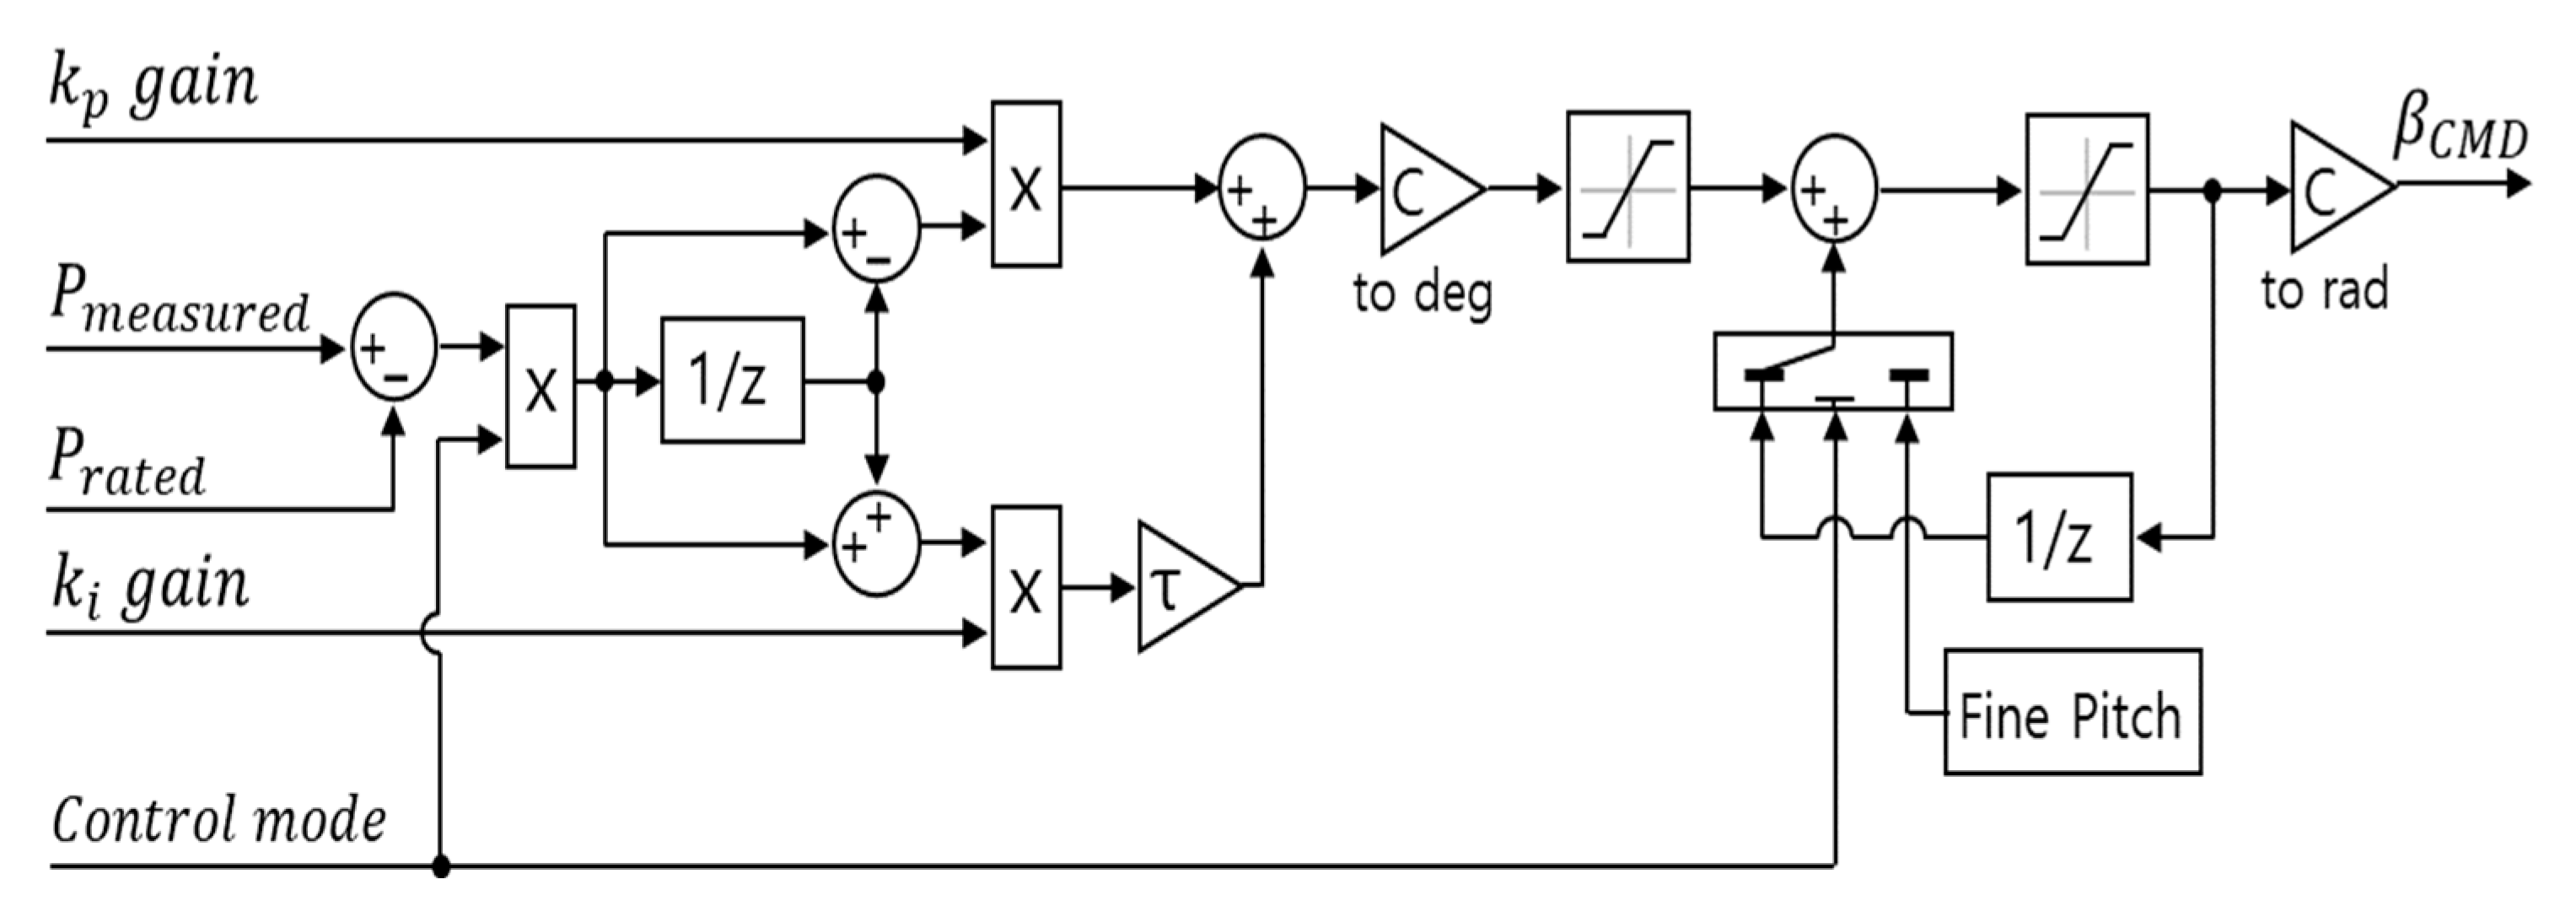
2.3. Strategy 1—Power Feedback PI Control Algorithm (Pitch Control)

Generally, the pitch PI control of the wind turbine is used to maintain the rated power even if the wind speed exceeds the rated wind speed. The pitch control calculates a pitch angle command according to the generator speed, thereby maintaining the generator speed and performing power control. Equation (1) shows the transfer function of the PI control, and the PI control algorithm may be described as Equation (2) according to the control output.
k ( s ) = k p ,   g a i n + k i ,   g a i n s
u ( t ) = k p ,   g a i n e ( t ) + k i ,   g a i n   e ( t ) d t  
As shown in Equation (3), the Ω g ,   e r r o r calculated using the rated generator speed and the measured generator speed is used as a control input parameter. However, the pitch control based on the generator speed maintains the rated speed regardless of any decrease in the generator efficiency and is disadvantageous in the sense that it cannot compensate for loss due to the decrease in the generator efficiency. This study was conducted to compensate for the disadvantages of pitch control based on the generator speed. The pitch control based on the power feedback performs the PI control using an error in the measured power and rated power and performs the power control to maintain the rated power. As shown in Equation (4), the power error calculated using the rated power and the measured power is used as a control parameter. Since the pitch control based on the power feedback is performed based on the measured power, the control is performed to maintain the rated power; even if the generator efficiency decreases for other reasons, it controls the rated power.
  Ω g ,   e r r o r = Ω g ,   m e a s u r e d Ω g ,   r a t e d  
  P   e r r o r = P m e a s u r e d P r a t e d
For example, generator efficiency may be reduced due to an increase in generator temperature. Although it is not possible to quantitatively identify the decrease in generator efficiency according to the operating temperature of the generator, it was confirmed through the generator performance test that the operating temperature gradually increased. After being installed in the area to be demonstrated in the future, it is expected that it will be possible to accurately grasp the trend of decreasing generator efficiency according to the operating temperature of the generator. In this study, a study on the design of a power compensation control algorithm capable of responding to changes in generator efficiency was conducted in advance. Figure 3 shows a schematic diagram of the structure of the power feedback PI control algorithm.
The power feedback PI control increases the operating range of the rotor speed to compensate for the generator loss. This is because the driving performance changes as the pitch command sends out a command value relatively smaller than that of the general pitch control. The rated torque value is applied to the generator torque command and has a constant value. The power of the wind turbine has a relationship as shown in Equation (5). P E l c is the amount of power generated in consideration of the wind turbine loss, T g is the generator torque, Ω g is the generator speed, and η g is the generator loss. Losses may vary due to climate or environmental factors in the area where the wind turbines are installed. In Equation (5), if the generator loss is reduced and the generator torque is maintained at a rated generator torque, P E l c is required to increase Ω g due to the generator loss to be maintained at a rated power. Therefore, the power feedback PI control is required to be designed in consideration of the allowable generator speed.
P E l c = T g   Ω g   η g
Without considering the allowable generator speed, the proposed algorithm can excessively increase the generator speed for power compensation due to reduced generator efficiency. The maximum generator speed of the Wind Rose 100 kW model is 56 rpm, which means that the operating range that can be increased for power compensation ranges from 50 to 56 rpm.

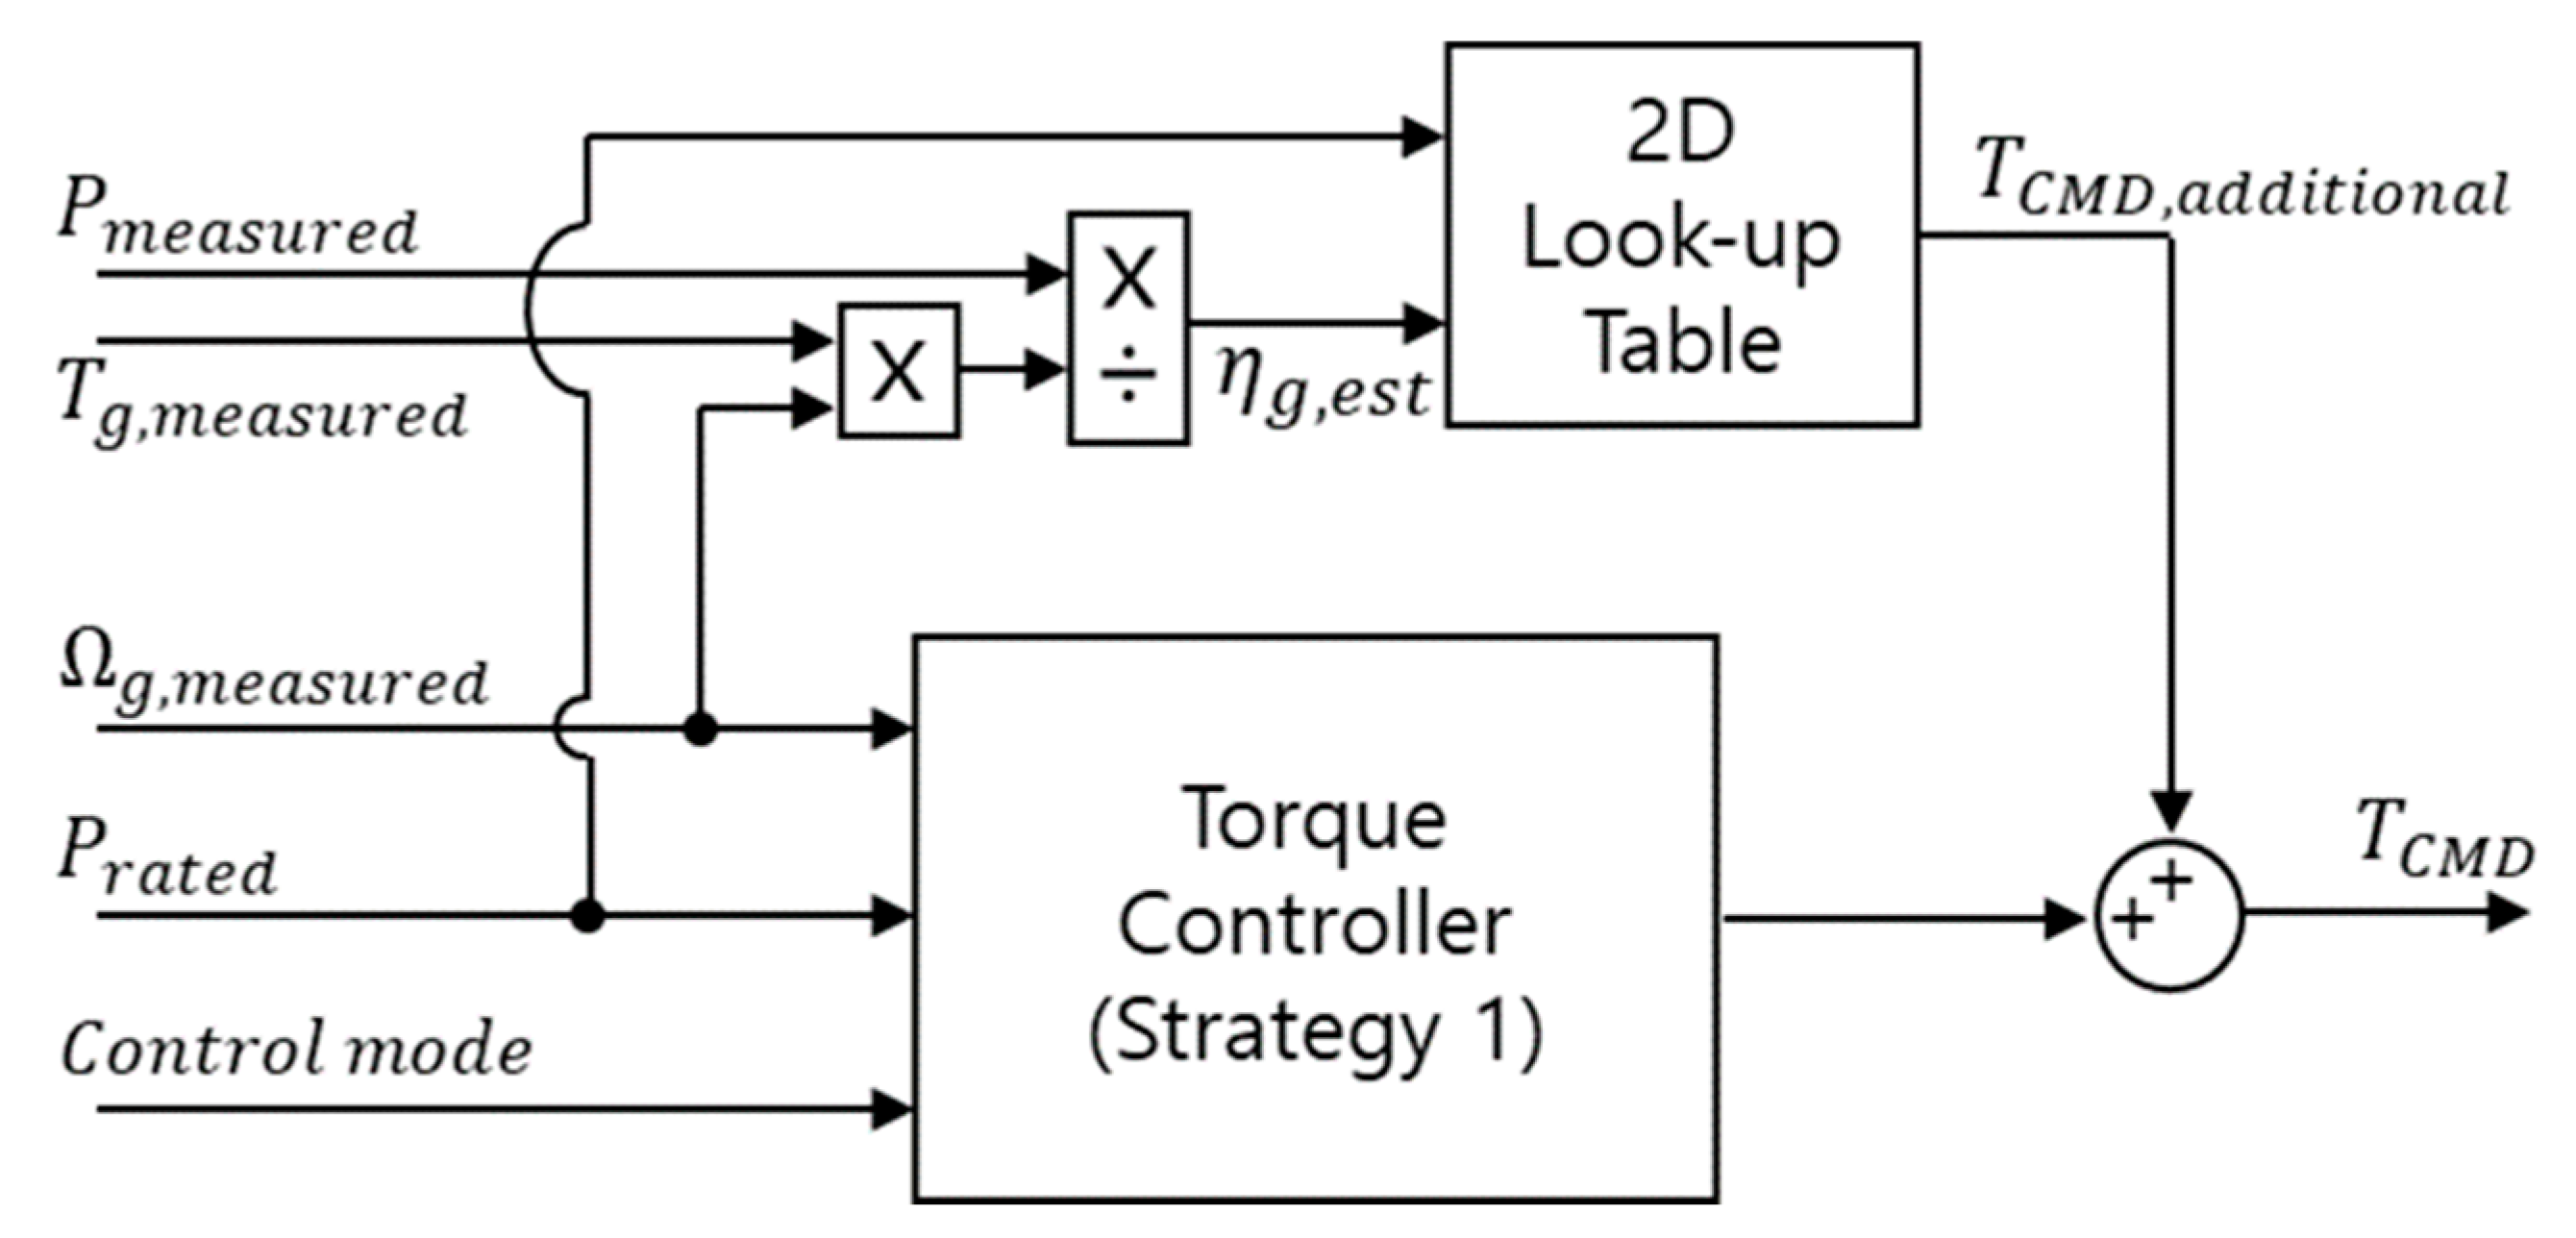
2.4. Strategy 2—Power Feedback Torque Compensation Algorithm (Torque Control)

By applying the power feedback PI control algorithm, operating in an area where the generator speed is higher than the rated speed may cause a decrease in stability in terms of the wind turbine operation situation. Therefore, there is a need for a control algorithm to prevent an excessive increase in the generator speed. The torque compensation control algorithm predicts the generator efficiency of the wind turbine and implements power compensation by calculating additional torque commands based on the predicted generator efficiency. The torque command calculated for power compensation is added to the original torque command as shown in Equation 6, and then sent to the final torque command. Figure 4 shows the structure of the power feedback torque compensation control algorithm.
T C M D = T C M D ,   o r i g i n a l + T C M D ,   a d d i t i o n a l
The generator efficiency is estimated using Equation (7), which is modified based on Equation (5). The current generator efficiency of the wind turbine may be estimated by dividing the value of the generator torque command and the generator speed product by the measured power. The estimated generator efficiency is used as one of the input values of the two-dimensional look-up table for the calculation of additional torque commands and can be designed in consideration of the maximum generator torque and generator specifications of the target wind turbine. In addition, the other input values used the rated power. A two-dimensional look-up table is required to consider the available power for the additional torque command calculation according to the changed wind speed.
η g ,   e s t = P m e a s u r e d / T g ,   m e a s u r e d   Ω g ,   m e a s u r e d   ,
The maximum generator torque of the Wind Rose 100 kW model is 25.59 kNm, and the generator torque compensation value considering the maximum generator torque is built in a table. The power compensation control using torque compensation is designed to preferentially perform torque control until the measured generator torque reaches the maximum generator torque value, and then perform power compensation control using pitch control.

2.5. Strategy 3—Estimated Generator Speed PI Control Algorithm (Pitch Control)

The PI control using the estimated generator speed has a similar structure to the original pitch control algorithm but has a difference in the error value calculation parameters used as a control input. As explained above, the original pitch control algorithm performs the PI control using the error between the measured generator speed and the rated generator speed. The rated generator speed is the generator speed at which the target wind turbine generates the rated power; the value is 50 rpm. However, the estimated generator speed PI control is performed using the error between the measured generator speed and the estimated generator speed. The estimated generator speed means the generator speed required for power compensation and can be estimated using the estimated generator efficiency. The value is calculated differently depending on the generator loss that has occurred, and if the generator loss is 15%, the predicted generator speed value is 51 rpm. A one-dimensional look-up table is built to estimate the generator speed, and the estimated generator efficiency is used as an input value. Figure 5 shows the structure of the estimated generator speed PI control algorithm.

3. Validation of Control Algorithm

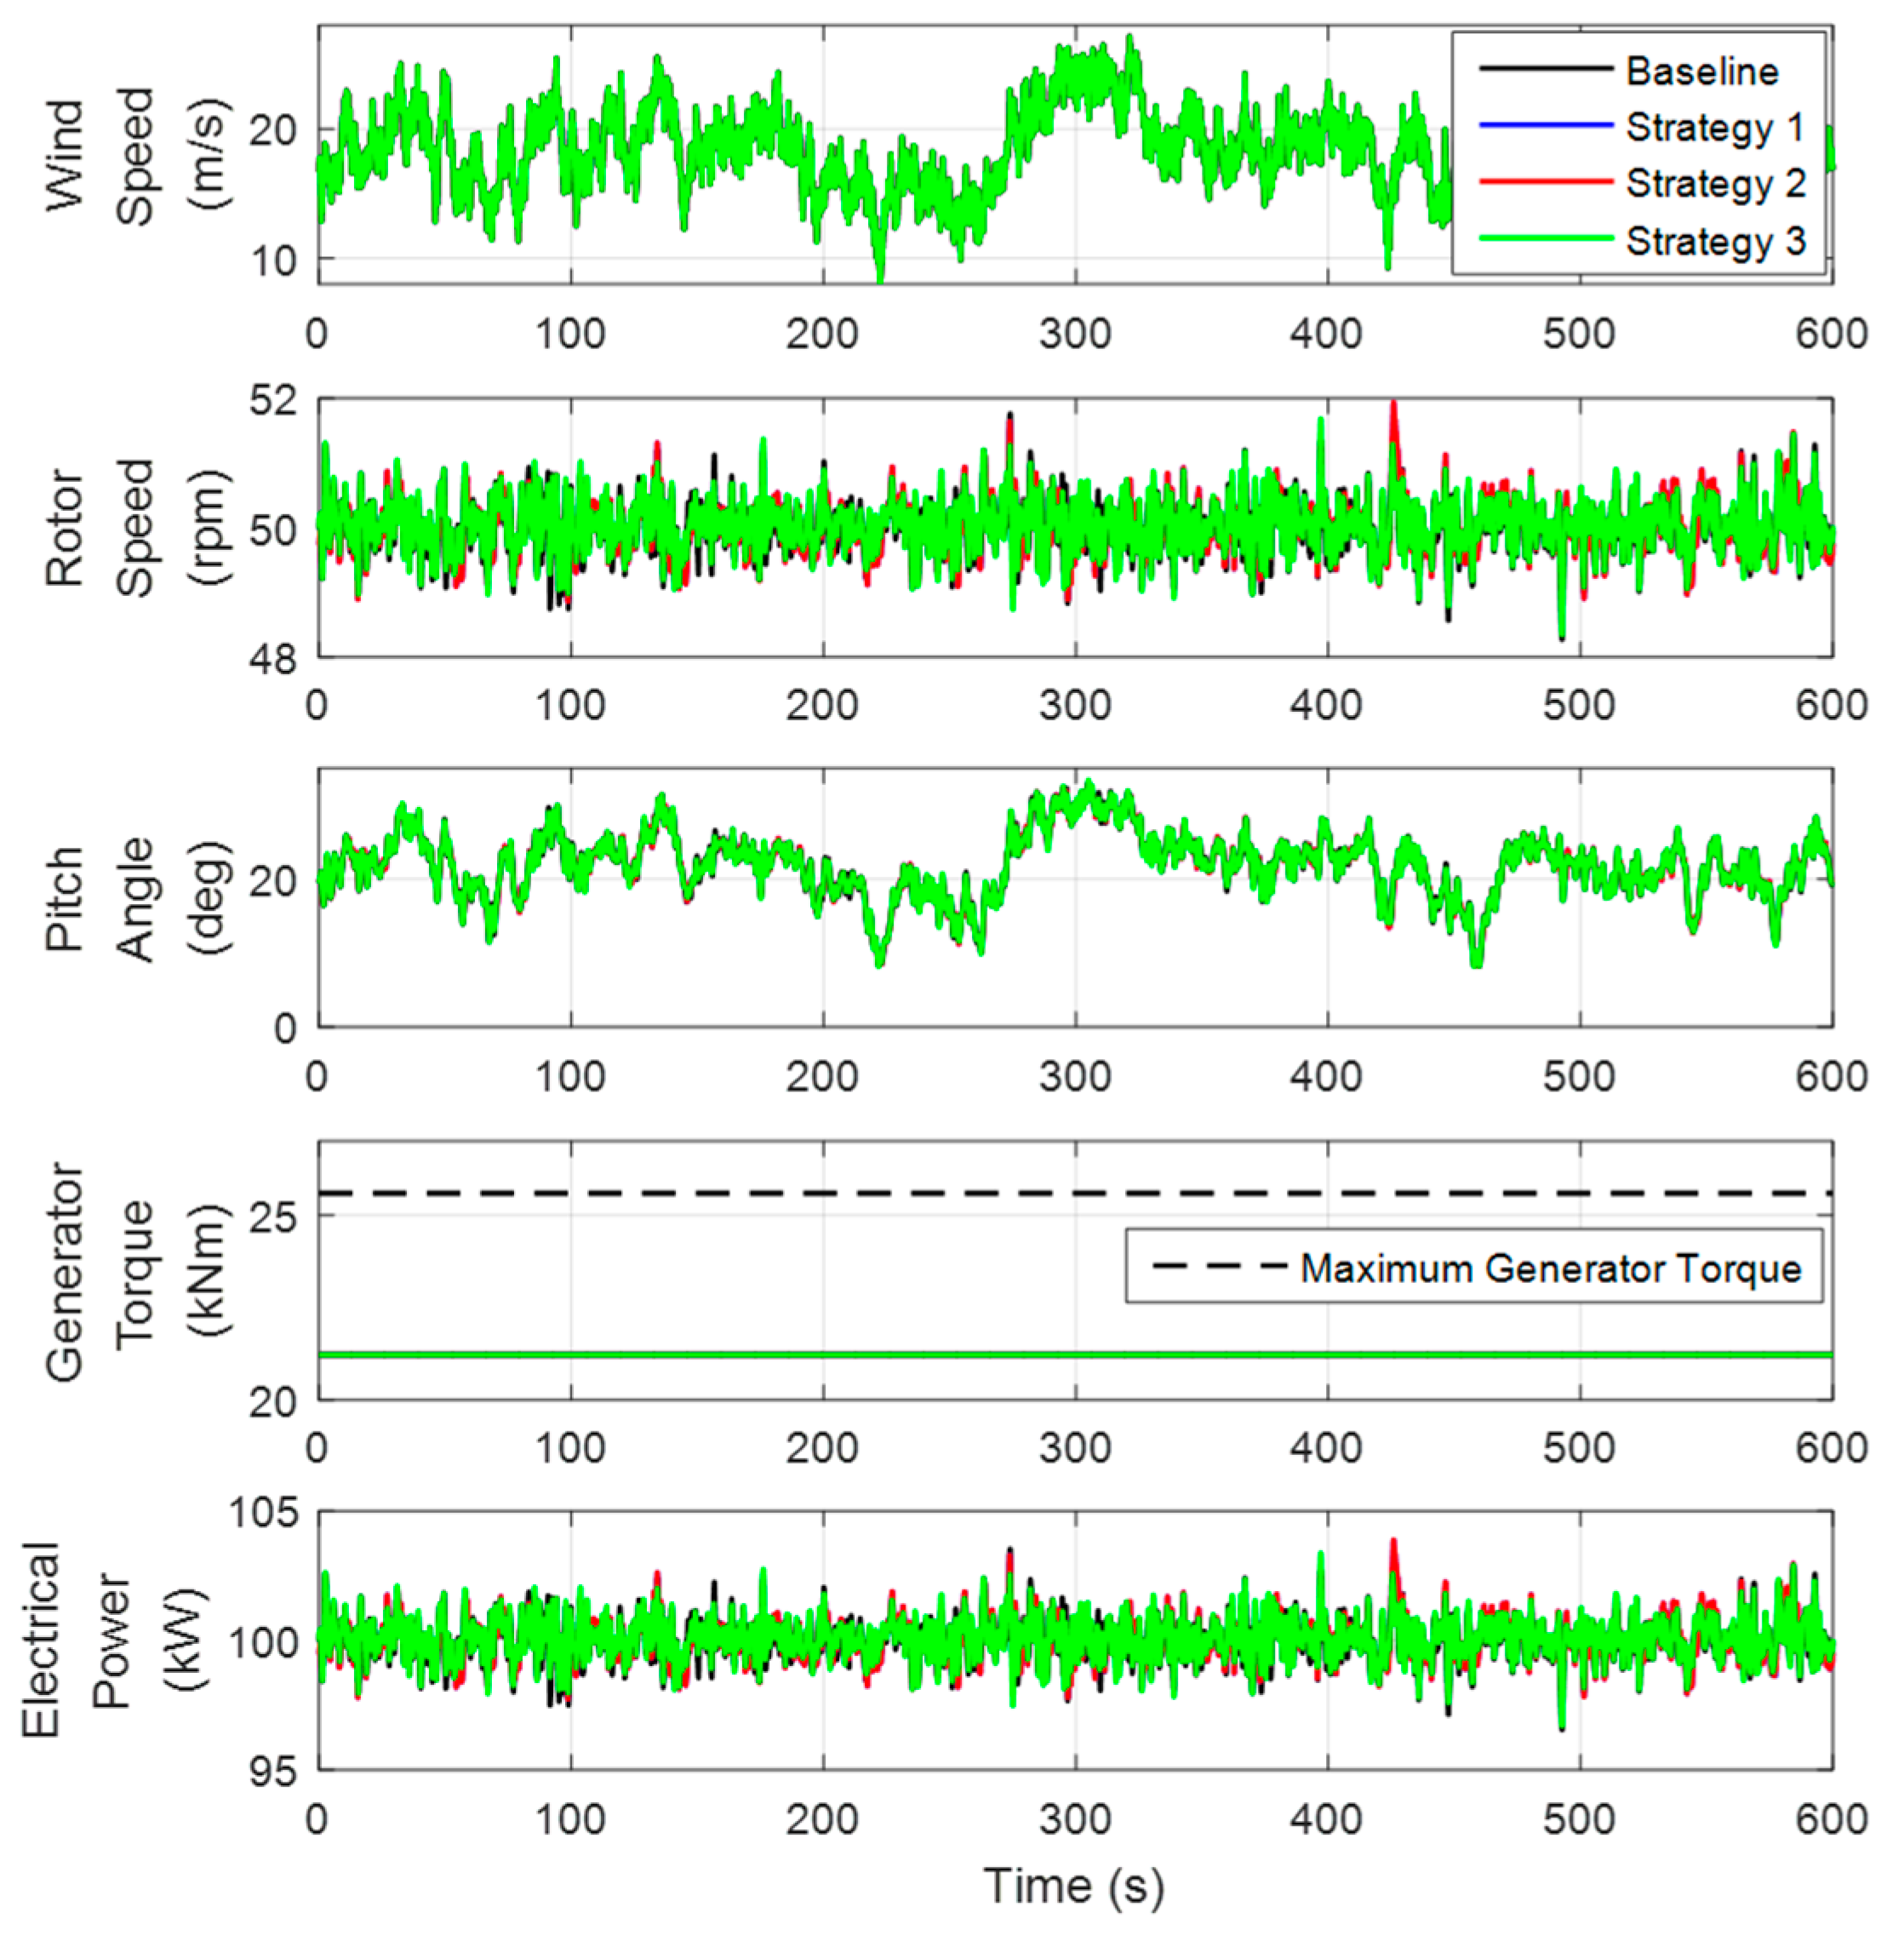
3.1. Simulation Results for Normal Condition (without Additional Generator Loss)

The simulation program used in this study is DNV’s Bladed program. The target wind turbine was modeled using the Bladed program. Moreover, the original power control algorithm of the target wind turbine and the three proposed power compensation control algorithms were designed using Matlab/Simulink (R2015b) and were finally completed in DLL format. The DLL-type external controller was applied to the dynamic simulation in conjunction with the aeroelastic analysis program DNV’s Bladed program to validate control performance. Dynamic simulations were performed using the Wind Rose 100 kW model selected as the target wind turbine. The simulation conditions were applied with an average wind speed of 18 m/s and a turbulence intensity NTM Class A and were performed for 600 s in a dynamic simulation environment where each condition was applied.
It was assumed that there was no additional generator loss, and 0% of the additional generator loss was applied. Figure 6 shows the rotor speed, pitch angle, generator torque, and power values according to the simulation results to which the basic power control algorithm and three power compensation control algorithms were applied. It was confirmed that the four control algorithms have similar power performance.
The power performance was similar, but Strategies 1 and 2 confirmed the effect of decreasing the standard deviation of the power and the standard deviation of the generator speed compared to the basic power control algorithm. In the case of Strategy 1, the power standard deviation and the generator speed standard deviation increased by 0.52%, respectively, and in the case of Strategy 2, the power standard deviation increased by 0.65%. For Strategy 3, no difference in the basic power control algorithm was found, and Table 2 and Table 3 show the comparison of the quantitative values of the simulation results.

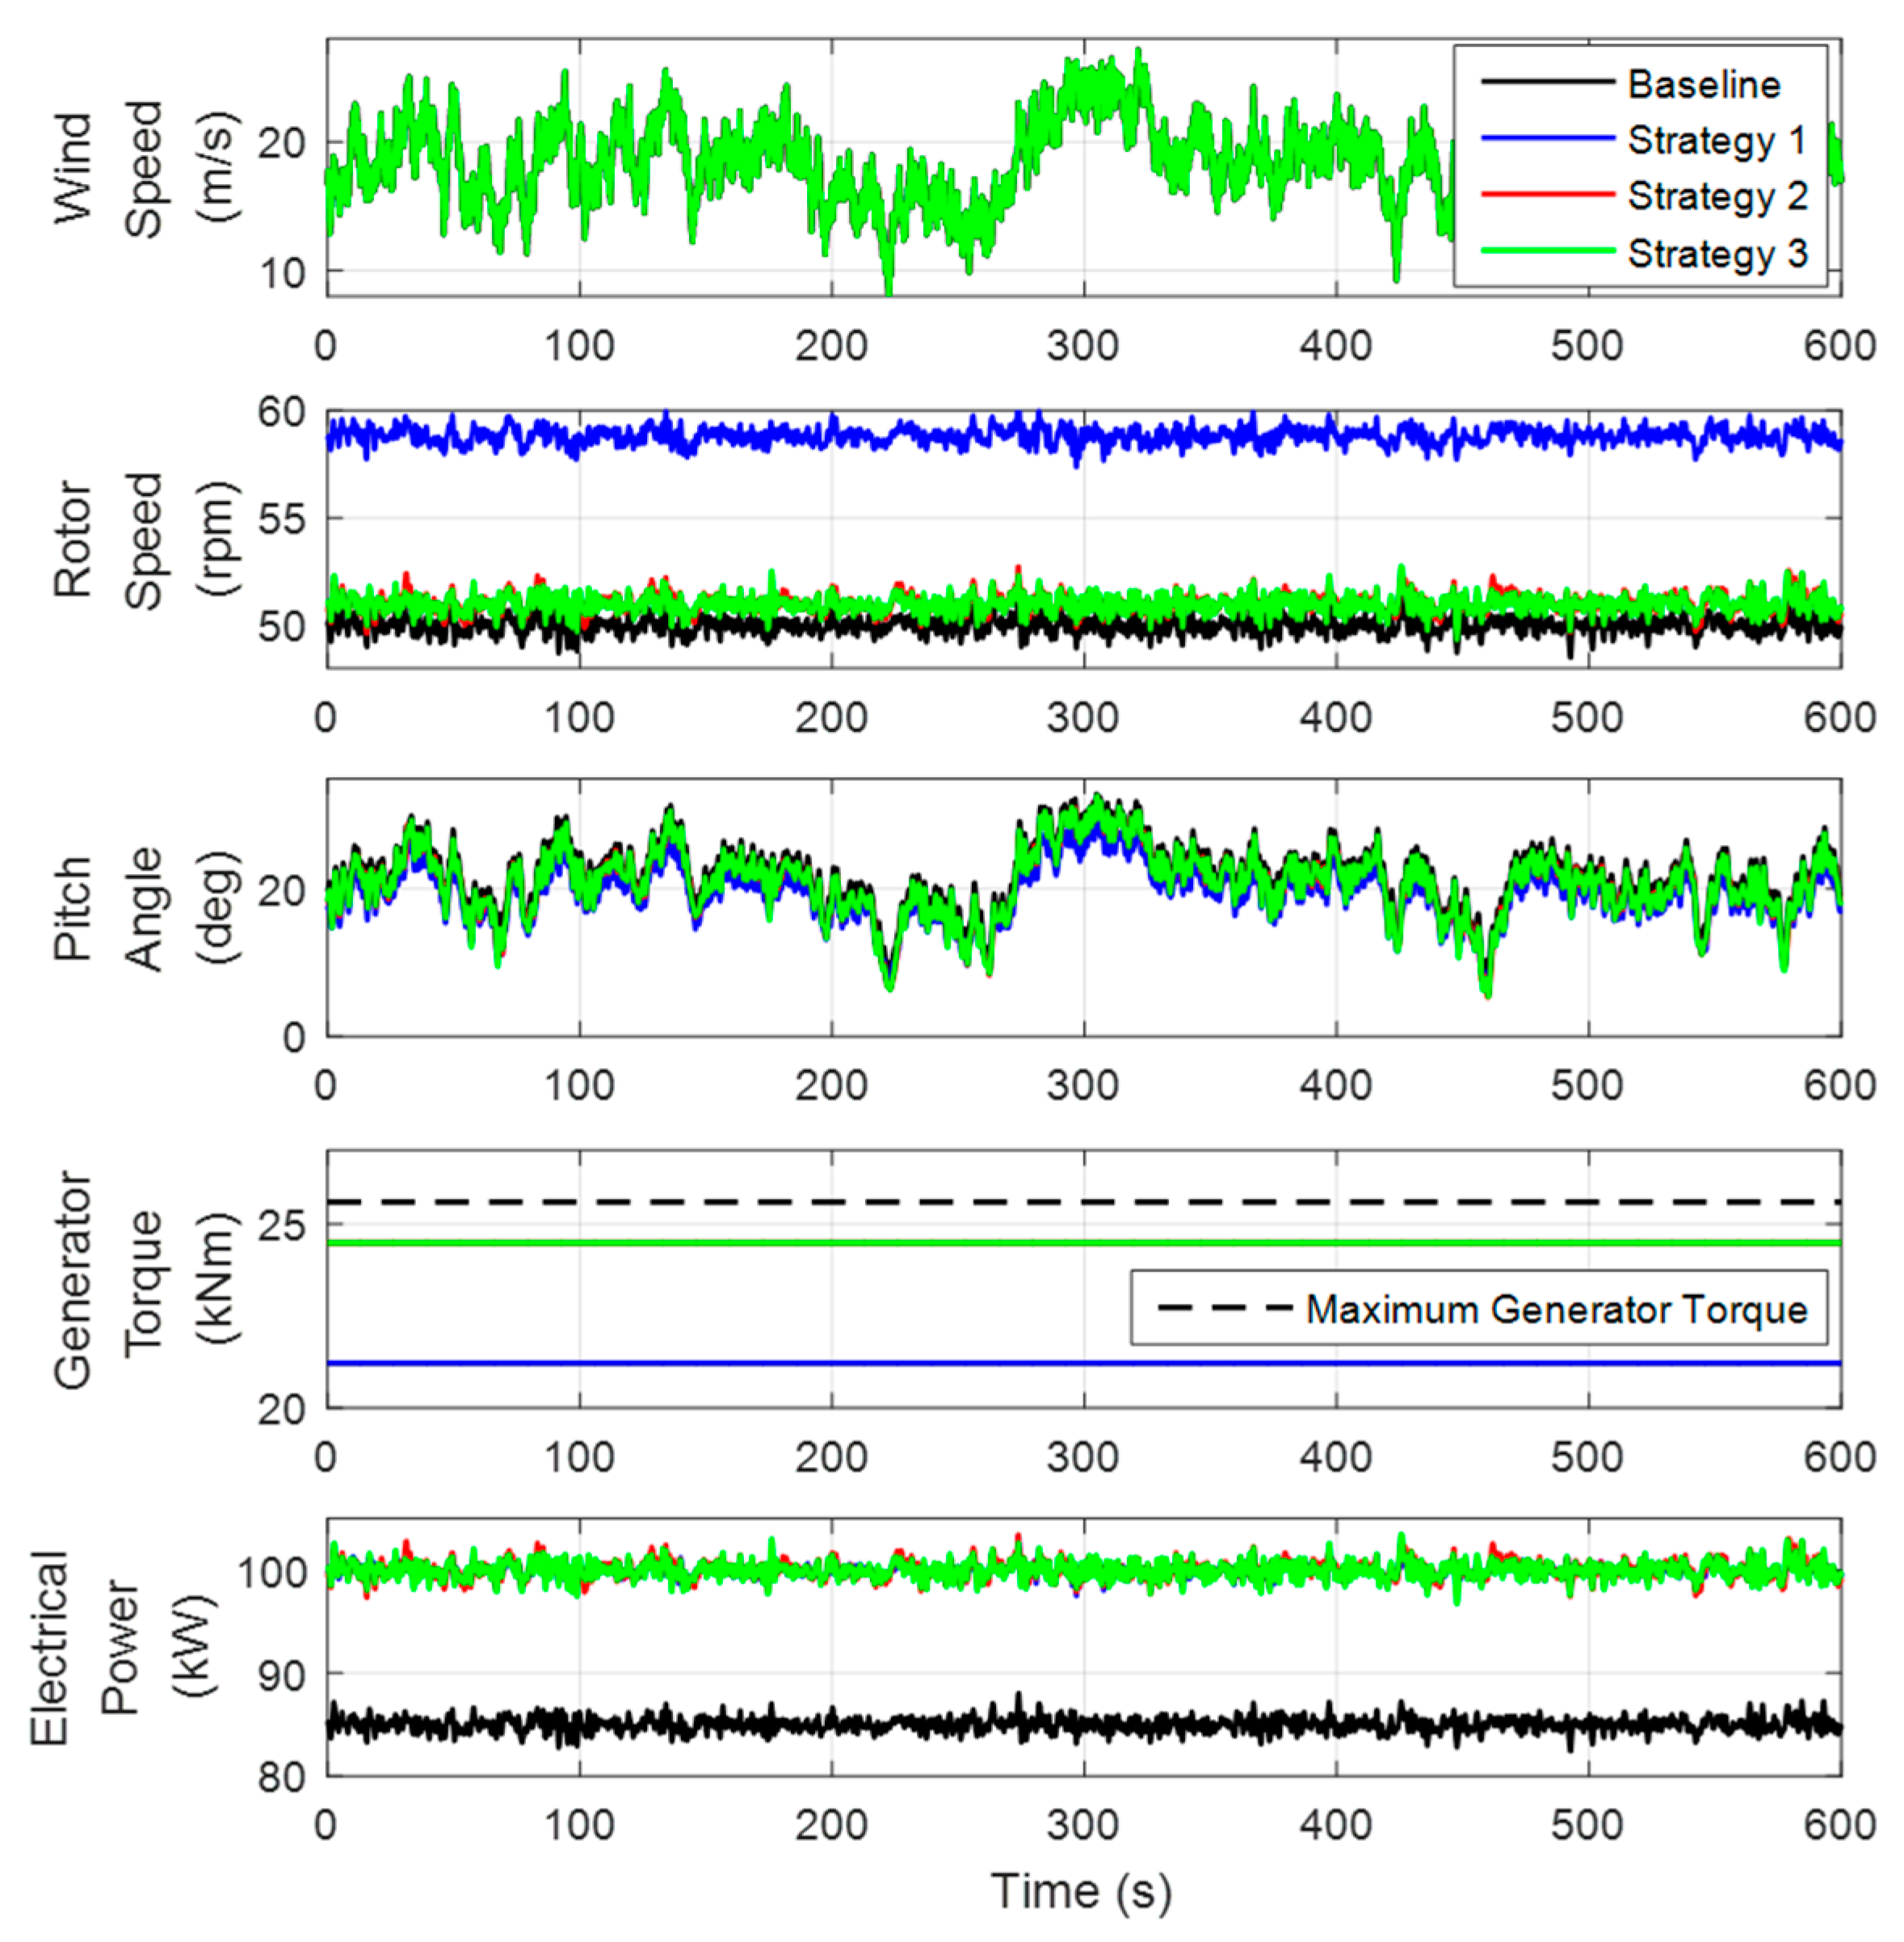
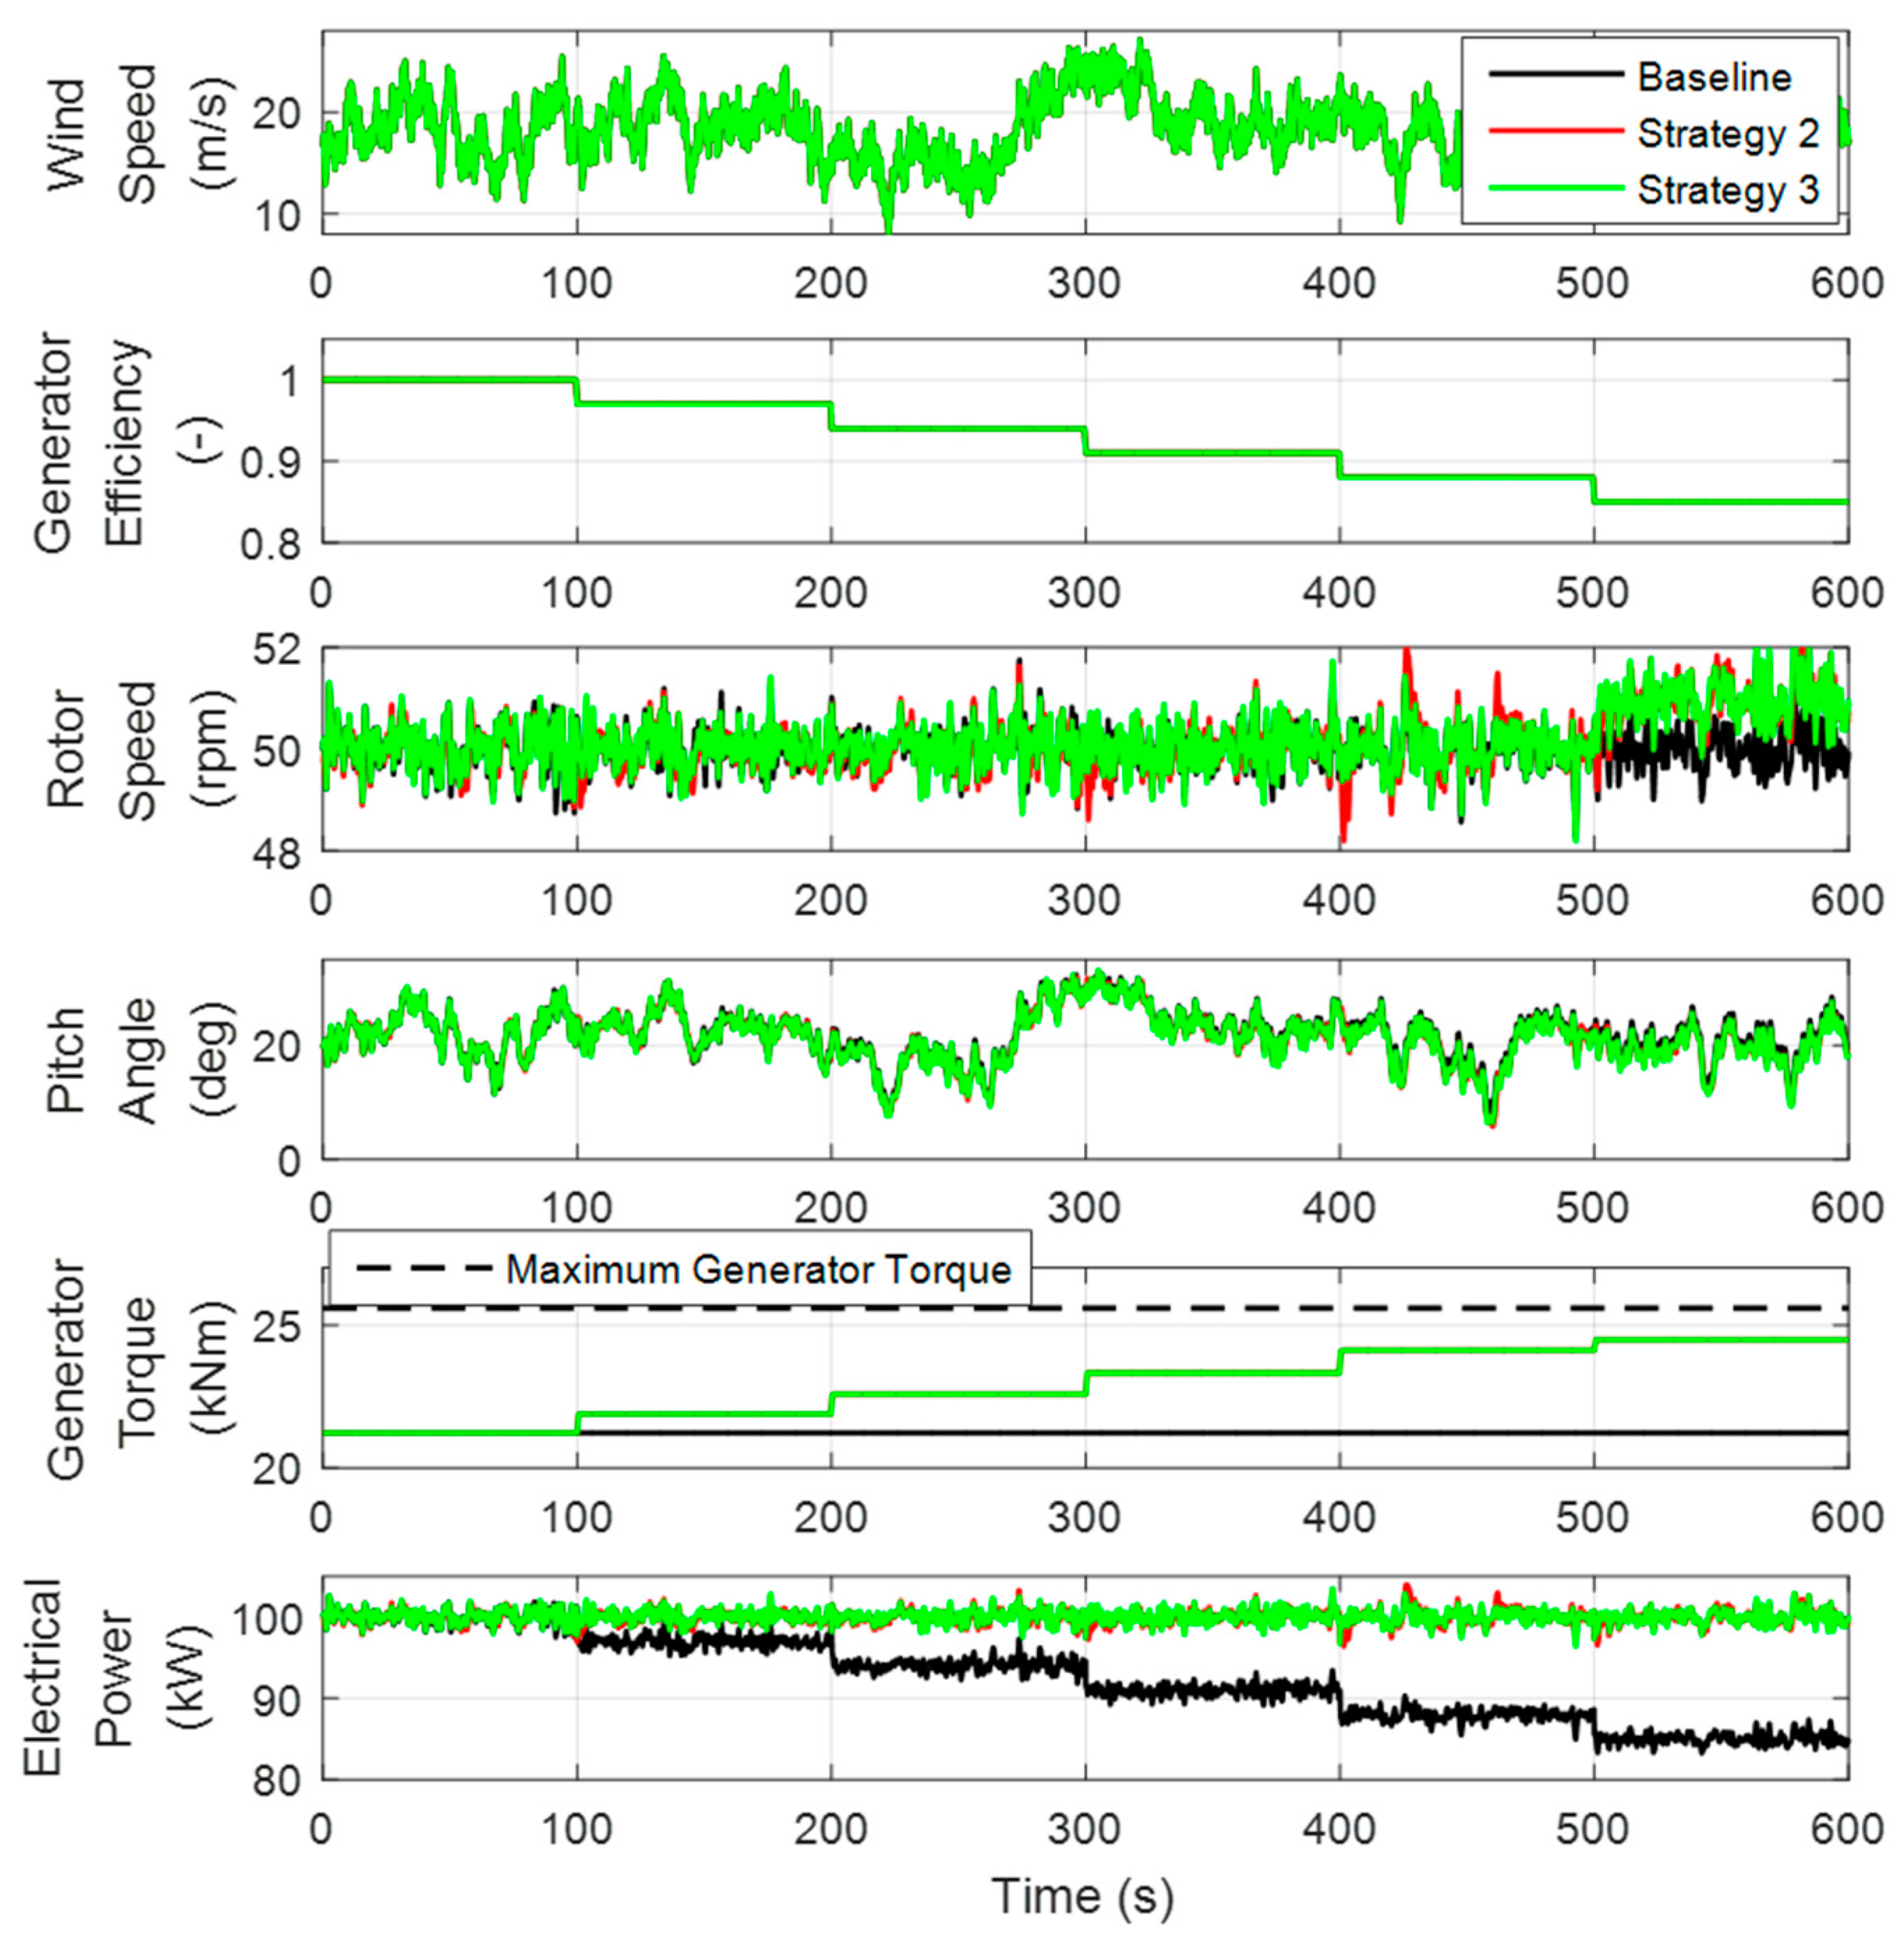
3.2. Simulation Results for Unusual Condition (with Additional Generator Loss)

In order to confirm the performance of the power compensation control algorithm, a simulation assuming additional generator loss was performed. It was assumed that the additional generator loss was 15%, and the other conditions, except for the generator efficiency, were applied in the same method as the simulation conditions performed above. Figure 7 shows the simulation results applied to four control algorithms. The solid black line is the result of the application of the basic power control algorithm, showing that the power decreases as the generator efficiency decreases. On the other hand, by applying the proposed control algorithm, the power compensation according to the reduction in generator efficiency was confirmed. The blue line is the simulation result to which Strategy 1 was applied, showing that the rotor speed was excessively increased to compensate.
The red and green lines show the results of Strategy 2 and Strategy 3. The difference with Strategy 1 is the presence or absence of an additional torque command according to the torque compensation control, and the torque compensation control algorithm sends out additional torque commands, confirming that the rotor speed operating range is relatively low. In addition, it was possible to confirm a change in operating performance through a change in the times of use of the pitch angle according to the application of the control algorithm. The difference between Strategy 1 and Strategy 3 is the error value used in the PI control algorithm. Strategy 1 used an error between the measured generator speed and the rated generator speed, and Strategy 3 used an error between the measured generator speed and the estimated generator speed. The quantitative values of the simulation results according to the application of the control algorithm are confirmed in Table 4 and Table 5.
Compared to the simulation results of applying the basic power control algorithm and additional generator loss 0%, the average power of the simulation results applied with the original power control algorithm and 15% additional generator loss decreased by 15.00%. In the case of Strategy 1, the standard deviation of the rotor speed decreased by 6.74%, but the average increased by 17.60%. Considering the stability of the wind turbine, it was found that the application of Strategy 1 was inappropriate. On the other hand, in the case of Strategy 2 and Strategy 3, the average rotor speed increased by about 2.00%, and it operated within an acceptable range. In the case of the standard deviation of rotor speed, Strategy 2 increased by 8.29% and Strategy 3 increased by 5.18%. In the case of power, it was confirmed that all of the proposed control algorithms could compensate for power and have a difference in standard deviation. In the case of Strategy 2, the power standard deviation increased by 6.35%, and in the case of Strategy 3, the power standard deviation increased by 3.24%.
As a result of the power performance comparison, it can be seen that strategy 1, strategy 2, and strategy 3 can all compensate for power, which can generate power without being affected by the additional loss of the generator. In addition, the stability comparison was compared with the allowable operation conditions using the operating range of the rotor rotation speed. As a result of the comparison, Strategy 1 exceeded the allowable rotor speed range and was determined to have no stability. Accordingly, Strategy 1 was excluded from the application. In the case of Strategies 2 and 3, the power standard deviation was slightly increased, but this did not significantly affect performance.

4. Discussion

The previously validated content was performed on the assumption that the additional generator loss of the target wind turbine was fixed at 15%. The target wind turbine may have changed generator efficiency due to the climate of the installation area. In this chapter, the performance of the power compensation control algorithm according to the variable generator efficiency was confirmed. The power compensation control algorithm can take into account the effects of changes in generator efficiency and estimate the generator efficiency at every moment. Since compensation control is performed based on the estimated generator efficiency, it is necessary to accurately estimate the variable generator efficiency. In order to validate the power compensation control performance, Strategy 2 and Strategy 3 described above were selected as the control algorithms to be validated, and performance comparison with the original power control algorithm was carried out.
The simulation conditions were applied to the Wind Rose 100 kW model and selected as NTM Class A with an average wind speed of 18 m/s. In addition, in order to reflect the variable generator efficiency, additional generator loss in the range from 0% to 15% was applied, and the situation was assumed to be reduced by 3% every 100 s. Dynamic simulations with the presented conditions were performed by applying control algorithms. Figure 8 shows the simulation results of the Wind Rose 100 kW model.
It can be seen that the generator efficiency gradually decreases over time, and the original power control algorithm operates with the power output reduced in accordance with the decreasing generator efficiency. On the other hand, it was found that Strategy 2 and Strategy 3 compensate for the reduced generator efficiency and operate while maintaining the rated power. Table 6 and Table 7 show the average value of the 100 s interval between the power and the rotor rotation speed. Compared with the 0% operation data of the additional generator loss of the original power control algorithm, the power was compensated, and the original power control algorithm quantitatively reduced the power output by the reduced generator efficiency.

5. Conclusions

In this study, the power compensation control algorithm according to three strategies was applied and validated to the Wind Rose 100 kW model. The original pitch control performs the control using an error between the measured and the rated generator speeds, though it cannot respond to the variable generator loss in the wind turbine. Unlike the original pitch control, Strategy 1 performs pitch control using an error between the measured power and the rated power and ensures operational performance in response to the loss of a generator. However, Strategy 1 is flawed in the sense that the rotor speed operation range is higher than the rated condition. This means that there is a limit to increasing the generator speed for power compensation. To improve this problem, Strategy 2 and Strategy 3 were designed. Strategies 2 and 3 can prevent an excessive increase in the rotor speed through torque compensation.
The aeroelastic analysis program Bladed was used to validate the control algorithm. The target wind turbine was selected as the Wind Rose 100 kW model. The simulation was performed, assuming that the additional generator loss was 0% and 15%. According to the results, it was found that the three power compensation control algorithms have similar performance to the original power control algorithm when the additional generator loss is 0%. As a result of comparing the rotor speed with the mean power and the standard deviation, it was found that the original power control algorithm and the proposed control algorithm had an error within 1.00%. Moreover, when the additional generator loss was 15%, the original power control algorithm could not compensate for the power output, but it was found that the proposed control algorithms operate while maintaining the rated power through power compensation. As a result of comparing the rotor speed with the mean power and the standard deviation, it was found that the original power control algorithm could not compensate for power loss and thus had a mean power error of 15.00%, and the proposed control algorithm had a mean power error of 0.05%. As described above, Strategy 1 operated while maintaining a high generator speed, and Strategy 2 and 3 operated while preventing an excessive increase in the generator speed.
In addition, in order to check the performance of the power compensation control algorithm according to the variable generator efficiency, additional simulations applied with the variable generator efficiency were performed. Considering the effect of reducing the standard deviation of power and rotor speed, Strategy 3 was found to be a little more effective.
The study is being carried out with the aim of a local demonstration of a 100 kW wind turbine in Thailand. This year, research related to the development of the control algorithms was conducted, and the results of the conducted research are presented in this paper. In the future, the target wind turbine will be installed in Thailand, and after it is installed, the test operation will be carried out by applying the control algorithm presented in this paper. According to the research progress of the task, there is a plan to perform practical application and performance validation.

Author Contributions

Conceptualization, D.K. and T.J.; methodology, D.K.; software, D.K.; supervision, I.P.; validation, D.K. and T.J.; investigation, D.K., B.P. and W.R.; data curation, D.K., T.J. and B.D.; writing—original draft, D.K.; writing—review and editing, I.P. All authors have read and agreed to the published version of the manuscript.

Funding

This work was supported by the International Energy Joint R&D Program of the Korea Institute of Energy Technology Evaluation and Planning (KETEP), granted financial resource from the Ministry of Trade, Industry and Energy, Republic of Korea (no. 20218520020010).

Institutional Review Board Statement

Not applicable.

Informed Consent Statement

Not applicable.

Data Availability Statement

Not applicable.

Conflicts of Interest

The authors declare no conflict of interest.

Nomenclature

NTMNormal Turbulence Model
MPPTMaximum Power Point Tracking
PLCProgrammable Logic Controller
PIProportional Integral
DLLDynamic Linking Library
Symbols
k p ,   g a i n Proportional gain
k i ,   g a i n Integral gain
Ω g ,   e r r o r Differences between rated and measured generator speeds
P   e r r o r Differences between rated and measured powers
P E l c Electrical power
T g Generator torque
Ω g Generator speed
η g Generator loss
T C M D Generator torque command
T C M D ,   o r i g i n a l Generator torque command for original torque controller
T C M D ,   a d d i t i o n a l Additional generator torque command for power compensation
η g ,   e s t Estimated generator loss
P m e a s u r e d Measured power
T g ,   m e a s u r e d Measured generator torque
Ω g ,   m e a s u r e d   Measured generator speed

References

  1. Global Wind Energy Council. GWEC|Global Wind Report 2022; Global Wind Energy Council: Brussels, Belgium, 2022. [Google Scholar]
  2. Bossanyi, E.A. The design of closed loop controllers for wind turbines. Wind Energy 2000, 3, 149–163. [Google Scholar] [CrossRef]
  3. Nam, Y. Wind Turbine System Control, 1st ed.; GS Intervision: Seoul, Korea, 2013. [Google Scholar]
  4. Bossanyi, E.A. Wind turbine control for load reduction. Wind Energy 2003, 6, 229–244. [Google Scholar] [CrossRef]
  5. Kim, K.; Kim, H.; Paek, I. Application and validation of peak shaving to improve performance of a 100 kW wind turbine. Int. J. Precis. Eng. Manuf. Green Technol. 2020, 7, 411–421. [Google Scholar] [CrossRef]
  6. Kim, C.; Kim, K.; Paek, I. Design of tower damper gain scheduling algorithm for wind turbine tower load reduction. J. Korean Sol. Energy Soc. 2018, 38, 1–13. [Google Scholar] [CrossRef]
  7. Bossanyi, E. Individual blade pitch control for load reduction. Wind. Energy 2003, 6, 119–128. [Google Scholar] [CrossRef]
  8. Kim, C.; Kim, K.; Song, Y.; Paek, I. Tower Load Reduction Control by Pitch Loop Individual Gain Scheduling. J. Wind. Energy 2018, 9, 25–32. [Google Scholar]
  9. Stammler, M.; Thomas, P.; Reuter, A.; Schwack, F.; Poll, G. Effect of load reduction mechanisms on loads and blade bearing movements of wind turbines. Wind. Energy 2019, 23, 274–290. [Google Scholar] [CrossRef] [Green Version]
  10. Selvam, K.; Kanev, S.; van Wingerden, J.W.; van Engelen, T.; Vergaegen, M. Feedback-feedforward individual pitch control for wind turbine load reduction. Int. J. Robust Nonlinear Control 2008, 130, 72–91. [Google Scholar] [CrossRef] [Green Version]
  11. Nam, Y.; Kim, J.; Paek, I.; Moon, Y.; Kim, S.; Kim, D. Feedforward Pitch Control Using Wind Speed Estimation. J. Power Electron. 2011, 11, 211–217. [Google Scholar] [CrossRef] [Green Version]
  12. Wang, N.; Johnson, K.E.; Wright, A.D. FX-RLS-based feedforward control for LIDAR-enabled wind turbine load mitigation. IEEE Trans. Control Syst. Technol. 2012, 20, 1212–1222. [Google Scholar] [CrossRef]
  13. Bao, J.; Yue, H.; Leithead, W.E.; Wang, J.Q. Feedforward control for wind turbine load reduction with pseudo-LIDAR measurement. Int. J. Autom. Comput. 2018, 15, 142–155. [Google Scholar] [CrossRef]
  14. Pitteloud, J.; Gsänger, S. 2017 Small Wind World Report; Technical Report; World Wind Energy Association: Bonn, Germany, 2017. [Google Scholar]
  15. Gözcü, O.; Kim, T.; Verelst, D.R.; McWilliam, M.K. Swept Blade Dynamic Investigations for a 100 kW Small Wind Turbine. Energies 2022, 15, 3005. [Google Scholar] [CrossRef]
  16. Siram, O.; Kesharwani, N.; Sahoo, N.; Saha, U.K. Aerodynamic Design and Wind Tunnel Tests of Small-scale Horizontal-axis Wind Turbines for Low Tip Speed Ratio Applications. J. Sol. Energy Eng. 2022, 144, 041009. [Google Scholar] [CrossRef]
  17. Fleck, B.; Huot, M. Comparative life-cycle assessment of a small wind turbine for residential off-grid use. Renew. Energy 2009, 34, 2688–2696. [Google Scholar]
  18. Tummala, A.; Velamati, R.K.; Sinha, D.K.; Indraja, V.; Krishna, V.H. A review on small scale wind turbines. Renew. Sustain. Energy Rev. 2016, 56, 1351–1371. [Google Scholar] [CrossRef]
  19. Kim, K.; Kim, H.; Paek, I.; Kim, H.; Son, J. Field Validation of Demanded Power Point Tracking Control Algorithm for Medium-Capacity Wind Turbine. Int. J. Precis. Eng. Manuf. Green Technol. 2019, 6, 875–881. [Google Scholar] [CrossRef]
  20. Castaignet, D.; Barlas, T.; Buhl, T.; Poulsen, N.; Wedel-Heinen, J.; Olesen, N.; Bak, C.; Kim, T. Full-scale test of trailing edge flaps on a Vestas V27 wind turbine: Active load reduction and system identification. Wind. Energy 2014, 17, 549–564. [Google Scholar] [CrossRef]
  21. Fuskele, V.; Baredar, P.; Sarviya, R.M.; Lal, S.; Awasthi, S. Wind turbine nacelle cooling systems: A review. Wiley Interdiscip. Rev. Energy Environ. 2022, 11, e456. [Google Scholar] [CrossRef]
  22. Jiang, Y. Wind turbine cooling technologies. Wind. Power Gener. Wind. Turbine Des. 2010, 44, 613–640. [Google Scholar]
  23. Taras, P.; Nilifard, R.; Zhu, Z.Q.; Azar, Z. Cooling Techniques in Direct-Drive Generators for Wind Power Application. Energies 2022, 15, 5986. [Google Scholar] [CrossRef]
  24. Vidal, Y.; Acho, L.; Luo, N.; Zapateiro, M.; Pozo, F. Power control design for variable-speed wind turbines. Energies 2012, 5, 3033–3050. [Google Scholar] [CrossRef]
  25. Hawari, Q.; Kim, T.; Ward, C.; Fleming, J. A robust gain scheduling method for a PI collective pitch controller of multi-MW onshore wind turbines. Renew. Energy 2022, 192, 443–455. [Google Scholar] [CrossRef]
  26. Ren, Y.; Li, L.; Brindley, J.; Jiang, L. Nonlinear PI control for variable pitch wind turbine. Control Eng. Pract. 2016, 50 (Suppl. C), 84–94. [Google Scholar] [CrossRef]
Figure 1. Target wind turbine (Wind Rose 100 kW).
Energies 16 00619 g001
Figure 2. Schematic diagram of the proposed control algorithms.
Energies 16 00619 g002
Figure 3. Schematic diagram of power feedback PI control (Strategy 1).
Energies 16 00619 g003
Figure 4. Schematic diagram of power feedback torque compensation control (Strategy 2).
Energies 16 00619 g004
Figure 5. Schematic diagram of estimated generator speed PI control (Strategy 3).
Energies 16 00619 g005
Figure 6. Comparison of simulation results using Bladed (additional generator loss 0%).
Energies 16 00619 g006
Figure 7. Comparison of simulation results using Bladed (additional generator loss 15%).
Energies 16 00619 g007
Figure 8. Comparison of simulation results with the variable generator efficiency.
Energies 16 00619 g008
Table 1. Specifications of target wind turbine.
SpecificationsUnitValue
Wind Turbine Type-HAWT, VSVP, Upwind
Rated PowerW100,000
Rotor Diameterm24.4
Hub Heightm30, 36
Rated Wind Speedm/s10
Rated Rotor Speedrpm50
Fine Pitch Angledeg−0.8
Optimal Tip Speed Ratio-7.3
Max-Cp-0.45
Gear Ratio-1:1
Table 2. Comparison of rotor speed according to simulation results (additional generator loss 0%).
Conditions
(Additional Generator Loss)
Rotor Speed (rpm, %)
MeanErrorStd.Error
Baseline (0%)50.00-0.386-
Strategy 1 (0%)50.020.040.3880.52
Strategy 2 (0%)50.020.040.3890.78
Strategy 3 (0%)50.040.080.3860.00
Table 3. Comparison of power according to simulation results (additional generator loss 0%).
Conditions
(Generator Efficiency)
Electrical Power (kW, %)
MeanErrorStd.Error
Baseline (0%)100.00-0.772-
Strategy 1 (0%)100.040.040.7760.52
Strategy 2 (0%)100.040.040.7770.65
Strategy 3 (0%)100.070.070.7720.00
Table 4. Comparison of rotor speeds according to simulation results (additional generator loss 15%).
Conditions
(Generator Efficiency)
Rotor Speed (rpm, %)
MeanErrorStd.Error
Baseline (0%)50.00-0.386-
Baseline (15%)50.0000.385−0.26
Strategy 1 (15%)58.8017.600.360−6.74
Strategy 2 (15%)51.002.000.4188.29
Strategy 3 (15%)50.951.900.4065.18
Table 5. Comparison of power according to simulation results (additional generator loss 15%).
Conditions
(Generator Efficiency)
Electrical Power (kW, %)
MeanErrorStd.Error
Baseline (0%)100.00-0.772-
Baseline (15%)85.00−15.000.655−15.16
Strategy 1 (15%)99.96−0.040.613−20.60
Strategy 2 (15%)100.030.030.8216.35
Strategy 3 (15%)99.95−0.050.7973.24
Table 6. Comparison of rotor speed according to simulation results.
SectionConditionsRotor Speed (rpm, %)
MeanErrorStd.Error
0~100 s
(0%)
Baseline49.99-0.433-
Strategy 250.010.040.391−9.70
Strategy 350.030.080.423−2.31
~200 s
(3%)
Baseline49.9900.343−20.79
Strategy 249.9900.347−19.86
Strategy 350.040.100.341−21.25
~300 s
(6%)
Baseline50.030.080.388−10.39
Strategy 250.000.020.406−6.24
Strategy 350.040.100.399−7.85
~400 s
(9%)
Baseline49.990.000.356−17.78
Strategy 249.9900.348−19.63
Strategy 350.050.120.395−8.78
~500 s
(12%)
Baseline49.97−0.040.393−9.24
Strategy 250.010.040.55027.02
Strategy 350.000.020.415−4.16
~600 s
(15%)
Baseline50.020.060.394−9.01
Strategy 250.961.940.4626.70
Strategy 350.951.920.431−0.46
Table 7. Comparison of power according to simulation results.
SectionConditionsElectrical Power (kW, %)
MeanErrorStd.Error
0~100 s
(0%)
Baseline99.99-0.865-
Strategy 2100.020.030.8720.81
Strategy 3100.070.080.846−2.20
~200 s
(3%)
Baseline96.98−3.010.665−23.12
Strategy 299.97−0.020.699−19.19
Strategy 3100.090.100.683−21.04
~300 s
(6%)
Baseline94.06−5.930.728−15.84
Strategy 2100.010.020.809−6.47
Strategy 3100.080.090.796−7.98
~400 s
(9%)
Baseline90.98−9.010.649−24.97
Strategy 299.9900.698−19.31
Strategy 3100.100.110.792−8.44
~500 s
(12%)
Baseline87.96−12.030.691−20.12
Strategy 2100.030.041.10227.40
Strategy 3100.000.010.833−3.70
~600 s
(15%)
Baseline85.0314.960.669−22.66
Strategy 299.95−0.040.9084.97
Strategy 399.94−0.050.848−1.97
Disclaimer/Publisher’s Note: The statements, opinions and data contained in all publications are solely those of the individual author(s) and contributor(s) and not of MDPI and/or the editor(s). MDPI and/or the editor(s) disclaim responsibility for any injury to people or property resulting from any ideas, methods, instructions or products referred to in the content.

