1. Introduction
With the growing demand of global energy, energy shortage and environmental pollution become increasingly crucial [
1], making it urgent to develop and utilize renewable energy. Geothermal, as a kind of clean energy, has great potential for development [
2].
The geothermal resources in Yinchuan Basin are low-to-medium temperature geothermal resources. The Shuining-Huangyangtan area is a high geothermal anomaly area with a shallow geothermal gradient of over 4 °C/100 m. The area is a fault basin, controlled by two faults inclining in NE, called East Helan Mountain fault and the Yellow River fault, respectively. Many studies have been conducted with regard to the formation mechanism of geothermal resources in this area. Chen et al. [
3] classified the geothermal type of the uplift area in the eastern margin of Yinchuan Basin as “mixed conduction-convection type” based on the structural genesis and the mode of heat transfer. At present, there are 11 local uplift structures found in the central deep subsidence zone of Yinchuan Basin, namely Pingluo uplift, Luhuatai uplift, Yongning uplift, Shahuqiao uplift, Tongjiqiao uplift, Yaofu uplift, Suixing uplift, Wuzhong uplift, Qingtongxia uplift, Jinyintan uplift, and Balang Lake uplift. These local uplift structures have certain controlling effect on geothermal energy.
Generally speaking, the large tensional fault zone is an important channel for the deep circle of hot water in the geothermal field. The Yellow River fault is a transcrustal fault which cuts a C-typed reflection zone at a depth of about 20 km and passes down through the Moho surface. There are many studies on the activity of the fault [
4,
5,
6,
7,
8,
9,
10,
11,
12,
13], but less focus on the geothermal geology problems about the fault. As one of the two basin controlling boundary faults in the east of Yinchuan Basin, the Yellow River fault develops along the western margin of the Ordos platform. The fault, with a total length of approximately 140 km, starts from the southeast of Huinong District of Shizuishan City in the north, extends along the Yellow River in SSW direction, and turns north-south at northern Yinchuan Hedong Airport, concealed in the south of Daquan to Sunjiatan. The landform to the east of the fault is platform or low mountain, where there are Paleogene, Neogene and older strata exposed to the surface. To the west is Yinchuan Plain, where the thickness of the Quaternary system reaches hundreds to thousands of meters, and the vertical differential movement between the two walls of the fault has been significant since Quaternary.
However, the genetic mechanism of regional geothermal is still controlled by the following factors: First, regional fault structural system and deep morphology. Regional faults are obviously segmented, as different regional segments show distinct characteristics. Second, the relationship between deep fluid movement and regional hydrothermal geothermal, which can guide the regional geothermal exploration. Third, the diverse geothermal in this region, including the hot-dry geothermal, of which the distribution rules are not clear enough. In this regard, geophysical methods are one of the important means to study the geothermal distribution and the formation mechanism. Geophysical methods can be used to analyze tectonic activity and geological structure and explain the genetic mechanism of geothermal [
14], so as to establish the corresponding model of geothermal geology-geophysics. The conceptual model of geothermal system, based on the comprehensive study of geoscience, is used to describe the geological conditions and processes related to temperature, pressure and fluid flow [
15]. Zhao et al. [
16] estimated the Moho and Curie depths of Gonghe Basin in Qinghai province by Park-Oldenburg inversion of gravity and magnetic data, proposed the geological conceptual model of Gonghe Basin based on the results of magnetospheric sounding and seismic inversion, and conducted an in-depth study on the geothermal mechanism of Gonghe Basin. Aydemir et al. [
17] studied the magnetic anomaly data, borehole data, the geothermal gradient, and conductivity data to model the magnetic anomaly and geothermal structure of Foca-Uzunada in western Turkey, and proved that the offshore area of Gol and Gandarli Bay are one of the most important geothermal potential areas in Turkey. Bekesi et al. [
1] established a geothermal model of the Dutch subsurface based on the inversion of temperature data, which revealed the area with potential for hydrothermal convection in these carbonate platforms.
The single-type geophysical observation method can judge the deep rock structure only by single physical parameter, which is limited in its ability to solve geological-geophysical problems and faces strong uncertainty of inversion and interpretation [
18,
19,
20,
21]. The multi-geophysical exploration methods can not only realize the joint constraint of different physical properties of the same rock structure, but also make the correspondence analysis of substances of different chemical components and different physical states, and establish the spatial distribution and interaction relationship of target rock-fluid structure [
22]. In this paper, we carried out 1:200,000 gravity measurement and 1:1,000,000 aeromagnetic measurement and established multi-scale density and magnetic models with different depths and different physical attributes. Combined with existing deep seismic exploration results, we comprehensively studied the distribution of earthquake sources, Moho depth, Curie interface depth, spatial distribution of fault structures, tectonic activity of blocks and 3D density model structure in the study area. After that, we clarify the heat control effect of regional fault structures and the heat exchange regularity between deep fluids and shallow materials and establish a multi-scale model of geothermal geology-geophysics. The model would be helpful to provide theoretical support and a scientific basis for the exploration, sustainable development, and utilization of geothermal resources in Ningxia region.
2. Regional Geothermal Conditions
The uplift and transfer effect of the Qinghai-Tibetan Plateau made the Ordos block move slowly to the southeast and formed the peripheral basin group after the end of the Cretaceous [
23]. The Ordos block is relatively stable and higher, which hinders the flow of the Yellow River, so the Yellow River flows eastward to a series of fault basins around the block [
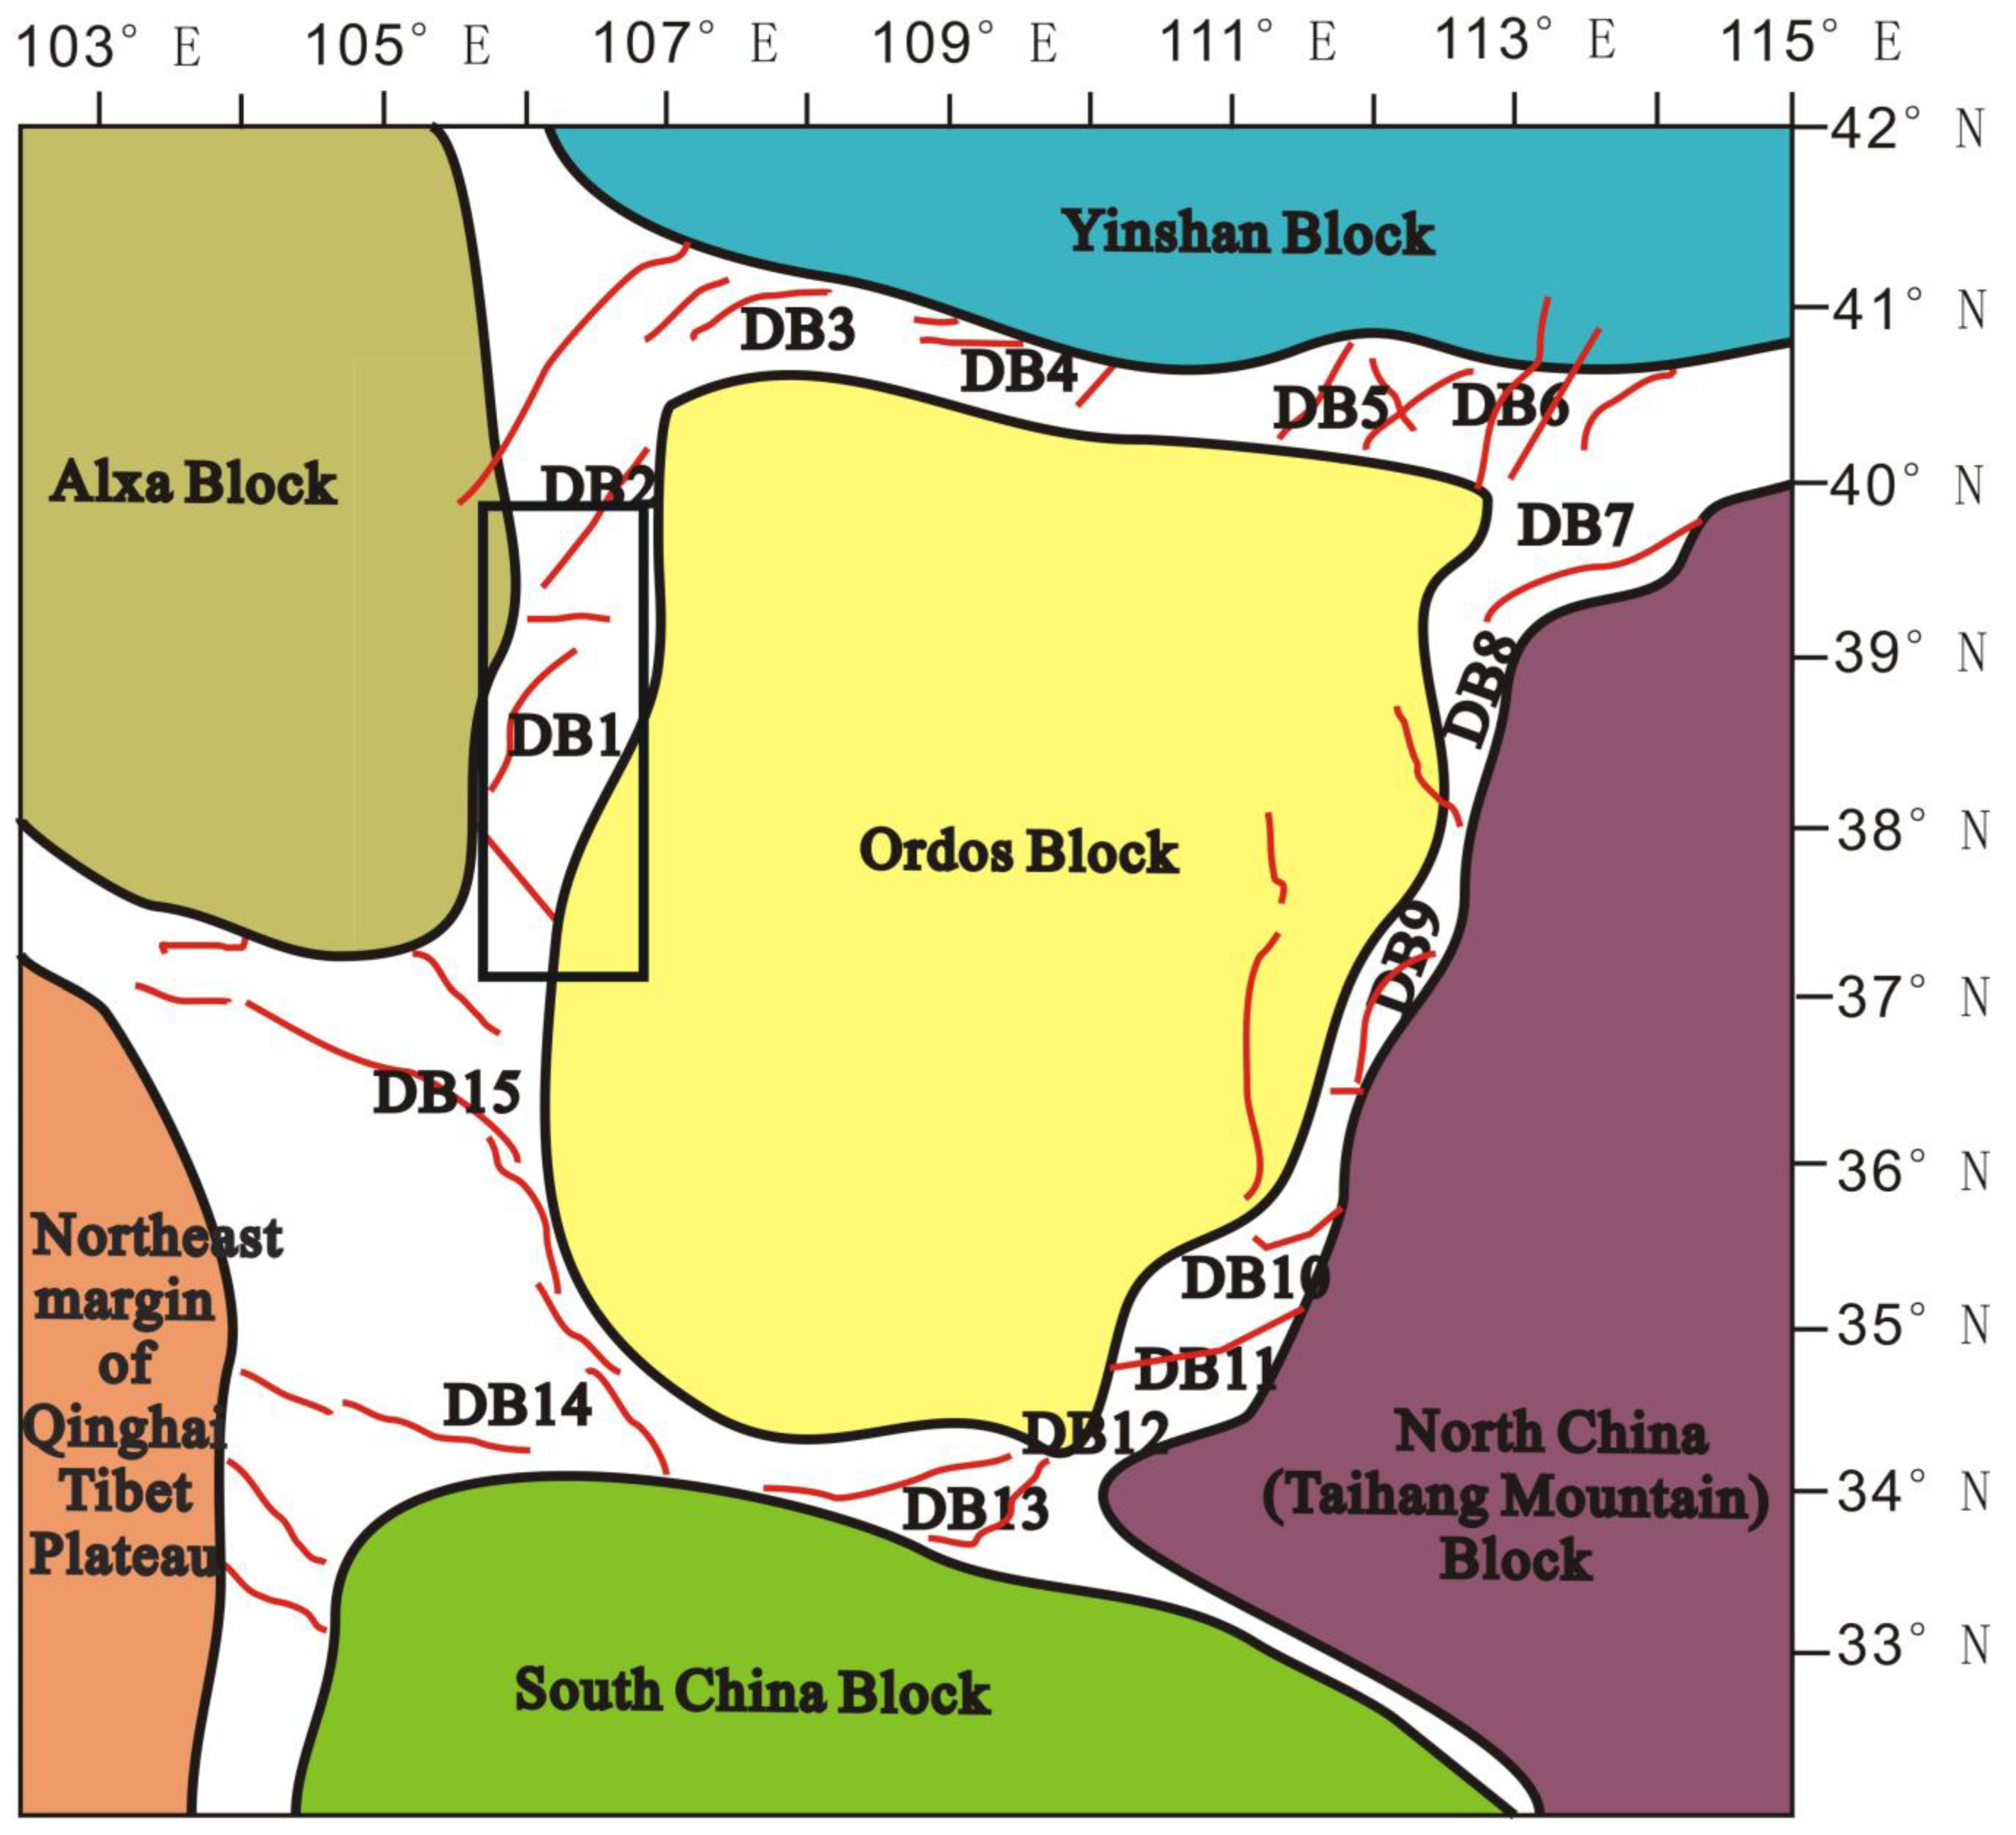
24]. In addition, the subduction of the Pacific plate deep underground controls the active movement of the upper mantle throughout northern China. As part of the North China block, Yinchuan Basin has been located between the Qinghai Tibet Fault Block, Alxa Fault Block, and Ordos Fault Block since the Late Cenozoic Era (
Figure 1) and is mainly characterized by NE trending fault depression movement. In addition to the background of early fault depression movement, it has also been affected by the uplift of Qinghai-Tibet Plateau expanding to the northeast since the late Cenozoic era [
25,
26]. The study area is covered by layers in Cenozoic, mainly distributed with Quaternary loess. Locally, there are Paleogene Qingshuiying Formation, Neogene Ganhegou Formation, Cretaceous Yijun Formation, and Ordovician Tianjingshan Formation. According to the boreholes in the study area, there are many sets of Mesozoic and Paleozoic strata under the Cenozoic, from old to new: Ordovician, Carboniferous, Permian, Cretaceous, Paleogene, Neogene, and Quaternary. There is no igneous rock exposed in the area [
27].
3. Deep Exploration and Interface Inversion of Regional Geophysical Data
3.1. Moho Distribution
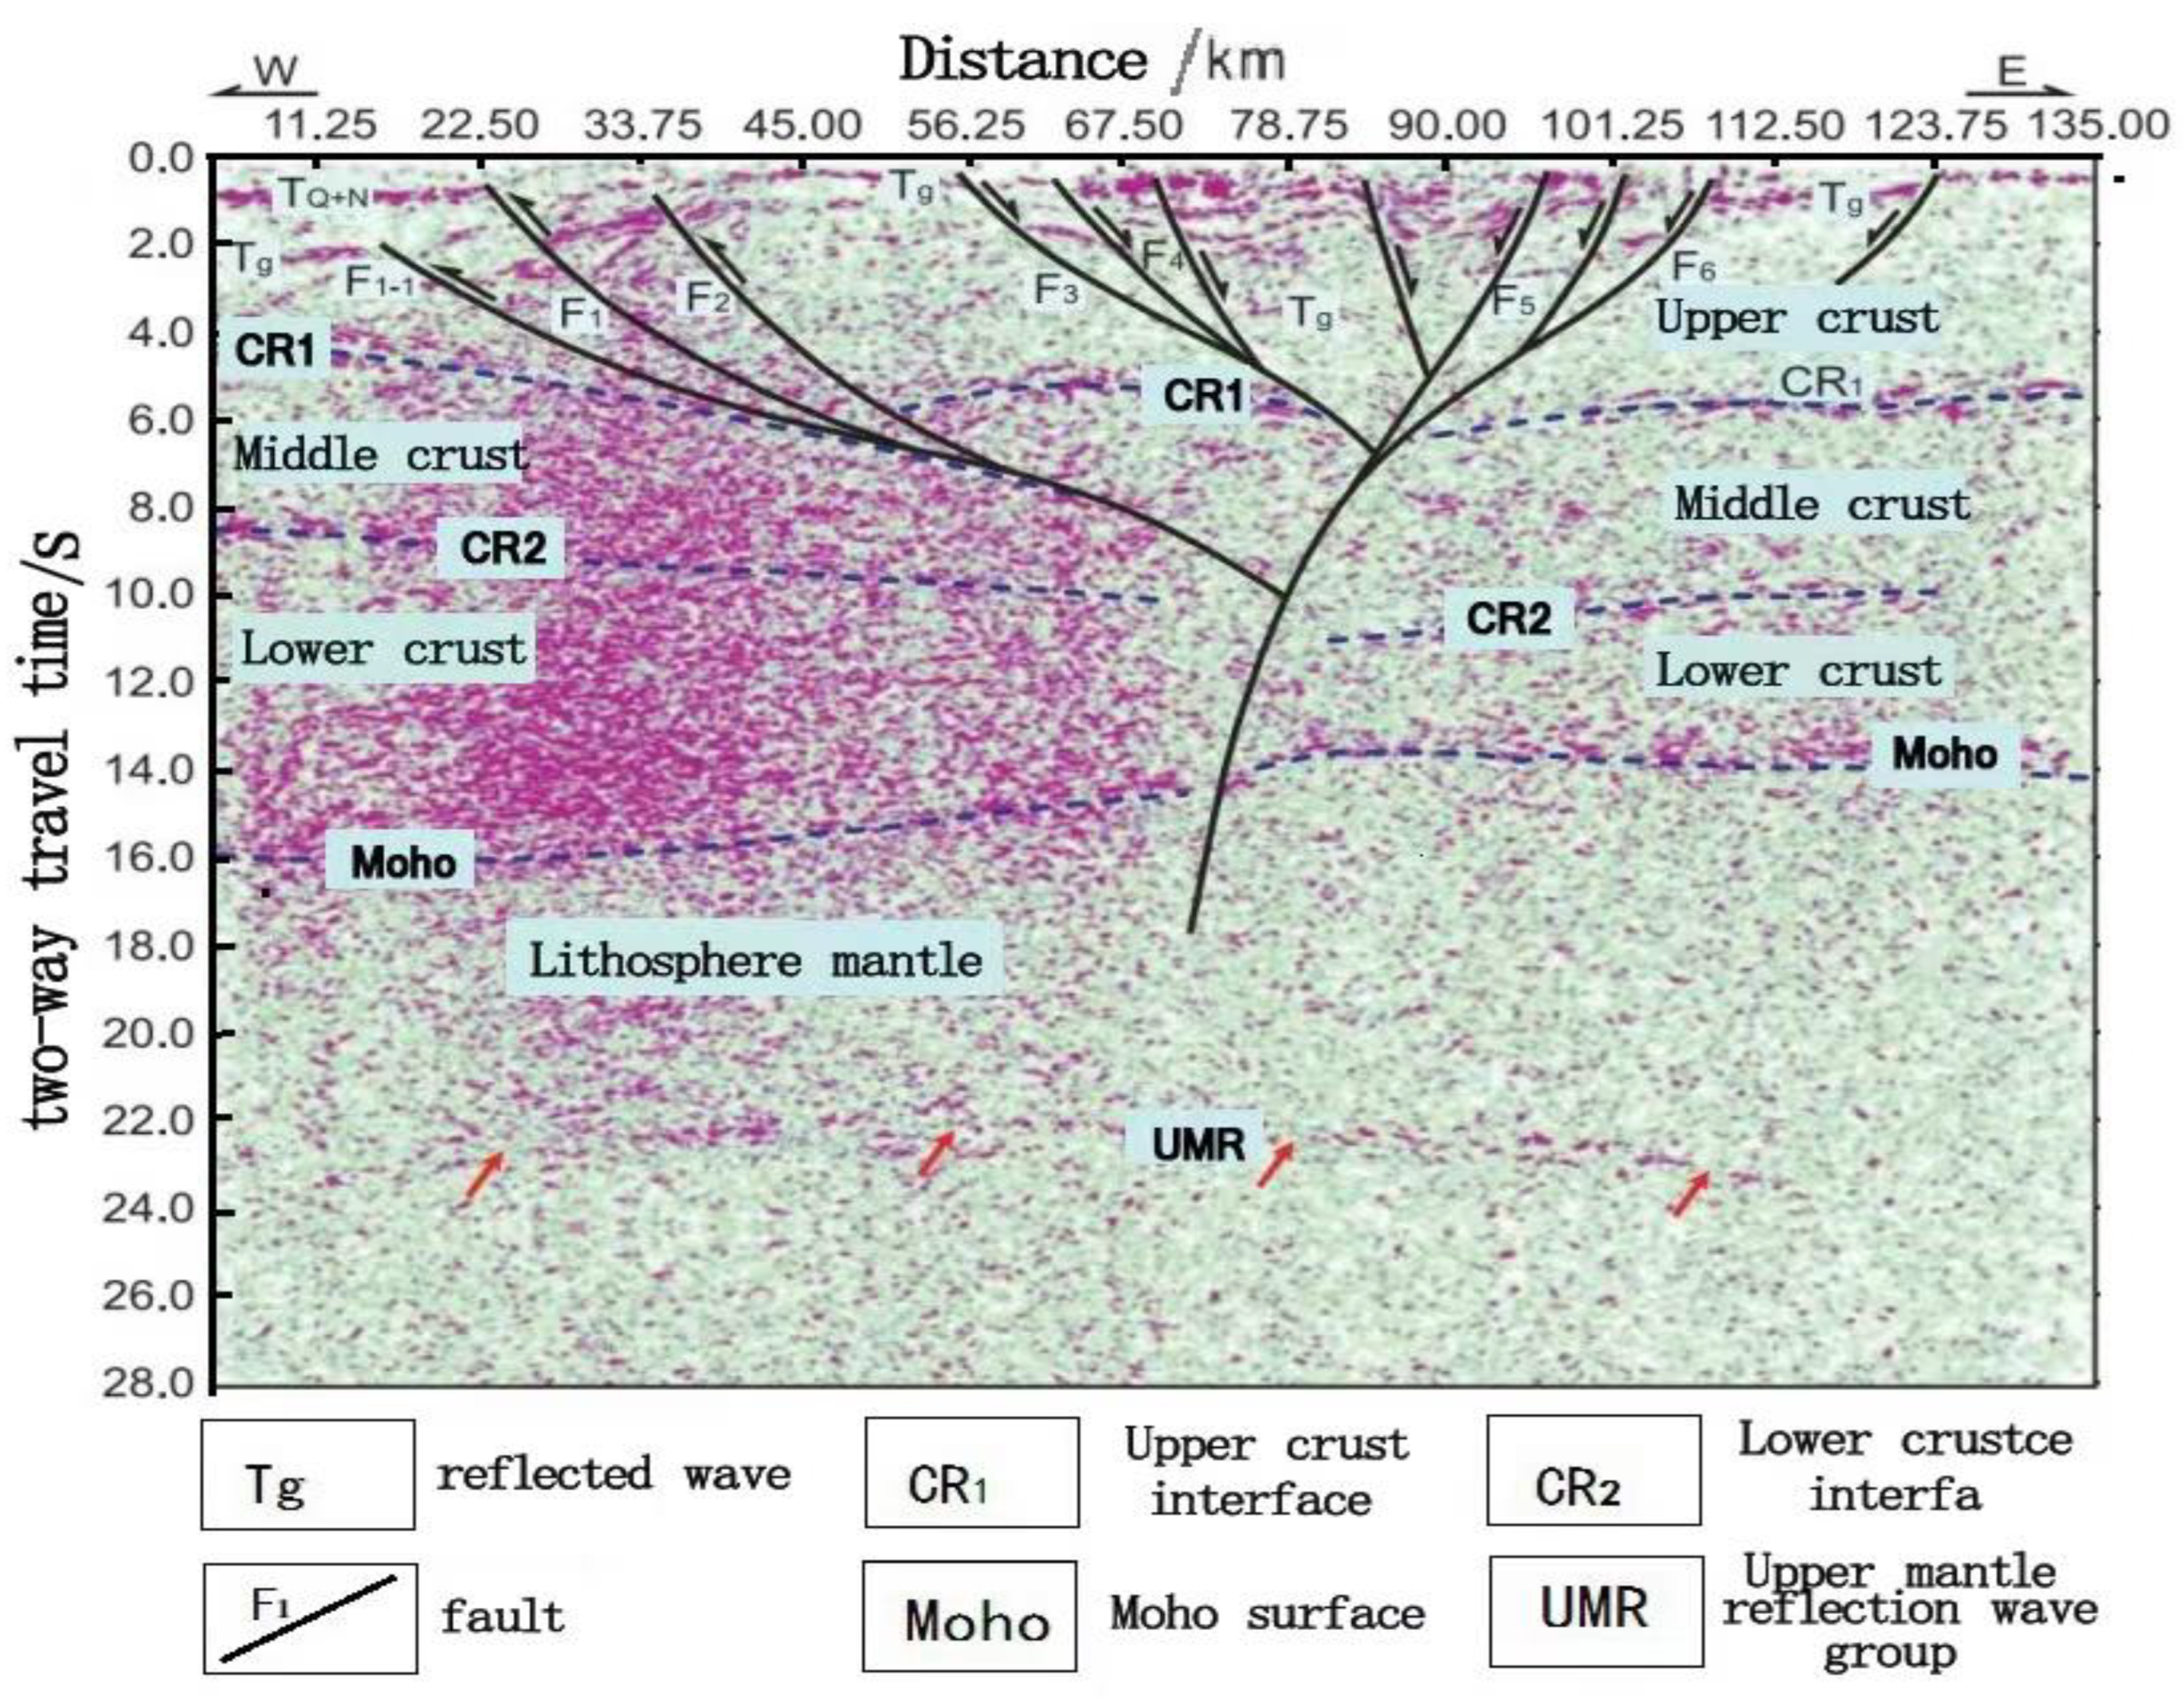
The area studied is located in the northern section of the North-South tectonic belt and the thrust belt of the western margin of Ordos. This particular tectonic environment makes the area in good conditions of deep heat source. A high-resolution deep seismic detection method was carried out by Liu et al. [
28] and used to study the uplifting Moho surface in the study area and provide evidence for the deep regional heat source. The petroleum seismic profile shows that the asthenosphere and the Moho surface are obviously uplifted near the Ordos block, as shown in
Figure 2. From the Alxa block eastward to Helan Mountain, Yinchuan Basin, and Ordos block, the Moho surface is gradually uplifted, with a maximum depth of 50 km, and reaches a minimum depth of 40 km near the Yellow River fault. Due to the uplift of the asthenosphere and the Moho surface, there is upwelling of the deep heat flow, as well as the intrusion of high-temperature molten materials into the upper crust. Consequently, the corresponding parts are heated, and localized melting may be formed, so that the deep crust has a higher temperature. Therefore, the terrestrial heat flow is the main source of geothermal heat in the study area.
3.2. Aeromagnetic Data Inversion and Curie Isotherm Distribution
The deep temperature interface, also known as Curie isotherm surface, is the temperature interface when the ferromagnetic minerals in rocks lose their ferromagnetism and become paramagnetic because the temperature rises to the Curie point. Curie isotherm surface is of great significance to the study of seismogenesis, geothermal exploration, crustal dynamics, metallogenesis of endogenetic metal deposits, and hydrocarbon genesis. Since the late 1970s, aeromagnetic data has been used by scholars at home and abroad to study the Curie isotherm surface. At present, aeromagnetic exploration is the main method to study the Curie depths [
29,
30,
31,
32,
33,
34]. Moreover, magnetic interface inversion is the main method to estimate the Curie interface depths [
35,
36].
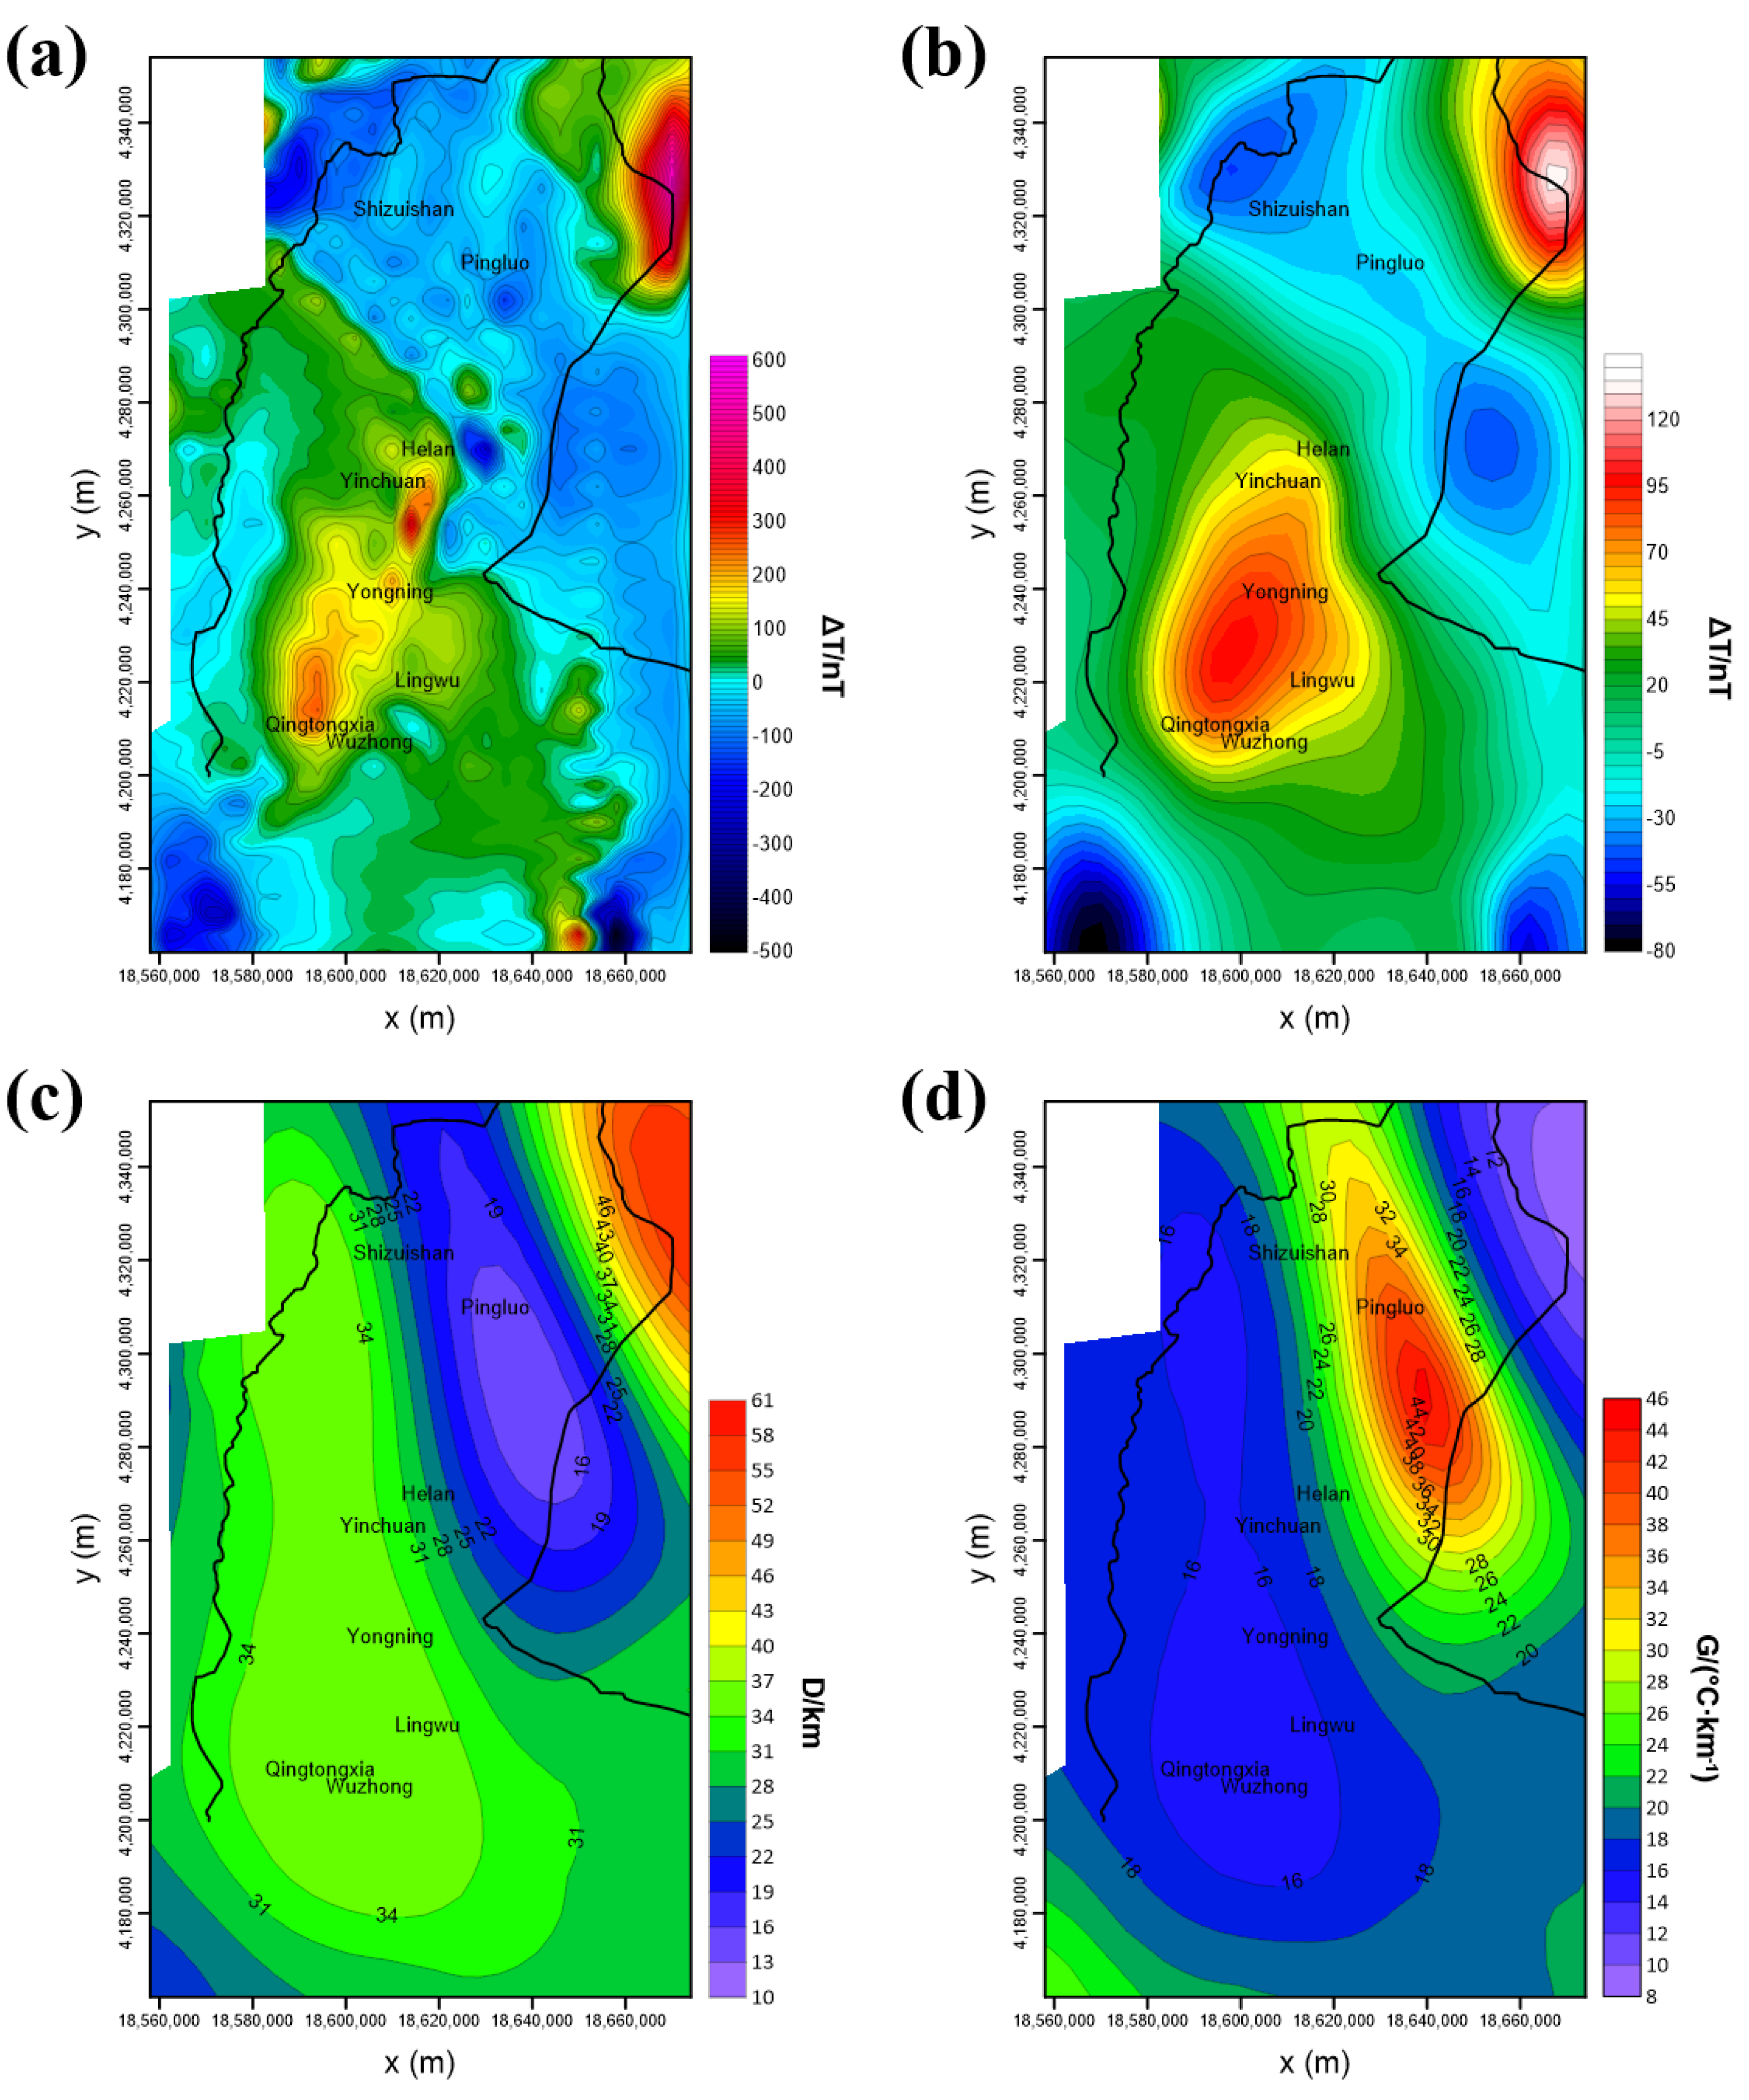
In this research, to study the deep interface in the study region, we measured aeromagnetic data and calculated the depth of the Curie isotherm and geothermal gradient, as shown in
Figure 3.
Figure 3a shows the distribution of aeromagnetic pole anomaly in the study area, which is jointly caused by shallow magnetic rocks and deep magnetic interfaces, and the superimposed magnetic anomaly needs to be separated and extracted [
37,
38]. The Curie isotherm surface can be estimated by using the aeromagnetic anomaly without the influence of shallow field sources (
Figure 3b). Taking 3000 × 10
3 A/m as the average magnetization of the magnetic interface and 30 km as the average depth of the Curie isotherm surface, the buried depths of the magnetic lower interface can be obtained by inversion calculation. Since the Curie isotherm can be considered as the 580 °C isotherm of underground temperature, the geothermal gradient can be obtained using the surface elevation and inverted Curie depths, as shown in
Figure 3d. The geothermal gradient can be calculated from
where
G represents the geothermal gradient;
T is the temperature at the surface;
is the depth of Curie isotherm. The Curie isotherm uplift area is spread NW with Pingluo as the center, and the maximum geothermal gradient is about 4.4 °C/100 m. From Pingluo to the southwest, the Curie isotherm depth increases and the geothermal gradient declines (
Figure 3). The above results indicate that the Yinchuan Plain is a fault basin, and the Curie isotherm surface and Moho surface in the deep part of the basin are uplifted, resulting in a larger isotherm gradient in the east of the plain.
4. Regional Blocks and Tectonic Activity
4.1. Relationship between Earthquakes Distribution and Regional Geothermal
Yinchuan Basin lies at the northern end of the North-South seismic zone in China. Since the late Quaternary, there have been strong fault activity in the graben system and frequent earthquakes under the condition that the Qinghai-Tibet Plateau expands to the northeast [
8]. The seismic activity in Yinchuan Basin is characterized by high frequency and high intensity, making Yinchuan Basin a major site of strong earthquakes, and causing 22 strong earthquakes successively. The seismic activities in the basin can be divided into the south and north sections by the boundary between Lingwu and Yongning, with obvious difference in the activity. The strong earthquake activities in the south section are distributed in a north-south zone from Lingwu to the east side of Niushoushan Mountain. Near the east side of the graben occurred 10 earthquakes, with the maximum magnitude of 5.5. The seismicity in this section shows characteristics of high frequency, short interval and low intensity. A total of 12 strong earthquakes occurred in the Yinchuan-Pingluo section, including one Ms 8 earthquake and two Ms 6 earthquakes. It can be seen that the earthquake frequency in this section is slightly higher than that in the south section, but the earthquake intensity is much higher. Since the Ms 8 earthquake in 1739, the seismic activities in this section tend to be quiet and no earthquakes with Ms ≥ 5.0 have occurred. The moderately strong earthquakes mainly occur in the southern section of the graben.
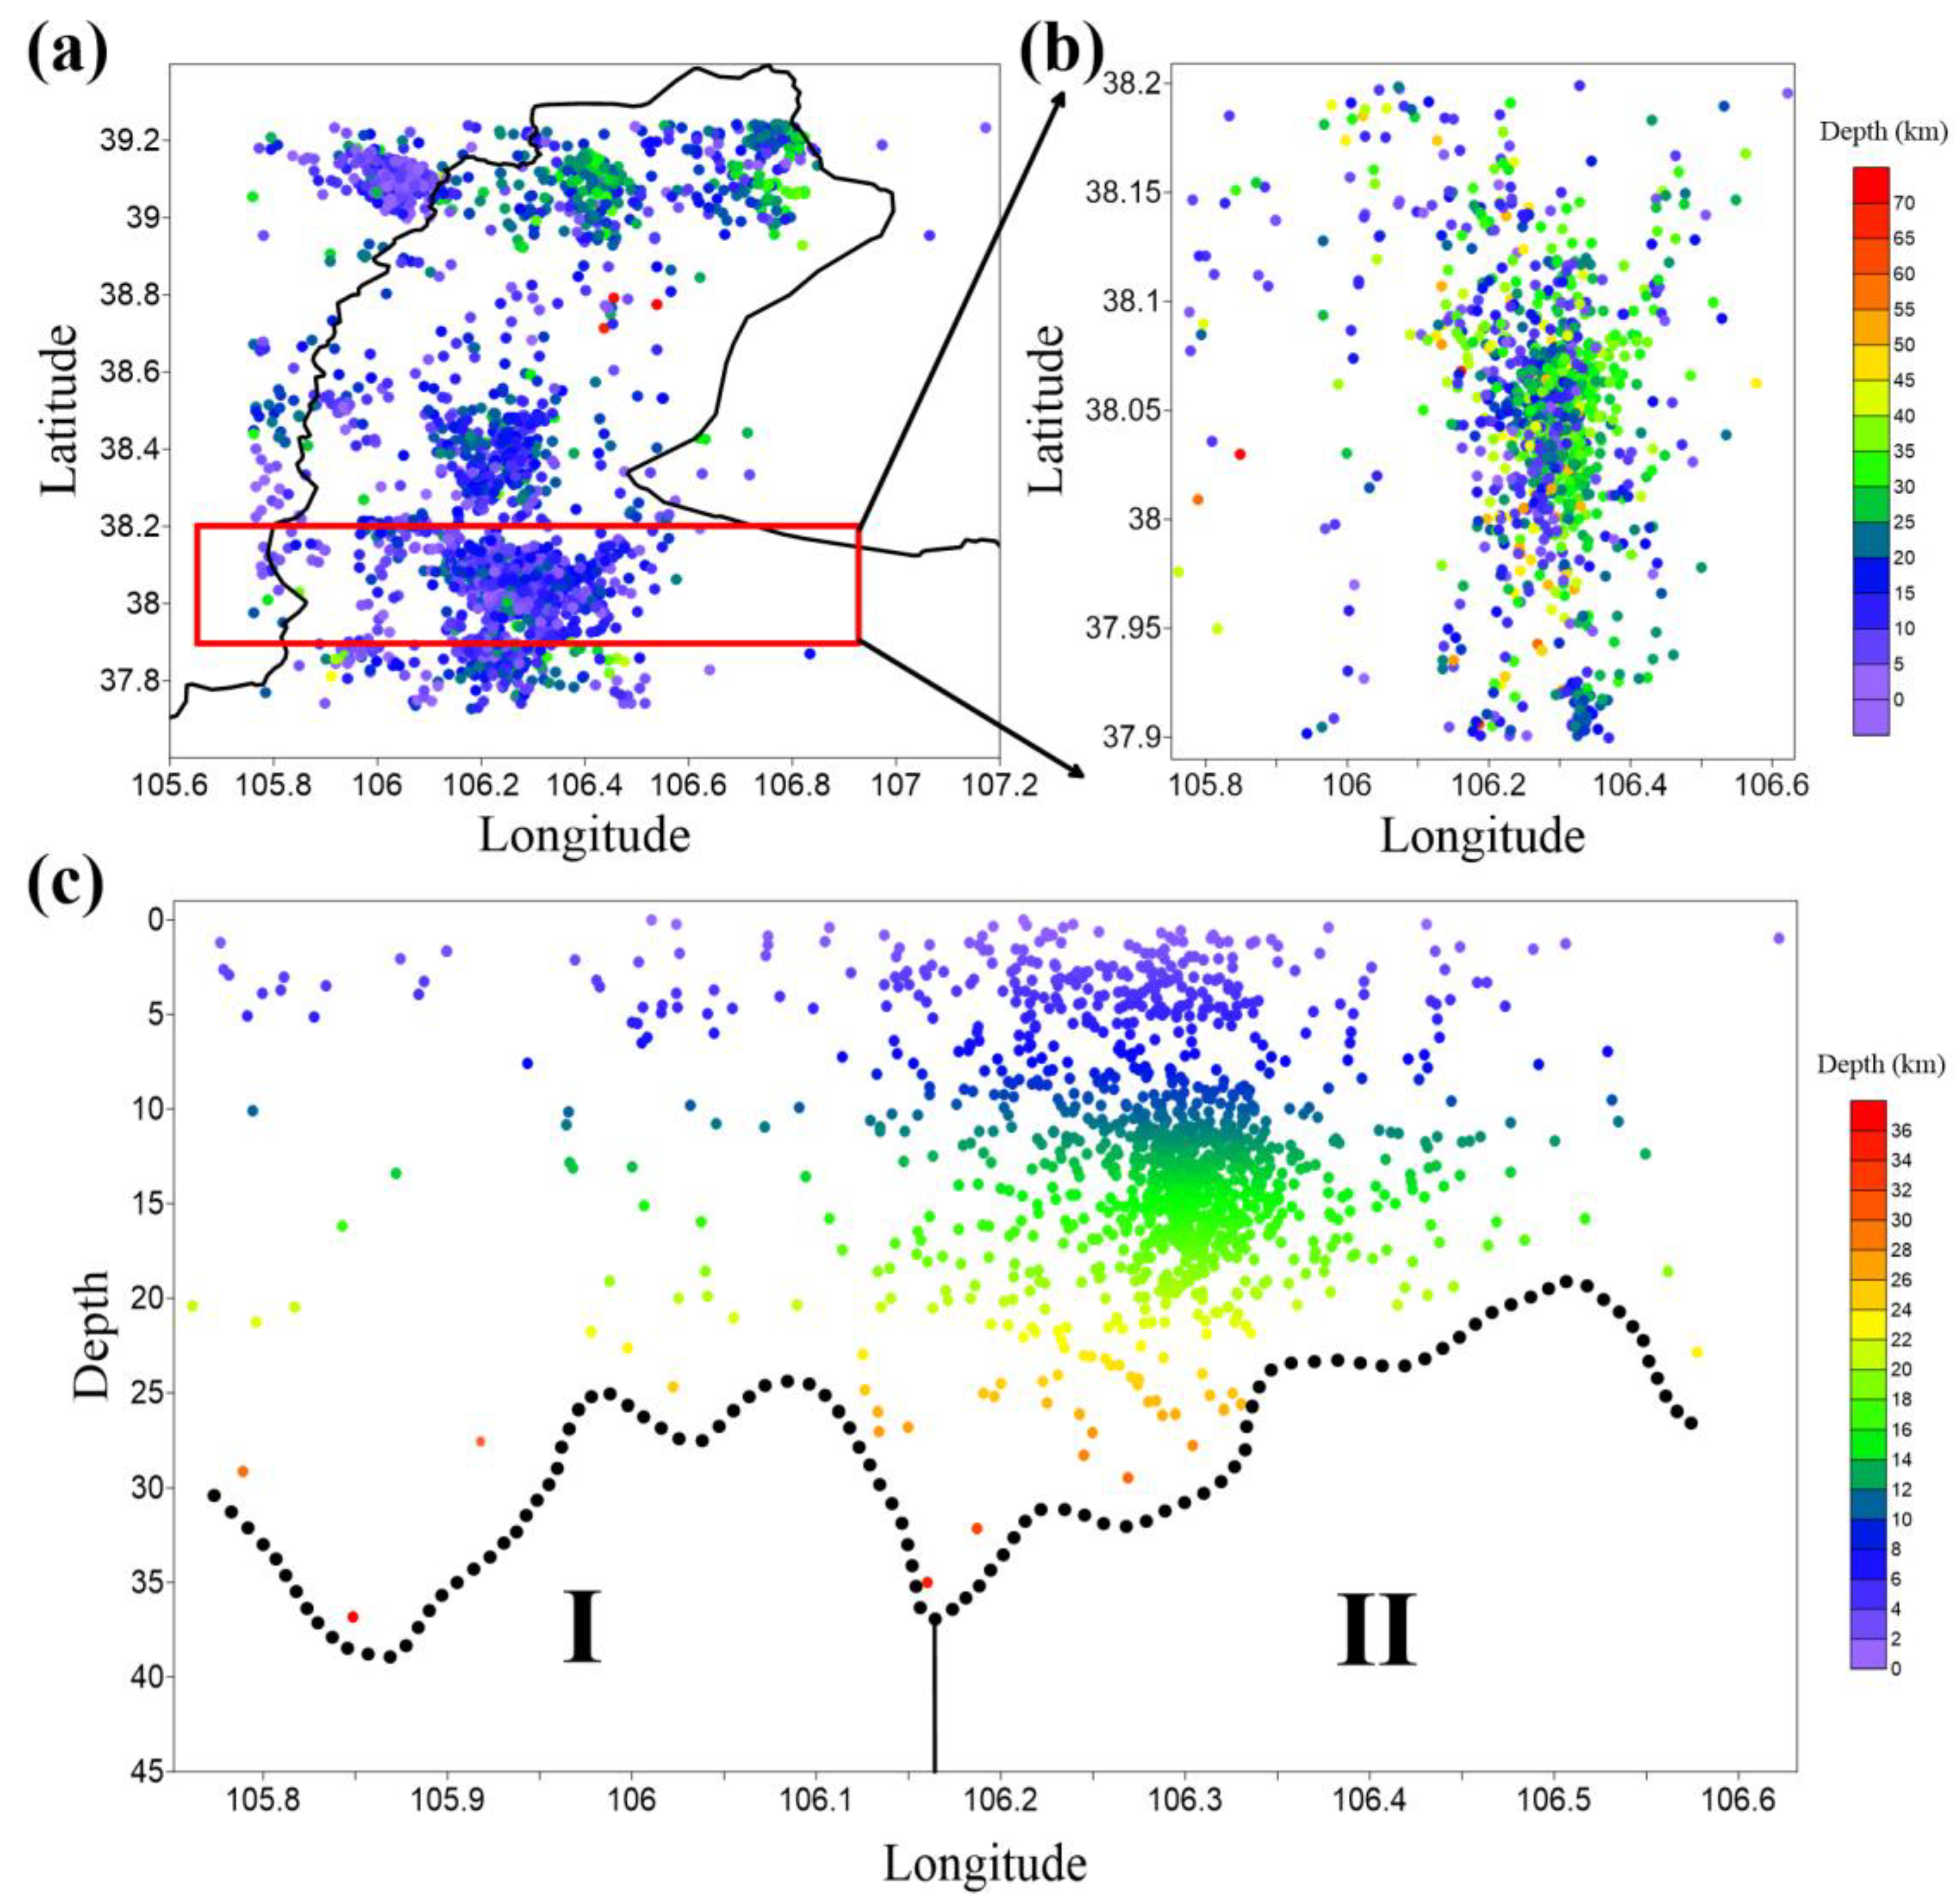
In order to study the edge of the deep stable structure in the study area, we collected and imaged the distribution of earthquake sources, as shown in
Figure 4. It can be found in
Figure 4a, that the weak earthquake epicenters in the basin are very dense in Lingwu and its south, forming a north-south seismic belt with a length of about 50 km and a width of about 30 km. The belt crosses the graben boundary eastward and affects the western edge of Ordos block. The weak seismic activities in the north section are roughly shown as an NNE trending belt. The activities are denser in the area from Yongning to Yinchuan, and are sparser in the area from Yinchuan to Pingluo. To the north of Pingluo, the epicenters of the weak earthquake is presented in a wide east-west belt.
4.2. The Distribution of Earthquake Epicenters and Deep Lithosphere Activities
According to the statistical results of focal depths obtained by the precise positioning of earthquakes in Lingwu-Wuzhong area (
Figure 4), the earthquake sources are distributed within the range of 10–33 km depth. The focal depth of 10–25 km accounts for the majority (>75%) and forms a dense layer, while depths of less than 5 km and more than 30 km account for very few. From 1970 to 1988, five earthquakes of magnitude 5 occurred in Wuzhong and Lingwu areas, with the focal depth of 14–24 km. In addition, calculated from isoseismal lines, the Yinchuan-Pingluo Ms 8 earthquake in 1739 had a focal depth of 24 km [
39]. Based on the above results, it can be seen that the dominant depth of earthquakes in this region is from 10 to 25 km.
For the entire study area contains several geological unit, we selected the earthquake sources distributed in the geothermal potential region and mapped a separate figure, as illustrated in
Figure 4b. The vertical perspective profile in
Figure 4c is imaged on the basis of
Figure 4b.
Figure 4c shows that the profile is divided into two areas (I and II) in terms of focal depth and seismic concentration rate. In Area I, the focal depth to the west of Wuzhong reaches 38 km. When the edge of event points (the black dotted line) is outlined and regarded as the edge of a stable structure, there is a clear difference in the areas where that stable structure extends into the crust. With reference to the Moho interface [
40], these seismic events may even occur in the mantle (below the Moho interface). Geothermal conditions of stable structures in the lower crust may be affected by mantle flow in the form of conduction. Changes in both Moho stable structure and in-situ structure may lead to local geothermal anomaly.
5. Three-Dimensional Inversion of Regional Gravity Data and Deep Structure
The gravity exploration method is mainly used to solve the actual geological problems by the density difference of the underground geological body, and has advantages such as good economy and wide detection range. In recent years, it has been widely applied in the field of geothermal exploration, such as the identification of geothermal prospect areas [
41,
42]. With the development of computer technology and inversion technology, 3D density inversion has gradually become one of the important means to build the distribution of underground density in the study area. In this section, we measured the gravity data of Yinchuan Plain. After that, 3D density inversion was carried out to obtain the distribution of underground density in the study area and further explain the geothermal formation mechanism of Yinchuan Plain.
5.1. Basic Principle of 3D Inversion
The 3D inversion of gravity and magnetic physical properties requires a grid division of the underground space. Firstly, the underground space is divided into M cubes with regular shape. Assuming that there are N observation points on the ground, the relationship of physical property between the observation data and the underground medium meets the following equation [
43,
44]:
In the above formula, d represents the ground observation data, and is a column vector with N elements; m is the physical parameters of the underground medium space, it can be density, magnetic susceptibility or magnetization in the potential field; A is the kernel function, which is the forward operator derived from forward modeling. The potential field observation data and physical parameters meet the above linear relationship. The basic form of the objective function required for inversion can be obtained according to the above relationship, as follows:
As the form of this objective function is not robust, it is necessary to add corresponding model constraints. According to Tikhonov regularization, the objective function can be rewritten as follows:
As the kernel function matrix decays faster with the increase of depth, the inversion results are faced with serious skin effect and need to add the depth weighting function, which is in the following form [
45]:
The objective function can be written as follows:
The conjugate gradient algorithm is used to solve the objective function.
5.2. Three-Dimensional Inversion Results
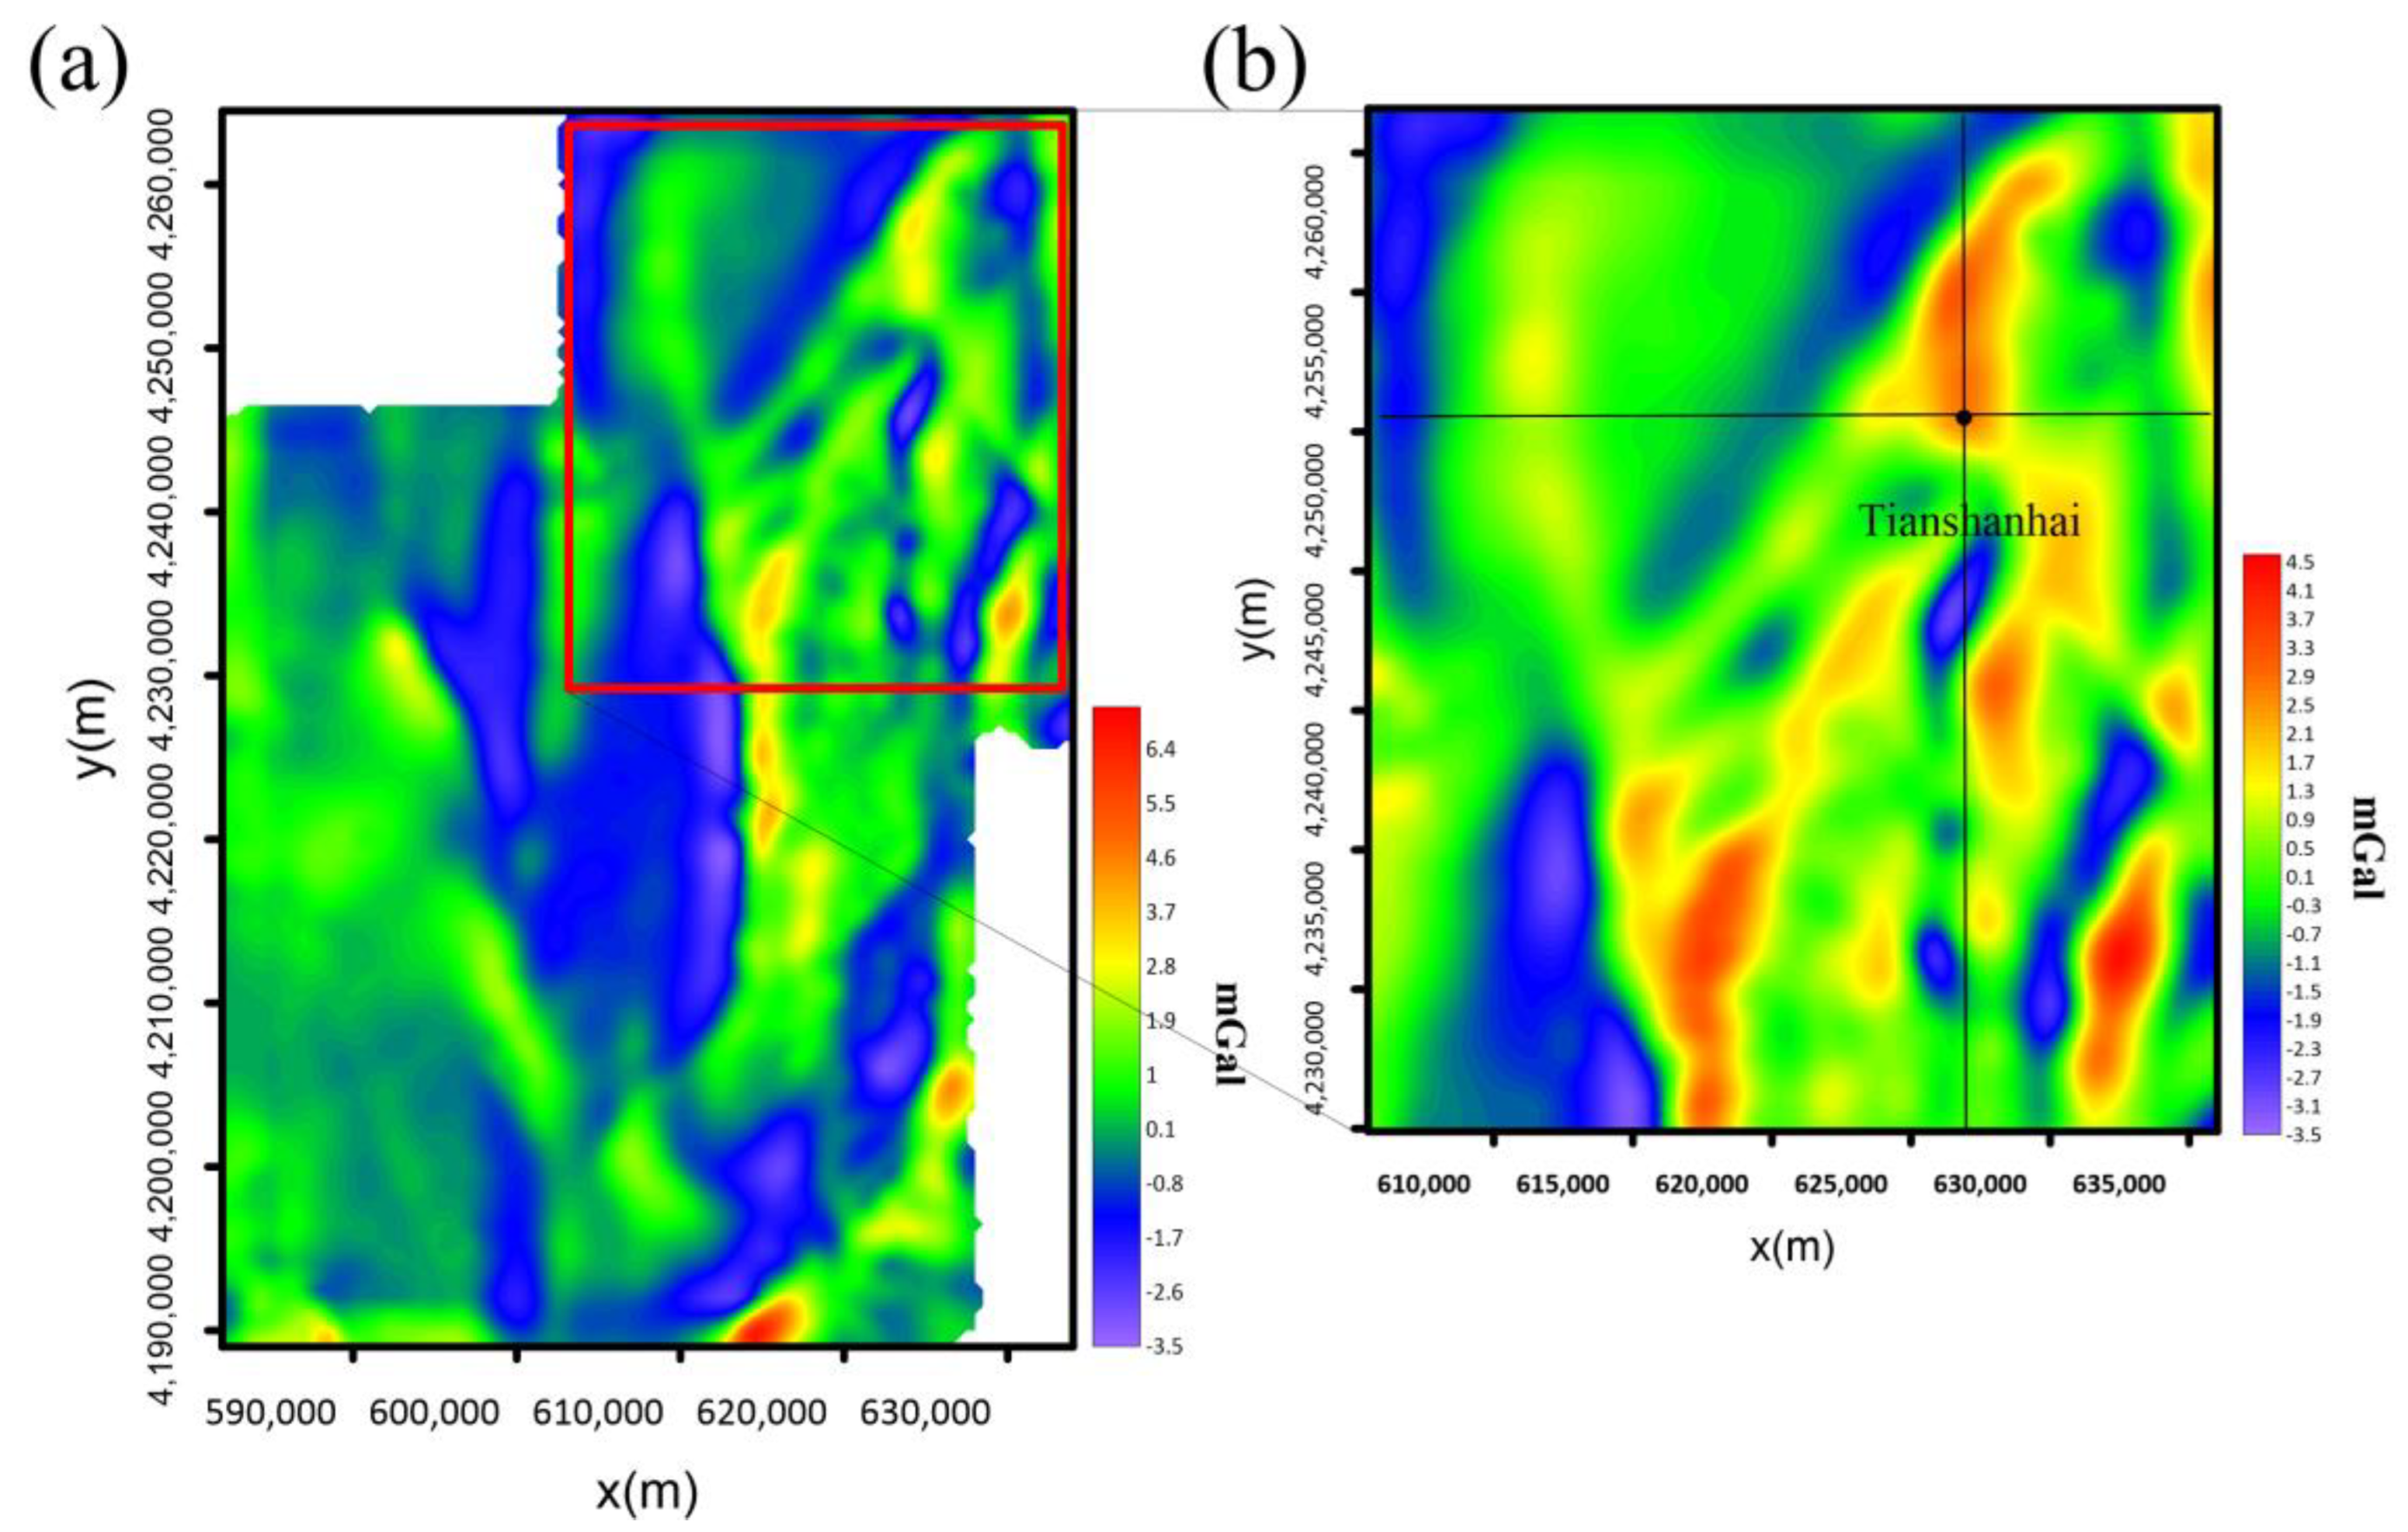
The study area is shown in
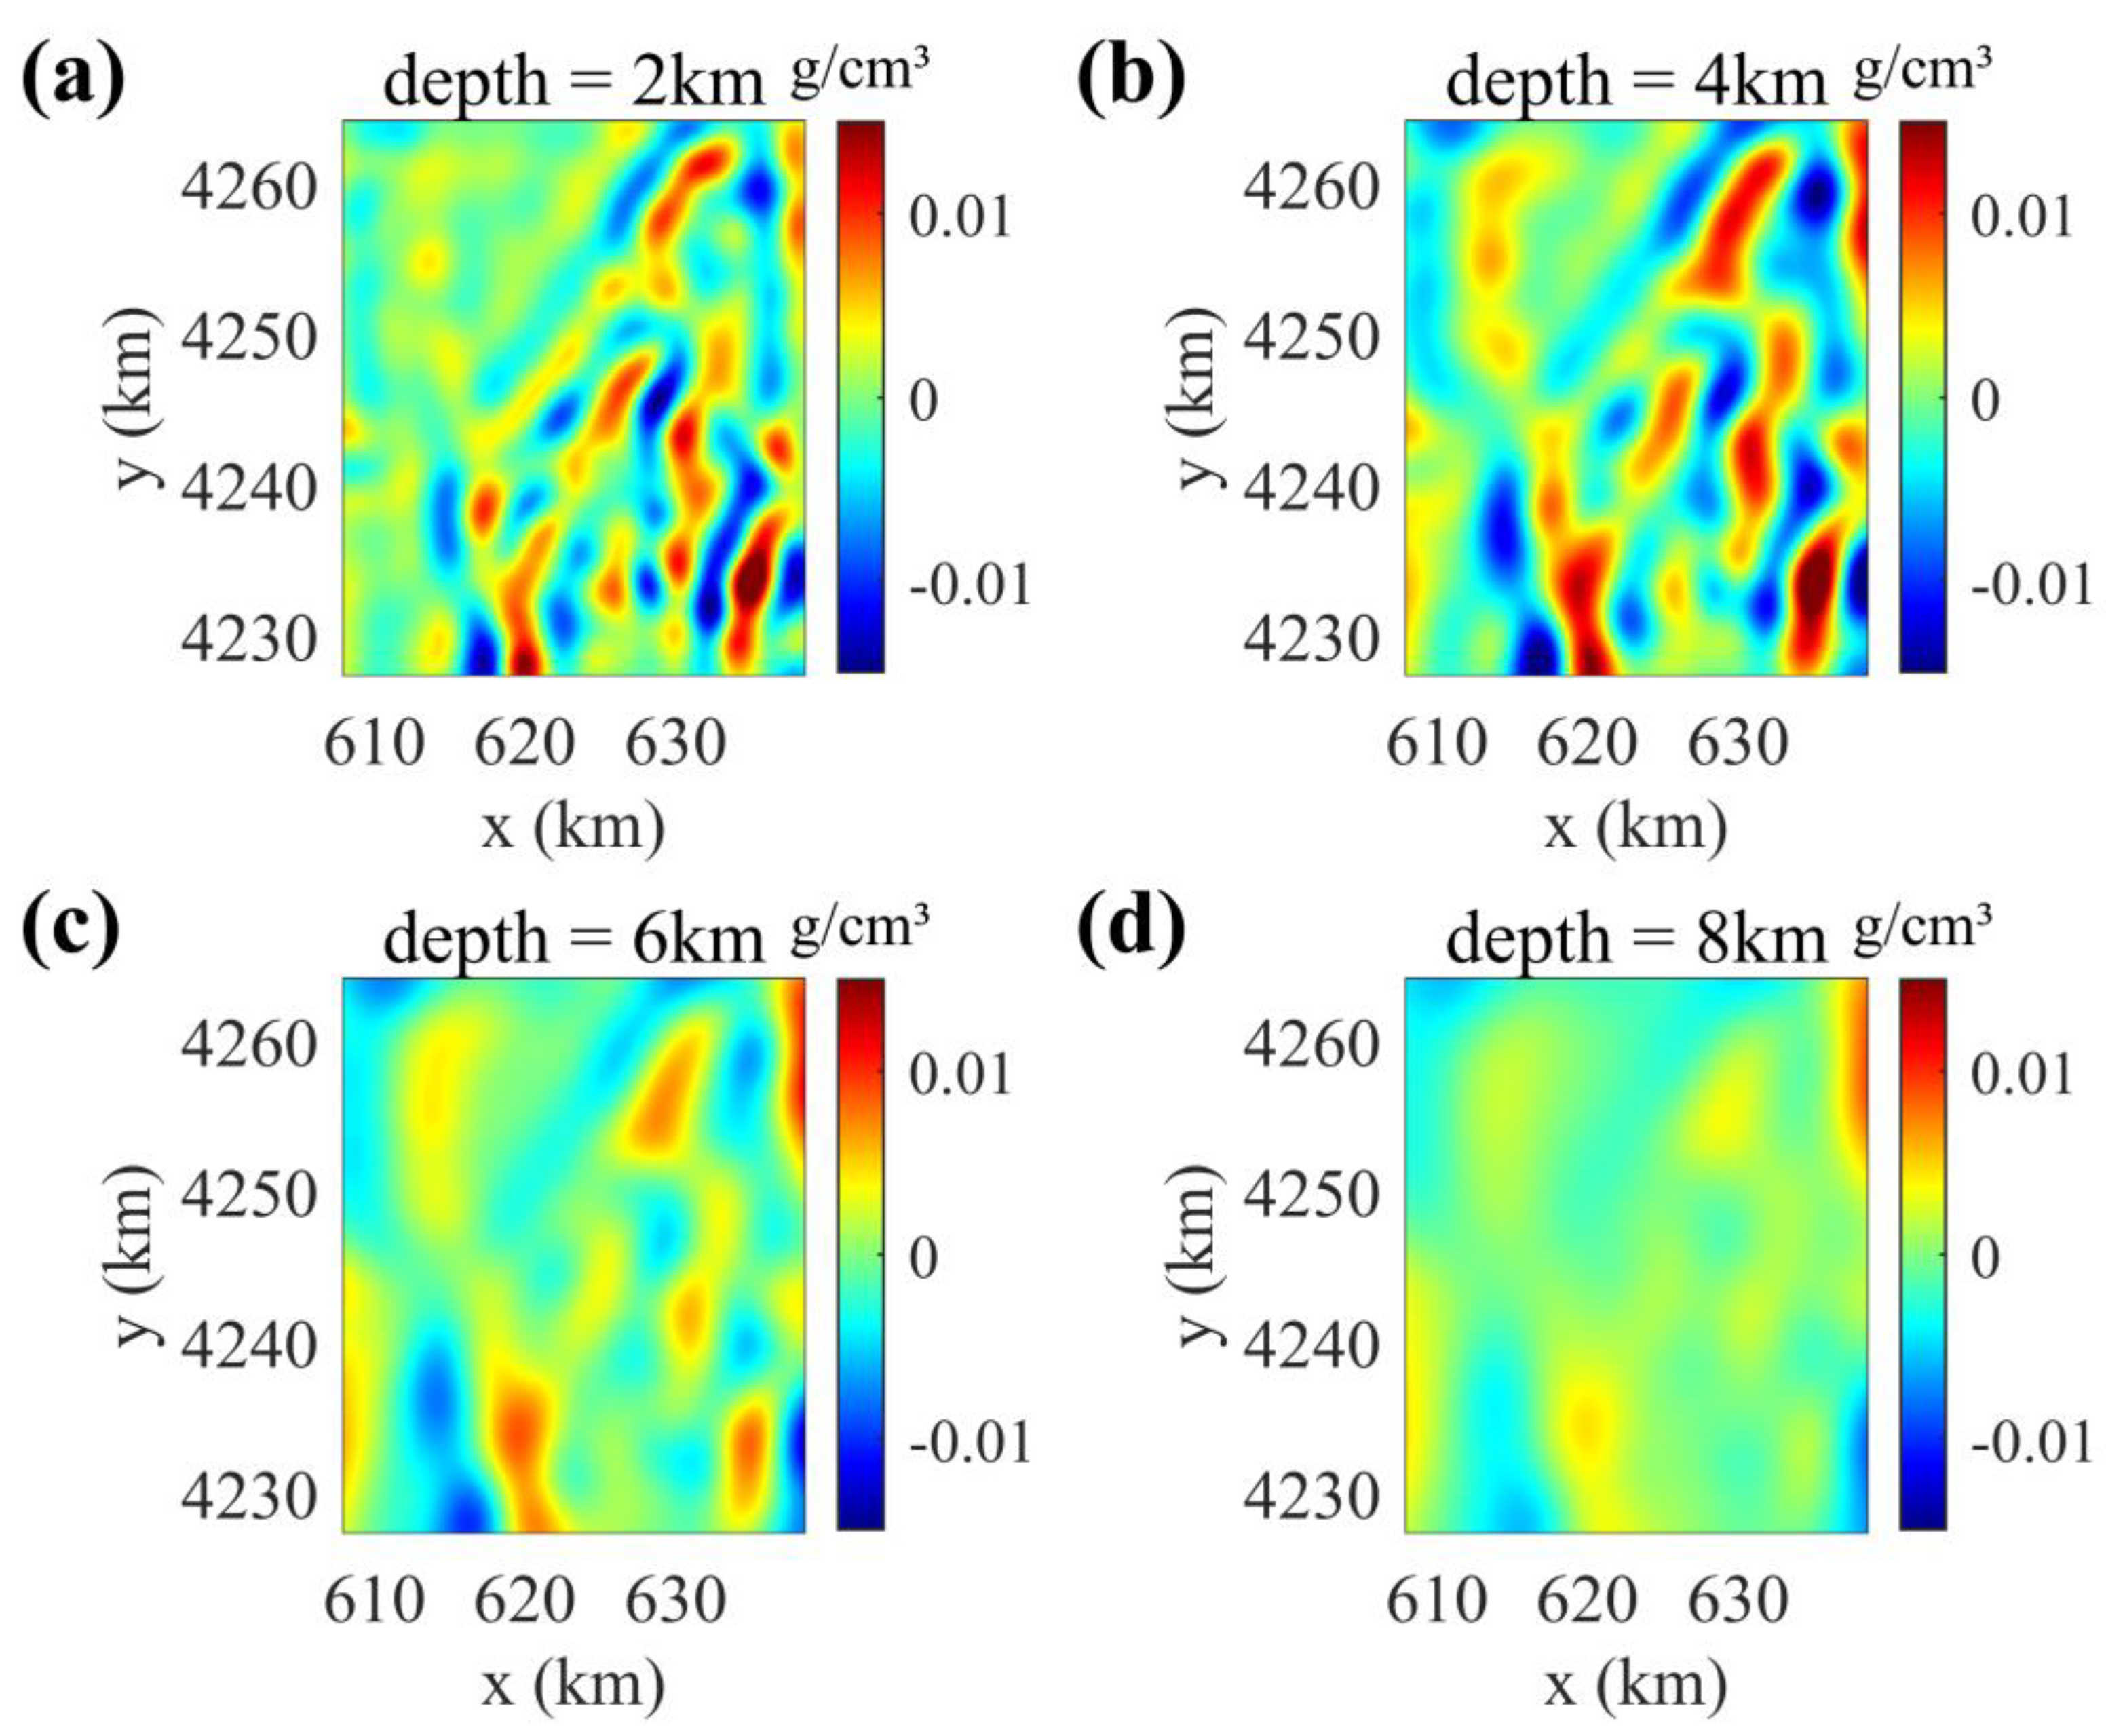
Figure 5. The inversion is carried out in Cartesian coordinates. The positive directions of x, y, z are set as north, east, and depth, respectively. The whole space range is 30,537 m × 36,696 m × 20,000 m. It is divided into 82 × 89 × 20 grids with the interval of 377 m, 417 m, and 1000 m in the directions of x, y, z, respectively. The horizontal section of the inversion results is shown in
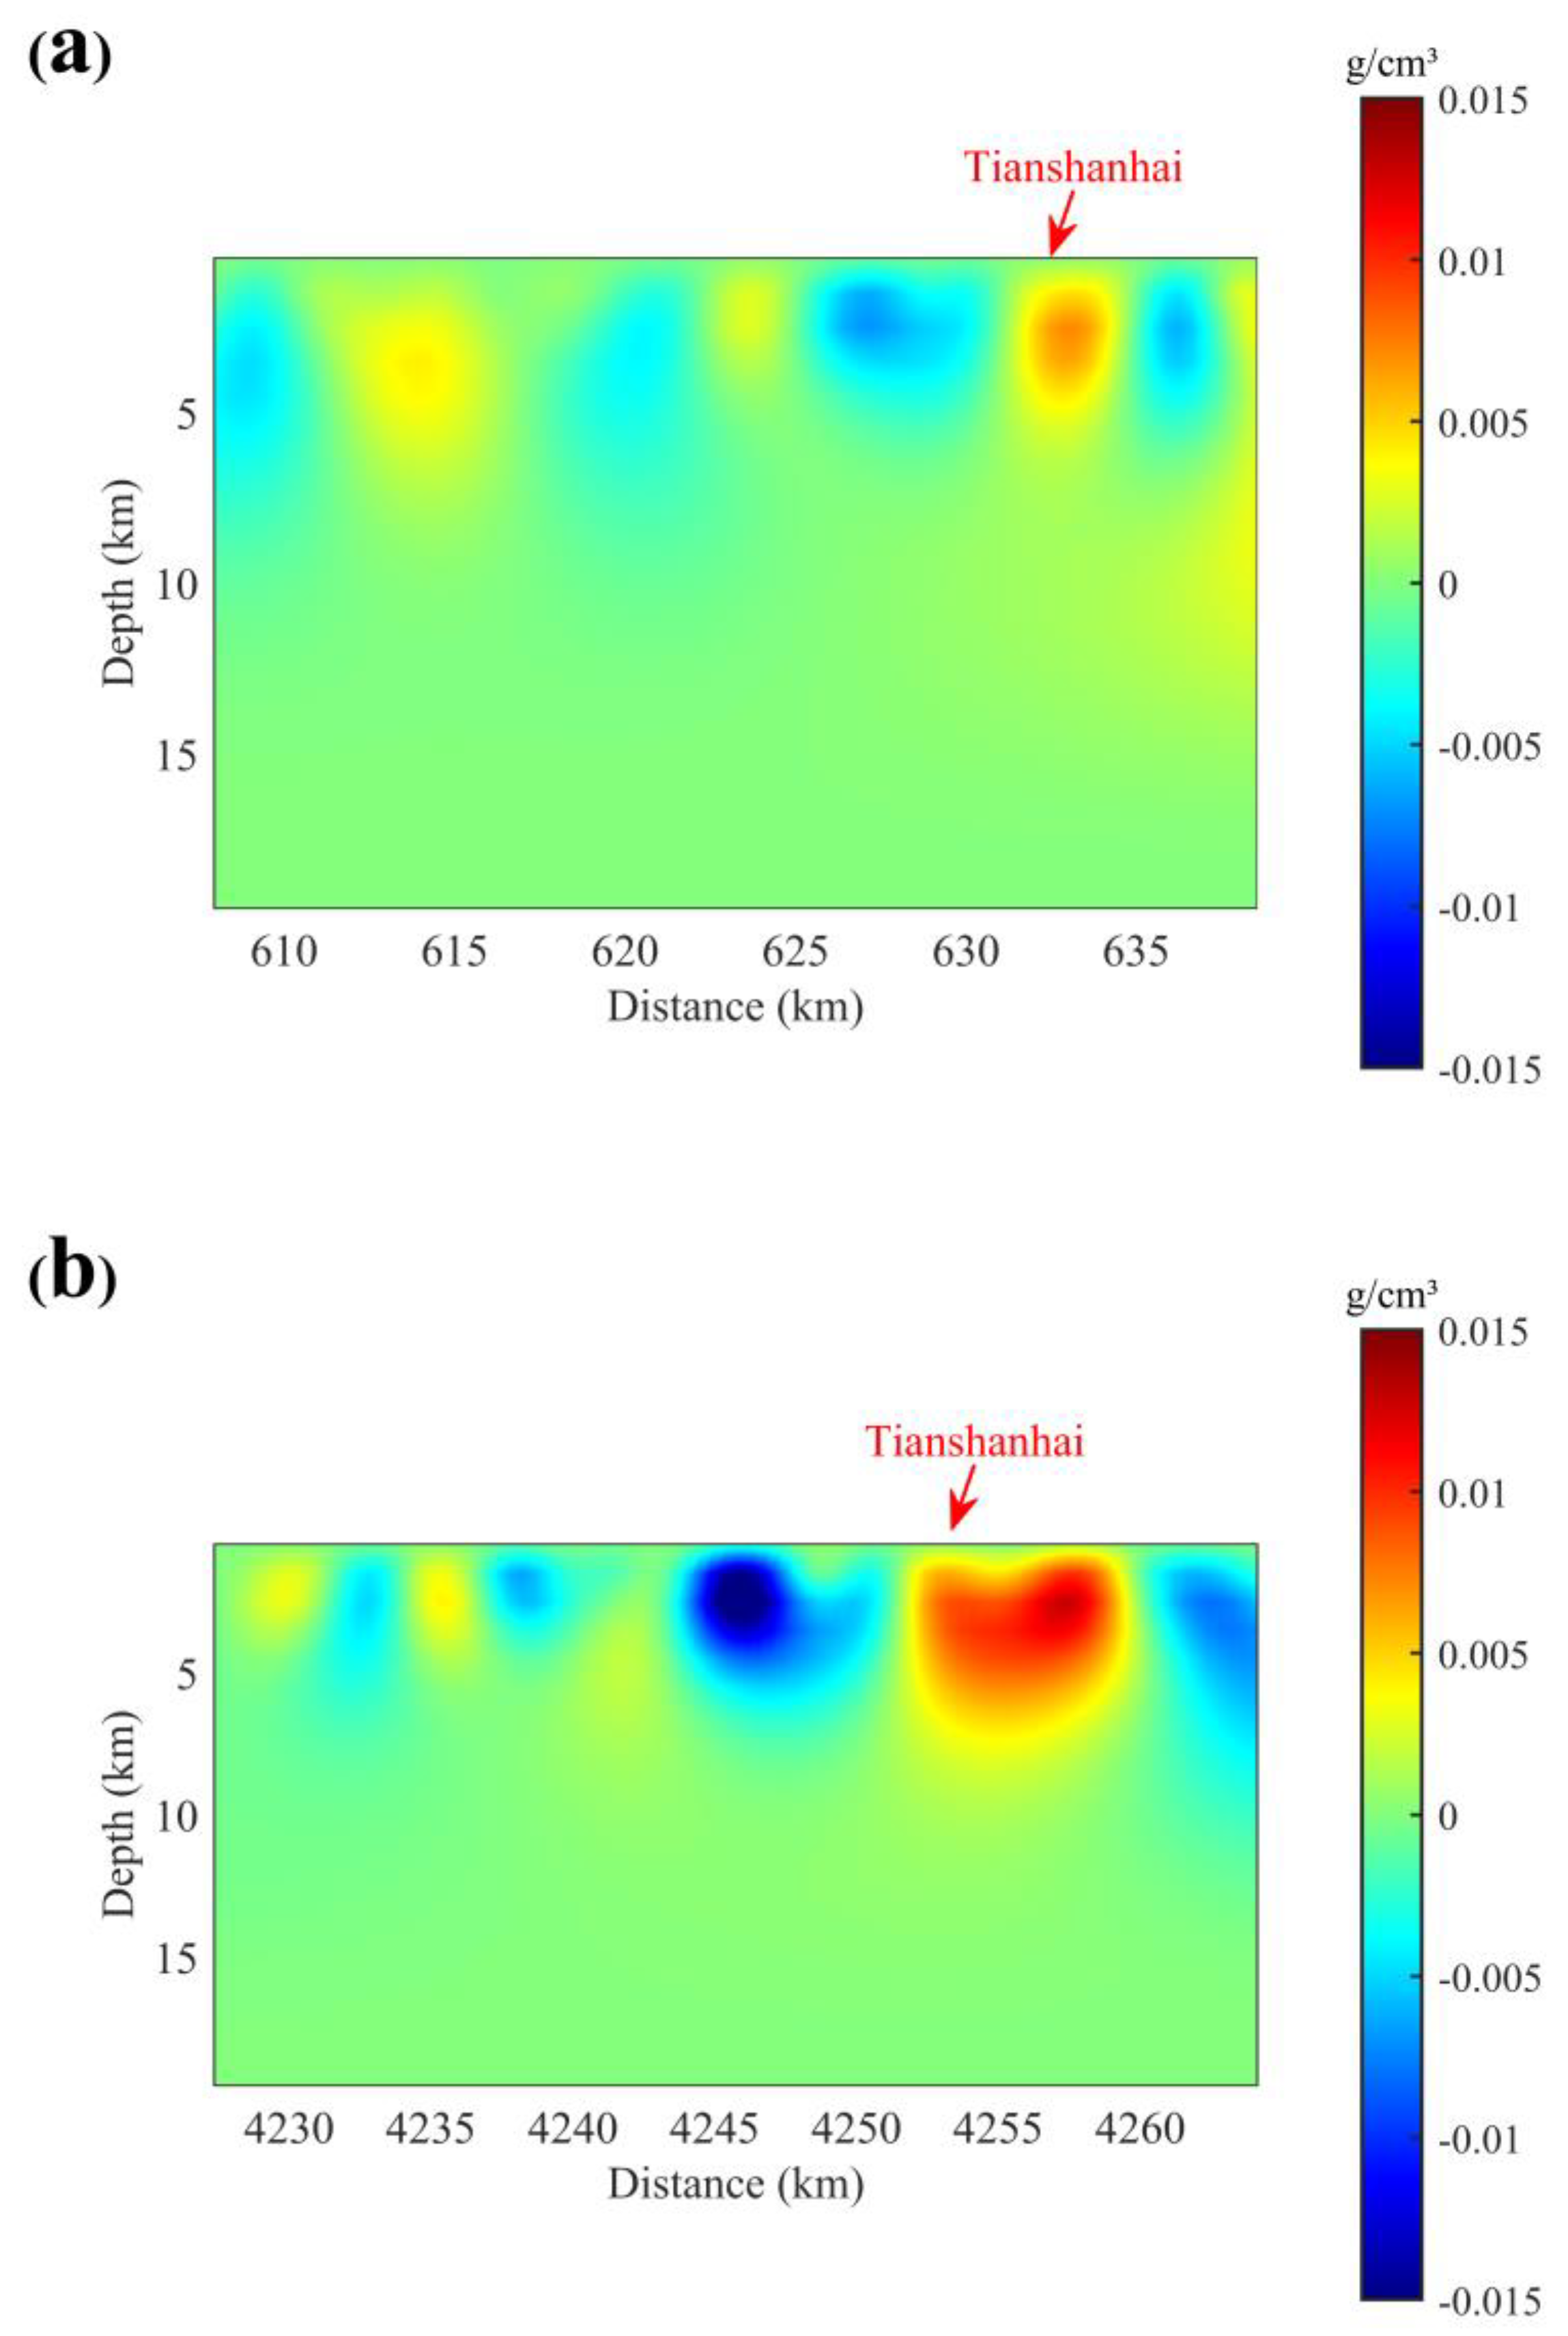
Figure 6, and sections crossing the Tianshanhai area in the directions of north-south and east-west are shown in
Figure 7.
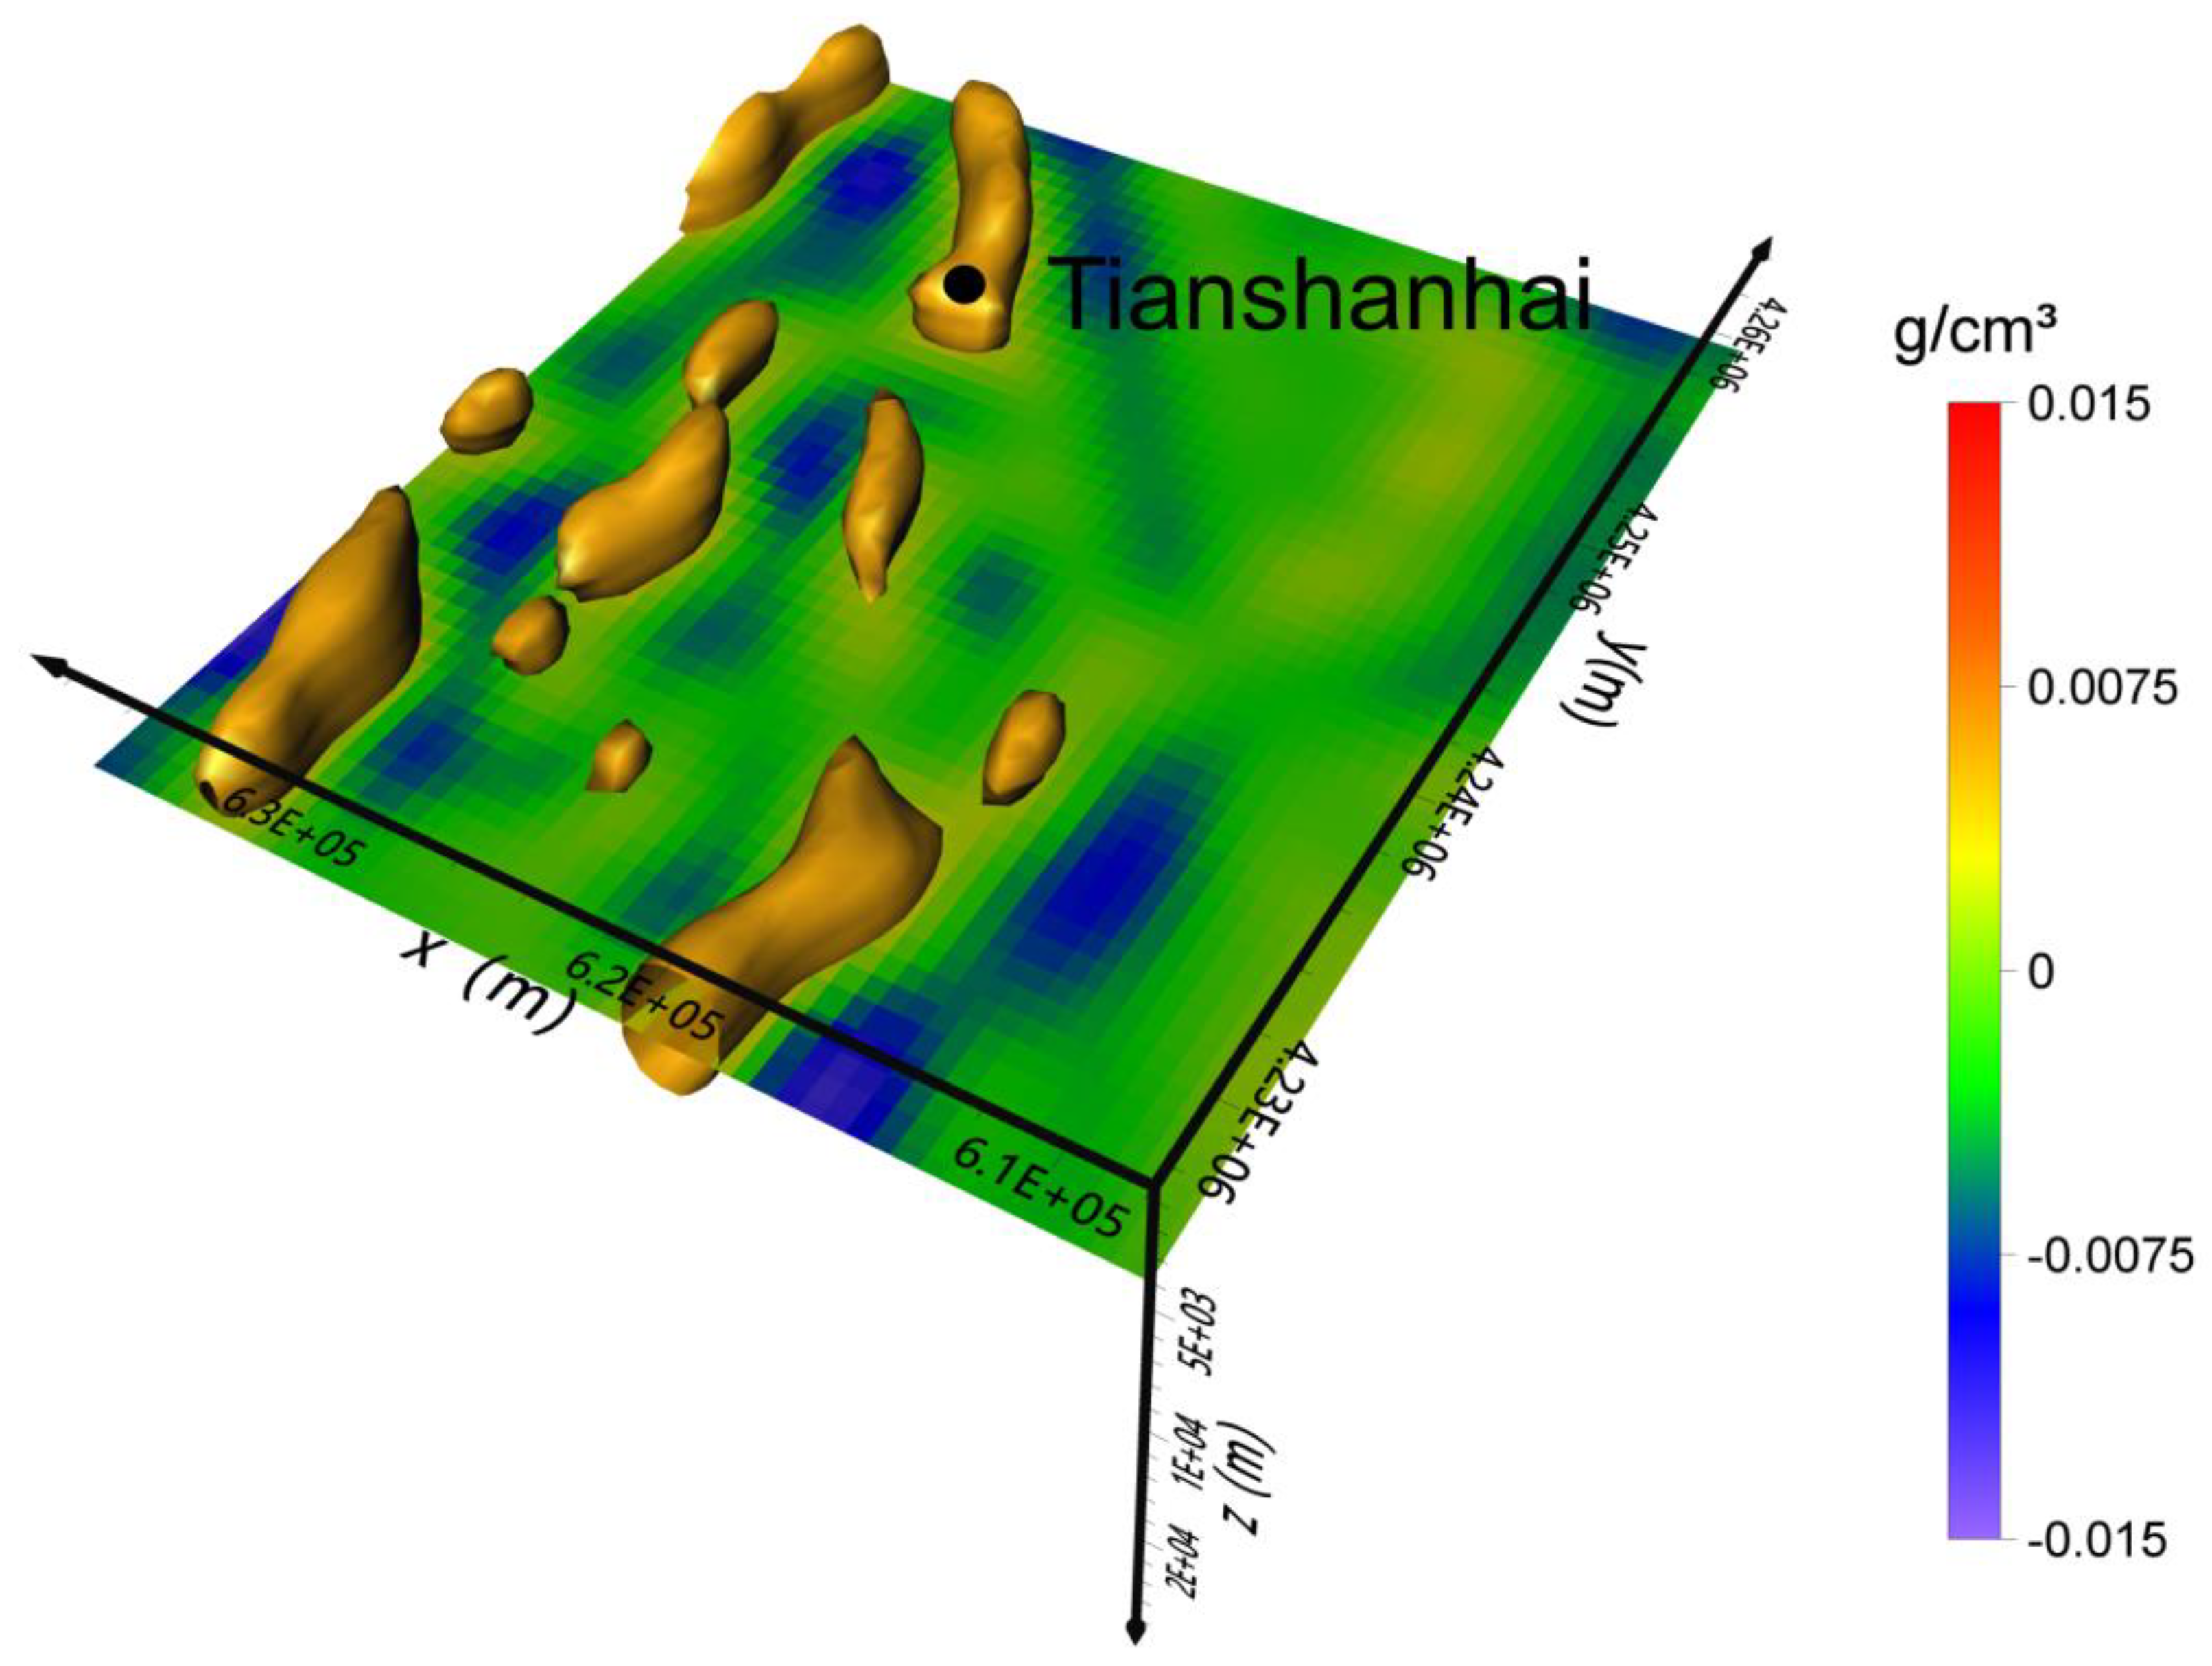
It can be found from the figures that the Tianshanhai World geothermal well corresponds to local high gravity anomaly.
Figure 8 shows the spatial distribution anomaly diagram of geologic bodies with relative densities above 0.005 g/cm
3. The high gravity anomaly is caused by the uplift of the Ordovician basement (and possibly the uplift of the Tertiary strata). The fault structure controls the depression and uplift of the strata in this area. Along the basement uplift zone, the ground temperature presents obvious high temperature anomaly. There is a clear correspondence between the high temperature anomaly area near the Tianshanhai borehole and the basement uplift area. When the strata in the uplift area have a good thermal reservoir structure, and the overlying thermal insulation strata reach a certain thickness, a geothermal field with development value can be formed. Therefore, in the sedimentary basins without geothermal anomalies on the surface, the basement uplift area is an important clue to find geothermal fields.
The fault and uplift structures of regional tectonic belts and sedimentary basins control the transmission and redistribution of terrestrial heat flow, resulting in the accumulation and dispersion of relatively uniform heat flow from the deep to the shallow crust during the transmission process, forming the high value anomaly of heat flow in local areas. The terrestrial heat flow converges with growing value in the active tectonic belt and basin uplift area, and it dispersed with declining value in the stable platform area and depressed basin area. As a result, more heat can be obtained from the deep strata of the high heat flow area, leading to the local high temperature anomalies in the fault tectonic belt or sedimentary basin uplift area.
6. Regional Geothermal Genesis Model
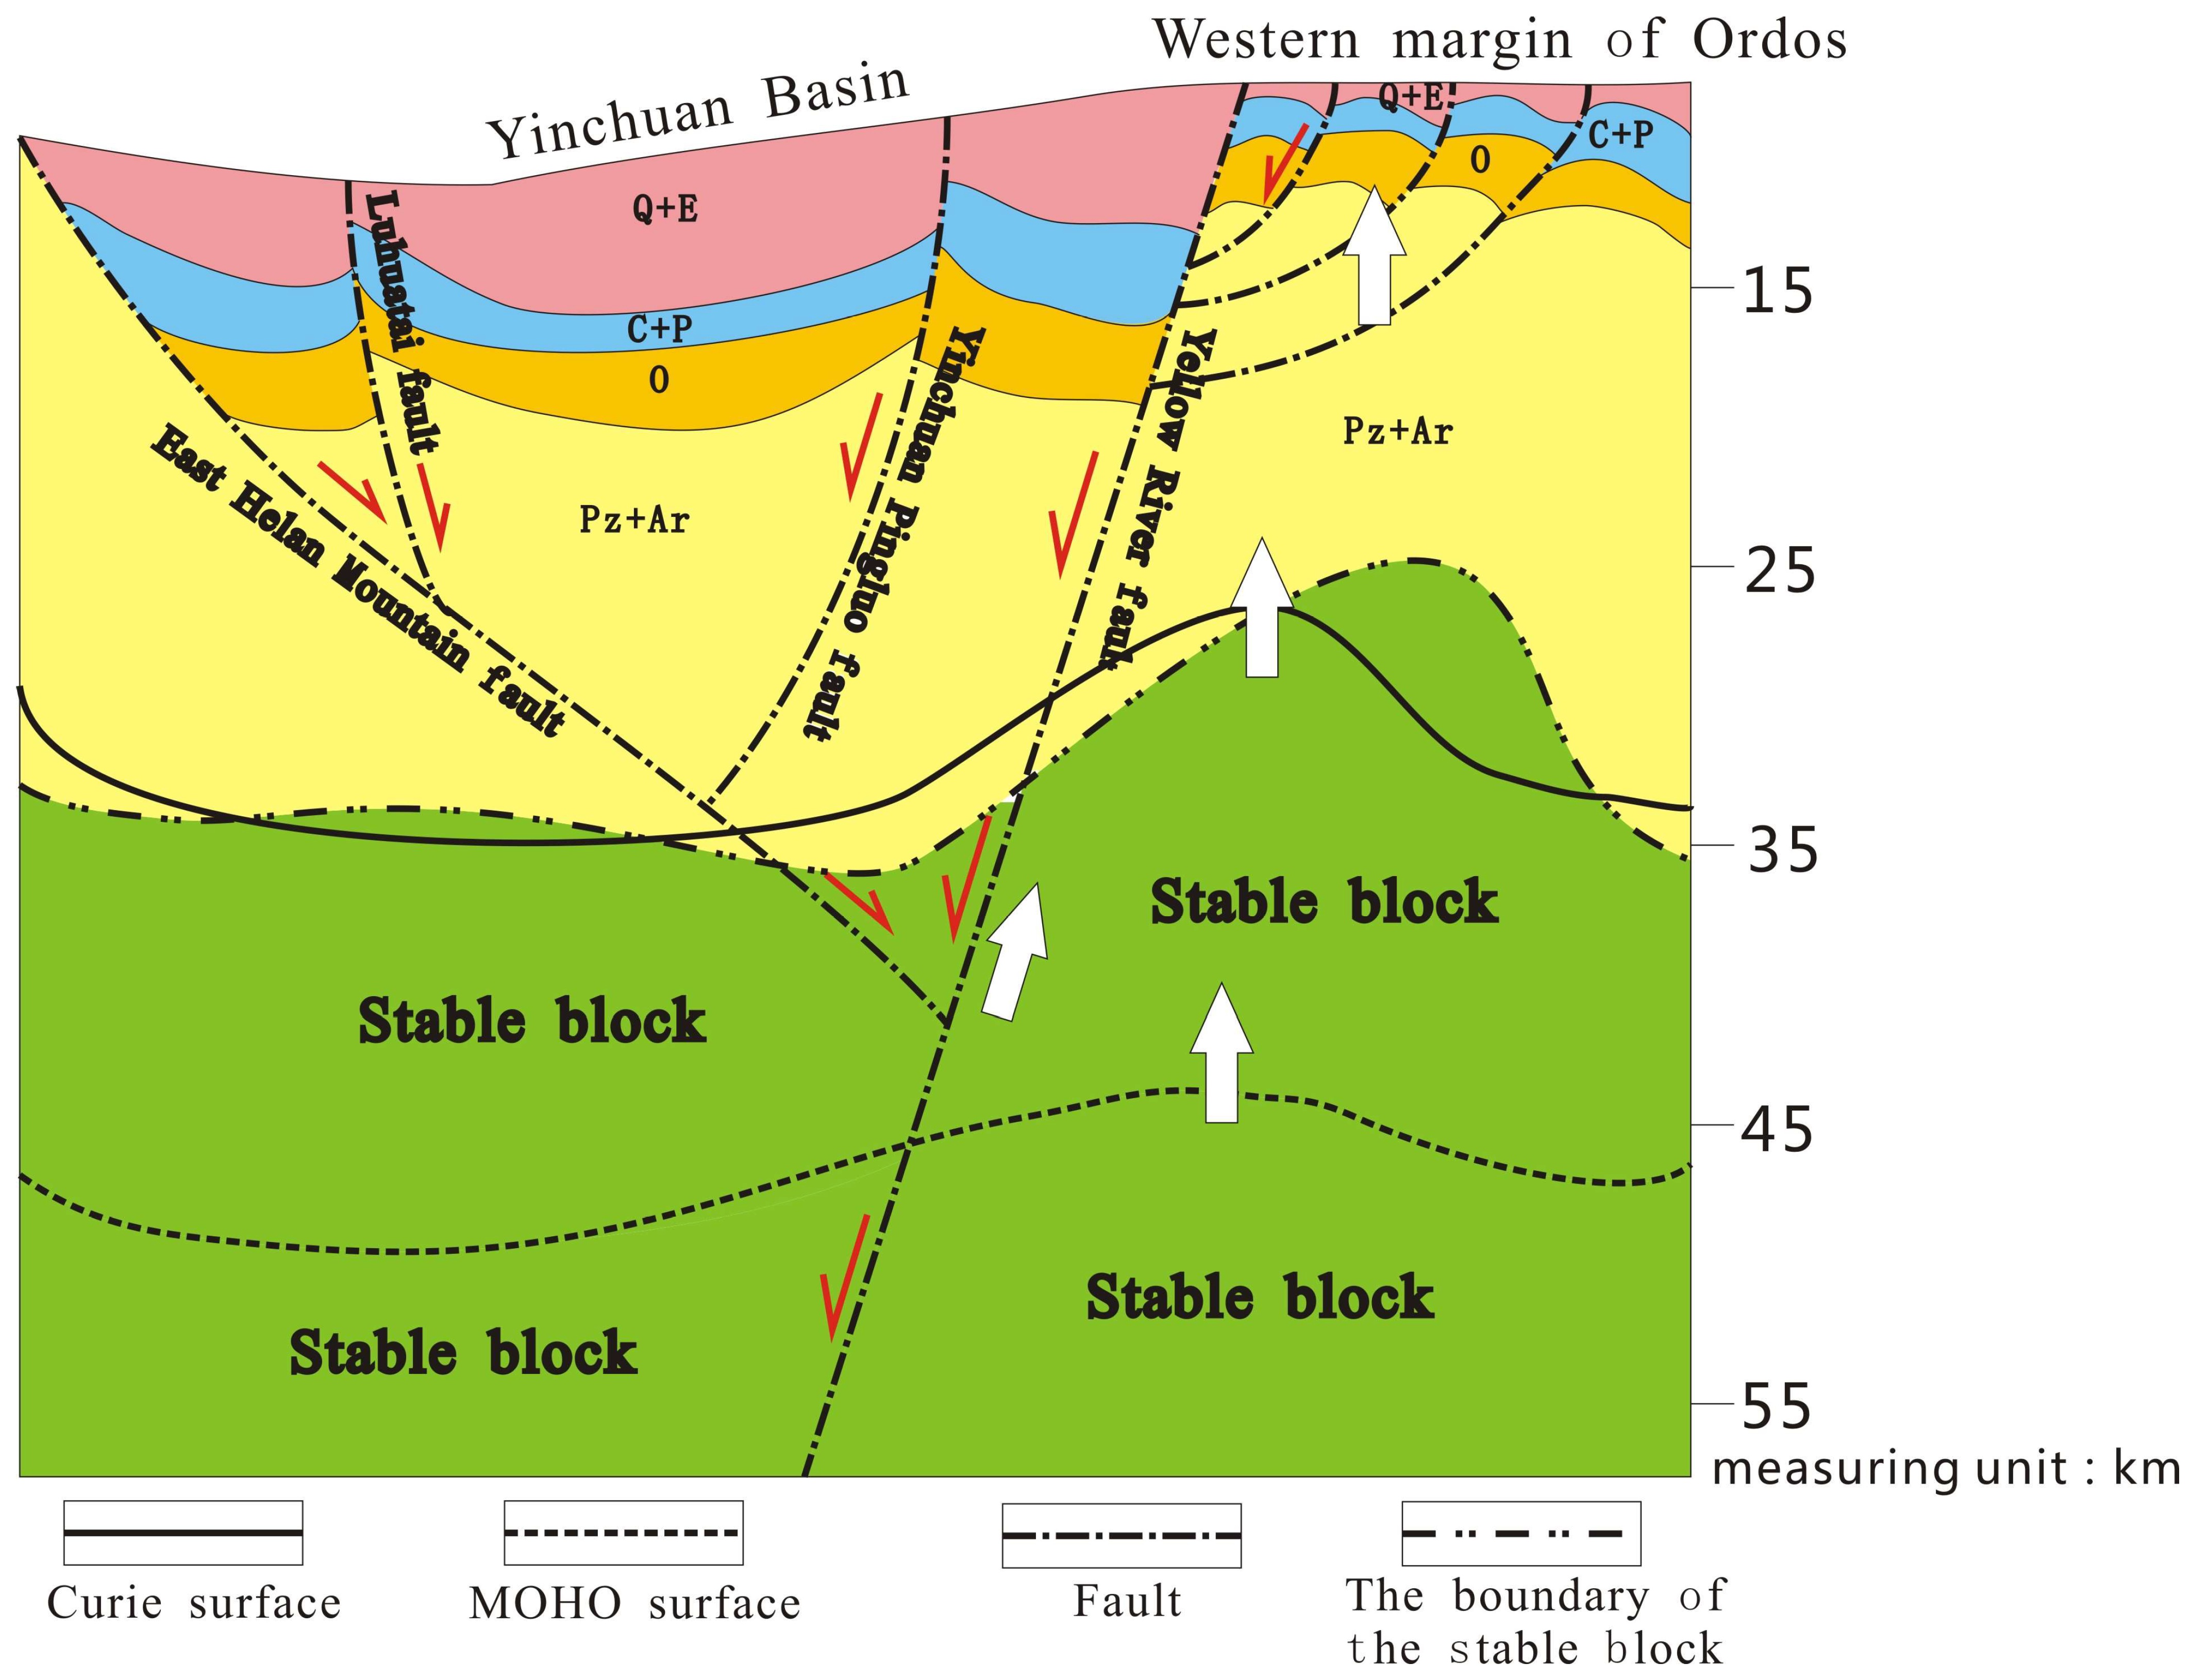
Based on seismic profile, Curie interface inversion, seismic stability interface and 3D density inversion, a model of the western margin of deep Ordos was established, as shown in
Figure 9. At the location of the Yellow River fault, the model displays that the Moho uplifts to about 40 km to the east, and the Curie rises to the shallowest 26 km, which indicates the overall uplift of the basement in this area.
The remote stress field of the Qinghai-Tibet Plateau in the later period placed the area surrounding the Ordos Plateau in an extensional environment, which enabled the upwelling of underground thermal materials and intensified the extension. During the Himalayan period, the main body of the Ordos Basin experienced several tectonic uplift events, and a series of Cenozoic fault basins were developed successively in its adjacent areas. The basement of these basins rose, and the normal faults in the extensional environment provided a channel for the upwelling of thermal materials.
7. Discussion
This area is located in the northern part of the north-south structural belt in China and the fault thrust belt on the western edge of Ordos. This specific tectonic environment has created good conditions of deep heat source in this area. The Yellow River fault is the control boundary on the west side of the study area, extending down into the lower crust and cutting off the Moho interface into the lithospheric mantle. The crustal thickness along the profile is 40–48 km, and the depth of Moho surface gradually increases from east to west. At the lower part of Yinchuan Basin near the Ordos block, the Moho surface appears obviously uplifted, and the Yellow River fault is cut at the highest point of the Moho surface. The deep and large active faults not only control the temperature of geological bodies, but also provide a channel for the upward migration of deep heat flow. The Yellow River fault is an extensional normal fracture, which can form a good heat conduction channel, so that the deep heat source of the earth can move to the shallow part. After being heated by the heat source from terrestrial heat flow, the water is transported to the thermal reservoir through the fault or fissure convection. The deep and large active faults provide a passage for the heat flow to move from the deep to the shallow, and the thermal fluid gathers in the uplift area to form a high geothermal anomaly area. The complete caprock and the thermal reservoir mainly composed of Ordovician limestone provide continuous heat supply, and deep large faults with secondary structures in active period provide migration channels, which make a good geothermal field. The thermal reservoir should preferably be a stratum with many fissures and pores to enrich the hot water, and the pores should have good connectivity, such as Ordovician limestone, so as to facilitate the flow of hot water. In the uplift area, the sedimentary characteristics of the early Ordovician are similar to those of the Cambrian period, and a set of carbonatite-dominated epicontinental sea deposits were developed, with a thickness of nearly a kilometer. In the Ordovician system, there are repeated interbeddings or interlayers of limestone, dolomite, shale in the vertical direction, and the fissure development is mostly filled by calcite, and the developed fissures are mostly filled by calcite. These connected fissures are favorable for the formation and reserve of geothermal water.
Based on the example of Yinchuan Plain, the geothermal genesis of the basin around Ordos is speculated. It is inferred that there should be two large-scale tectonic activities in the whole adjacent basin. The first tectonic activity made the asthenosphere and Moho surface on the side of the Ordos block appear obviously uplifted. Due to the asthenosphere and Moho surface uplift, the deep heat flow upwelled and the high-temperature molten material intruded into the upper crust. As a result, the corresponding area heated up, and partial melting may occur, causing a higher temperature in the deep crust. The second tectonic activity was in the Himalayan period. The main body of the Ordos Basin experienced several tectonic uplifting events, and a series of Cenozoic faulted basins developed in the surrounding areas. The extensional environment provided a channel for the upwelling of thermal materials.
8. Conclusions
Based on the gravity, magnetic, and seismic data, the study adopted multiple geophysical data processing and inversion methods to conduct a multi-scale comprehensive study on the deep rock structure (including the distribution of Moho surface, Curie surface, and the lower interface of Cenozoic strata), regional block activity, and deep structures in the study area, and a multi-scale model of geothermal geology and geophysics in the study area was established.
The deep seismic reflection profile shows that the asthenosphere and Moho surface on the side close to the Ordos block are gradually uplifted, reaching 40 km near the Yellow River fault. The inversion of aeromagnetic anomaly interface shows that the Curie isotherm surface is uplifted in the Yinchuan Plain and causes a large isotherm gradient. By analyzing and utilizing the regional focal depth and seismic concentration rate to study the block activity, it is found that some of the focal points are located below the Moho surface, i.e., the mantle area. It is inferred that the local geothermal anomaly in the study area is related to the structural instability of Moho surface. The density structure of typical geothermal areas is studied by 3D gravity inversion. The inversion density distribution reveals that there is a good corresponding relationship between the known high temperature anomaly area and the inverted high-density body, which means that the local uplift area of basement in Yinchuan Basin is an important indicator for geothermal exploration.
Finally, we established a multi-scale model of geothermal geology-geophysics based on the physical structure of the deep earth with different depths and different physical attributes obtained from inversion calculation. Geophysical evidence shows that the Yellow River fault is an important heat-controlling fault in the study area, rising with the asthenosphere and Moho surface in the western margin of Ordos Basin. Under the background of regional extension and basin base uplift, a high-temperature melt was formed. In the late tectonic movement, the normal faults provided hot materials with the conduction channel, and the hot material energy was gathered and transferred in the local uplift area of the fault basin, finally resulting in the surface water thermal anomaly after circulating with the shallow water. Therefore, the spatial distribution system of the Yellow River fault and the local uplift of the basin provide the direction for further heat exploration in the study area.
Author Contributions
Conceptualization, B.A. and Z.Z.; methodology, B.A. and J.Z.; software, B.A.; validation, B.A. and B.S.; formal analysis, B.A.; investigation, B.A. and Y.B.; resources, B.A. and Z.Z.; data curation, B.A. and Z.Y.; writing—original draft preparation, B.A. and B.S.; writing—review and editing, B.A. and J.Y.; visualization, B.A.; supervision, Z.Z. and Y.B.; project administration, Z.Z.; funding acquisition, Z.Z. All authors have read and agreed to the published version of the manuscript.
Funding
This research was funded by the National Science Foundation of China (grant number: 42074119) and Natural Science Foundation of Ningxia (Outstanding Youth Project) (grant number: 2023A0885).
Data Availability Statement
Not applicable.
Acknowledgments
The authors would like to thank the editors and reviewers for providing their valuable comments and suggestions.
Conflicts of Interest
The authors declare no conflict of interest.
References
- Bekesi, E.; Struijk, M.; Bonte, D.; Veldkamp, H.; Limberger, J.; Fokker, P.A.; Vrijlandt, M.; van Wees, J.D. An updated geothermal model of the Dutch subsurface based on inversion of temperature data. Geothermics 2020, 88, 101880. [Google Scholar] [CrossRef]
- Zeng, Z.F.; Chen, X.; Li, J.; Li, T.L.; Zhang, L.H. Advancement of geothermal geophysics exploration. Prog. Geophys. 2012, 27, 168–178. (In Chinese) [Google Scholar]
- Chen, X.J.; Hu, X.J.; Li, N.S.; Wu, Y.; Cheng, G.Q.; Ni, P.; Cao, Y.Y.; Bu, J.B. A discussion on geothermal accumulation model on the eastern margin of Yinchuan Basin. Geophys. Geochem. Explor. 2021, 45, 583–589. (In Chinese) [Google Scholar]
- Zhao, C.B.; Fang, S.M.; Liu, B.J.; Ji, J.F.; Feng, S.Y.; Guo, X.J.; Li, J.C.; Qin, X.Y. Experiment on fault tectonics with deep seismic reflection detection in Yinchuan Basin. J. Geod. Geodyn. 2009, 29, 33–38. (In Chinese) [Google Scholar]
- Feng, S.Y.; Gao, R.; Long, C.X.; Fang, S.M.; Zhao, C.B.; Kou, K.P.; Tan, Y.L.; He, H.Y. The compressive stress field of Yinchuan garben: Deep seismic reflection profile. Chin. J. Geophys. 2011, 54, 692–697. [Google Scholar]
- Zhang, P.; Li, L.M.; Liu, J.D.; Xu, H.G.; Li, J.L.; Gu, Q.P.; Jiang, X. Research on the characteristics of quaternary activities of feihuanghe fault in Xuzhou area. Dizhen Dizhi 2015, 37, 208–221. [Google Scholar]
- Li, Y.; Liu, B.J.; Feng, S.Y.; Ji, J.F.; Qin, J.J.; Guo, X.J. Exploration of shallow structure and buried faults in the Yinchuan basin using seismic refraction and reflection data. Chin. J. Geophys. 2017, 60, 3096–3109. [Google Scholar]
- Liu, L.; Jiang, F.Y.; Zhu, L.Y. Analysis of horizontal movement and seismicity in Yinchuan Basin. J. Geod. Geodyn. 2018, 38, 36–42. (In Chinese) [Google Scholar]
- Bao, G.D.; Chen, H.; Hu, J.M.; Zhu, G.F. Quaternary activity and segmentation of the Yellow River Fault of the eastern margin of Yinchuan Graben. Acta Geosci. Sin. 2019, 40, 614–628. (In Chinese) [Google Scholar]
- Zhu, X.H. Application of Magnetotelluric in Exploration of Active Fault Zone in Yinchuan Basin, Ningxia. Master’s Thesis, China University of Geosciences (Beijing), Beijing, China, 2019. [Google Scholar]
- Chen, X.J.; Hu, X.J.; Li, N.S.; An, B.Z.; Bai, Y.D. Research on the deep geological structure in Yinchuan Plain: 3D modeling based on geophysical data. Geophys. Geochem. Explor. 2020, 44, 245–253. (In Chinese) [Google Scholar]
- Hu, X.J.; Chen, X.J.; Li, N.S.; Wu, Y.; Chen, T.T. New understanding of the distribution characteristics of the Yellow River fault on the eastern margin of Yinchuan Basin. Geophys. Geochem. Explor. 2021, 45, 913–922. (In Chinese) [Google Scholar]
- Chen, X.J.; Hu, X.J.; Bai, Y.D.; Wu, Y.; Chen, T.T.; Cao, Y.Y.; Ni, P. Basement structure characteristics of the Lingwu depression in southern Yinchuan Basin. Geophys. Geochem. Explor. 2022, 46, 862–867. (In Chinese) [Google Scholar]
- Zhao, X.Y.; Zeng, Z.F.; Wang, K.; Huai, N. Study on the geothermal model of Gonghe-Guide region, Qinghai, China. In Proceedings of the 7th International Conference on Environment and Engineering Geophysics & Summit Forum of Chinese Academy of Engineering on Engineering Science and Technology, Beijing, China, 26–29 June 2016; pp. 300–303. [Google Scholar]
- Ponggohong, C.R.I.; Suryantini; Angga, B.P. 3D Geological and Isothermal Model of Geothermal Field Based on the Integration of Geoscience and Well Data. In Proceedings of the 8th ITB International Geothermal Workshop, IIGW 2019, Bandung, Indonesia, 20–21 March 2019; IOP Publishing Ltd.: Bandung, Indonesia, 2020. [Google Scholar]
- Zhao, X.Y.; Zeng, Z.Z.; Wu, Z.W.; Wang, K.; Li, J.; Xu, T.F. Delineating the area of HDR in Songliao basin using geophysical method. Prog. Geophys. 2015, 30, 2863–2869. (In Chinese) [Google Scholar]
- Aydemir, A.; Bilim, F.; Cifci, G.; Okay, S. Modeling of the Foca-Uzunada magnetic anomaly and thermal structure in the gulf of Izmir, western Turkey. J. Asian Earth Sci. 2018, 156, 288–301. [Google Scholar] [CrossRef]
- Gallardo, L.A.; Meju, M.A. Characterization of heterogeneous near-surface materials by joint 2D inversion of dc resistivity and seismic data. Geophys. Res. Lett. 2003, 30, 1658. [Google Scholar] [CrossRef]
- Um, E.S.; Commer, M.; Newman, G.A. A strategy for coupled 3D imaging of large-scale seismic and electromagnetic data sets: Application to subsalt imaging. Geophysics 2014, 79, Id1–Id13. [Google Scholar] [CrossRef]
- He, H.Y.; Li, T.L.; Zhang, R.Z.; Zhu, W. Three-dimensional cross-gradient joint inversion of gravity, gravity gradient and magnetotelluric data based on smooth-focusing regularization method. Chin. J. Geophys. 2022, 65, 1822–1838. [Google Scholar]
- Meng, Q.F. Research on High Precision Joint Inversion Method of Gravity and Magnetic with Undulating Terrain. Ph.D. Thesis, Jilin University, Changchun, China, 2022. [Google Scholar]
- Liao, C.; Hu, X.Y.; Zhang, S.H.; Li, X.W.; Yin, Q.Z.; Zhang, Z.; Zhang, L.F. Joint inversion of gravity, magnetotelluric and seismic data using the alternating direction method of multipliers. Geophys. J. Int. 2022, 229, 203–218. [Google Scholar] [CrossRef]
- Guo, X.Y.; Gao, R.; Li, S.Z.; Xu, X.; Huang, X.F.; Wang, H.Y.; Li, W.H.; Zhao, S.J.; Li, X.Y. Lithospheric architecture and deformation of NE Tibet: New insights on the interplay of regional tectonic processes. Earth Planet Sci. Lett. 2016, 449, 89–95. [Google Scholar] [CrossRef]
- Guo, K.; Tian, T.; Dong, X. Recovery of the Lower Paleozoic thermal evolution history of Weibei Uplift, Ordos Basin. Ground Water 2015, 37, 204–205. (In Chinese) [Google Scholar]
- Tian, X.B.; Bai, Z.M.; Klemperer, S.L.; Liang, X.F.; Liu, Z.; Wang, X.; Yang, X.S.; Wei, Y.H.; Zhu, G.H. Crustal-scale wedge tectonics at the narrow boundary between the Tibetan Plateau and Ordos block. Earth Planet Sci. Lett. 2021, 554, 116700. [Google Scholar] [CrossRef]
- Li, J.Y.; Hou, W.S.; Guo, B.; Shen, X.Z.; Zheng, W.J. Three-dimensional full waveform inversion of velocity in southwestern margin of Ordos and adjacent areas. Chin. J. Geophys. 2022, 65, 2074–2089. [Google Scholar]
- Zhai, M.G. Ordos Block (Basin) is a key to understand early continental evolution and tectonic regime of the North China Craton. Kexue Tongbao/Chin. Sci. Bull. 2021, 66, 3441–3461. [Google Scholar] [CrossRef]
- Liu, B.J.; Feng, S.Y.; Ji, J.F.; Wang, S.J.; Zhang, J.S.; Yuan, H.K.; Yang, G.J. Lithosphere structure and fault characteristics of Helan Mountain and Yinchuan Basin-results of deep seismic reflection profile. Sci. Sin. 2017, 47, 179–190. [Google Scholar]
- Ross, H.E.; Blakely, R.J.; Zoback, M.D. Testing the use of aeromagnetic data for the determination of Curie depth in California. Geophysics 2006, 71, L51–L59. [Google Scholar] [CrossRef]
- Wu, Z.C.; Gao, J.Y.; Zhao, L.H.; Zhang, T.; Yang, C.G.; Wang, J. Characteristic of magnetic anomalies and Curie point depth at northern continental margin of the South China Sea. Diqiu Kexue-Zhongguo Dizhi Daxue Xuebao/Earth Sci. J. China Univ. Geosci. 2010, 35, 1060–1068. [Google Scholar]
- Obande, G.E.; Lawal, K.M.; Ahmed, L.A. Spectral analysis of aeromagnetic data for geothermal investigation of Wikki Warm Spring, north-east Nigeria. Geothermics 2014, 50, 85–90. [Google Scholar] [CrossRef]
- Xiong, S.Q.; Yang, H.; Ding, Y.Y.; Li, Z.K. Characteristics of Chinese continent Curie point isotherm. Chin. J. Geophys. 2016, 59, 3604–3617. [Google Scholar]
- Ma, J.; Wang, W.Y.; Luo, X.G.; Yao, P.; Zhao, Z.G.; Qiu, Z.Y.; Ji, X.L.; Lu, B.L.; Feng, X.L. The magnetic basement and Curie surface depth in the South China Sea and adjacent areas derived from magnetic data. Chin. J. Geophys. 2018, 61, 4269–4280. [Google Scholar]
- Wang, D.H.; Zhang, J.F.; Wang, X.; Jiang, W.L.; Tian, T. Analysis of aeromagnetic anomalies and deep structures of Jiangsu segment of Tan-Lu fault zone and its adjacent region. Prog. Geophy 2018, 33, 1419–1429. (In Chinese) [Google Scholar]
- Parker, R.L. The rapid calculation of potential anomalies. Geophys. J. Int. 1973, 31, 447–455. [Google Scholar] [CrossRef]
- Du, W.; Dong, J.S.; Chen, X.Z.; Zhang, Y.Y.; Liu, J.C.; Hui, M.L. Calculation of Curie depth in Qinghai Province based on an improved Parker-Oldenburg interface inversion method. Chin. J. Geophys. 2022, 65, 1096–1106. [Google Scholar]
- Zhu, D.; Hu, X.Y.; Liu, S.; Li, H.W.; Zuo, B.X. Can Targeted Source Information Be Extracted from Superimposed Magnetic Anomalies? J. Geophys. Res. Solid Earth 2022, 127, e2022JB024279. [Google Scholar] [CrossRef]
- Zhu, D.; Li, H.W.; Liu, T.Y.; Fu, L.H.; Zhang, S.H. Low-rank matrix decomposition method for potential field data separation. Geophysics 2020, 85, G1–G16. [Google Scholar] [CrossRef]
- Bai, M.X.; Jiao, D.C. The historical analysis for M=8 Earthquake in 1739 at Yinchuan-Pingluo Area. Northwestern Seismol. J. 2005, 2, 135–140. (In Chinese) [Google Scholar]
- Zhao, J.M.; Liu, G.D.; Lu, Z.X.; Zhang, X.K.; Zhao, G.Z. Lithospheric structure and dynamic processes of the Tianshan orogenic belt and the Junggar basin. Tectonophysics 2003, 376, 199–239. [Google Scholar]
- Jiang, D.D. Inversion of Gravity and Magnetic Data and Geothermal Genesis in Changbai Mountain Volcanic Area. Ph.D. Thesis, Jilin University, Changchun, China, 2021. [Google Scholar]
- Lei, X.D.; Li, C.; Wang, L.F.; Zhao, Y.; You, Z.X.; Tang, X.C.; Guan, W.; Li, J. Genesis of the heat flow anomaly in Yanqing basin, NW Beijing. Chin. J. Geophys. 2022, 65, 3405–3418. [Google Scholar]
- Li, Y.; Oldenburg, D.W. 3-D inversion of gravity data. Geophysics 1998, 63, 109–119. [Google Scholar] [CrossRef]
- Liu, S.; Baniamerian, J.; Fedi, M. Imaging Methods Versus Inverse Methods: An Option or An Alternative? IEEE Trans. Geosci. Remote Sens. 2020, 58, 3484–3494. [Google Scholar] [CrossRef]
- Vatankhah, S.; Renaut, R.A.; Ardestani, V.D.E. A fast algorithm for regularized focused 3D inversion of gravity data using randomized singular-value decomposition. Geophysics 2018, 83, G25–G34. [Google Scholar] [CrossRef]
| Disclaimer/Publisher’s Note: The statements, opinions and data contained in all publications are solely those of the individual author(s) and contributor(s) and not of MDPI and/or the editor(s). MDPI and/or the editor(s) disclaim responsibility for any injury to people or property resulting from any ideas, methods, instructions or products referred to in the content. |
© 2023 by the authors. Licensee MDPI, Basel, Switzerland. This article is an open access article distributed under the terms and conditions of the Creative Commons Attribution (CC BY) license (https://creativecommons.org/licenses/by/4.0/).


