1. Introduction
1.1. Background and Motivation
The proportion of energy contributed by variable renewable sources (VRSs), such as solar and wind, to the power system is increasing. Considering this, maintaining system reliability and controlling the associated costs have emerged as important issues. The use of highly variable and non-dispatchable renewable sources increases profile cost, which is related to the additional capacity caused by the reduced capacity factors of generation capacities to back up and provide flexibility for VRS incorporation. In addition, the uncertainty associated with the generation profile of VRSs leads to balancing issues in the system and increases costs. In the day-ahead planning scheme that many countries have adopted, including Korea, because of this uncertainty and the forecasting error of VRSs, the operating reserve must be able to compensate for events in which renewable generation deviates from the forecasted level. The amount of operating reserve needed increases significantly as the penetration of VRSs in the power system increases, and therefore, it is extremely important to develop a market mechanism for efficiently procuring the required operating reserve.
The characteristics of operating reserve markets are different from those of the electricity load market. Electricity load can be purchased by bidding on a suitable value in the market, and once the bidding process is successfully settled, the purchased electricity can be fully utilized to the buyer’s benefit. Hence, it becomes a private good that has excludability. By contrast, operating reserve is a system requirement for maintaining the reliability of power system operation, and once it is secured, all participants in the power system and market can benefit from it. Hence, operating reserves have the characteristics of a public good because they do not have excludability. Because of this characteristic, operating reserves should be managed by a public market moderator, such as a system operator.
The aforementioned characteristics of operating reserve make it difficult to adopt competitive market mechanisms, and without a competitive market, it is difficult to discover an efficient price for operating reserve. As VRS penetration in the power system increases, the associated uncertainty increases, which warrants higher levels of operating reserve. However, if the operating reserve is not priced reasonably and efficiently, the cost of balancing increases excessively when the price is too high, and a sufficient amount of reserves cannot be secured when the price is too low.
The operating reserve demand curve (ORDC) can serve as an important basis in the search for a fair and efficient price for operating reserves. The ORDC presents the implicit price of operating reserve because it measures the marginal benefit of each unit of operating reserve in the power system. This benefit consists of direct and indirect benefits to society due to the increased security of the power system and the prevention of load shedding, which can lead to blackouts. The social cost of a blackout can be quantified as the value of lost load (VOLL) and is included in the model when estimating an ORDC.
The ORDC can be expressed with Equation (1), as suggested by Hogan and Pope (2019) [
1]. It represents the marginal benefit of unit operating reserve in the power system, and it is composed of two parts. The first part, loss of load probability (LOLP), is an indicator of the power system’s reliability level as a function of the quantity of operating reserve. When the quantity of operating reserve is high, LOLP is low and system reliability is high. By contrast, when the quantity of operating reserve is low, LOLP is high and system reliability is low. Hence, LOLP is a decreasing function of reserve quantity. In addition, to maintain the LOLP level of a power system with a higher proportion of VRSs, a greater quantity of operating reserve would be required. The second part, value of lost load (VOLL), is used to determine the social cost of load shedding. Therefore, the product of VOLL and LOLP amounts to the expected social cost of load shedding, which represents the social benefit of unit reserve quantity. Here, the marginal cost (MC) of a power system should be subtracted from the VOLL because load shedding does not generate any marginal cost. The VOLL level varies depending on the structure of the society in question. In highly industrialized and developed societies, any power supply interruption has a high social cost, and accordingly, the VOLL is typically higher in more developed countries.
Equation (1). Definition of ORDC.
where,
,
,
,
,
.
In this study, we use a stochastic dynamic optimization model called Matpower Optimal Scheduling Tool (MOST) that can analyze the reserve quantity needed for a given uncertainty level of VRSs. The stochastic nature of MOST allows us to adopt renewable generation input as a probability-assigned stochastic value to obtain the quantity of operating reserve needed to fulfill the system reliability requirement for a given uncertainty level. The dynamic nature of MOST allows us to consider inter-hour restrictions, such as the ramping constraint, and analyze the load-following reserve [
2,
3].
We apply MOST to the Korean power system and estimate the ORDC in 2020 with a low penetration of VRSs and in 2034 with a high penetration of VRSs. In addition to the ORDC estimation, we determine the required quantity of operating reserve and its time-varying hourly requirement. Moreover, we investigate how the curtailment of VRSs can be an effective resource for balancing the system and reducing the required quantity of operating reserve.
1.2. Literature Review
Several researchers, including Prada (1999) [
4], Bajo (2021) [
5], Hogan and Pope (2019) [
1], Frew et al. (2021) [
6], and Zarnikau et al. (2020) [
7], have analyzed the proper price and quantity of operating reserve needed in diverse power system environments and methodologies.
Prada (1999) [
4] studied the allocation of operating reserves by system operators when the electricity market transitions to a competitive market scheme. In the past, operating reserves were secured as a fixed percentage of peak demand. For this reason, it was difficult to properly define the risk and probability of an insufficient power supply. In addition, it was impossible to analyze the cost efficiency of operating reserve from such a rigid quantity perspective because it was impossible to quantify the increase in power system reliability upon the addition of unit operating reserve. Prada (1999) [
4] estimated the ORDC by measuring the economic value of the added reliability to customers and applying a static demand model.
Bajo (2021) [
5] estimated the ORDC by using Texas ERCOT data for the period 2015–2019. His results indicated that the price of operating reserve decreased by 0.10–0.15% when the proportion of wind power in the system increased by 1%. This result provides a reverse incentive for securing operating reserve resources because more operating reserves are needed when the proportion of variable renewable power generation is high.
Hogan and Pope (2019) [
1] analyzed the ORDC to provide a fair and reasonable price for operating reserve in the PJM power system. They listed the reasons underlying the failure of PJM’s operating reserve market design to achieve economic efficiency as of 2019. First, the current operating reserve market structure of PJM was created in the past, and it did not effectively reflect the complex reserve operation and its academic basis as of the date of their study. Second, the previous ORDC was estimated when the penetration of variable renewable sources was negligible, and therefore, it failed to reflect the considerably higher level of uncertainty in the power system. In the present study, we redefine the types of operating reserve in the day-ahead and real-time markets and propose a newly estimated ORDC that considers the high penetration of renewable sources in the power system.
Frew et al. (2021) [
6] analyzed how operating reserve eligibility and scarcity pricing affect the overall system electricity price in ERCOT-like systems and showed how reserve prices as well as energy prices are impacted by reserve scarcity events. Zarnikau et al. (2020) [
7] studied how ORDC affects investment incentives for generation capacity in Texas.
1.3. Study Objective
The main objectives of this study can be summarized as follows: First, we estimate the distinguished ORDCs of the Korean power system in 2020 with a low penetration of VRSs and in 2034 with a high penetration of VRSs by using a stochastic dynamic optimization model. In this manner, we understand how the ORDC changes when more VRSs are deployed in the Korean power system. Second, the correct quantities of hourly operating reserve needed in 2020 and 2034 are estimated, and time-varying hourly reserve requirements within a day are analyzed to provide a good basis for more efficient management of operating reserve. Third, the role of VRS curtailment as a balancing resource to replace operating reserves is investigated. In the dynamic between the offer price and reserve quantity, VRS curtailment plays an important role because it can replace operating reserves when the price of the reserve is excessively high. For this reason, it is important to study how VRS curtailment can contribute toward minimizing the system operation cost and how it should be valued.
To estimate the ORDCs, we use a novel stochastic dynamic optimization model that considers VOLL and LOLP in the cost-minimization process. The forecast profiles of VRSs, such as solar and wind, that reflect realistic uncertainty levels are generated using the econometrics model and the Monte Carlo simulation method.
3. Results
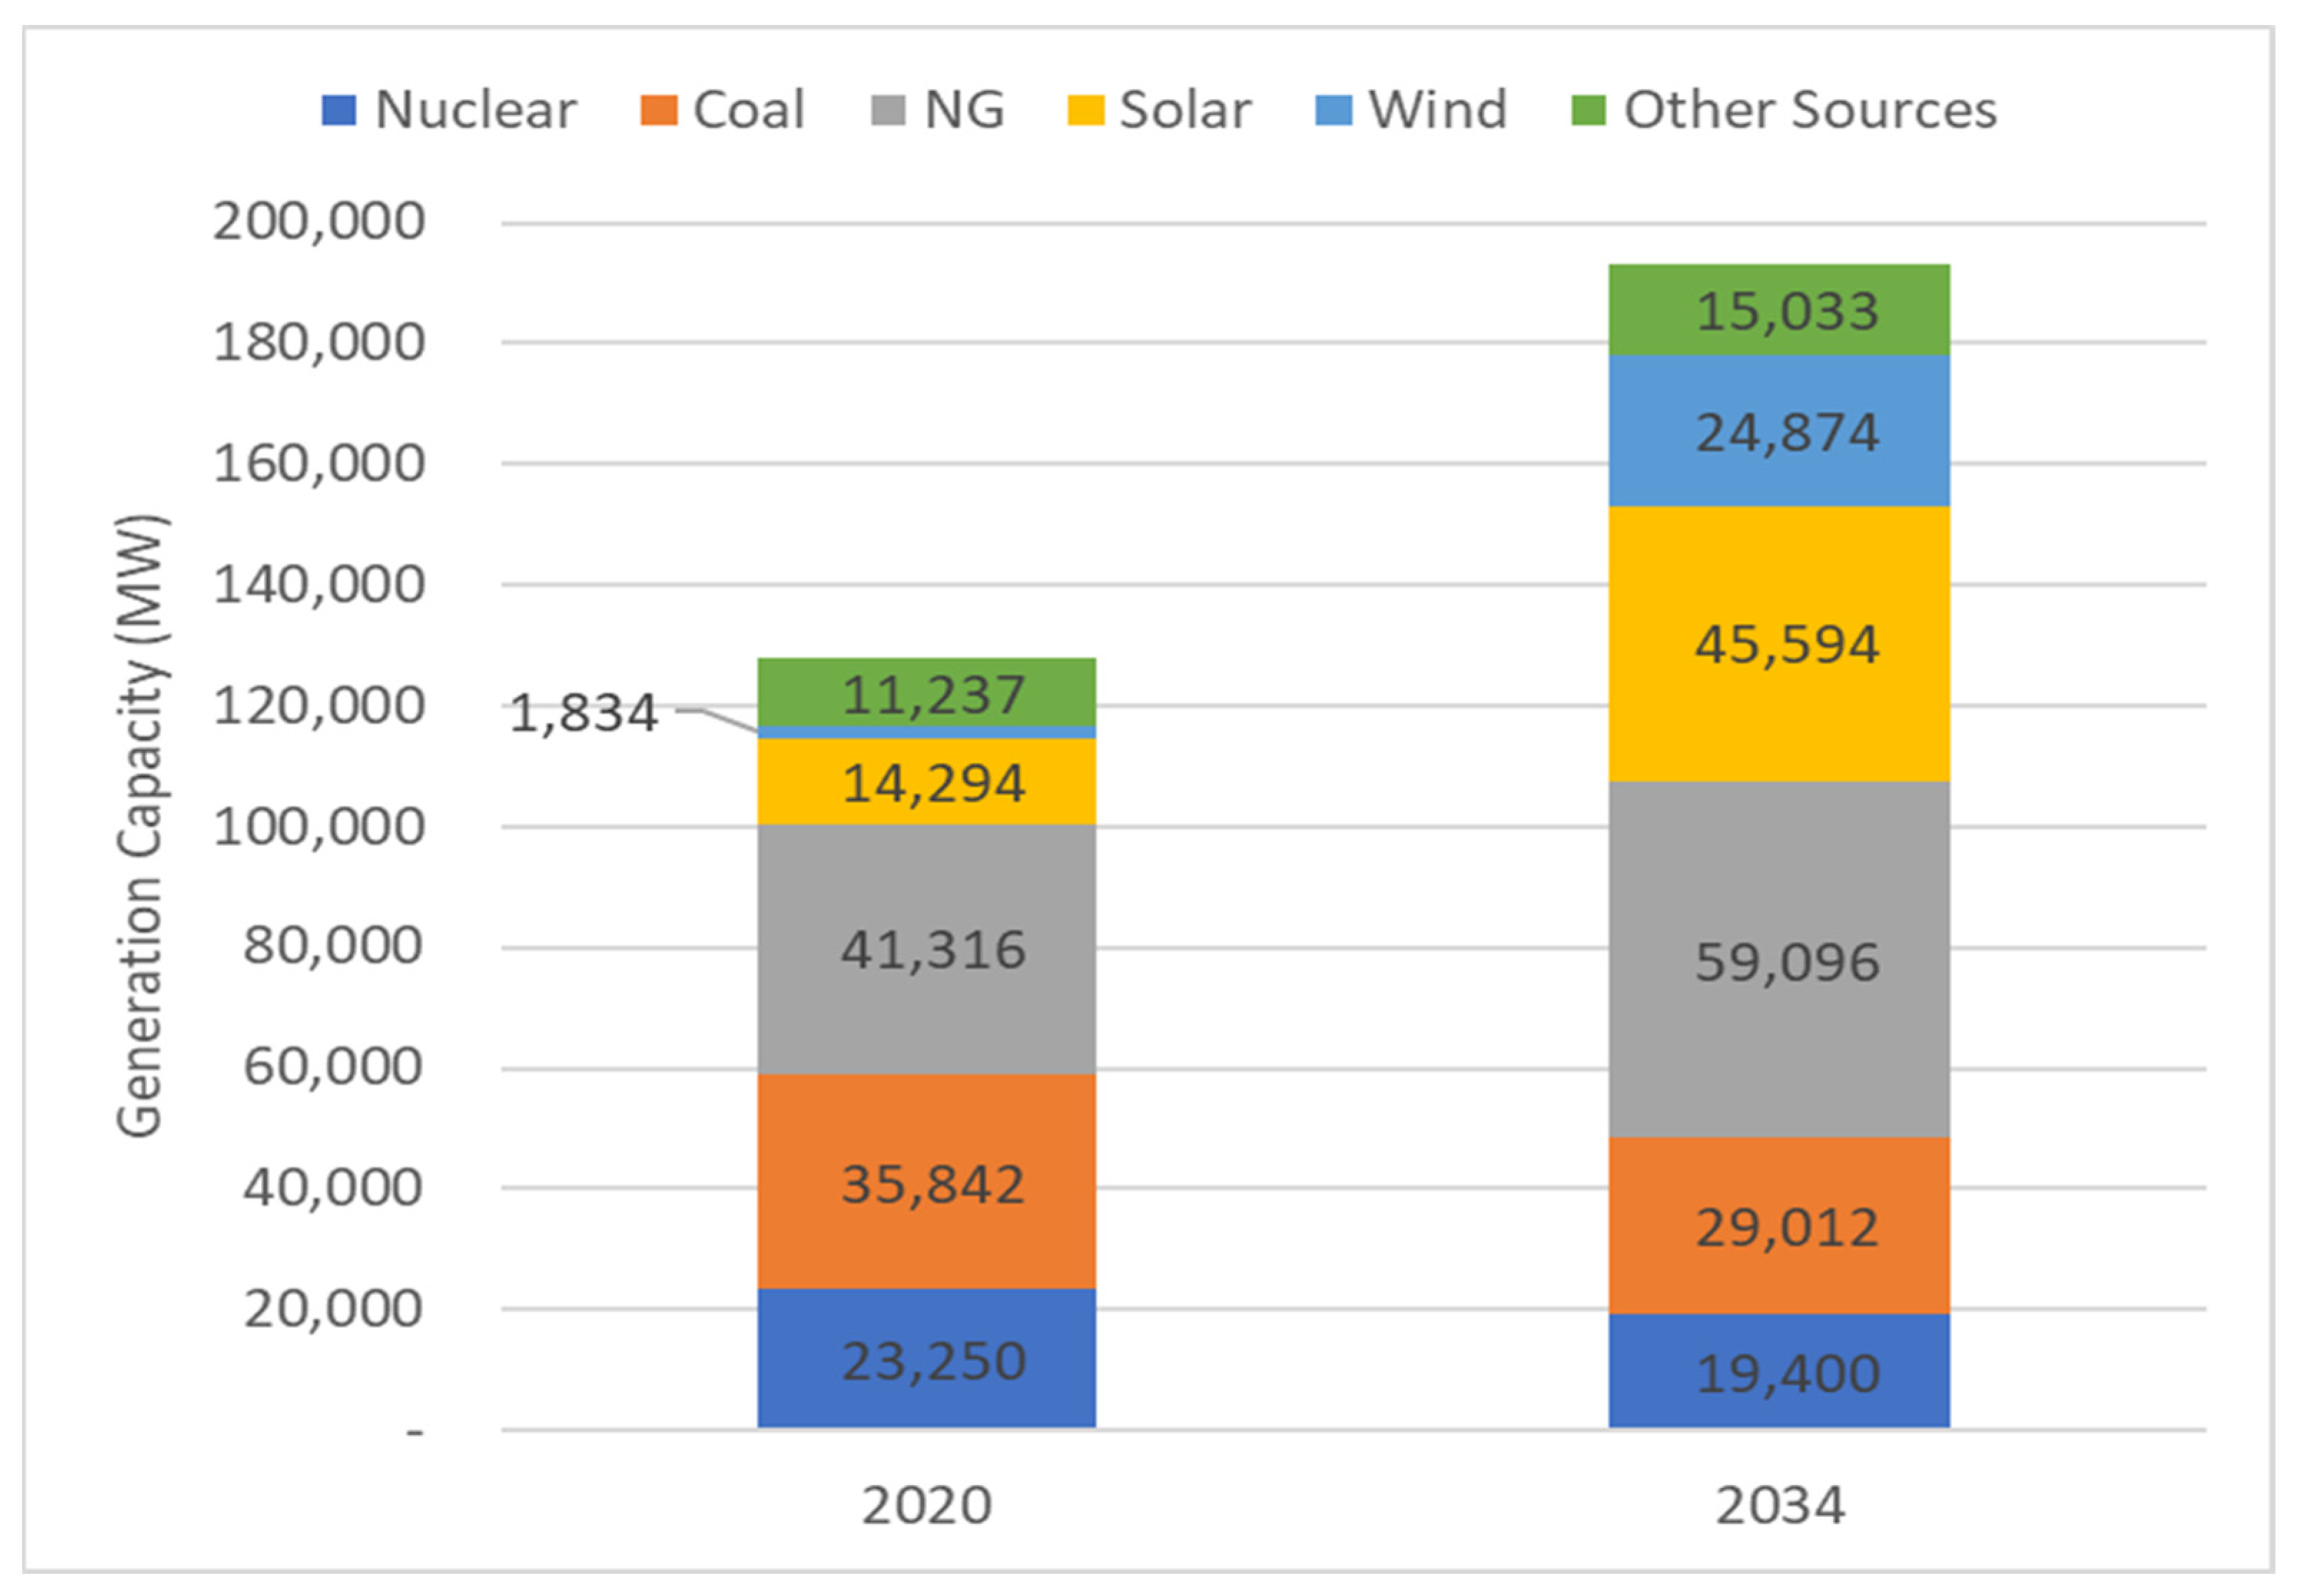
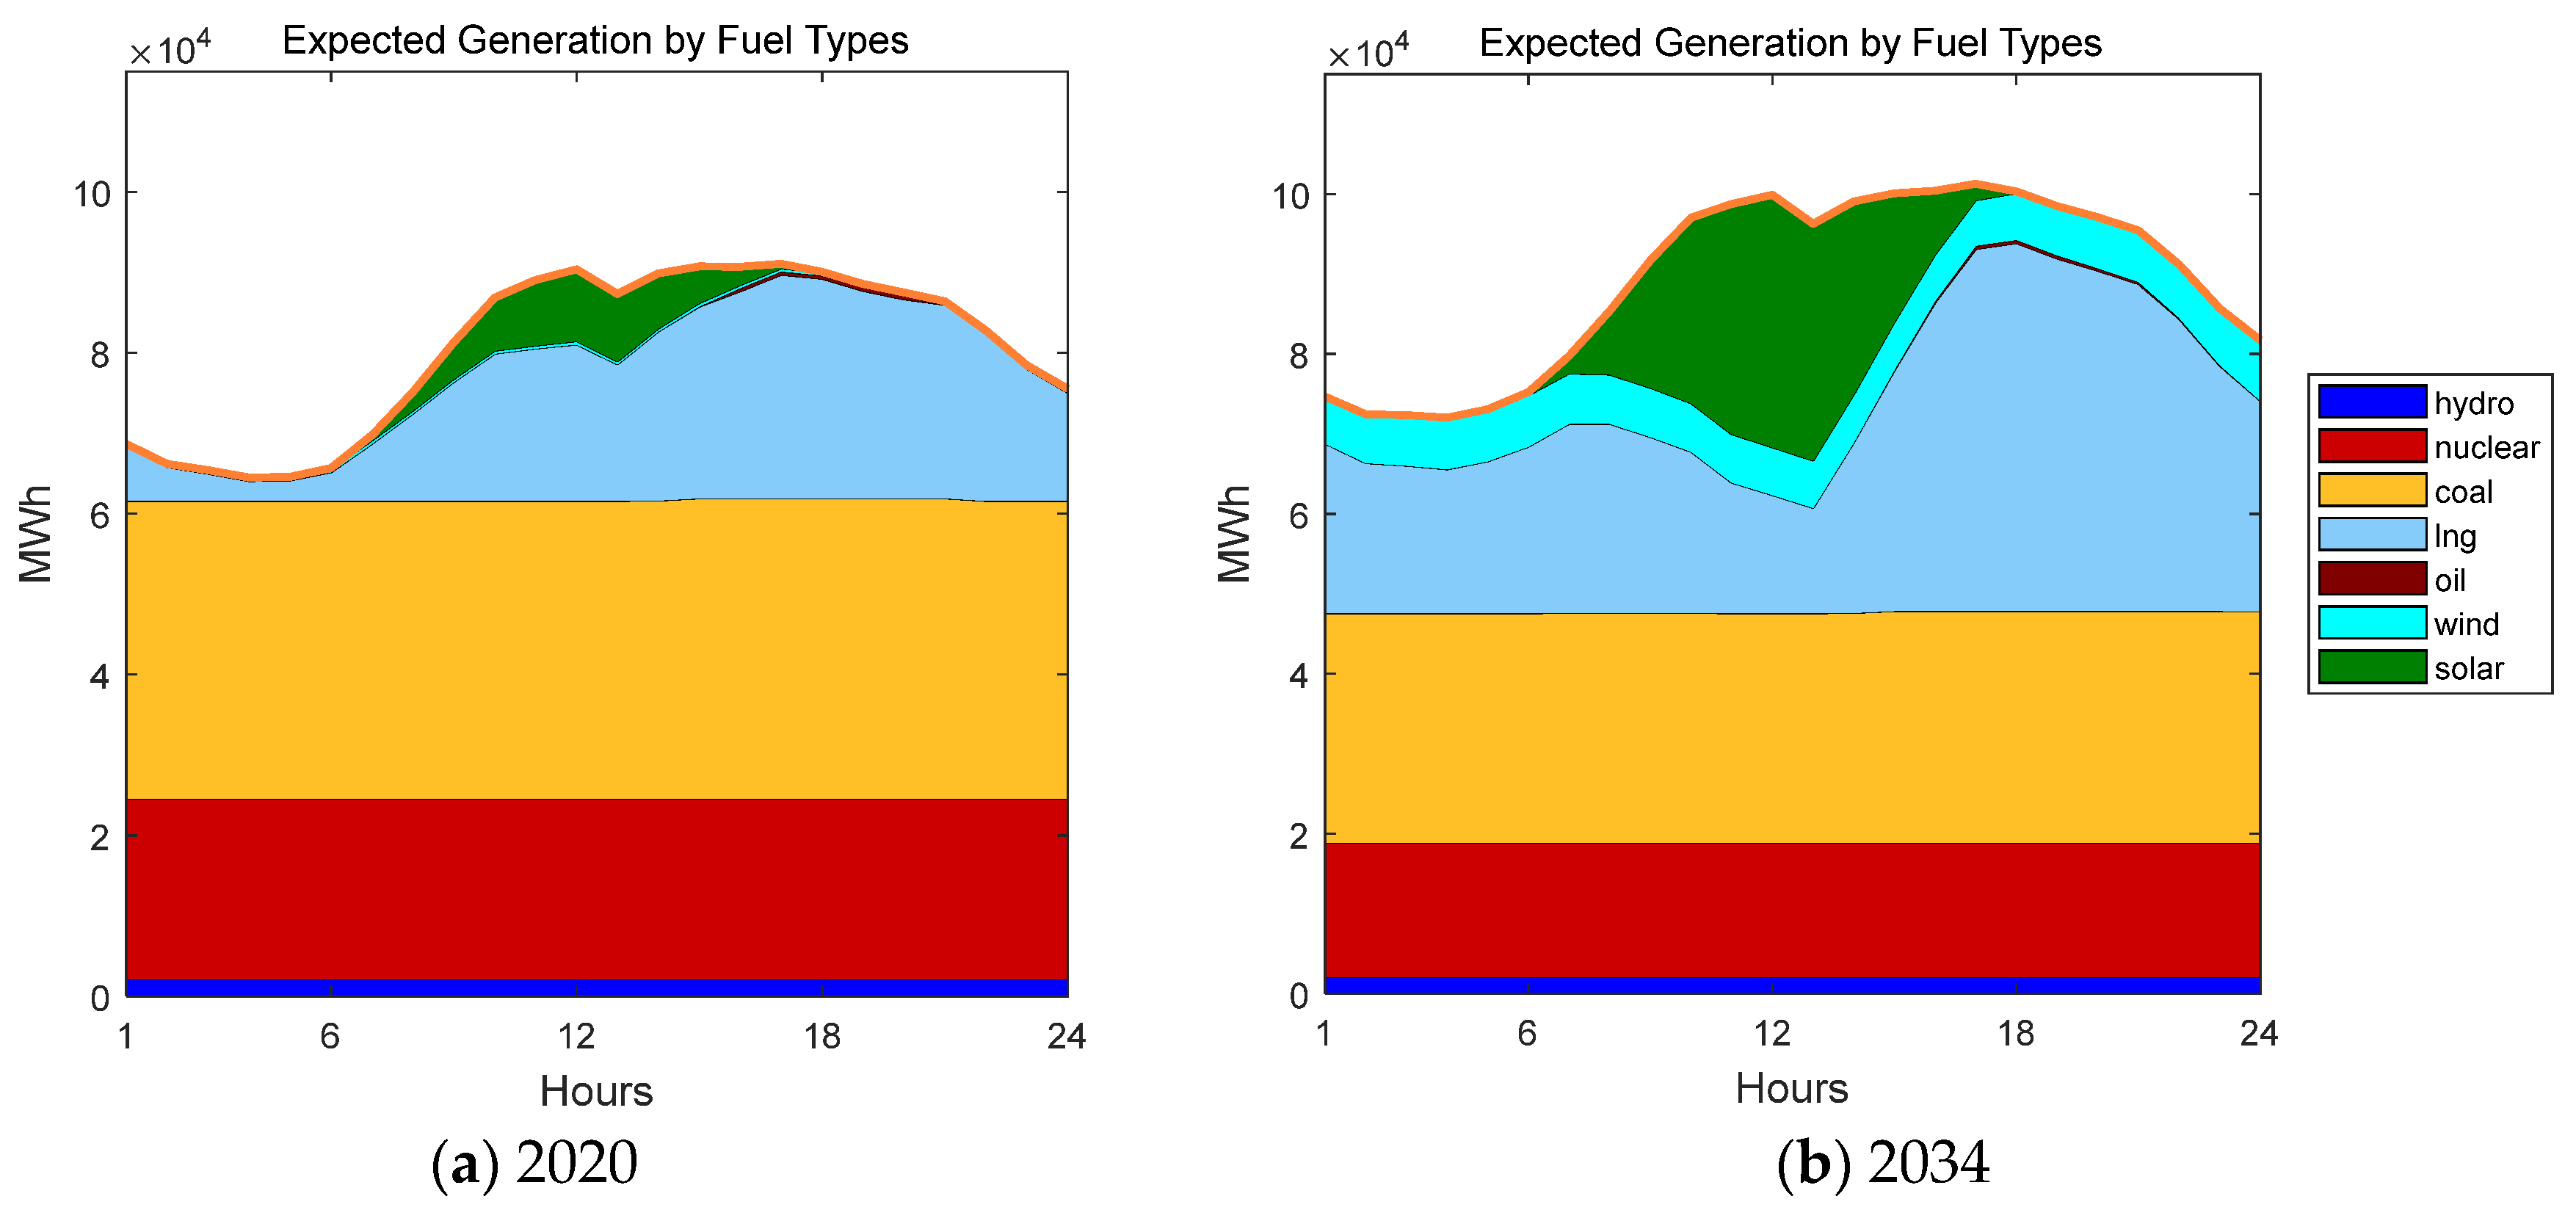
Figure 4 shows the expected generation profiles for different fuel types over an entire representative summer day. The proportion of VRSs, such as wind and solar, in the total electricity generated in 2020 is 3.9%, and as shown in
Figure 4, wind generation is limited and solar accounts for most of the VRSs. By contrast, in 2034, the proportion of VRSs in Korea will be 21.0%, and solar generation will create a significant duck curve during the daytime.
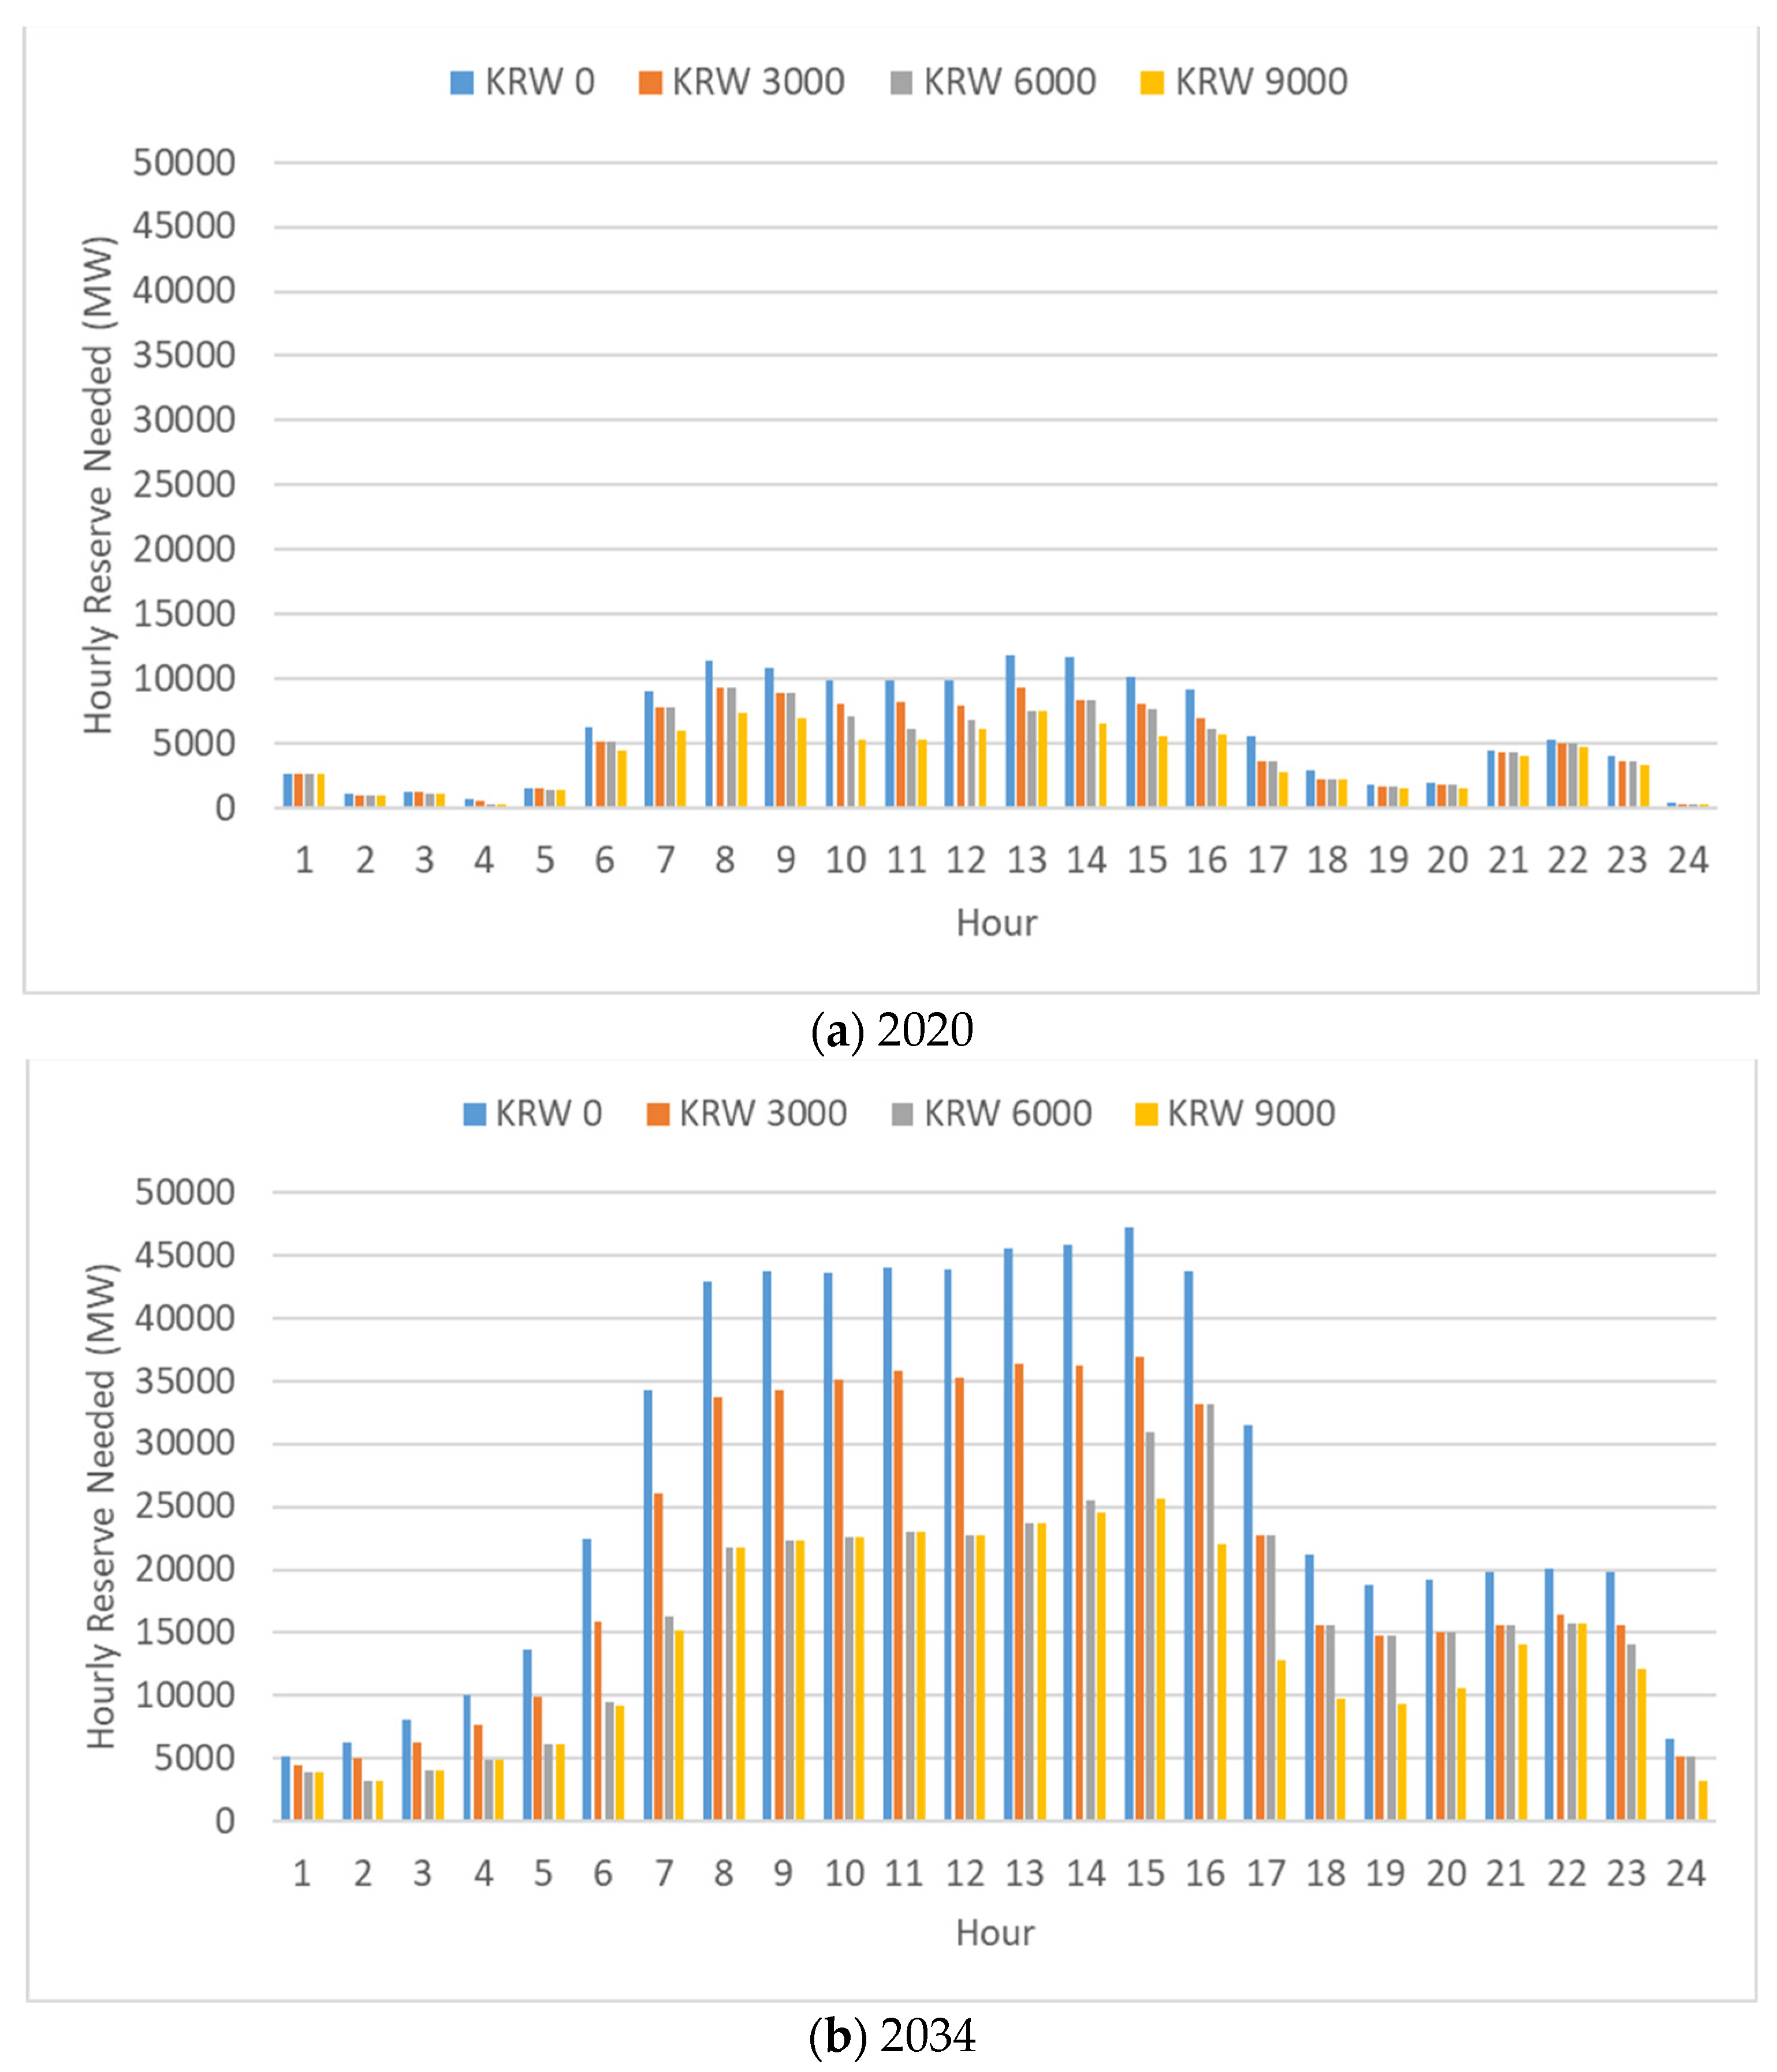
Figure 5 illustrates the hourly reserve needed considering varying reserve offer prices from 0 KRW/kW to 9000 KRW/kW. The amount of reserve needed increases gradually in the later hours as the forecasting error increases when it moves far from the point of day-ahead planning. The reserve needed increases to the maximum level when solar generation is actively supplied from hour 10 to hour 17, and then the reserve requirement decreases after sunset because uncertainty due to solar generation no longer exists and wind generation is the only source of uncertainty.
Moreover,
Figure 5 shows that the optimum reserve requirement varies when different reserve offer prices are applied. In the co-optimization model that considers both energy cost and reserve cost, the optimum reserve quantity is determined by considering the tradeoff relationship between the cost of securing more reserves and the cost of load shedding or VRS curtailment. Hence, when the reserve price increases, the use of more reserves becomes economically infeasible, and the quantity of reserves used in the power system should be reduced until the increased social cost due to a lower reliability level is equal to the reserve cost. If the cost of securing the required reserve is higher than the expected social cost, including the cost of VRS curtailment or the cost of load shedding, it is reasonable to reduce the quantity of reserves.
When the reserve offer price increases from 0 KRW to 6000 KRW/kW, the reserve quantity needed decreases significantly, but any cost escalation beyond 6000 KRW/kW does not lower the reserve requirement considerably in 2034. This indicates that the reserve requirements estimated at reserve offer prices higher than 6000 KRW/kW are necessary for securing system reliability, which cannot be compromised even when the cost increases significantly.
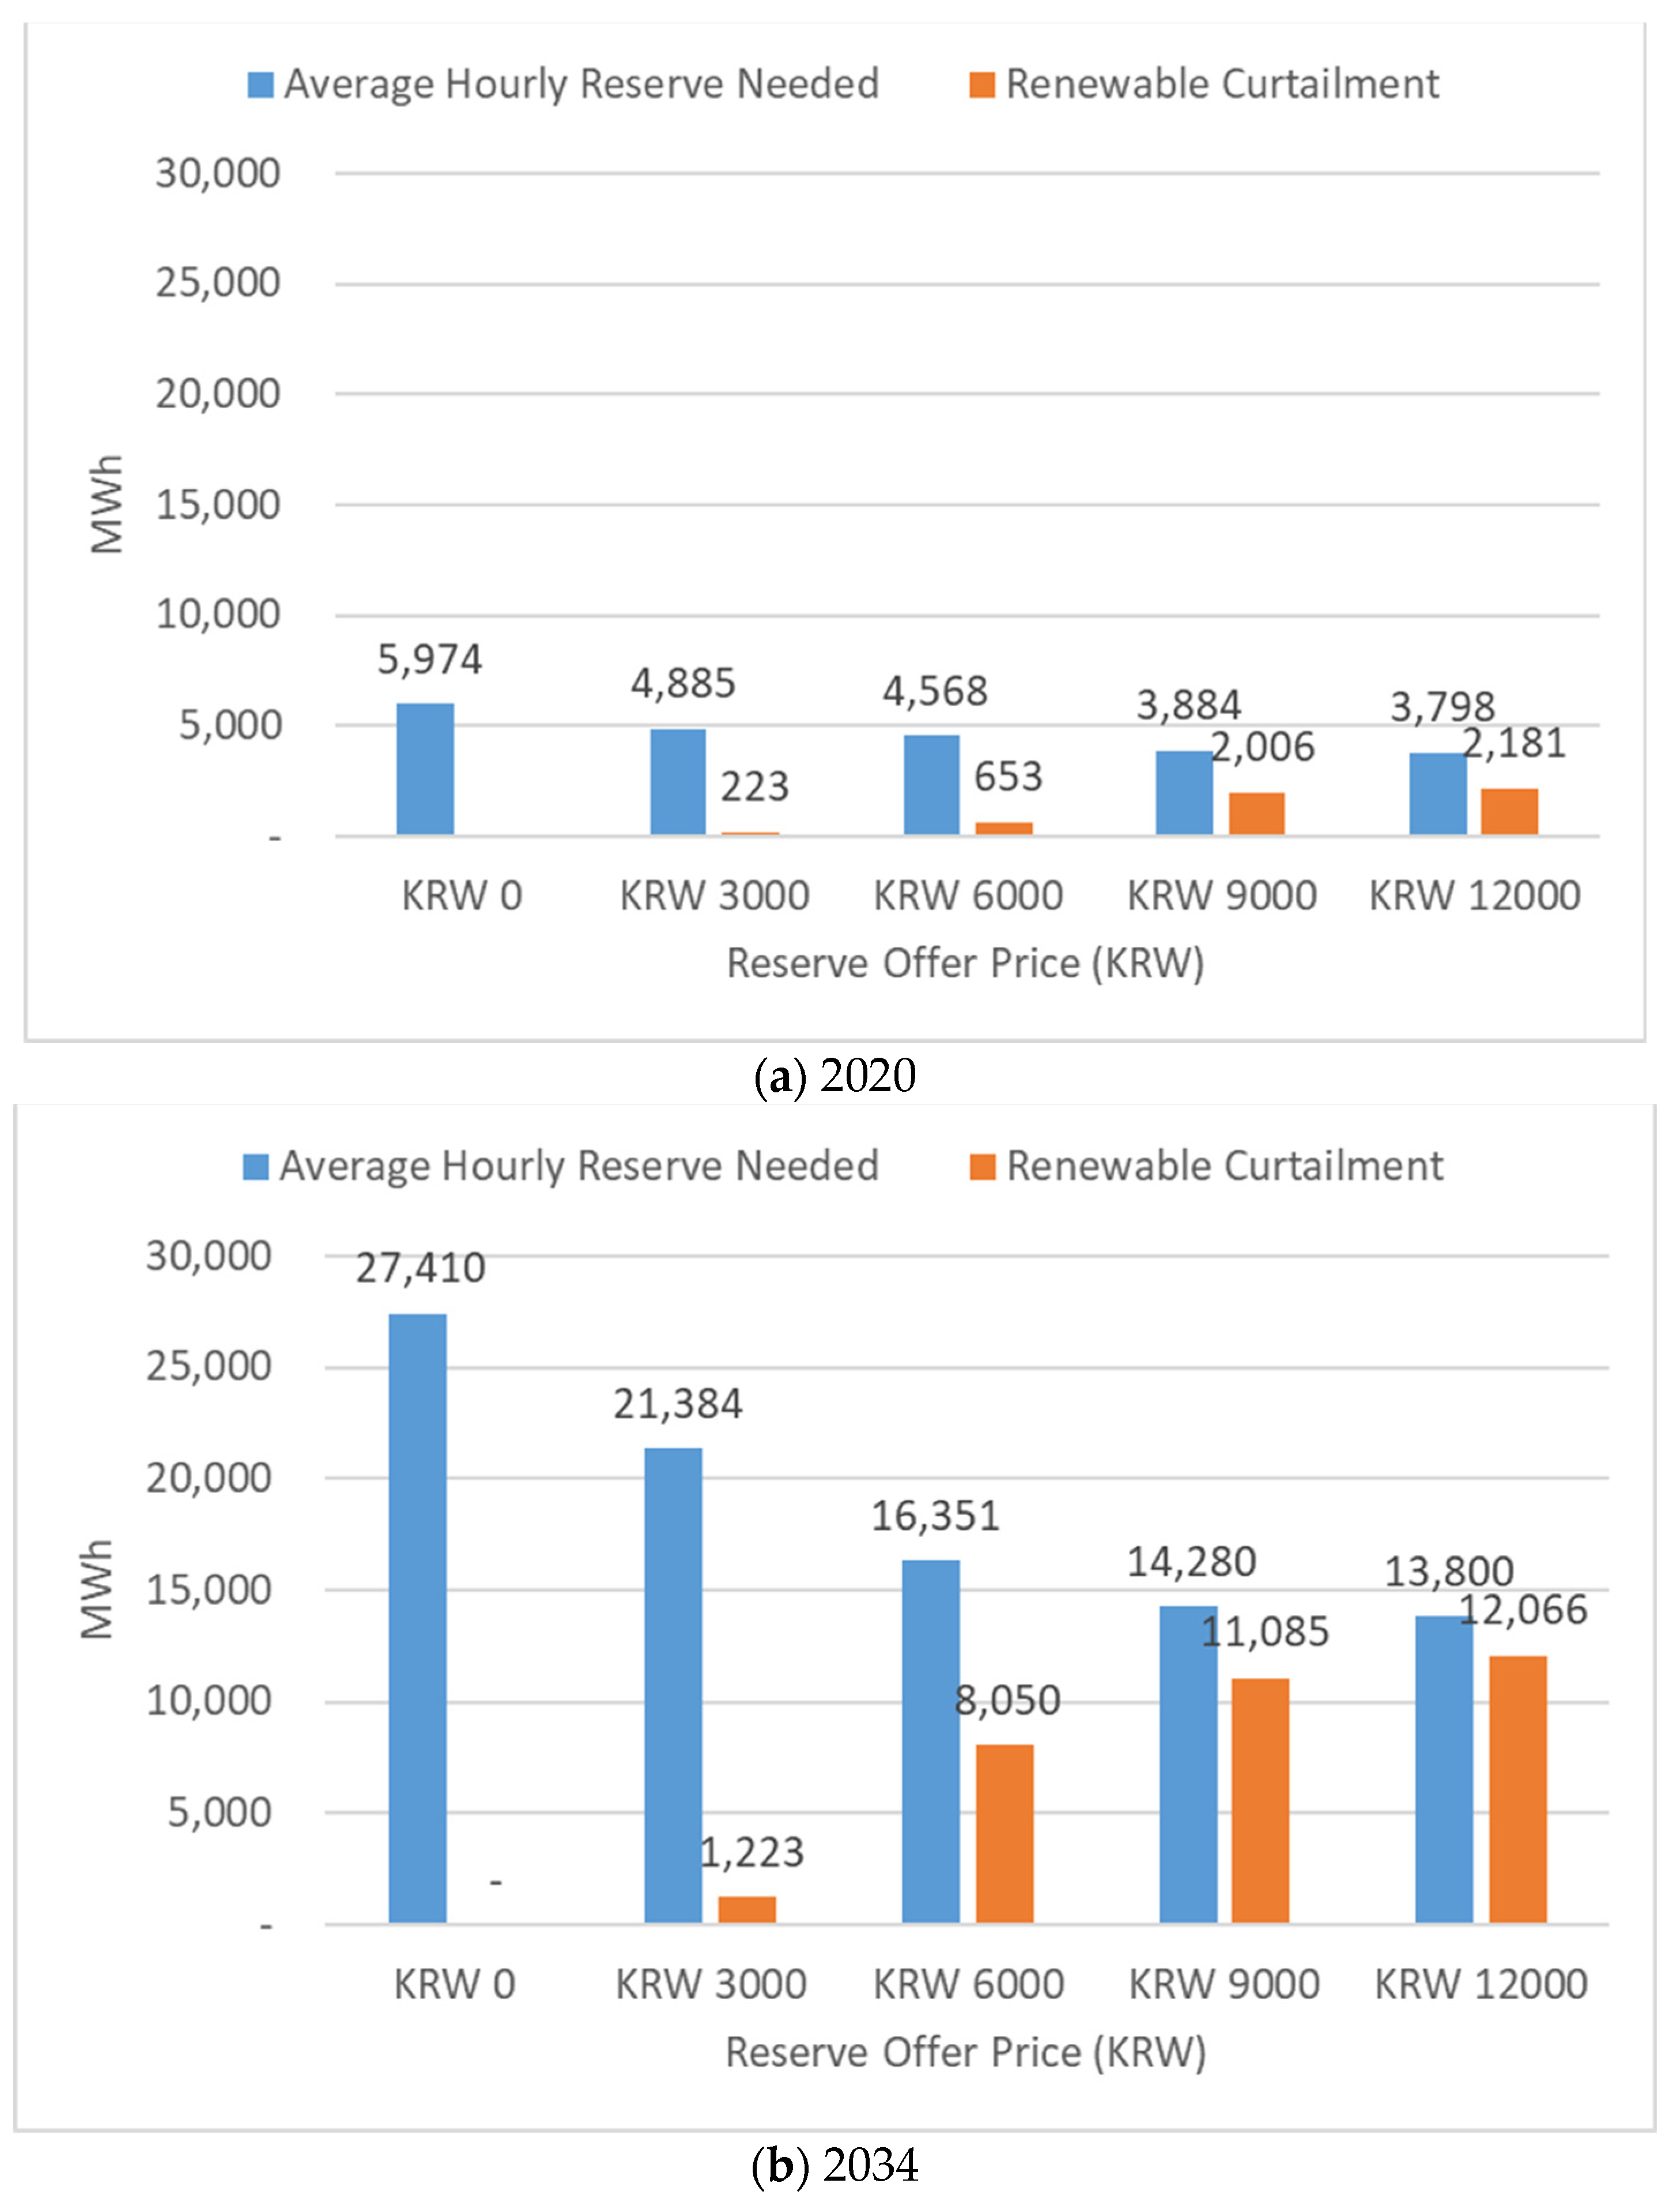
Figure 6 shows the relationship between the average hourly reserve requirement and VRS curtailment, given varying reserve offer prices. The average reserve offer price in the last five years in Korea has been approximately 3000 KRW/kW, and at this level, the average reserve requirements in 2020 and 2034 are 4885 MW and 21,384 MW, respectively. The reserve quantity in 2034 will be approximately 4.4 times higher than that in 2020. As the reserve offer price increases, the reserve cost exceeds the social benefit of securing reserves, which reduces the reserve requirement, and the system is balanced by means of VRS curtailment. This indicates that VRS curtailment should be considered a useful and cost-effective balancing resource. As the penetration of VRSs increases in the quest to achieve Korea’s goal of becoming carbon net-zero by 2050, the power system would need massive amounts of reserve resources, and a considerably more efficient solution would involve the VRSs balancing themselves instead of securing additional generation capacities for the purpose. To this end, VRSs that can be curtailed should be incentivized.
According to the current guideline for operating reserves in Korea, the power system has to maintain at least 4500 MW of operating reserve, and at least 2000 MW of responsive resources are required to operate within 20 min, so the Korean power system has to maintain at least 6500 MW of reserve units for variable renewable sources in total. The average amount of required reserve estimated for 2020 is approximately 4885 MW at the current reserve price level of 3000 KRW/kW. This estimate satisfies the level that the current guideline requires.
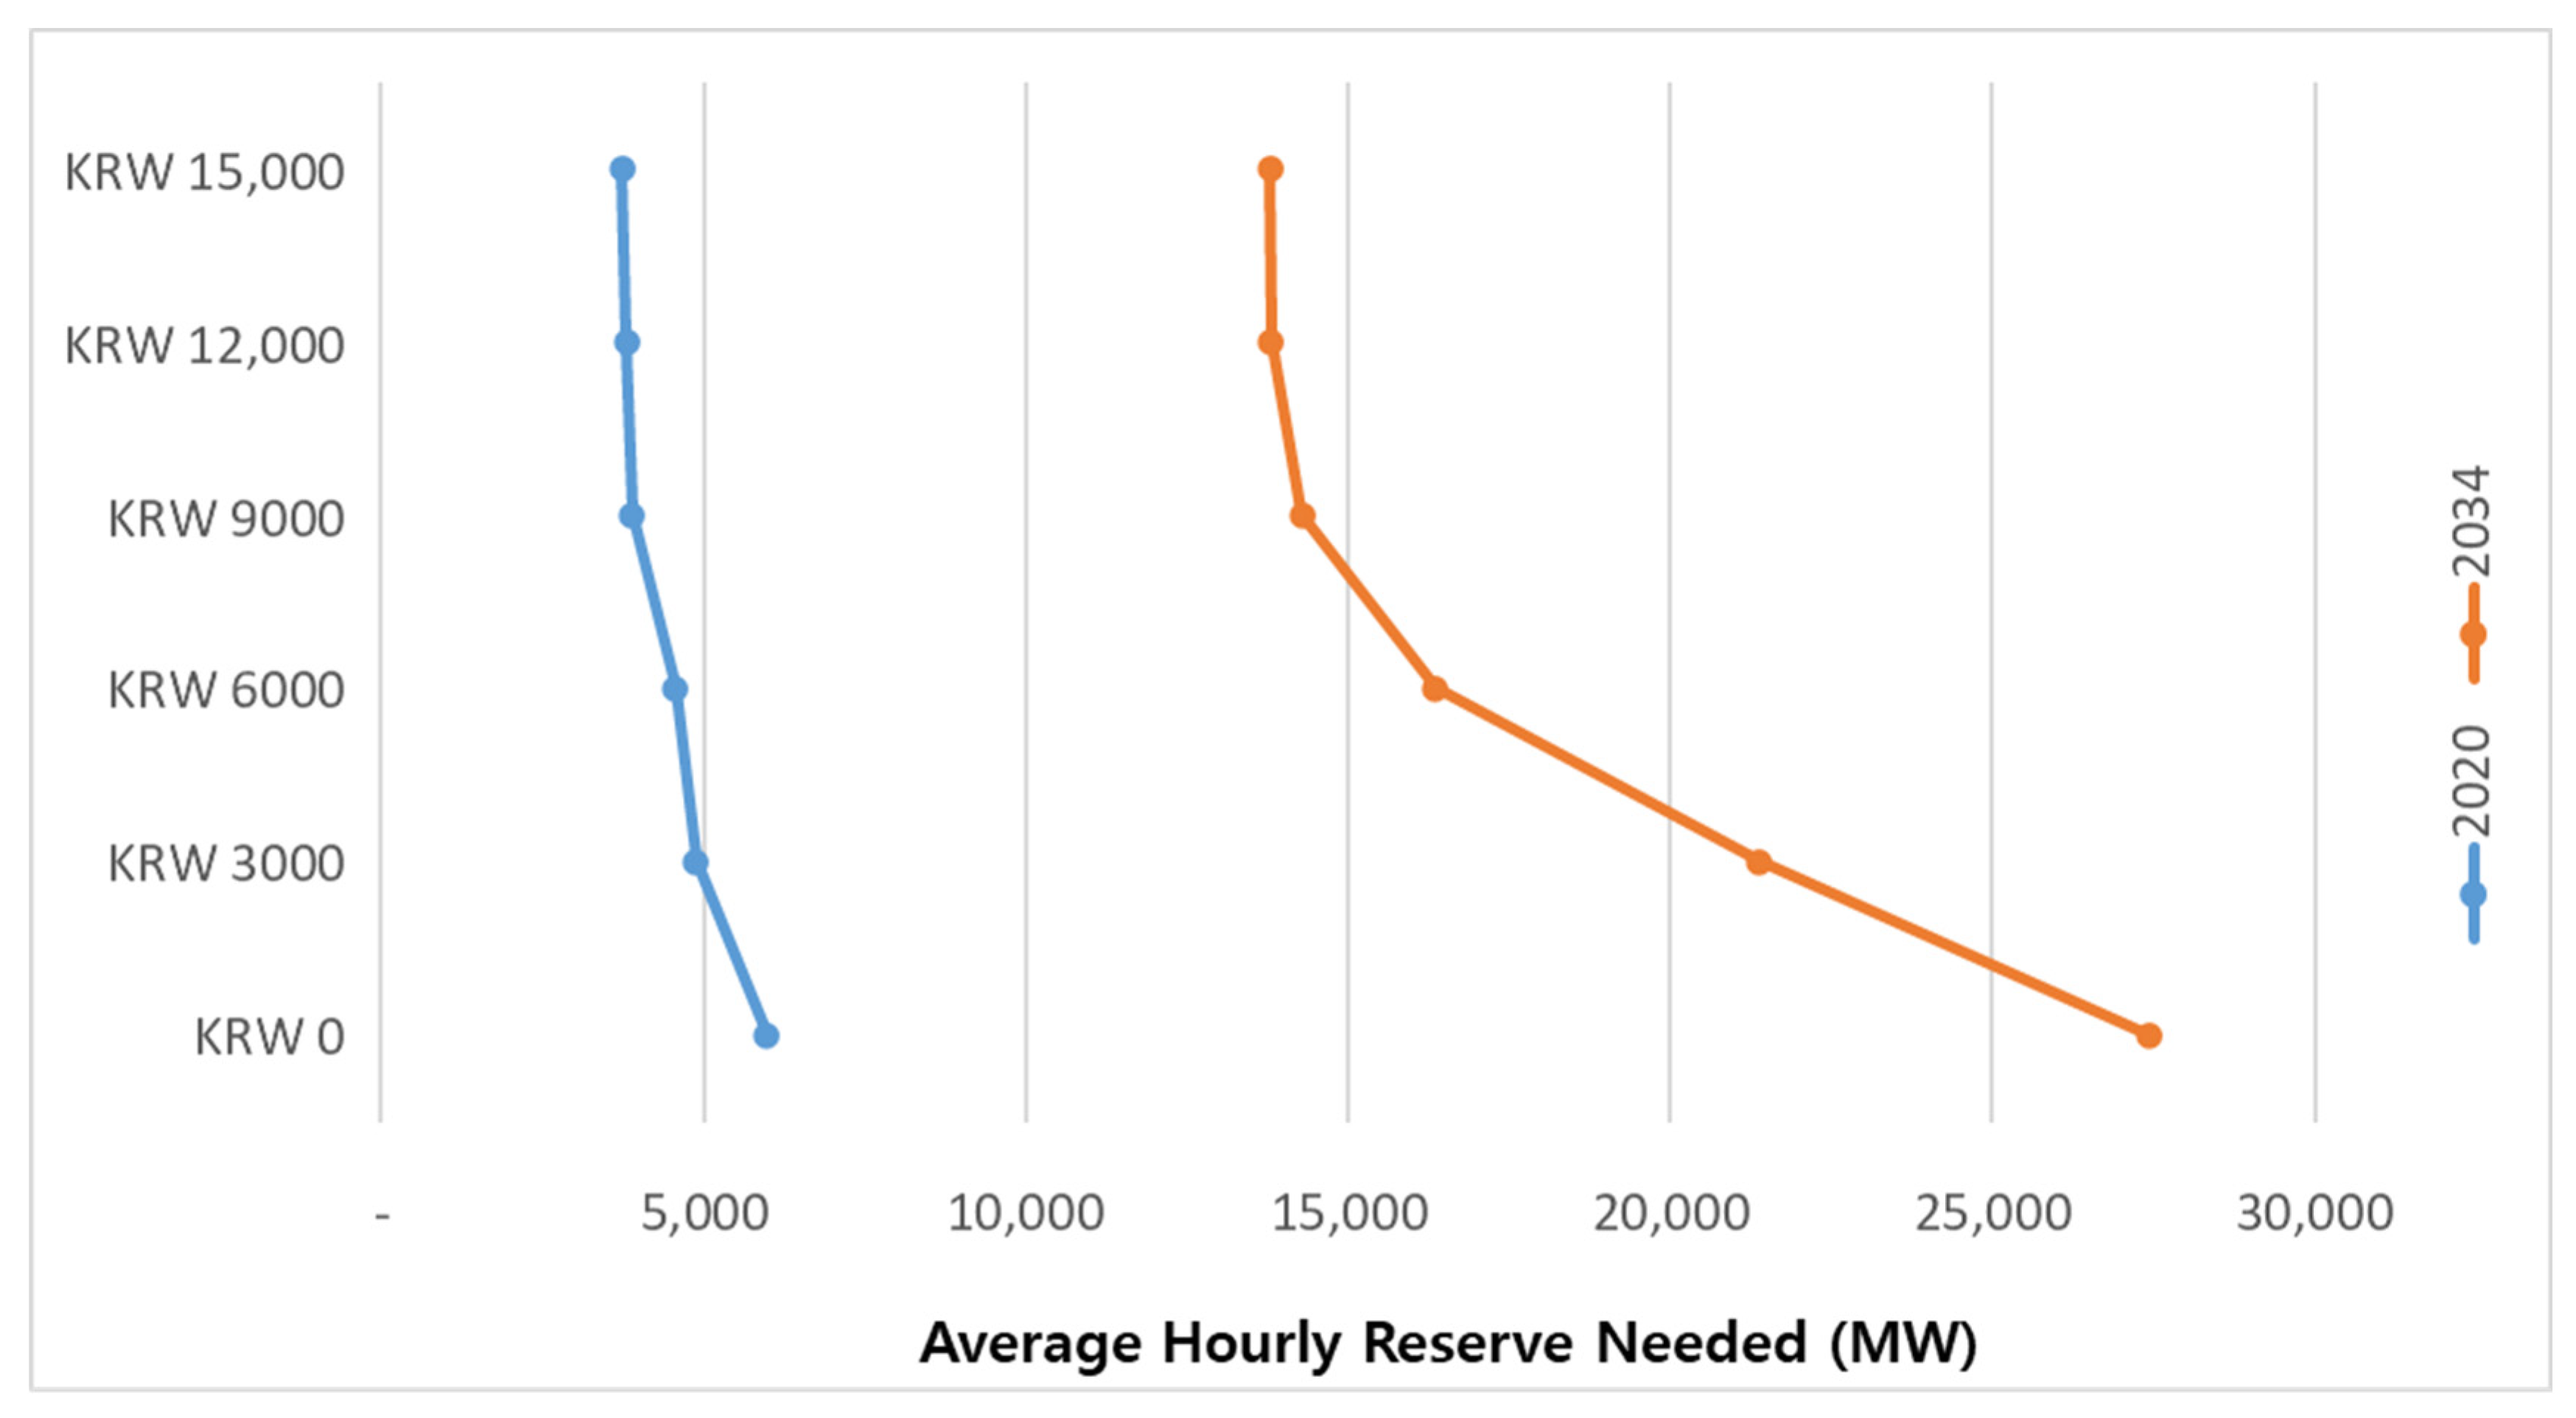
Figure 7 summarizes the ORDCs of the Korean power system in 2020 and 2034. An ORDC is used to estimate the marginal benefit of an additional unit of reserve, and it provides the basis for properly valuing reserves and determining the relationship between the amount of reserve needed and the reserve price.
The ORDC of 2020 presents an extremely inelastic demand curve. The reserve requirement does not change considerably with the offer price because VRS penetration is extremely low and its uncertainty is not significant. The ORDC of 2034 is more elastic with considerably higher uncertainty due to VRSs, and therefore, the amount of reserve needed to cover this uncertainty varies significantly with reserve price. As depicted in
Figure 6, when the reserve price is higher, the power system is optimized by reducing the reserve needed and curtailing VRS generation to balance the system. The ORDC of 2034 shows that when the reserve price increases from 0 KRW to 9000 KRW, the amount of reserve needed decreases rapidly because other alternatives, such as VRS curtailment, can provide the required balancing. However, when the amount of reserve reaches approximately 15,000 MW, further price increases cannot reduce the reserve requirement. Therefore, this is the minimum reserve requirement for the system in 2034.
4. Conclusions
In this study, the ORDCs of the Korean power system in 2020 and 2034 with different VRS penetration levels were estimated, and on the basis of the estimated ORDCs, the number of reserves required to achieve system reliability for a given level of VRS-induced uncertainty were analyzed. A stochastic dynamic optimization model was used to capture the probabilistic characteristics of wind and solar generation, and inter-hour constraints and ramping restrictions were also considered to estimate not only contingency reserves but also load-following reserves.
At the current level of the reserve offer price in Korea, the hourly reserve requirements for 2020 and 2034 were calculated as approximately 4885 MW and 21,384 MW, respectively. In addition, our results indicate that the hourly reserve requirement varies due to the different forecasting errors of VRSs. The amount of hourly reserve needed gradually increased as the forecasting error increased when moving away from the point of day-ahead planning. The hourly reserve reached its maximum level at hours 15–16, when solar power is actively generated. Thereafter, the hourly reserve requirement decreased gradually due to the elimination of the uncertainty induced by solar generation.
One way to reduce the forecasting error of variable renewable sources would be to shorten the planning horizon. In the current day-ahead scheme, forecasting should be calculated for 24 h so the forecasting error increases as we forecast further ahead to hour 22 or hour 23 compared to hour 2 or hour 3. If we shorten this period to 12 h and 6 h, then forecasting error and induced reserve cost would be further decreased. One challenge regarding this change would be to implement data collection and optimization of a power system in a shorter time period with induced costs due to more frequent power system planning.
Moreover, we demonstrated the existence of a tradeoff relationship between the reserve quantity and VRS curtailment. As the reserve offer price increases, the value of reserve resources as an asset increases. In this scenario, VRS curtailment emerges as a more cost-effective balancing resource and starts to replace the reserve requirement.
Finally, the estimated ORDC of 2020 shows a price-inelastic demand curve because the reserve requirement does not change considerably with changes in the reserve offer price. This is because the uncertainty induced by VRSs is low due to low VRS penetration, and therefore, the amount of reserve needed to secure system reliability does not vary considerably when the uncertainty is limited. By contrast, the estimated ORDC of 2034 is located far to the right, and it exhibits higher price elasticity than the estimated ORDC of 2020. High reserve requirements due to high VRS uncertainty move the ORDC of 2034 toward the right, and other balancing measures, such as curtailment, emerge as cost-effective alternatives to the reserve requirement.
The implications of this study can be summarized as follows:
First, reserve costs are expected to increase rapidly in the future as the penetration of VRSs increases. Therefore, to effectively manage reserve costs, it is important to accurately compute reserve requirements and the associated reserve price that reflects the social benefits of the reserve. It is difficult to ascertain the proper reserve price because of its characteristics as a public good. Therefore, the estimated ORDC provides an important basis for the efficient operation of the reserve market.
Second, a time-varying standard for the reserve requirement is needed. To manage the massive uncertainty induced by VRSs in a cost-effective manner, we need a more flexible and systematic standard for the reserve requirement. Instead of a fixed requirement throughout the day or week, optimal hourly reserve requirements determined on the basis of day-ahead forecasting can effectively reduce the cost of balancing the system against VRS-induced uncertainty.
Third, VRS curtailment should be considered an effective alternative to reserves, and system operators should use it to reduce the system operation cost, including generation cost and reserve cost. To this end, reasonable incentives should be provided to VRS plants that curtail generation for balancing purposes.


