
Electricity Production and Sustainable Development: The Role of Renewable Energy Sources and Specific Socioeconomic Factors


Abstract
:1. Introduction
2. State of the Art
2.1. GDP Contribution on CO2 Emissions
2.2. The Role of Urbanization in Energy Consumption and CO2 Emissions
2.2.1. Urbanization and Energy Consumption Nexus
2.2.2. Urbanization and CO2 Emissions Nexus
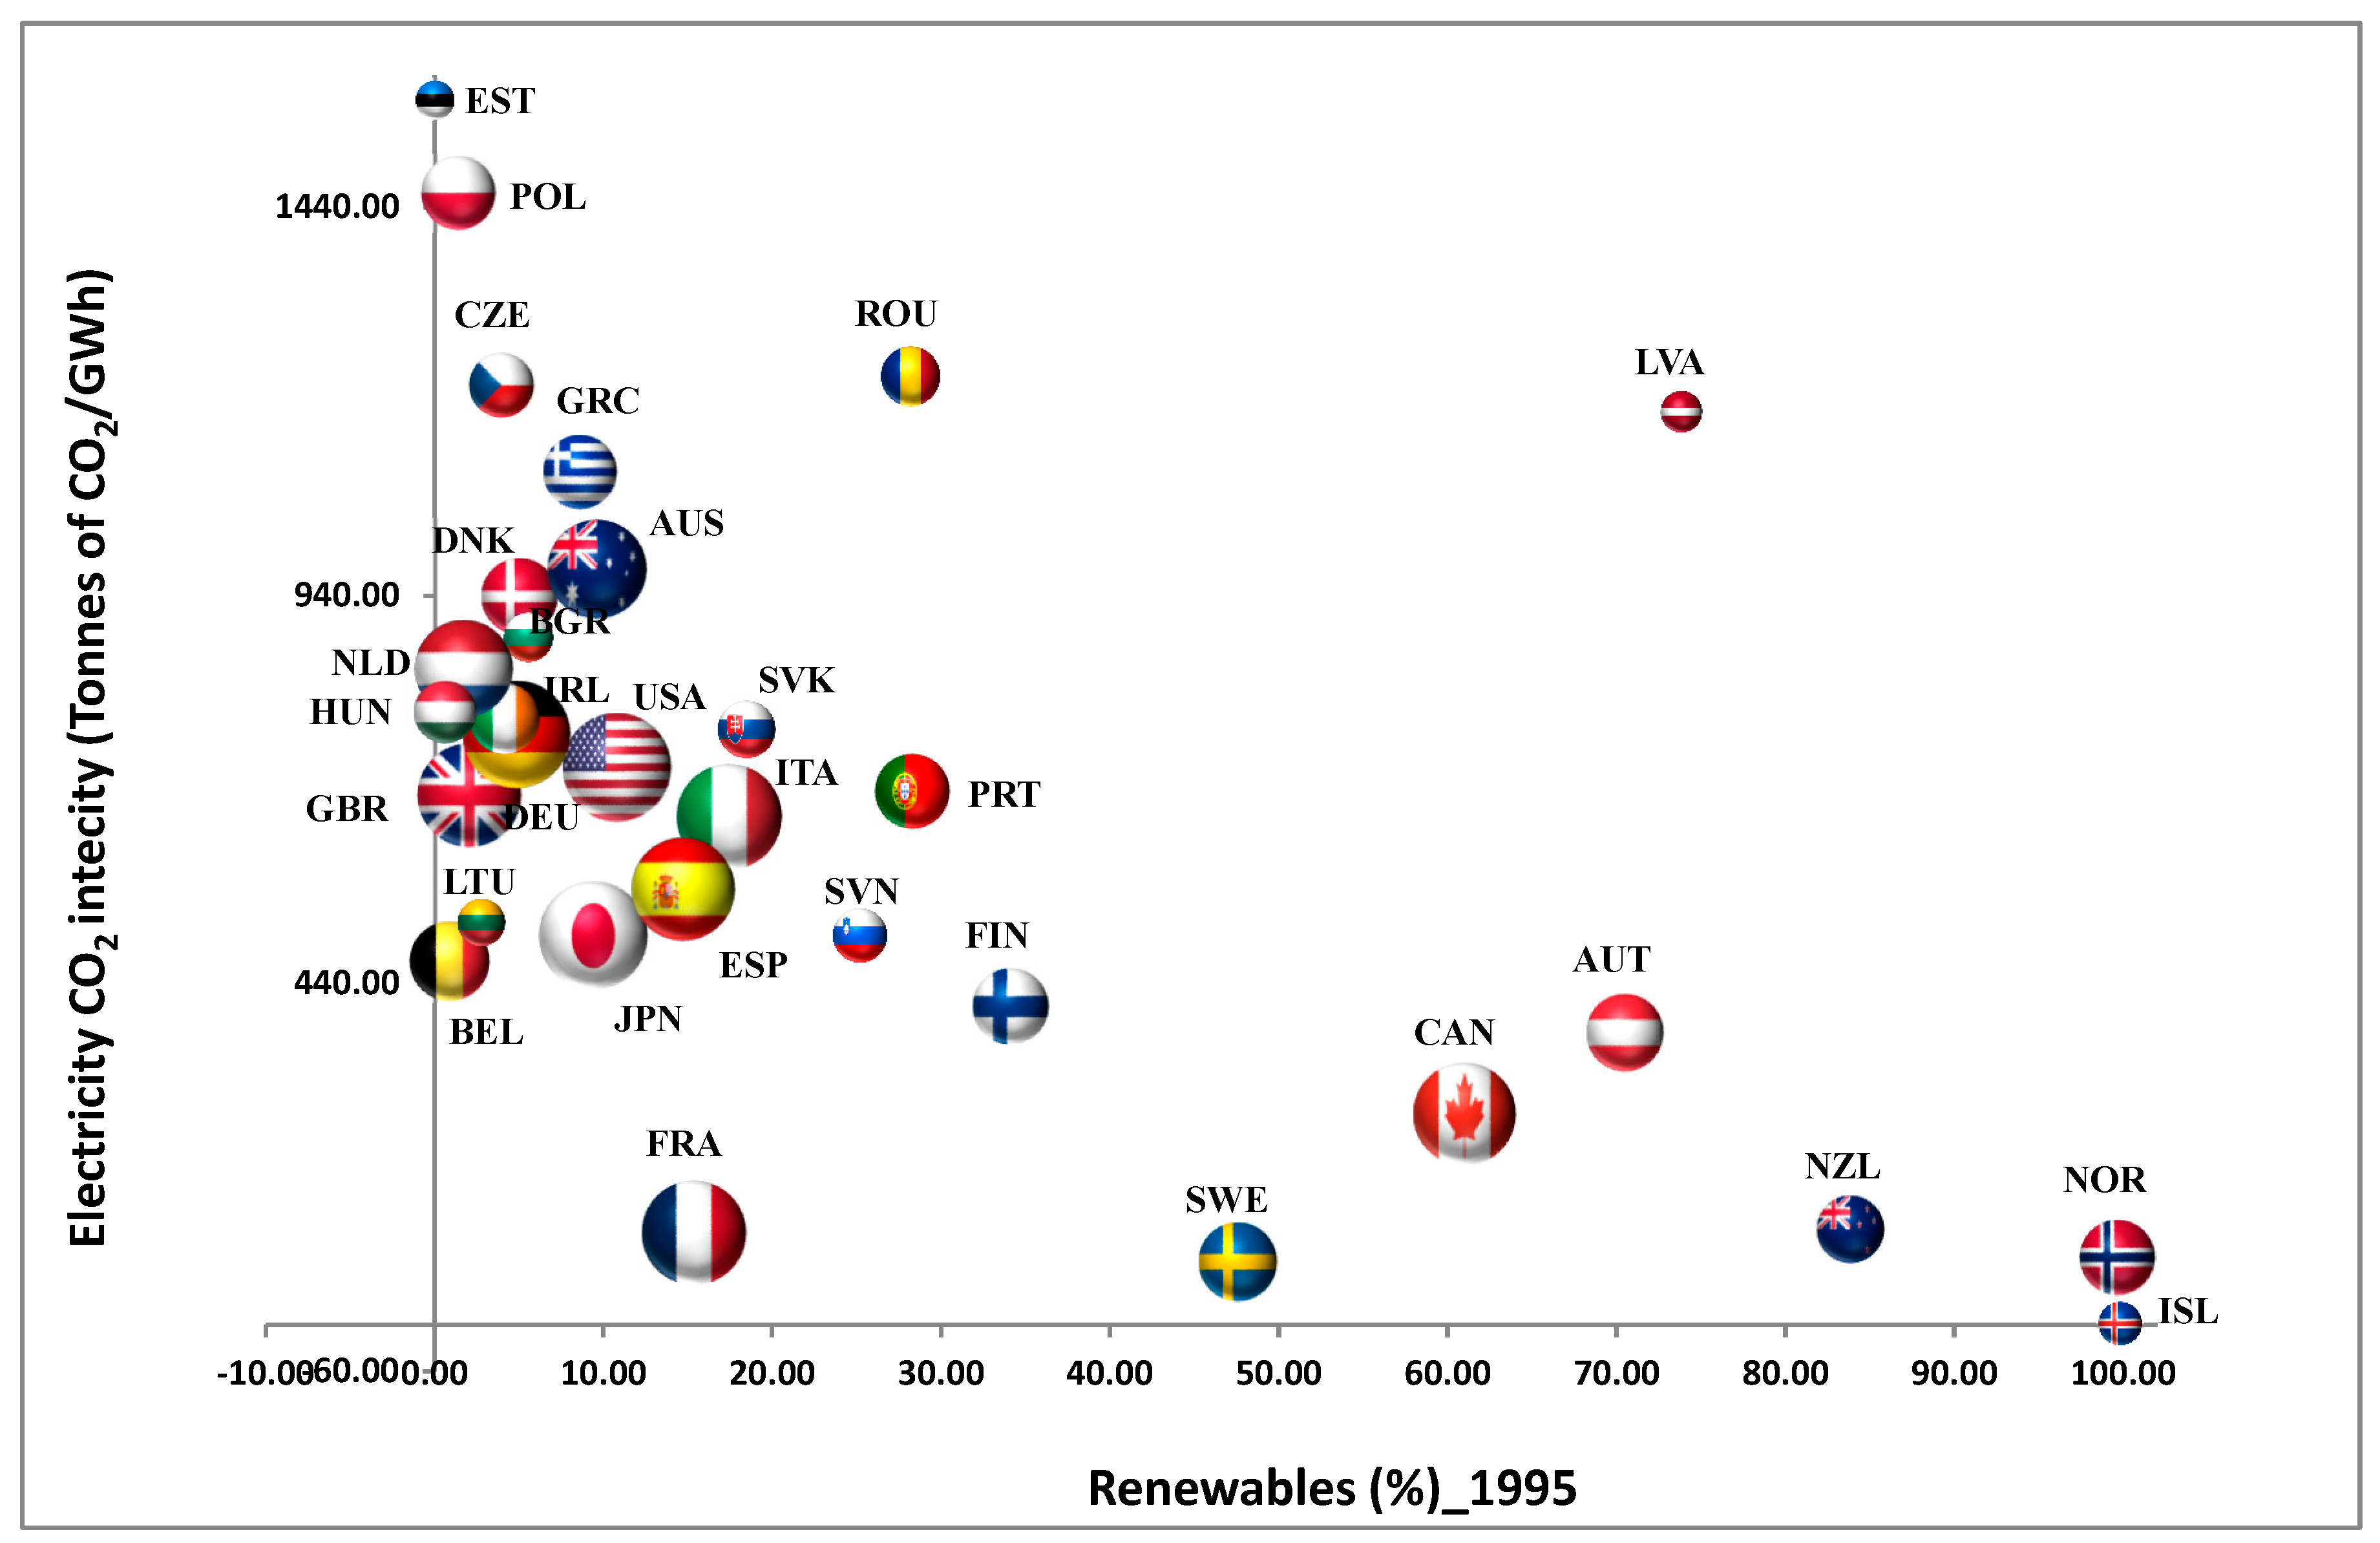
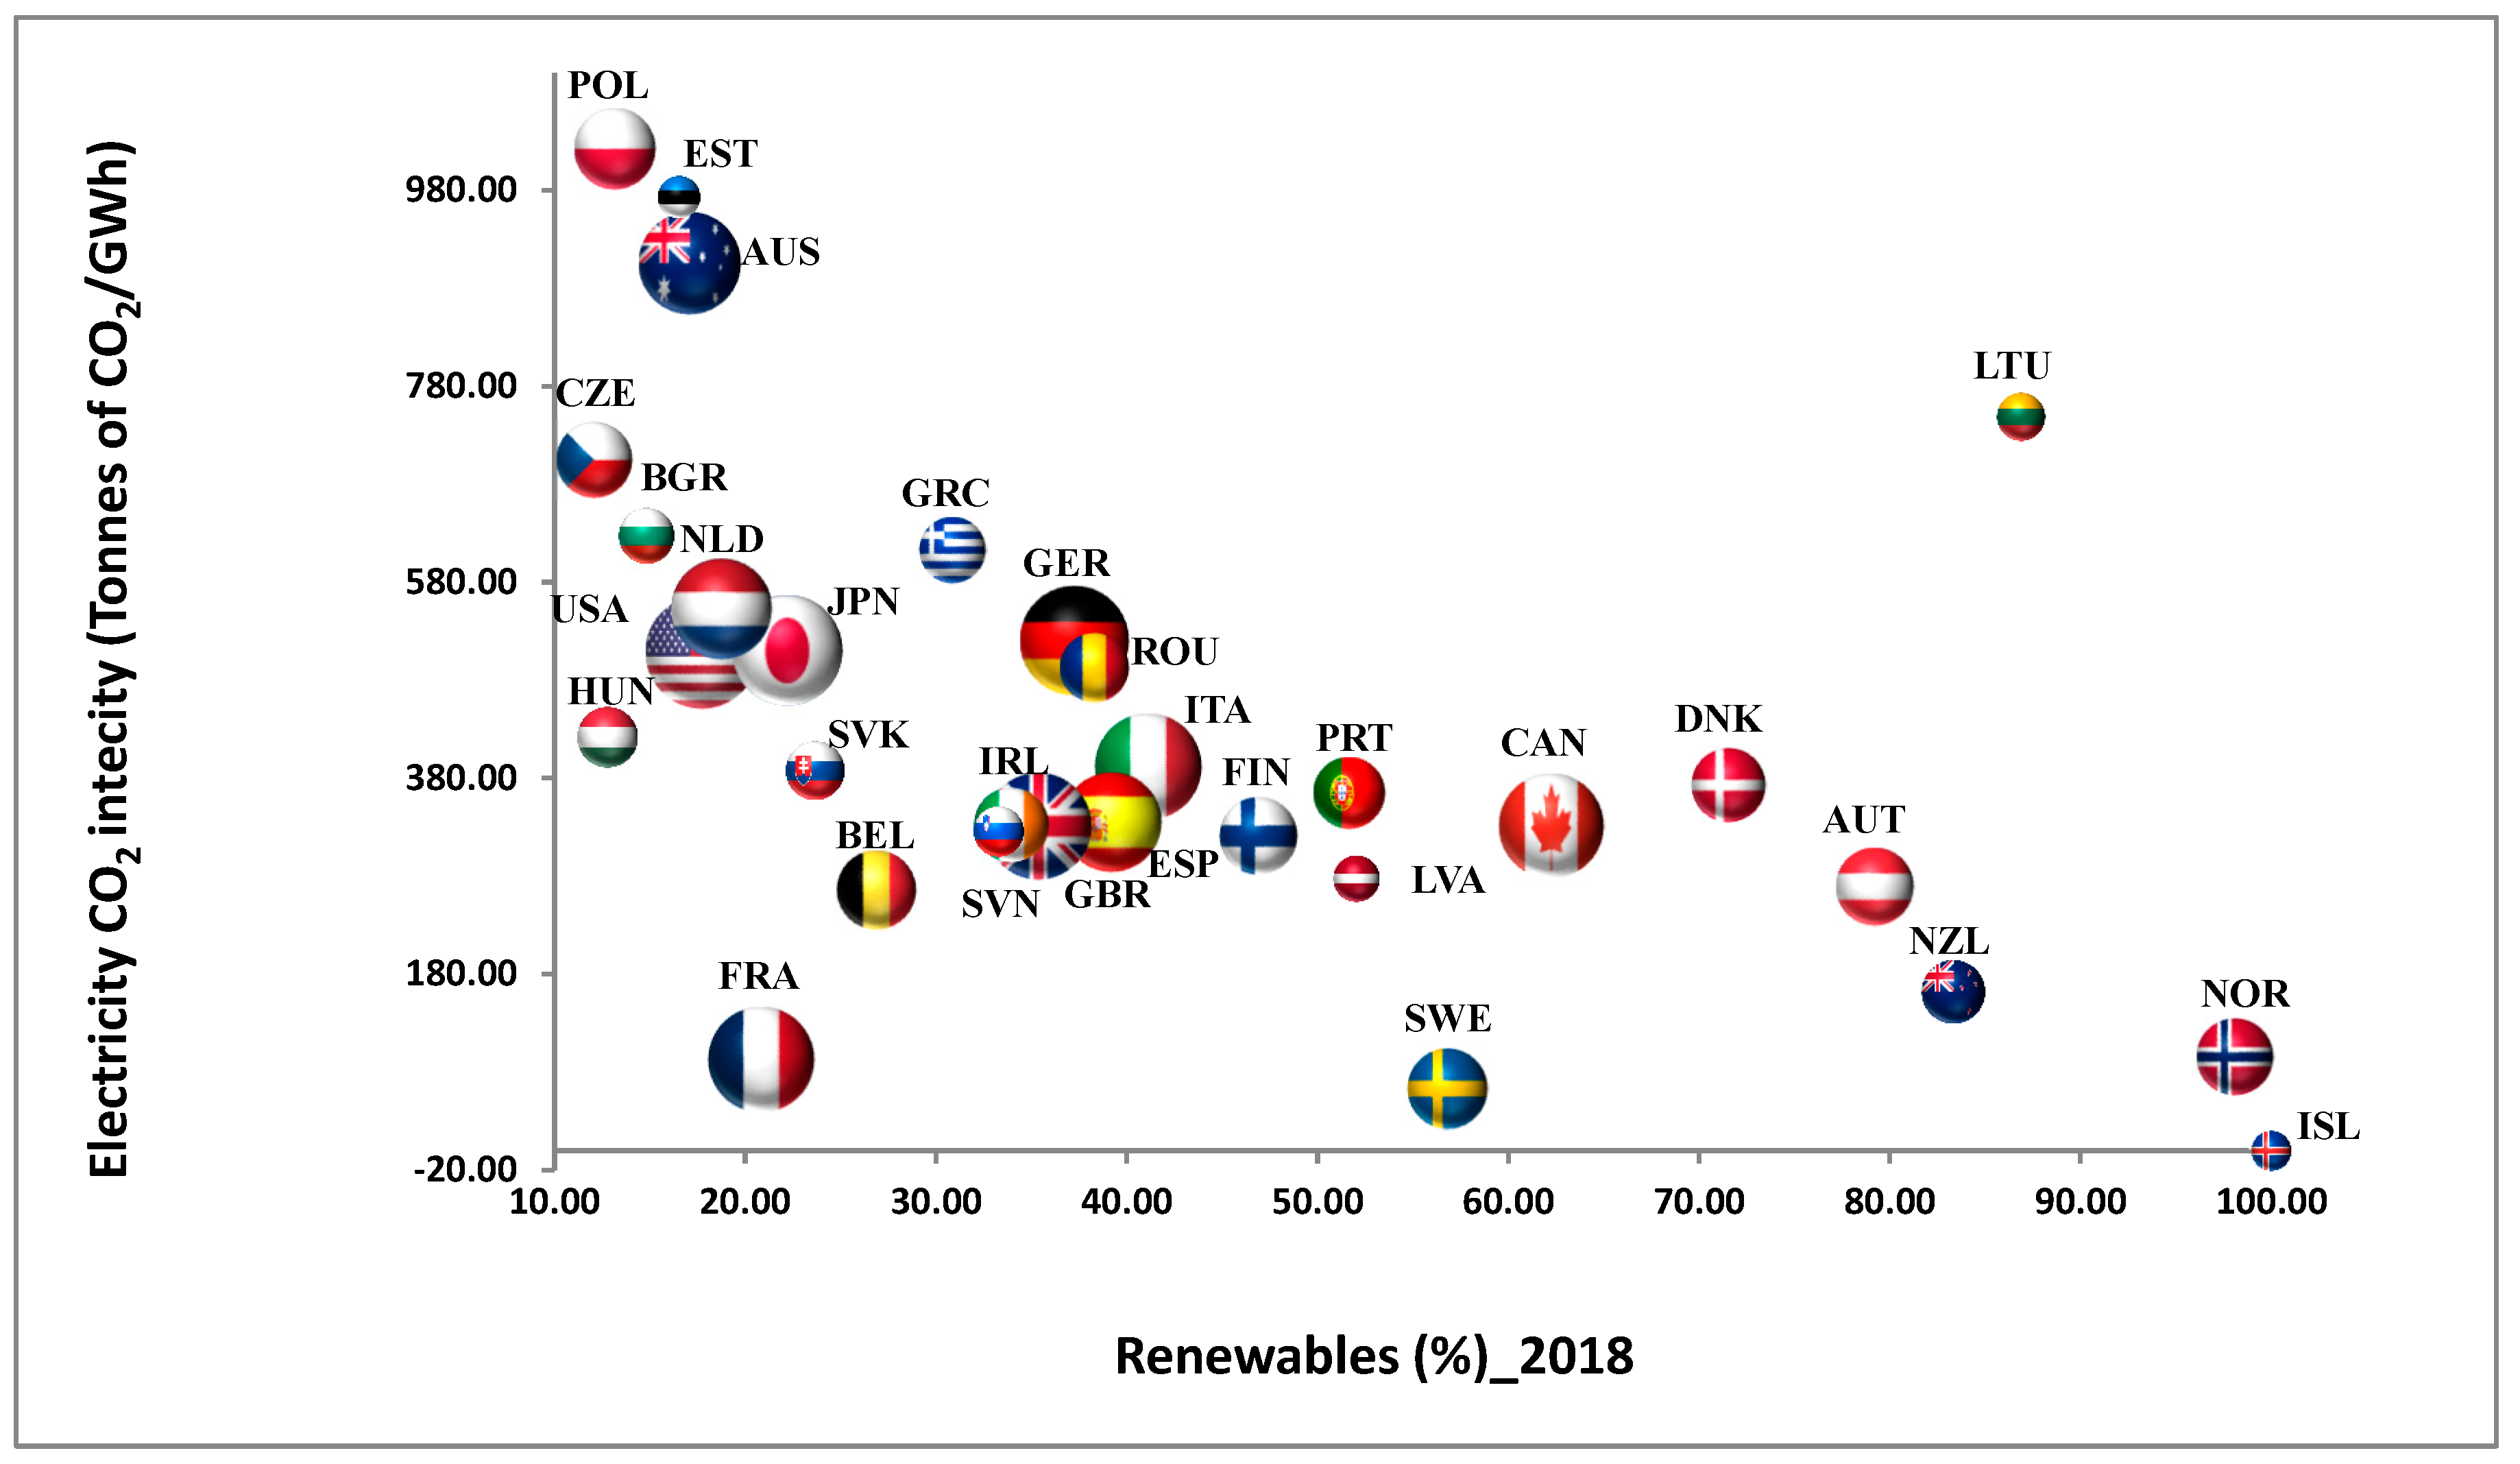
2.3. RES Electricity Production and CO2 Emissions
2.4. The Impact of Capital Investments on Electricity Consumption and CO2 Emissions
3. Methodology and Data
3.1. Data Summary
3.2. Causality Testing between Model Variables
3.3. Models Specification
3.4. Testing for Cross-Section Dependence
3.5. Panel Unit Root Test
3.6. Panel Cointegration Tests
3.7. Heteroskedasticity, Serial-Correlation and Omitted Variable Tests
3.8. Econometric Modelling
3.8.1. Static Modelling
3.8.2. Dynamic Modelling
4. Empirical Analysis and Results
5. Discussion and Policy Implications
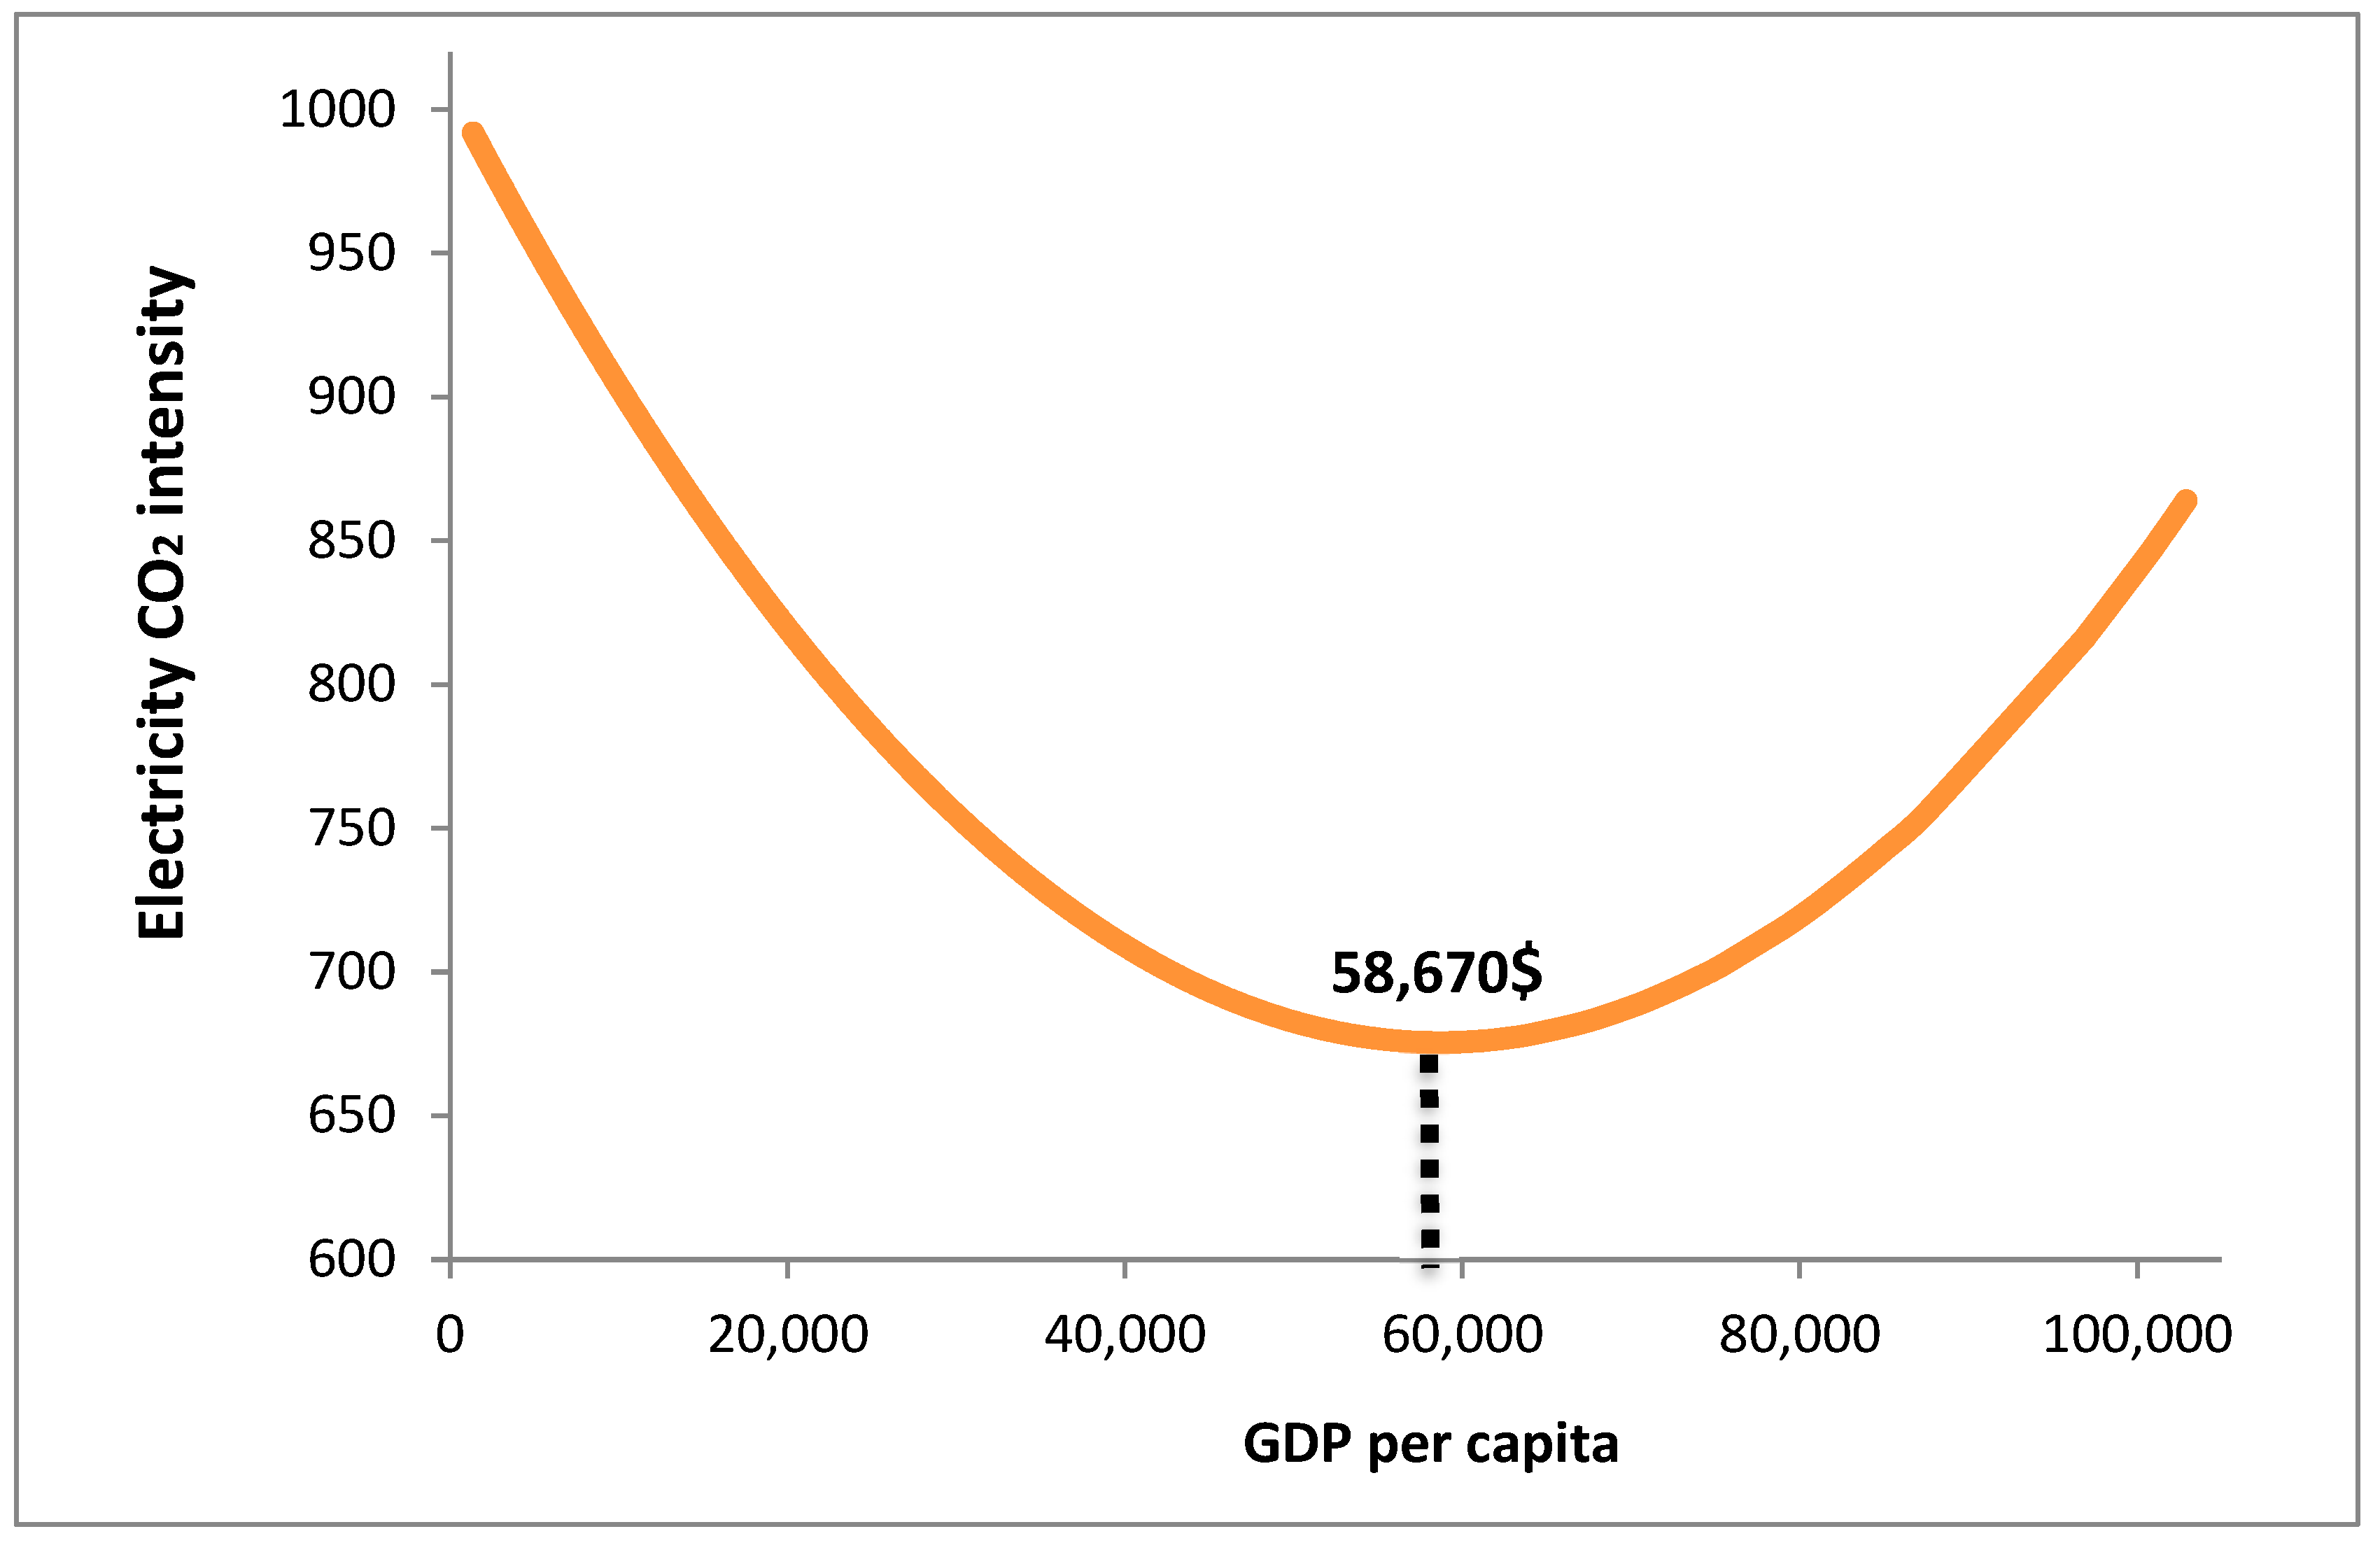
5.1. GDP per Capita
5.2. Urbanization
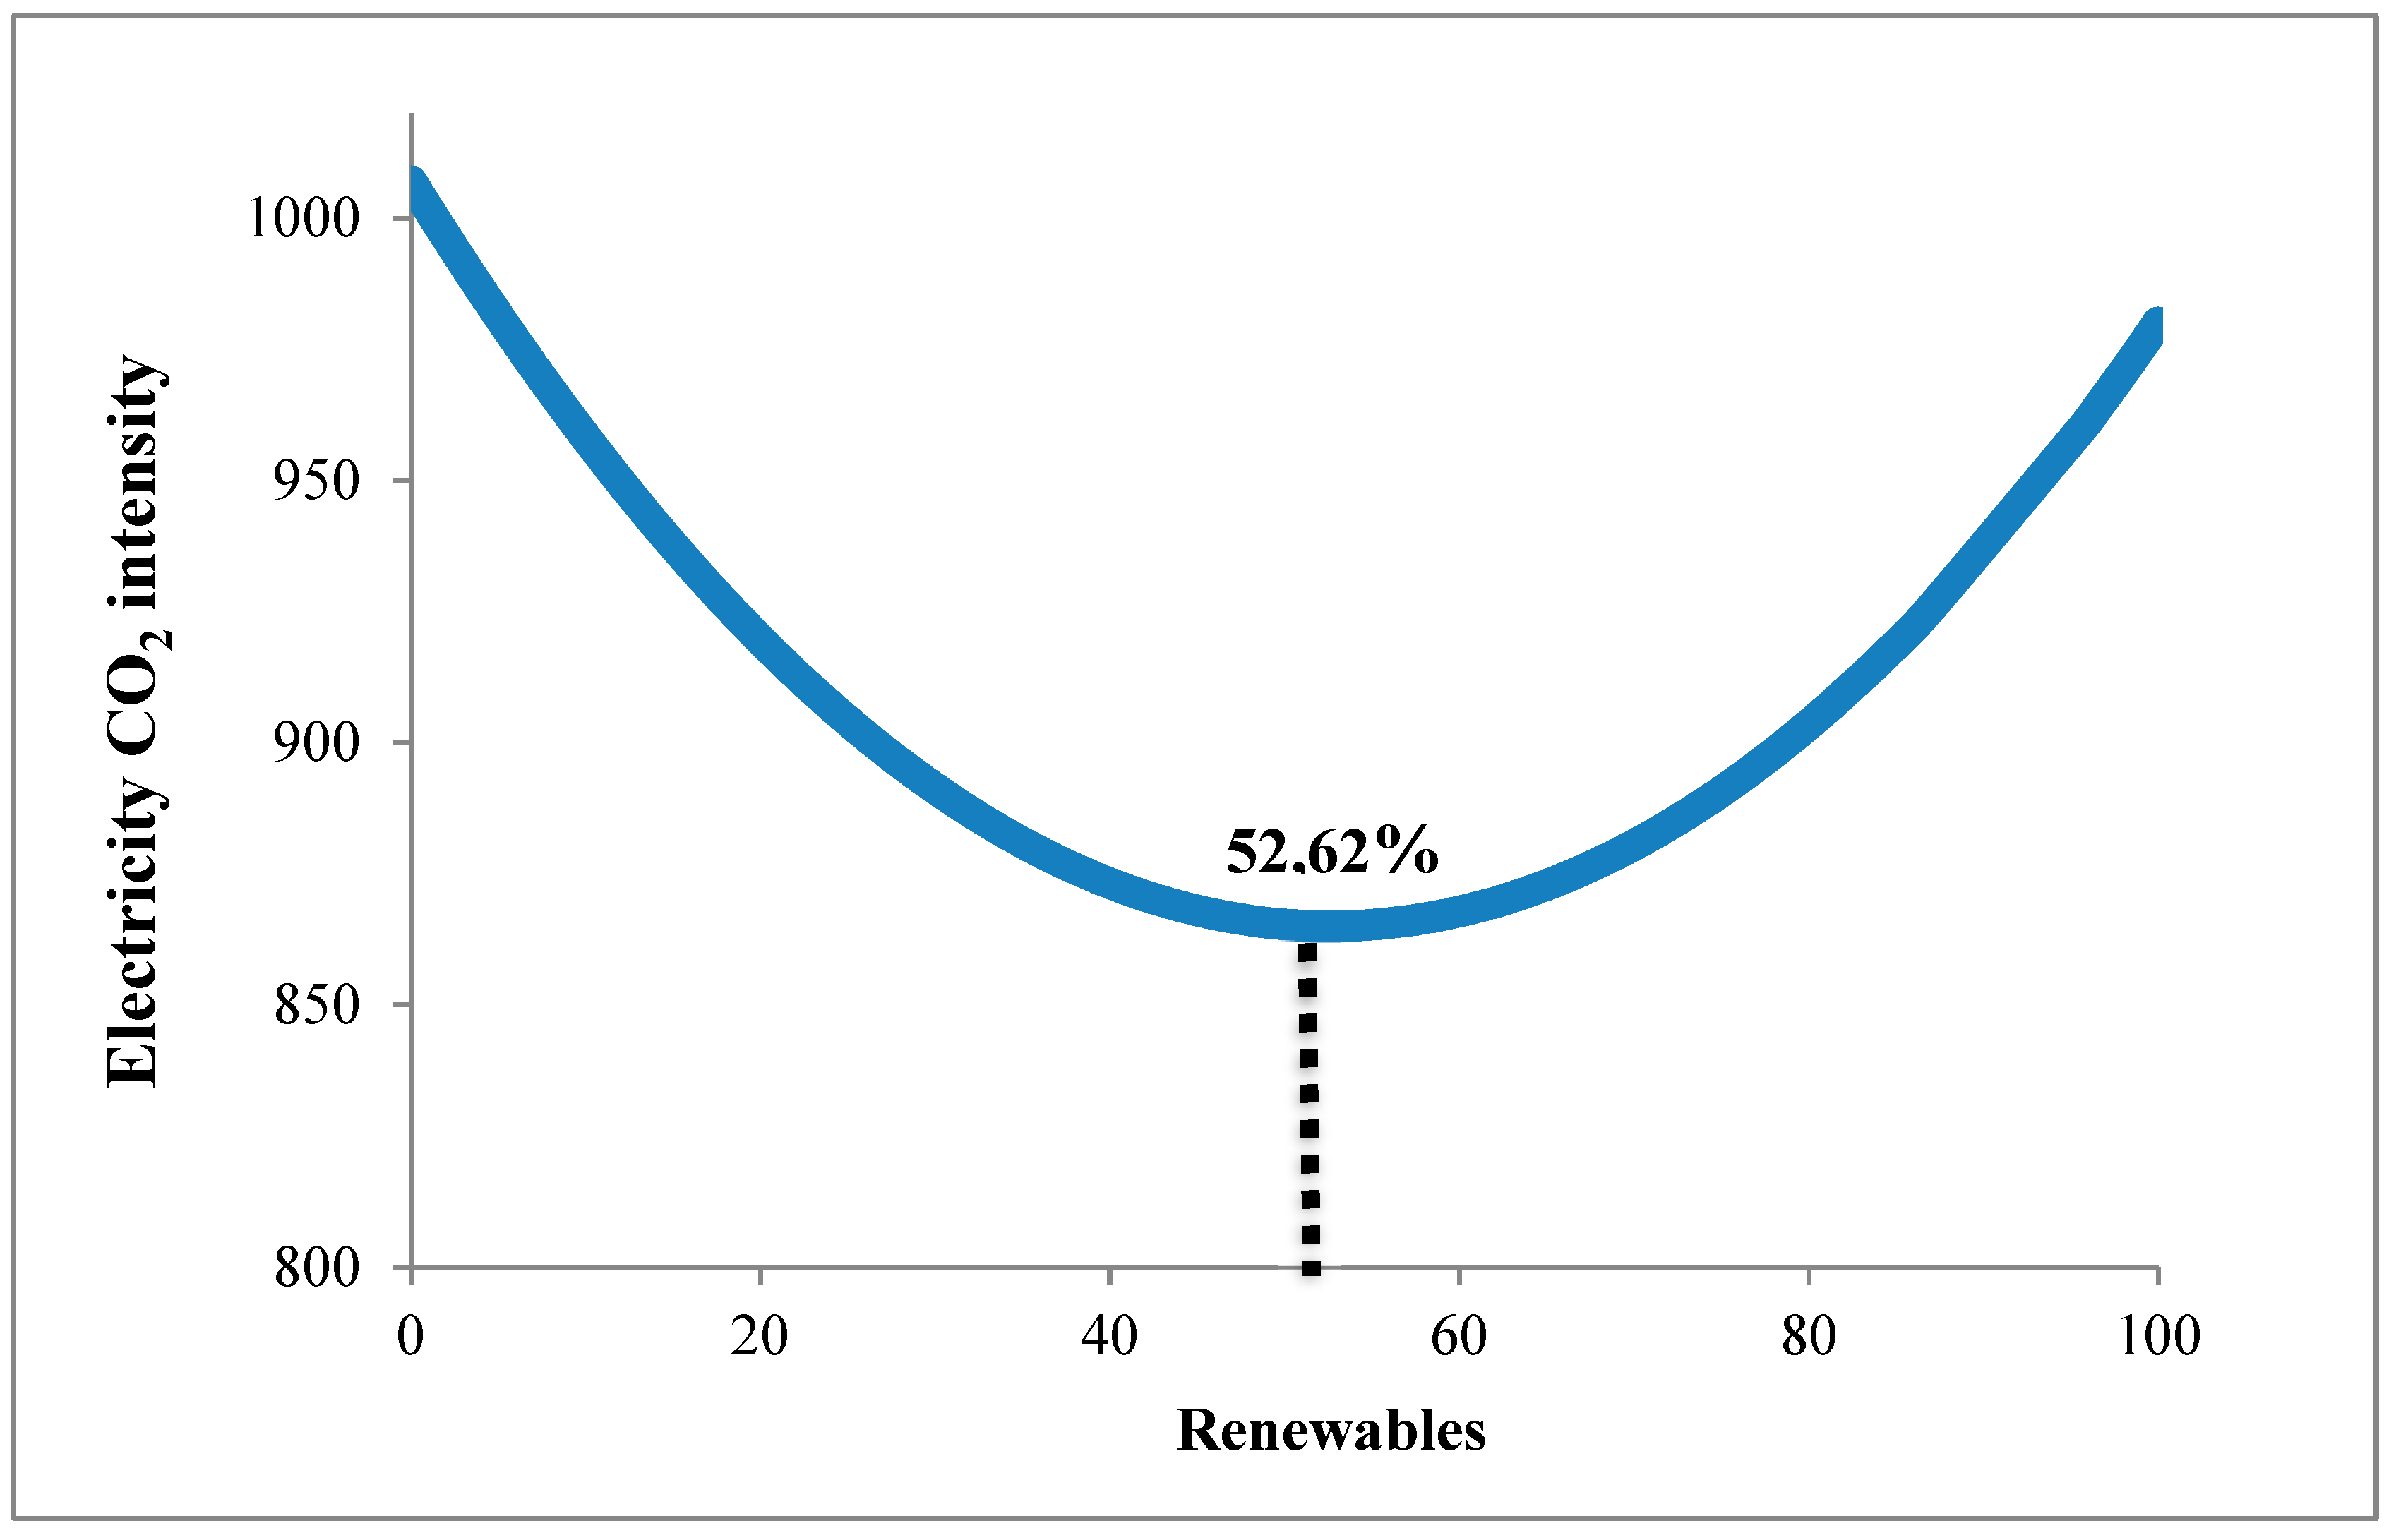
5.3. Renewables
5.4. Electricity Sector’s GFCF
6. Conclusions
Author Contributions
Funding
Data Availability Statement
Conflicts of Interest
Abbreviations
| EU | European Union |
| GPD | Gross Domestic Products |
| GFCG | Gross Fixed Capital Formation |
| GWh | Giga Watt hour |
| RES | Renewable Energy Sources |
| UN | United Nations |
References
- United Nations Economic Commission for Europe Carbon. Neutrality in the UNECE Region: Integrated Life-Cycle Assessment of Electricity Sources. March 2022. Available online: https://unece.org/sed/documents/2021/10/reports/life-cycle-assessment-electricity-generation-options (accessed on 10 December 2022).
- UN General Assembly, Transforming Our World: The 2030 Agenda for Sustainable Development, 21 October 2015 A/RES/70/1. Available online: https://www.refworld.org/docid/57b6e3e44.html (accessed on 31 December 2022).
- European Parliament. Amendments Adopted by the European Parliament on 8 October 2020 on the Proposal for a Regulation of the European Parliament and of the Council Establishing the Framework for Achieving Climate Neutrality and Amending Regulation (EU) 2018/1999. 2020. Available online: https://eur-lex.europa.eu/legal-content/EN/TXT/?uri=CELEX:52020AP0253 (accessed on 31 December 2022).
- European Commission. Directorate-General for Communication, Decarbonising our Energy System to Meet Our Climate Goals, Publications Office of the European Union. 2021. Available online: https://data.europa.eu/doi/10.2775/582723 (accessed on 30 June 2022).
- Gilbert, A.; Sovacool, B.K. US Liquefied Natural Gas (LNG) exports: Boom or bust for the global climate? Energy 2017, 141, 1671–1680. [Google Scholar] [CrossRef]
- European Commission. Proposal for a Regulation of the European Parliament and of the Council Establishing a Social Climate Fund, COM (2021), 2021/0206 (COD). Available online: https://eur-lex.europa.eu/legal-content/en/ALL/?uri=CELEX:52021PC0568 (accessed on 31 December 2022).
- Armeanu, D.S.; Joldes, C.C.; Gherghina, S.C.; Andrei, J.V. Understanding the multidimensional linkages among renewable energy, pollution, economic growth and urbanization in contemporary economies: Quantitative assessments across different income countries’ groups. Renew. Sustain. Energy Rev. 2021, 142, 10818. [Google Scholar] [CrossRef]
- Grossman, G.M.; Krueger, A.B. Economic growth and the environment. Q. J. Econ. 1995, 110, 353–377. [Google Scholar] [CrossRef] [Green Version]
- Halkos, G.E. Environmental Kuznets curve for sulphur: Evidence using GMM estimation and random coefficient panel data models. Environ. Dev. Econ. 2003, 8, 581–601. [Google Scholar] [CrossRef]
- Anwar, M.A.; Zhang, Q.; Asmi, F.; Hussain, N.; Plantinga, A.; Zafar, M.W.; Sinha, A. Global perspectives on environmental kuznets curve: A bibliometric review. Gondwana Res. 2022, 103, 135–145. [Google Scholar] [CrossRef]
- Sarkodie, S.A.; Strezov, V. A review on Environmental Kuznets Curve hypothesis using bibliometric and meta-analysis. Sci. Total Environ. 2019, 649, 128–145. [Google Scholar] [CrossRef]
- Kacprzyk, A.; Kuchta, Z. Shining a new light on the environmental Kuznets curve for CO2 emissions. Energy Econ. 2020, 87, 104704. [Google Scholar] [CrossRef]
- Wang, Q.; Wu, S.; Zeng, Y.; Wu, B. Exploring the relationship between urbanization, energy consumption, and CO2 emissions in different provinces of China. Renew. Sustain. Energy Rev. 2016, 54, 1563–1579. [Google Scholar] [CrossRef]
- Shahbaz, M.; Chaudhary, A.R.; Ozturk, I. Does urbanization cause increasing energy demand in Pakistan? Empirical evidence from STIRPAT model. Energy 2017, 122, 83–93. [Google Scholar] [CrossRef] [Green Version]
- Bakirtas, T.; Akpolat, A.G. The relationship between energy consumption, urbanization, and economic growth in new emerging-market countries. Energy 2018, 147, 110–121. [Google Scholar] [CrossRef]
- Charfeddine, L. The impact of energy consumption and economic development on Ecological Footprint and CO2 emissions: Evidence from a Markov Switching Equilibrium Correction Model. Energy Econ. 2017, 65, 355–374. [Google Scholar] [CrossRef]
- Faisal, F.; Tursoy, T.; Gunsel Resatoglu, N.; Berk, N. Electricity consumption, economic growth, urbanisation and trade nexus: Empirical evidence from Iceland. Econ. Res.-Ekon. Istraž. 2018, 31, 664–680. [Google Scholar] [CrossRef] [Green Version]
- Wei, W.; Zhang, P.; Yao, M.; Xue, M.; Miao, J.; Liu, B.; Wang, F. Multi-scope electricity-related carbon emissions accounting: A case study of Shanghai. J. Clean. Prod. 2020, 252, 119789. [Google Scholar] [CrossRef]
- Huang, S.Z.; Sadiq, M.; Chien, F. Dynamic nexus between transportation, urbanization, economic growth and environmental pollution in ASEAN countries: Does environmental regulations matter? Environ. Sci. Pollut. Res. 2021. [Google Scholar] [CrossRef]
- Grodzicki, Τ.; Jankiewicz, Μ. The impact of renewable energy and urbanization on CO2 emissions in Europe—Spatio-temporal approach. Environ. Dev. 2022, 44, 100755. [Google Scholar] [CrossRef]
- Lin, B.; Li, Z. Is more use of electricity leading to less carbon emission growth? An analysis with a panel threshold model. Energy Policy 2020, 137, 111121. [Google Scholar] [CrossRef]
- Shafiei, S.; Salim, R.A. Non-renewable and renewable energy consumption and CO2 emissions in OECD countries: A comparative analysis. Energy Policy 2014, 66, 547–556. [Google Scholar] [CrossRef] [Green Version]
- Zhang, C.; Lin, Y. Panel Estimation for Urbanisation, Energy Consumption and CO2 Emissions: A Regional Analysis in China. Energy Policy 2012, 49, 488–498. [Google Scholar] [CrossRef]
- Rafiq, S.; Salim, R.; Nielsen, I. Urbanization, openness, emissions and energy intensity: A study of increasingly urbanized emerging economies. Energy Econ. 2016, 56, 20–28. [Google Scholar] [CrossRef]
- Sadorsky, P. The effect of urbanization on CO2 emissions in emerging economies. Energy Econ. 2014, 41, 147–153. [Google Scholar] [CrossRef]
- Sun, C.; Zhang, F.; Xu, M. Investigation of pollution haven hypothesis for China: An ARDL approach with breakpoint unit root tests. J. Clean. Prod. 2017, 161, 153–164. [Google Scholar] [CrossRef]
- Ehigiamusoe, K.U. A disaggregated approach to analyzing the effect of electricity on carbon emissions: Evidence from African countries. Energy Rep. 2020, 6, 1286–1296. [Google Scholar] [CrossRef]
- Moutinho, V.; Madaleno, M.; Inglesi-Lotz, R.; Dogan, E. Factors affecting CO2 emissions in top countries on renewable energies: A LMDI decomposition application. Energy Rev. 2018, 90, 605–622. [Google Scholar] [CrossRef] [Green Version]
- Saidi, K.; Omri, A. The impact of renewable energy on carbon emissions and economic growth in 15 major renewable energy-consuming countries. Environ. Res. 2020, 186, 109567. [Google Scholar] [CrossRef] [PubMed]
- Balsalobre-Lorente, D.; Shahbaz, M.; Roubaud, D.; Farhani, S. How economic growth, renewable electricity and natural resources contribute to CO2 emissions? Energy Policy 2018, 113, 356–367. [Google Scholar] [CrossRef] [Green Version]
- Bekun, F.V.; Alola, A.A.; Sarkodie, S.A. Toward a sustainable environment: Nexus between CO2 emissions, resource rent, renewable and nonrenewable energy in 16-EU countries. Sci. Total Environ. 2018, 657, 1023–1029. [Google Scholar] [CrossRef]
- Zeqiraj, V.; Sohag, K.; Soytas, U. Stock market development and low-carbon economy: The role of innovation and renewable energy. Energy Econ. 2020, 91, 104908. [Google Scholar] [CrossRef]
- Cheng, C.; Ren, X.; Wang, Z. The impact of renewable energy and innovation on carbon emission: An empirical analysis for OECD countries. Energy Procedia 2019, 158, 3506–3512. [Google Scholar] [CrossRef]
- Teng, J.-Z.; Khan, M.K.; Khan, M.I.; Chishti, M.Z.; Khan, M.O. Effect of foreign direct investment on CO2 emission with the role of globalization, institutional quality with pooled mean group panel ARDL. Environ. Sci. Pollut. Res. 2021, 28, 5271–5282. [Google Scholar] [CrossRef] [PubMed]
- Mujtaba, A.; Kumar, P.J.; Victor, F.B.; Kumar, P.S. Symmetric and asymmetric impact of economic growth, capital formation, renewable and non-renewable energy consumption on environment in OECD countries. Renew. Sustain. Energy Rev. 2022, 160, 112300. [Google Scholar] [CrossRef]
- Adams, S.; Acheampong, A.O. Reducing carbon emissions: The role of renewable energy and democracy. J. Clean. Prod. 2019, 240, 118245. [Google Scholar] [CrossRef]
- Chen, Y.; Wang, Z.; Zhong, Z. CO2 emissions, economic growth, renewable and non-renewable energy production and foreign trade in China. Renew. Energy 2019, 131, 208–216. [Google Scholar] [CrossRef]
- Leitão, N.C.; Balsalobre-Lorente, D.; Cantos-Cantos, J.M. The Impact of Renewable Energy and Economic Complexity on Carbon Emissions in BRICS Countries under the EKC Scheme. Energies 2021, 14, 4908. [Google Scholar] [CrossRef]
- Halkos, G.E. Exploring the economy–environment relationship in the case of sulphur emissions GE Halkos. J. Environ. Plan. Manag. 2013, 56, 159–177. [Google Scholar] [CrossRef]
- Charfeddine, L.; Kahia, M. Impact of renewable energy consumption and financial development on CO2 emissions and economic growth in the MENA region: A panel vector autoregressive (PVAR) analysis. Renew. Energy 2019, 139, 198–213. [Google Scholar] [CrossRef]
- Shahbaz, M.; Nasir, M.A.; Roubaud, D. Environmental degradation in France: The effects of FDI, financial development, and energy innovations. Energy Econ. 2018, 74, 843–857. [Google Scholar] [CrossRef] [Green Version]
- Hanif, I.; Faraz Raza, S.M.; Gago-de-Santos, P.; Abbas, Q. Fossil fuels, foreign direct investment, and economic growth have triggered CO2 emissions in emerging Asian economies: Some empirical evidence. Energy 2019, 171, 493–501. [Google Scholar] [CrossRef]
- Sodersten, C.-J.; Wood, R.; Hertwich, E.C. Environmental Impacts of Capital Formation. J. Ind. Ecol. 2017, 22, 55–67. [Google Scholar] [CrossRef]
- Rahman, Z.U.; Ahmad, M. Modeling the relationship between gross capital formation and CO2 (a)symmetrically in the case of Pakistan: An empirical analysis through NARDL approach. Environ. Sci. Pollut. Res. 2019, 26, 8111–8124. [Google Scholar] [CrossRef]
- Shahbaz, M.; Hye, Q.M.A.; Tiwari, A.K.; Leitão, N.C. Economic growth, energy consumption, financial development, international trade and CO2 emissions in Indonesia. Renew. Sustain. Energy Rev. 2013, 25, 109–121. [Google Scholar] [CrossRef]
- Baek, J. A new look at the FDI–income–energy–environment nexus: Dynamic panel data analysis of ASEAN. Energy Policy 2016, 91, 22–27. [Google Scholar] [CrossRef]
- Ozturk, I.; Acaravci, A. The long-run and causal analysis of energy, growth, openness and financial development on carbon emissions in Turkey. Energy Econ. 2013, 36, 262–267. [Google Scholar] [CrossRef]
- Cheng, Z.; Li, L.; Liu, J. The emissions reduction effect and technical progress effect of environmental regulation policy tools. J. Clean. Prod. 2017, 149, 191–205. [Google Scholar] [CrossRef]
- World Bank; OECD. GDP per Capita (Current US$), World Bank National Accounts Data and OECD National Accounts Data files, NY.GDP.PCAP.CD. 2022. Available online: https://data.worldbank.org/indicator/NY.GDP.PCAP.CD (accessed on 30 June 2022).
- World Bank; United Nations; Urban Population (% of Total Population); United Nations Population Division. World Urbanization Prospects: 2018 Revision, SP.URB.TOTL.IN.ZS. 2018. Available online: https://data.worldbank.org/indicator/SP.URB.TOTL.IN.ZS (accessed on 30 June 2022).
- OECD. Gross Fixed Capital Formation/Electricity Sector, Capital Formation by Activity ISIC rev4. 2020. Available online: https://stats.oecd.org/Index.aspx?DataSetCode=SNA_TABLE8A (accessed on 30 June 2022).
- U.S. Energy Information Administration; Electricity Generation from Renewables (GWh). Interantional/Electricity. 2022. Available online: https://www.eia.gov/international/data/world/electricity/electricity-generation (accessed on 30 June 2022).
- OECD. Electricity Generation (Indicator); OECD: Paris, France, 2022. [Google Scholar] [CrossRef] [Green Version]
- IEA. CO2 Emissions from Electricity Total (% of Total Fuel Combustion) Energy and Carbon Tracker. 2020. Available online: https://webstore.iea.org/iea-energy-and-carbon-tracker (accessed on 30 June 2022).
- IEA. CO2 Emissions from Fuel Combustion, IEA World Energy Balances. 2020. Available online: https://webstore.iea.org/co2-emissions-from-fuel-combustion-2020-highlights (accessed on 30 June 2022).
- Dumitrescu, E.I.; Hurlin, C. Testing for Granger non-causality in heterogeneous panels. Econ. Model. 2012, 29, 1450–1460. [Google Scholar] [CrossRef] [Green Version]
- Pesaran, M.H. General Diagnostic Tests for Cross Section Dependence in Panels; Cambridge Working Papers No: 0435 in Economics; Faculty of Economics, University of Cambridge: Cambridge, UK, 2004. [Google Scholar] [CrossRef]
- Pesaran, M.H. Testing Weak Cross-Sectional Dependence in Large Panels. Econ. Rev. 2015, 34, 1089–1117. [Google Scholar] [CrossRef] [Green Version]
- Friedman, M. The use of ranks to avoid the assumption of normality implicit in the analysis of variance. J. Am. Stat. Assoc. 1937, 32, 675–701. [Google Scholar] [CrossRef]
- Frees, E.W. Assessing cross-sectional correlation in panel data. J. Econom. 1995, 69, 393–414. [Google Scholar] [CrossRef]
- Westerlund, J. Testing for error correction in panel data. Oxf. Bull. Econ. Stat. 2007, 69, 709–748. [Google Scholar] [CrossRef]
- Demetriades, P.O.; James, G. Finance and Growth in Africa: The Broken Link. SSRN Electron. J. 2011, 113, 263–265. [Google Scholar] [CrossRef] [Green Version]
- Pedroni, P. Panel co-integration: Asymptotic and finite sample properties of pooled time series tests with an applicaton to the PPP hypothesis. Econom. Theory 2004, 20, 597–625. [Google Scholar] [CrossRef] [Green Version]
- Breusch, T.S.; Pagan, A.R. A Simple Test for Heteroscedasticity and Random Coefficient Variation. Econometrica 1979, 47, 1287–1294. [Google Scholar] [CrossRef]
- Glejser, H. A New Test for Heteroskedasticity. J. Am. Stat. Assoc. 1969, 64, 316. [Google Scholar] [CrossRef]
- Harvey, A.C. Estimating Regression Models with Multiplicative Heteroscedasticity. Econometrica 1976, 44, 461. [Google Scholar] [CrossRef]
- White, H. A heteroscedasticity Consistent Covariance Matrix Estimator and a Direct Test of Heteroscedasticity. Econometrica 1980, 48, 817–838. [Google Scholar] [CrossRef]
- Wooldridge, J.M. Econometric Analysis of Cross Section and Panel Data; MIT Press: Cambridge, MA, USA, 2010; Available online: http://www.jstor.org/stable/j.ctt5hhcfr (accessed on 30 June 2022).
- Breusch, T.S.; Pagan, A.R. The Lagrange Multiplier Test and its Applications to Model Specification in Econometrics. Rev. Econ. Stud. 1980, 47, 239–253. [Google Scholar] [CrossRef]
- Hausman, J.A. Specification Tests in Econometrics. Econometrica 1978, 46, 1251–1271. [Google Scholar] [CrossRef] [Green Version]
- Driscoll, J.; Kraay, A. Consistent covariance matrix estimation with spatially dependent panel data. Rev. Econ. Stat. 1998, 80, 549–560. [Google Scholar] [CrossRef]
- Blundell, R.; Bond, S. Initial conditions and moment restrictions in dynamic panel data models. J. Econ. 1998, 87, 115–143. [Google Scholar] [CrossRef]
- Arellano, M.; Bond, S.R. Some Tests of Specification for Panel Data: Monte Carlo Evidence and an Application to Employment Equations. Rev. Econ. Stud. 1991, 58, 277–297. [Google Scholar] [CrossRef] [Green Version]
- Windmeijer, F. A finite sample correction for the variance of linear efficient two-step GMM estimators. J. Econ. 2005, 126, 25–51. [Google Scholar] [CrossRef]


| Electricity CO2 Intensity (1) (Metric Tons per GWh) | GDP per Capita (2) (Current USD) | Electricity GFCF (3) (% GDP) | Urbanization (4) (% Total Population) | Renewables (5) (% Total Fuel Mix) | |
|---|---|---|---|---|---|
| Mean | 562.51 | 29,193.68 | 1.18 | 74.02 | 29.81 |
| Median | 520.00 | 26,870.75 | 0.88 | 75.60 | 28.22 |
| Std. dev. | 329.96 | 18,374.73 | 2.61 | 11.82 | 18.33 |
| Minimum | 0.00 | 1348.83 | 0.00 | 50.62 | 0.00 |
| Maximum | 1821.60 | 102,913.50 | 6.31 | 98.00 | 99.99 |
| Skewness | 0.63 | 0.70 | 24.02 | −0.15 | 1.11 |
| Kurtosis | 3.45 | 3.56 | 626.71 | 2.23 | 3.18 |
| Jarque-Bera | 55.04 *** (0.0000) | 69.79 *** (0.0000) | 0.00 *** (0.0000) | 21.11 *** (0.0000) | 155.00 *** (0.0000) |
| Variable | Electricity CO2 Intensity | GDP per Capita | GDP per Capita2 | Electricity GFCF | Urbanization | Renewables | Renewables2 |
|---|---|---|---|---|---|---|---|
| Electricity CO2 Intensity | 1.0000 | ||||||
| GDP per capita | −0.4772 *** | 1.0000 | |||||
| (0.0000) | |||||||
| GDP per capita2 | −0.3927 *** | 0.9371 *** | 1.0000 | ||||
| (0.0000) | (0.0000) | ||||||
| Electricity GFCF | 0.0694 * | −0.0495 | −0.0402 | 1.0000 | |||
| (0.0585) | (0.1778) | (0.2730) | |||||
| Urbanization | −0.3129 *** | 0.5310 *** | 0.4155 *** | 0.0113 | 1.0000 | ||
| (0.0000) | (0.0000) | (0.0000) | (0.7576) | ||||
| Renewables | −0.6191 *** | 0.3812 *** | 0.4002 *** | −0.0026 *** | 0.1580 *** | 1.0000 | |
| (0.0000) | (0.0000) | (0.0000) | (0.9445) | (0.0000) | |||
| Renewables2 | −0.5684 *** | 0.3901 *** | 0.4322 *** | 0.0160 | 0.2196 *** | 0.9576 *** | 1.0000 |
| (0.0000) | (0.0000) | (0.0000) | (0.6629) | (0.0000) | (0.0000) |
| Null Hypothesis: | Obs | Test-Statistic | p-Value |
|---|---|---|---|
| Electricity CO2 Intensity does not Granger Cause GDP per capita | 682 | 2.5523 | 0.0107 |
| GDP per capita does not Granger Cause Electricity CO2 Intensity | 682 | 7.7634 | 0.0000 |
| Electricity CO2 Intensity does not Granger Cause Electricity GFCF | 682 | 2.5363 | 0.0112 |
| Electricity GFCF does not Granger Cause Electricity CO2 Intensity | 682 | 3.7923 | 0.0001 |
| Electricity CO2 Intensity does not Granger Cause Urbanization | 682 | 1.5386 | 0.1239 |
| Urbanization does not Granger Cause Electricity CO2 Intensity | 682 | 9.5967 | 0.0000 |
| Electricity CO2 Intensity does not Granger Cause Renewables | 682 | 1.9598 | 0.1417 |
| Renewables does not Granger Cause Electricity CO2 Intensity | 682 | 12.002 | 0.0000 |
| GDP per capita does not Granger Cause Electricity GFCF | 682 | 5.3219 | 0.0051 |
| Electricity GFCF does not Granger Cause GDP per capita | 682 | 4.9294 | 0.0075 |
| GDP per capita does not Granger Cause Urbanization | 682 | 0.1142 | 0.8921 |
| Urbanization does not Granger Cause GDP per capita | 682 | 1.4370 | 0.2384 |
| GDP per capita does not Granger Cause Renewables | 682 | 5.9537 | 0.0027 |
| Renewables does not Granger Cause GDP per capita | 682 | 1.5914 | 0.2044 |
| Urbanization does not Granger Cause Electricity GFCF | 682 | 1.5536 | 0.2122 |
| Electricity GFCF does not Granger Cause Urbanization | 682 | 0.0184 | 0.9817 |
| Urbanization does not Granger Cause Renewables | 682 | 0.8356 | 0.4340 |
| Renewables does not Granger Cause Urbanization | 682 | 0.1253 | 0.8822 |
| Electricity GFCF does not Granger Cause Renewables | 682 | 2.5245 | 0.0809 |
| Renewables does not Granger Cause Electricity GFCF | 682 | 1.8145 | 0.1637 |
| Variable | Pesaran (2004) CDtest | Correlation | Correlation (Absolute) | Pesaran (2015) Weak CDtest |
|---|---|---|---|---|
| Electricity CO2 Intensity | 46.34 *** (0.0000) | 0.439 | 0.630 | 101.077 *** (0.0000) |
| GDP per capita | 93.89 *** (0.0000) | 0.889 | 0.889 | 103.395 *** (0.0000) |
| GDP per capita2 | 90.15*** (0.0000) | 0.853 | 0.853 | 100.580 *** (0.0000) |
| Electricity GFCF | 7.61 *** (0.0000) | 0.072 | 0.372 | 90.972 *** (0.0000) |
| Urbanization | 35.72 *** (0.0000) | 0.338 | 0.830 | 105.585 *** (0.0000) |
| Renewables | 64.40 *** (0.0000) | 0.610 | 0.727 | 95.756 *** (0.0000) |
| Renewables2 | 65.27 *** (0.0000) | 0.618 | 0.721 | 89.403 *** (0.0000) |
| Basic Model | Polynomial Model | |
|---|---|---|
| Pesaran’s test of cross sectional independence | 10.458 *** (0.0000) | 13.359 *** (0.0000) |
| Friedman’s test of cross sectional independence | 96.876 *** (0.0000) | 110.507 *** (0.0000) |
| Frees’ test of cross sectional independence | 8.244 | 5.703 |
| Critical values from Frees’ Q distribution: | Alpha = 0.10 0.1078 | Alpha = 0.10 0.1078 |
| Alpha = 0.05 0.1408 | Alpha = 0.05 0.1408 | |
| Alpha = 0.01 0.2034 | Alpha = 0.01 0.2034 |
| Variable | Inverse χ2 Statistic (p) | Modified Inversed χ2 Statistic (Pm) | Inverse Normal Statistic (Z) | Inverse Logit Statistic (L) |
|---|---|---|---|---|
| Electricity CO2 Intensity | 103.0259 *** | 3.6842 *** | 1.0655 | −0.0120 |
| (0.0008) | (0.0001) | (0.8567) | (0.4952) | |
| GDP per capita | 20.6865 | -−3.7101 | 4.3823 | 4.1194 |
| (1.0000) | (0.9999) | (1.0000) | (1.0000) | |
| GDP per capita2 | 20.7444 | −3.7049 | 4.9410 | 4.8531 |
| (1.0000) | (0.9999) | (1.0000) | (1.0000) | |
| Electricity GFCF | 79.3312 * | 1.5564 * | −1.7302 ** | −1.6842 ** |
| (0.0681) | (0.0598) | (0.0418) | (0.0471) | |
| Urbanization | 47.4316 | −1.3083 | 2.1543 | 2.2479 |
| (0.9141) | (0.9046) | (0.9844) | (0.9870) | |
| Renewables | 22.1894 | −3.5751 | 7.1893 | 7.7981 |
| (1.0000) | (0.9998) | (1.0000) | (1.0000) | |
| Renewables2 | 23.3734 | −3.4688 | 7.1098 | 7.8171 |
| (1.0000) | (1.0000) | (1.0000) | (0.9997) |
| Variable | Inverse χ2 Statistic (p) | Modified Inversed χ2 Statistic (Pm) | Inverse Normal Statistic (Z) | Inverse Logit Statistic (L) |
|---|---|---|---|---|
| Electricity CO2 Intensity | 478.4146 *** | 37.3951 *** | −16.8170 *** | −23.6538 *** |
| (0.0000) | (0.0000) | (0.0000) | (0.0000) | |
| GDP per capita | 290.5592 *** | 20.5252 *** | −12.7707 *** | −14.3531 *** |
| (0.0000) | (0.0000) | (0.0000) | (0.0000) | |
| GDP per capita2 | 332.7196 *** | 24.3113 *** | −13.9425 *** | −16.4278 *** |
| (0.0000) | (0.0000) | (0.0000) | (0.0000) | |
| Electricity GFCF | 341.4535 *** | 25.0957 *** | −13.3819 *** | −16.7344 *** |
| (0.0000) | (0.0000) | (0.0000) | (0.0000) | |
| Urbanization | 84.7092 *** | 2.0393 *** | −1.7676 *** | −1.9244 *** |
| (0.0293) | (0.0207) | (0.0386) | (0.0280) | |
| Renewables | 405.2631 *** | 30.8259 *** | −14.3857 *** | −19.6564 *** |
| (0.0000) | (0.0000) | (0.0000) | (0.0000) | |
| Renewables2 | 381.7343 *** | 28.7130 *** | −13.0039 *** | −17.9590 *** |
| (0.0000) | (0.0000) | (0.0000) | (0.0000) |
| Equation | Statistic | |||
|---|---|---|---|---|
| Gτ | Gα | Pτ | Pα | |
| CO2 Elec Int = f (GDP per capita) | −3.076 *** (0.000) | −13.551 (0.104) | −28.254 *** (0.000) | −15.741 *** (0.000) |
| CO2 Elec Int = f (GDP per capita)2 | −2.880 *** (0.000) | −13.487 (0.114) | −25.523 *** (0.000) | −15.681 *** (0.000) |
| CO2 Elec Int = f (GFCF Electricity) | −2.695 *** (0.012) | −11.846 (0.554) | −19.268 *** (0.000) | −12.772 *** (0.000) |
| CO2 Elec Int = f (Urbanization) | −2.712 *** (0.009) | −7.438 (1.000) | −12.821 (0.113) | −7.262 (0.935) |
| CO2 Elec Int = f (Renewables) | −3.025 *** (0.000) | −12.237 (0.427) | −23.110 *** (0.000) | −13.720 *** (0.000) |
| CO2 Elec Int = f (Renewables)2 | −3.027 *** (0.000) | −12.189 (0.442) | −22.424 (0.000) | −14.273 (0.000) |
| Panel v-Statistic | Panel rho-Statistic | Panel t-Statistic | Panel ADF-Statistic | Group rho-Statistic | Group t-Statistic | Group ADF-Statistic | |
|---|---|---|---|---|---|---|---|
| Test-Statistics | −2.059 | 3.958 | −2.608 | 0.8478 | 6.131 | −3.133 | 1.132 |
| Basic-Model | Polynomial-Model | |||
|---|---|---|---|---|
| Statistic | p-Value | Statistic | p-Value | |
| Breusch-Pagan Heteroskedasticity test | 31.82 *** | 0.0000 | 21.71 *** | 0.0000 |
| Glejser Heteroskedasticity test | 30.02 *** | 0.0000 | 31.73 *** | 0.0000 |
| Harvey Heteroskedasticity test | 20.33 *** | 0.0000 | 23.77 *** | 0.0000 |
| White Heteroskedasticity test | 29.83 *** | 0.0000 | 47.01 *** | 0.0000 |
| Breusch-Godfrey/Wooldridge Serial Correlation test | 467.98 *** | 0.0000 | 449.43 *** | 0.0000 |
| RESET omitted variable test | 11.39 *** | 0.0000 | 0.97 | 0.4064 |
| Basic-Model | Polynomial-Model | |||
|---|---|---|---|---|
| Statistic | p-Value | Statistic | p-Value | |
| Poolability test | 21.370 *** | 0.0000 | 17.171 *** | 21.532 |
| Breusch-Pagan LM test | 4900.3 *** | 0.0000 | 4760.6 *** | 0.0000 |
| Joint significance F-test (FE) | 90.95 *** | 0.0000 | 93.06 *** | 0.0000 |
| Time-Effects test (FE) | 0.275 | 0.9997 | 0.299 | 0.9995 |
| Hausman test | 8.81 ** | 0.0319 | 16.47 *** | 0.0056 |
| Variable | Static-Analysis | Dynamic-Analysis | ||
|---|---|---|---|---|
| Basic-Model Polynomial-Model | Basic-Model | |||
| Fixed Effects Driskoll-Kraay (S.E) Fixed Effects | Fixed Effects Driskoll-Kraay (S.E) | Difference-GMM (2-Steps) | System-GMM (2-Steps) | |
| CO2 Electricity Intensity(t−1) | - | - | 0.6873 *** | 0.6880 *** |
| - | - | (0.0000) | (0.0000) | |
| GDP per capita | −0.0031 *** (0.000) | −0.0113 *** (0.000) | −0.0016 *** (0.0000) | −0.0015 *** (0.0000) |
| GDP per capita2 | - | 9.63 × 10⁻⁸ *** | - | - |
| - | (0.000) | - | - | |
| GFCF Electricity | 2.6097 *** (0.005) | 2.8675 *** (0.0000) | 9.2446 *** (0.0000) | 10.8065 *** (0.000) |
| Urbanization | −3.6626 | −2.1194 | −4.4343 ** | −4.4770 *** |
| (0.1190) | (0.3090) | (0.0157) | (0.0035) | |
| Renewables | −2.6553 *** | −5.3984 ** | −1.4997 *** | −1.3879 *** |
| (0.000) | (0.0180) | (0.0000) | (0.0000) | |
| Renewables2 | - | 0.0513 * | - | - |
| - | (0.0830) | - | - | |
| Constant | 1000.02 *** | 1007.034 *** | - | - |
| (0.000) | (0.000) | - | - | |
| AR(1) (p-value) | - | - | 0.0370 | 0.0330 |
| AR(2) (p-value) | - | - | 0.3260 | 0.3220 |
| Hansen-J test (p-value) | - | - | 0.3809 | 0.5061 |
Disclaimer/Publisher’s Note: The statements, opinions and data contained in all publications are solely those of the individual author(s) and contributor(s) and not of MDPI and/or the editor(s). MDPI and/or the editor(s) disclaim responsibility for any injury to people or property resulting from any ideas, methods, instructions or products referred to in the content. |
© 2023 by the authors. Licensee MDPI, Basel, Switzerland. This article is an open access article distributed under the terms and conditions of the Creative Commons Attribution (CC BY) license (https://creativecommons.org/licenses/by/4.0/).
Share and Cite
Halkos, G.E.; Tsirivis, A.S. Electricity Production and Sustainable Development: The Role of Renewable Energy Sources and Specific Socioeconomic Factors. Energies 2023, 16, 721. https://doi.org/10.3390/en16020721
Halkos GE, Tsirivis AS. Electricity Production and Sustainable Development: The Role of Renewable Energy Sources and Specific Socioeconomic Factors. Energies. 2023; 16(2):721. https://doi.org/10.3390/en16020721
Chicago/Turabian StyleHalkos, George E., and Apostolos S. Tsirivis. 2023. "Electricity Production and Sustainable Development: The Role of Renewable Energy Sources and Specific Socioeconomic Factors" Energies 16, no. 2: 721. https://doi.org/10.3390/en16020721