Article

A Novel Approach Using High Charging Voltage for the Restoration of Discarded Lead Acid Batteries

Department of Electrical and Electronic Engineering, Lee Kong Chian Faculty of Engineering and Science, Universiti Tunku Abdul Rahman, Kajang 43000, Malaysia
*
Author to whom correspondence should be addressed.
Energies 2023, 16(4), 1598; https://doi.org/10.3390/en16041598
Submission received: 24 November 2022 / Revised: 19 January 2023 / Accepted: 29 January 2023 / Published: 5 February 2023
(This article belongs to the Collection Renewable Energy and Energy Storage Systems)

Abstract

:
A lead acid battery is an old renewable battery that is usually discharged to deliver a high surge current to ignite a petrol-based engine. Nowadays, there are different improved versions of lead acid batteries that can deliver high energy densities with low maintenance costs. As the batteries are charged and discharged repeatedly over time, the amount of lead sulfate across the electrode plates grows, reducing the total surface areas of the plates and, thus, the rate of ionization between the electrolyte and the plate surfaces. The batteries then eventually come to the end of their service lives. Even with the improved versions, lead acid batteries are usually discarded at their retirement. However, if the retired batteries can be used for other purposes, the circular economy of the batteries can be improved significantly. It is therefore necessary to study the physical characteristics of the retired batteries and explore means of improving their charging and discharging capabilities. This paper presents research on improving the storage capability of retired lead acid batteries by applying different charging voltages across them. The results show that the electrode plates of the retired batteries become porous when a high charging voltage is applied, hence increasing the total surface area of the plate surfaces. The storage capability of the batteries is improved because the accumulated lead sulfate is removed from the electrode plates by the high charging voltage. As a result, the rate of ionization is increased, hence restoring the storing capability of the retired batteries to up to 71–89% of the original capacity rating.

Graphical Abstract

1. Introduction

Deep-cycle lead acid batteries are one of the most reliable, safe, and cost-effective types of rechargeable batteries used in petrol-based vehicles and stationary energy storage systems [1,2,3,4]. However, the rapid degradation of lead acid batteries is a weakness that leads many to opt for other battery technologies [5,6,7,8,9]. There are a few causes of the rapid degradation of lead acid batteries, including the corrosion of the positive grid [10] and the deformation or expansion of the grid, as well as sulfation and shedding of the active material of the cell plates due to electrolyte stratification, low electrolyte levels, or the batteries being idle for too long [11,12,13]. Sulfation can happen on both the positive and negative electrode plates [14,15,16,17]. If a battery has not been frequently discharged and charged or its electrolyte has been starved for an extended period, the remaining lead sulfate becomes crystallized, forming an insulated layer over the plate surfaces. The highly sulfated cell plate can lose its porous characteristics, reducing the contact surfaces between the plate and the electrolytes and resulting in inefficient ionization [15]. As a result, the battery internal resistance increases over time, reducing the charging and discharging capabilities of the battery. In addition, the deposition of lead sulfate is not even across the plate surfaces [18], causing an uneven distribution of current density across the plate during charging and discharging and thereby reducing the battery performance. When overcharging is too frequent, the plate can become deformed, bringing it into contact with adjacent plates and creating an internal short circuit or open circuit [19,20].
Some manufacturers use lead–antimony (Pb-Sb), lead–tin (Pb-Sn), or lead–tin–calcium (Pb-Sn-Ca) alloys instead of pure lead to improve the tensile strengths and the electrical conductivity of the grids [21,22,23]. However, Slavkov et al. [24] reported that doping lead anodes with either calcium (Ca) or tin (Sn) increases the corrosion rate as compared with pure lead anodes. Thomas et al. [25] claimed that the expansion of a positive grid caused by overcharging is a function of calcium content, which is a drawback of lead–calcium batteries. Lead–tin–calcium–samarium (Pb-Sn-Ca-Sm) [26] alloy has thus been used instead due to its low corrosion rate.
At present, the cost per watt-hour of lead acid batteries is probably the lowest among rechargeable batteries [11,27], which has prompted many to search for innovative solutions that involve either prolonging the lifespan of the batteries or resuscitating the retired lead acid batteries. Such solutions include modifying the grid materials, structures and active materials for the plates [28,29]. Furthermore, different charging methods, such as the pulse charging technique, have been developed to restore the performance of discarded lead acid batteries, as described in [12,30,31,32,33,34]. However, to obtain an effective pulse charging mechanism for lead acid batteries, the voltage, current, and frequency of the pulses must be controlled accurately [35]. Another contemporary method is the inverse charging approach developed by Karami and Asadi [36], which can improve the average recovery of battery performance to up to 80% of its nominal capacity. However, the inverse charging approach is ineffective for heavily sulfated batteries [37,38]. It has been shown that all the different charging techniques come with their limitations when resuscitating retired batteries. It is therefore necessary to carry out studies to establish the effects of high charging voltage on the lead sulfate of discarded batteries and to develop an appropriate charging voltage technique for restoring the charging capability of retired lead acid batteries.
This paper presents the effects of the conventional constant charging voltage of about 2.4 V across a cell of a retired lead acid battery. The results show that such a charging voltage was not able to restore the cell when lead sulfate was heavily deposited over the plate surfaces. However, when the charging voltage was greater than 2.4 V, the charging capability of the cell could be improved. This was because a charging voltage greater than 2.4 V per cell could effectively remove the lead sulfate from the plate surfaces, restoring the charging capability of the cell to up to 71% of its original energy content. Microscopic scans of the plate surfaces of new and retired cells showed the effects of different high charging voltages on the porous characteristics of the plate surfaces. As a result, the most appropriate voltage level that could effectively remove the lead sulfate from the plate surfaces was determined. This voltage level can be used as a point of reference for those who intend to revive any retired lead acid battery through the high charging voltage technique. This paper begins with a description of the experimental set up and procedure, which is followed by a discussion of the results and a conclusion.

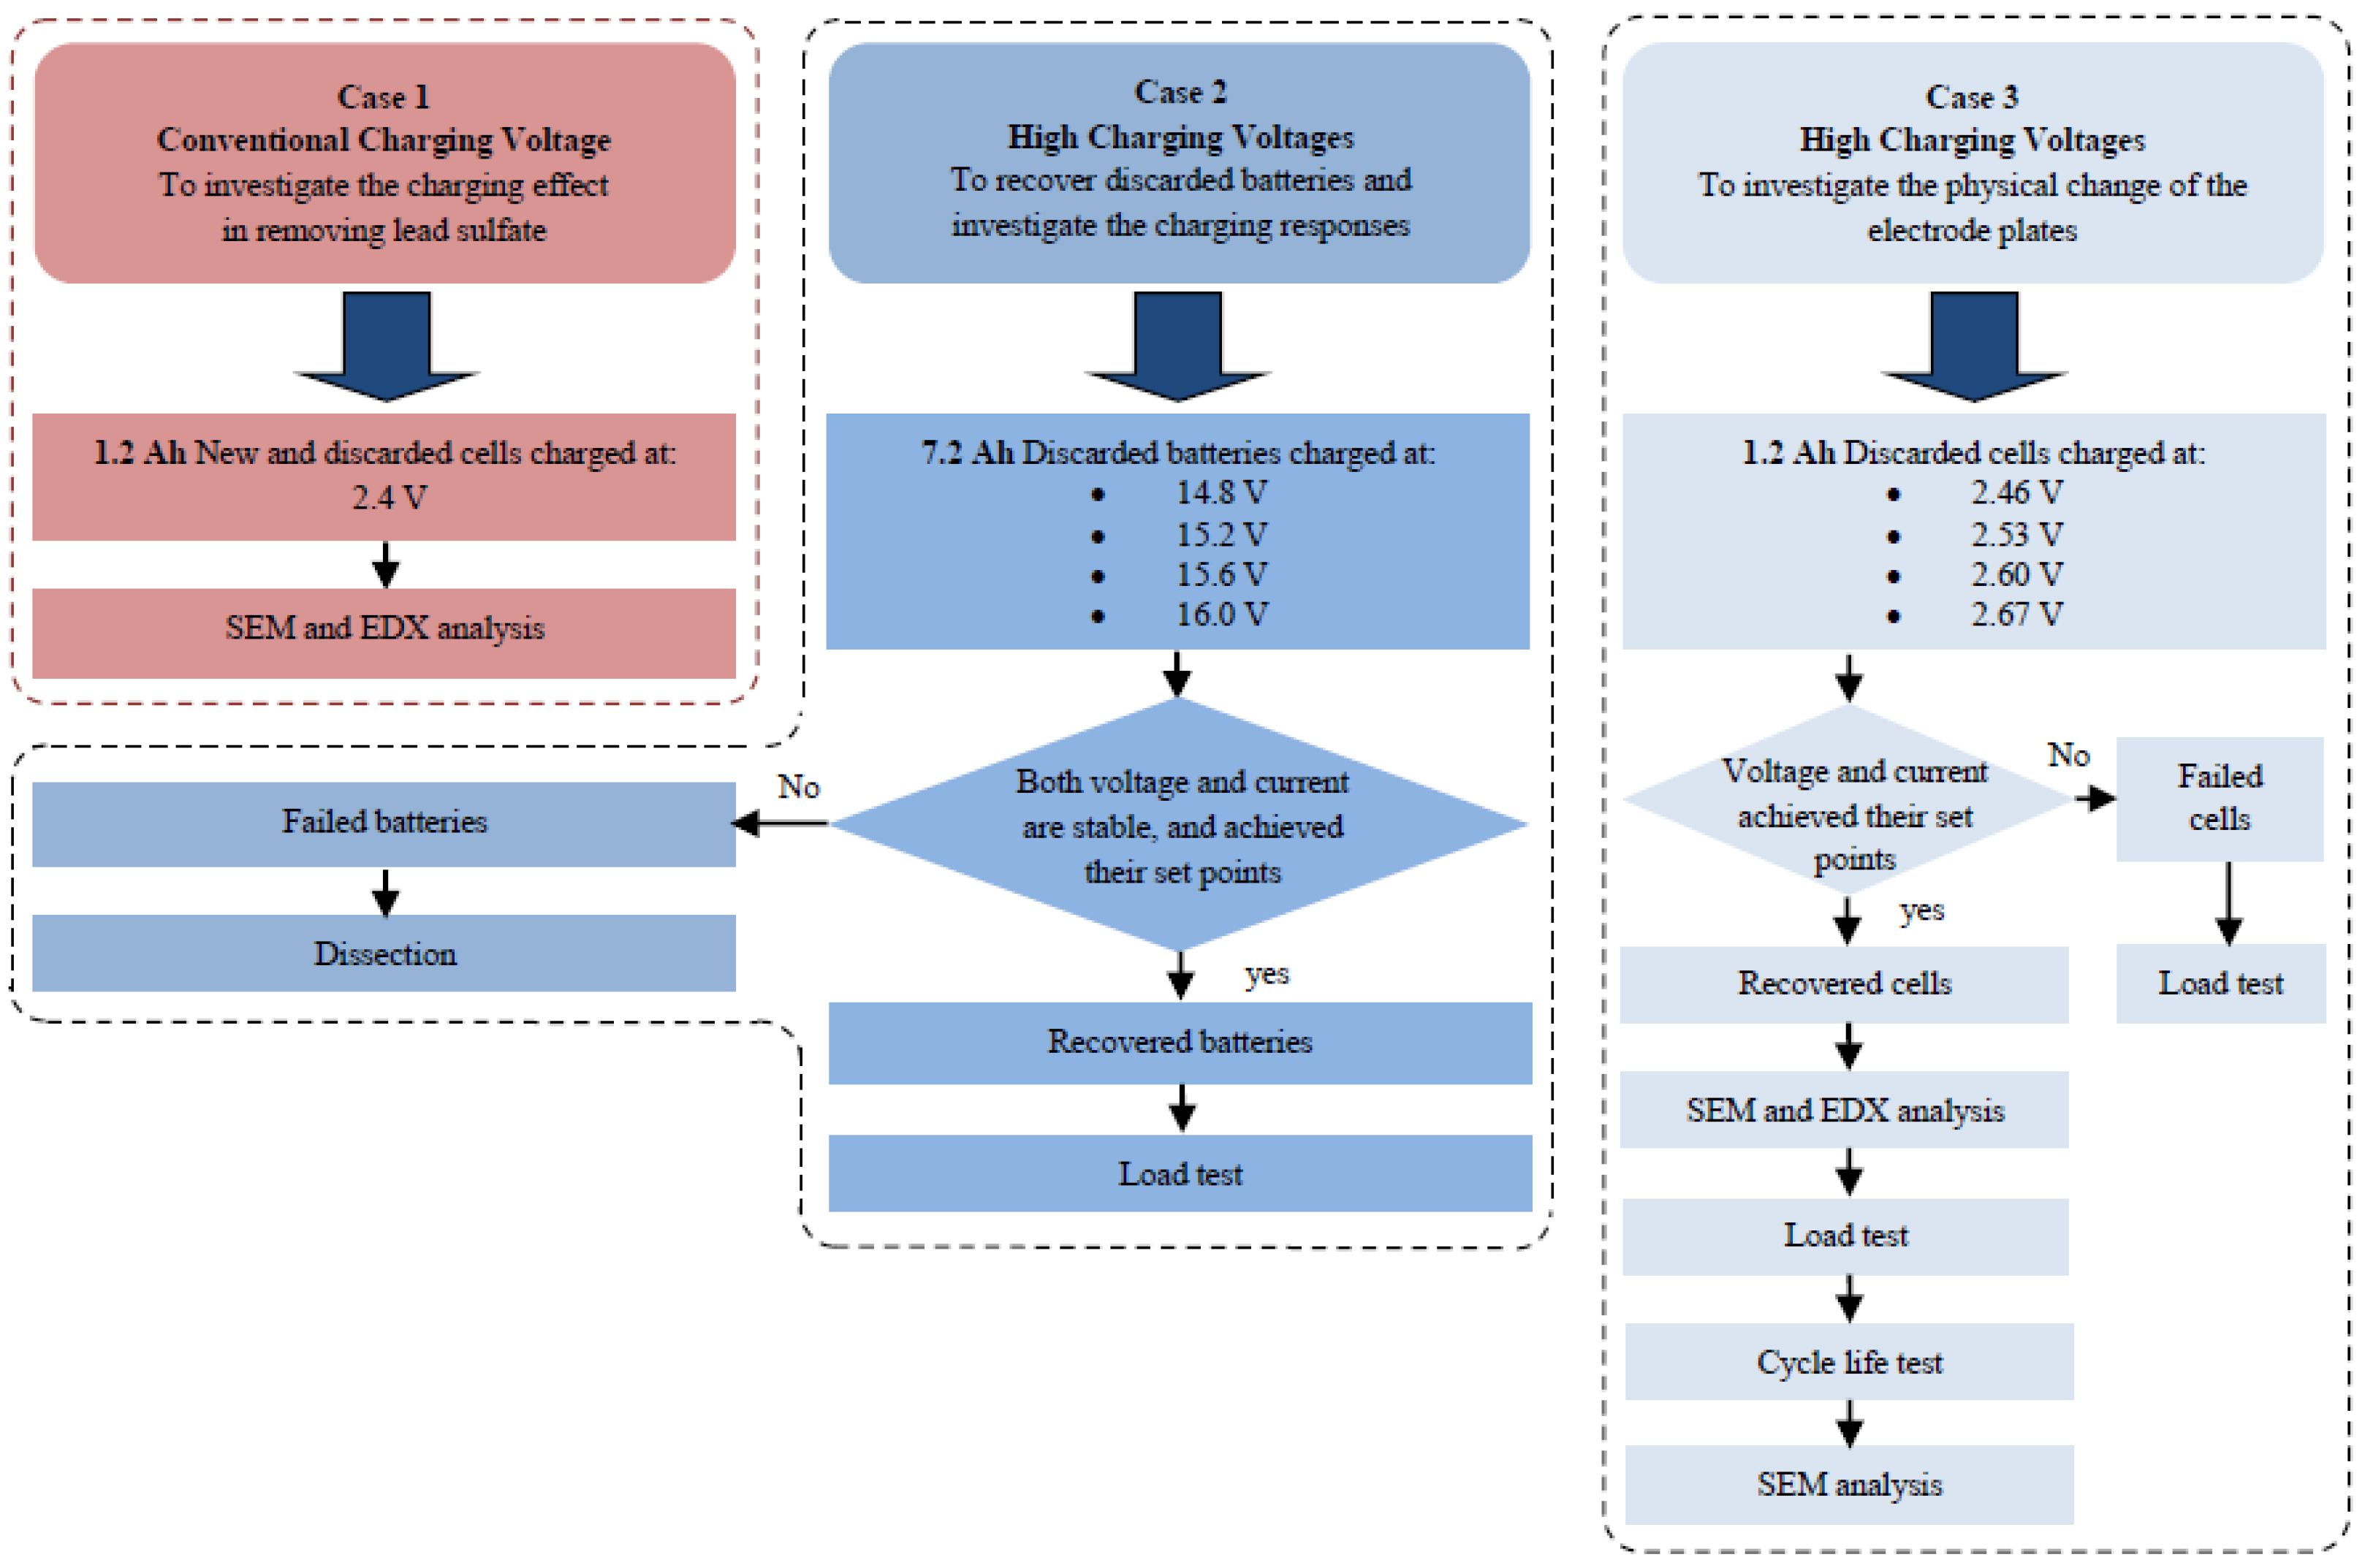
2. Experimental Details

There were three cases in this experiment. The first case mainly involved the restoration of discarded lead acid cells using a conventional charging voltage of 2.4 V and their comparison with an identical new cell, aiming at investigating the charging effect of the conventional charging voltage in removing the accumulated lead sulfate from the cells. The second case involved restoring the discarded batteries using the proposed high charging voltages (greater than 2.4 V) in order to study the charging capability and charging response of the battery. The third case involved determining the most appropriate charging voltage for restoring retired batteries through the verification of the physical changes in the plate surfaces. Figure 1 shows a flow chart for the three cases.

2.1. Materials

The cells used in the first case were extracted from 12 V 3.5 Ah VRLA deep-cycle discarded batteries manufactured in 2017 that were retrieved from a UPS fire alarm system. An identical new cell with no cycling history was charged simultaneously with the discarded cells for comparison purposes.
The experiment in the second case was based on 30 units of a 12 V 7.2 Ah VRLA deep-cycle discarded battery manufactured in 2017 that was retrieved from a small industrial UPS system. These batteries were selected randomly, and the internal conditions were unknown.
The cells used in the third case were extracted from four 12 V 3.5 Ah VRLA deep-cycle discarded batteries manufactured in 2017 that were retrieved from the same UPS system as in case two. The electrolyte used for the cell tests was a sulfuric acid solution with a concentration of 32%, which was the lowest resistivity of the acid solution [39].

2.2. Experimental Setup
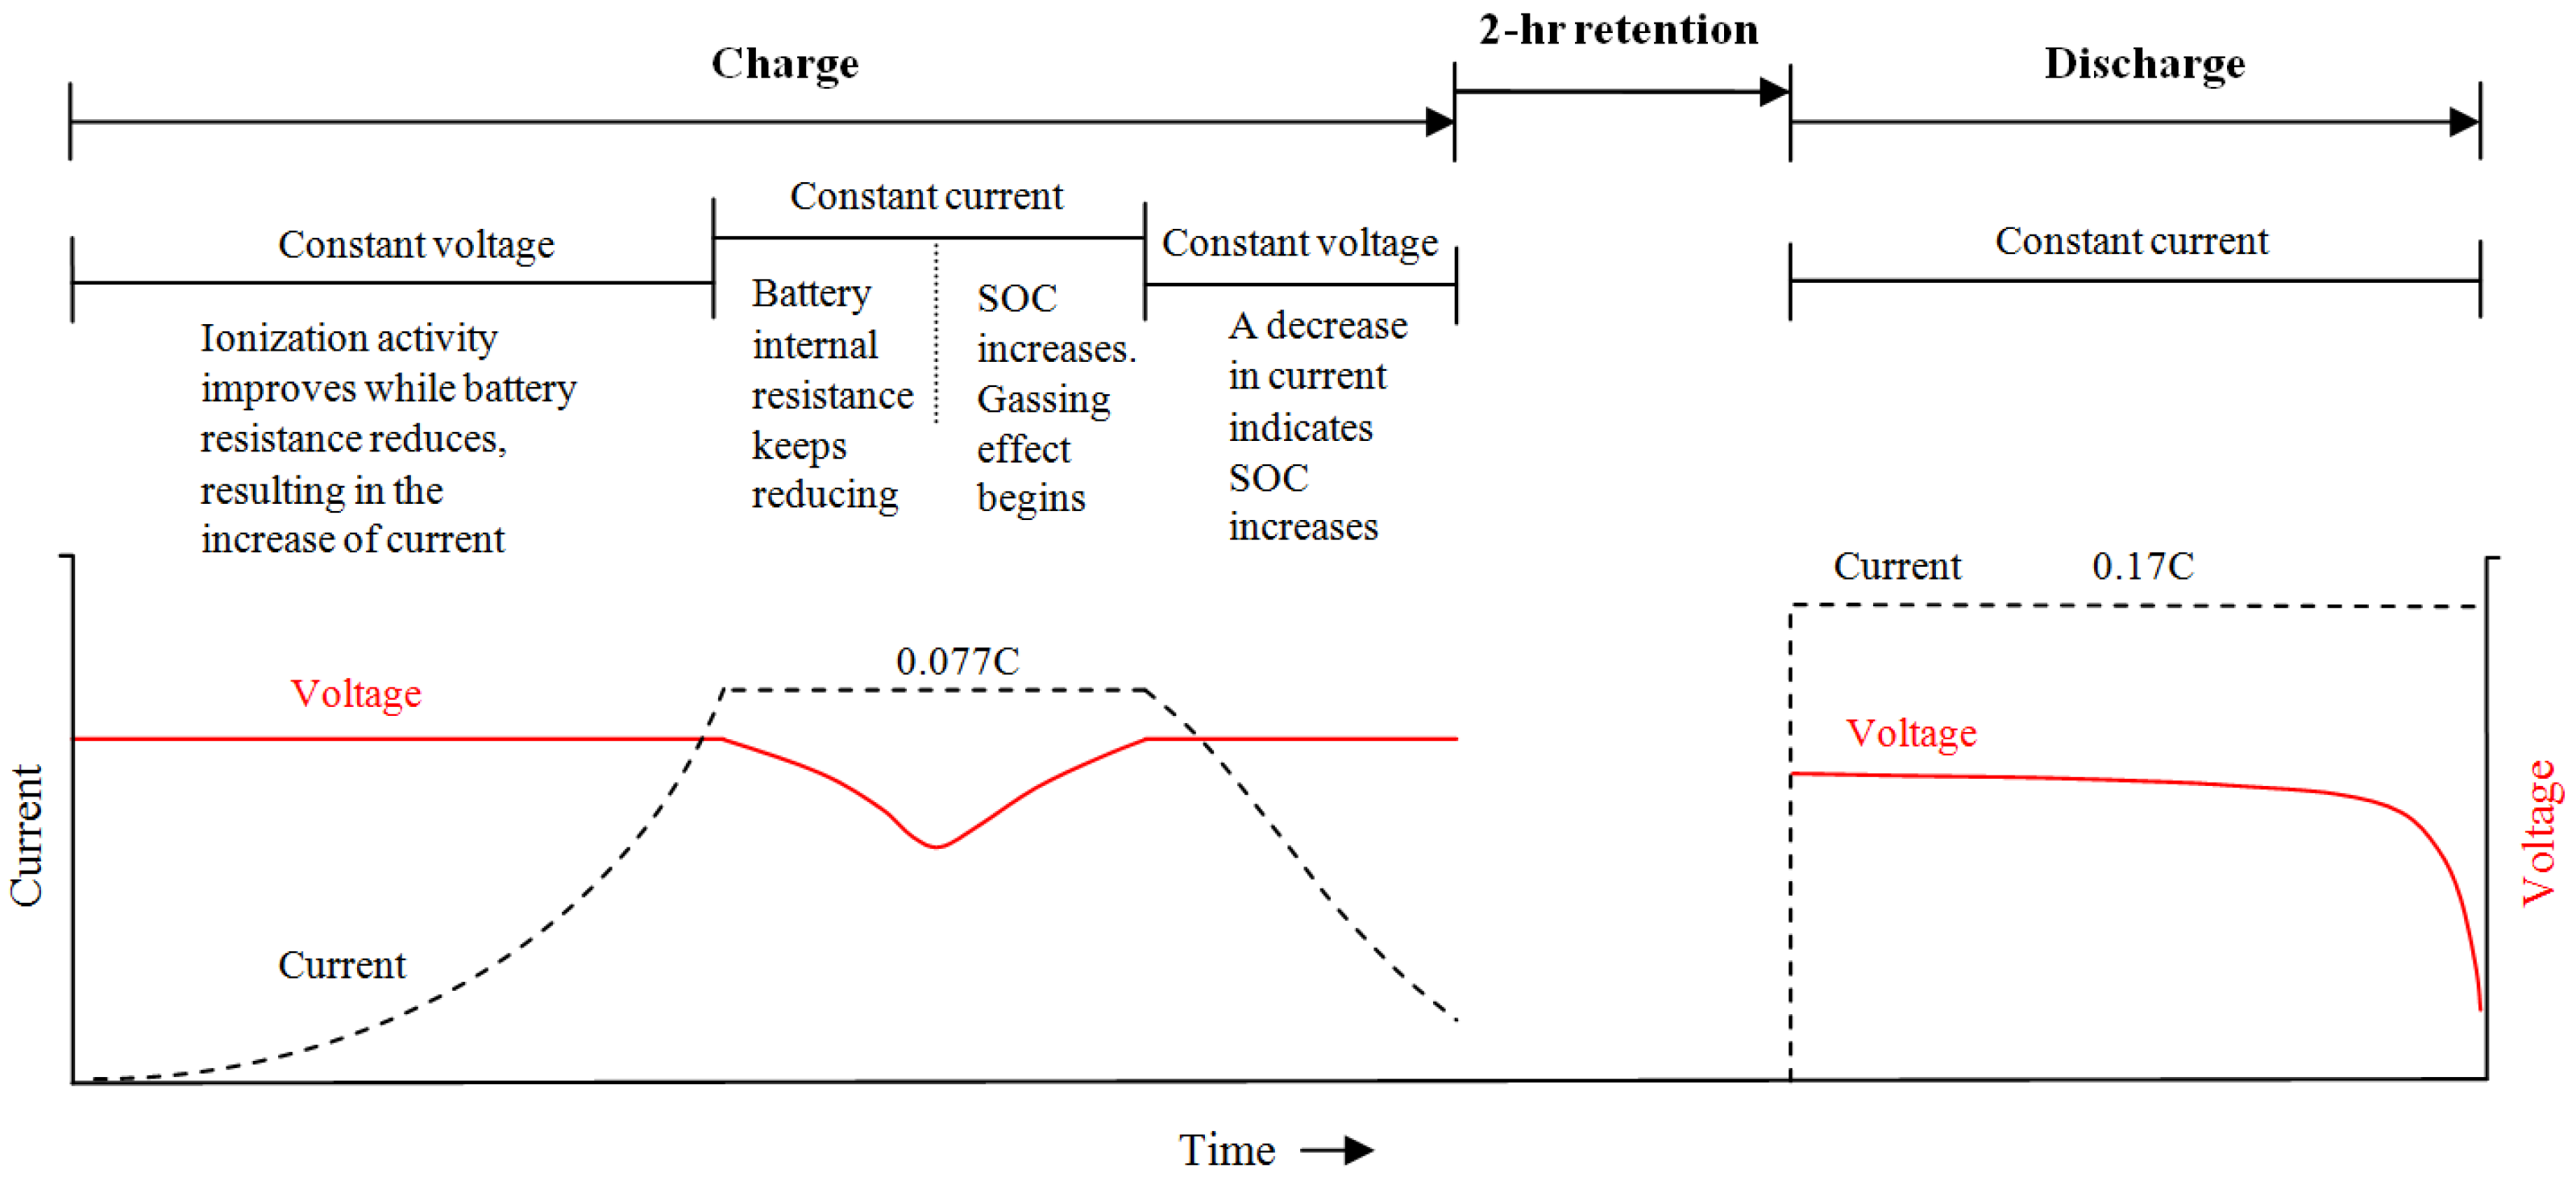
The charging of the batteries and cells was carried out using a PS-3010DF DC power supply manufactured by Long Wei Electric (Hong Kong, China). The discharging process was accomplished using a ZKE EBD-M05 electronic load (ZKETECH, Shanghai, China). All voltage parameters were measured using a Fluke 179 digital multi-meter (Fluke Everett, Washington, DC, USA). A CENTER 350 infrared thermometer (CENTER, New Taipei City, Taiwan) was used to measure the battery temperature during charging. An S-3400N scanning electron microscope from HITACHI (Tokyo, Japan) and an ERMA optical microscope (Erma Inc., Saitama, Japan) were used for the morphological studies of the cell plate surface.
The charging of the 1.2 Ah discarded cells was performed in a beaker with 160 mL of electrolyte. Spacers were used to prevent contact between the positive and negative plates. Each cell was composed of one positive plate and one negative plate with a clearance of 2.5 mm.

2.3. Procedure

In case one, the discarded cells and the new cell were charged at a conventional charging voltage (2.4 V) with a current set at 0.1 C. The charging scheme was a constant voltage followed by a constant current.
In cases two and three, the first charging period for the batteries and cells was 20 h. For the batteries with a stable charging response (the voltage-on-charge increased or decreased steadily without fluctuation) over the 20 h, charging was continued until they were fully charged. The change in battery temperature was recorded every 15 min during the process. Table 1 shows the charging parameters for the batteries and cells. The charging currents were set to 0.077 C to minimize the gassing effect and reduce the battery temperature during the charging process. As indicated in the table, each battery and cell were charged at one specified voltage.
Figure 2 illustrates the charging and discharging procedures for the batteries and cells charged at high charging voltages. The discharge capacity of the recovered batteries and cells was determined using a 5 h constant-current discharge rate and assessed two hours after the batteries or cells were fully charged. The cutoff voltages for the batteries and cells were set at 10.5 V and 1.75 V, respectively.

3. Results and Discussion

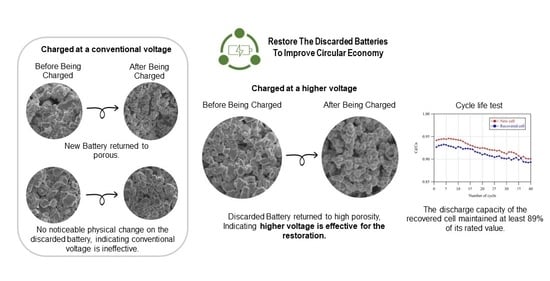
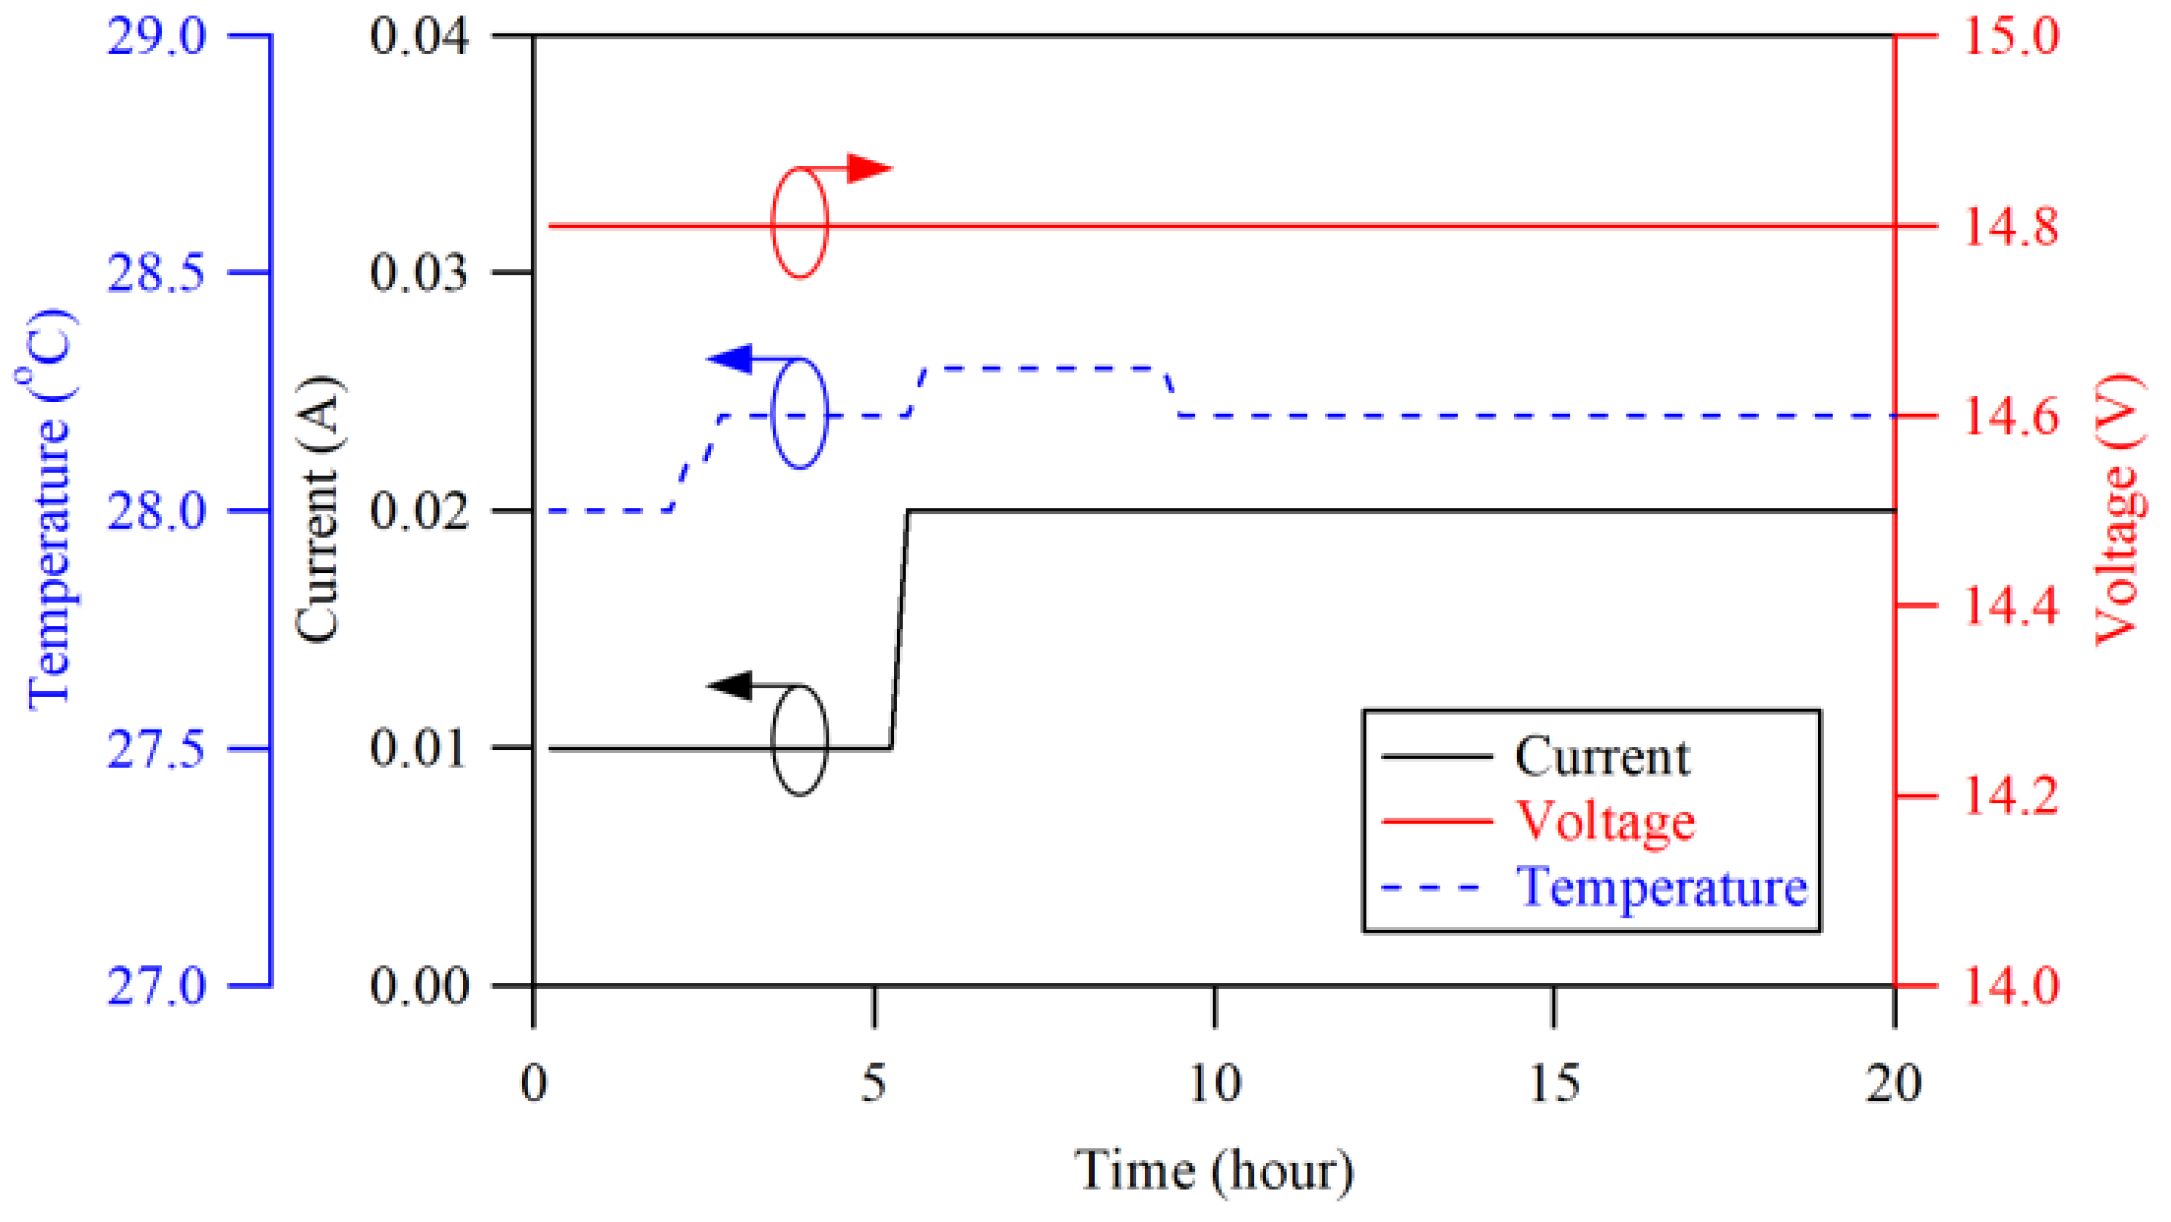
3.1. Case One: New and Discarded Cells Charged at 2.4 V

The charging results for the discarded cells charged at 2.4 V were compared with those for an identical new cell charged under the same conditions. Section 3.1.1 and Section 3.1.2 present the positive and negative cell plates, respectively.

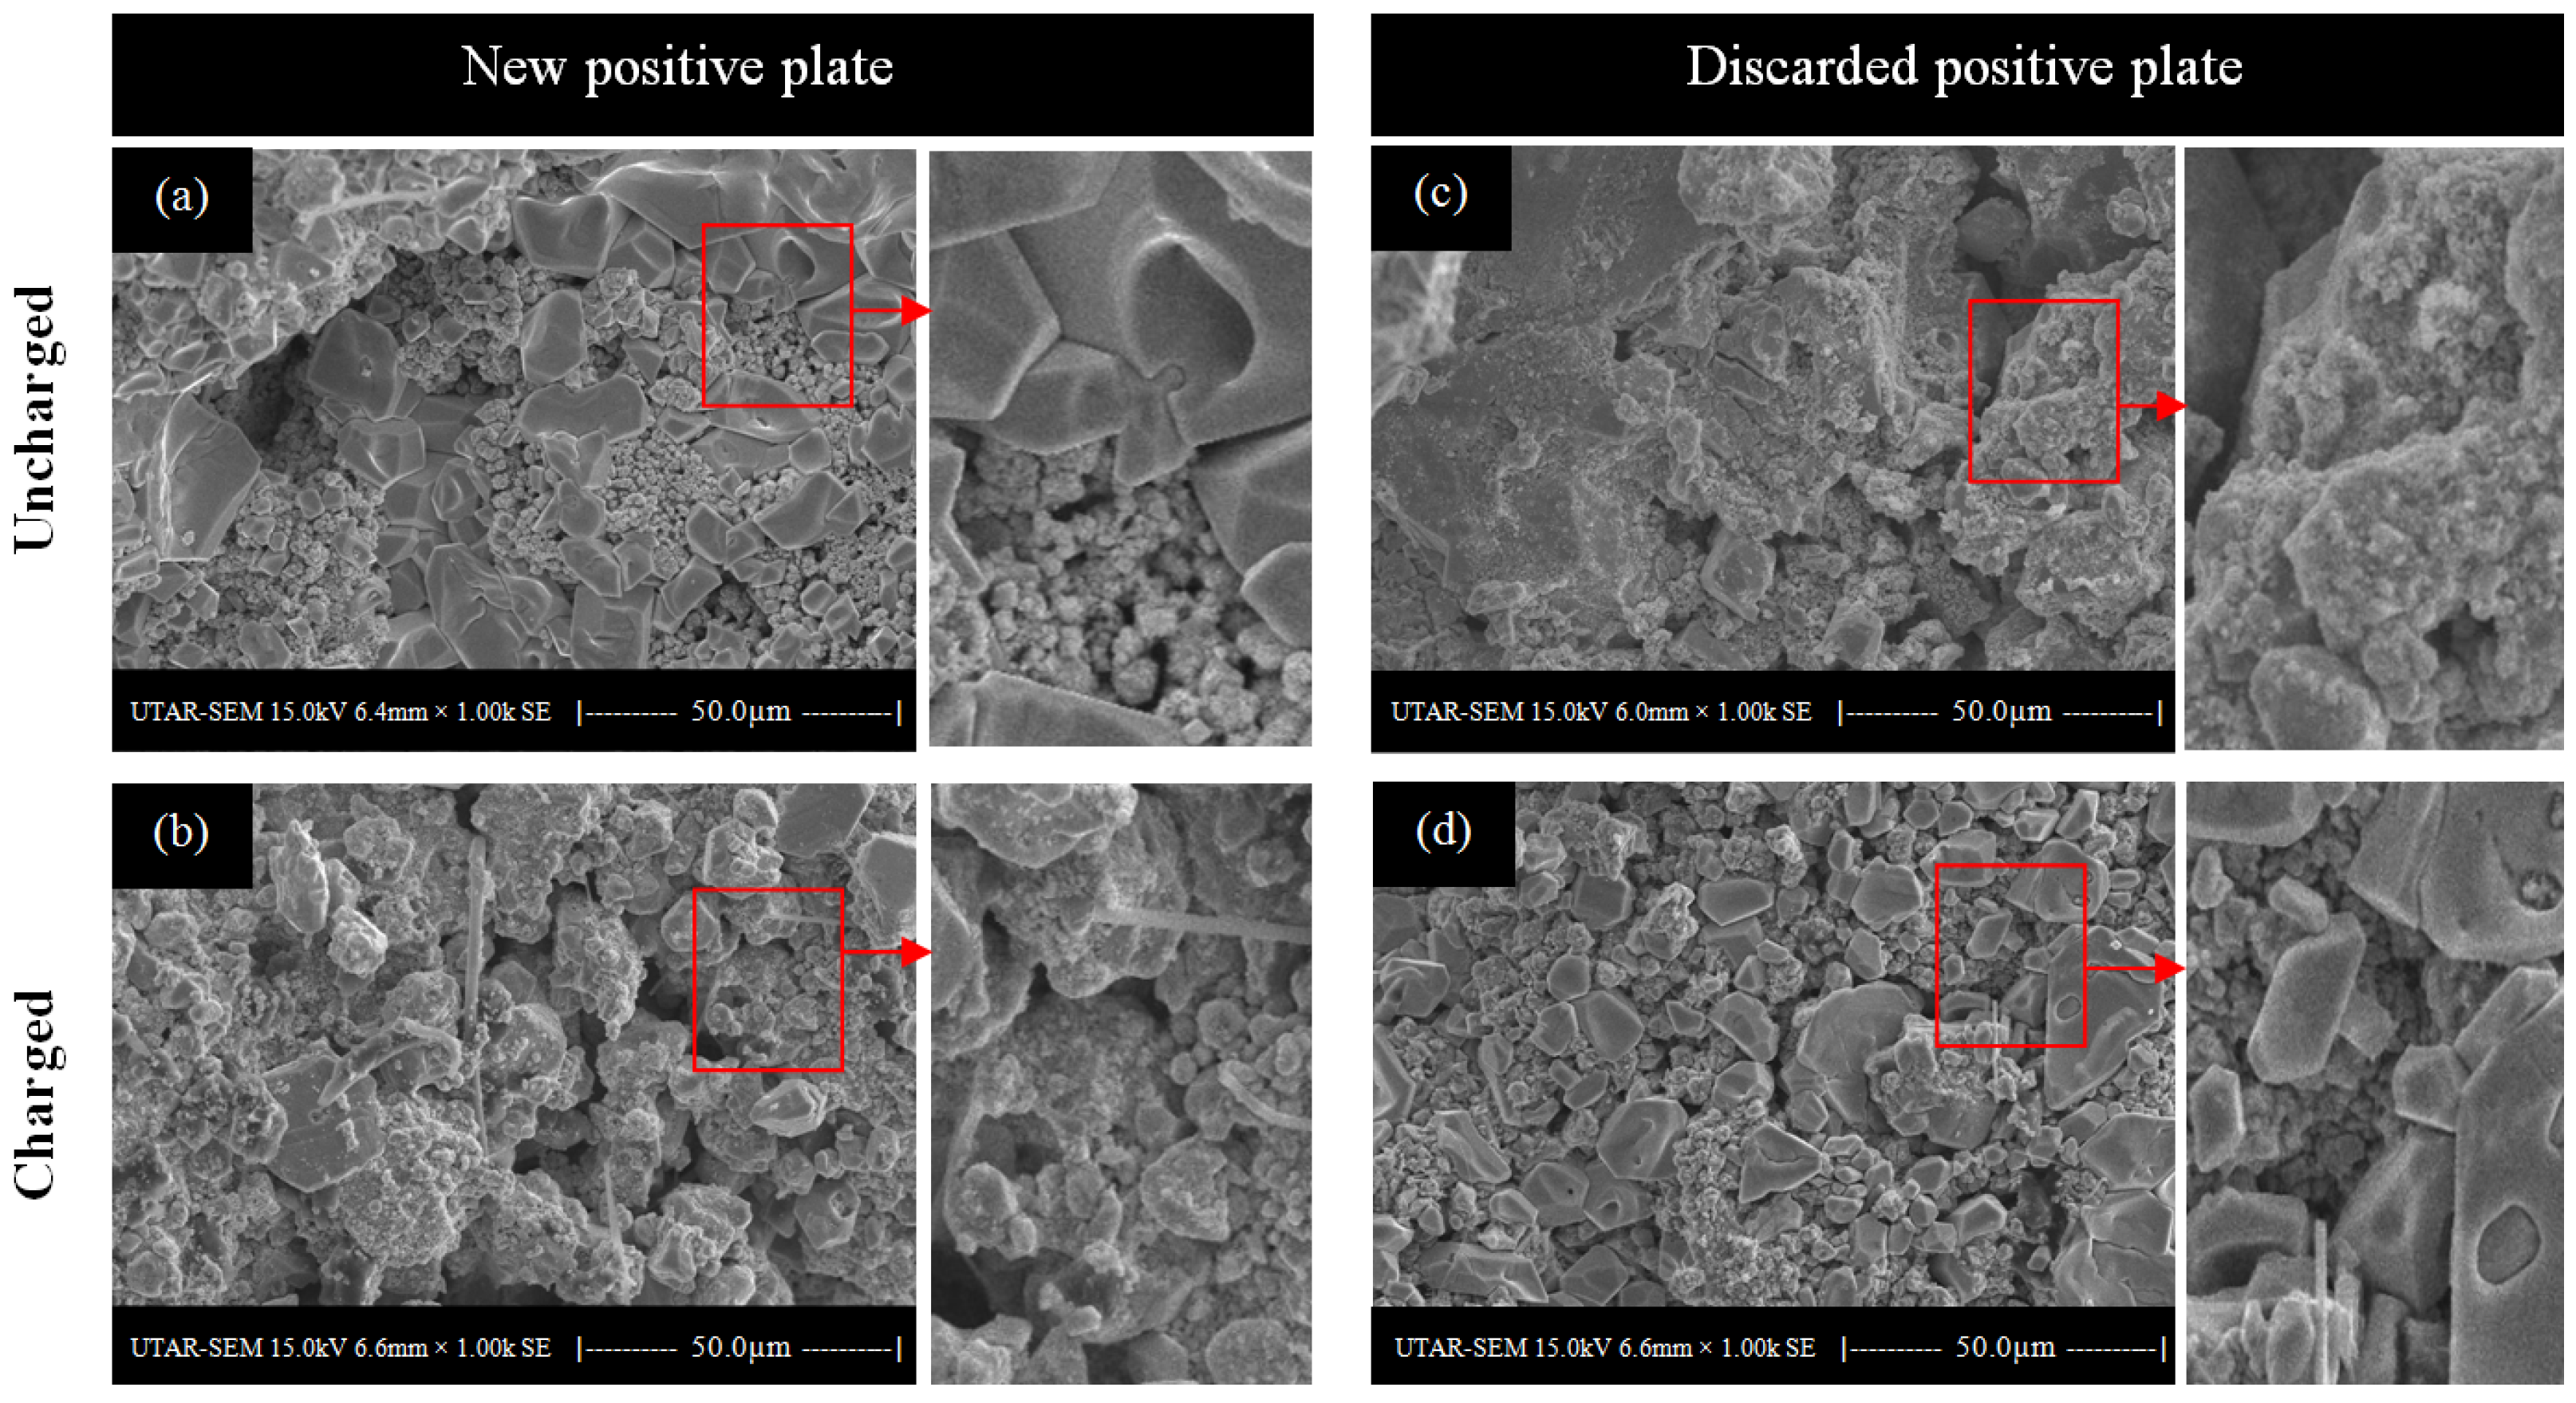
3.1.1. Positive Plates

Figure 3 shows microscopic scans of the new and discarded positive cell plates before and after charging. Figure 3a shows a new plate surface before charging. It can be seen that the granular structure of the active material is crowded together, exhibiting a low-porosity character. Figure 3b shows the surface of the charged plate. It can be seen that the highly uneven surface of the plate was recovered after charging, increasing the porosity of the surfaces and facilitating the permeation of electrolytes into the inner part of the plate. Unlike the new plate, the uncharged discarded plate presented in Figure 3c showed a granular structure for the active material. Due to the long cycling history, the micropores of the plate were occupied by lead sulfate, which reduced the plate porosity. Figure 3d shows the charged discarded positive plate. The granular structure of the active material can be seen. However, the surface porosity was not as high as that of the charged new positive plate. Thus, charging a cell at a conventional charging voltage cannot recover the surface porosity of the positive plate.
During the charging of the cell, the positive plate underwent an oxidation process. It released electrons to dissociate the sulfate ions from the lead sulfate and restore the lead dioxide on the plate. Equation (1) shows how the electrochemical reaction occurred on the positive plate during the charging. However, for the highly sulfated cell plate, the resistance was relatively high. Therefore, the usual charging voltage of 2.4 V could not trigger this reaction effectively.
PbSO4 (s) + 2H2O (l) → PbO2 (s) + H2SO4 (aq) + 2H+ (aq) + 2e
In order to investigate the effect of the charging on the chemical properties of the plates, the total concentrations of lead (Pb), sulfur (S), and oxygen (O) in the plate were analyzed before and after the cell was charged. Table 2 shows the energy-dispersive X-ray (EDX) results for the positive plates. It can be seen that, before the cell was charged, the initial sulfur component in the discarded positive plate was 14.10% wt, which was higher than the sulfur content of 11.89% wt in the new positive plate. After the cell was charged, the sulfur content in the discarded positive plate was 12.84% wt, which was higher than that of 6.21% wt in the new plate. This indicates that the charging process was no longer effective in eliminating the accumulated lead sulfate from the discarded positive plates.
It was noticed that, before the cell was charged, the lead content in the discarded plate was 71.40% wt, which was lower than that of 75.34% wt in the new plate. This was because of the high oxidation level caused by repeated charging during the cycle life of the retired cell. After the retired cell was charged, the lead content in the retired positive plate was reduced slightly from 71.40% wt to 71.03% wt. This indicated that oxidation was no longer effective in the retired cell during the charging process. This was mainly because the plate surface was no longer porous, hence reducing the rate of ionization between the electrolyte and the plate surface.

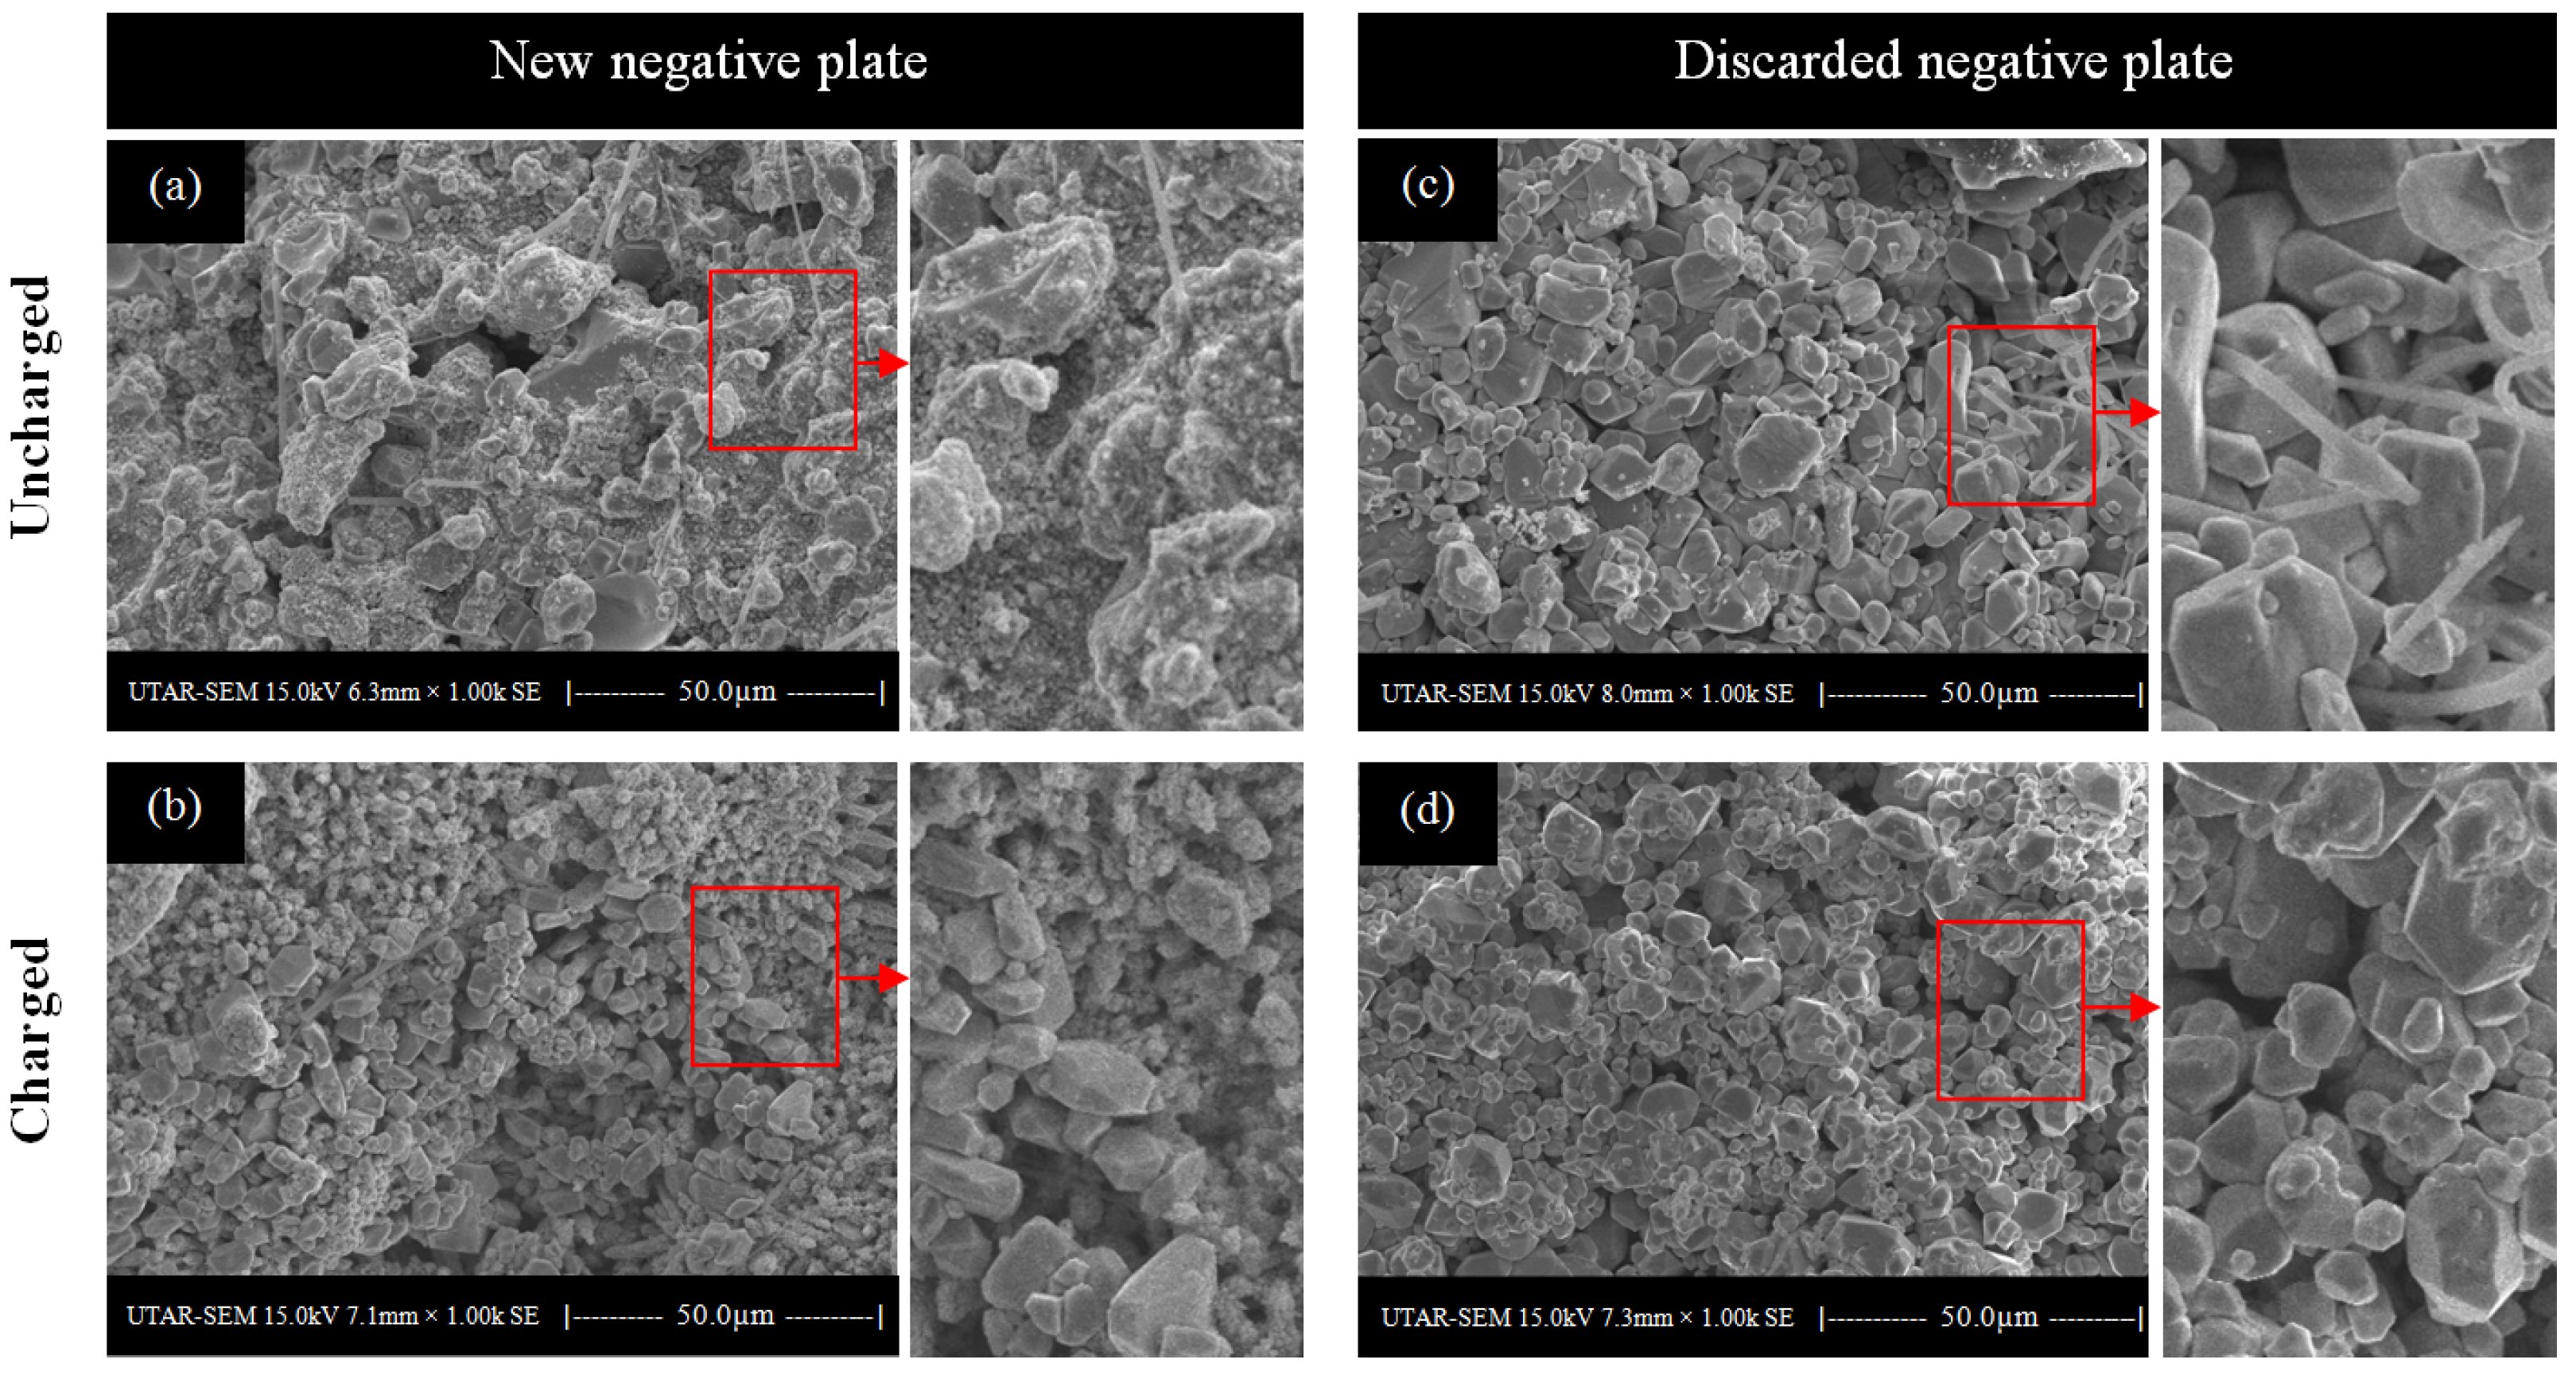
3.1.2. Negative Plates

Figure 4 shows the microscopic scans of the new and discarded negative plates before and after charging. Figure 4a shows the uncharged new negative plate with a low-porosity surface. However, this surface structure was changed after it was charged, as shown in Figure 4b, and the plate surface returned to being highly even. Figure 4c shows the uncharged discarded negative plate. The granular structure of the active material appeared to be dense. Compared to the charged plate shown in Figure 4d, there was no noticeable physical change. In other words, the plate did not provide porosity even after it was charged. As shown by the surface morphology study, the conventional charging voltage could not restore the surface porosity of discarded negative plates.
Equations (2) and (3) describe the chemical reaction in the negative plate during the charging process. The negative plate underwent a reduction process, receiving two electrons and dissociating the sulfate ion from the lead sulfate (Equation (2)). The sulfate ion further combined with the hydrogen ions in the electrolyte to form a sulfuric acid solution (Equation (3)). However, the resistance of heavily deposited and crystallized PbSO4 over the discarded negative plate can slow down the electrochemical transformations from PbSO4 to Pb and H2SO4.
PbSO4 (s) + 2e → Pb (s) + SO42− (aq)
Pb (s) + SO42− (aq) + 2H+ (aq) → Pb (s) + H2SO4 (aq)
Table 3 shows the EDX results for the negative plates. The sulfur component of the new cell plate was reduced by 3.78% wt after it was charged. The sulfur content of the discarded negative plate was significantly higher than that of the new negative plate, indicating that PbSO4 was heavily deposited across the discarded negative plate. It can also be seen that the sulfur content in the discarded plate was only a little bit lower than that after the discarded plate was charged. Such a small reduction in sulfur content was due to the heavily deposited PbSO4, which slowed down the rate of ionization over the plate surface.
The increase in the lead content in the new cell from 79.92% wt to 86.47% wt was due to the effective conversion of lead sulfate to pure lead during the charging. It was noticed that the charging did not restore the lead content of the discarded plate effectively. This was because of the low rate of ionization in the discarded negative plate. The oxygen content in the discarded plate was reduced from 13.35% wt to 13.09% wt, indicating poor reduction of oxygen content in the negative plate during the charging. Thus, charging at a conventional charging voltage of 2.4 V per cell cannot effectively restore the chemical properties of discarded cell plates.

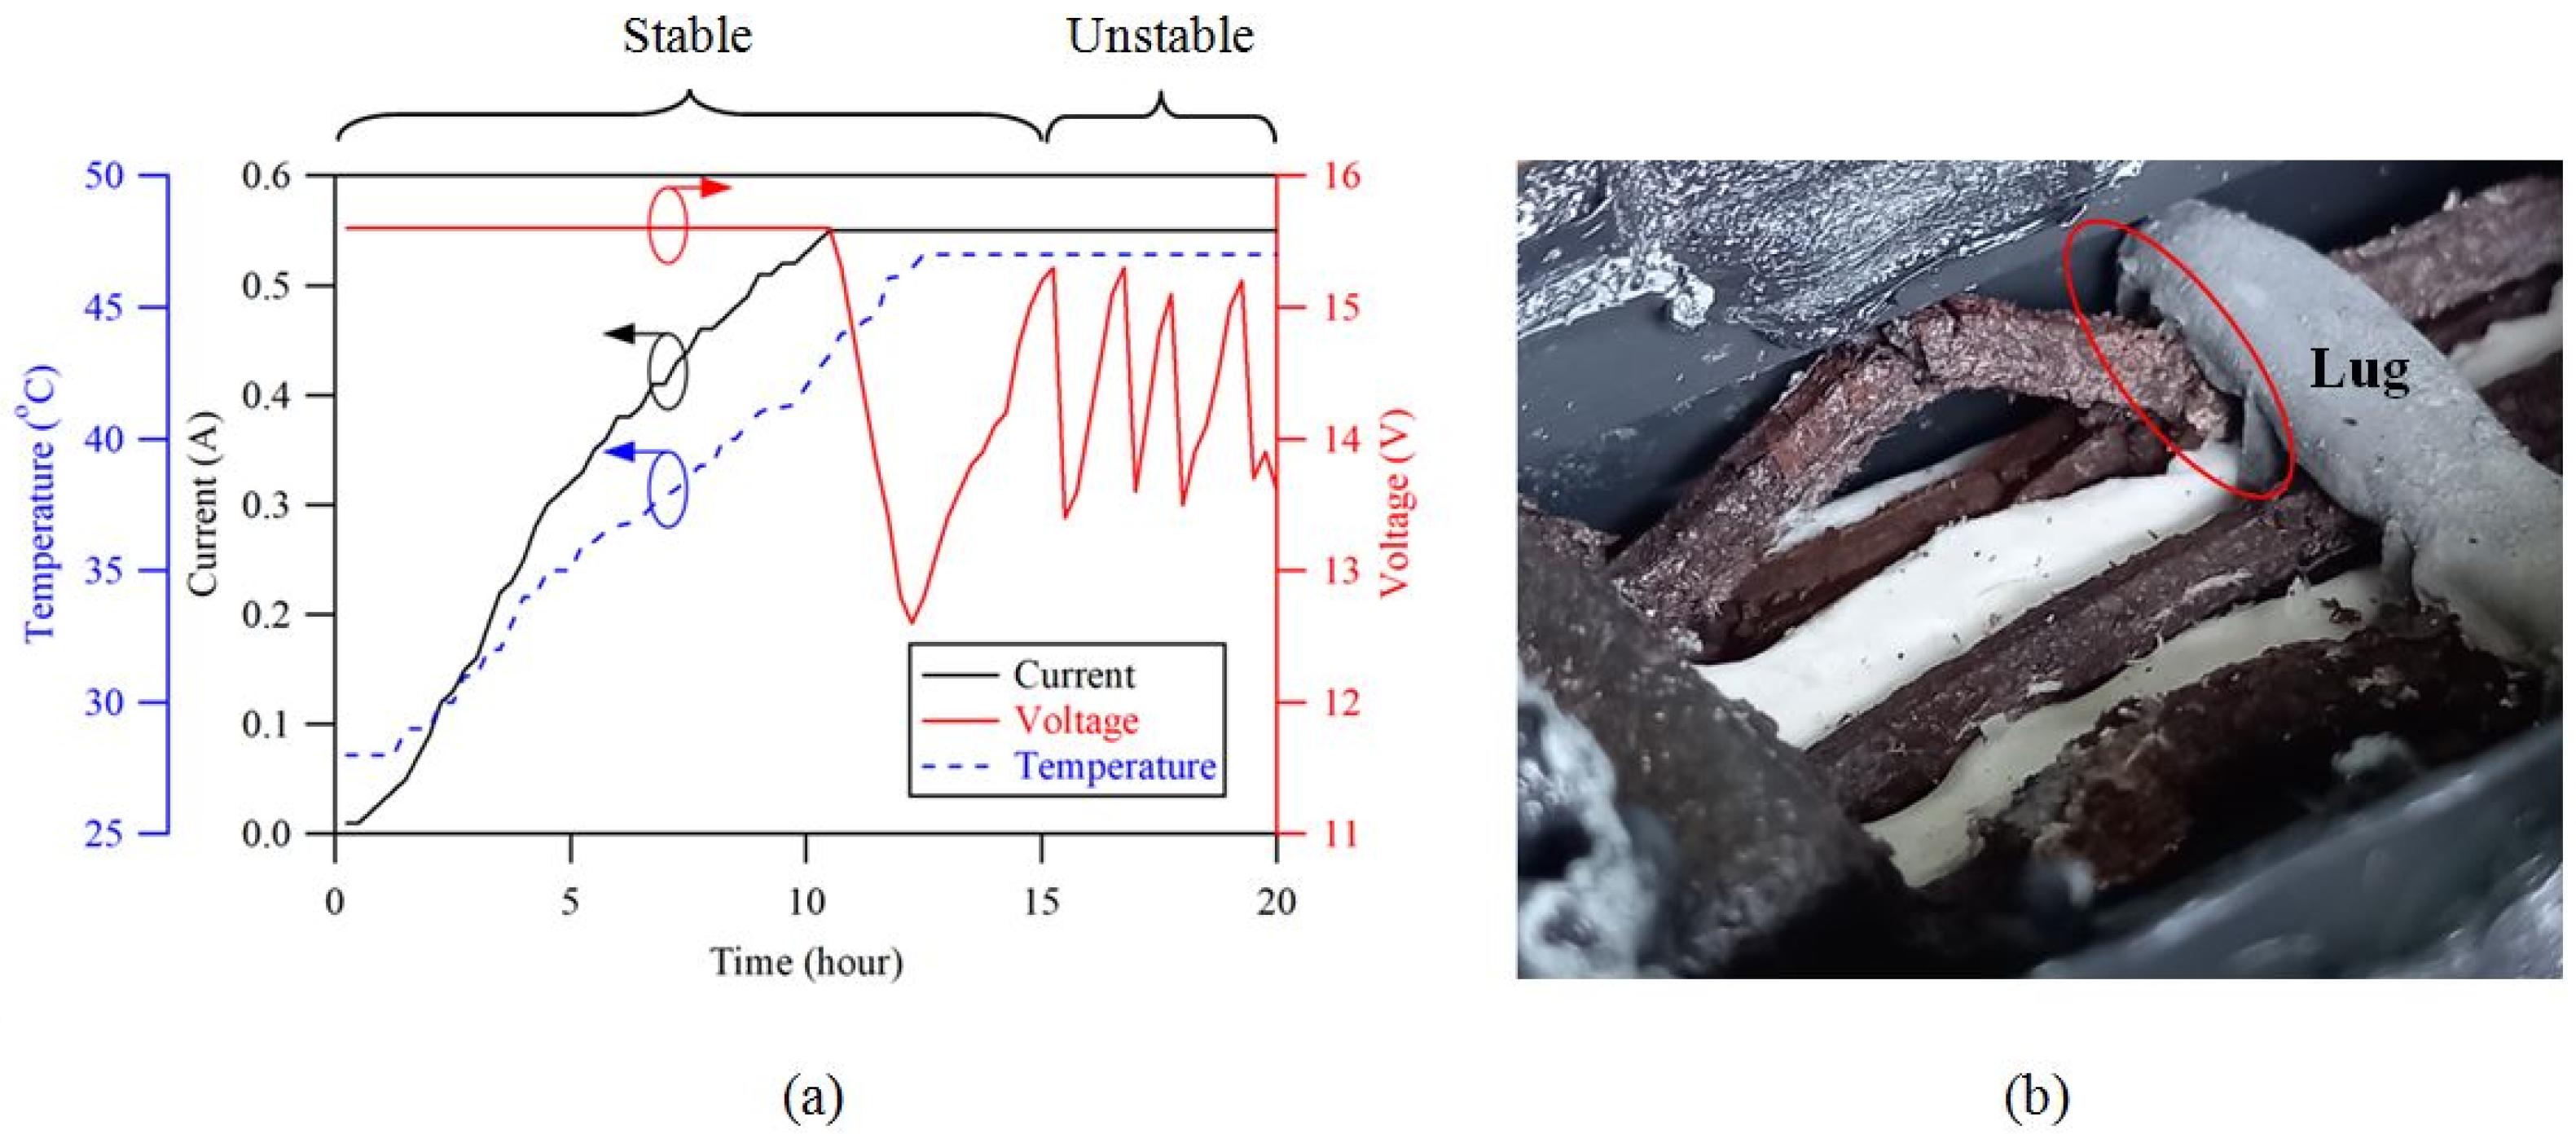
3.2. Case Two: Discarded Batteries

The charging results for the batteries are divided into two sections—Section 3.2.1 and Section 3.2.2—that discuss the failed and recovered batteries, respectively.

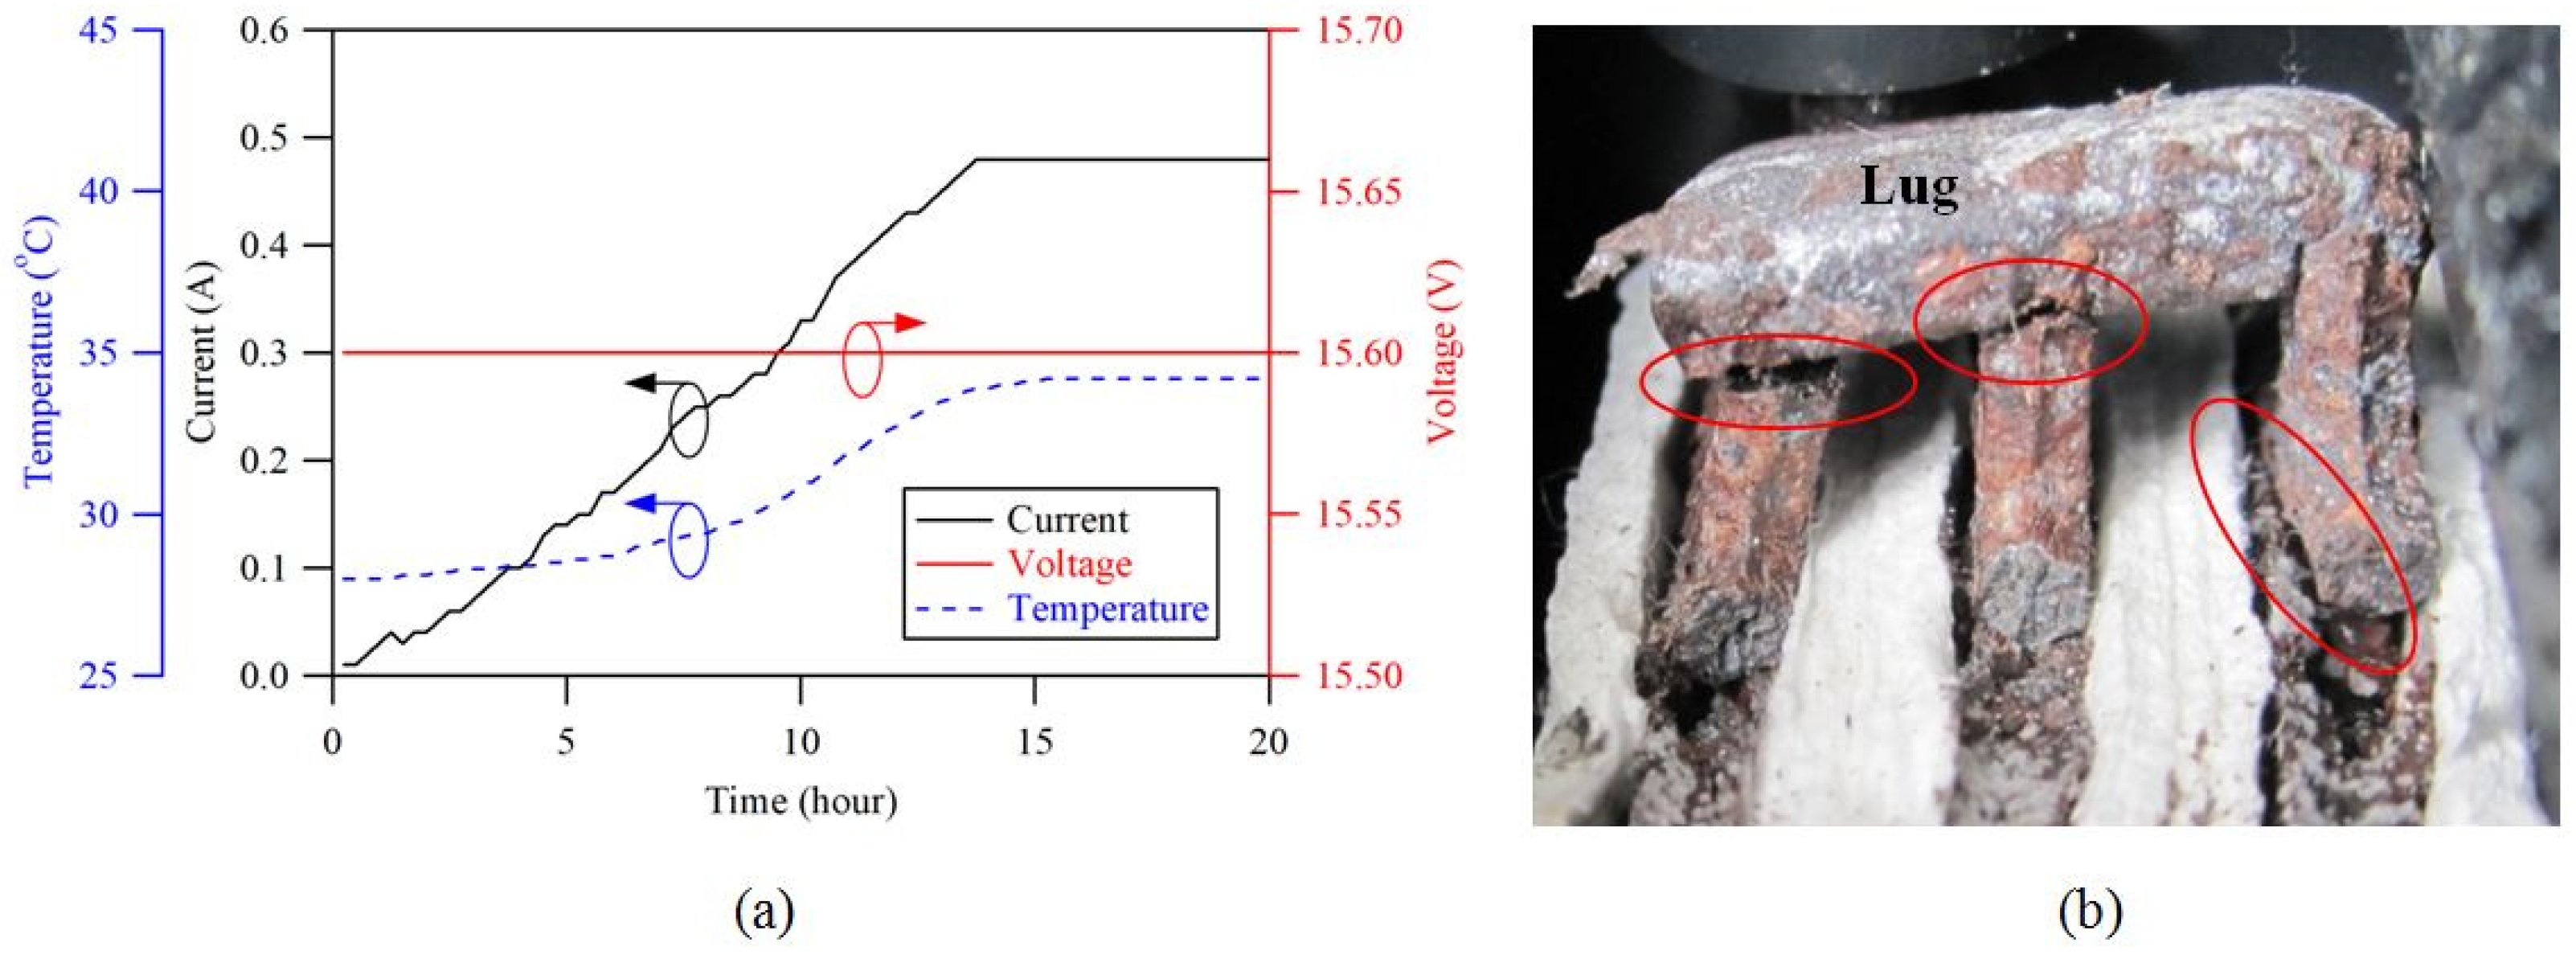
3.2.1. Charging Results for Failed Batteries

The failed batteries were categorized into three scenarios. Scenario 1 showed that batteries that were charged at 14.8 V and 15.2 V were returned to the same charging profiles and the batteries did not accept further charge. As shown in Figure 5, when the batteries were charged at 14.8 V, the current flowing through the batteries was measured and found to be very small throughout the charging process. This means that the internal resistance of the batteries was high and constant throughout the process. Charging voltages of both 14.8 V and 15.2 V were not able to revive the dead batteries at all.
In scenario two, the batteries were charged at 15.6 V and 16.0 V. In this scenario, the batteries exhibited a distinctive charging profile where the current flowing through the batteries increased gradually, as shown in Figure 6a. The current increased to a certain level and then remained at the constant value of 0.55 A, which showed that the batteries’ internal resistance dropped gradually. According to the anatomical analysis of the batteries shown in Figure 6b, some connections to the positive plates were broken due to corrosion. Nevertheless, the positive plates remained in contact with the lug with high contact resistance, allowing a small amount of current to flow through the crack when forced by a higher voltage. The contact resistance between the plates and the lug limited the current, resulting in the current being incapable of reaching the set value throughout the duration of charging. The broken connection between the electrode plates resulted in the sum of the cell voltages always being less than 12 V. As a result, batteries that were internally open-circuited were deemed irrecoverable and discarded.
In scenario 3, the batteries were charged at 15.6 V and 16.0 V. The batteries in this scenario could return to a different charging profile where the voltage-on-charge fluctuated during the charging. Figure 7a shows one of the sample batteries that were charged at 15.6 V. Driven by the high charging voltage, the current successfully reached the set value of 0.077 C (0.55 A). However, voltage fluctuation occurred in the second half of the constant-current stage. This was the stage at which the SOC and the battery voltage increased. During the voltage fluctuation, the battery temperature rose to 47 °C, which was 2 °C higher than the optimal operating range [40]. As can be seen in the anatomical image shown in Figure 7b, the deformed positive grids were in contact with the sulfated negative lug, which caused a partial short circuit in the respective cell. When forced by a higher voltage, the charging current intermittently flowed through the contact point and partially bypassed the cell, which caused the terminal voltage to drop. As the voltage dropped below the potential that could overcome the contact resistance, the current reverted to the original value. As a result, the cell operated as normal, and the SOC and battery voltage rose again. This phenomenon kept repeating, resulting in voltage fluctuations. Thus, this category of batteries with an internal short circuit was irrecoverable, and they should be discarded.
Table 4 summarizes the charging results for the failed batteries. Both 14.8 V and 15.2 V demonstrated the same charging profile, and a higher current could not be generated due to the high internal resistance of the batteries. On the other hand, 15.6 V and 16.0 V successfully overcame the batteries’ resistance and revealed the internal defects of the failed batteries.

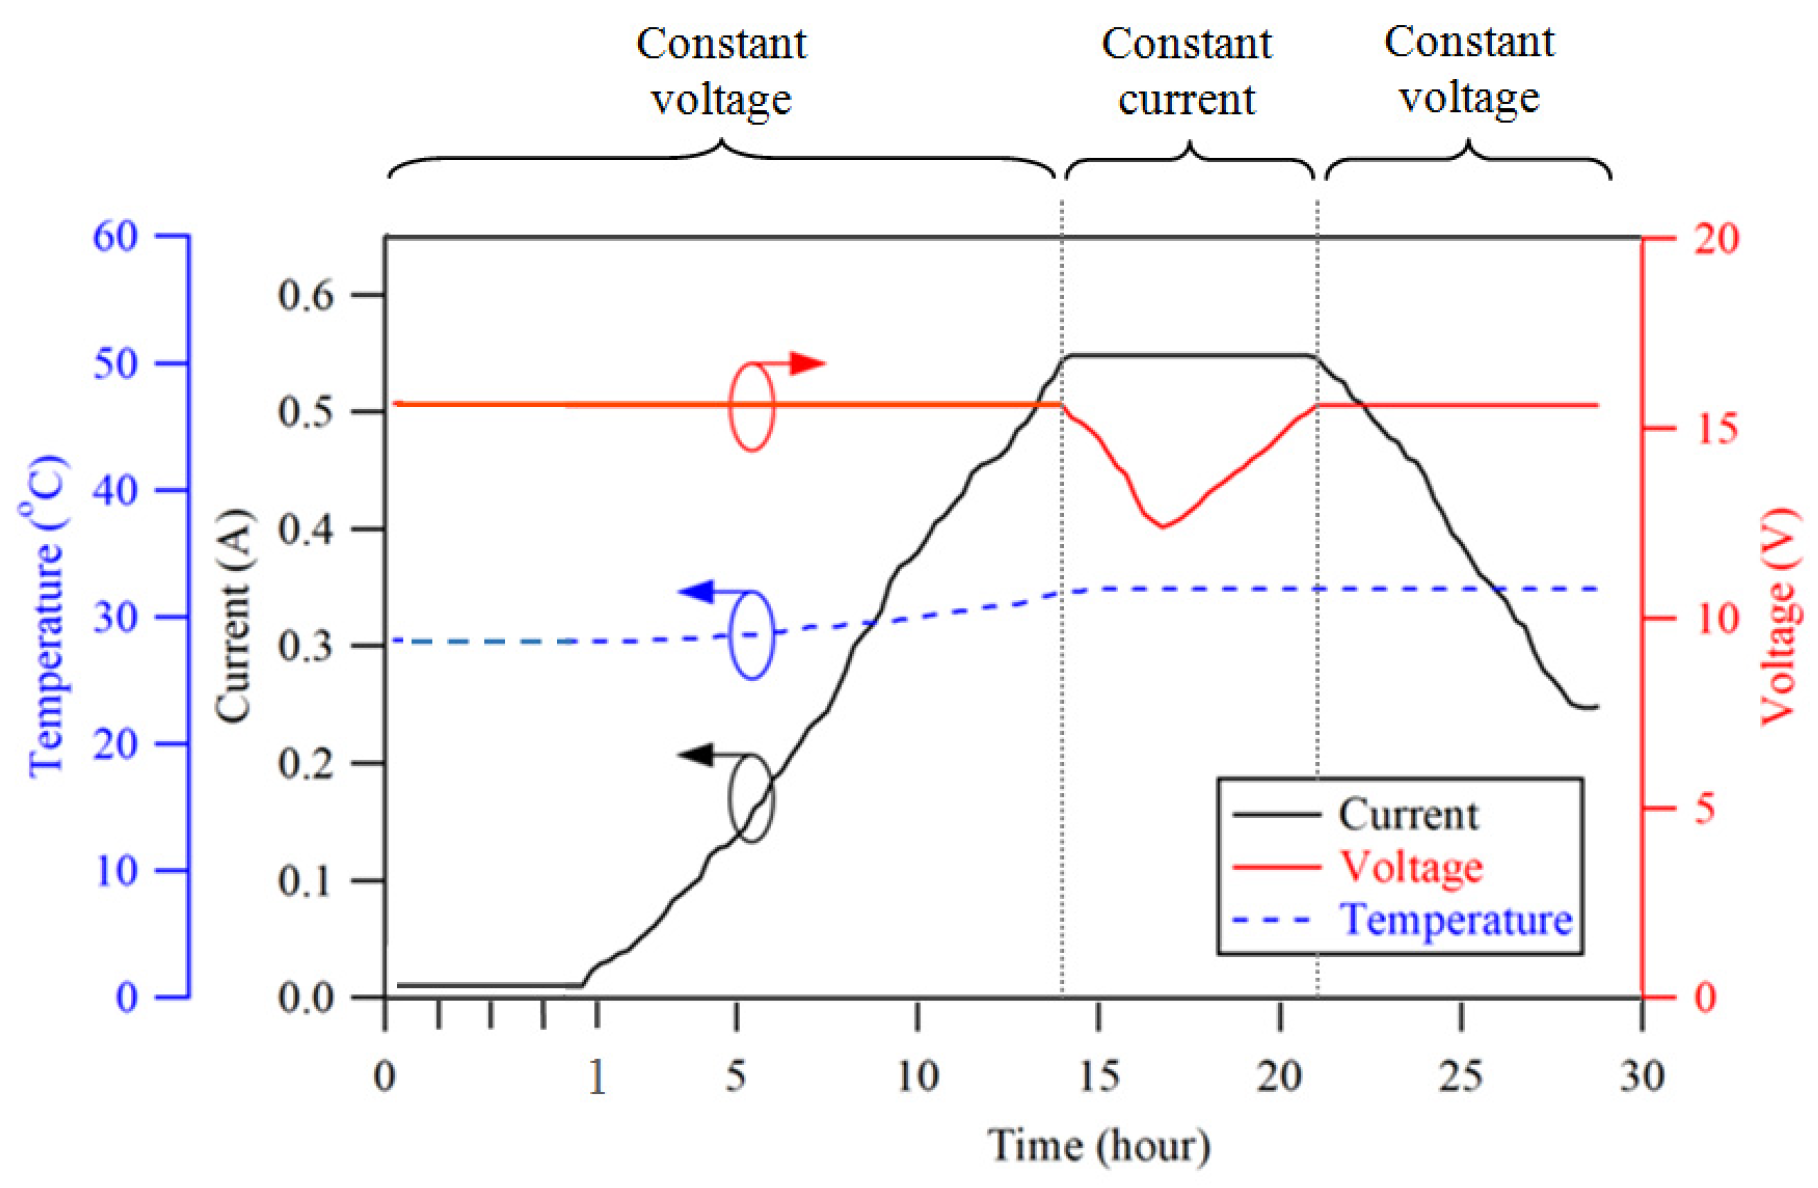
3.2.2. Charging Results for Recovered Batteries

Table 5 shows the charging results for the recovered batteries. The charging currents of the batteries that were charged at 15.6 V and 16.0 V successfully reached the set value of 0.077 C. The charging profiles of these two voltage levels were identical, and the voltage-on-charge ran stably throughout the entire charging process and achieved the set voltage values when the batteries were fully charged. Unlike the failed batteries, the increase in battery temperature was suppressed, showing that no internal open circuit or short circuit existed. Figure 8 shows the charging profile of one of the recovered batteries that was charged at 15.6 V and achieved the anticipated outcome.
Figure 9 shows the discharge curves of the recovered battery before and after the restoration. The comparison shows that the discharge capacity of the recovered battery was apparently high after the charging process. Note that a 5 h discharge rate was applied for the load test, and the cutoff voltage was set at 10.5 V. The steep “droop” in voltage at the beginning of the discharging process was caused by the sudden engagement of a heavy load. The rebound reaction indicated that the ionization between the cell plates and the electrolyte was active and robust [41].
The discharge results for several recovered battery samples are summarized in Table 6. The highest discharge capacity recorded was 6440 mAh (or 89.4% of the original rating), and the Cf/Ci was 20.1. It is clear from Table 6 that the percentage of recovery was greater than 66.5%, which shows that the high charging voltage in the recovery of the discarded batteries affected by sulfation was efficient.

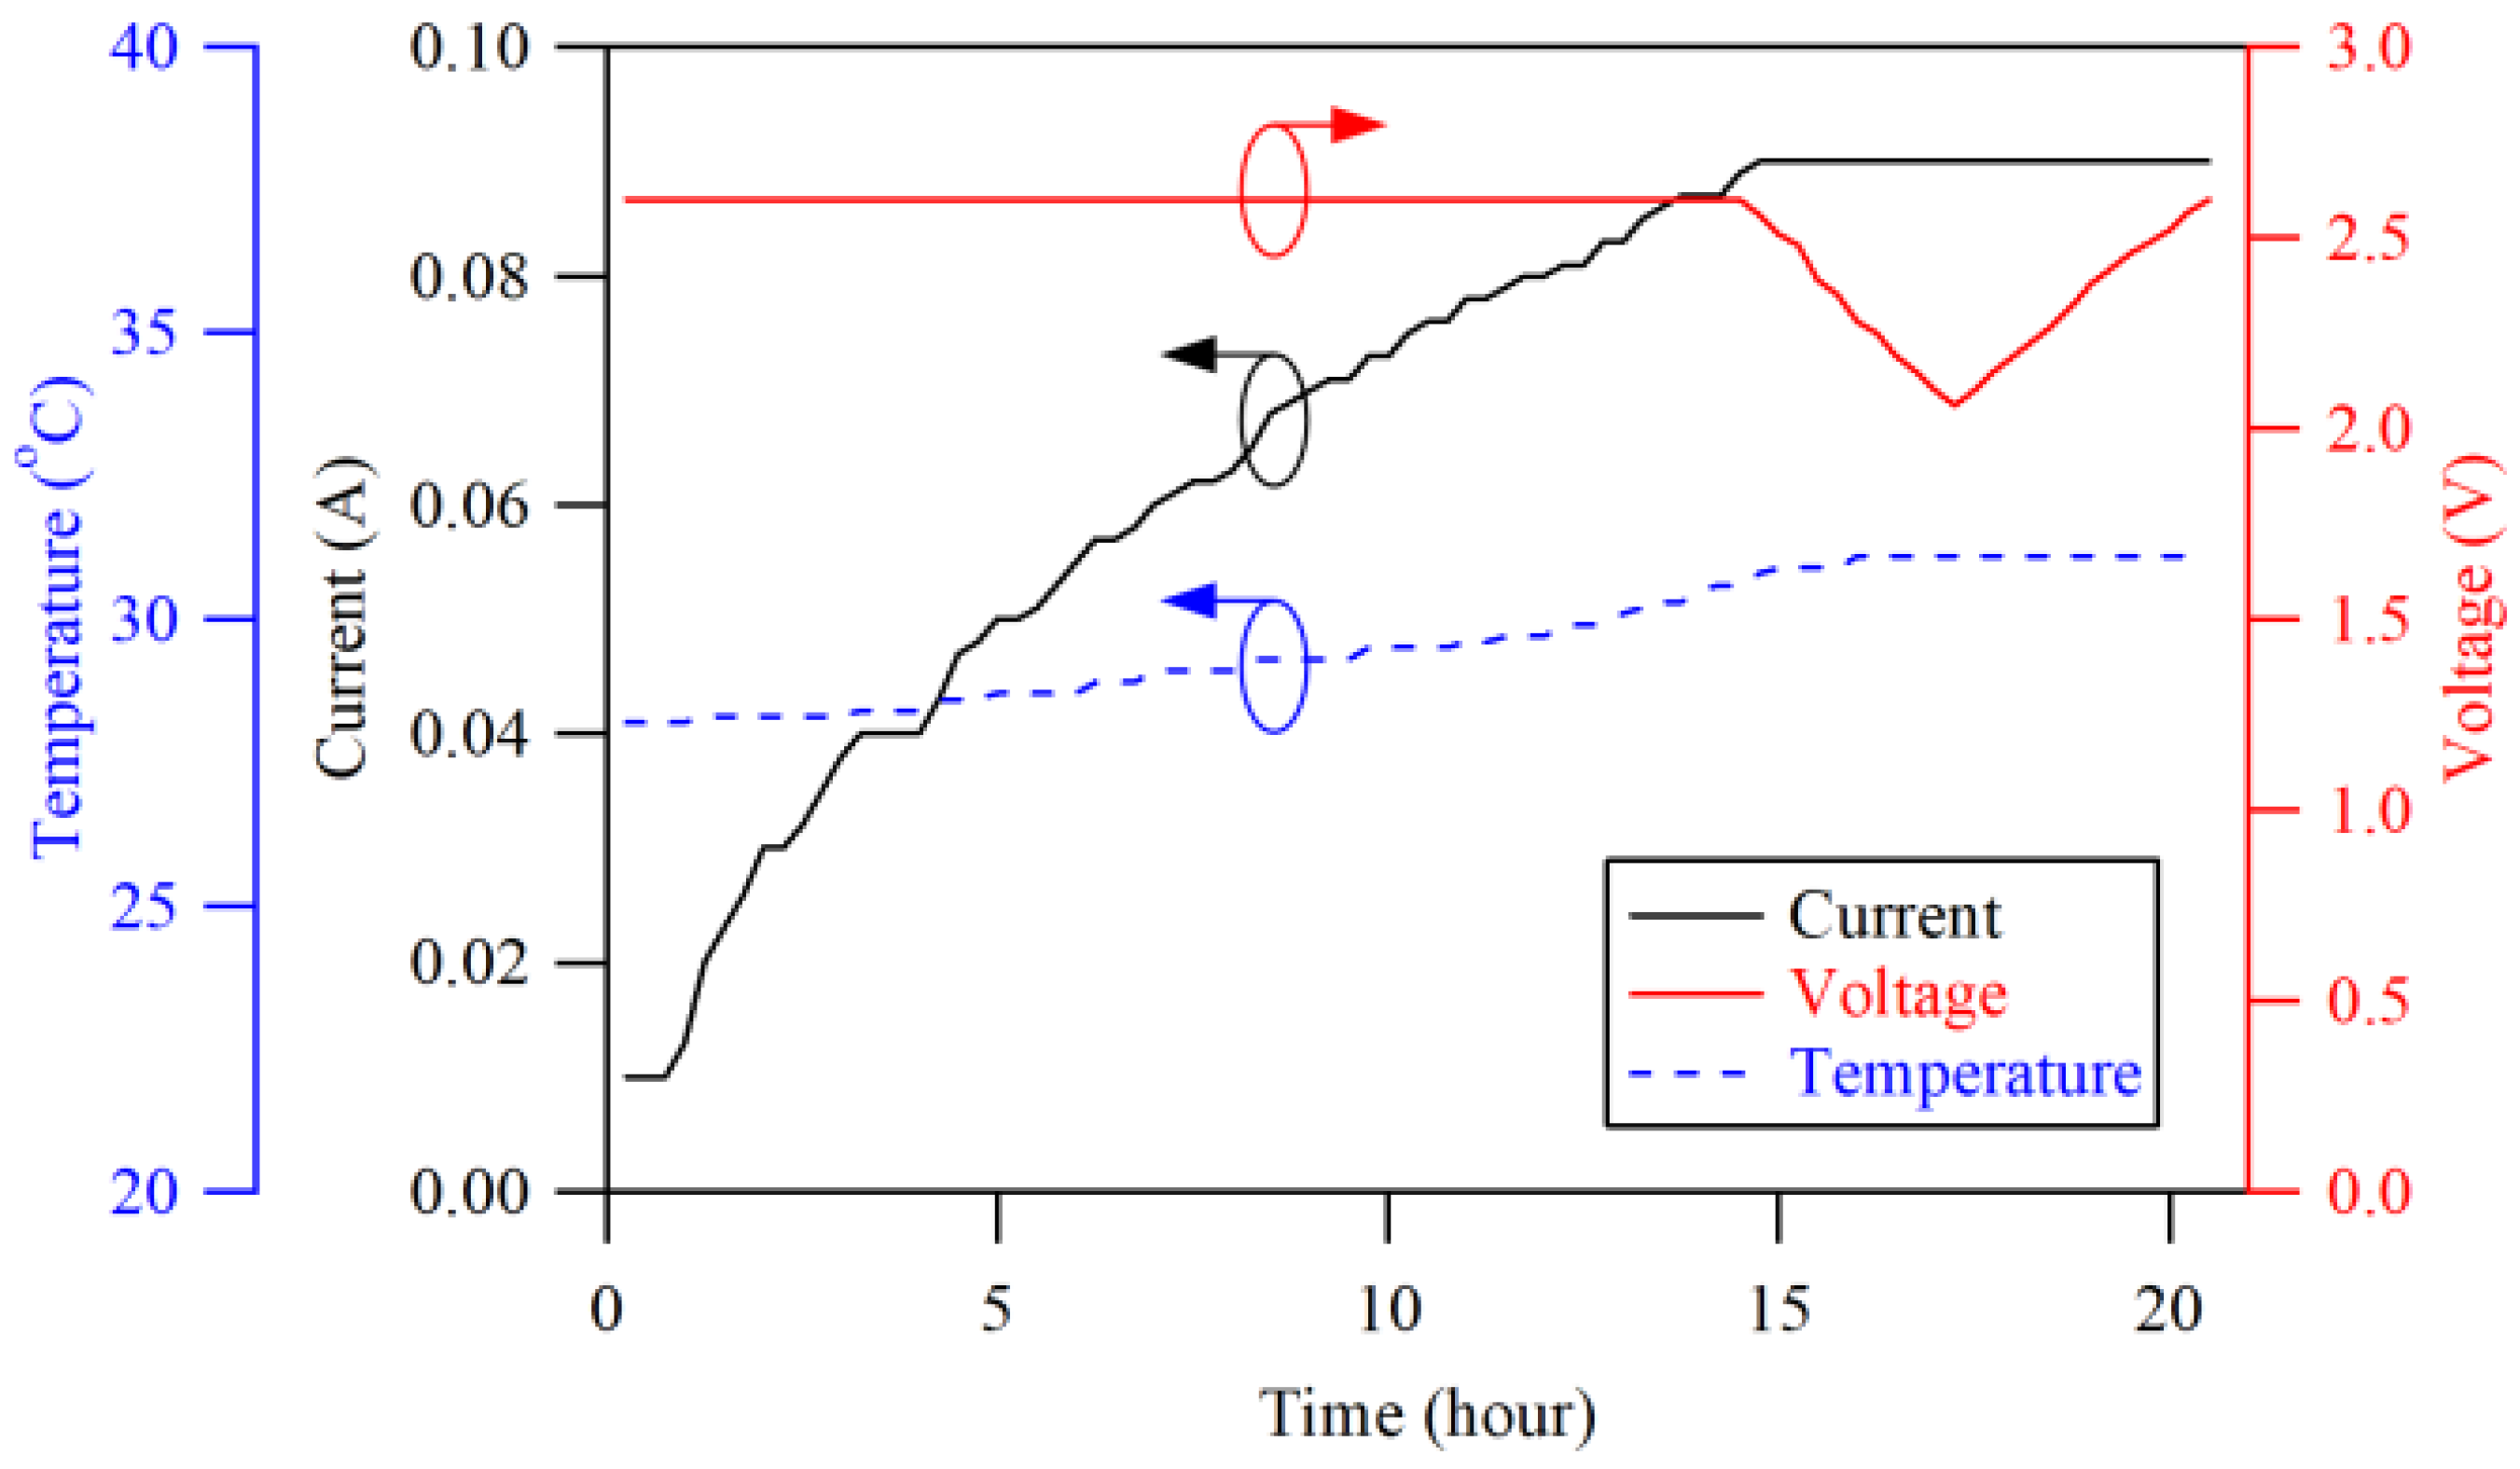
3.3. Case Three: Discarded Cells

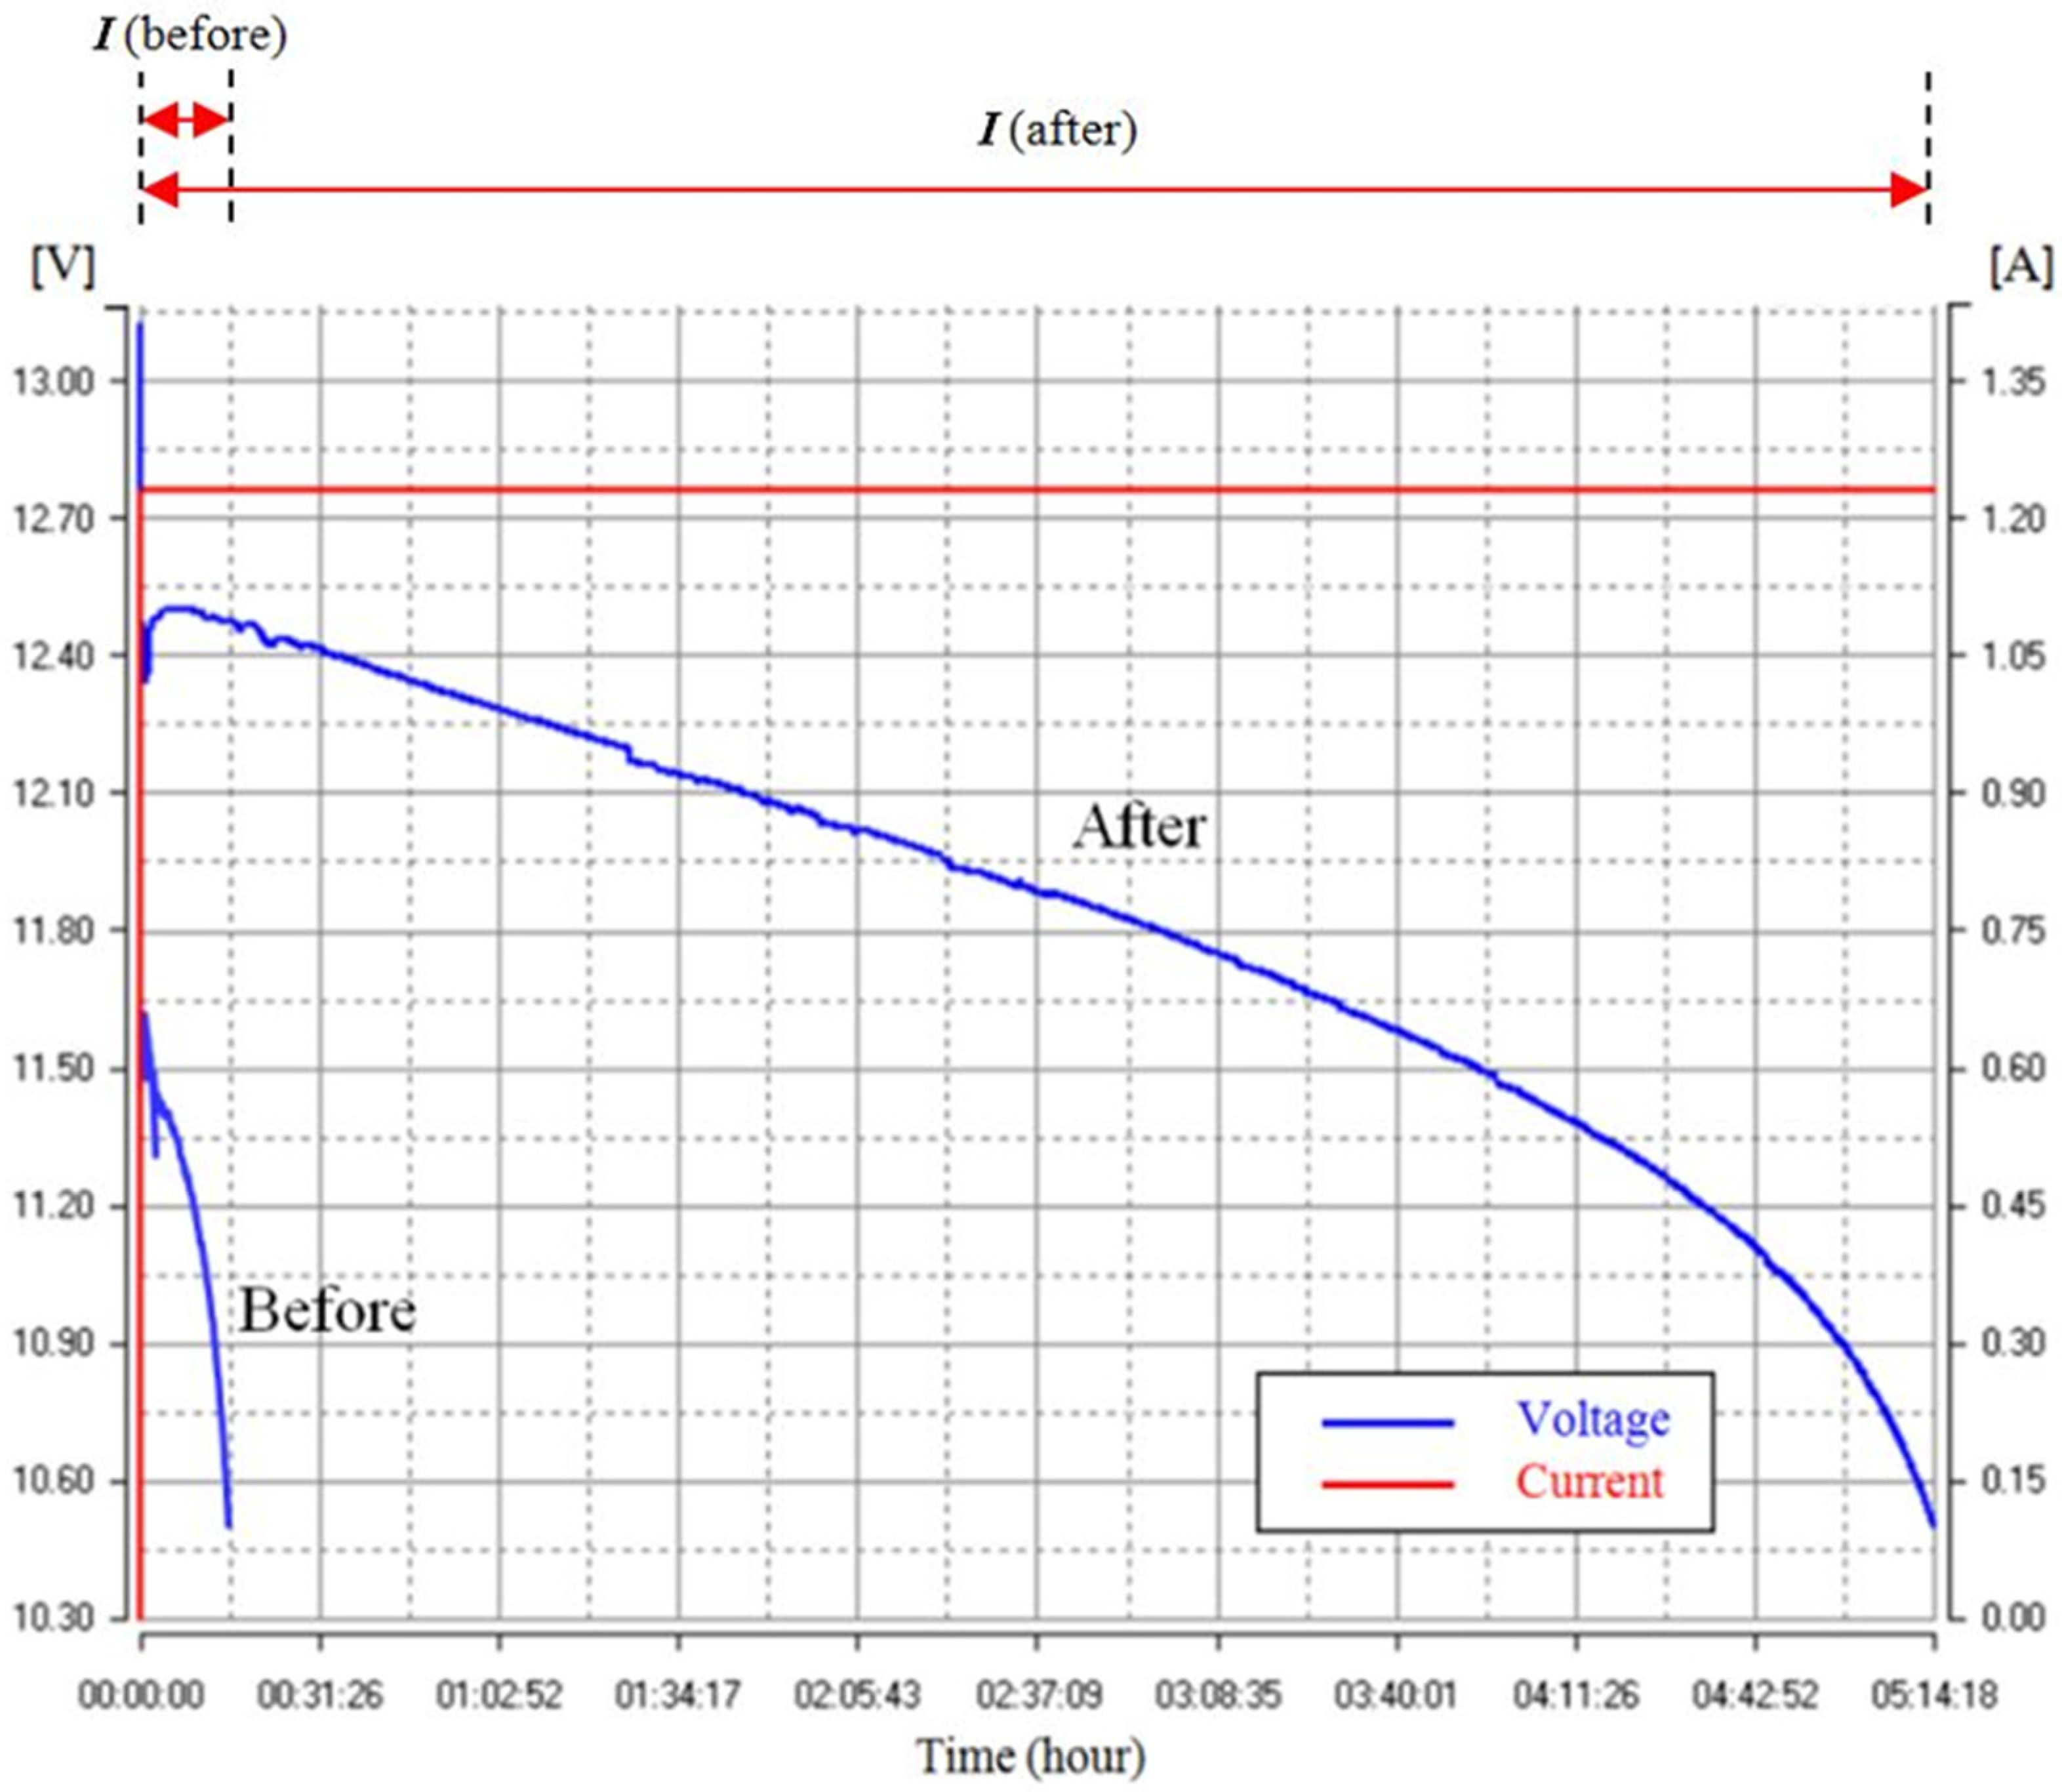
3.3.1. Charging and Discharging Results for Recovered Cells

Figure 10 shows the charging response of one of the recovered cells charged at 2.6 V. In the first 14.5 h, the acceptance of charge gradually increased, indicating that the applied voltage level improved the ionization activity in the sulfated cells. Since the cell had no physical defects, the rise in cell temperature was solely caused by the charge transfer during the ionization process [40]. Therefore, the maximum temperature recorded was 31.1 °C.
Table 7 summarizes the charging and discharging results for the discarded cells. Note that 2.46 V and 2.53 V were unable to charge the cells effectively, and the charging currents did not increase during the charging process and remained stagnant at 0.01 A and 0.03 A, respectively. On the other hand, 2.6 V and 2.67 V successfully raised the currents to the set value, and the cells reached full charge. As shown by the results, the cells that were charged at these two voltage levels had their charging capabilities restored by shedding off the lead sulfate that was deposited on the plate surfaces. The discharge capacities of the recovered cells were 1112 mAh and 1134 mAh, respectively, which were 92.6% and 94.5% of their ratings. However, a 4 ml depletion of the electrolyte was observed with the cells charged at 2.67 V after the charging process. This indicates that the gassing level generated by the charging voltage was significant compared to the cell at 2.6 V. As a result, 2.67 V (or 16.0 V for a six-cell battery) was considered too high for the charging of lead acid batteries and cells.

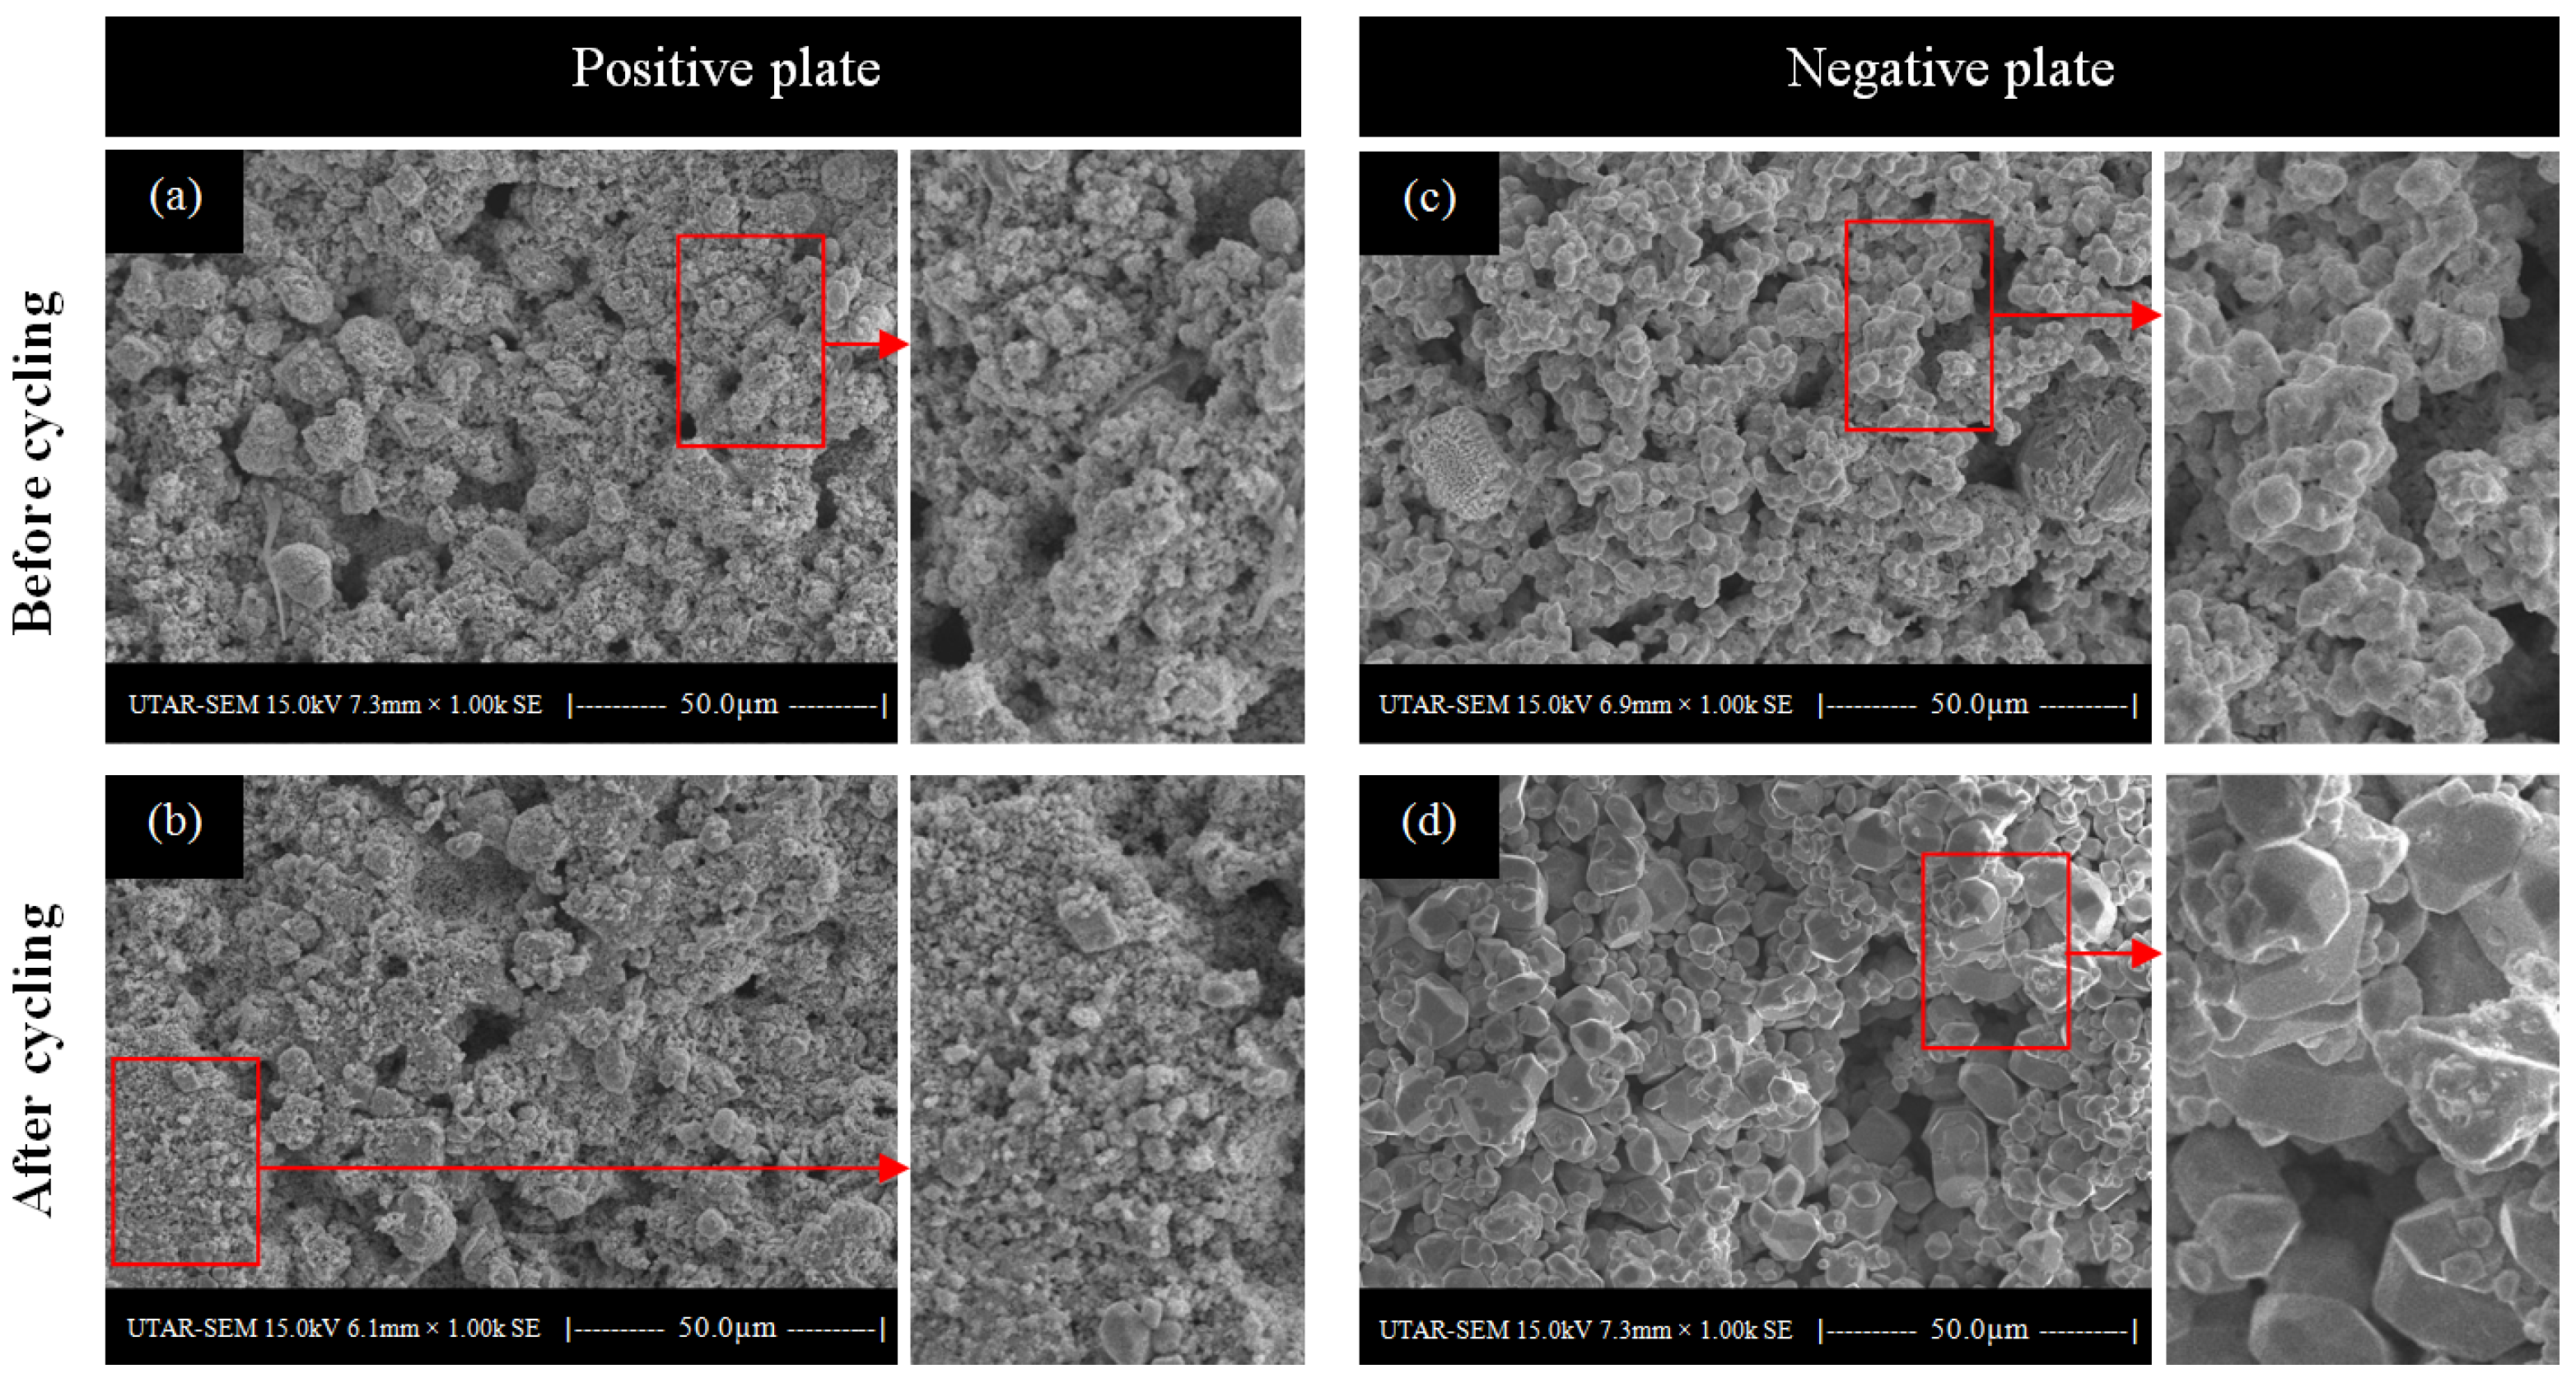
3.3.2. Surface Morphology Study of the Recovered Cells

Figure 11 shows the surface morphologies of the positive and negative plates before and after charging. Figure 11a shows the surface of the uncharged positive plate that lost porosity due to sulfation. This surface morphology provided a limited surface area for electrochemical reactions. As a result, the cell’s charging capability and ability to store energy became very limited. Figure 11b shows the re-emerged rough surface on the fully charged positive plate. Details on the plate surfaces can be seen in the magnified SEM image, which shows the micropores present on the surface. Figure 11c shows the uncharged negative plate. There were no micropores apparent on the surface. Nevertheless, the plate surface returned to a high degree of roughness after being charged at a higher voltage, as shown in Figure 11d.
Table 8 shows the EDX results for the positive and negative plates before and after the charging process. Initially, the sulfur component in the positive plate was 14.37% wt, but it decreased to 11.07% wt after being charged. Similarly, the sulfur component in the negative plate was reduced from 15.78% wt to 6.25% wt. The reduction in the sulfur component indicated the removal of lead sulfate from the plates, which restored a higher lead content to the plates. The increase in the oxygen level in the charged positive plate indicated that the oxidation process took place effectively. In addition, the decrease in the oxygen level in the negative plate indicated a robust reduction process during the charging process.

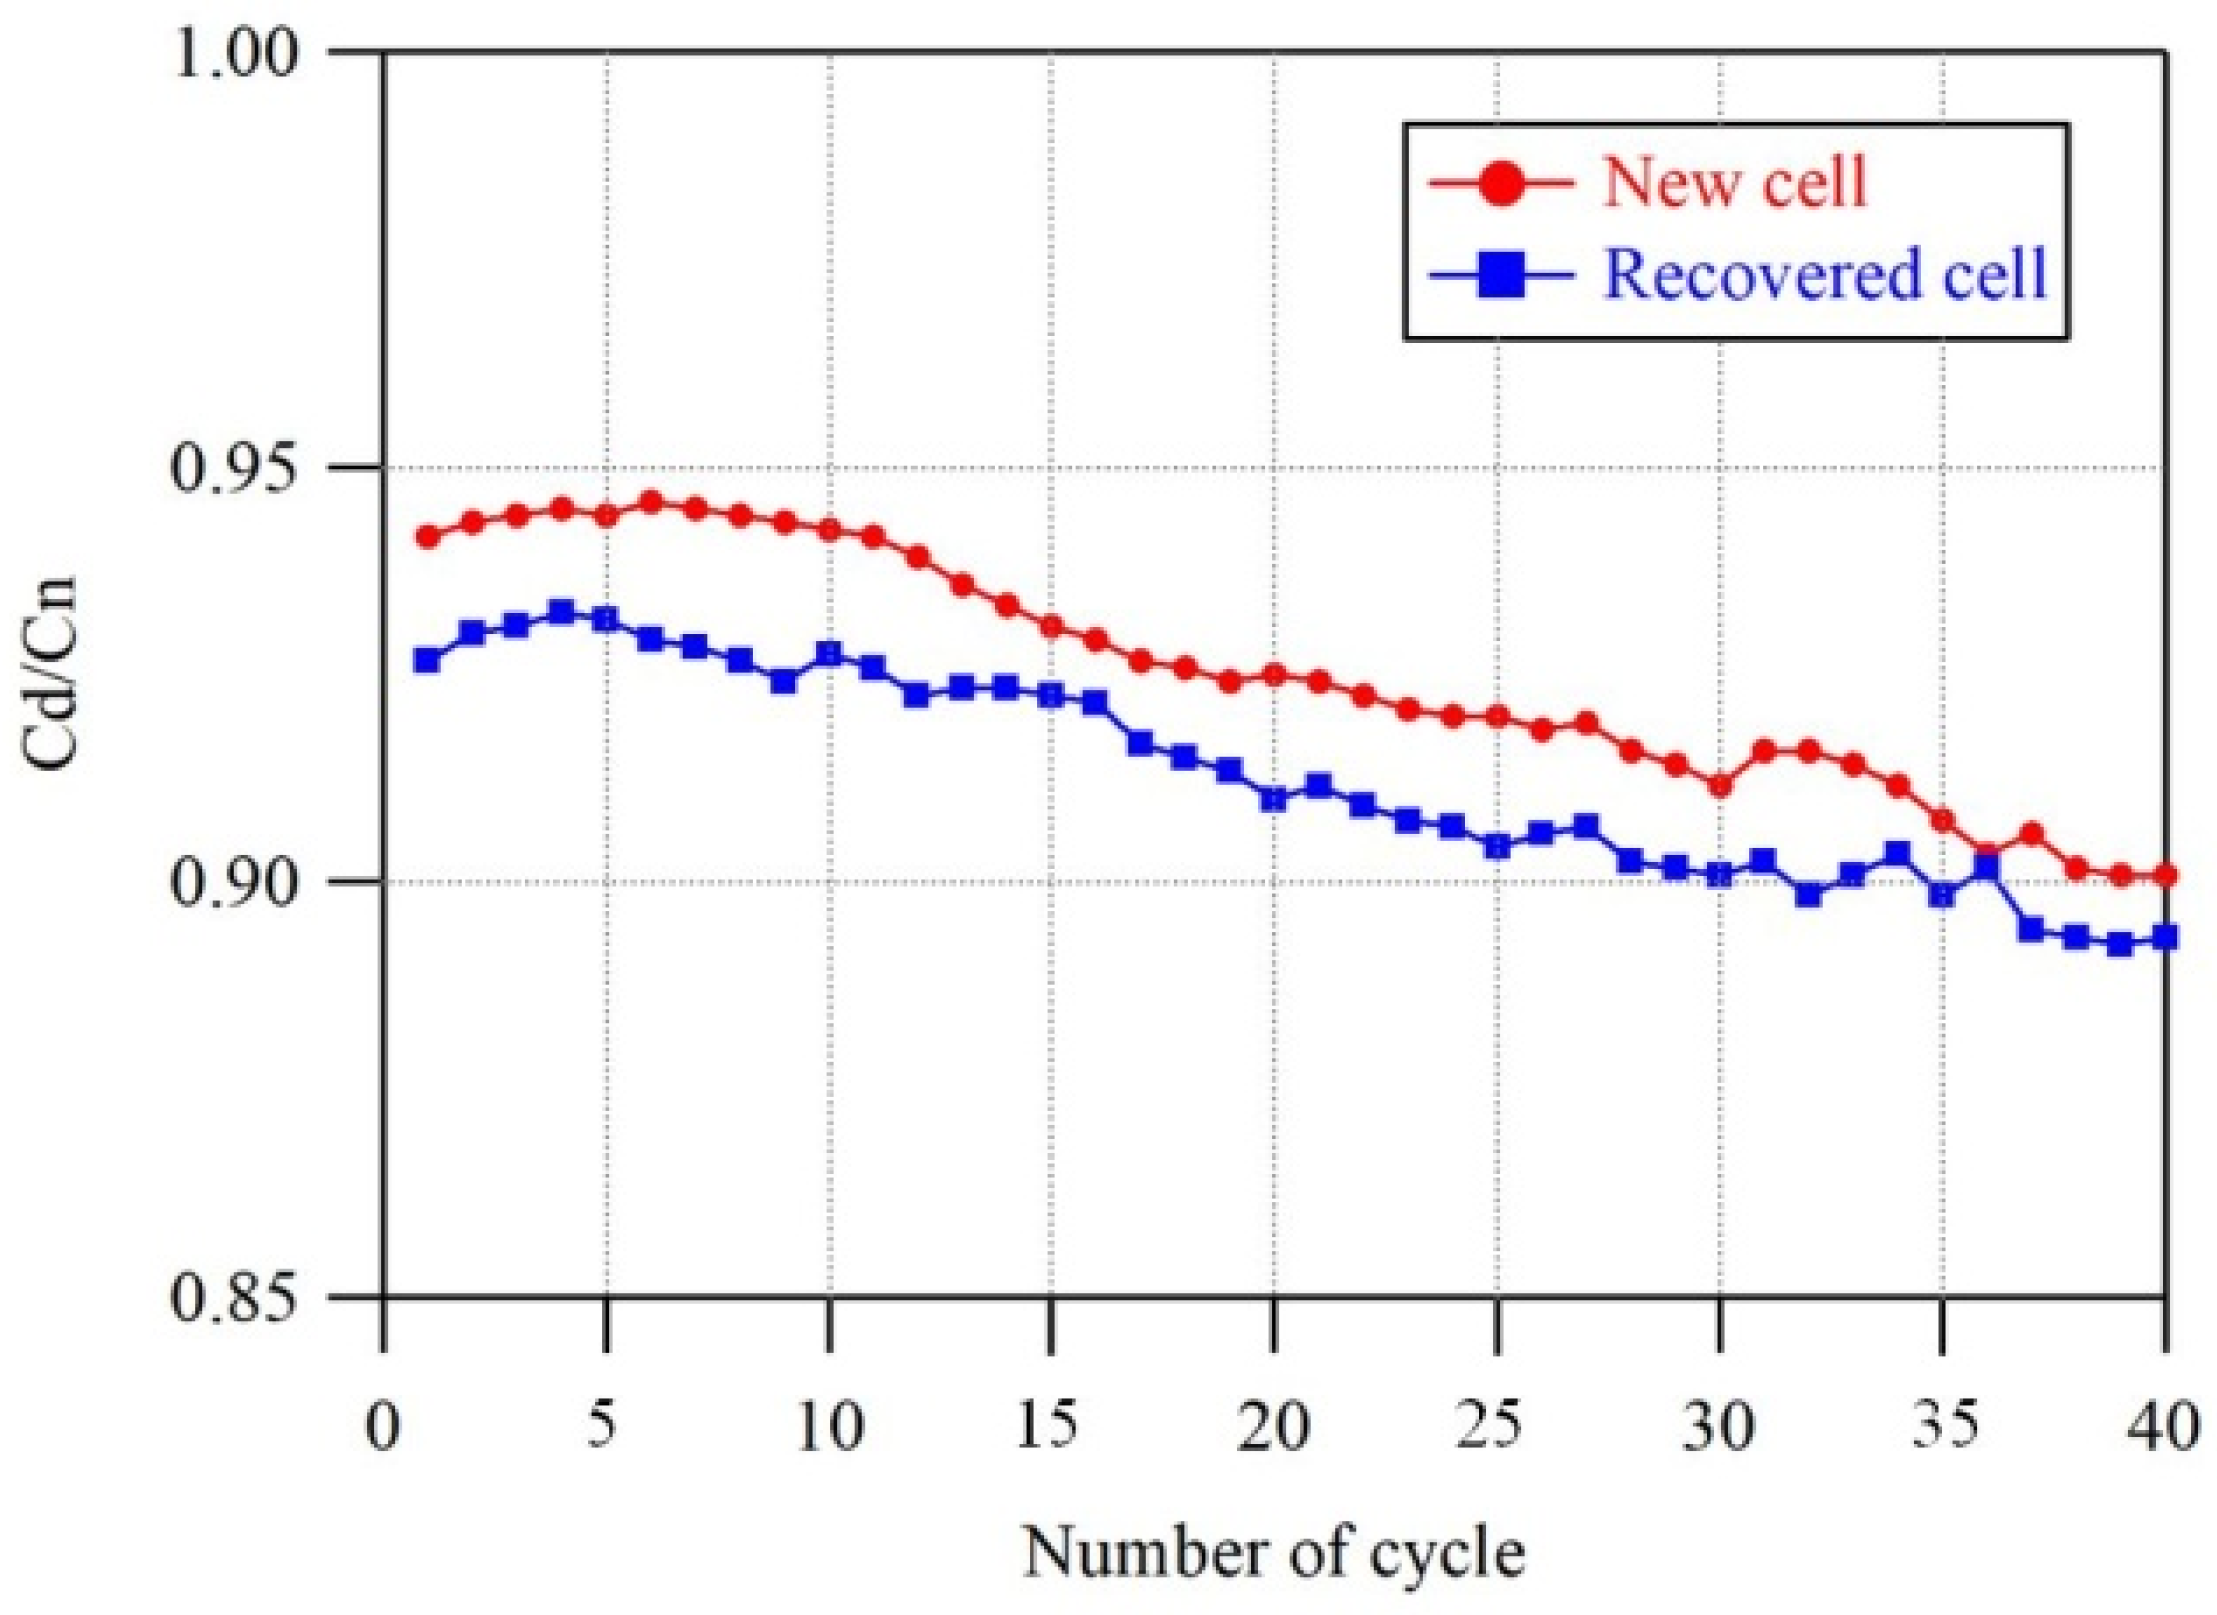
3.3.3. Cycle Life Test

Recovered cells were used for the cycle life test and compared with a new cell with identical specifications. The charging voltage for the cycle life test was 2.4 V and the charging current was 0.1 C. The cut-off voltage was set at 1.75 V. Over 40 charge–discharge cycles, the discharge capacity value for the recovered cells remained close to that of the new cell in each iteration. Figure 12 shows the discharged capacities (Cd) of the new and recovered cells compared with the nominal capacity (Cn). The average discharged capacity of the recovered cells was 98.6% that of the new cell or 91.3% of its rated value. In the last cycle of the test, the recovered cells maintained their discharge capacity at 89% of the rated value, demonstrating the cells’ reliable durability. Note that the highest capacity ratio (Cd/Cn) for the new cell was 0.94 instead of 1.0 because a 5 h discharge rate was applied for the test [42,43]. This high discharge rate validated the discharge capability of the cell in providing a high discharge current after the restoration process.
A microscopic scan of the plate surfaces was performed to investigate the physical changes in the cell plates after the cycle life test in order to compare them with their initial state. Figure 13a shows the initial surface morphology of the positive plate. The micropores on the active material can clearly be seen. After the cycle life test, the surface was smoother than the initial condition, indicating a reduction in surface porosity. The highlighted areas shown in Figure 13b indicate a reduction in the surface porosity, as the surface was smoother than the initial state. A similar phenomenon was also observed for the negative plate. Figure 13c shows a negative plate before the cycle life test. However, Figure 13d shows that the granular structure of the active material appeared to be dense after the cycle life test, which decreased the surface porosity.
Regarding the structure stability, it was noticed that the surface structures of both the positive and negative plates were not stable because the structures became increasingly even or smooth as the testing progressed. The total surface areas of the plates were progressively reduced as the amount of deposited lead sulfate grew on the plate surfaces, causing a reduction in the plate porosity. With such a progressive change in the porosity, the battery gradually lost its ability to facilitate the exchange of electrons between the plates and the electrolyte.

4. Conclusions

The long-term accumulation of lead sulfate causes a decline in the storage capacity of lead acid batteries. Due to the poor electrical conductivity of lead sulfate, the conventional charging voltage cannot cope with the high resistance caused by lead sulfate. In this study, different high charging voltages were used to examine the effects on the charging capability of discarded batteries. According to the experiment results, 15.2 V and below could not overcome the internal resistance of the discarded batteries. However, 15.6 V and 16.0 V were effective in recovering the charging capability and restoring the capacity of the batteries. Higher charging voltages can be used to determine the internal condition and possibility of reuse of discarded batteries without dismantling them in advance. Recovered battery cells charged at 2.67 V produced a high gassing rate that depleted 4 mL of the electrolyte after 20 h of charging. Such a reaction can also result in the shedding of active materials from the cell plate, which shortens the battery’s shelf life. However, 2.6 V was found to be efficient in restoring the charging capability of sulfated cells, returning the non-porous cell plate to a porous state. The porosity facilitates the permeation of the electrolyte into the inner parts of the plates and promotes robust ionization, which can result in a high discharge capacity and reliable durability. In conclusion, this paper demonstrates that high charging voltage can restore the charging capabilities of discarded lead acid batteries. As a result, their working life can be extended before the end-of-life of the batteries.

Author Contributions

Conceptualization, C.H.L. and Y.S.L.; methodology, C.H.L.; formal analysis, C.H.L. and J.W.; investigation, C.H.L. and J.W.; data curation, C.H.L.; writing—original draft preparation, C.H.L.; writing—review and editing, C.H.L., J.W. and Y.S.L.; visualization, C.H.L.; supervision, Y.S.L. and J.W. All authors have read and agreed to the published version of the manuscript.

Funding

This research received no external funding.

Data Availability Statement

The data presented in this study are available on request from the corresponding author.

Conflicts of Interest

The authors declare no conflict of interest.

References

  1. Byrne, R.H.; Nguyen, T.A.; Copp, D.A.; Chalamala, B.R.; Gyuk, I. Energy Management and Optimization Methods for Grid Energy Storage Systems. IEEE Access 2018, 6, 13231–13260. [Google Scholar] [CrossRef]
  2. Gong, H.; Rallabandi, V.; McIntyre, M.L.; Hossain, E.; Ionel, D.M. Peak Reduction and Long Term Load Forecasting for Large Residential Communities Including Smart Homes with Energy Storage. IEEE Access 2021, 9, 19345–19355. [Google Scholar] [CrossRef]
  3. Hau, L.C.; Lim, Y.S.; Chua, K.H. Active Control Strategy of Energy Storage System for Reducing Maximum Demand Charges under Limited Storage Capacity. J. Energy Eng. 2017, 143, 04017010. [Google Scholar] [CrossRef]
  4. Chua, K.H.; Lim, Y.S.; Morris, S. Peak Reduction for Commercial Buildings Using Energy Storage. In Proceedings of the IOP Conference Series: Earth and Environmental Science, Kunming, China, 22–25 September 2017; Volume 93, p. 012008. [Google Scholar] [CrossRef]
  5. Marańda, W. Capacity degradation of lead-acid batteries under variable-depth cycling operation in photovoltaic system. In Proceedings of the 2015 22nd International Conference Mixed Design of Integrated Circuits & Systems, Torun, Poland, 25–27 June 2015; pp. 552–555. [Google Scholar] [CrossRef]
  6. Yahmadi, R.; Brik, K.; Ammar, F.B. Degradation analysis of the lead acid battery plates in the manufacturing process. In Proceedings of the 2015 IEEE 12th International Multi-Conference on Systems, Signals & Devices, Mahdia, Tunisia, 16–19 March 2015; pp. 1–6. [Google Scholar] [CrossRef]
  7. Delgado-Sanchez, J.M.; Lillo-Bravo, I. Influence of Degradation Processes in Lead-acid Batteries on the Technoeconomic Analysis of Photovoltaic Systems. Energies 2020, 13, 4075. [Google Scholar] [CrossRef]
  8. Yahmadi, R.; Brik, K.; Ammar, F.B. Failures Analysis and Improvement Lifetime of Lead Acid Battery in Different Applications. In Proceedings of the 3rd International Conference on Automation, Control, Engineering and Computer Science, Hammamet, Tunisia, 20–22 March 2016; pp. 148–154. [Google Scholar]
  9. Ruetschi, P. Aging Mechanisms and Service Life of Lead–Acid Batteries. J. Power Sources 2004, 127, 33–44. [Google Scholar] [CrossRef]
  10. May, G.J.; Davidson, A.; Monahov, B. Lead Batteries for Utility Energy Storage: A Review. J. Energy Storage 2018, 15, 145–157. [Google Scholar] [CrossRef]
  11. Linden, D.; Reddy, T.B. Handbook of Batteries; McGraw Hill, Ed.; Elsevier Science: New York, NY, USA, 2002. [Google Scholar]
  12. Kirchev, A.; Delaille, A.; Perrin, M.; Lemaire, E.; Mattera, F. Studies of the Pulse Charge of Lead-acid Batteries for PV Applications. Part II. Impedance of the Positive Plate Revisited. J. Power Sources 2007, 170, 495–512. [Google Scholar] [CrossRef]
  13. Hu, J.; Guo, Y. Effects of Electrolyte Stratification on Performances of AGM Valve-regulated Lead-acid Batteries. Electrochim. Acta 2007, 52, 6734–6740. [Google Scholar] [CrossRef]
  14. Catherino, H.A.; Feres, F.F.; Trinidad, F. Sulfation in Lead-acid Batteries. J. Power Sources 2004, 129, 113–120. [Google Scholar] [CrossRef]
  15. Franke, M.; Kowal, J. Empirical Sulfation Model for Valve-regulated Lead-acid Batteries Under Cycling Operation. J. Power Sources 2018, 380, 76–82. [Google Scholar] [CrossRef]
  16. Pavlov, D.; Milusheva, Y.; Vassilev, S.; Shibahara, T.; Tozuka, M. Benzyl Benzoate as an Inhibitor of the Sulfation of Negative Electrodes in Lead Acid Batteries. J. Energy Storage 2018, 17, 336–344. [Google Scholar] [CrossRef]
  17. Ghavami, R.K.; Kameli, F.; Shirojan, A.; Azizi, A. Effects of Surfactants on Sulfation of Negative Active Material in Lead Acid Battery Under PSOC Condition. J. Energy Storage 2016, 7, 121–130. [Google Scholar] [CrossRef]
  18. Moseley, P.T.; Rand, D.A.J.; Garche, J. Lead-Acid Batteries for Future Automobiles; Elsevier: Amsterdam, The Netherlands, 2017; pp. 601–618. [Google Scholar] [CrossRef]
  19. Taguchi, M.; Sugita, H. Analysis for Electrolytic Oxidation and Reduction of PbSO4/Pb Electrode by Electrochemical QCM Technique. J. Power Sources 2002, 109, 294–300. [Google Scholar] [CrossRef]
  20. Zeng, Y.; Hu, J.; Ye, W.; Zhao, W.; Zhou, G. Investigation of Lead Dendrite Growth in the Formation of Valve-regulated Lead-acid Batteries for Electric Bicycle Applications. J. Power Sources 2015, 286, 182–192. [Google Scholar] [CrossRef]
  21. Lakshmi, C.S. Structure and Properties of Lead–calcium–tin Alloys for Battery Grids. J. Power Sources 1998, 73, 23–29. [Google Scholar] [CrossRef]
  22. Peixoto, L.C.; Osório, W.R.; Garcia, A. Microstructure and Electrochemical Corrosion Behavior of a Pb–1 wt % Sn Alloy for Lead-Acid Battery Components. J. Power Sources 2009, 192, 724–729. [Google Scholar] [CrossRef]
  23. Rand, D.A.J.; Boden, D.P.; Lakshmi, C.S.; Nelson, R.F.; Prengaman, R.D. Manufacturing and Operational Issues with Lead-acid Batteries. J. Power Sources 2002, 107, 280–300. [Google Scholar] [CrossRef]
  24. Slavkov, D.; Haran, B.S.; Popov, B.N.; Fleming, F. Effect of Sn and Ca Doping on the Corrosion of Pb Anodes in Lead Acid Batteries. J. Power Sources 2002, 112, 199–208. [Google Scholar] [CrossRef]
  25. Thomas, U.B.; Forster, F.T.; Haring, H.E. Corrosion and Growth of Lead-calcium Alloy Storage Battery Grids asAFunction of Calcium Content. Trans. Electrochem. Soc. 1947, 92, 313–325. [Google Scholar] [CrossRef]
  26. Pour-ali, S.; Mosallami, M.; Davoodi, A. Electrochemical Corrosion Behavior of Pb-Ca-Sn-Sm Grid Alloy in H2SO4 Solution. J. Alloys Compd. 2015, 652, 172–178. [Google Scholar] [CrossRef]
  27. Moseley, P.T.; Garche, J. Electrochemical Energy Storage for Renewable Sources and Grid Balancing. In Electrochemical Energy Storage for Renewable Sources and Grid Balancing; Newnes: Oxford, UK, 2014; pp. 1–473. [Google Scholar] [CrossRef]
  28. Rahmanifar, M.S. Electrochimica Acta Enhancing the Cycle Life of Lead-Acid Batteries by Modifying Negative Grid Surface. Electrochim. Acta 2017, 235, 10–18. [Google Scholar] [CrossRef]
  29. Boden, D.P. Improved Oxides for Production of Lead/acid Battery Plates. J. Power Sources 1998, 73, 56–59. [Google Scholar] [CrossRef]
  30. Schilling, S. Ensuring Lead-acid Battery Performance with Pulse Technology. In Proceedings of the Fourteenth Annual Battery Conference on Applications and Advances, Long Beach, CA, USA, 12–15 January 1999; pp. 247–252. [Google Scholar] [CrossRef]
  31. Hsieh, H.I.; Shih, S.F.; Hsieh, J.H.; Wang, C.H. Photovoltaic High-frequency Pulse Charger for Lead-acid Battery Under Maximum Power Point Tracking. Int. J. Photoenergy 2013, 2013, 687693. [Google Scholar] [CrossRef]
  32. Sun, R.L.; Hu, P.Q.; Wang, R.; Qi, L.Y. A New Method for Charging and Repairing Lead-acid Batteries. In Proceedings of the IOP Conference Series: Earth and Environmental Science, Harbin, China, 29 November–1 December 2020; Volume 461, p. 012031. [Google Scholar] [CrossRef]
  33. Kirchev, A.; Delaille, A.; Karoui, F.; Perrin, M.; Lemaire, E.; Mattera, F. Studies of the Pulse Charge of Lead-acid Batteries for PV Applications. Part III. Electrolyte Concentration Effects on the Electrochemical Performance of the Positive Plate. J. Power Sources 2008, 179, 808–818. [Google Scholar] [CrossRef]
  34. Kirchev, A.; Mattera, F.; Lemaire, E.; Dong, K. Studies of the Pulse Charge of Lead-acid Batteries for Photovoltaic Applications. Part IV. Pulse Charge of the Negative Plate. J. Power Sources 2009, 191, 82–90. [Google Scholar] [CrossRef]
  35. Horkos, P.G.; Yammine, E.; Karami, N. Review on Different Charging Techniques of Lead-acid Batteries. In Proceedings of the 2015 3rd International Conference on Technological Advances in Electrical, Electronics and Computer Engineering (TAEECE), Beirut, Lebanon, 29 April 2015–1 May 2015; Volume 2015, pp. 27–32. [Google Scholar] [CrossRef]
  36. Karami, H.; Asadi, R. Recovery of discarded sulfated lead-acid batteries. J. Power Sources 2009, 191, 165–175. [Google Scholar] [CrossRef]
  37. Khalil, R.A. A study of the effect of inverse charging on the service life of lead acid battery. Bull. Electrochem. 2000, 16, 472–475. [Google Scholar]
  38. Spanos, C.; Berlinger, S.A.; Jayan, A.; West, A.C. Inverse Charging Techniques for Sulfation Reversal in Flooded Lead-Acid Batteries. J. Electrochem. Soc. 2016, 163, A1612–A1618. [Google Scholar] [CrossRef]
  39. Vinal, G.W.; Craig, D.N. Resistivity of Sulfuric-acid Solutions and Its Relation to Viscosity and Temperature. J. Res. Natl. Bur. Stand. 1934, 13, 689. [Google Scholar] [CrossRef]
  40. Svoboda, V. Batteries|Fast Charging. Encycl. Electrochem. Power Sources 2009, 424–442. [Google Scholar] [CrossRef]
  41. He, Q.; Zha, Y.; Sun, Q.; Pan, Z.; Liu, T. Capacity Fast Prediction and Residual Useful Life Estimation of Valve Regulated Lead Acid Battery. Math. Probl. Eng. 2017, 2017, 7835049. [Google Scholar] [CrossRef]
  42. Ioannou, S.; Dalamagkidis, K.; Stefanakos, E.K.; Valavanis, K.P.; Wiley, P.H. Runtime, Capacity and Discharge Current Relationship for Lead Acid and Lithium Batteries. In Proceedings of the 2016 24th Mediterranean Conference on Control and Automation (MED), Athens, Greece, 21–24 June 2016; Volume 2016, pp. 46–53. [Google Scholar] [CrossRef]
  43. Cugnet, M.G.; Dubarry, M.; Liaw, B.Y. Peukert’s Law of a Lead-Acid Battery Simulated by a Mathematical Model. ECS Trans. 2019, 25, 223–233. [Google Scholar] [CrossRef]
Figure 1. Experimental procedures for discarded cells and batteries.
Energies 16 01598 g001
Figure 2. Charging and discharging procedures for case two and case three.
Energies 16 01598 g002
Figure 3. Microscopic scans of new positive plates (a,b), and discarded positive plates (c,d) before and after charging at 2.4 V.
Energies 16 01598 g003
Figure 4. Microscopic scans of new negative plates (a,b) and discarded negative plates (c,d) before and after charging at 2.4 V.
Energies 16 01598 g004
Figure 5. Scenario one: charging profile of failed batteries that did not accept charge when being charged at 14.8 V.
Energies 16 01598 g005
Figure 6. Scenario two: (a) charging profile of the open-circuited batteries when charging at 15.6 V; (b) broken connections between lug and plates.
Energies 16 01598 g006
Figure 7. Scenario three: (a) charging response of the short-circuited batteries when charging at 15.6 V; (b) an expanded positive grid short with the negative lug.
Energies 16 01598 g007
Figure 8. The charging profile demonstrated by the recovered batteries.
Energies 16 01598 g008
Figure 9. Five-hour discharge curves of one of the recovered batteries.
Energies 16 01598 g009
Figure 10. Charging response of the recovered cell (charged at 2.6 V).
Energies 16 01598 g010
Figure 11. Microscopic scans of the recovered positive (a,b) and negative plates (c,d) before and after recovery.
Energies 16 01598 g011
Figure 12. Discharged capacities of new cell and recovered cell during the 40 cycles of testing.
Energies 16 01598 g012
Figure 13. Microscopic scans of the positive (a,b) and negative plates (c,d) before and after the cycle life test.
Energies 16 01598 g013
Table 1. Charging voltages and currents set in the experiments.
Charging Voltage (V)Set Current
BatteriesCells
14.82.460.077 C
15.22.530.077 C
15.62.600.077 C
16.02.670.077 C
Table 2. EDX analysis of new and discarded positive plates before and after charging.
DescriptionComponents (% wt)
PbSO
New positive plate before charging75.3411.8912.77
New positive plate after charging80.5506.2113.24
Discarded positive plate before charging71.4014.1014.50
Discarded positive plate after charging71.0312.8416.13
Table 3. EDX analysis of new and discarded negative plates before and after charging.
DescriptionComponents (% wt)
PbSO
New negative plate before charging79.9207.4412.64
New negative plate after charging86.4703.6609.87
Discarded negative plate before charging77.7608.8913.35
Discarded negative plate after charging78.2008.7113.09
Table 4. Charging results for the failed batteries charged at high charging voltages.
ScenarioCharging Voltage (V)Max. Recorded
Current C (A)
Results
Battery Temp. at 20th h (°C)Charging ResponseOpen Circuit Voltage (V)
114.80.003 C (0.02 A)28.0No acceptance of charge<12
115.20.013 C (0.09 A)28.3No acceptance of charge<12
215.60.067 C (0.48 A) 34.2Voltage-on-charge was stable<12
315.60.077 C (0.55 A)47.0Voltage fluctuated between 12.6 and 15.3 V>12
216.00.071 C (0.51 A)34.9Voltage-on-charge was stable<12
316.00.077 C (0.55 A)47.0Voltage fluctuated between 12.6 and 15.1 V>12
Table 5. Charging results for the recovered batteries charged at high charging voltages.
Charging Voltage (V)Max. Recorded
Current C (A)
Results
Battery Temp. at 20th h (°C)Charging ResponseOpen Circuit Voltage (V)
15.60.077 C (0.55 A)32.3Voltage-on-charge achieved 15.6 V>12
16.00.077 C (0.55 A)33.1Voltage-on-charge achieved 16.0 V>12
Table 6. Discharged capacities for the recovered batteries before and after charging.
Battery No.Charging Voltage (V)Discharge Capacity (mAh)Cf/Ci% of Recovery
Before (Ci)After (Cf)
115.6320644020.185.0
215.6401628915.781.8
315.6386585615.276.2
415.6343512815.066.5
516.069057098.369.7
Table 7. Charging and discharging results for discarded cells.
Charging Voltage (V)Maximum Current (A)Electrolyte (mL)Results
Before ChargeAfter ChargeCharging Response5 h Discharge
Capacity (mAh)
2.460.01160160No acceptance of charge--
2.530.03160160No acceptance of charge18
2.600.09 (0.077 C)160160Fully charged1112
2.670.09 (0.077 C)160156Fully charged1134
Table 8. EDX analysis of positive and negative plates before and after charging.
SampleComponents (% wt)
PbSO
Positive plate before charging70.1214.3715.51
Positive plate after charging71.1011.0717.83
Negative plate before charging65.8515.7818.37
Negative plate after charging83.6706.2510.08
Disclaimer/Publisher’s Note: The statements, opinions and data contained in all publications are solely those of the individual author(s) and contributor(s) and not of MDPI and/or the editor(s). MDPI and/or the editor(s) disclaim responsibility for any injury to people or property resulting from any ideas, methods, instructions or products referred to in the content.

