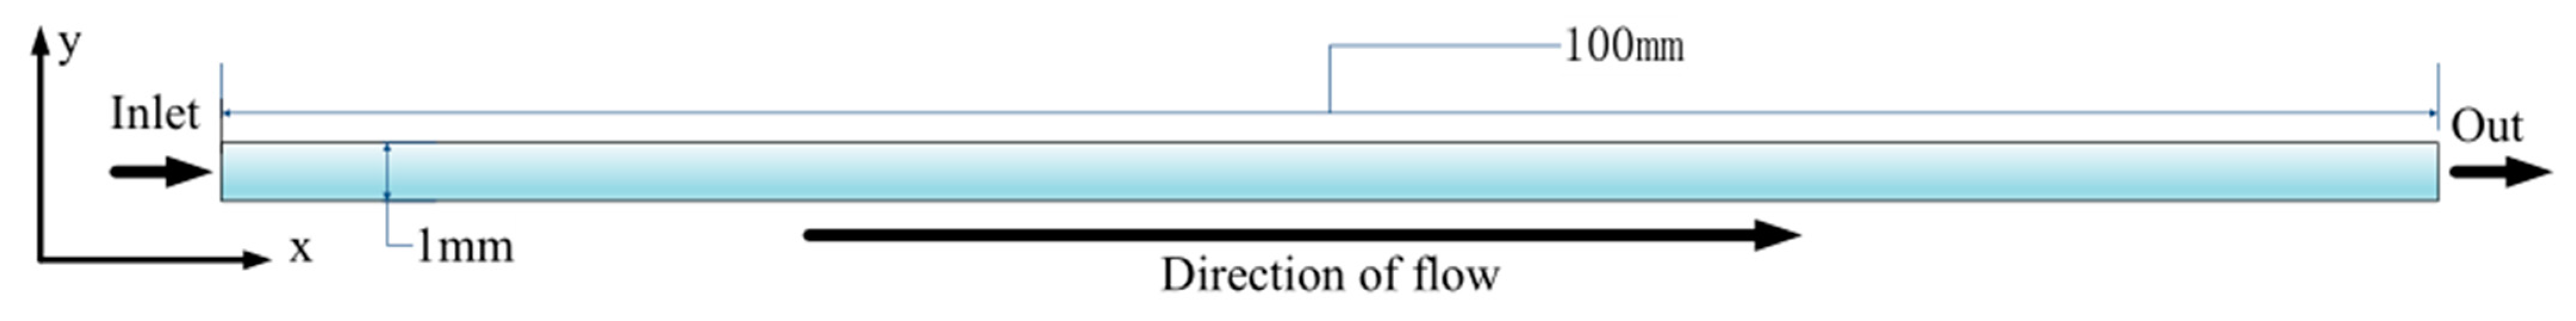
Figure 1.
Geometric model.
Figure 1.
Geometric model.
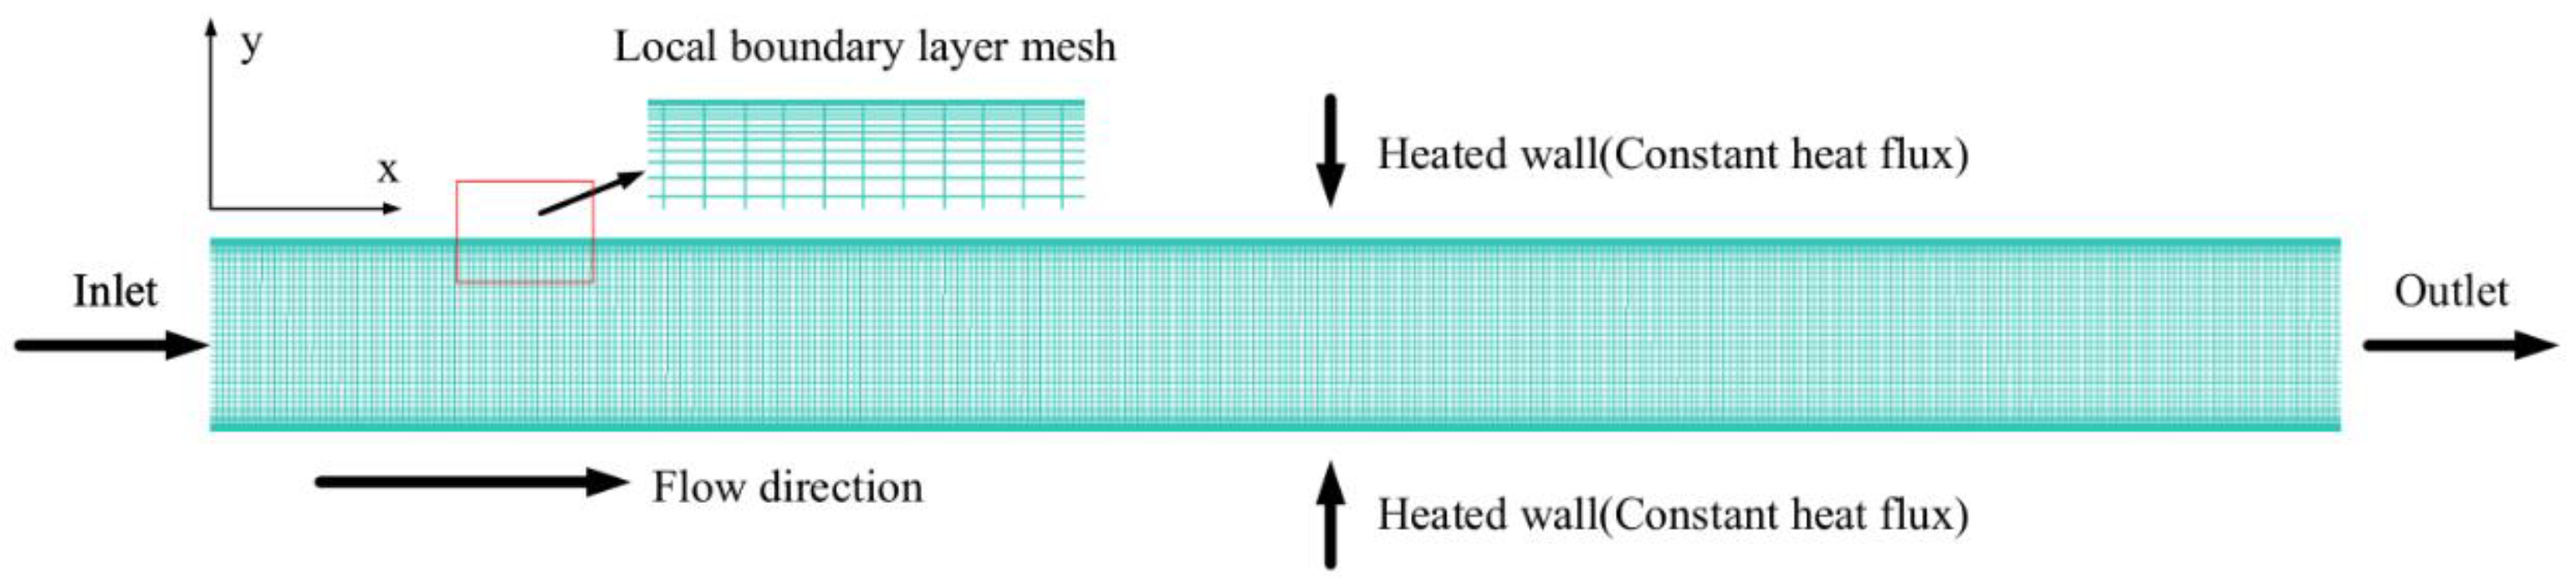
Figure 2.
Grid diagram of computing domain.
Figure 2.
Grid diagram of computing domain.
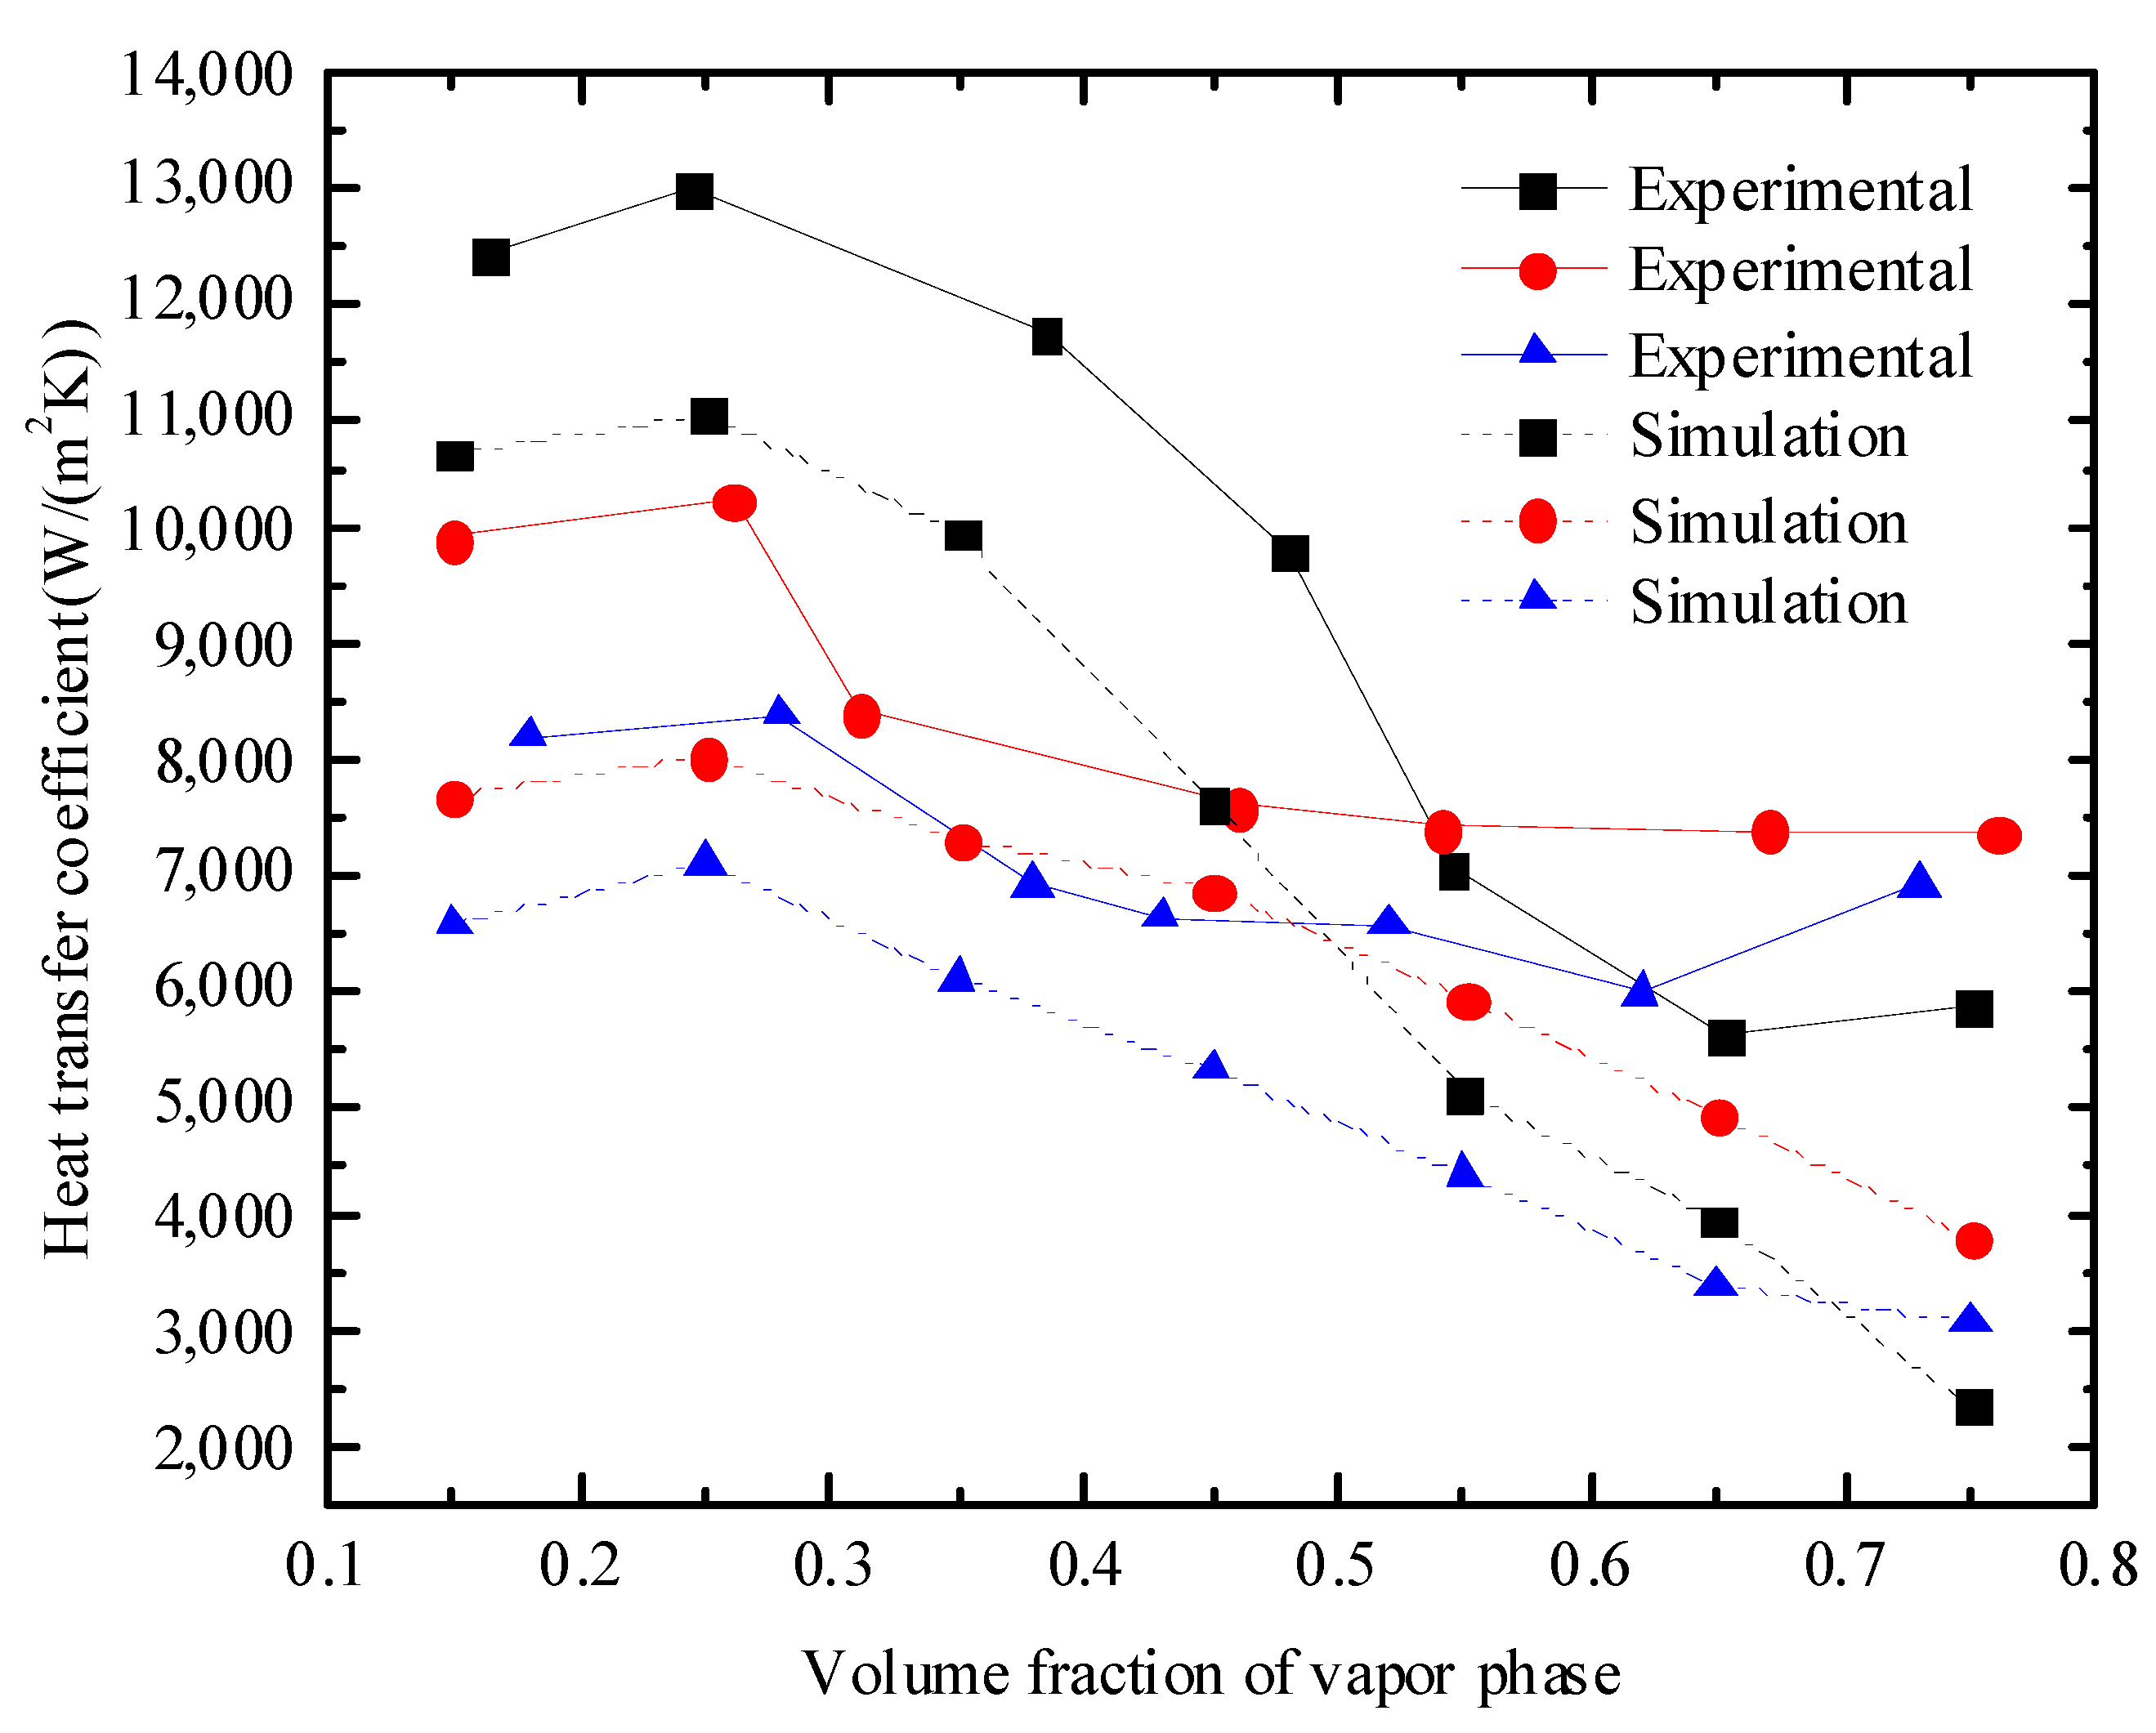
Figure 3.
Change in heat transfer coefficient with dryness (the experimental conditions include D = 6 mm, G = 240 kg/m
2·s, T
sat = 283 K, and q = 10–20 kW/m
2 [
7]).
Figure 3.
Change in heat transfer coefficient with dryness (the experimental conditions include D = 6 mm, G = 240 kg/m
2·s, T
sat = 283 K, and q = 10–20 kW/m
2 [
7]).
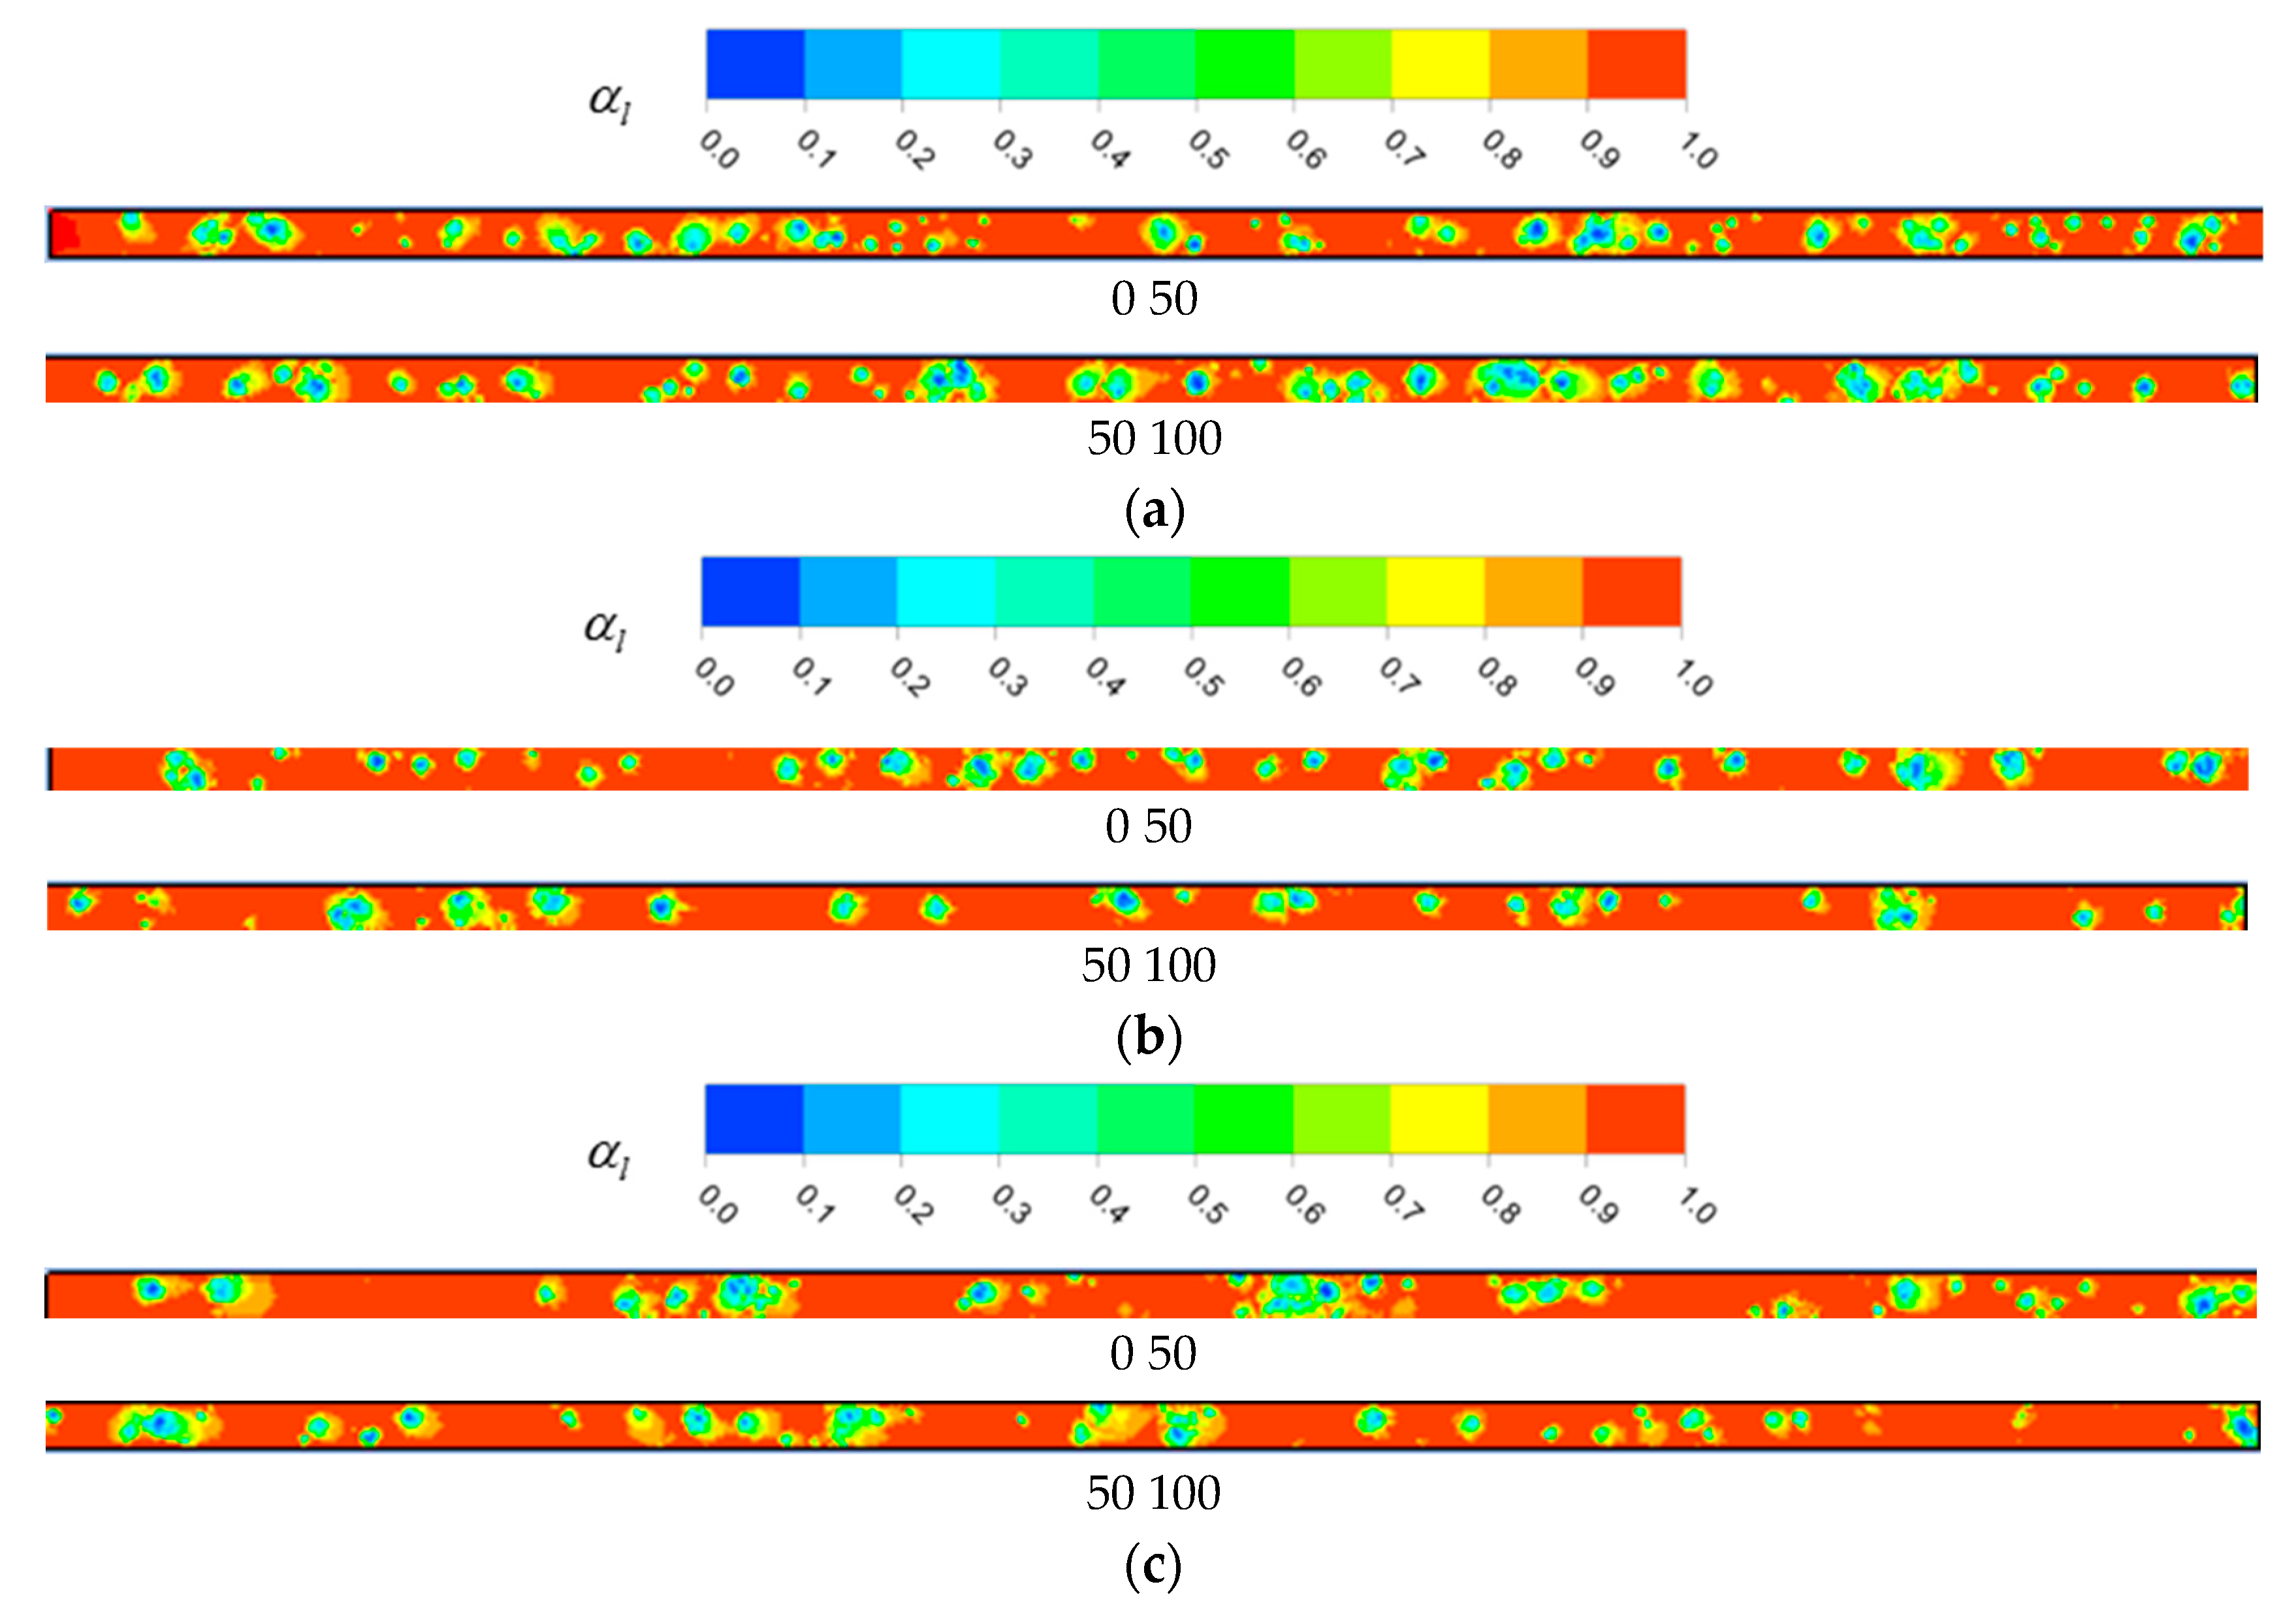
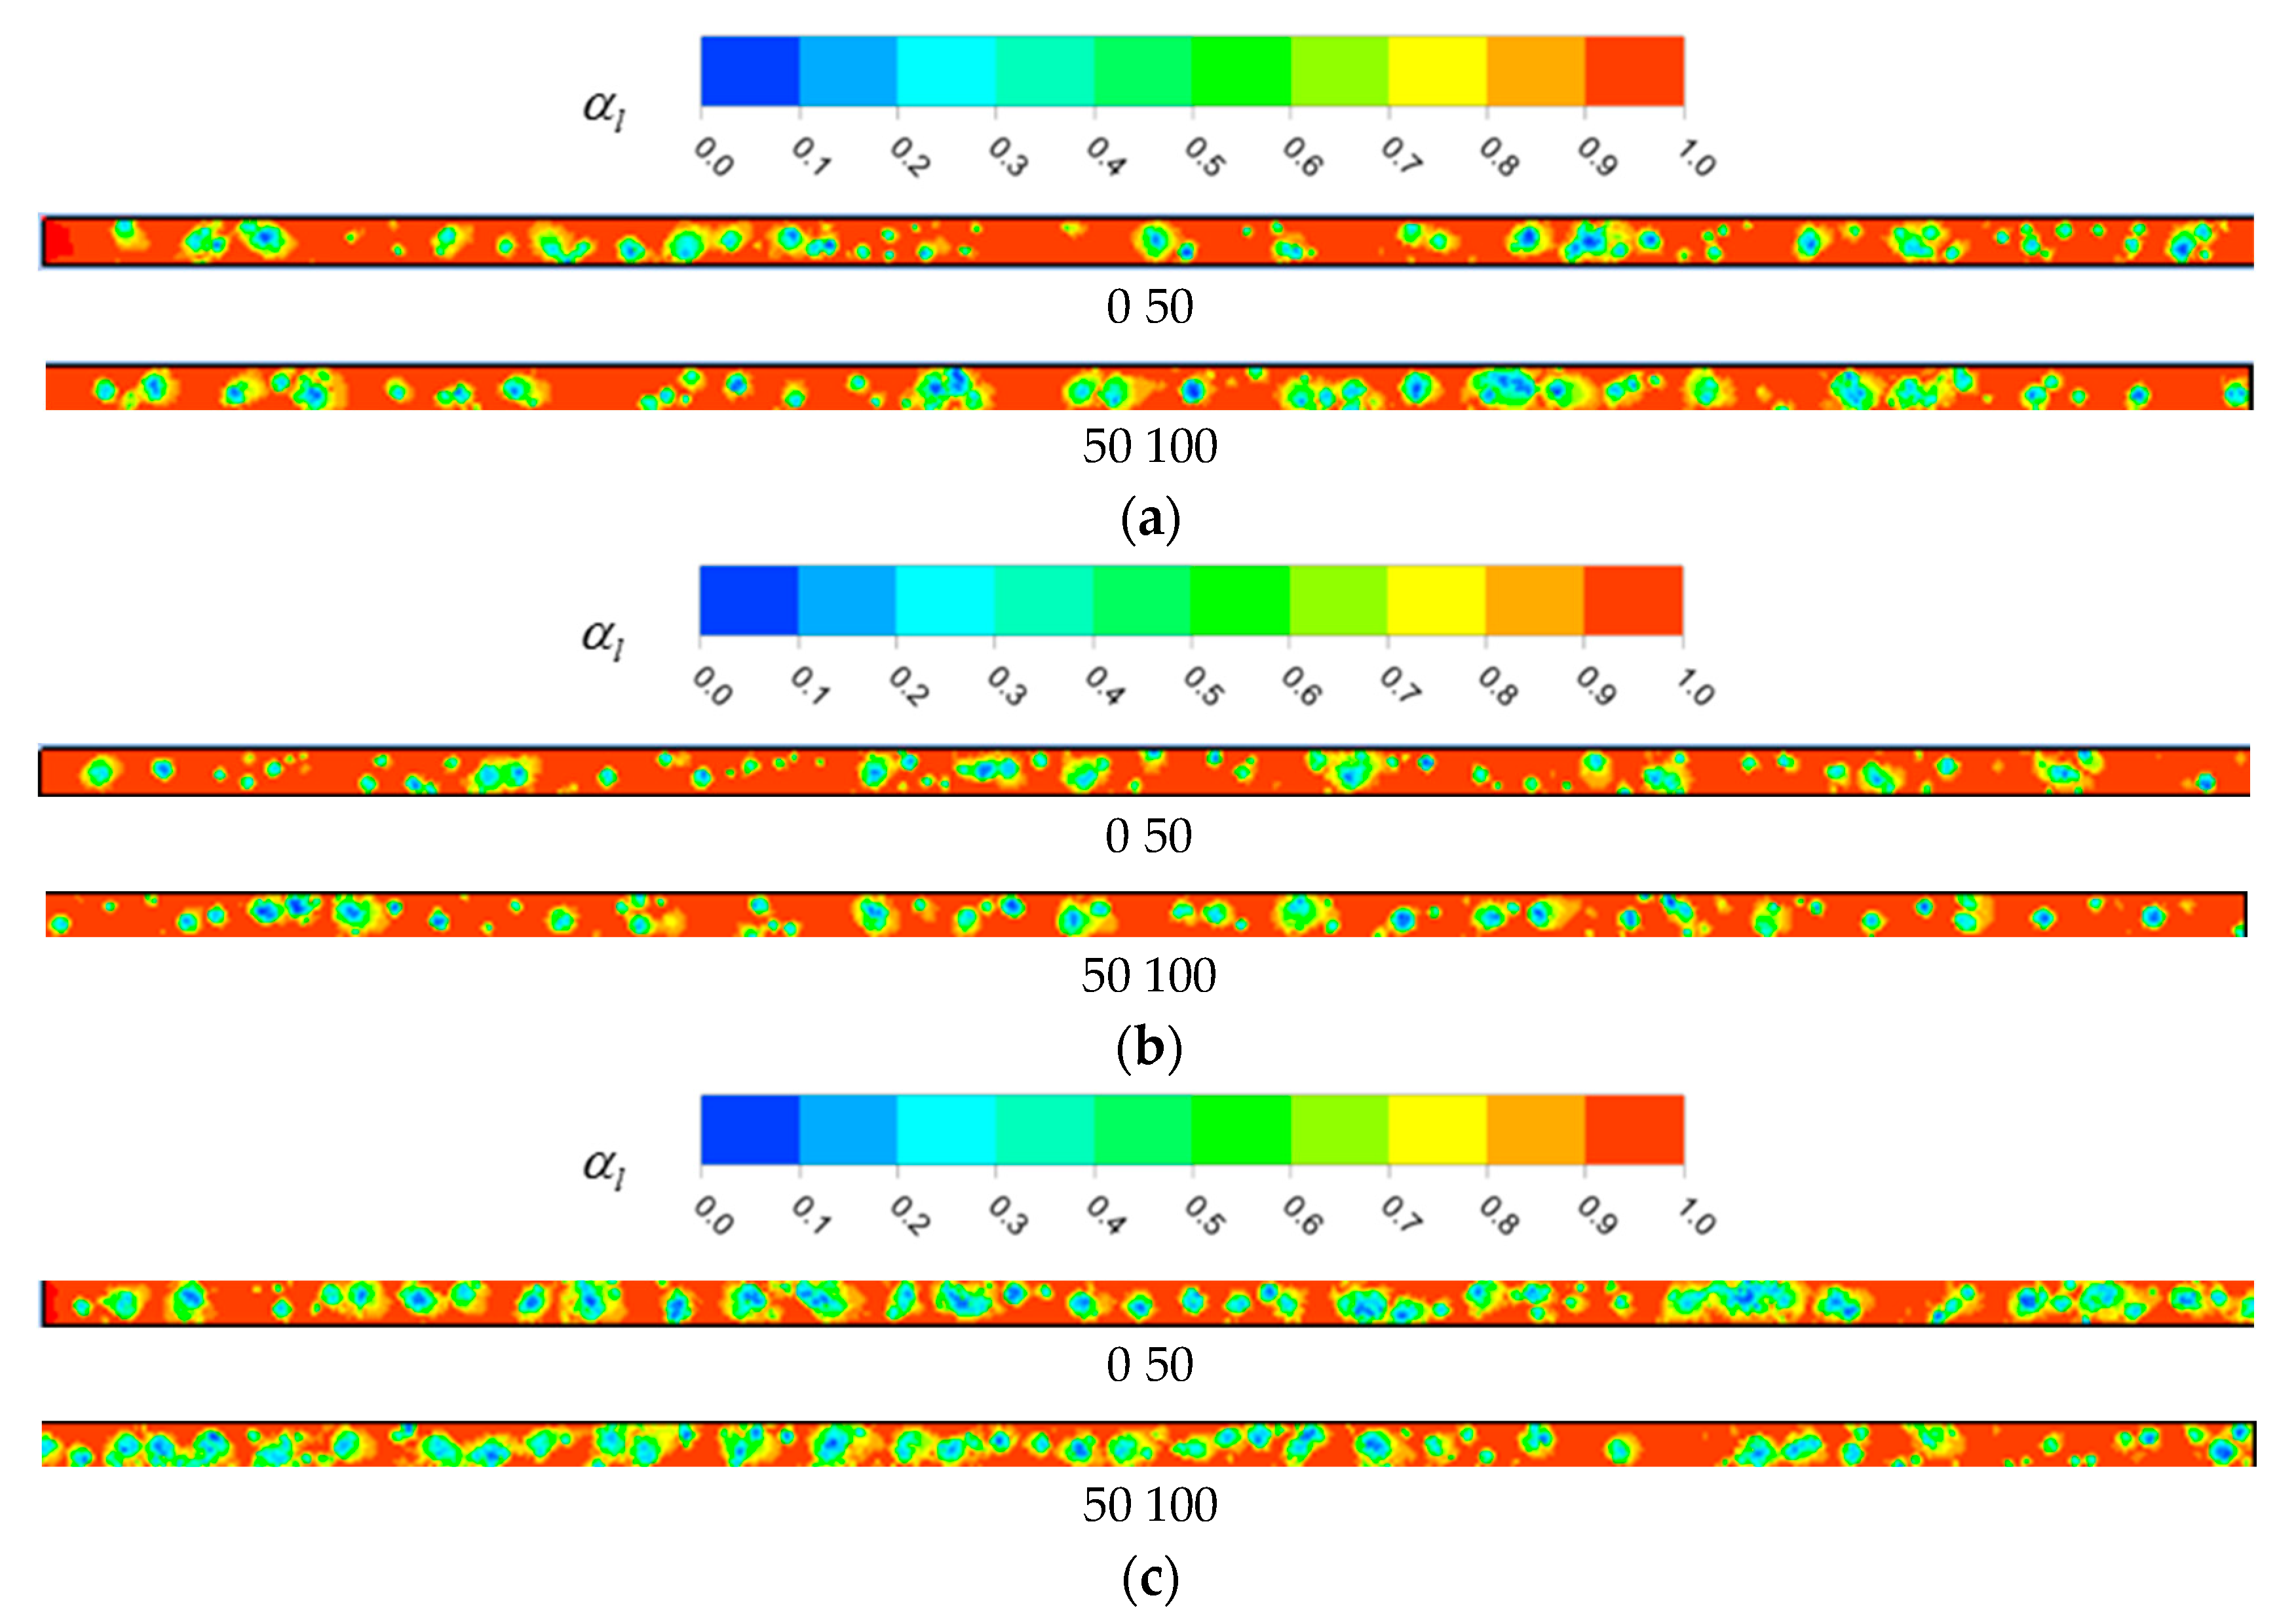
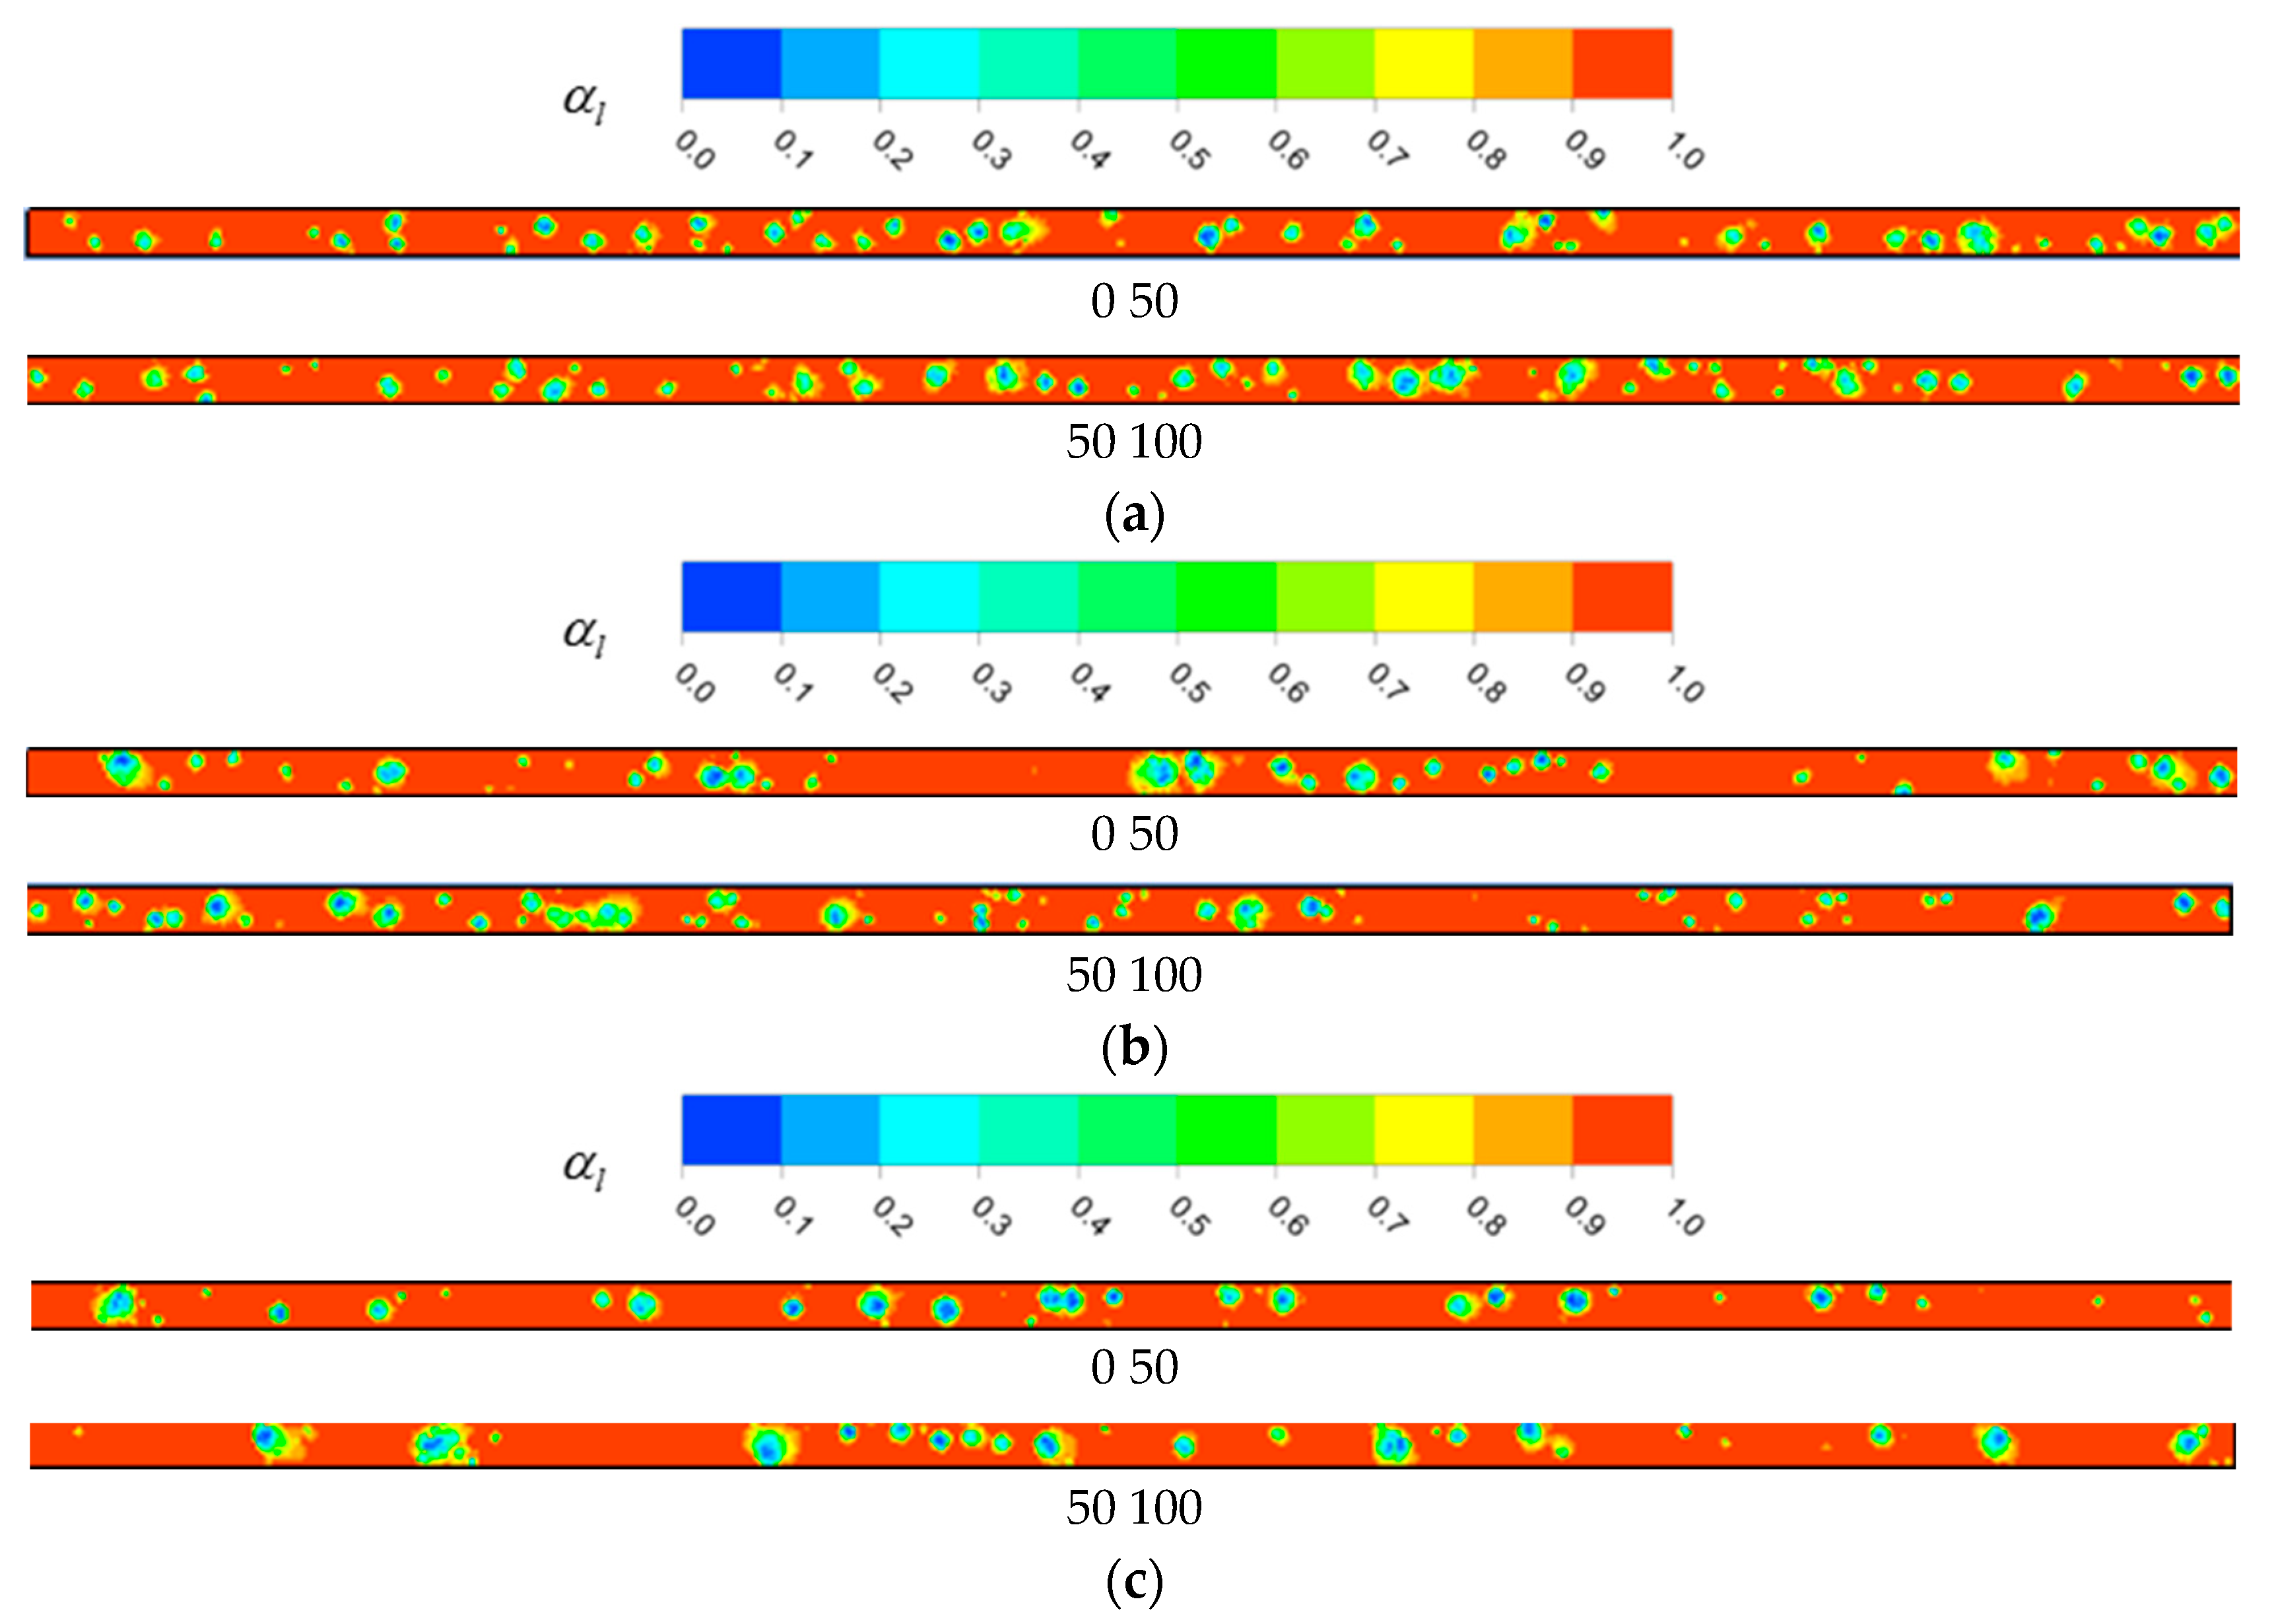
Figure 4.
Volume fraction distribution of R744 liquid phase at different mass fluxes: (a) Tsat = 253 K, G = 50 kg/m2·s, q = 10 kW, X = 0.28; (b) Tsat = 253 K, G = 75 kg/m2·s, q = 10 kW, X = 0.19; (c) Tsat = 253 K, G = 100 kg/m2·s, q = 10 kW, X = 0.14.
Figure 4.
Volume fraction distribution of R744 liquid phase at different mass fluxes: (a) Tsat = 253 K, G = 50 kg/m2·s, q = 10 kW, X = 0.28; (b) Tsat = 253 K, G = 75 kg/m2·s, q = 10 kW, X = 0.19; (c) Tsat = 253 K, G = 100 kg/m2·s, q = 10 kW, X = 0.14.
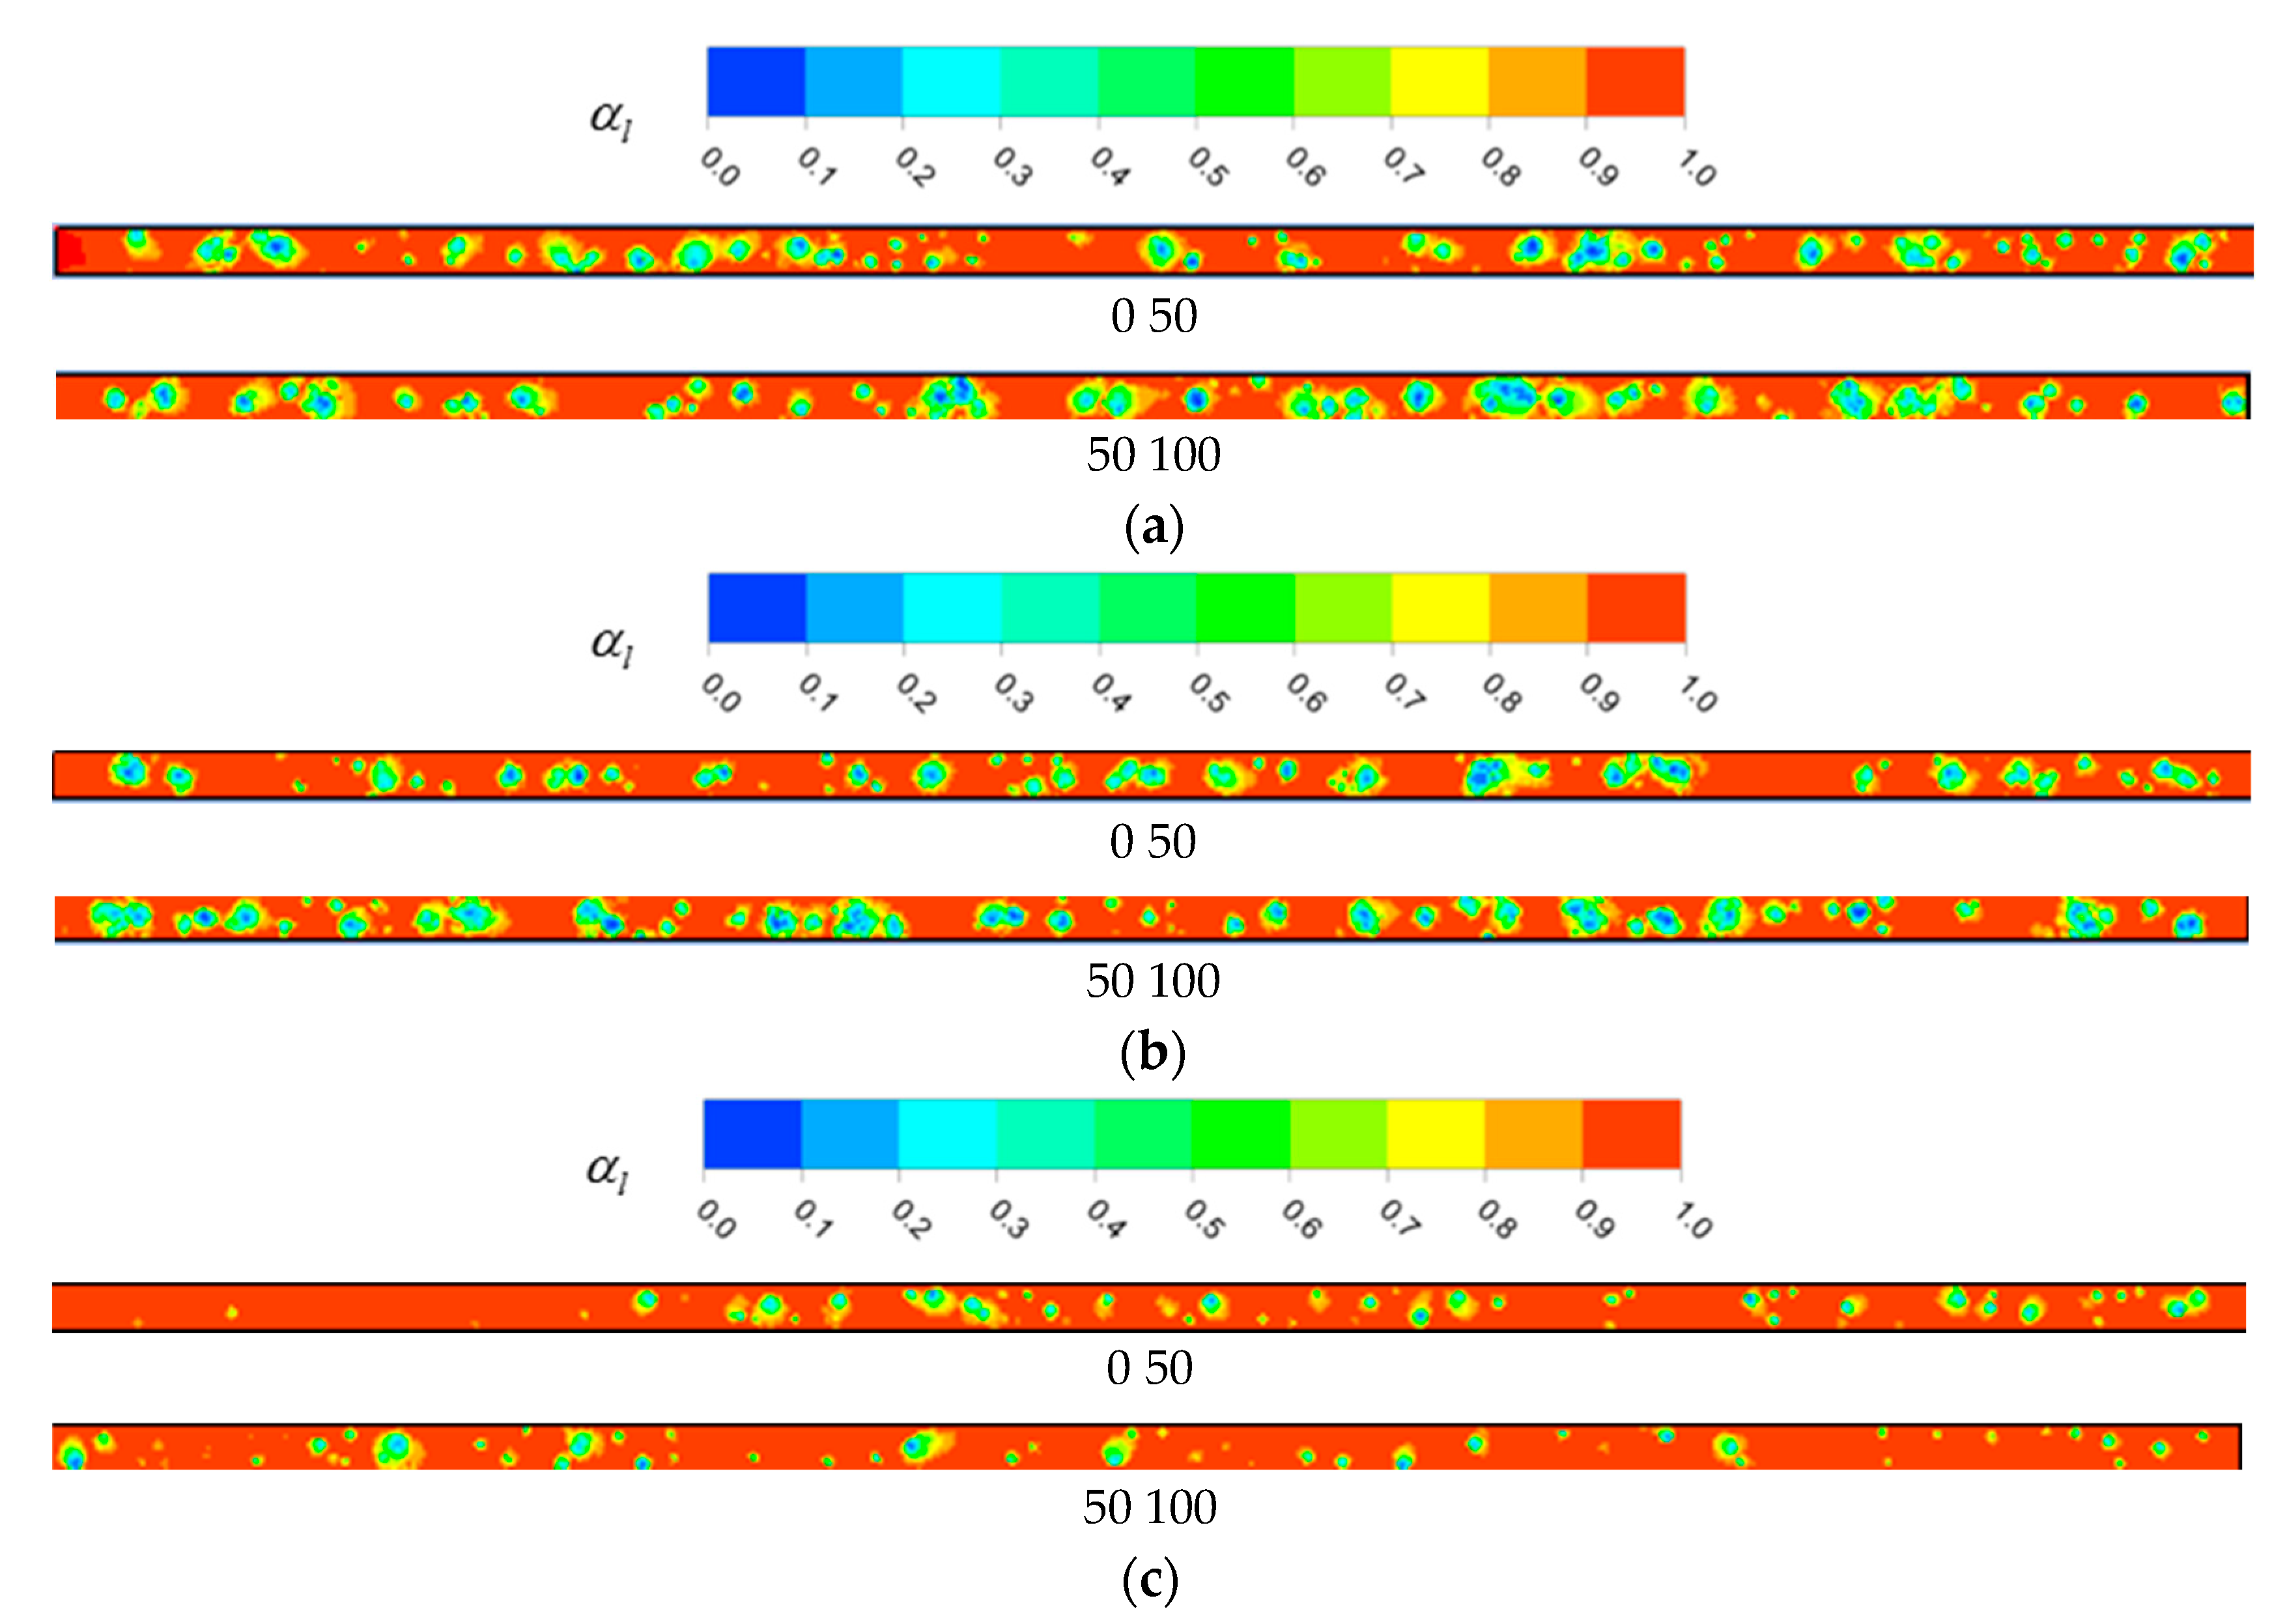
Figure 5.
Volume fraction distribution of R744 liquid phase at different heat fluxes: (a) Tsat = 253 K, G = 50 kg/m2·s, q = 10 kW, X = 0.28; (b) Tsat = 253 K, G = 50 kg/m2·s, q = 20 kW, X = 0.56; (c) Tsat = 253 K, G = 50 kg/m2·s, q = 30 kW, X = 0.84.
Figure 5.
Volume fraction distribution of R744 liquid phase at different heat fluxes: (a) Tsat = 253 K, G = 50 kg/m2·s, q = 10 kW, X = 0.28; (b) Tsat = 253 K, G = 50 kg/m2·s, q = 20 kW, X = 0.56; (c) Tsat = 253 K, G = 50 kg/m2·s, q = 30 kW, X = 0.84.
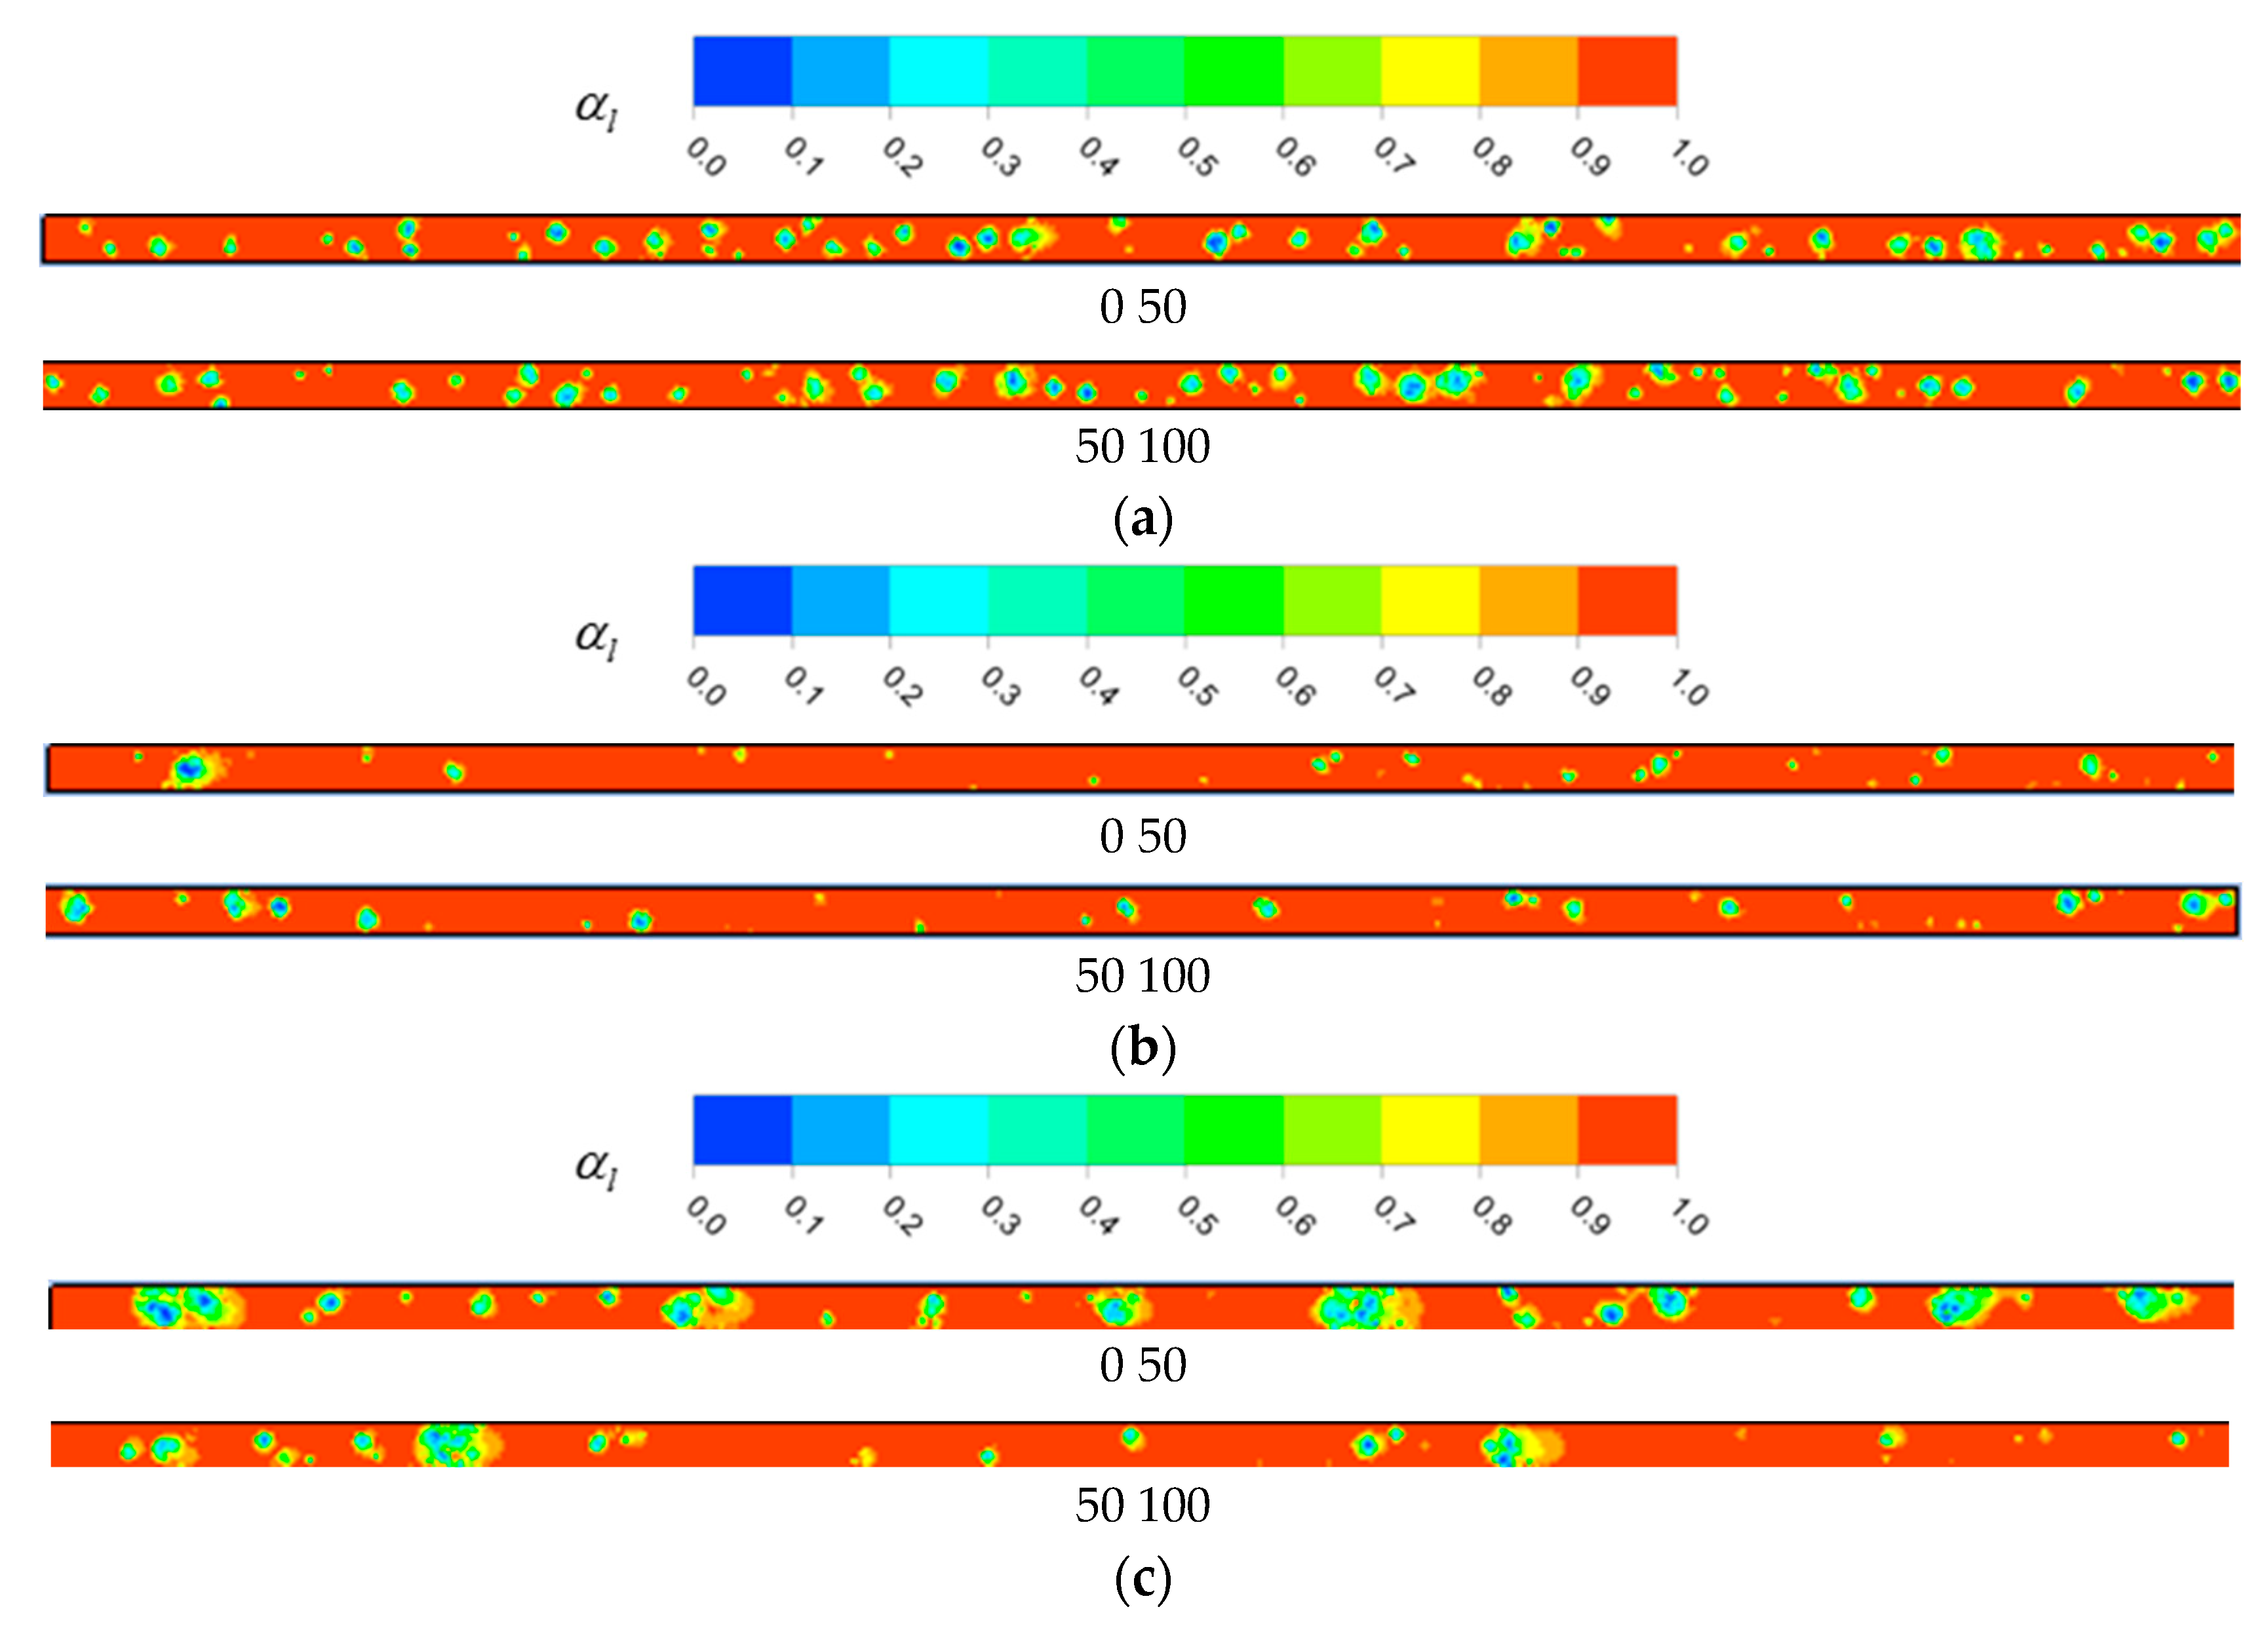
Figure 6.
Volume fraction distribution of R744 liquid phase at different Tsat values: (a) Tsat = 253 K, G = 50 kg/m2·s, q = 10 kW, X = 0.28; (b) Tsat = 263 K, G = 50 kg/m2·s, q = 10 kW, X = 0.31; (c) Tsat = 273 K, G = 50 kg/m2·s, q = 10 kW, X = 0.35.
Figure 6.
Volume fraction distribution of R744 liquid phase at different Tsat values: (a) Tsat = 253 K, G = 50 kg/m2·s, q = 10 kW, X = 0.28; (b) Tsat = 263 K, G = 50 kg/m2·s, q = 10 kW, X = 0.31; (c) Tsat = 273 K, G = 50 kg/m2·s, q = 10 kW, X = 0.35.
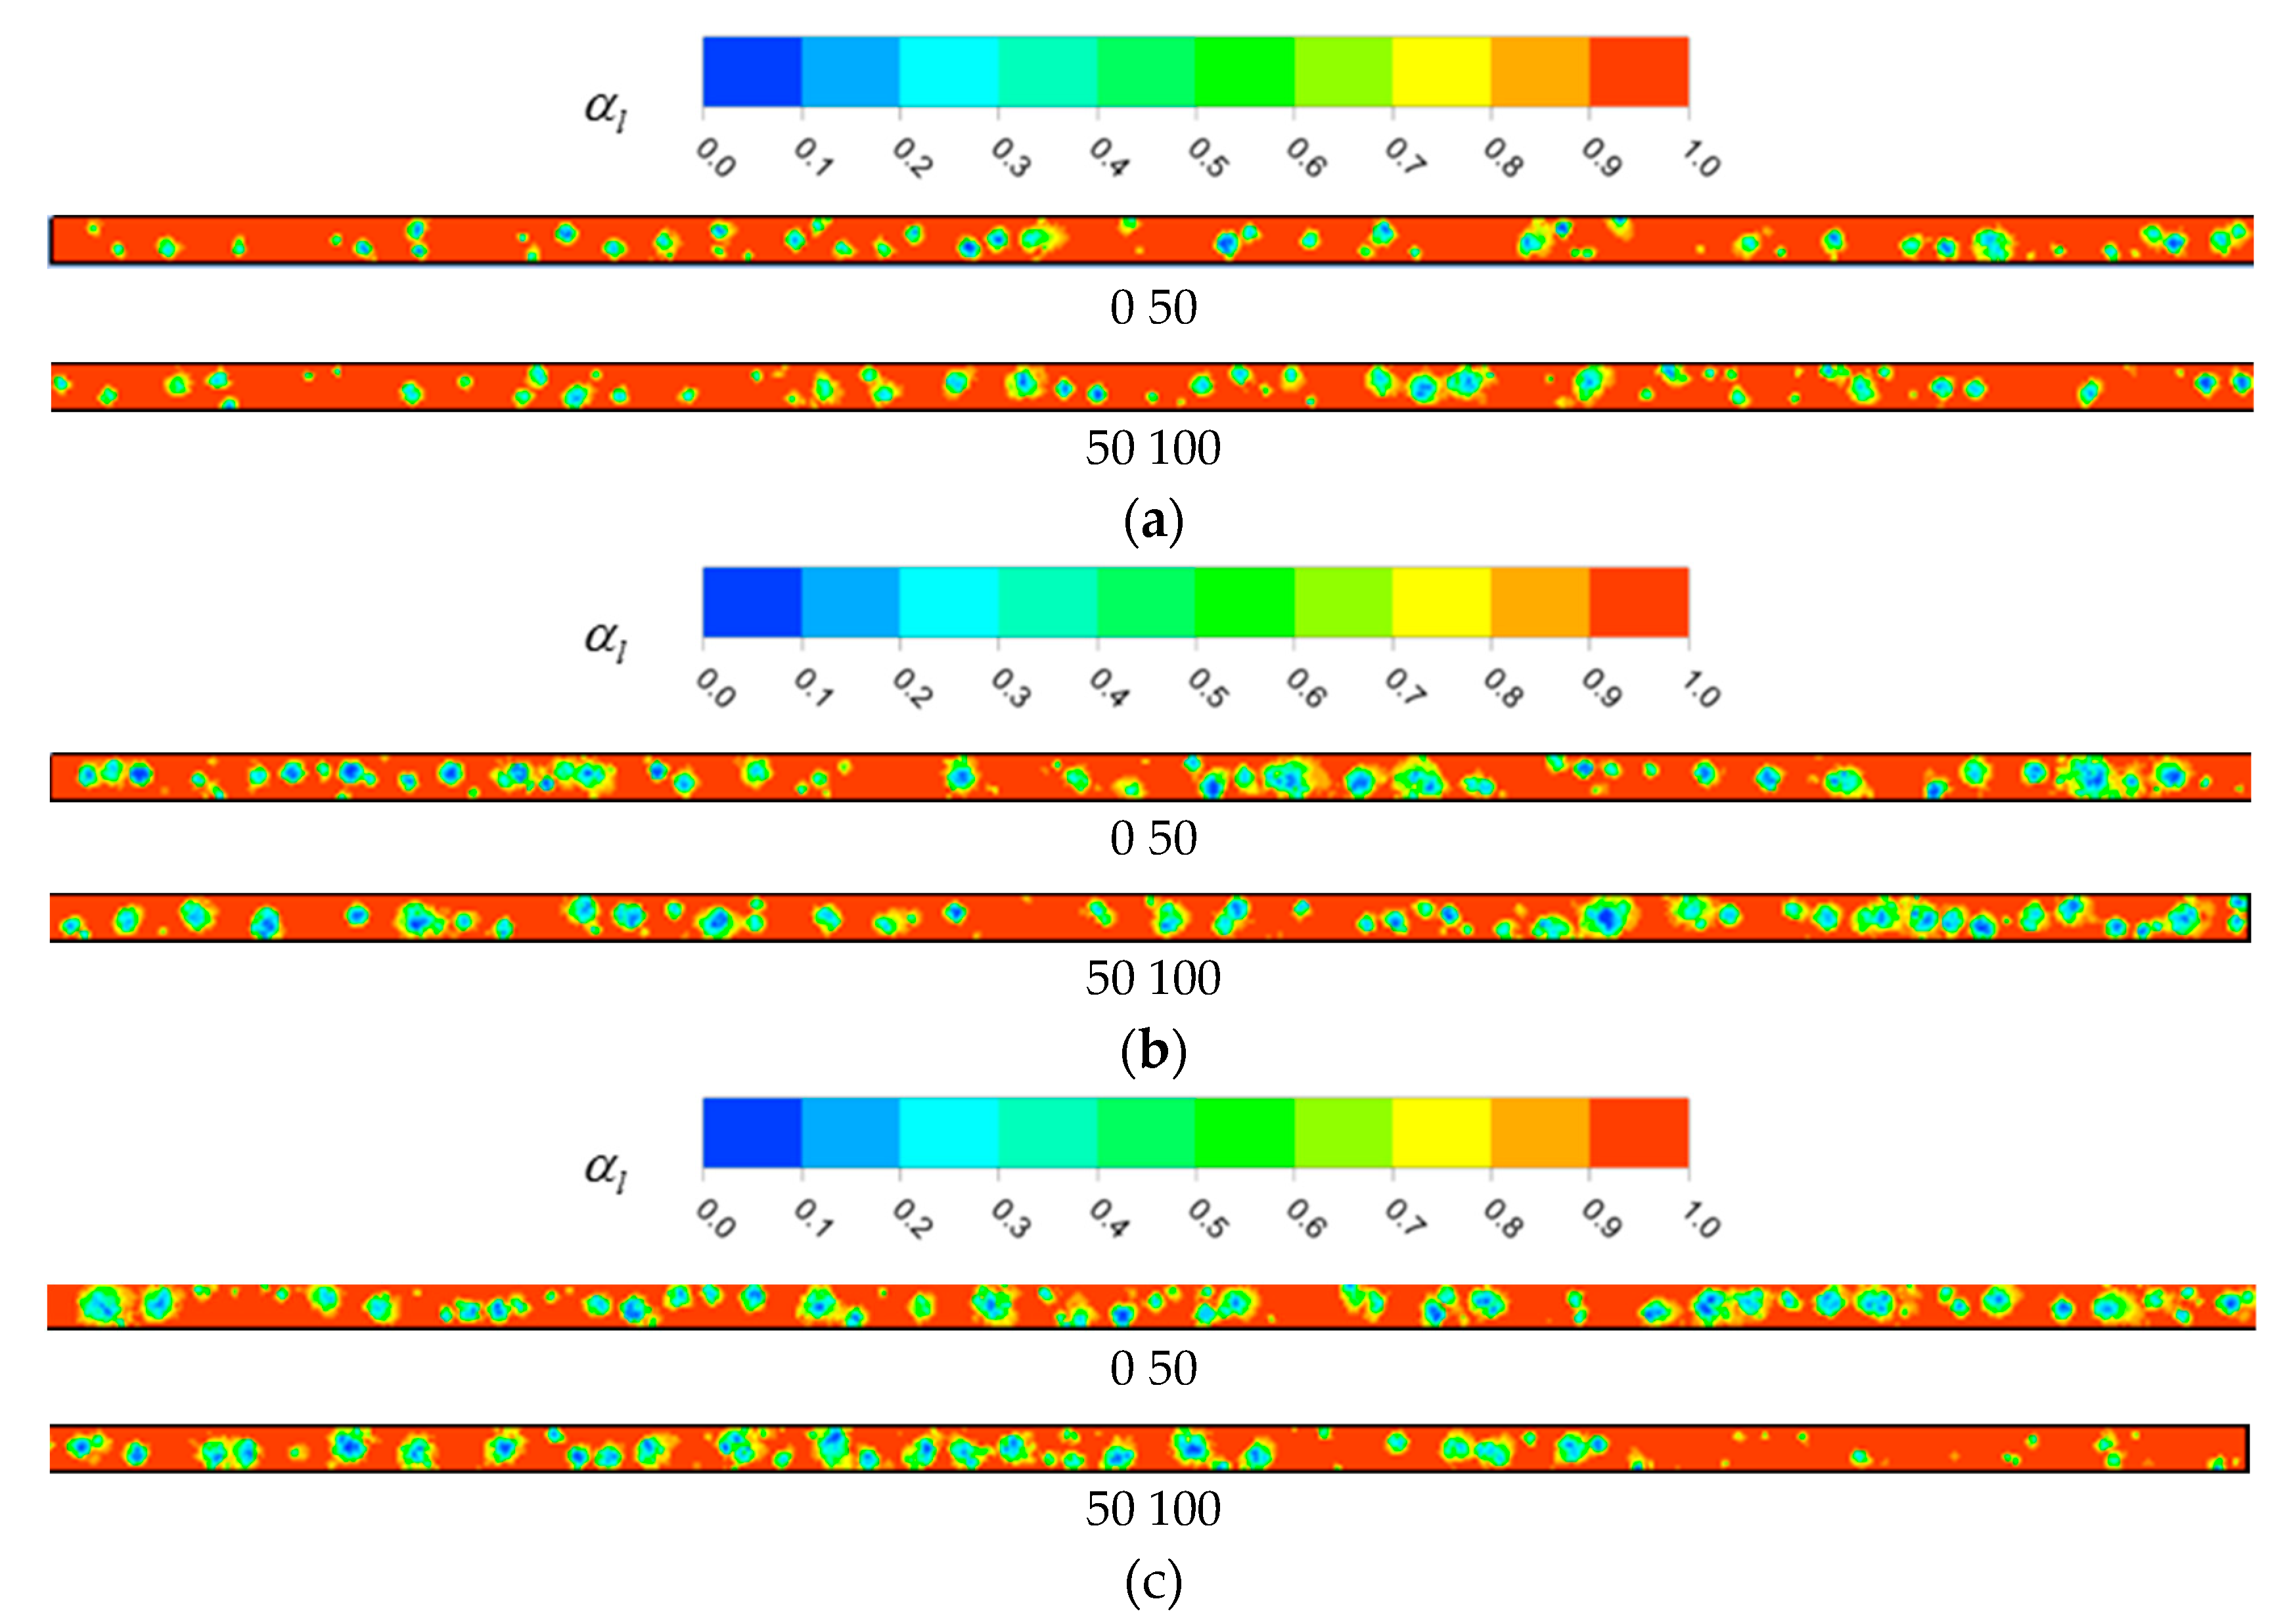
Figure 7.
Volume fraction distribution of az-refrigerant liquid phase at different mass fluxes: (a) Tsat = 253 K, G = 50 kg/m2·s, q = 10 kW, X = 0.26; (b) Tsat = 253 K, G = 75 kg/m2·s, q = 10 kW, X = 0.18; (c) Tsat = 253 K, G = 100 kg/m2·s, q = 10 kW, X = 0.13.
Figure 7.
Volume fraction distribution of az-refrigerant liquid phase at different mass fluxes: (a) Tsat = 253 K, G = 50 kg/m2·s, q = 10 kW, X = 0.26; (b) Tsat = 253 K, G = 75 kg/m2·s, q = 10 kW, X = 0.18; (c) Tsat = 253 K, G = 100 kg/m2·s, q = 10 kW, X = 0.13.
Figure 8.
Volume fraction distribution of az-refrigerant liquid phase at different heat fluxes: (a) Tsat = 253 K, G = 50 kg/m2·s, q = 10 kW, X = 0.26; (b) Tsat = 253 K, G = 50 kg/m2·s, q = 20 kW, X = 0.52; (c) Tsat = 253 K, G = 50 kg/m2·s, q = 30 kW, X = 0.78.
Figure 8.
Volume fraction distribution of az-refrigerant liquid phase at different heat fluxes: (a) Tsat = 253 K, G = 50 kg/m2·s, q = 10 kW, X = 0.26; (b) Tsat = 253 K, G = 50 kg/m2·s, q = 20 kW, X = 0.52; (c) Tsat = 253 K, G = 50 kg/m2·s, q = 30 kW, X = 0.78.
Figure 9.
Volume fraction distribution of az-refrigerant liquid phase at different Tsat values: (a) Tsat = 253 K, G = 50 kg/m2·s, q = 10 kW, X = 0.26; (b) Tsat = 263 K, G = 50 kg/m2·s, q = 10 kW, X = 0.29; (c) Tsat = 273 K, G = 50 kg/m2·s, q = 10 kW, X = 0.32.
Figure 9.
Volume fraction distribution of az-refrigerant liquid phase at different Tsat values: (a) Tsat = 253 K, G = 50 kg/m2·s, q = 10 kW, X = 0.26; (b) Tsat = 263 K, G = 50 kg/m2·s, q = 10 kW, X = 0.29; (c) Tsat = 273 K, G = 50 kg/m2·s, q = 10 kW, X = 0.32.
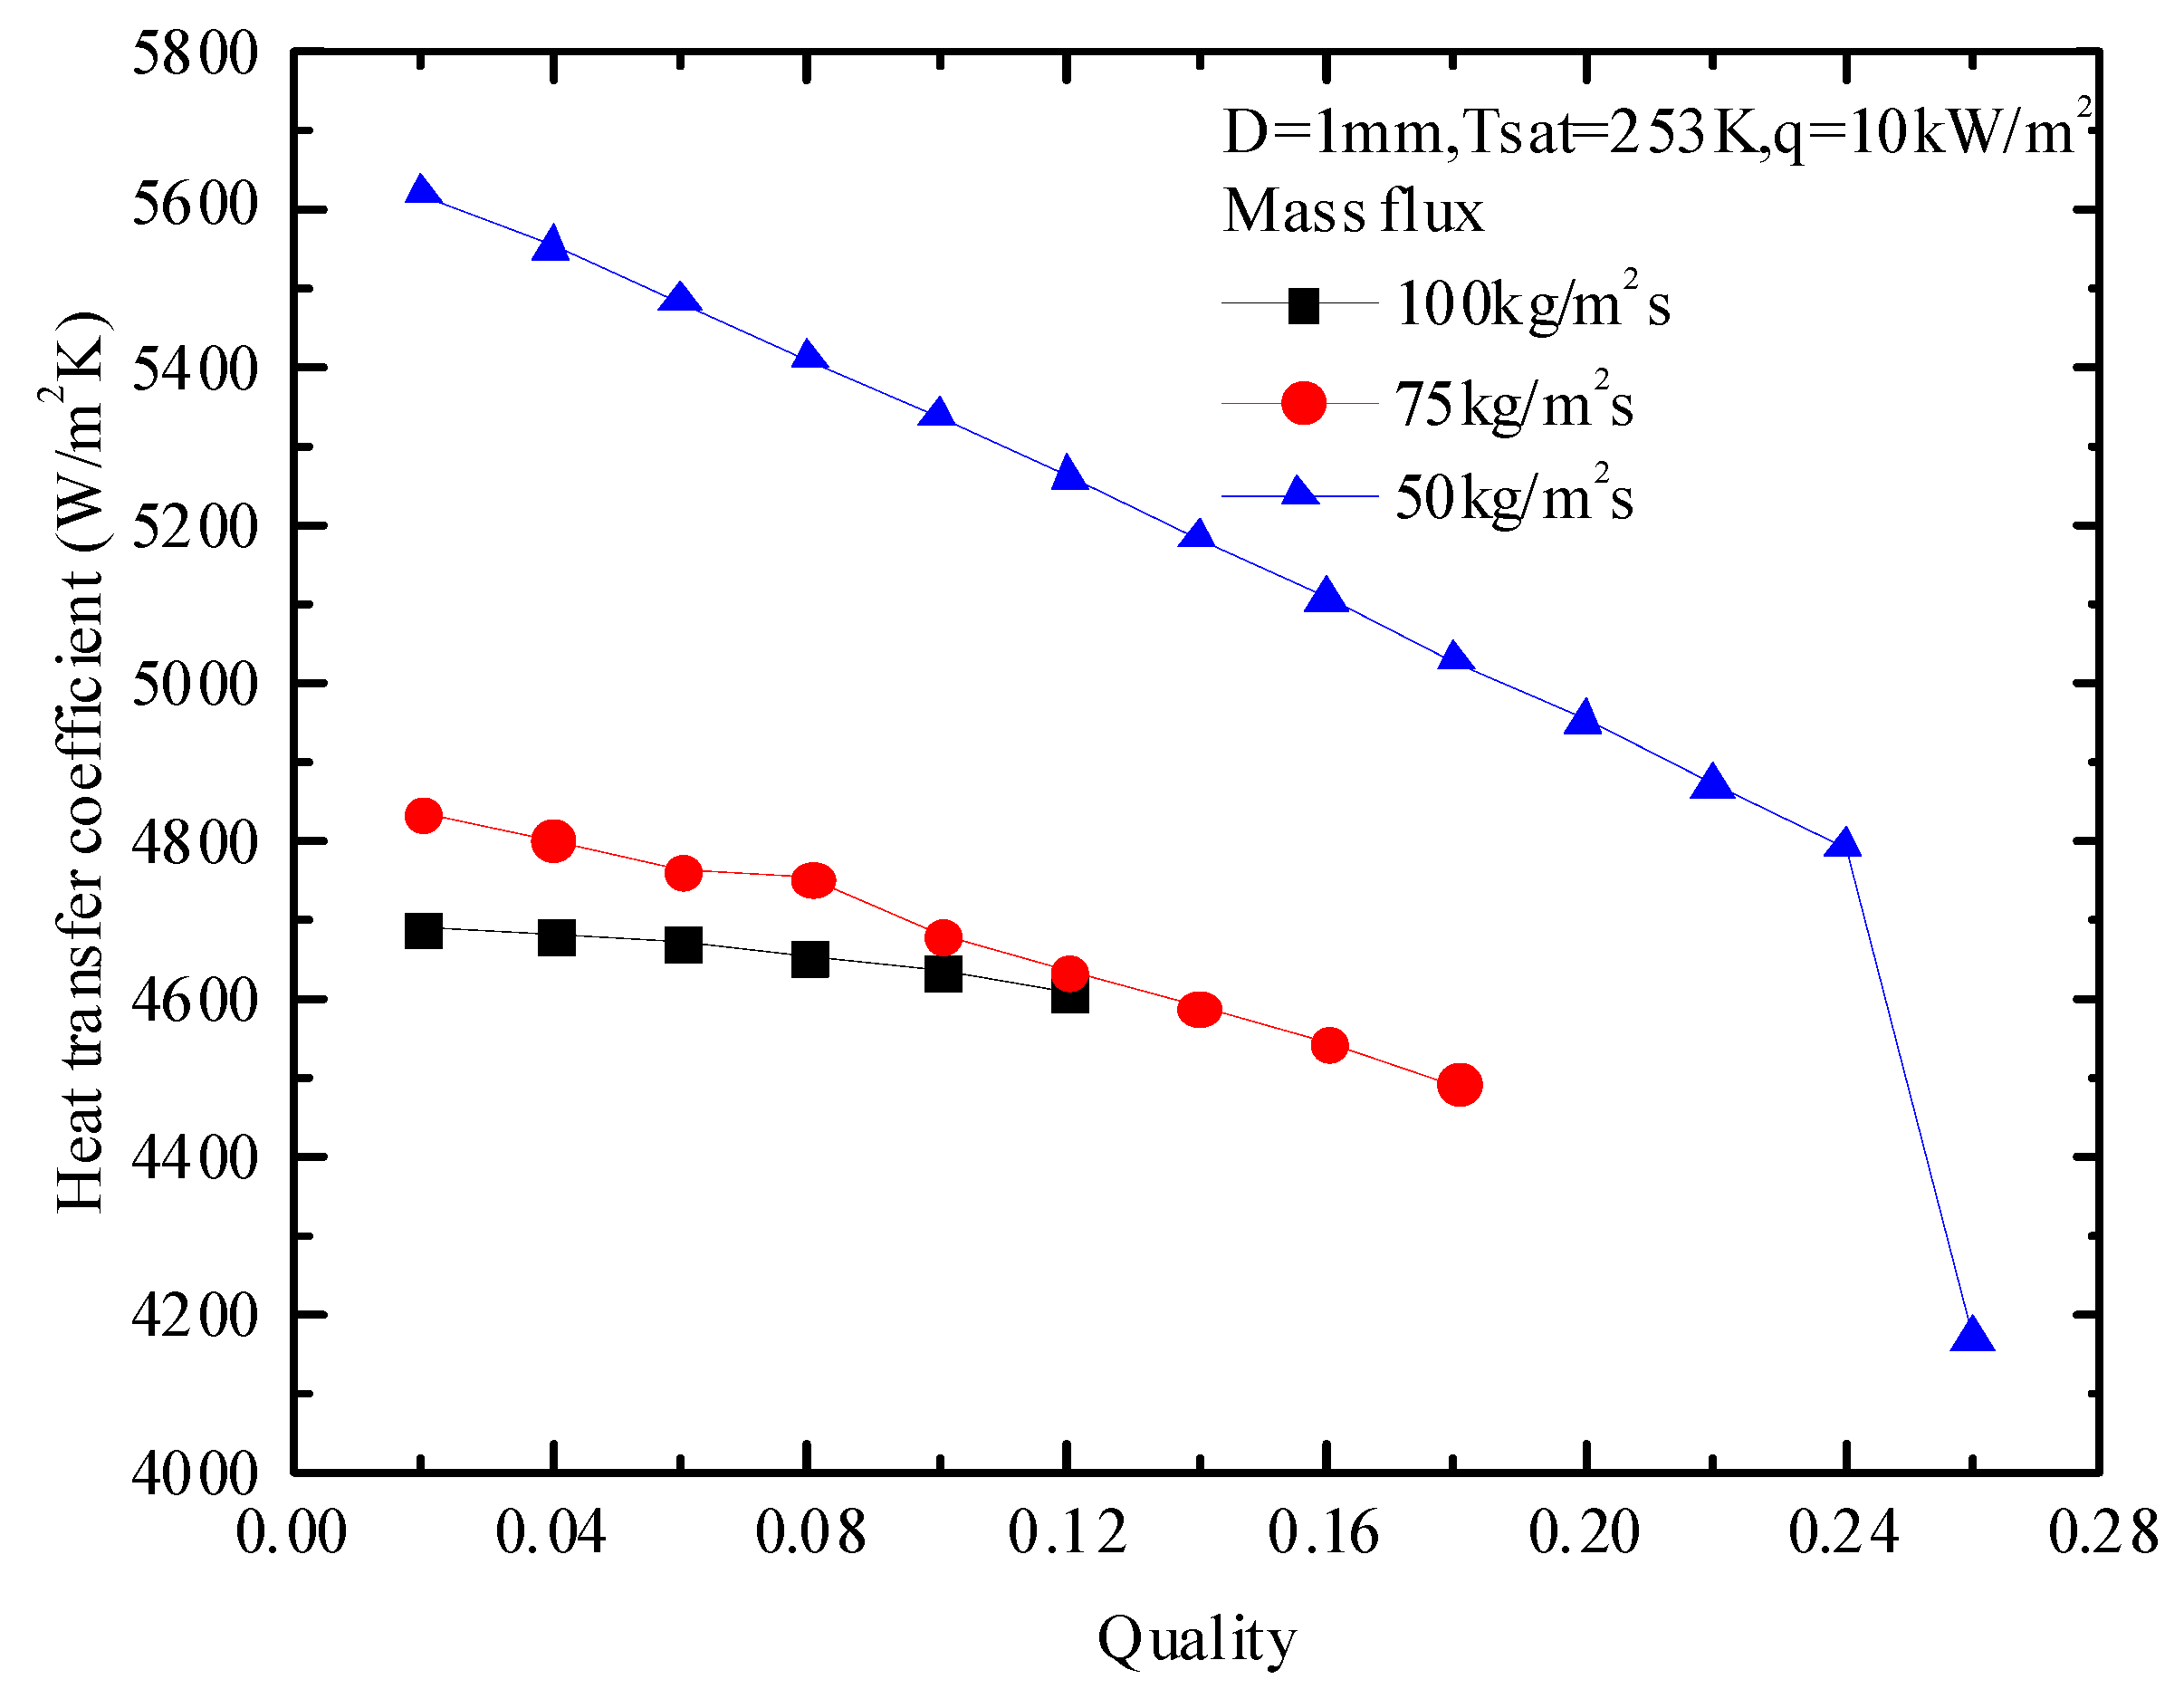
Figure 10.
Effect of mass flux on heat transfer coefficient of R744.
Figure 10.
Effect of mass flux on heat transfer coefficient of R744.
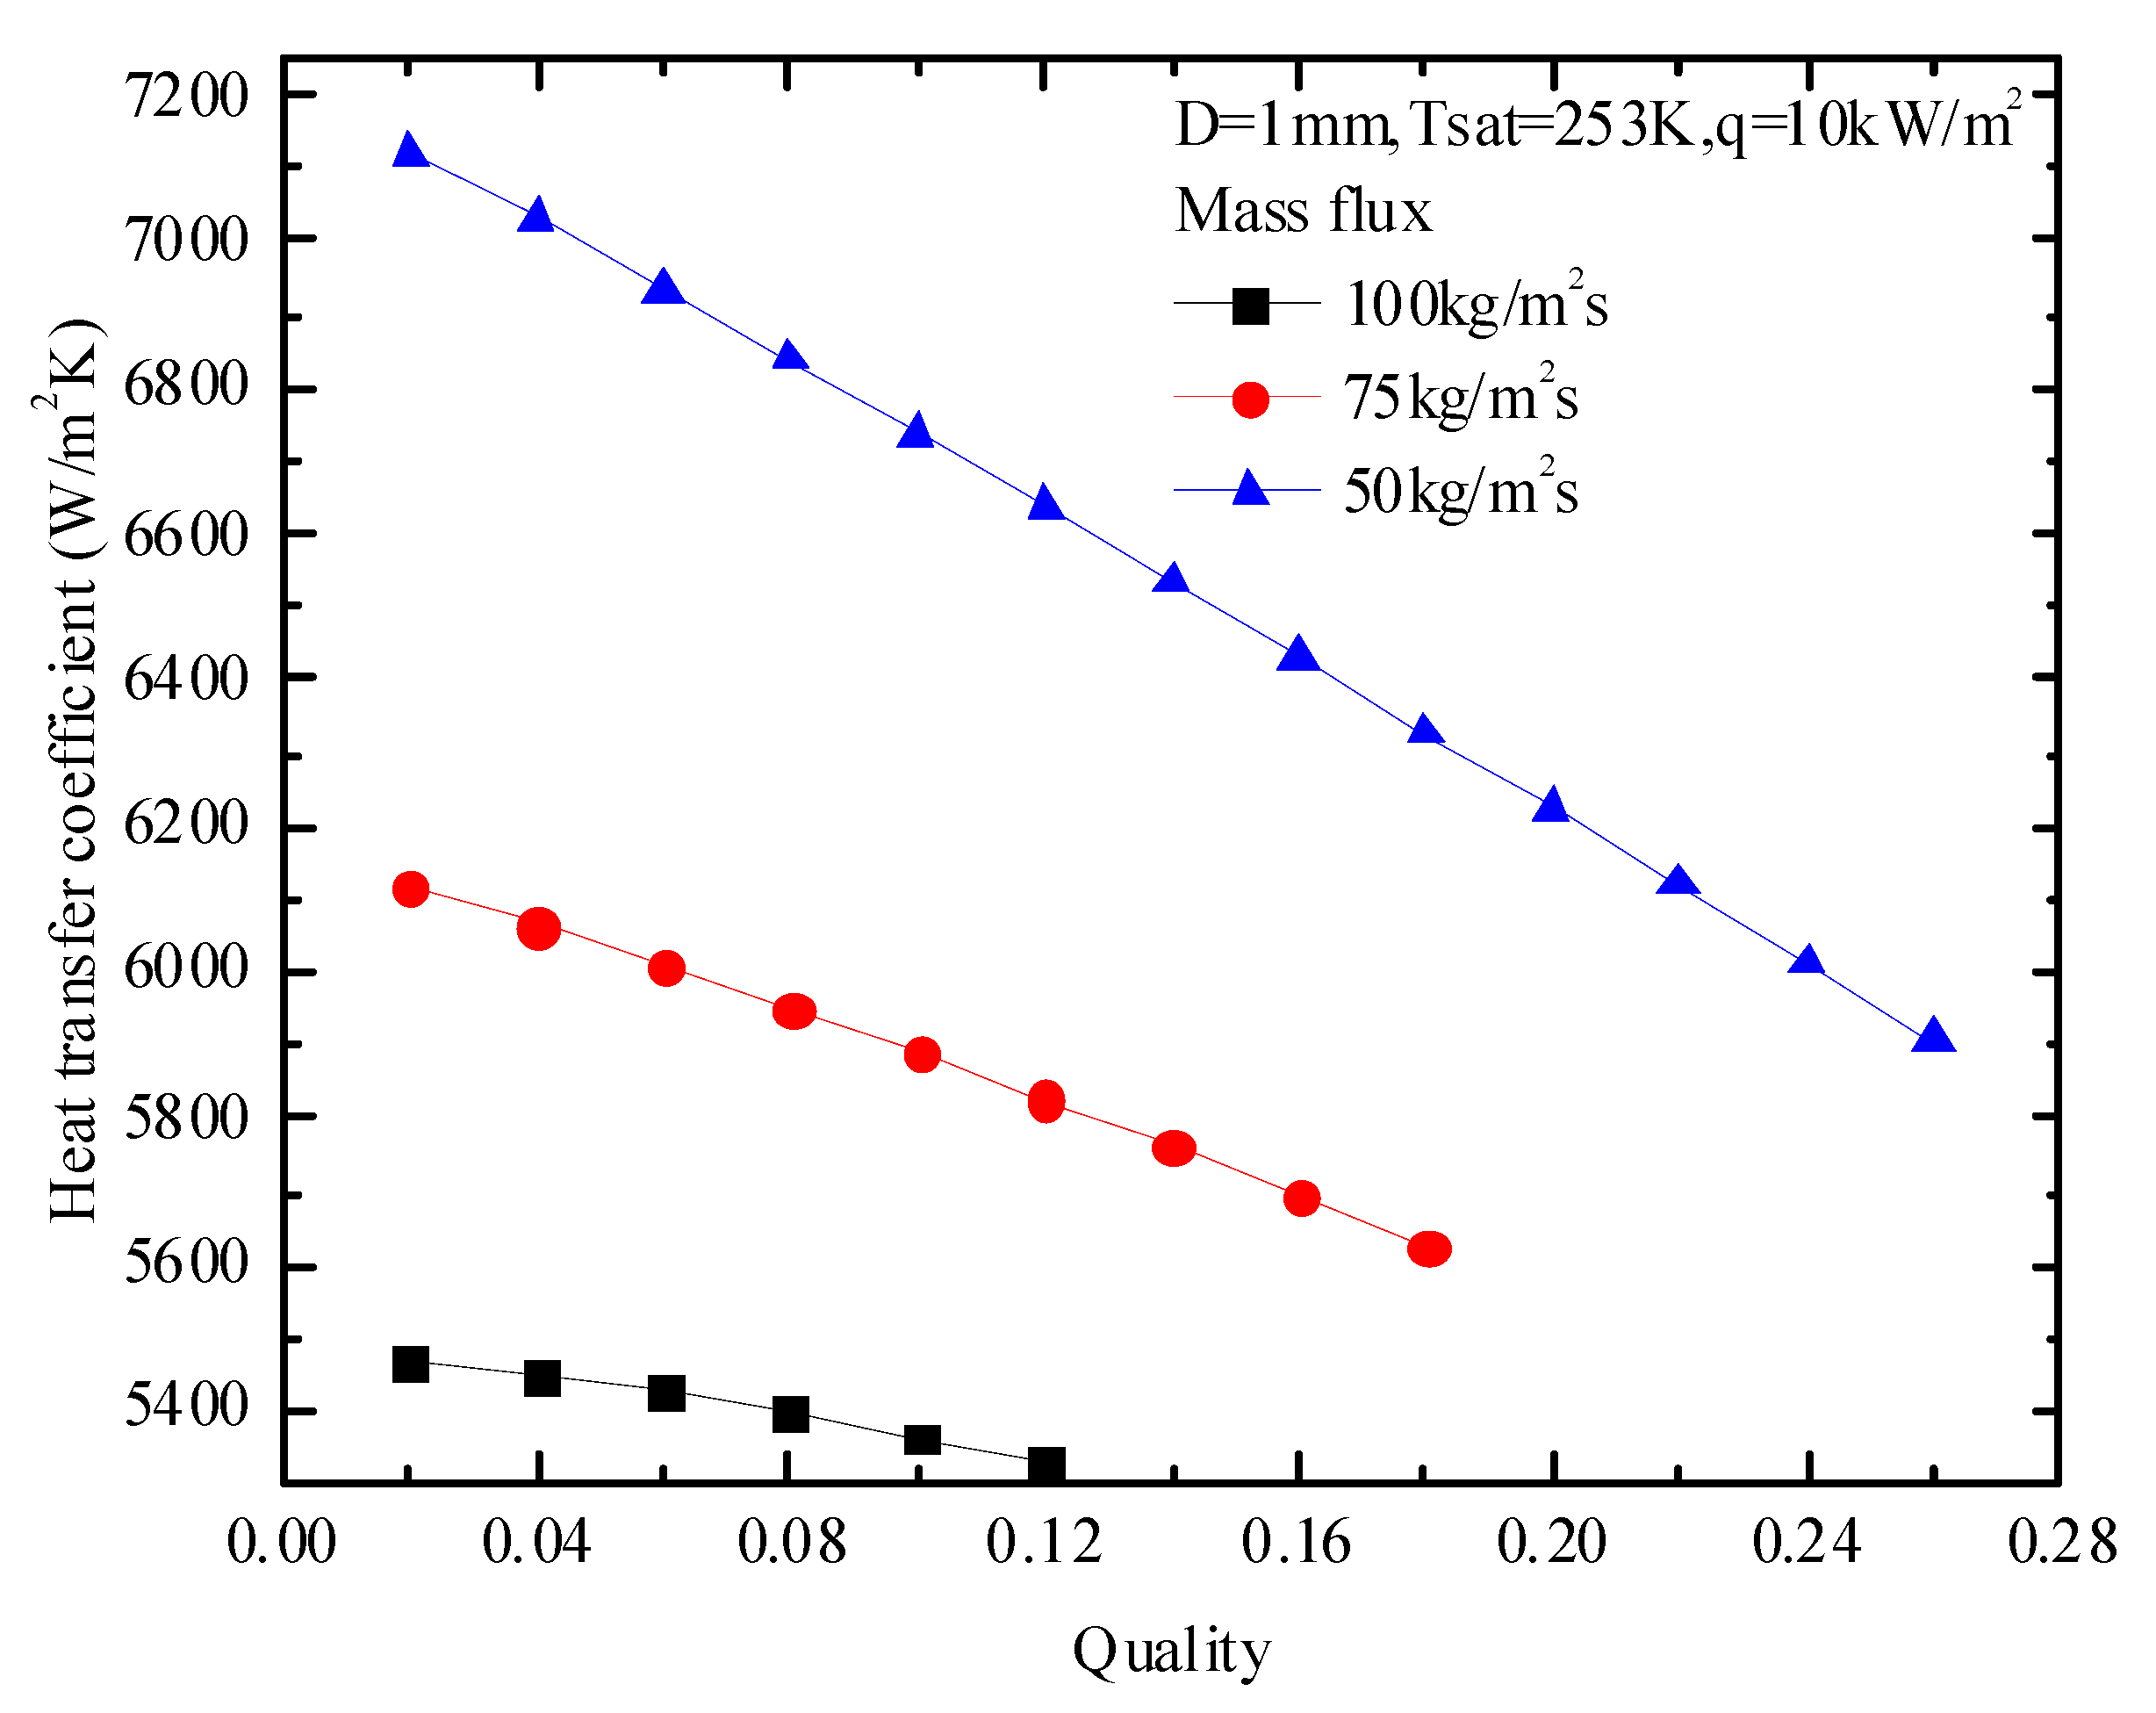
Figure 11.
Effect of mass flux on heat transfer coefficient of azeotropic refrigerant.
Figure 11.
Effect of mass flux on heat transfer coefficient of azeotropic refrigerant.
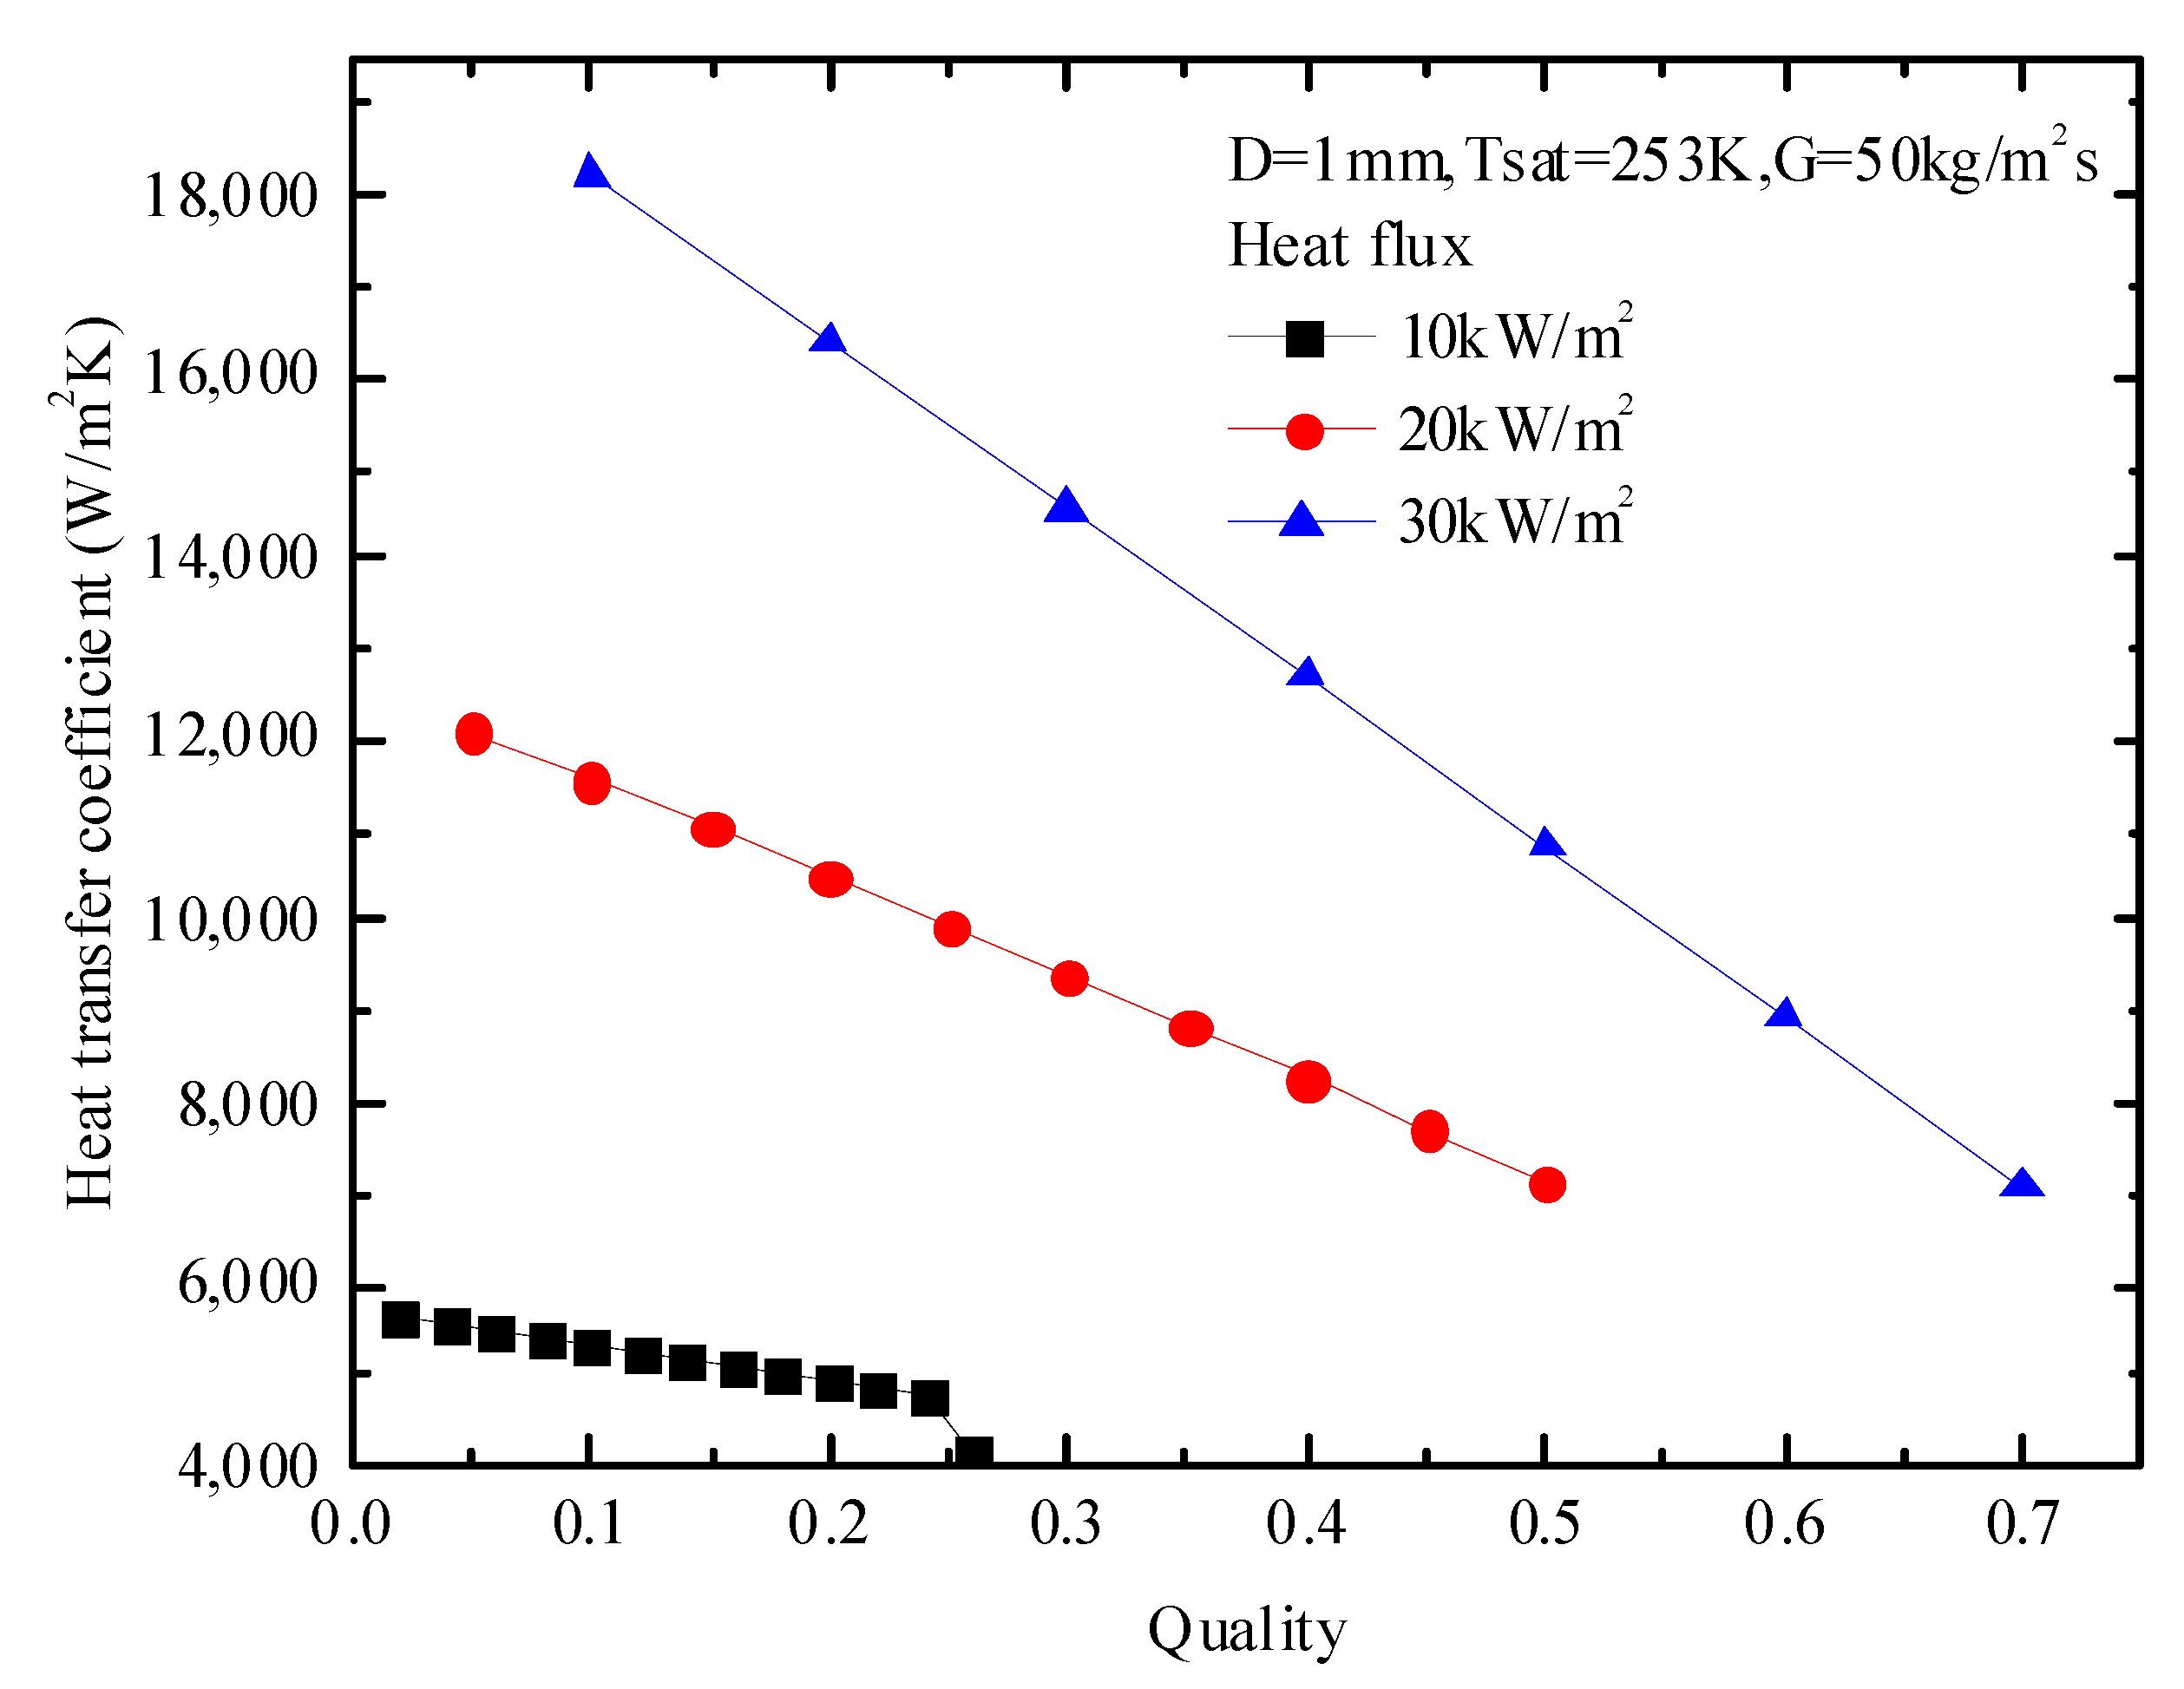
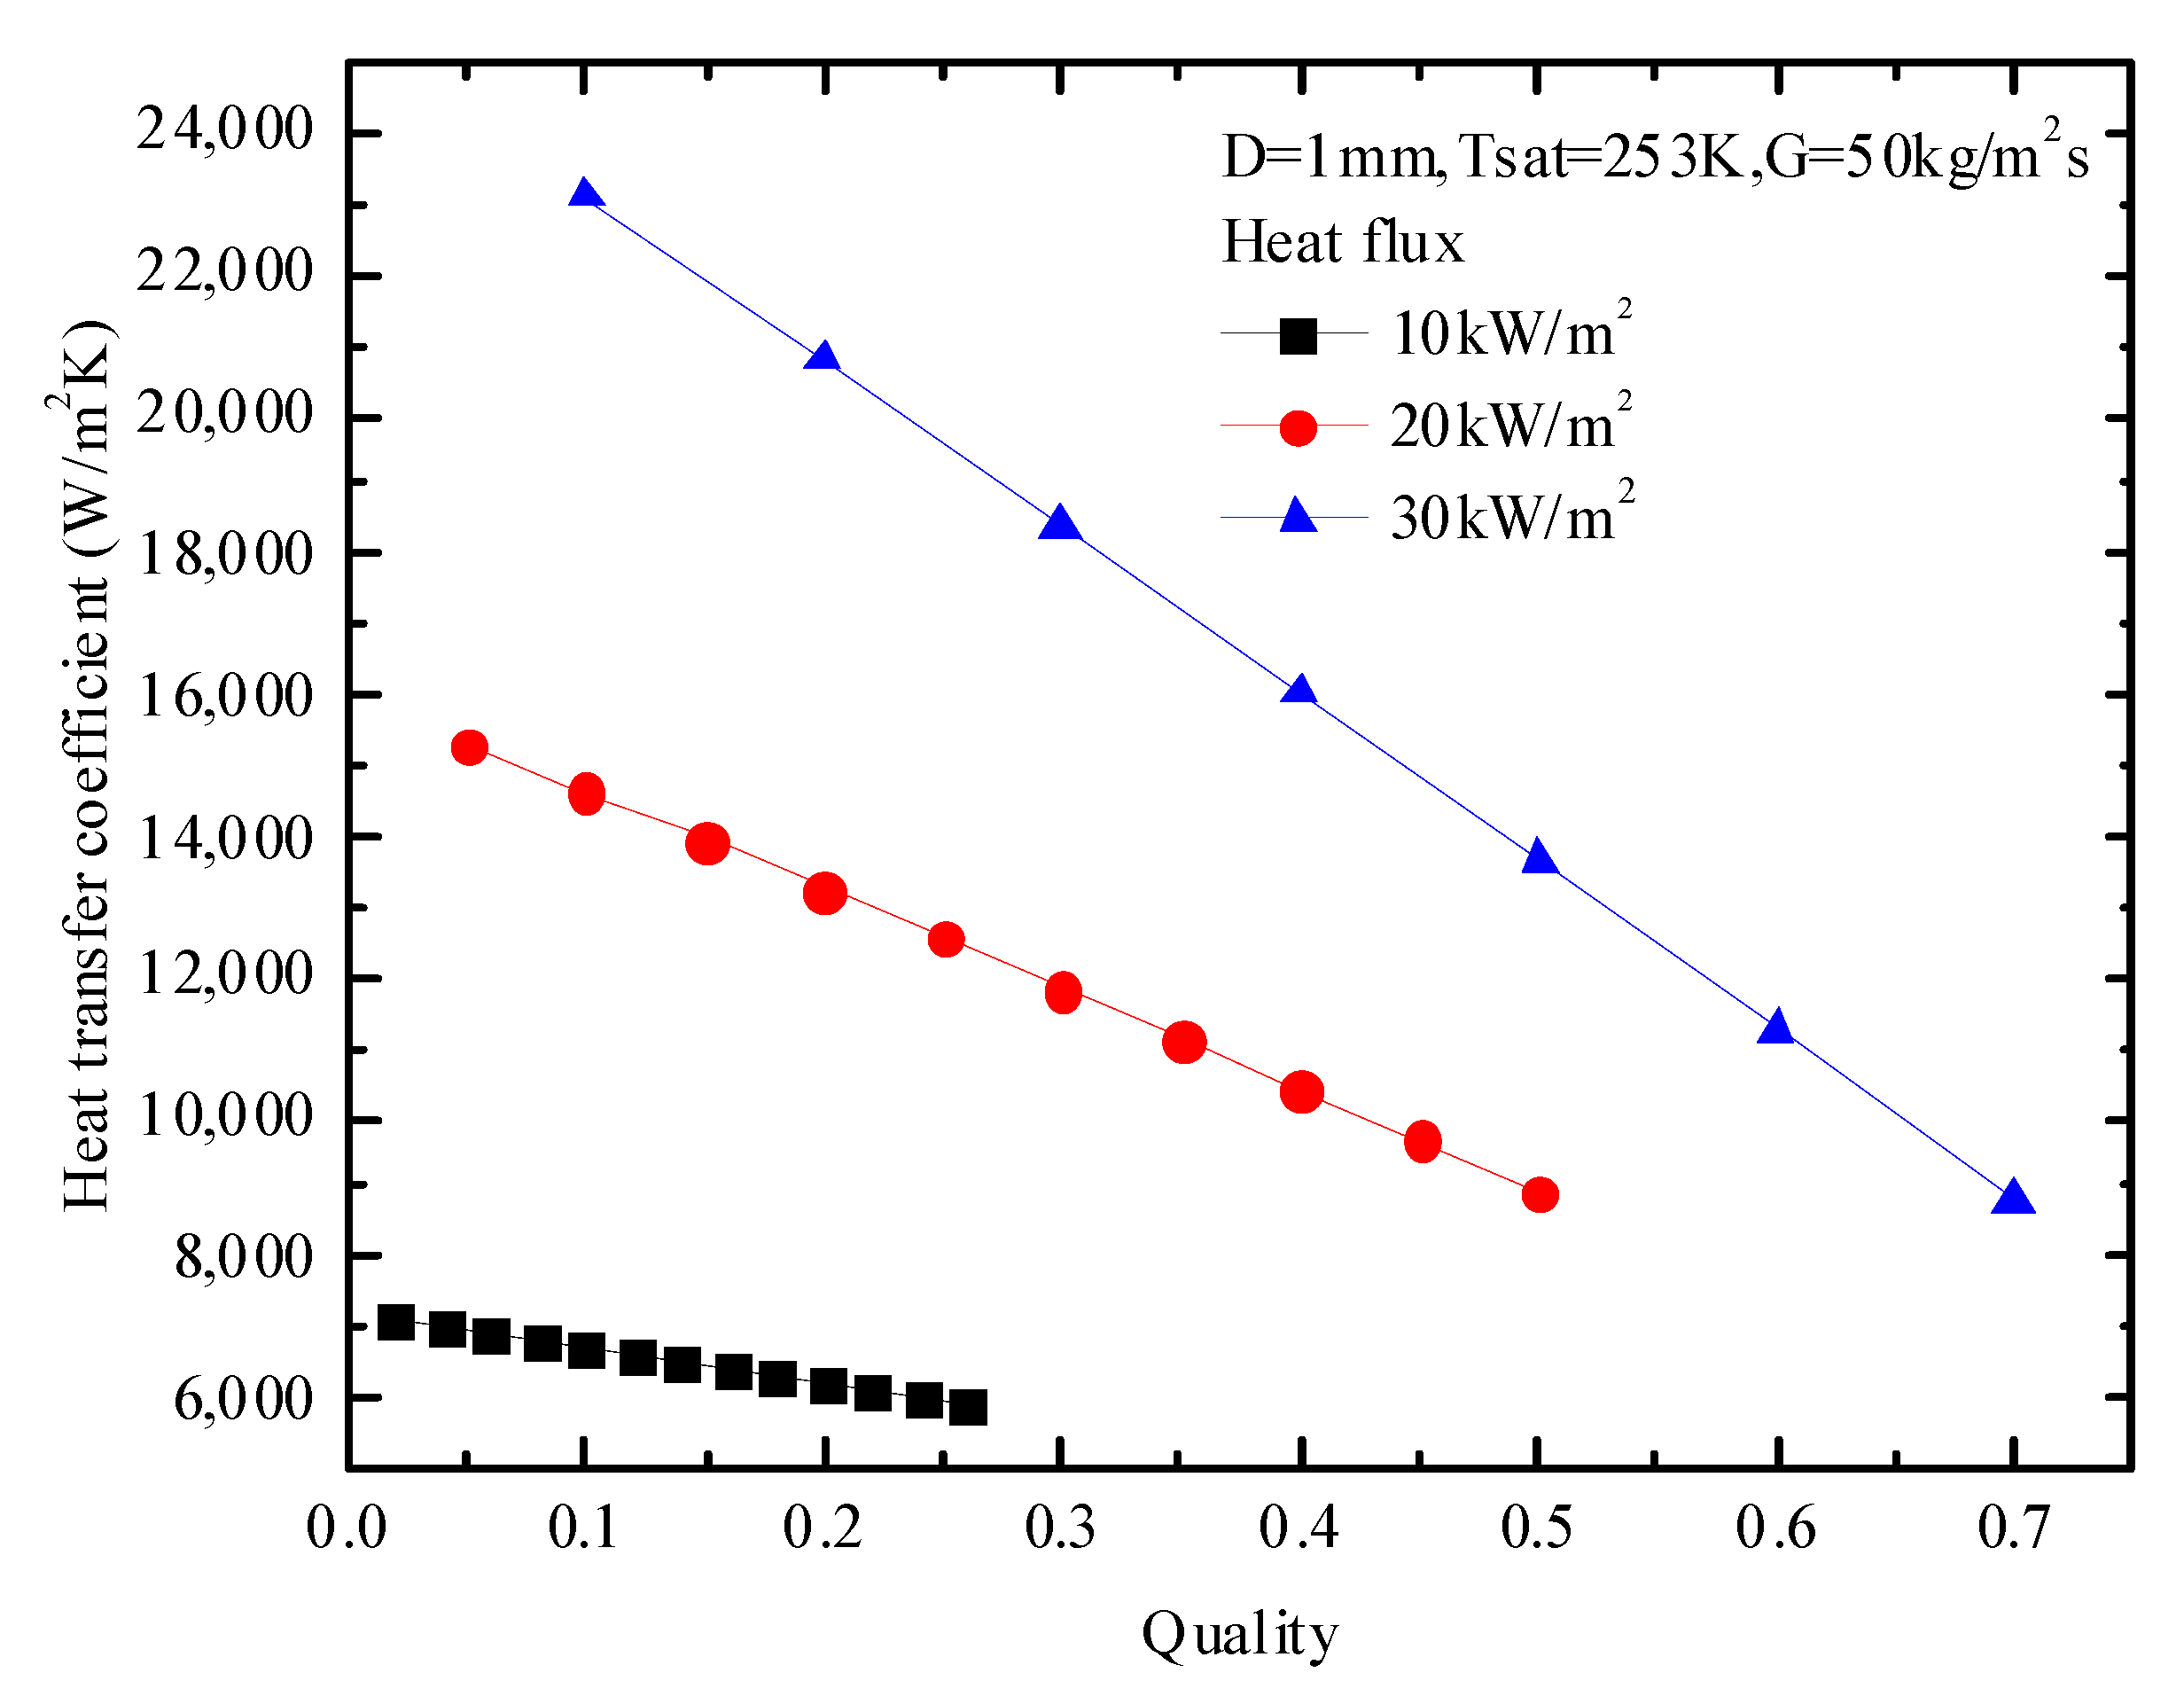
Figure 12.
Effect of heat flux on heat transfer coefficient of R744.
Figure 12.
Effect of heat flux on heat transfer coefficient of R744.
Figure 13.
Effect of heat flux on heat transfer coefficient of azeotropic refrigerant.
Figure 13.
Effect of heat flux on heat transfer coefficient of azeotropic refrigerant.
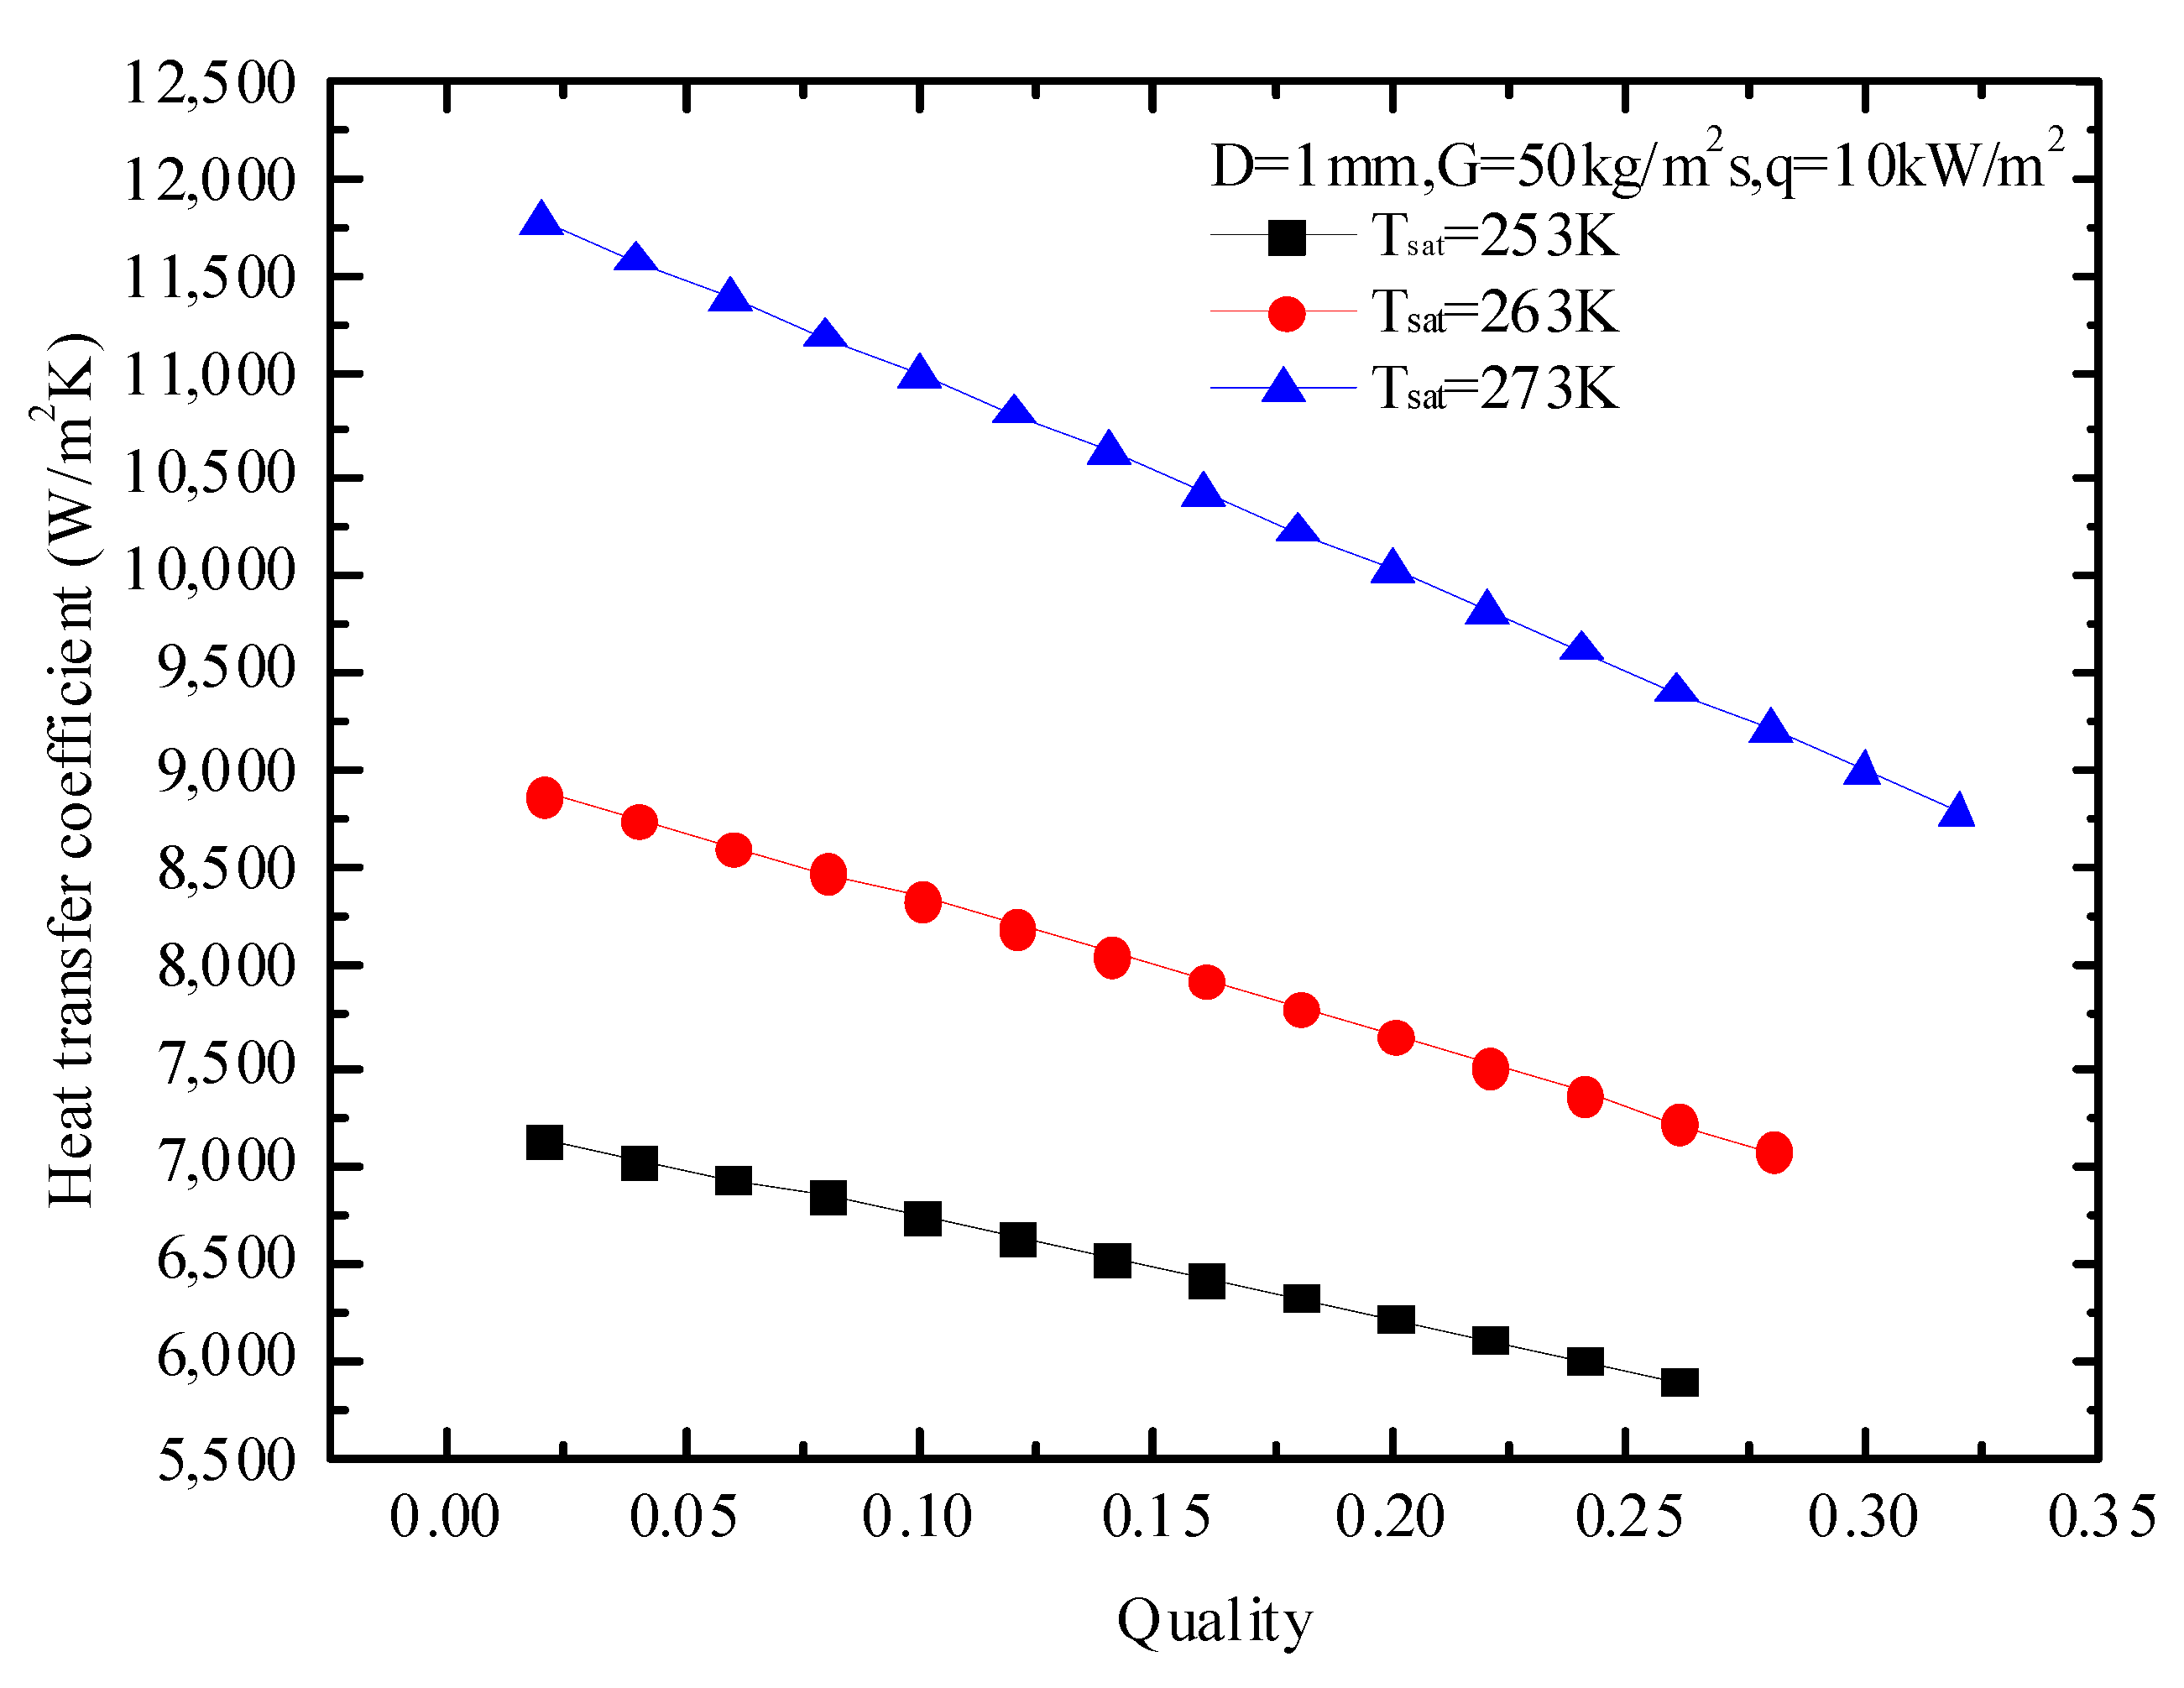
Figure 14.
Effect of Tsat on heat transfer coefficient of R744.
Figure 14.
Effect of Tsat on heat transfer coefficient of R744.
Figure 15.
Effect of Tsat on heat transfer coefficient of azeotropic refrigerant.
Figure 15.
Effect of Tsat on heat transfer coefficient of azeotropic refrigerant.
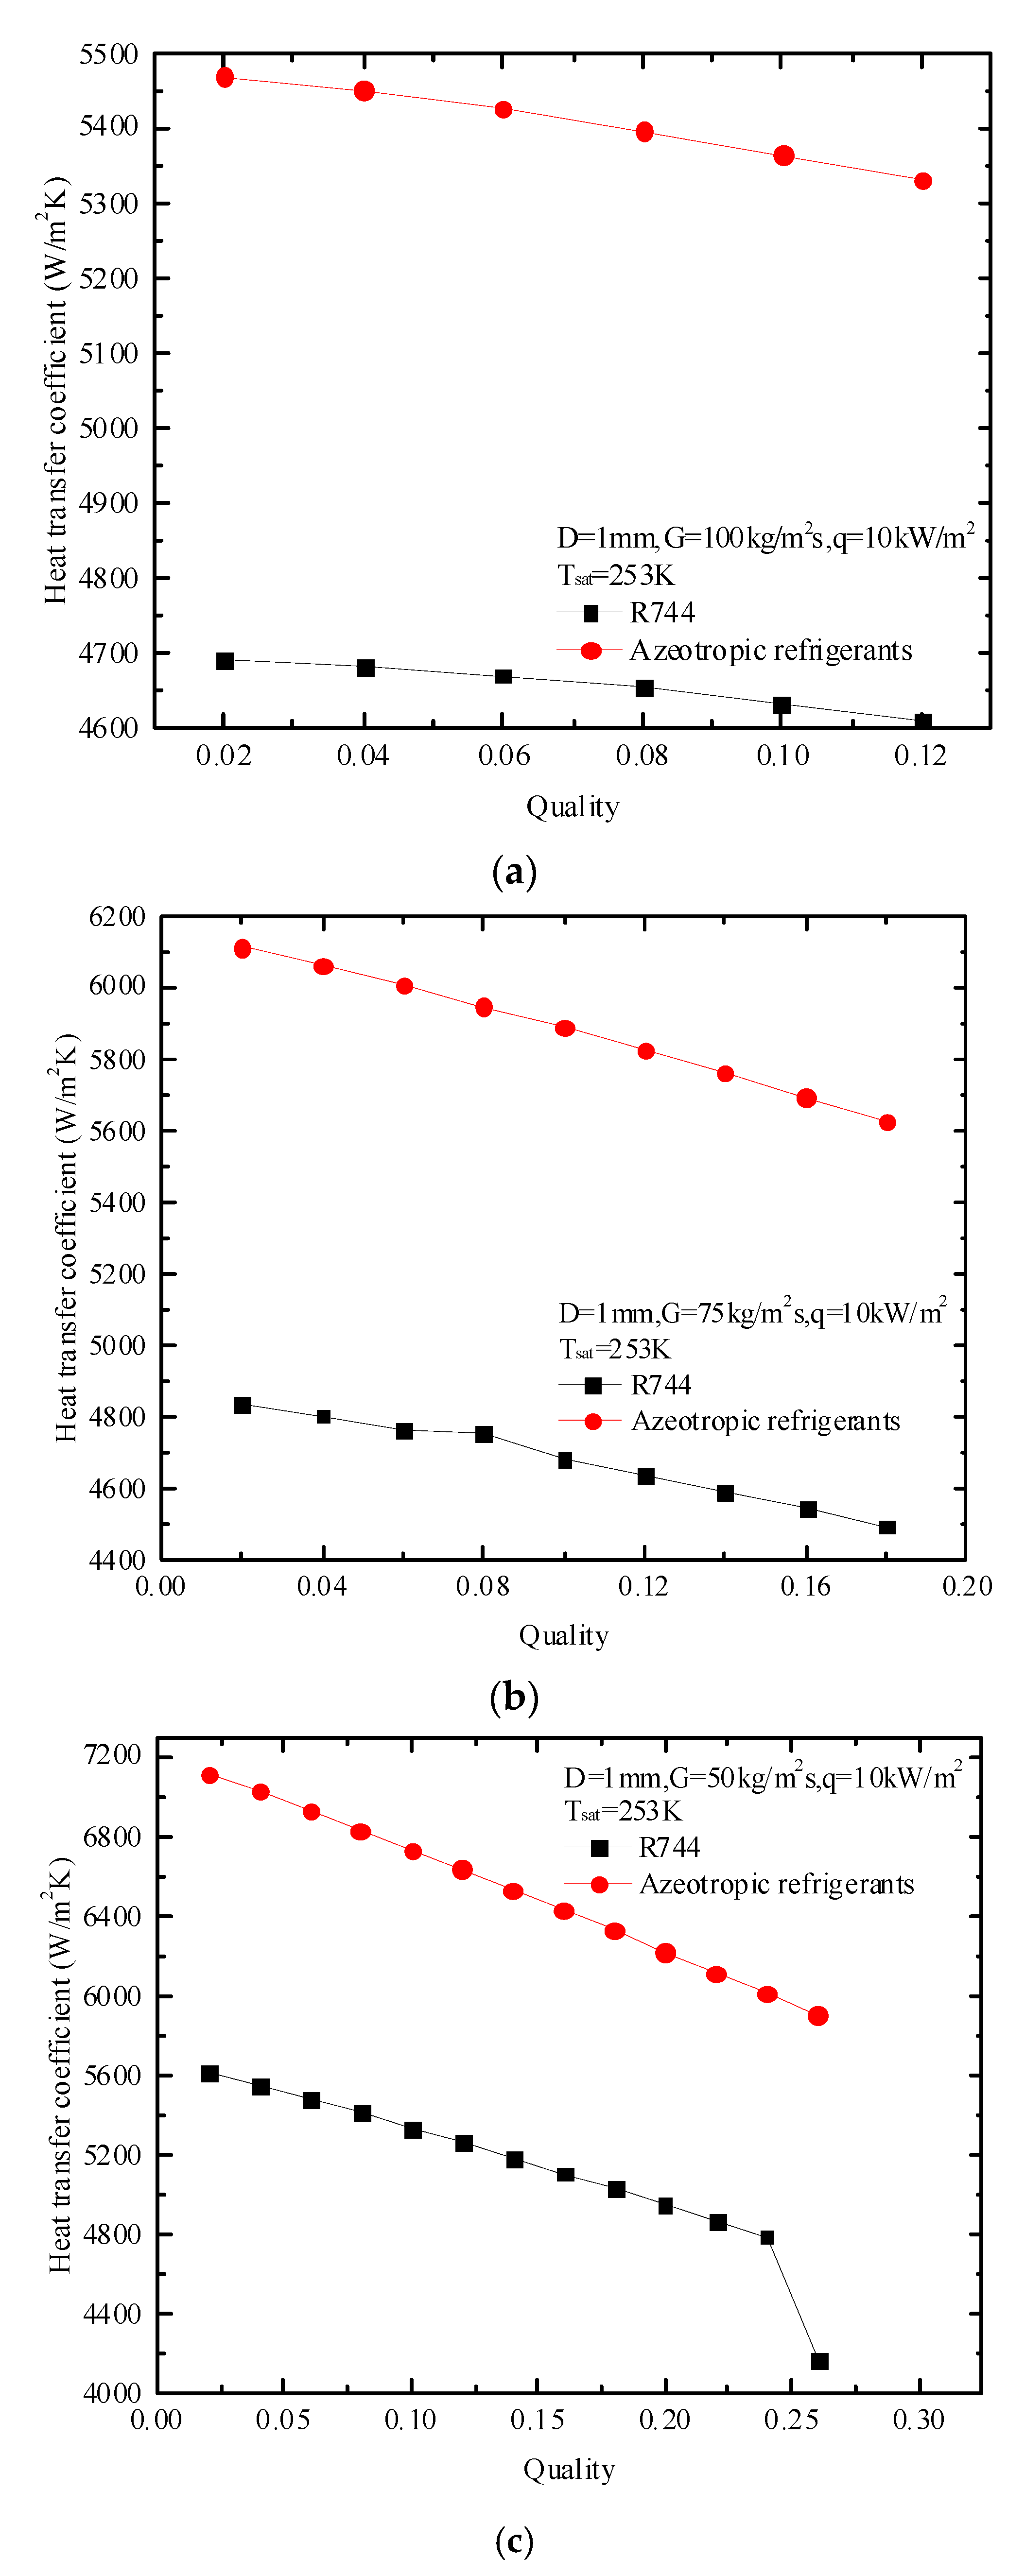
Figure 16.
Comparison of heat transfer coefficients between azeotropic refrigerant and R744 at different mass fluxes: (a) G = 100 kg/m2·s; (b) G = 75 kg/m2·s; (c) G = 50 kg/m2·s.
Figure 16.
Comparison of heat transfer coefficients between azeotropic refrigerant and R744 at different mass fluxes: (a) G = 100 kg/m2·s; (b) G = 75 kg/m2·s; (c) G = 50 kg/m2·s.
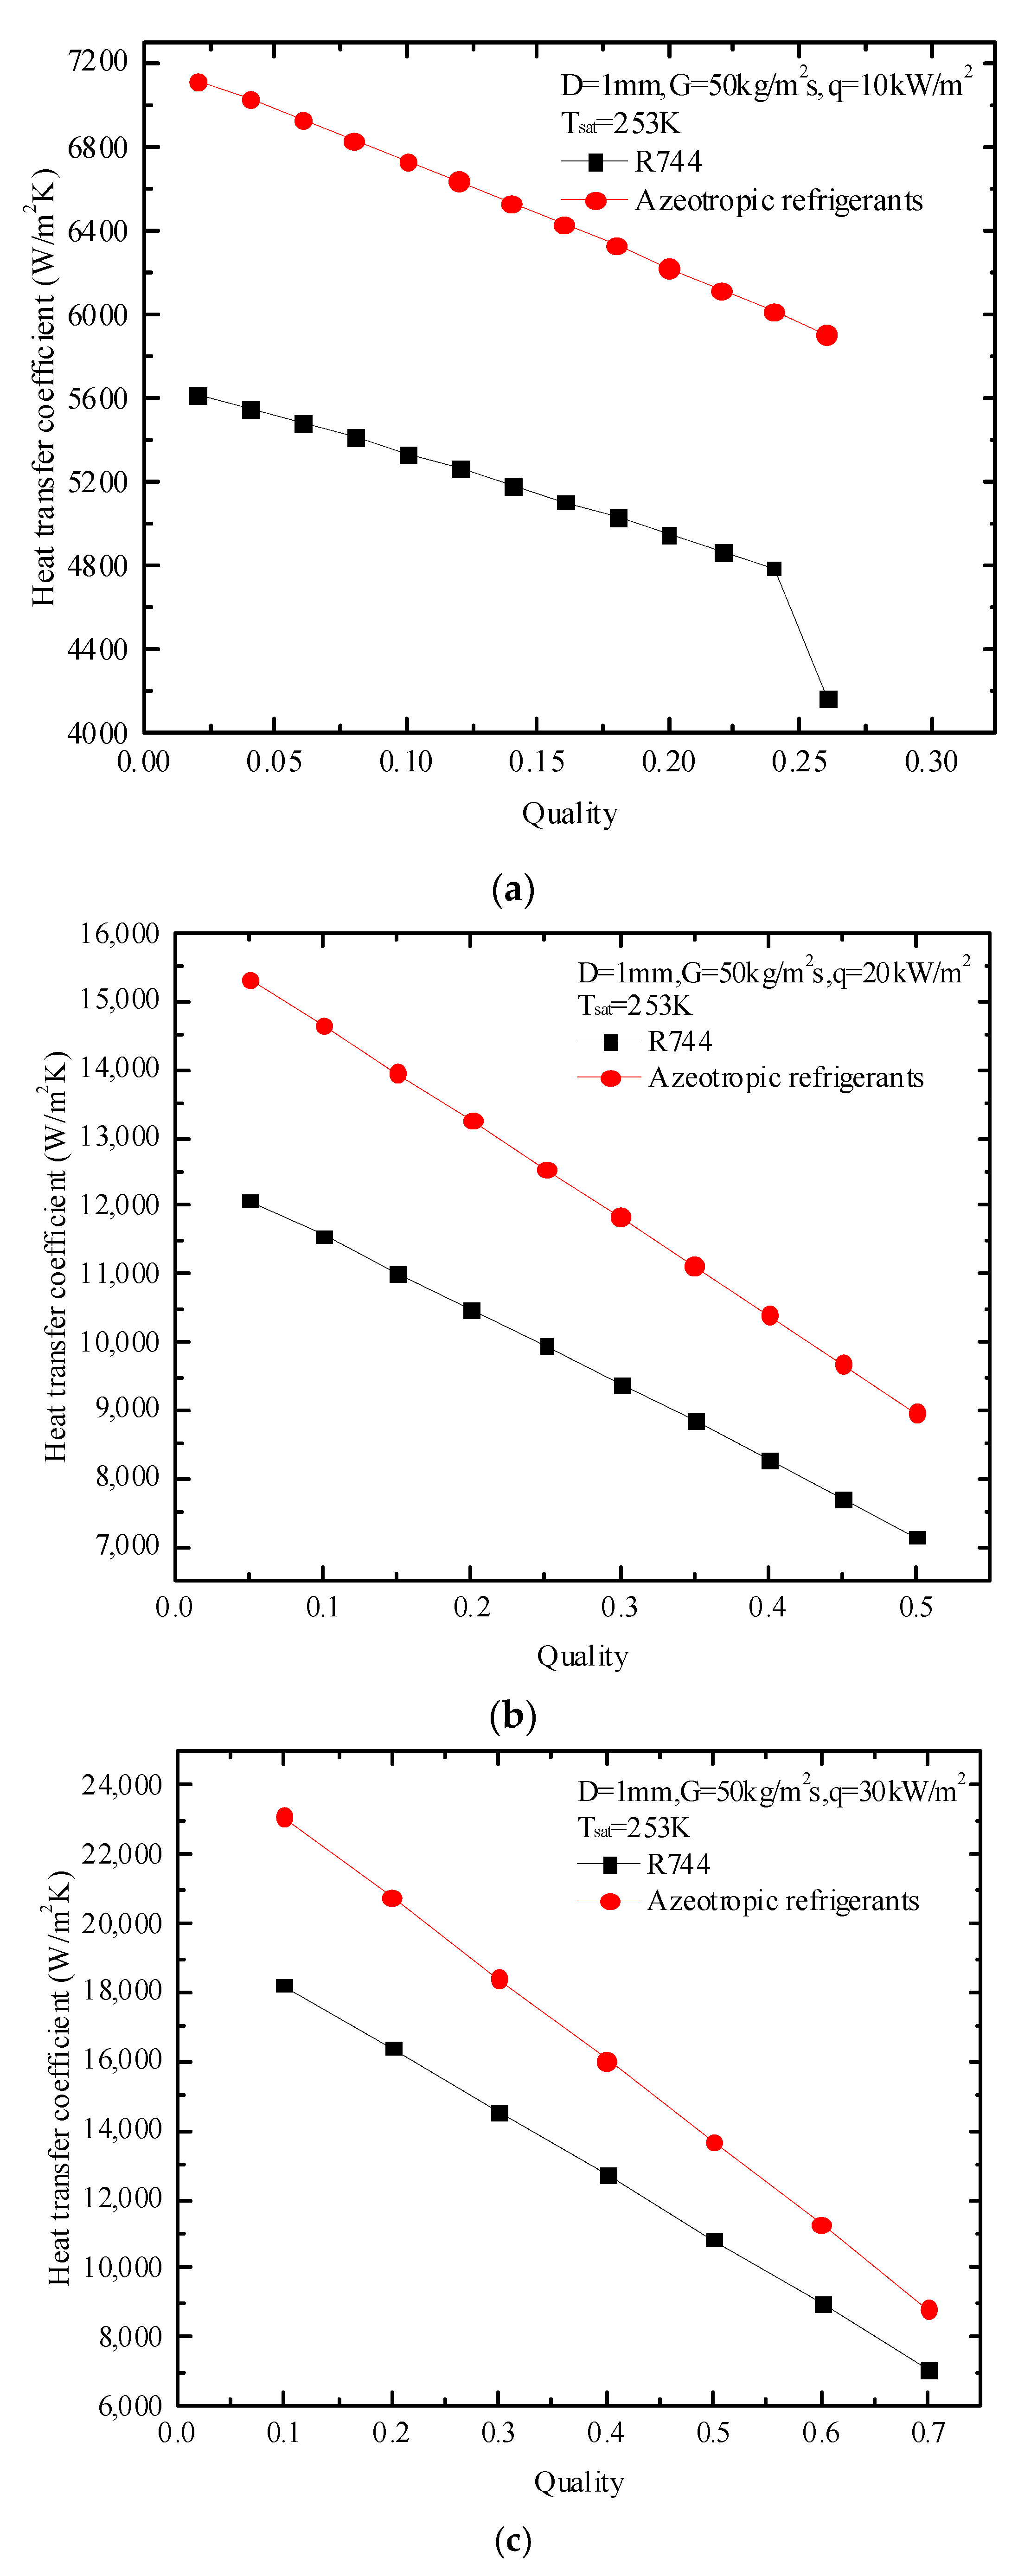
Figure 17.
Comparison of heat transfer coefficients between azeotropic refrigerant and R744 at different heat fluxes: (a) q = 10 kW; (b) q = 20 kW; (c) q = 30 kW.
Figure 17.
Comparison of heat transfer coefficients between azeotropic refrigerant and R744 at different heat fluxes: (a) q = 10 kW; (b) q = 20 kW; (c) q = 30 kW.
Figure 18.
Comparison of heat transfer coefficients between azeotropic refrigerant and R744 at different Tsat values: (a) Tsat = 253 K; (b) Tsat = 263 K; (c) Tsat = 273 K.
Figure 18.
Comparison of heat transfer coefficients between azeotropic refrigerant and R744 at different Tsat values: (a) Tsat = 253 K; (b) Tsat = 263 K; (c) Tsat = 273 K.
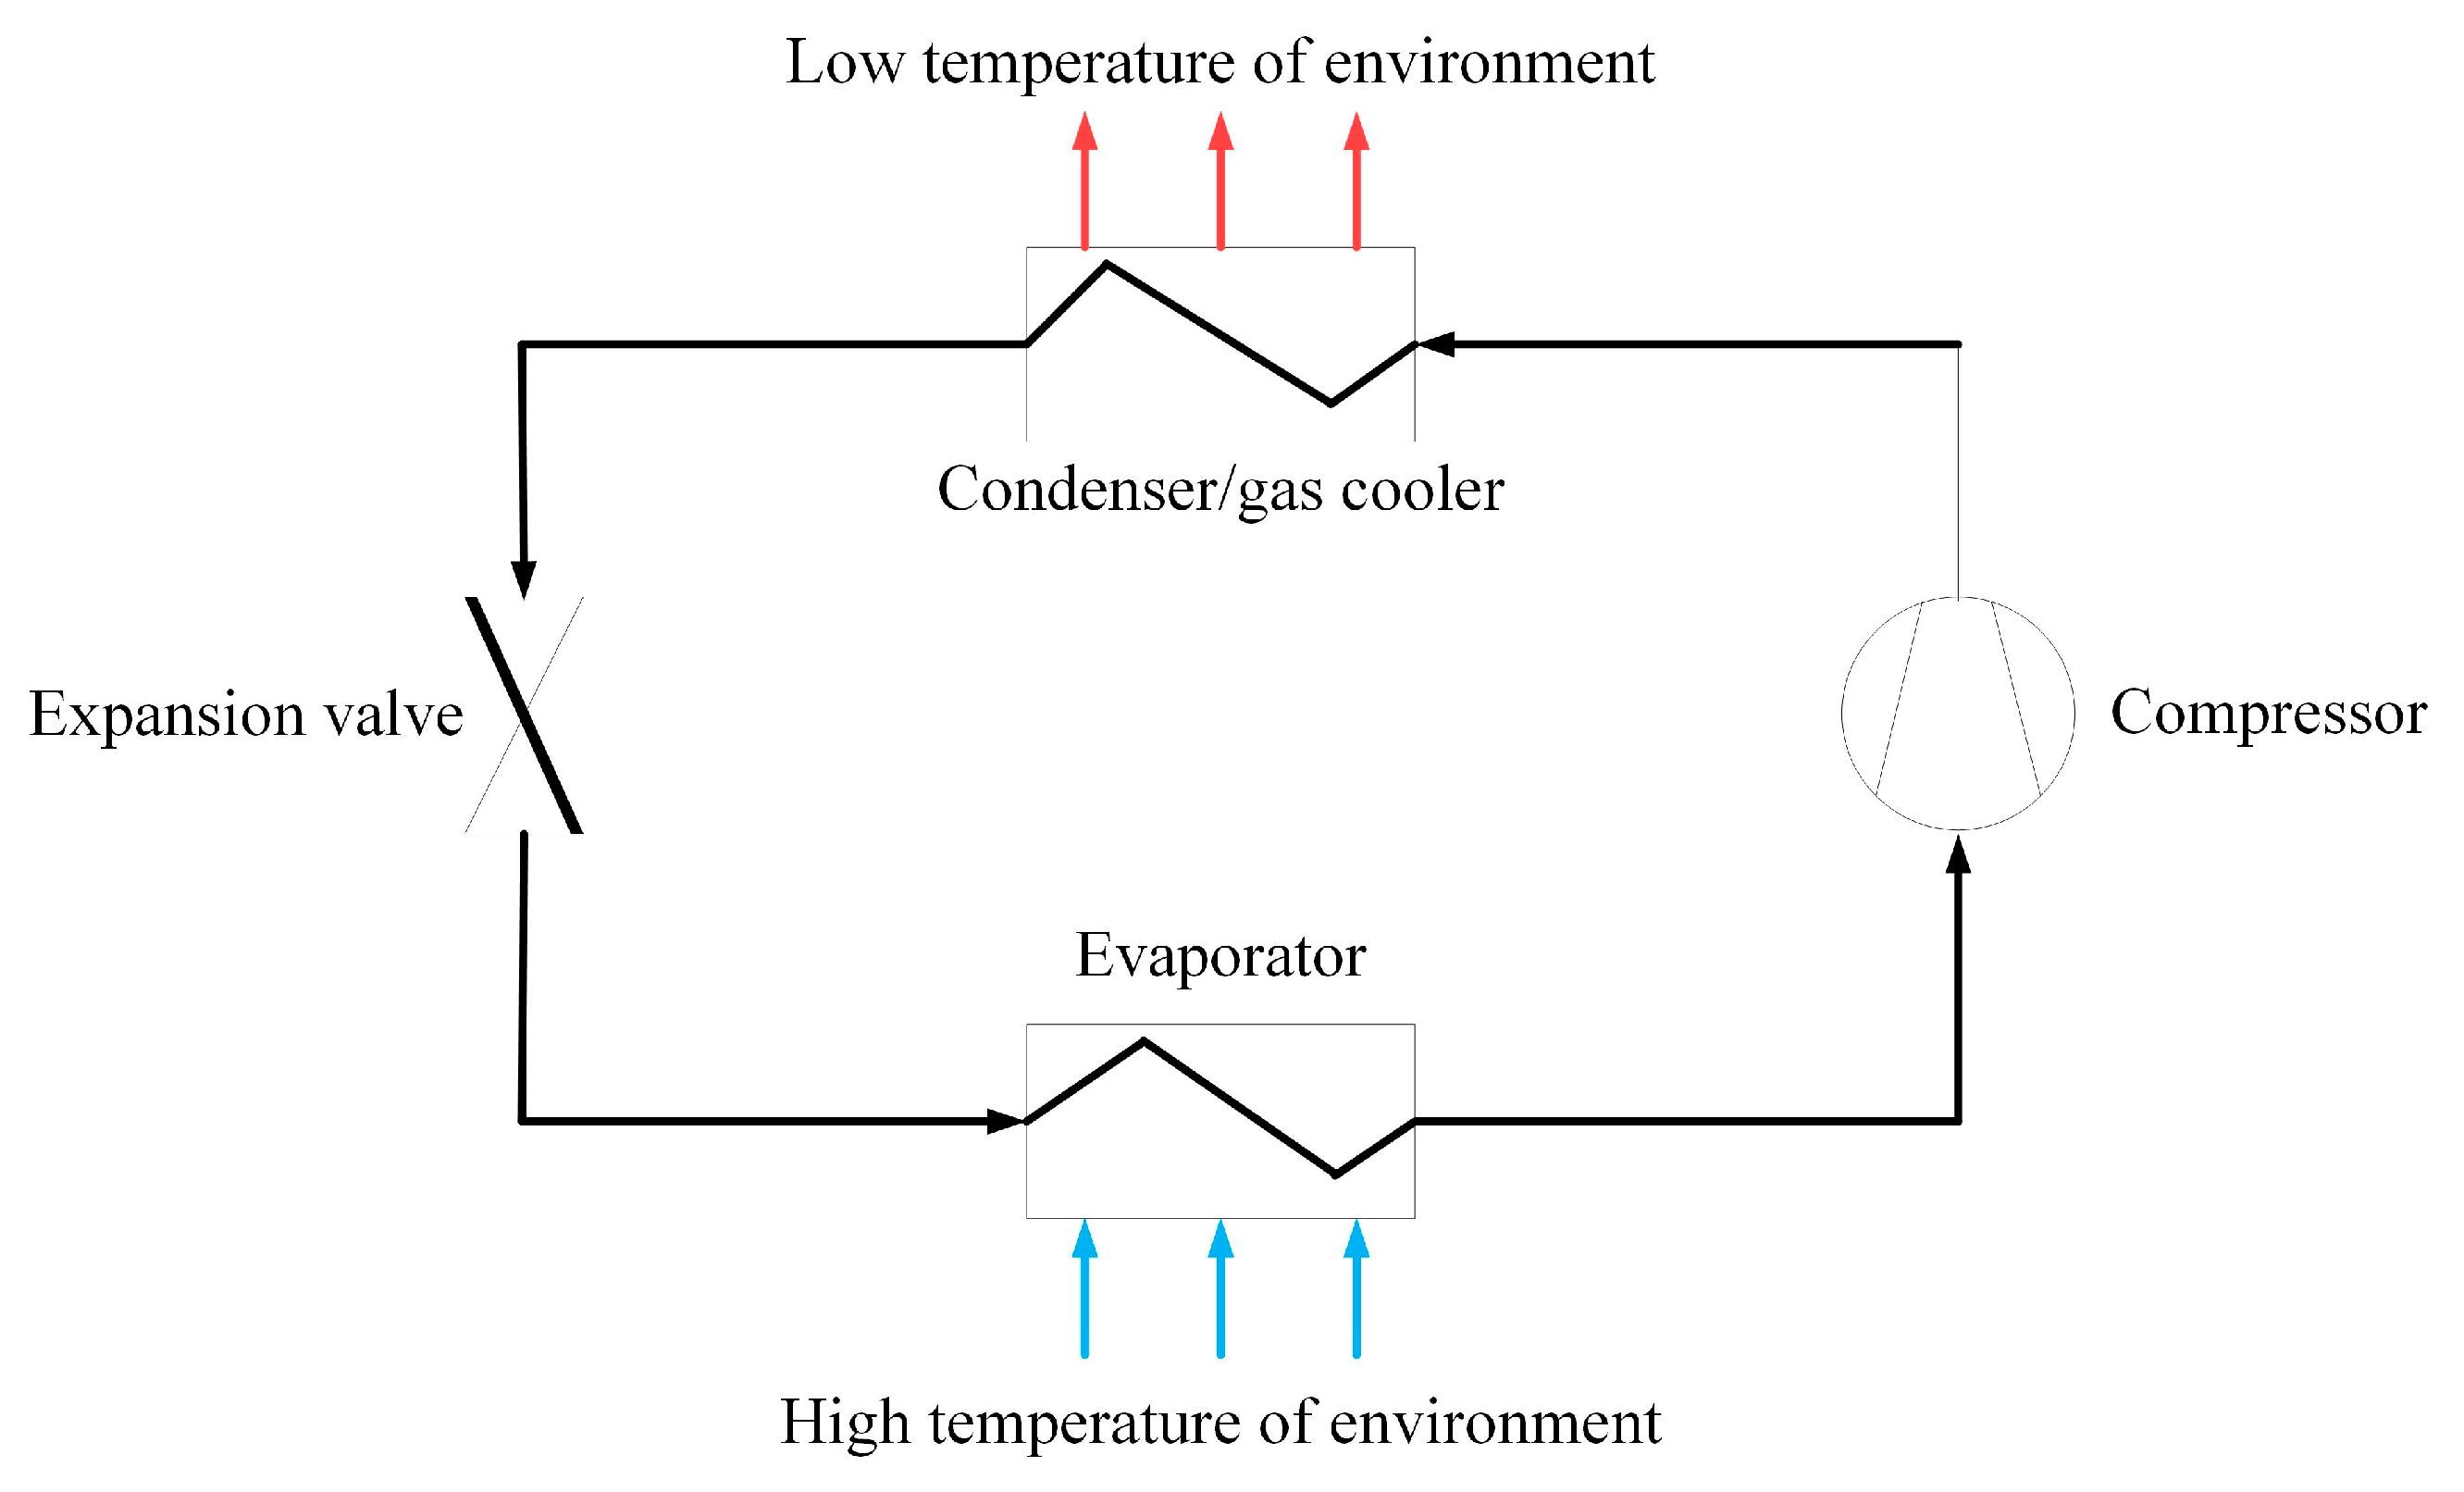
Figure 19.
Scheme of the subcritical vapor compression heating working cycle.
Figure 19.
Scheme of the subcritical vapor compression heating working cycle.
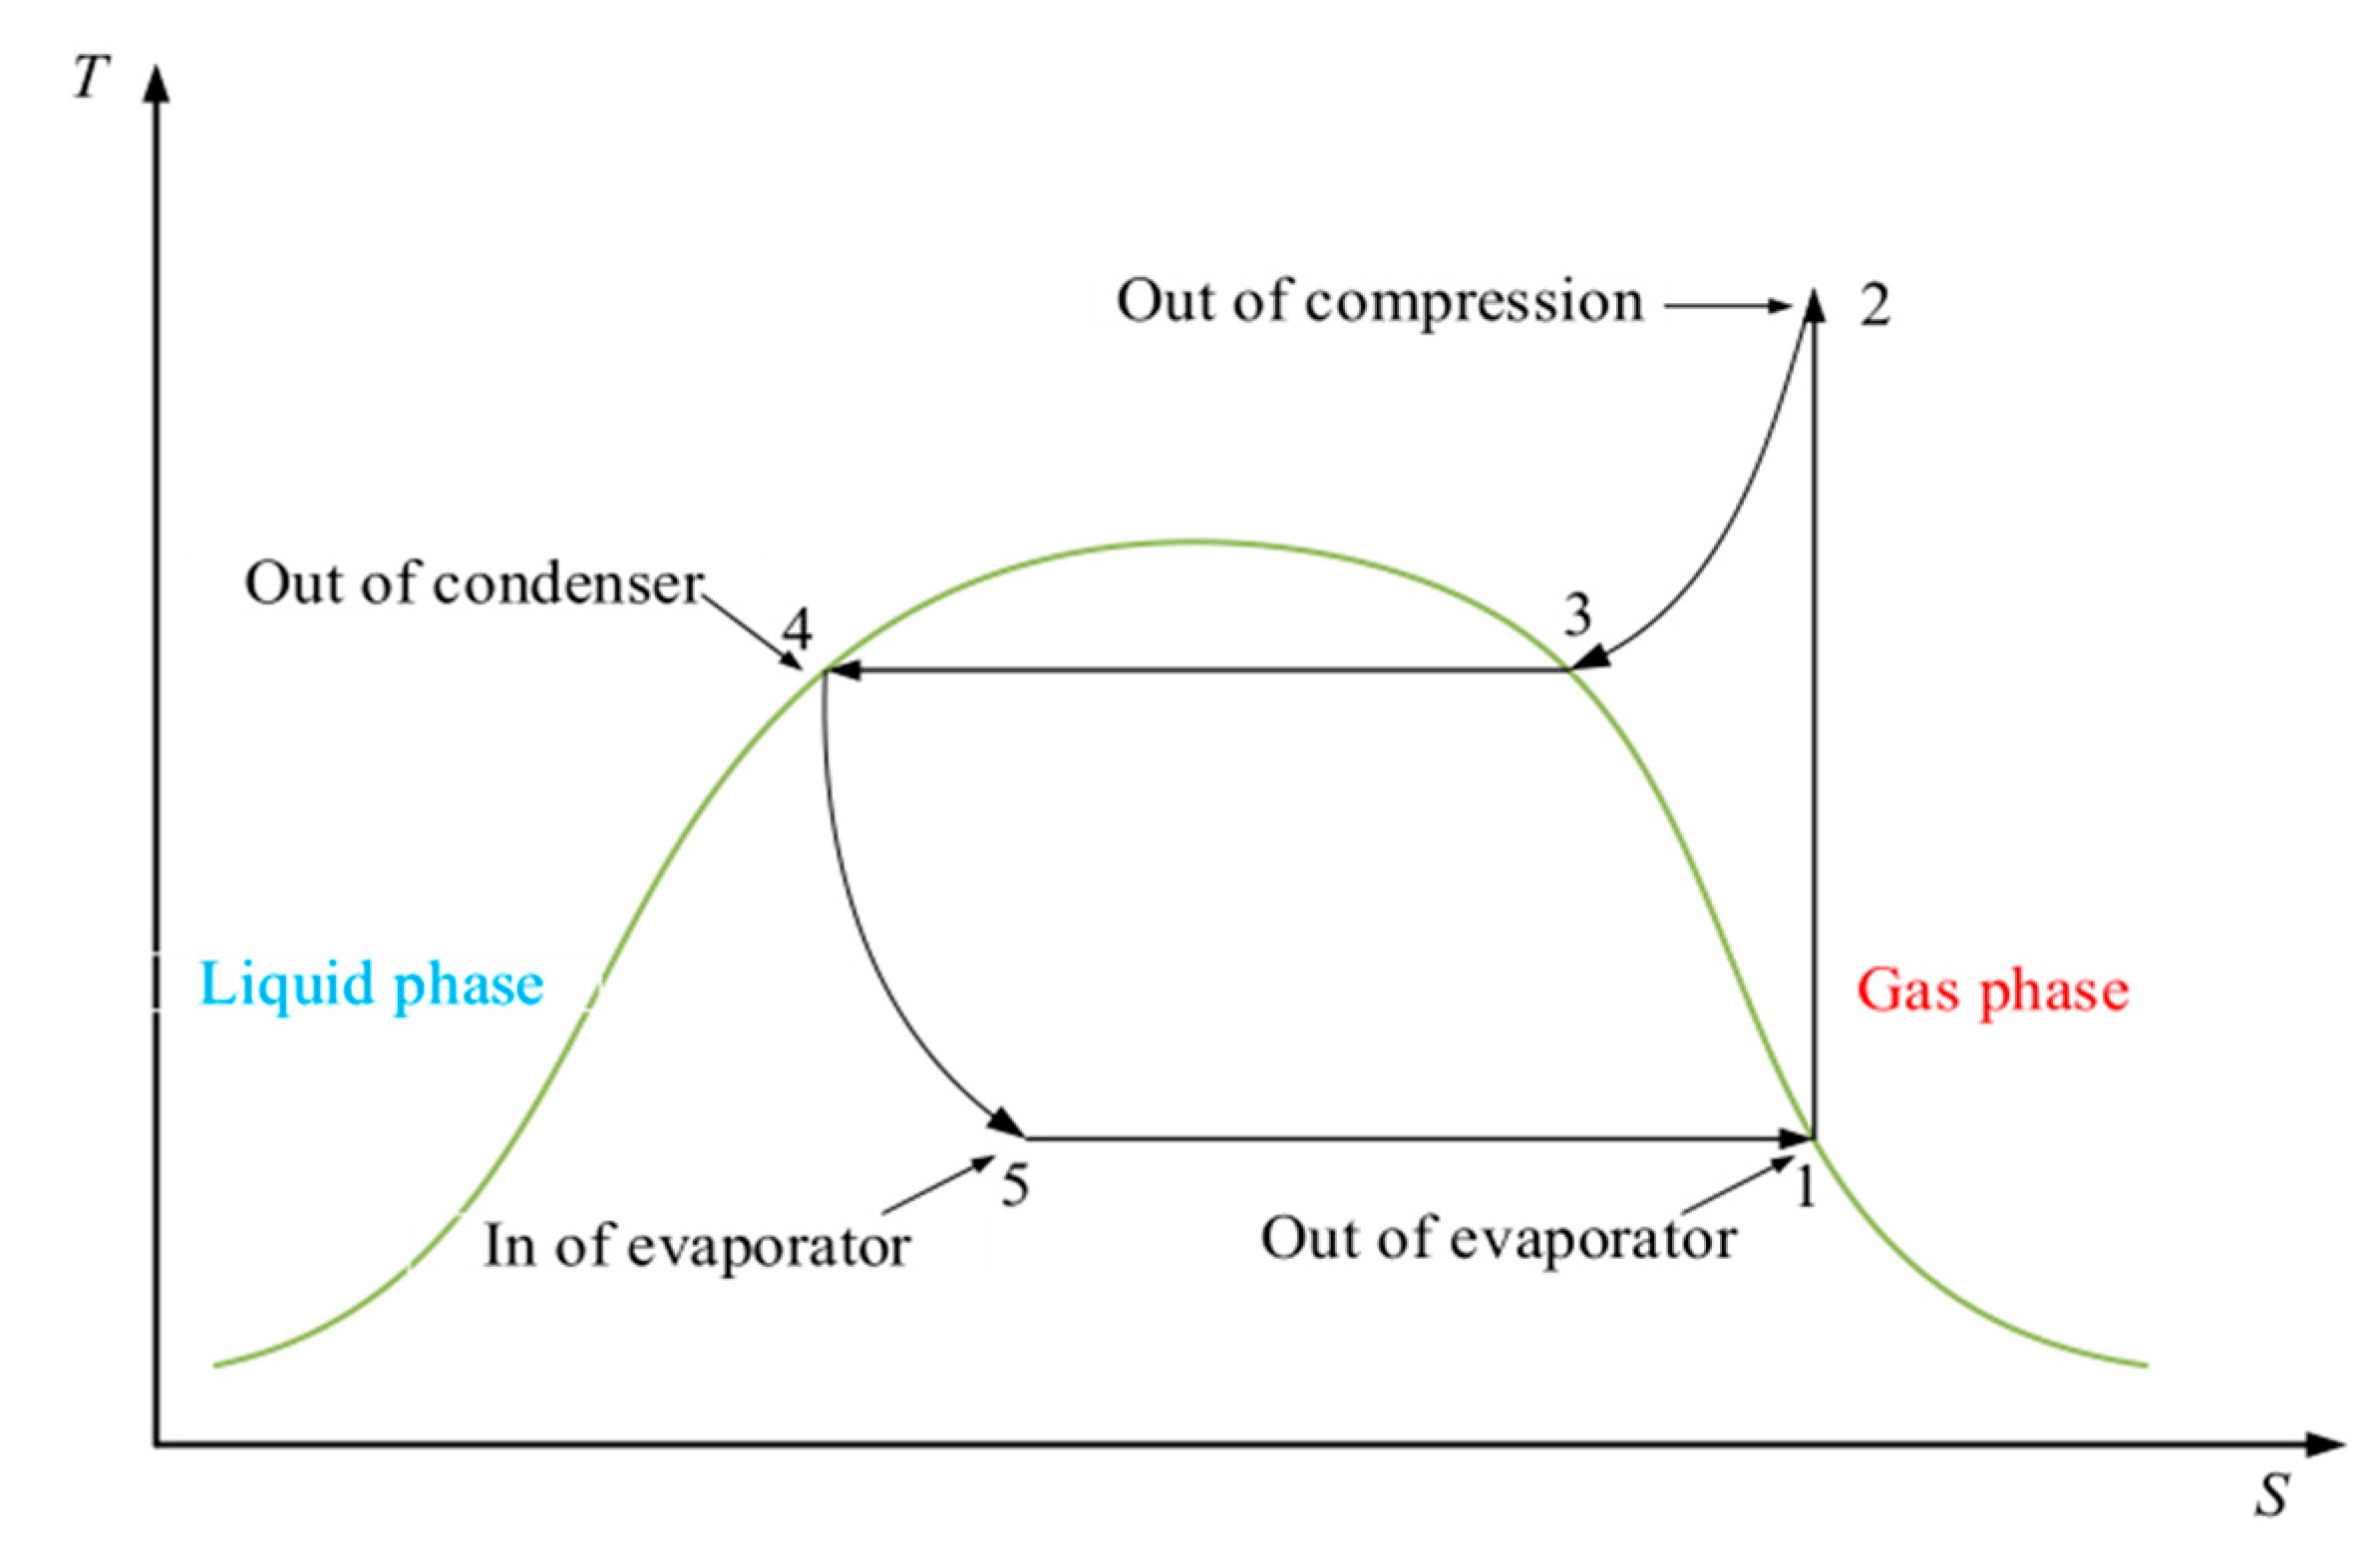
Figure 20.
T-S diagram of the subcritical vapor compression heating working cycle.
Figure 20.
T-S diagram of the subcritical vapor compression heating working cycle.
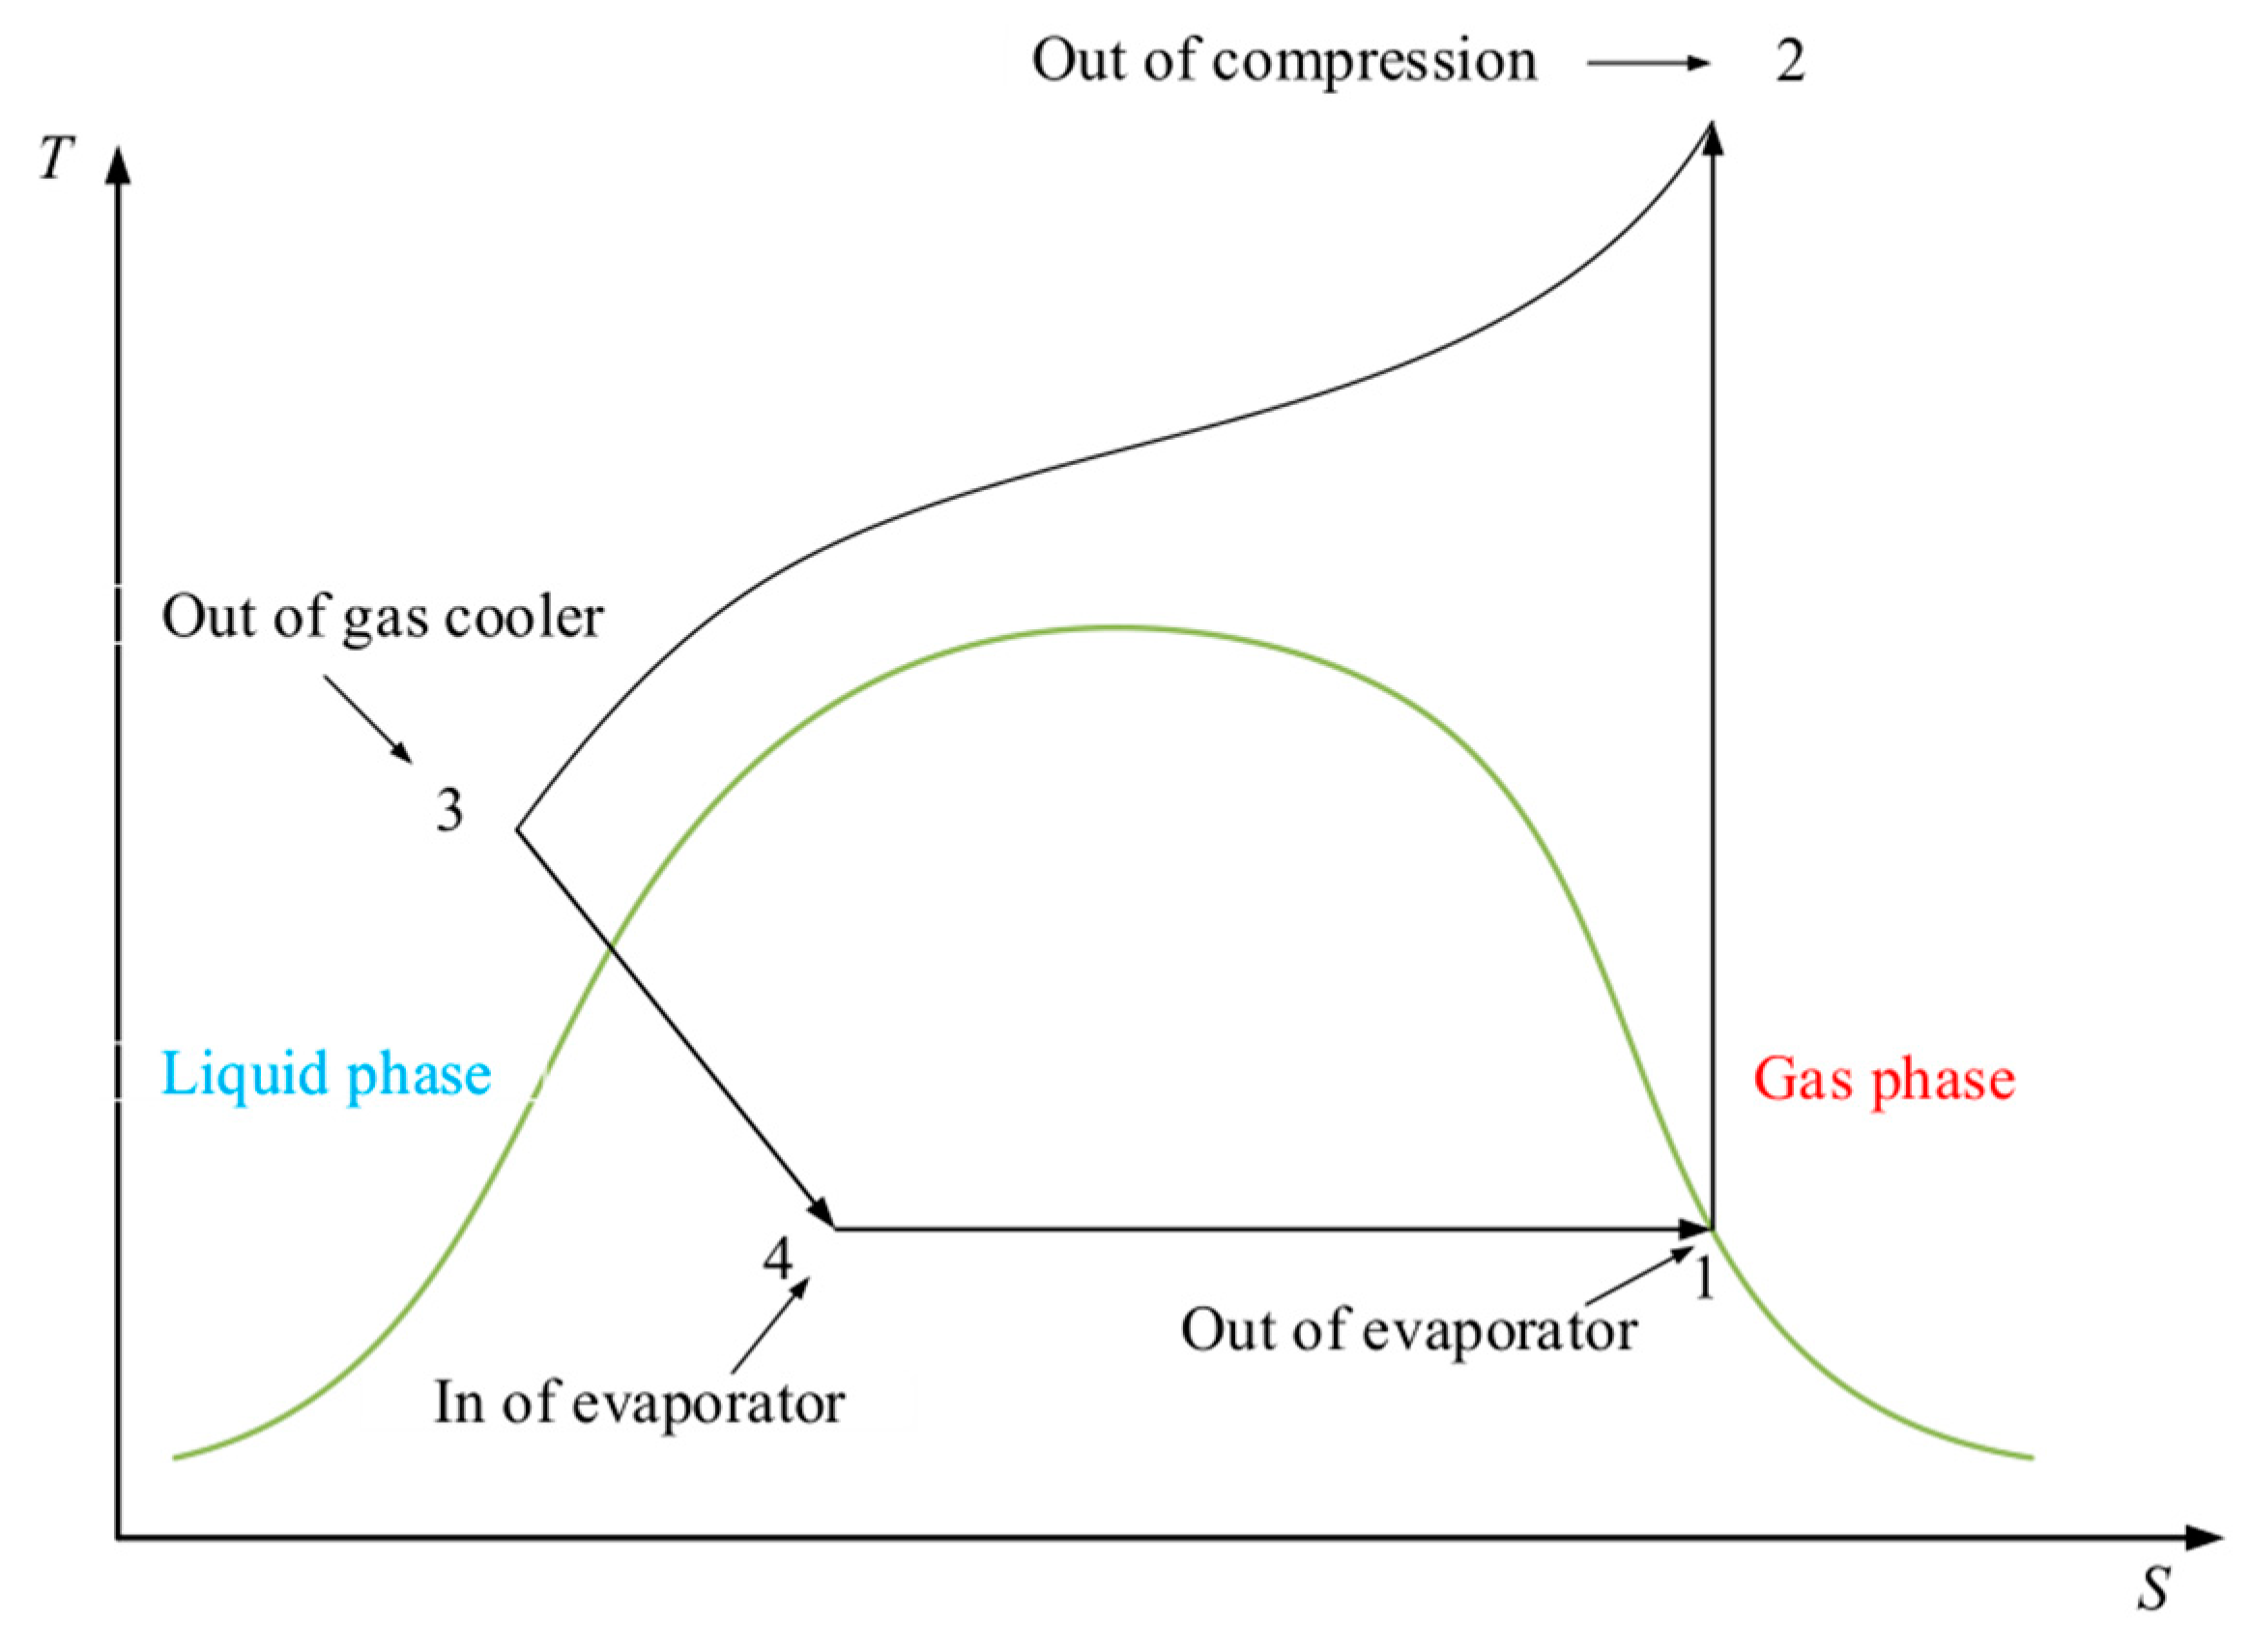
Figure 21.
T-S diagram of the transcritical vapor compression heating working cycle.
Figure 21.
T-S diagram of the transcritical vapor compression heating working cycle.
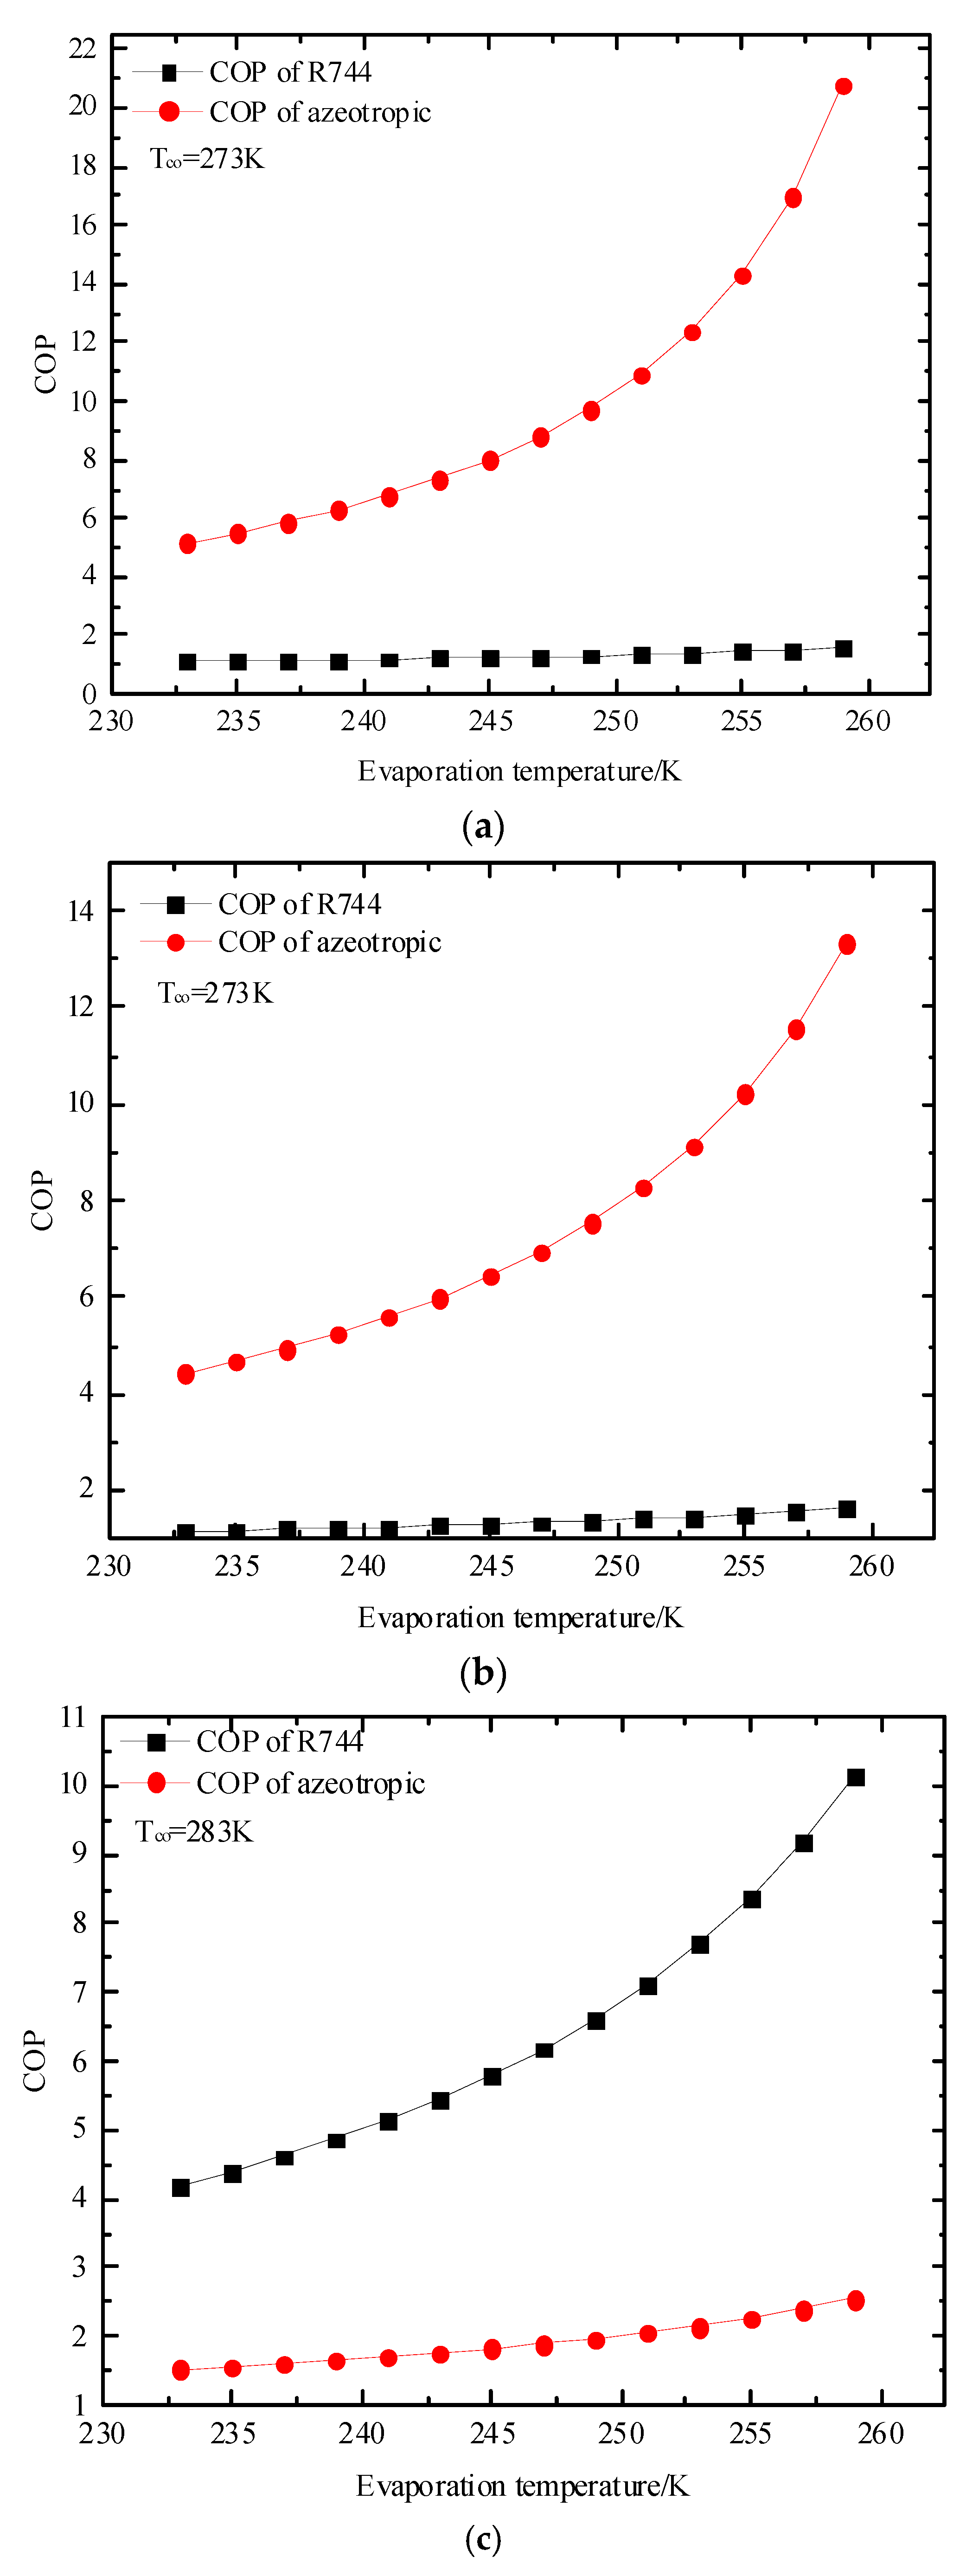
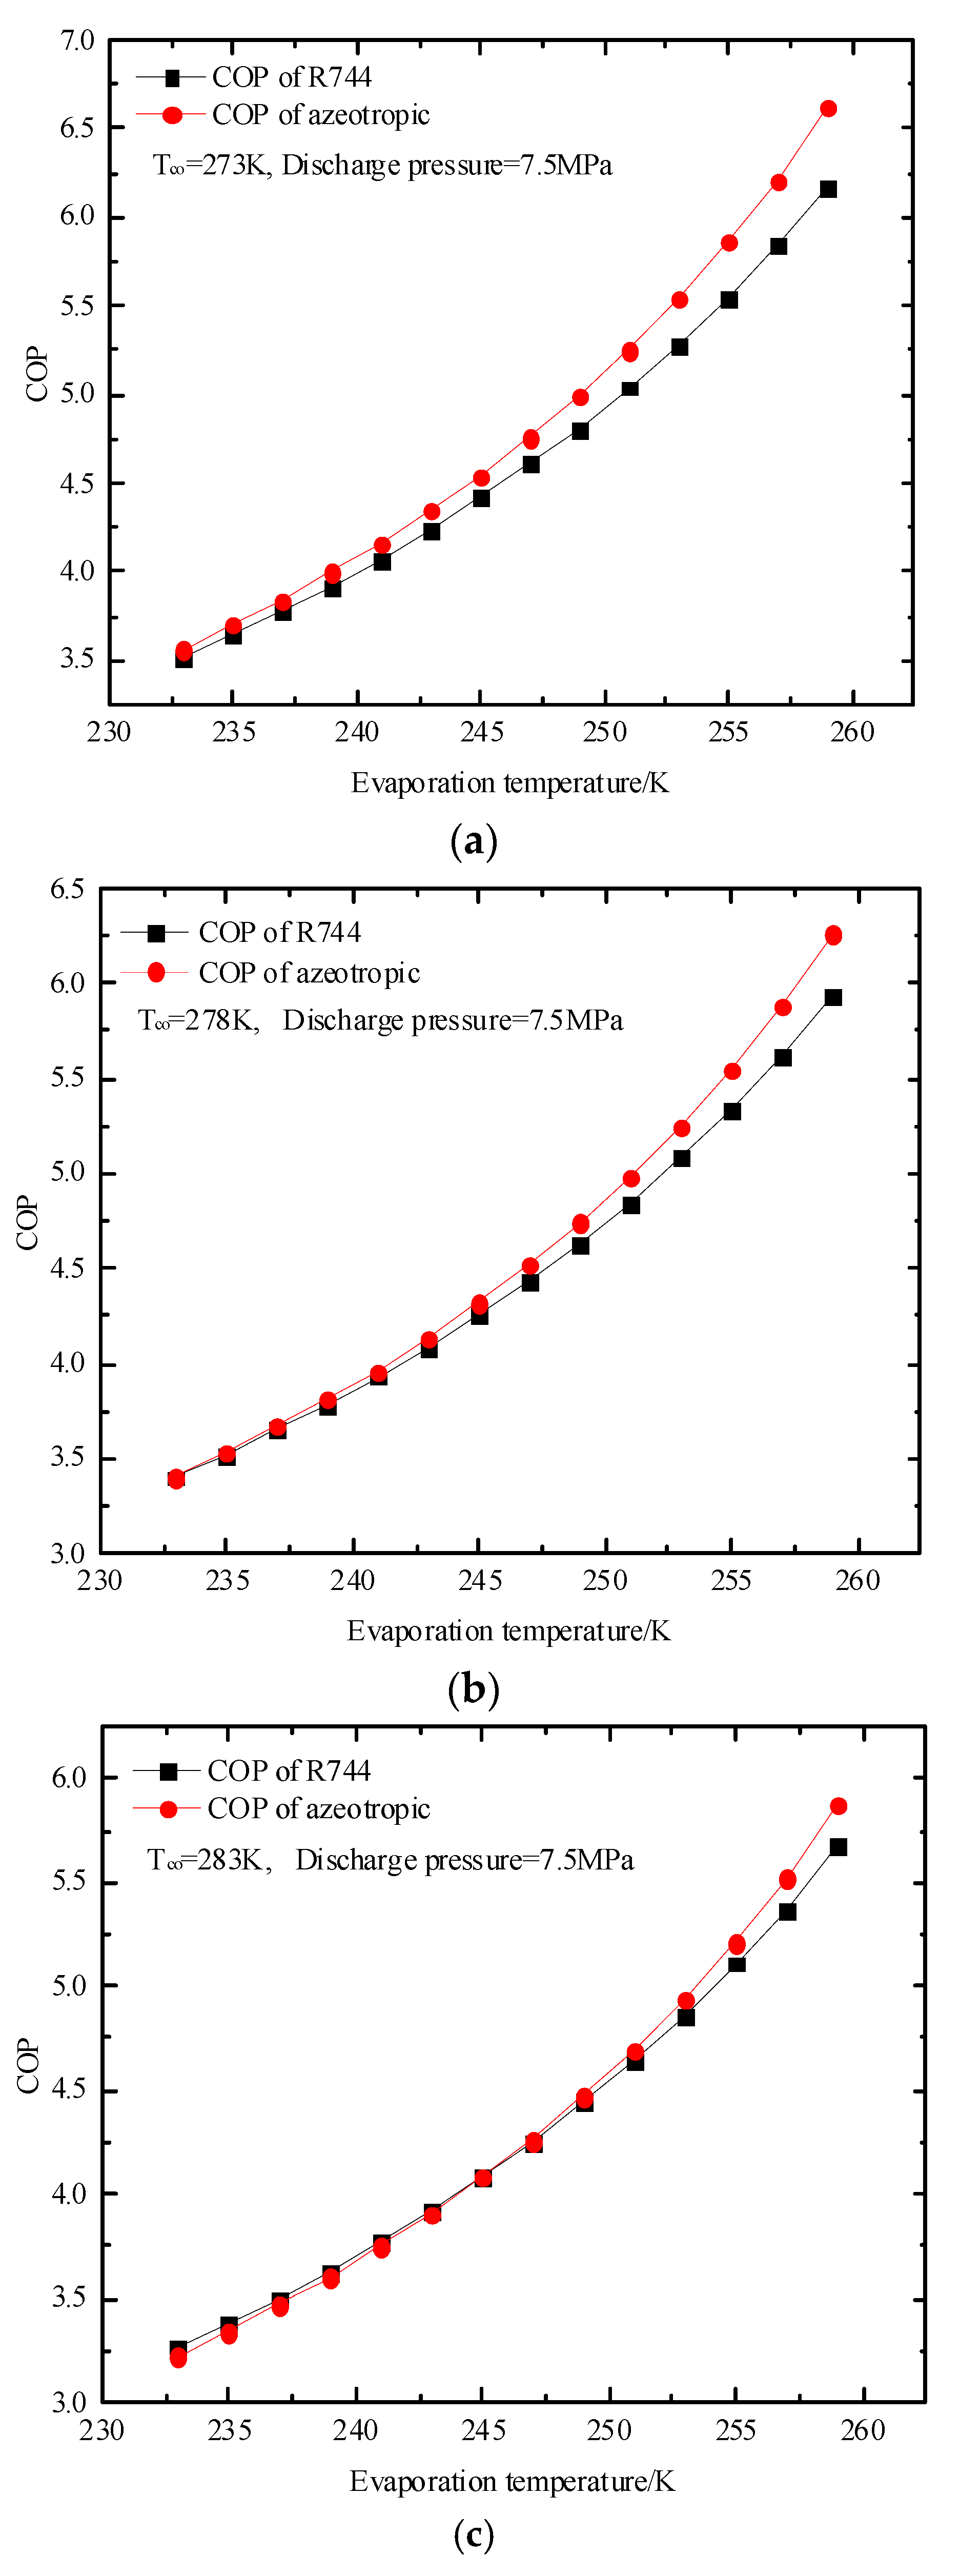
Figure 22.
Comparison of COP values of azeotropic refrigerant and R744 varies with evaporation temperature at different outlet temperatures of condenser: (a) Tco = 273 K; (b) Tco = 278 K; (c) Tco = 283 K.
Figure 22.
Comparison of COP values of azeotropic refrigerant and R744 varies with evaporation temperature at different outlet temperatures of condenser: (a) Tco = 273 K; (b) Tco = 278 K; (c) Tco = 283 K.
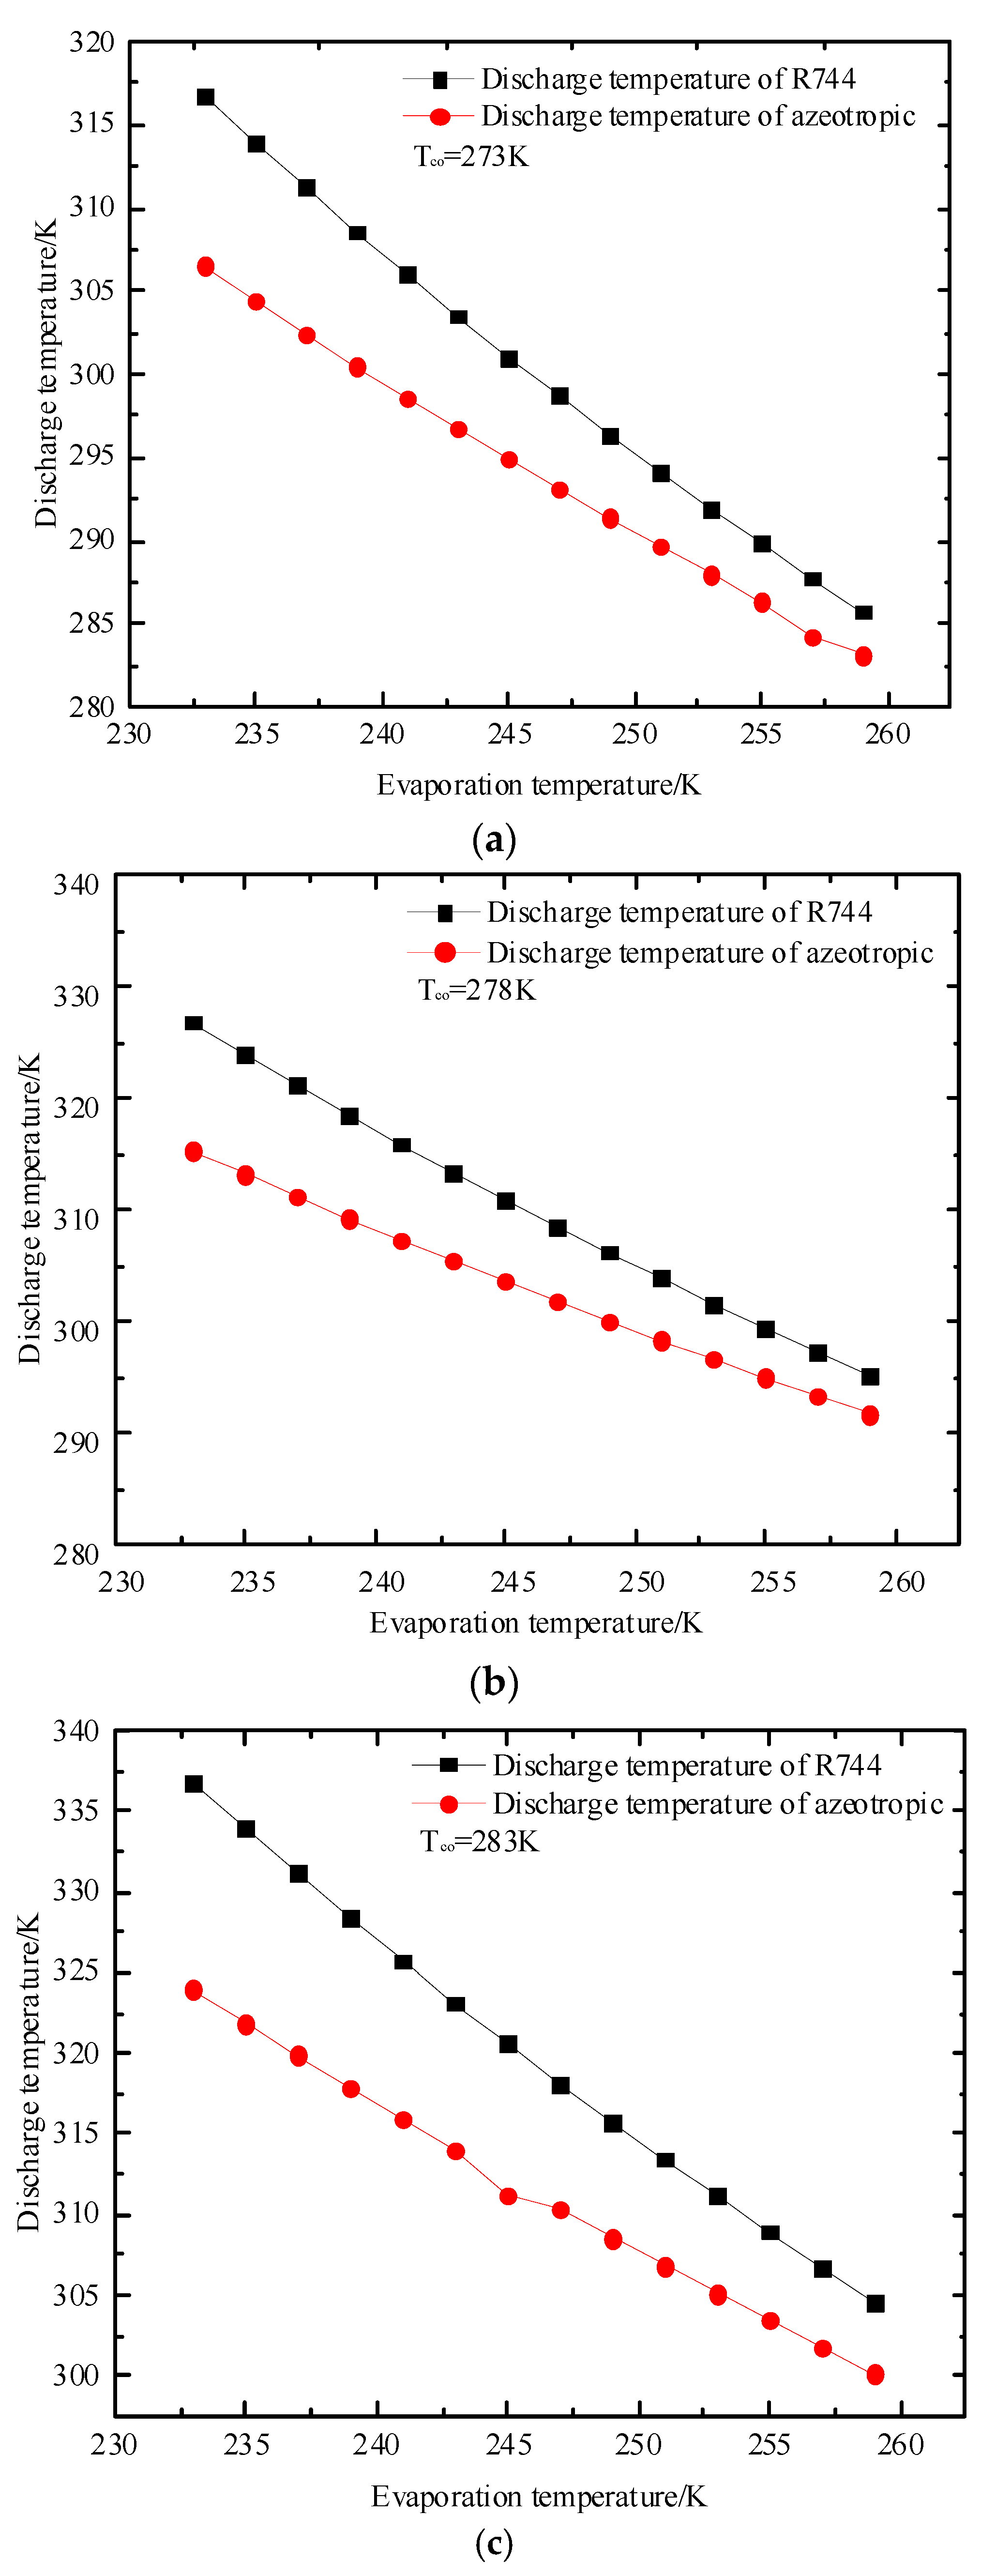
Figure 23.
Comparison of discharge temperature of azeotropic refrigerant and R744 varies with evaporation temperature at different outlet temperatures of condenser: (a) Tco = 273 K; (b) Tco = 278 K; (c) Tco = 283 K.
Figure 23.
Comparison of discharge temperature of azeotropic refrigerant and R744 varies with evaporation temperature at different outlet temperatures of condenser: (a) Tco = 273 K; (b) Tco = 278 K; (c) Tco = 283 K.
Figure 24.
Comparison of COP of azeotropic refrigerant and R744 varies with evaporation temperature at different outlet temperatures of condenser: (a) Tco = 273 K; (b) Tco = 278 K; (c) Tco = 283 K.
Figure 24.
Comparison of COP of azeotropic refrigerant and R744 varies with evaporation temperature at different outlet temperatures of condenser: (a) Tco = 273 K; (b) Tco = 278 K; (c) Tco = 283 K.
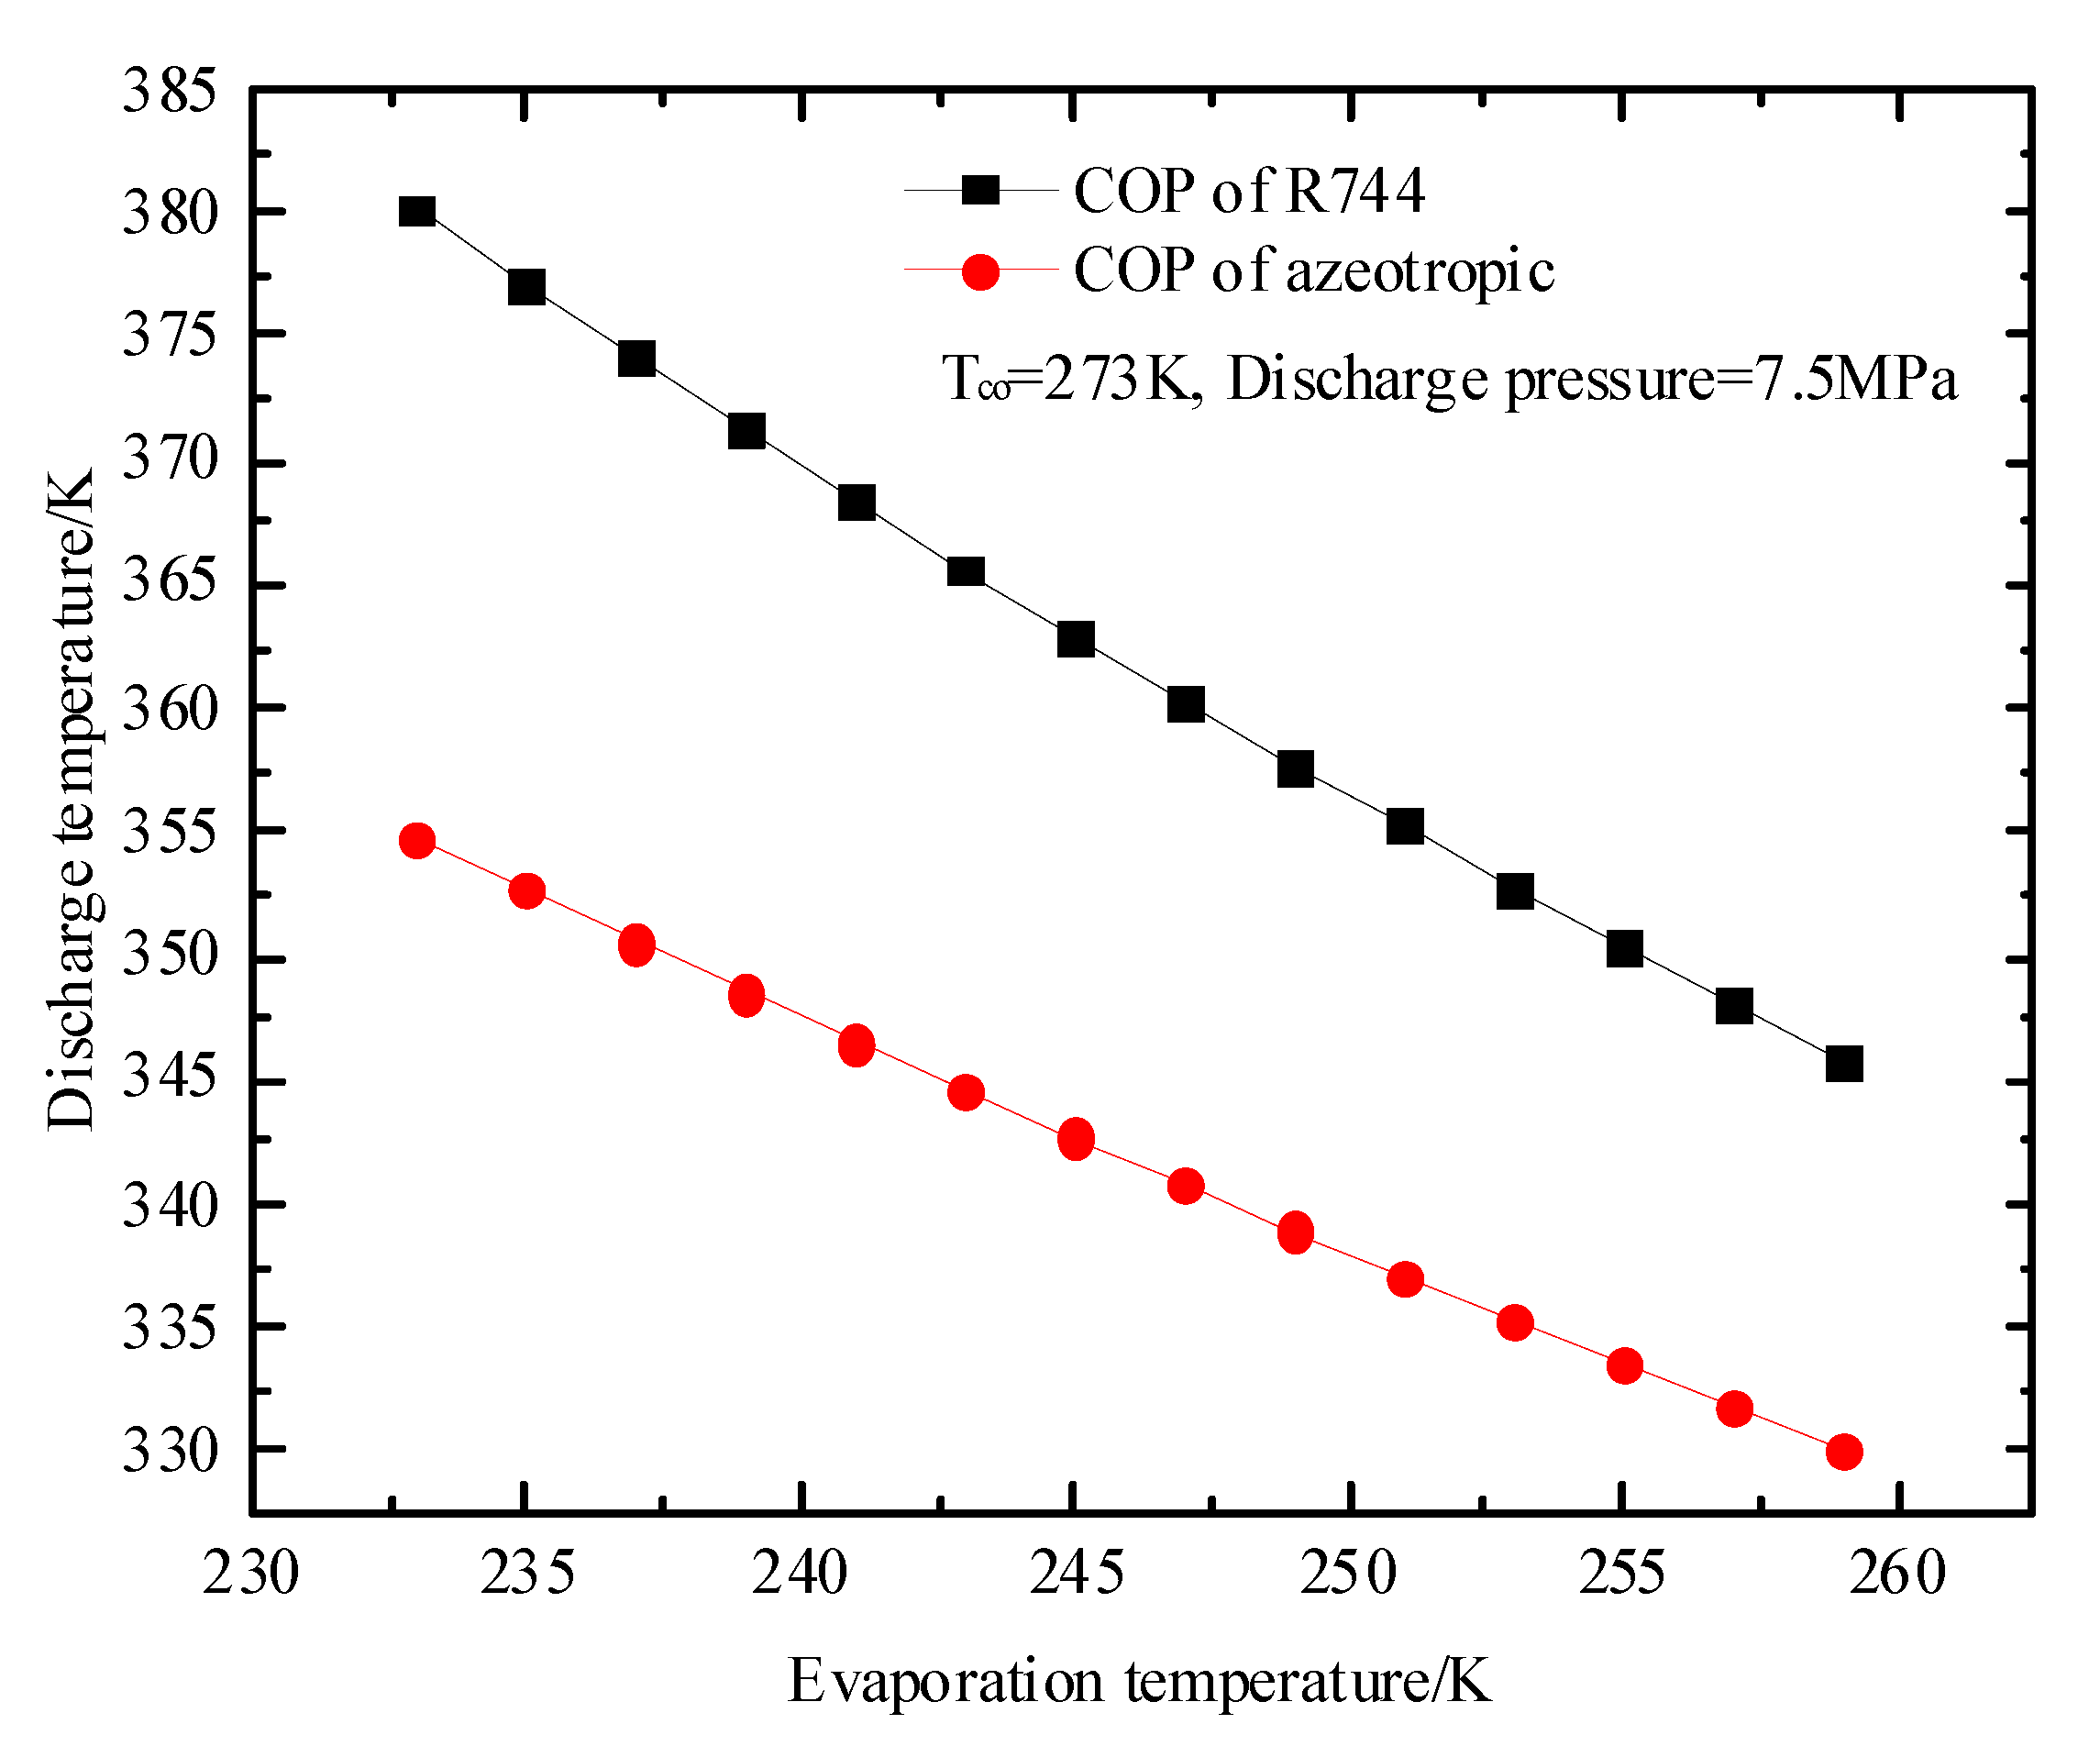
Figure 25.
Comparison of discharge temperature of azeotropic refrigerant and R744 varies with evaporation temperature at different outlet temperatures of condenser.
Figure 25.
Comparison of discharge temperature of azeotropic refrigerant and R744 varies with evaporation temperature at different outlet temperatures of condenser.
Table 1.
Simulation conditions.
Table 1.
Simulation conditions.
| Case | D (mm) | G (kg/m2·s) | Q (kW/m2) | Psat (MPa) | Tsat (K) |
|---|
| R744 | 1 | 50/75/100 | 10/20/30 | 2.3/3.03/3.92 | 253/263/273 |
| azeotropic refrigerant | 1 | 50/75/100 | 10/20/30 | 1.96/2.64/3.47 | 253/263/273 |
Table 2.
Thermophysical parameters of R744.
Table 2.
Thermophysical parameters of R744.
| Parameter | R744 | R744 | R744 |
|---|
| Tsat (K) | 253 | 263 | 273 |
| (kg/m3) | 1032.4 | 983.7 | 928.33 |
| (kg/m3) | 51.45 | 70.85 | 97.18 |
| CPL (kJ/(kg·K)) | 2.1636 | 2.3046 | 2.5377 |
| CPV (kJ/(kg·K)) | 1.2867 | 1.5050 | 1.8578 |
| (mW/(m·K)) | 134.82 | 122.72 | 110.61 |
| (mW/(m·K)) | 15.069 | 16.928 | 19.621 |
| (μPa·s) | 1.4 × 10⁻⁴ | 1.2 × 10⁻⁴ | 1.0 × 10⁻⁴ |
| (μPa·s) | 1.31 × 10⁻⁵ | 1.38 × 10⁻⁵ | 1.4 × 10⁻⁵ |
| hgf (kJ/kg) | 282.78 | 259 | 231.35 |
| (N/m) | 8.62 | 6.53 | 4.57 |
| Psat (MPa) | 1.96 | 2.64 | 3.47 |
Table 3.
Thermophysical parameters of the azeotropic refrigerant.
Table 3.
Thermophysical parameters of the azeotropic refrigerant.
| Parameter | Az-Refrigerant | Az-Refrigerantv | Az-Refrigerant |
|---|
| Tsat (K) | 253 | 263 | 273 |
| Liquid density (kg/m3) | 748.9 | 704.14 | 649.59 |
| Vapor density (kg/m3) | 58.99 | 81.49 | 114.01 |
| L of specific heat capacity (kJ/(kg·K)) | 2.5278 | 2.8231 | 3.4261 |
| V of specific heat capacity (kJ/(kg·K)) | 1.7603 | 2.1978 | 3.1137 |
| T-conductivity of l (mW/(m·K)) | 109.53 | 98.56 | 87.47 |
| T-conductivity of v (mW/(m·K)) | 17.54 | 20.53 | 25.54 |
| Liquid viscosity (μPa·s) | 0.9 × 10⁻⁴ | 0.78 × 10⁻⁴ | 0.65 × 10⁻⁴ |
| Vapor viscosity (μPa·s) | 1.2 × 10⁻⁵ | 1.3 × 10⁻⁵ | 1.4 × 10⁻⁵ |
| Latent heat of vaporization (kJ/kg) | 301.12 | 276.34 | 247.42 |
| Tension (N/m) | 5.24 | 3.56 | 2.03 |
| Psat (MPa) | 2.3 | 3.03 | 3.92 |
Table 4.
The local boundary layer grid of three grids.
Table 5.
Independent verification of grid size.
Table 5.
Independent verification of grid size.
| Number of Grids | Grid Quality | Max Relative Error of T |
|---|
| 156,104 | 1 | 0% |
| 182,104 | 1 | 0.053% |
| 226,228 | 1 | 0.081% |
Table 6.
Critical parameters of R744 and azeotropic refrigerant.
Table 6.
Critical parameters of R744 and azeotropic refrigerant.
| Parameter | Critical Pressure (MPa) | Critical Temperature (K) |
|---|
| R744 | 7.37 | 304.13 |
| azeotropic refrigerant | 4.87 | 305.32 |


