Article

Numerical Modeling of Laser Heating and Evaporation of a Single Droplet

by
Sagar Pokharel
1,*,
Albina Tropina
2,† and
Mikhail Shneider
2,†
1
Department of Aerospace Engineering, Texas A&M University, College Station, TX 77843, USA
2
Department of Mechanical and Aerospace Engineering, Princeton University, Princeton, NJ 08544, USA
*
Author to whom correspondence should be addressed.
These authors contributed equally to this work.
Energies 2023, 16(1), 388; https://doi.org/10.3390/en16010388
Submission received: 13 December 2022 / Revised: 23 December 2022 / Accepted: 23 December 2022 / Published: 29 December 2022

Abstract

:
Laser technology is being widely studied for controlled energy deposition for a range of applications, including flow control, ignition, combustion, and diagnostics. The absorption and scattering of laser radiation by liquid droplets in aerosols affects propagation of the laser beam in the atmosphere, while the ignition and combustion characteristics in combustion chambers are influenced by the evaporation rate of the sprayed fuel. In this work, we present a mathematical model built on OpenFOAM for laser heating and evaporation of a single droplet in the diffusion-dominated regime taking into account absorption of the laser radiation, evaporation process, and vapor flow dynamics. The developed solver is validated against available experimental and numerical data for heating and evaporation of ethanol and water droplets. The two main regimes—continuous and pulsed laser heating—are explored. For continuous laser heating, the peak temperature is higher for larger droplets. For pulsed laser heating, when the peak irradiance is close to transition to the boiling regime, the temporal dynamics of the droplet temperature does not depend on the droplet size. With the empirical normalization of time, the dynamics of the droplet shrinkage and cooling are found to be independent of droplet sizes and peak laser intensities.

1. Introduction

The evaporation of liquid droplets has been studied for a long time because of its applications in various fields. Popular applications include liquid fuel spray evaporation and combustion under high-pressure conditions [1], spray drying and cooling, material processing, crystal growth, medical aerosols, etc. [2]. Heating and evaporation of a liquid fuel droplet is the first important step in the ignition process. In addition, in environmental sciences, the theory of raindrops falling, fog, and cloud formation at high altitudes can be significantly improved by better understanding of the processes associated with the evaporation of liquid droplets [3]. Thus, a fundamental understanding of the droplet evaporation process and possible control of this process are of great importance for industrial engineering, bio-medical fields, and environmental sciences [1,3]. Despite the ongoing research efforts in experiments and modeling of droplet heating and evaporation, the physics of processes on the fluid–gas interface, especially for arbitrary-shaped droplets, is still not well understood [4]. One of the difficulties in mathematical modeling is connected with the fact that the phase change process at the liquid–gas interface can be in non-equilibrium thus requiring molecular dynamics or kinetic modeling approaches.
In general, the fuel droplet evaporation process includes two sub-processes: detachment of fuel molecules from the drop surface (phase change) and diffusion of the formed vapor from the surface to the ambient gas. Assuming that the fuel vapor is saturated, the evaporation process is controlled by diffusion of the vapor into the gas and can be described by hydrodynamic models of evaporation [5] starting from the classical Maxwell diffusion theory. Diffusion hydrodynamic models describe well the evaporation of large droplets, but for small droplets, the evaporation process is limited by detachment and release of fuel molecules from the droplet surface. In that case, we have the so-called depletion or kinetic regime of evaporation, and kinetic or molecular dynamics models are needed. A comprehensive description of results and unsolved problems in modeling the heating and evaporation of spherical and non-spherical fuel droplets is presented in review papers [4,6]. The analytical solution to the problem of heat and mass transfer for axisymmetric spheroidal droplets is shown in [7]. Zhang [8] developed a detailed numerical model for studying the evaporation of suspended droplets in high-pressure environments, which included real gas effects and solubility of inert species. Other models, which include the non-uniformity of the droplet temperature, effects of the internal circulation inside the droplet, and Stefan-flow, are formulated in the papers of Abramzon and Sirignano [9]. Those models are extensively used as evaporation models in CFD calculations.
When laser radiation is used to heat a liquid droplet due to a possibility of plasma formation near the droplet, new physical effects can be observed. In this case, droplet heating takes place via absorption of the laser radiation penetrating the droplet’s surface, followed by the evaporation process. An optically transparent large fuel droplet behaves as an optical focusing system thus increasing the intensity of the incident laser radiation inside the droplet. Another effect is connected with the negative charge accumulation on the droplet due to the attachment of electrons from the surrounding plasma thereby introducing a strong electrostatic force on the droplet. Surface reactions and penetration of excited species through the liquid droplet interface can also take place [10]. It was shown in [11], that applying an external voltage across the droplet causes an appearance of the ionic wind, which in turn enhances heat transfer on the droplet interface. Possible control of the heating and evaporation processes using laser energy deposition is also attractive for modern aerospace applications, e.g., efficient mixing, ignition, and combustion of liquid fuel droplets, laser wave propagation/attenuation in remote sensing, bleaching, control of size distribution of droplets, etc. [12,13,14,15]. Thus, understanding effects connected with the laser irradiation of liquid droplets is highly desirable. In this paper, we consider the first step toward the research related to the controllable heating and evaporation of ethanol ( C 2 H 5 O H ) droplets using continuous and pulsed laser energy irridation as shown in Figure 1, which can be further extended to study the non-equilibrium laser-plasma formation and its interaction with the droplet. Due to the advantageous properties of ethanol (renewable and biodegradable fuel and high latent heat) it is considered an alternative to conventional fuels [16]. Evaporation due to heating from ambient for ethanol and ethanol/diesel blends have been the focus of various recent studies [17,18].
The absorption of laser radiation by a spherical droplet can be characterized by the Mie size parameter α = 2 π R λ n , where R is the radius of the droplet, λ is the wavelength of the laser, and n is the refractive index of the gas medium. For small α , the internal distribution of the electric field, as well as the temperature distribution within the droplet, can be considered uniform. For droplets with α > 1 , as the thermal conductivity of liquid ethanol is high compared to the gas phase, it can be assumed that the absorption of laser radiation is uniform if the intensity is not high enough to transition to explosive evaporation. To describe the uniform laser radiation absorption in spherical droplets, an approach similar to [19,20] can be used, where the authors derived simple approximate expressions for the absorption efficiency factor on the basis of Mie theory [21] for an arbitrary droplet size. Similar approaches can be found in other literature sources [22,23,24]. The liquid droplet interacts with the surrounding gas through mass, momentum, and energy exchanges. A hydrodynamic model based on the thermodynamic equilibrium at the droplet interface, attributed to Maxwell, suggests that the vapor concentration in the vicinity of the droplet surface is saturated and the rate of evaporation is controlled by the diffusion of vapor to the ambient gas. Following the hydrodynamic model, the commonly known D 2 law provides a relationship between the diameter of the droplet and the vaporization time, assuming uniform temperature and steady evaporation. The reliability of the hydrodynamic models could be increased by the use of jump conditions across the Knudsen layer (the thin region between the liquid droplet interface and the hydrodynamic region). Most empirical correlations for droplet heating and evaporation are integrated through the gas phase with thermophysical properties taken at the reference gas state and include empirical correlations, as functions of the Nusselt ( N u ) and Sherwood ( S h ) numbers, based on previous analytical, computational, and experimental studies [4]. Since the evaporation process of an isolated droplet at small α is spherically symmetrical, there is no need for multi-dimensional models. Laser heating and evaporation of isolated droplets, below the breakdown threshold for the ambient gas, are also spherically symmetric, provided that the waist of the laser is large compared to the size of the droplet ω 0 > R d . However, an immediate extension to simulate multiple droplets (array of droplets) or interaction with inhomogeneous ambient surrounding (laser-induced plasma) requires a multidimensional model. Thus, a general two-dimensional axisymmetric model of droplet heating and evaporation was developed using the open-source library OpenFOAM. To develop a consistent model for the fuel droplet interaction with the laser pulse, Navier–Stokes and species concentration equations should be coupled with the diffusion dominated droplet evaporation model. In this paper, we present a two-dimensional mathematical model of the laser heating and evaporation of the ethanol droplet, which can be extended to include the laser plasma formation and interaction.

2. Formulation of the Model
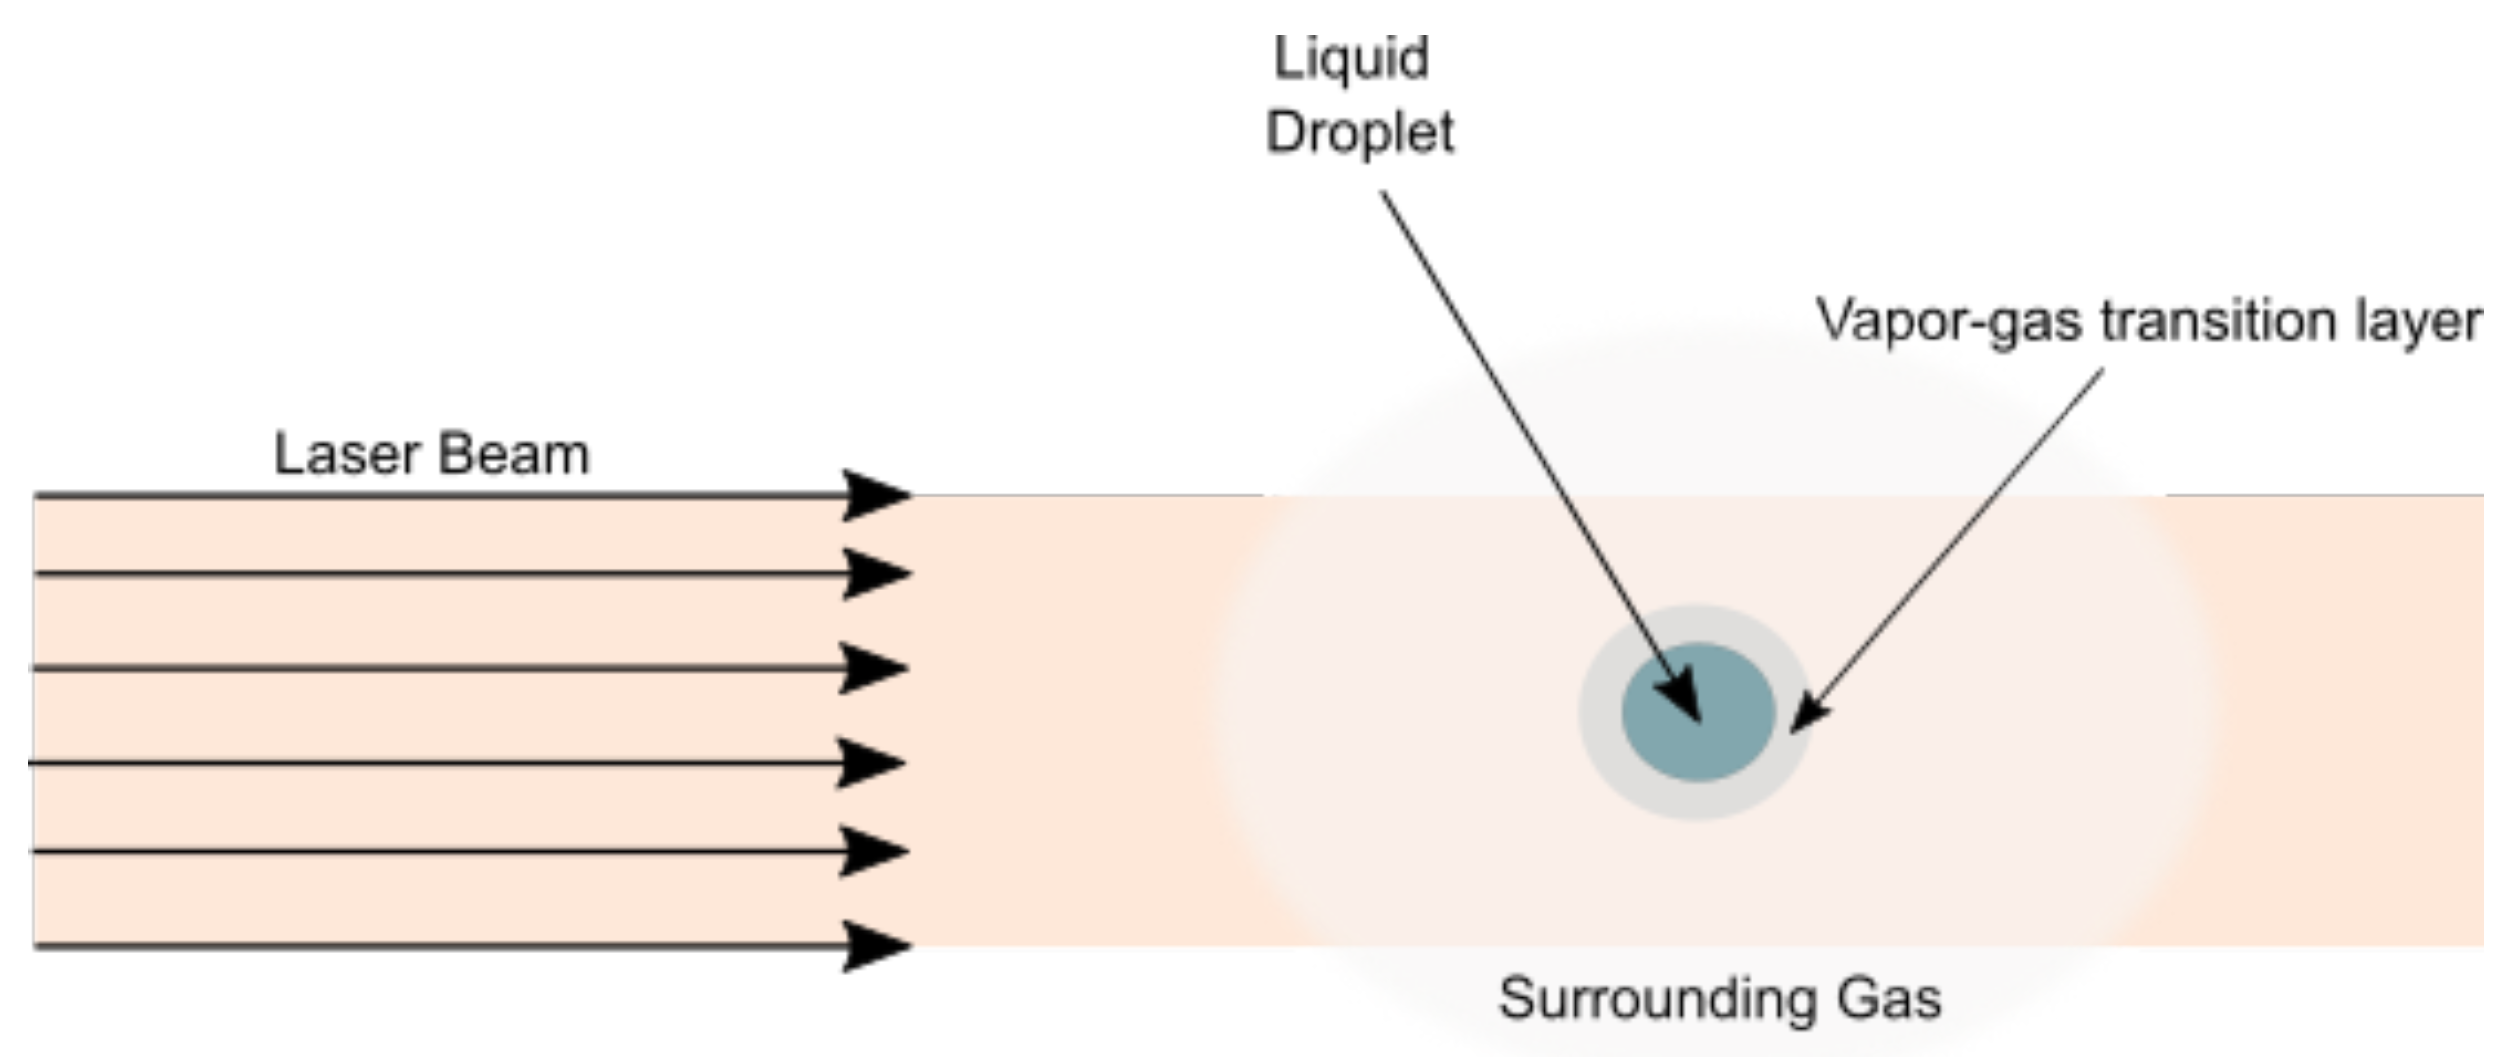
2.1. Liquid Droplet

Although the size of the droplet decreases due to the evaporation process, it is considered to remain spherical and uniformly heated so the equation for the total enthalpy of the droplet is sufficient to describe the heating and evaporation process in the droplet. The effects associated with the internal circulation, Kelvin effect, and droplet breakup are neglected because of their relatively weak influence on heating and evaporation of micro-meter-sized droplets under consideration.
Integration of the energy equation over the spherically symmetrical droplet volume gives Equation (1), which describes the evolution of temperature of the droplet in time [22,25]. Because the thermal conductivity of the liquid is high compared to the gas phase, uniformity of the temperature distribution inside the droplet is assumed to be achieved instantaneously relative to equivalent energy equilibration in the gas phase (≈1 ms compared to 10 ms). Only for the case of relatively high laser intensity, corresponding to the explosive regime of evaporation, a nonuniform distribution of temperature inside the droplet is important [22]. Here, we present results for the so-called slow heating regime and, therefore, an integrated approach for heating and absorption is considered. Since we are not solving the equation for the temperature distribution inside the droplet, the heat flux at the surface K D T L r R must be replaced by a consistent energy balance [25] at the interface, which results in Equation (2).
Here, C p , D / g is the specific heat capacity at constant pressure for the droplet(D) or gas (g). T D is the integrated temperature inside the droplet, T D 0 is the initial droplet temperature, while T g is the temperature of the bulk gas. ρ D / g / v is the mass density for a drop, gas, or vapor. Similarly, K is the thermal conductivity, U is the bulk velocity normal to the interface, and R is the radius of the droplet. The mass and energy flux are m f and w f , respectively. The mass flux, w f , is calculated using Equation (3), which results from the energy balance at the liquid droplet interface. Q v is the rate of heat absorption by the liquid droplet due to laser radiation and L is the latent heat of vaporization.
C p , D d ( 4 / 3 π R 3 ρ D T D ) d t = 4 π R 2 K D T L r R + Q v
4 / 3 π R 3 ρ D C p , D d T D d t = 4 π R 2 m f ( L + C p , D ( T g T D ) ) + 4 π R 2 w f + Q v
w f = K g T g r | R ρ g U C p , g T g | R m f 3 2 ρ v 2
d R d t = m f ρ D
The energy flux through the interface, w f , includes thermal conduction through the gas phase (first term on the right-hand side of Equation (3)), heat convection, and kinetic energy flux (second and third terms on the right-hand side of Equation (3), respectively). The latter result from the induced flow of the ethanol vapor. The term m f C p , D ( T g T D ) in Equation (2) represents the enthalpy flux connected with the shrinkage of the droplet surface due to evaporation. Because of the droplet surface shrinkage, an additional equation, Equation (4), for the temporal evolution of the droplet radius, along with Equation (2) is solved. To close the system of Equations (2) and (4), the initial radius and temperature of the droplet R ( t = 0 ) = R 0 and T D ( t = 0 ) = T D 0 are provided. The boundary conditions at the interface are set through the specification of energy and mass fluxes w f , m f , which are taken from the hydrodynamic part of the model.

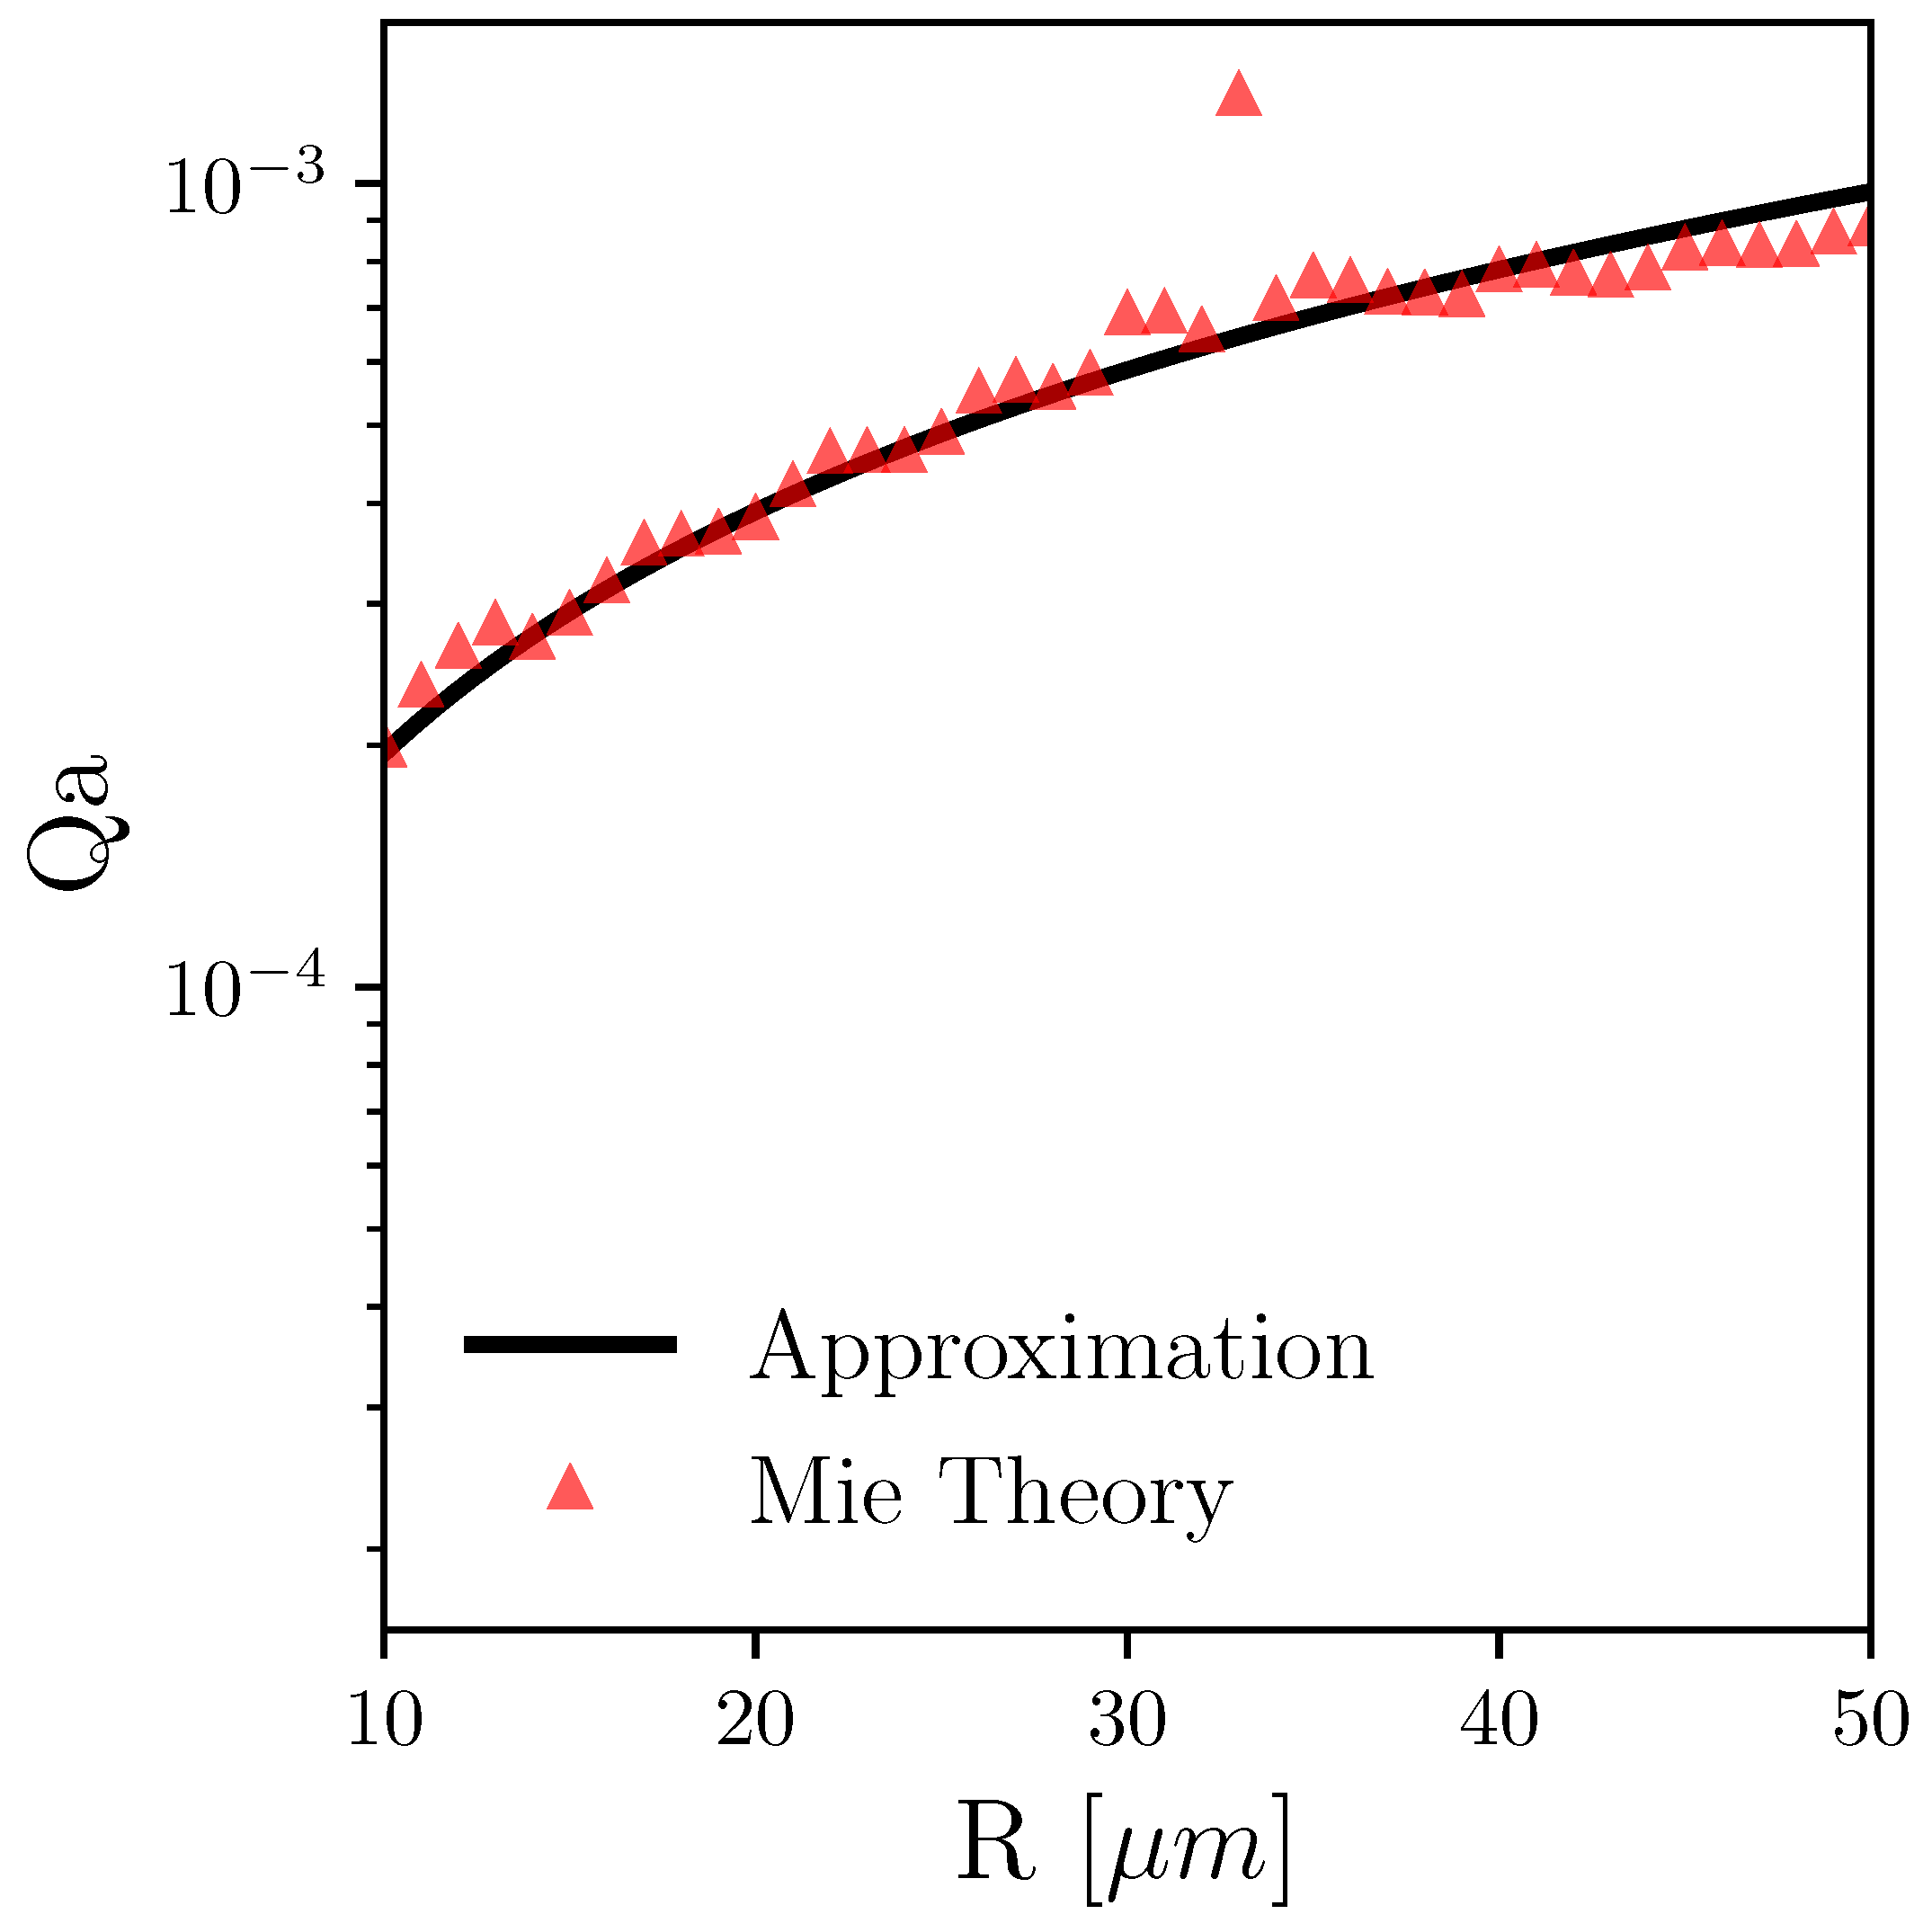
2.2. Absorption of Laser Radiation

In this study, we consider uniform heating from linearly polarized light, the effects of absorption of laser radiation by the surrounding gas are neglected, and gas ionization is also neglected because the intensity of the laser is considered to be well below the ionization threshold of the ambient gas. Uniform absorption of laser radiation by the droplet is approximated as Q v = Q a I L 0 π R 2 , where I L 0 is the laser intensity. Q a is the absorption efficiency factor, which, according to the Mie theory [21], can be found using Equation (5). The deviation from uniform absorption increases with the drop size, but for the sizes considered here, the assumption of uniform absorption is valid. The semi-empirical expression [19,24], utilized to approximate the efficiency factor of absorption from the Mie theory is Q a = 4 n n + 1 2 ( 1 e x p ( 8 π k R / λ ) ) , where n and k are the real and imaginary parts of the complex refractive index of the liquid droplet, respectively, and λ is the laser wavelength. Comparison between the efficiency factor of absorption calculated by the approximate expression and using the Mie theory 5 is shown in Figure 2, which justifies the use of the approximate equation for Q a . Here, m = n i k is the complex refractive index, x is the Mie size parameter, and the Mie coefficients, a k and b k are defined as follows; ψ k and ζ k are the Riccati–Bessel functions.
Q a = 2 x 2 k = 1 ( 2 k + 1 ) R e ( a k ) | a k | 2 + R e ( b k ) | b k | 2
a k = ψ k ( x ) ψ k ( mx ) m ψ k ( x ) ψ k ( mx ) ζ k ( x ) ψ k ( mx ) m ζ k ( x ) ψ k ( mx )
b k = m ψ k ( x ) ψ k ( mx ) ψ k ( x ) ψ k ( mx ) m ζ k ( x ) ψ k ( mx ) ζ k ( x ) ψ k ( mx )
Figure 2. Efficiency factor of absorption, Q a , against radius of the droplet, R.
Energies 16 00388 g002

2.3. Hydrodynamic Part of the Model

Equations for temperature and species conservation and the Navier–Stokes equations for the gas phase form the hydrodynamic portion of the mathematical model.This model provides the necessary boundary conditions for the energy and mass fluxes, which are required for coupling with the heating and evaporation model described in the previous section. The hydrodynamic model includes equations of conservation of the mass (Equation (6)), momentum (Equation (8)), and thermal energy (Equation (9)) of the fluid. Furthermore, equations for the conservation of individual species (Equation (7)) are also included. The system of equations (Equations (6)–(9)) forms a complete model describing the behavior of a multi-component mixture in the gas phase. More detailed information on the formulation of the multi-component gas phase model can be found in [5].
ρ t + · ρ v = 0 ,
ρ Y k t + · v ρ Y k = · D ρ Y k ,
( ρ v ) t + · ρ v v = p + · τ ,
ρ h t + · ρ v h + ρ k t + · ρ v k = d p d t + · τ · v + · ( K h ) ,
where τ is
τ i j = μ ( v i x j + v j x i 2 3 v k x k δ i j )
Here, τ i j represents the components of the viscous stress tensor, h is the mass specific enthalpy, and k is the kinetic energy. In the system of Equations (6)–(9), ρ , v , and p are density, velocity, and pressure, respectively. Y k is the mass fraction of species k, while D and K are the mixture thermal conduction coefficient and mixture averaged diffusion coefficient. To close the set of equations we use the equation of state
p = ρ R u T k N s Y k M w , k ,
where R u is the universal gas constant and M w , k is the molecular weight of species k.
The momentum exchange between the droplet and the gas phase is neglected. With the specification of the normal bulk velocity U, the concentration of the ethanol vapor Y v and the surface temperature of the droplets T D at the droplet interface, the hydrodynamic part of the model is coupled with the heating and evaporation model. The vapor mass flux m f = ρ Y v U D ρ Y v is substituted in Equation (3) resulting in the required total mass and energy flux for the evaporation model. After the energy and mass flux are specified, equations of the evaporation model can be integrated in time to find the updated average temperature and radius of the droplet. With no momentum exchange, a zero gradient in pressure was assumed at the interface. The Clausius–Clapeyron equation is used to determine the mass fraction of ethanol vapor at the interface using the updated pressure and droplet temperature T D . Only a normal bulk velocity is assumed to exist at the droplet interface, which is specified from the calculated mass flux as U = m f / ρ . Because the mass flux of species, except the fuel vapor, is zero, the total mass flux at the interface is equal to the total vapor mass flux. The remaining boundary conditions for the concentration of species Y k must be specified at the interface. We assume that the mass flux of species (other than vapor) normal to the interface is zero and use this condition to find Y k at the interface by formulating a Robin-type boundary condition.
Γ k = U ρ Y k D ρ Y k = 0
The thermodynamic properties of the liquid, vapor, and ambient gas of ethanol depend on the temperature. We use a mass-averaged approach for the thermodynamic properties of the mixture and the Wilkes mixing rule [26] for the transport properties. The latent heat of vaporization and saturated vapor pressure are also functions of temperature taken from the NIST database. Other properties of ethanol in the liquid and vapor phase were collected from different sources [27,28,29,30] and are provided in Appendix A.

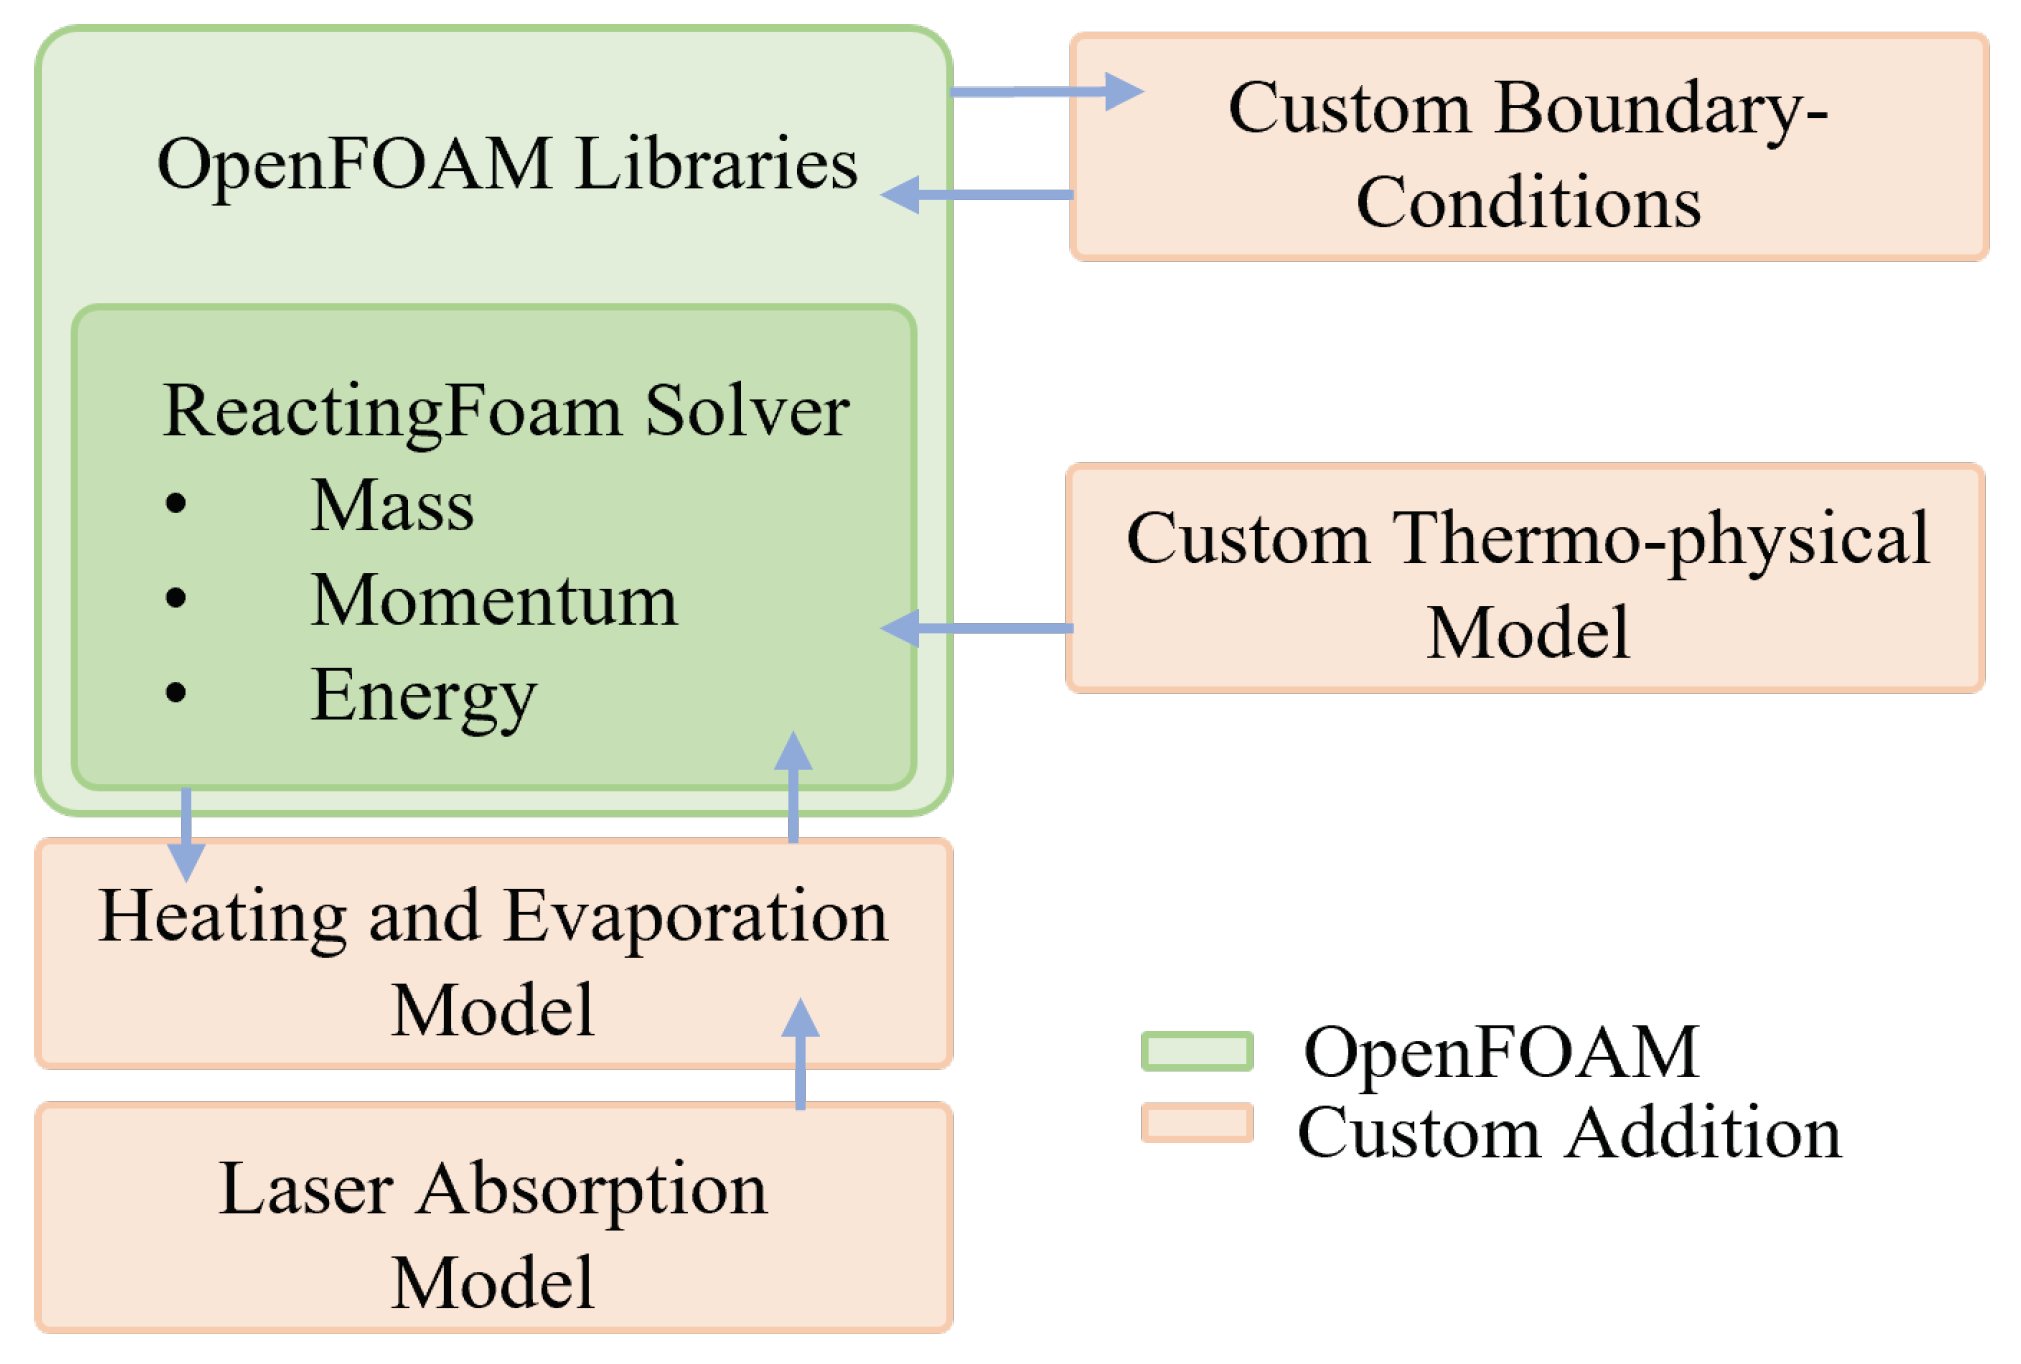
2.4. Numerical Procedure

To solve the system of Equations (6)–(9), we developed a numerical solver using the finite-volume framework of libraries from OpenFOAM [31]. The open-source solver reactingFoam of OpenFOAM-v6 (OF) was extended to include the required thermophysical model for the vapor-air mixture. Similarly, we added the laser absorption model and the evaporation model combined with custom boundary conditions at the interface. Figure 3 shows the schematic diagram explaining the interplay between available OpenFoam libraries and added sub-sections specifically for the current work. As coupling between velocity and pressure is important for stability and for the accurate capturing of the induced Stefan flow velocity, we choose the PIMPLE algorithm with a bounded implicit Euler scheme for temporal integration. The convective and diffusion terms were discretized by the upwind-biased second-order scheme and Gauss linear scheme with non-orthogonality correction, respectively.

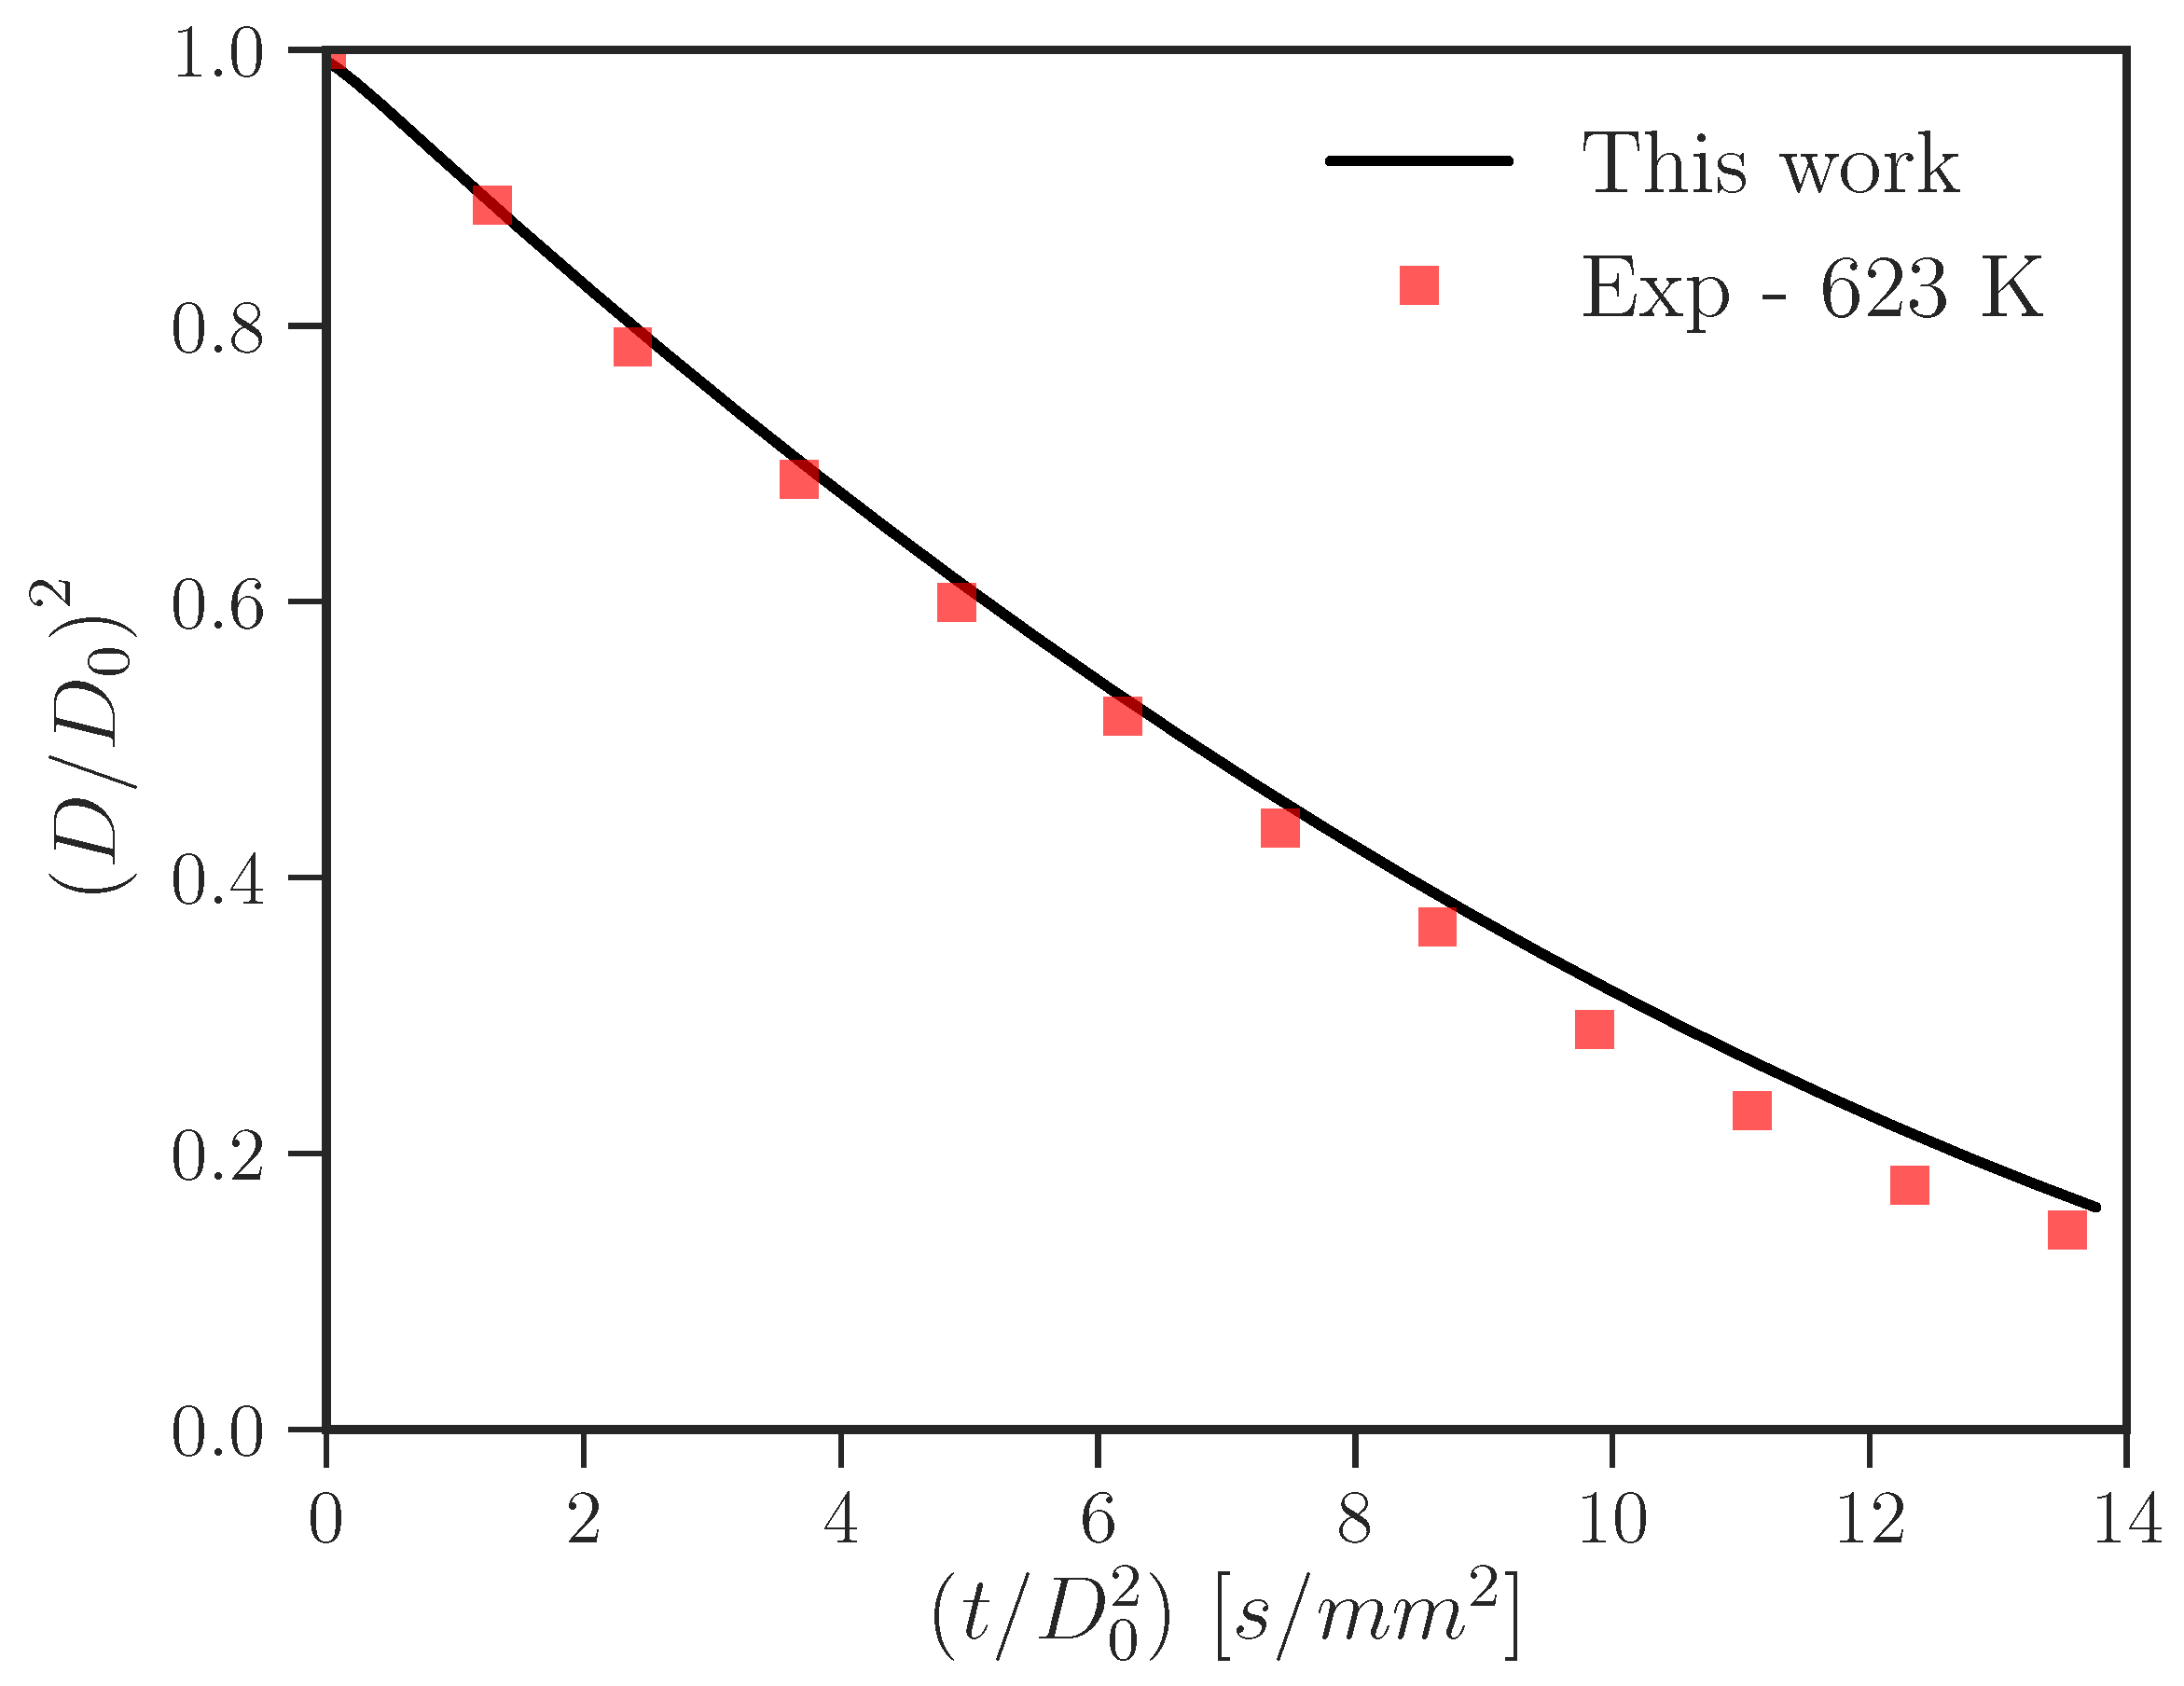
2.5. Verification and Validation of the Code

In an experimental study, Ref. [32] considered the evaporation of isolated ethanol droplets at atmospheric pressure for several ambient gas temperatures ranging from 373 to 623 K. A special experimental setup was designed to minimize the conduction loss from the droplet to the fiber holding the droplet. We choose a case with the initial droplet diameter of D 0 = 500 μ m at T D = 300 K evaporating into the ambient air of temperature T g = 623 K for model validation. Figure 4 shows the temporal dynamics of the normalized diameter of the droplet. It is seen that the surface area of the droplet decreases as evaporation progresses and the so-called D 2 regime is observed for steady evaporation caused by heating from the ambient surrounding gas. However, as the droplet’s size decreases, the rate of evaporation slows and starts to deviate from the D 2 law. The larger evaporation mass flux leads to higher losses in kinetic energy from evaporating vapor molecules and loss of enthalpy from the droplet shrinkage. The good agreement observed with the experimental results shown in Figure 4 indicates that the developed model can predict the heating and evaporation of the droplet with high accuracy.
Park and Armstrong [22] formulated a model for the heating and evaporation of a water droplet continuously irradiated by a laser. For diffusion-dominated heating and evaporation, they formulated a zero-dimensional model, which solved for the droplet temperature T D and droplet radius R d combined with the expressions for the mass and heat loss rate. We compare our results for the water droplet with the results from [22], where the water droplet of R 0 = 10 μ m at 300 K was continuously irradiated by a CO 2 laser beam of the wavelength, λ = 10.6 μ m. The domain size for the case is shown in Figure 5. Figure 6 shows the temporal evolution of the droplet temperature, T D for the different mesh sizes and compares the results with Park and Armstrong’s [22]. The fine mesh had 8750 cells with the smallest cell size being 0.3 μ m, while the coarse mesh had 5600 cells with the smallest size 0.4 μ m. Temporal dynamics of the droplet temperature is the same for fine and coarse meshes, thus our simulation results are mesh independent. As seen from Figure 6, the maximum temperature of the irradiated droplet is in good agreement for both models, but we predict a sharper increase in the droplet temperature compared to the Park and Armstrong’s model [22]. We claim that the temporal dynamics are different because of differences in the laser heating source formulation, as the use of the same optical parameters for the liquid droplet provided lower volumetric heating in the Park and Armstrong model [22]. Furthermore, the model formulated in [22] was zero dimensional in the gas phase and was based on an approximate evaporation flux for steady formulation. This led to an instant development of the vapor concentration profile from the interface in comparison to the unsteady development of the vapor concentration profile, which is also captured in our formulation. Thus, the implementation details of the kinetic energy exchange and shrinkage of droplet are not comparable directly to our model. In fact, our model is able to capture the dynamics of laser heating and evaporation of the liquid droplet with adequate accuracy.

3. Results and Discussion

We consider continuous and pulsed laser heating and evaporation of the ethanol droplet at different laser intensities and droplet sizes and compare results with the available literature data. The results presented in the following sections are for a laser wavelength λ = 1064 nm.

3.1. Continuous Laser Heating

Because studies on laser heating and evaporation of droplets have been performed mostly for water droplets, we also simulated laser irradiation of the water droplet. First, we compare the dynamics of continuous laser heating and evaporation of water and ethanol droplets with a radius of 10 μ m. The laser wavelength is taken as λ = 1064 nm with I l 0 = 10 10 W/m 2 and the initial droplet temperature T = 300 K. Figure 7 shows a comparison between the temporal dynamics of the droplet temperature and the normalized diameter squared for water and ethanol droplets. It is seen that for the same laser intensity and size of the droplet the maximum temperature of the water droplet is higher by 12 K than that of ethanol. Furthermore, because of the higher evaporation mass flow, the ethanol droplet shows a sharp decrease in the surface area. For example, at 2.5 ms, the ethanol droplet lost 70 % of its surface area, while the water droplet had lost only 40 % . For both droplets, the temperature reached a plateau after a sharp increase in evaporating fluxes. During the early heating of the droplets, t < 0.25 ms when there is essentially no conduction and evaporation losses, the temperature rise of the ethanol droplet is higher than for the water droplet. Although the absorption coefficient at λ = 1064.0 nm is higher for water compared to ethanol (see the appendix for refractive index values), a higher ρ C p in water resists changes in temperature. Peak temperature is determined by the balance of evaporation, laser absorption, and conduction loss. Thus, heating and evaporation of the ethanol droplet with a lower boiling temperature and higher evaporative losses result in a lower peak temperature.
We also provide an analysis of the heating and evaporation characteristics of ethanol droplets of different sizes R D = (10 μ m, 40 μ m). The same continuous laser heating source and ambient conditions as in Figure 7 were taken. Figure 8 shows results of the numerical simulation. The initial size of the droplet dictates the maximum temperature of the droplet. At the beginning of the simulation, when the droplet is surrounded by the ambient gas, a small difference between the vapor concentration at the droplet interface and the surrounding gas results in a sudden diffusive flux. This flux equilibrates as soon as the vapor concentration establishes a continuous profile at the interface as shown in Figure 8c. Since the initial mass flux is insignificant to the mass of the droplet, the spikes do not affect the results obtained. In the initial period of laser heating, both the mass flux (Figure 8c) and heat flux (Figure 8d) are small and negligible compared to the laser absorption. With progress in time, these losses are higher for the smaller droplet, which leads to a slower increase in the droplet temperature. Only when the maximum temperature is reached for both droplets, the mass flux and heat flux from the larger droplet exceed that of the smaller droplet. This tendency is also observed in temporal dynamics of the normalized droplet radius (Figure 8). The higher temperature of large droplets irradiated by the laser of the same intensity is connected with the balance between energy loss per unit volume and the heat energy absorbed by the droplet per unit volume. The absorbed energy per unit volume for both droplets is not significantly different. The heat flux out of the droplet depends on the temperature gradient at the interface, which is also comparable for both droplets at the initial period of laser heating because of the same initial droplet temperature. However, the total heat energy loss per unit volume is smaller for the larger droplet because it scales as q v 1 / R D . Thus, relative cooling becomes stronger as the droplet size decreases, resulting in a temperature decrease being observed later for smaller droplets, whereas in larger droplets, the heating is mainly balanced by evaporation and is maintained at a relatively constant temperature. Considering continuous laser heating, the laser intensity should be smaller than some critical intensity to guarantee that the droplet does not explode due to the very fast evaporation or that the evaporation regime will not turn into boiling. One of the ways to avoid such a transition is to use a pulsed laser for heating and evaporation, which also provides additional control of the evaporation process.

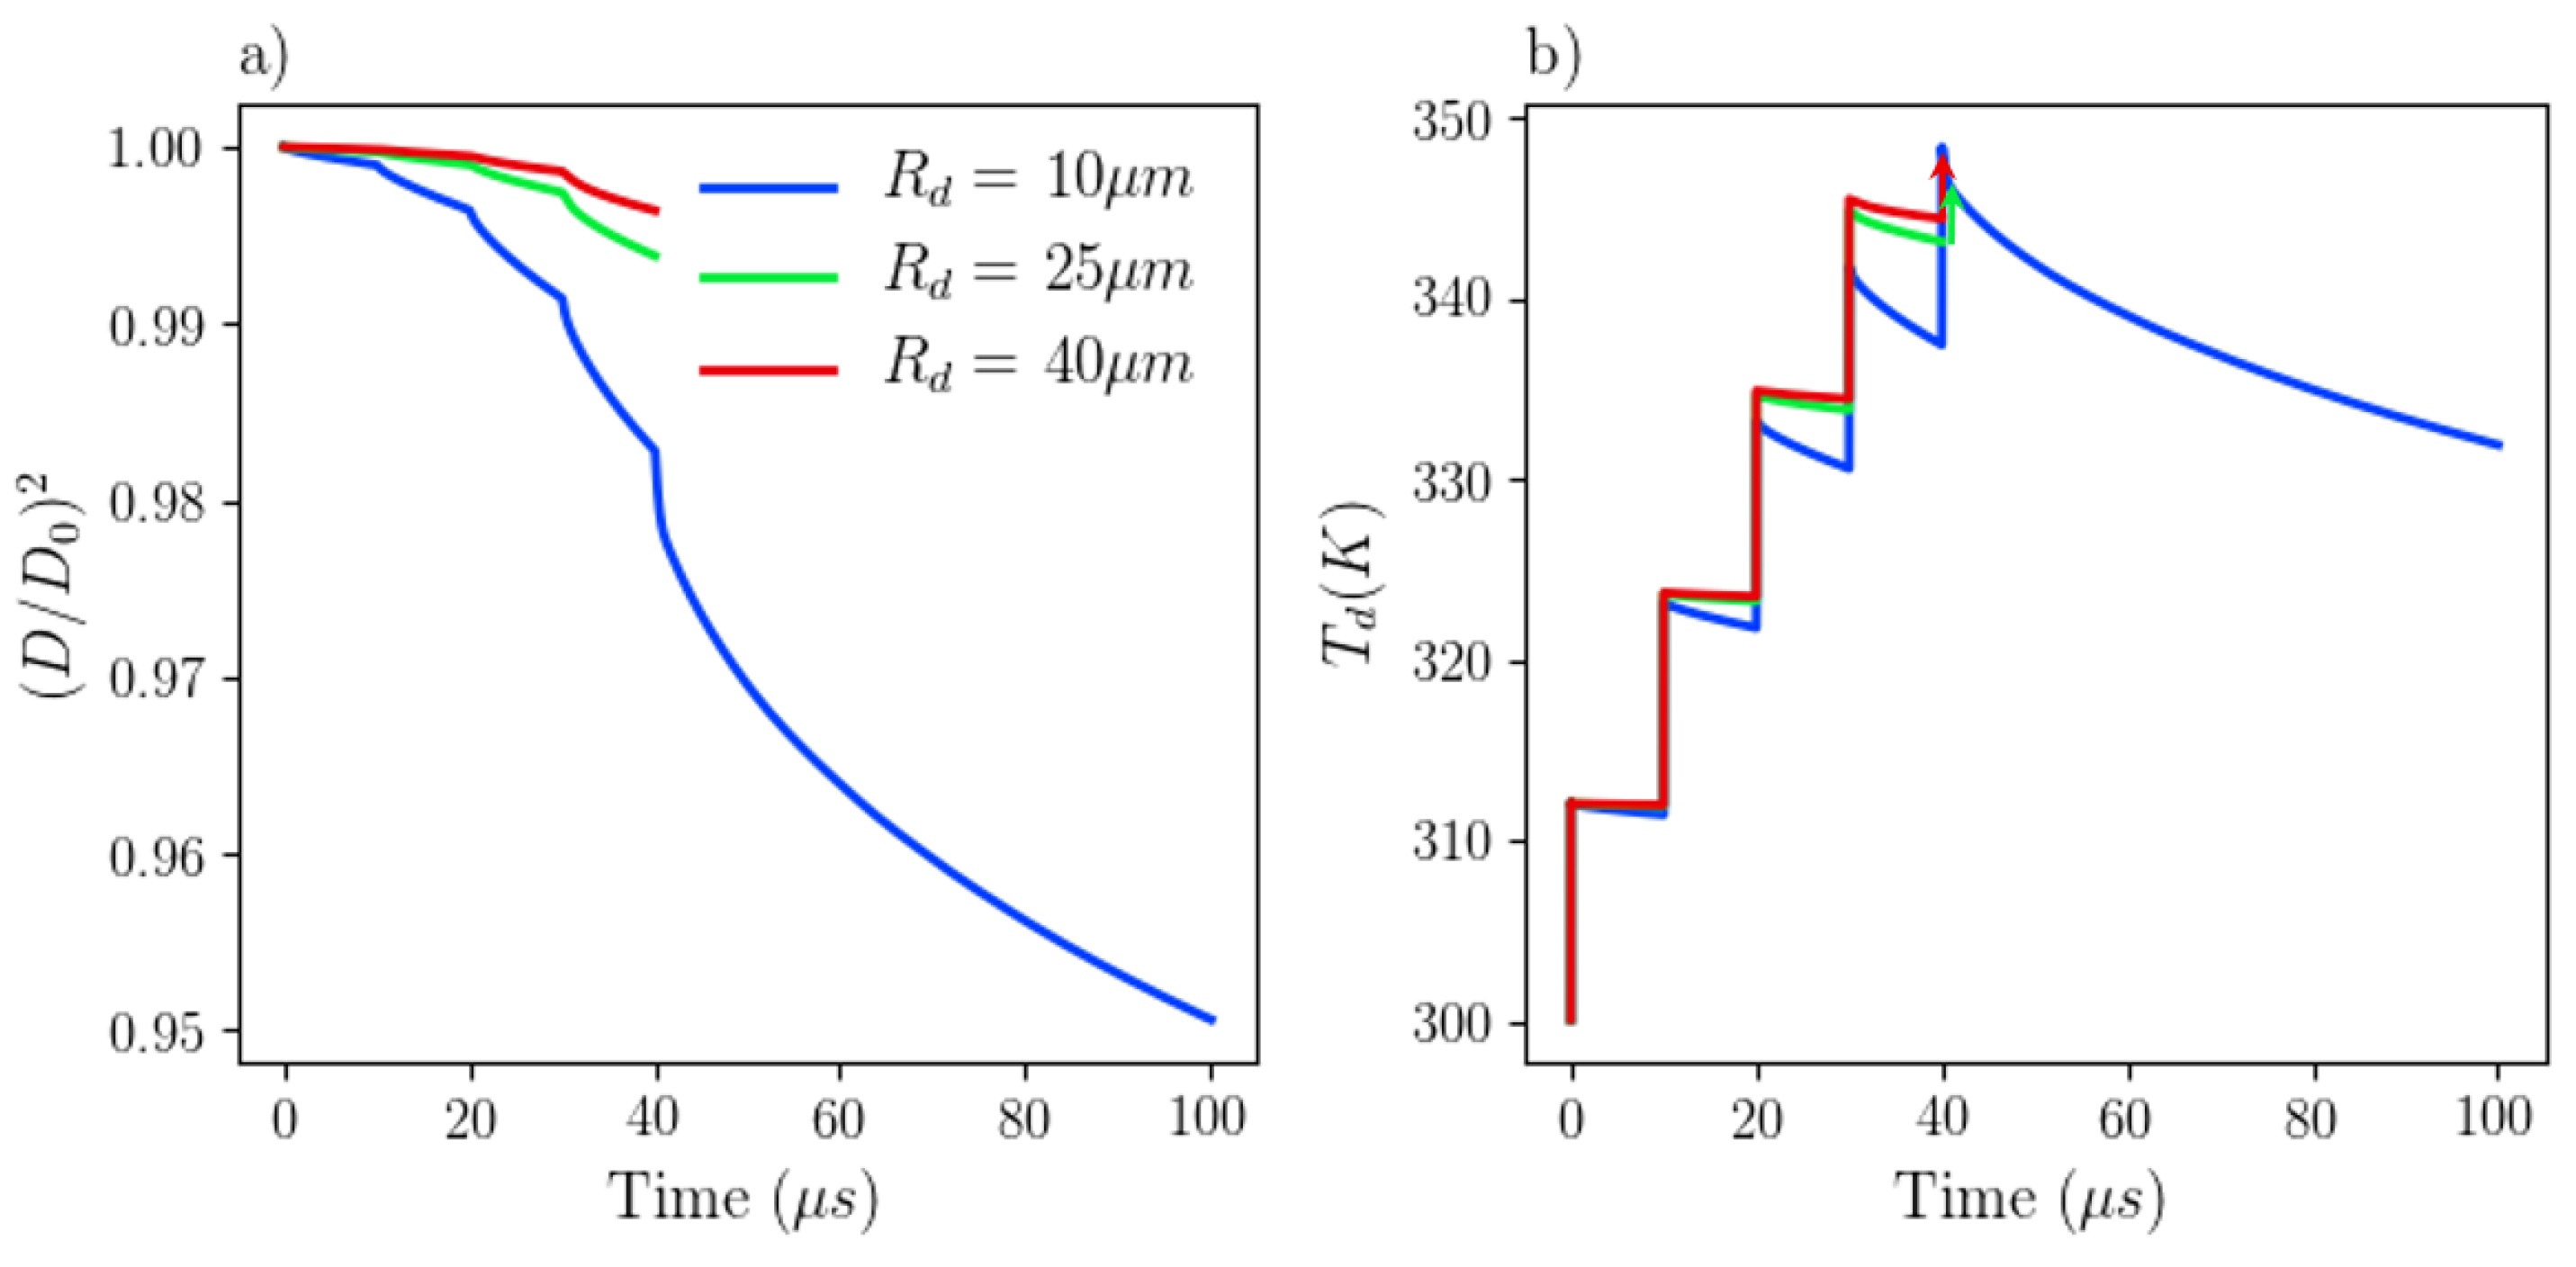
3.2. Pulsed Laser Heating

The main parameters for the simulation in this section are shown in Table 1. The laser wavelength is λ = 1064 nm with a full-width half maximum (FWHM), t p = 10 ns, and droplets evaporate into the ambient air at 300 K.
For pulsed laser heating of a droplet, because of the short duration of the single laser pulse, the evaporative processes have not yet been established. If the intensity of the laser pulse is high enough, the droplet will enter the boiling mode after absorbing enough laser radiation to reach the boiling temperature. In the cases when the peak laser intensity was I L 0 = 5 × 10 14 W/m 2 for all droplet sizes considered, see Table 1, the droplet temperature exceeds the boiling temperature at 2 ns and the evaporating process goes into the boiling regime. As seen from previous results for continuous laser heating, shown in Figure 8b, the initial rise of the droplet temperature caused by the laser irradiation is the same regardless of the droplet size. The same trend is observed for all droplets with pulsed laser heating when the high laser intensity resulted in a temperature above the boiling temperature.
A detailed look into the time required for the droplets to reach the boiling temperature as a result of the absorption of the laser radiation can aid in the laser parameter selection for desired droplet heating and evaporation dynamics. The time required for the ethanol droplets of sizes listed in Table 1 to reach the boiling temperature was recorded by varying the laser intensity and pulse width. The time to reach the boiling temperature for the droplet normalized by the FWHM of the laser for a range of intensities is presented in Figure 9. The laser pulse had a Gaussian shape in time defined by the FWHM and peak intensity. Because droplet heating was found to be independent of the droplet size (at early times for pulsed heating), results for the different sizes of droplets collapse into a single curve. Due to the higher absorption, an increase in the laser intensity causes a decrease in the time required to reach the boiling temperature and the dependence is non-linear. The time to reach the boiling temperature with a high-intensity pulse is the time required for the droplet to increase its sensible enthalpy from the initial temperature to the boiling temperature, as other heat losses are not significant on the considered timescale. Thus, at constant thermophysical properties of the liquid droplet and constant laser intensity, the time to reach boiling is given by the relation t b o i l = ( 4 / 3 ) R ρ D C p , D ( T b T a ) / ( Q a I L ) . It should be noted that t b o i l is independent of the radius of the droplet, R, because the approximation of the efficiency factor of absorption, Q a , is proportional to the radius of the droplet, R. Figure 9 also shows the analytical results for the case when the full-width half maximum, t p = 15 ns . The analytical result is slightly different from the simulation data because the simulation results were for Gaussian pulses in time. Thus, if different pulse widths and peak intensities are chosen in such a way that the integrated intensity is the same (equal fluence), t p = 15 ns, I L 0 = 2 × 10 14 W/m 2 (triangle symbol) and t p = 10 ns, I L 0 = 3 × 10 14 W/m 2 (circle symbol), then the boiling temperature of the droplet is reached after the time equal to the same percentage of the pulse width. For both laser pulses represented by symbols in Figure 9, this time is 70% of the pulse width. As the integrated energy of the laser pulse in time determines when the droplet would reach the boiling temperature, the temporal shape and peak intensity of the laser control the heating of the droplet.
The mass fraction of ethanol and the induced velocity from the evaporation process for a case of pulsed laser heating, t p = 10 ns, I L 0 = 1.0 × 10 14 W/m 2 , R D 0 = 25 μ m, is shown in Figure 10. For laser intensities that do not reach boiling, the temporal dynamics of the heating and evaporation process are shown in Figure 11. The strong radially symmetric gradient of the ethanol mass fraction at the interface, Figure 10, and a rapid increase in the temperature during the heating phase, Figure 11b, are observed. After the end of the laser pulse, conductive and convective cooling of the droplet, which are relatively slow processes, leads to small changes in the droplet temperature over time. A qualitatively similar trend in the evolution of the droplet surface temperature was shown for a water droplet heated with pulsed laser radiation [23]. It is worth noting that laser fluence F = I L 0 t p π / ( 2 l n ( 2 ) ) is often used in studies of pulsed laser energy deposition instead of laser intensity, and all the results presented in this section can be easily reformulated in terms of the laser fluence without any loss of generality. A comparison between the continuous and pulsed laser heating and evaporation has shown that the maximum temperature of droplets heated by a short laser pulse does not depend on the droplet size and depends only on the laser fluence. This was not the case for continuous laser heating when the maximum temperature was reached later in time. Figure 11d shows the conductive and convective heat flux from the droplet, which is normalized by I L 0 R D 2 . The normalized heat flux profiles for droplets of the same size followed a single profile for different intensities. It should be noted that without the normalization, the heat flux and mass flux, Figure 11c, trends were similar. This correlation between heat and mass transfer is often employed in semi-empirical models for droplet heating and evaporation. As seen from Figure 11c, the mass flux during the heating phase is higher for smaller droplets and higher intensities, in contrast to the smaller mass flux for smaller droplets only at the end of the cooling phase, t 1 ms. As a result, larger droplets cool slowly compared to smaller droplets after being heated to the same temperature, Figure 11b. It is confirmed by the results shown in Figure 11, where temporal dynamics of the normalized radius for different size droplets is presented. The smallest droplets, R d = 10 μ m, have lost all the energy gained from the laser pulse very quickly, and as a result, a decay of the normalized radius is practically flat at t 1 ms. The droplet heated by a laser pulse of the higher maximum intensity, e.g., R d = 25 μ m, I L 0 = 10 14 W/m 2 is shrinking with the same rate approximately as the smaller droplet heated by a laser pulse of the lower intensity, e.g., R d = 10 μ m, I L 0 = 0.5 × 10 14 W/m 2 . From Figure 11, it is clear how the initial heating of the droplet proceeds, t < 10 7 s. However, the dynamics of heating and evaporation and their dependence on the droplet size and intensity of laser radiation are not clear for t > 10 7 s. However, the empirical normalization of time as t ^ = t ( I L 0 / 10 14 ) 2.11 / R D 0 2 gives results which are easier to interpret for later times, as shown in Figure 12. The results show that dynamics of the droplet shrinkage in terms of the surface area and cooling in terms of the normalized temperature with the proper time normalization following the same dynamics for droplets of different sizes and peak laser intensities with the same pulse width. When the temperature of the droplet is cooled to the ambient 300 K, the trend lines are separate, as the droplet is close to equilibrium with the surrounding and does not evolve further in time.
The results for single-pulsed heating of the droplet have distinct processes of initial heating and subsequent cooling and evaporation. In repeatedly pulsed operation, a single-pulse laser operates similarly for heating and cooling of the droplets, but it provides more control with the ability to change the repetition rates. Now we consider pulsed laser heating when the laser wavelength, intensity, and repetition rate are 1064 nm, 0.5 × 10 14 W/m 2 , and 100 KHz, respectively. Five subsequent laser pulses of 10 ns pulse-width with a time delay of 10 μ s were employed for heating. It is seen that after each laser pulse, the local linear evaporation regime, also called the D 2 regime, is formed. However, in comparison to the evaporation process from ambient surrounding heating, the slope of the square of the normalized droplet radius changes with time. Thus, instead of a constant evaporation rate, we observed a gradually increasing evaporation rate. The faster cooling rate of smaller droplets causes a higher temperature decrease compared to that of larger droplets in the cooling phase. This effect being accumulated during subsequent laser pulses causes transition to the boiling regime for larger droplets, while the smaller droplets are maintained well below the boiling temperature. This is clearly seen in Figure 13b, where after the fifth laser pulse, droplets of R d = 25 , 40 μ m undergo transition to the boiling mode but the smallest droplet with R d = 10 μ m does not. Thus, by changing the laser repetition rate, it is possible to achieve a selective transition to the boiling regime for droplets of different sizes. In summary, we show that the heating and evaporation dynamics can be controlled by the laser operating parameters, such as the laser pulse width and the peak intensity. The temporal dependence of the cooling and shrinkage of the droplet can be made independent of the droplet size using proper normalization of the time axis with the peak intensity of the laser. Further control over the droplet heating and evaporation dynamics, e.g., selective transition to boiling regime, can be achieved by the use of repeated laser pulses at a specified frequency.

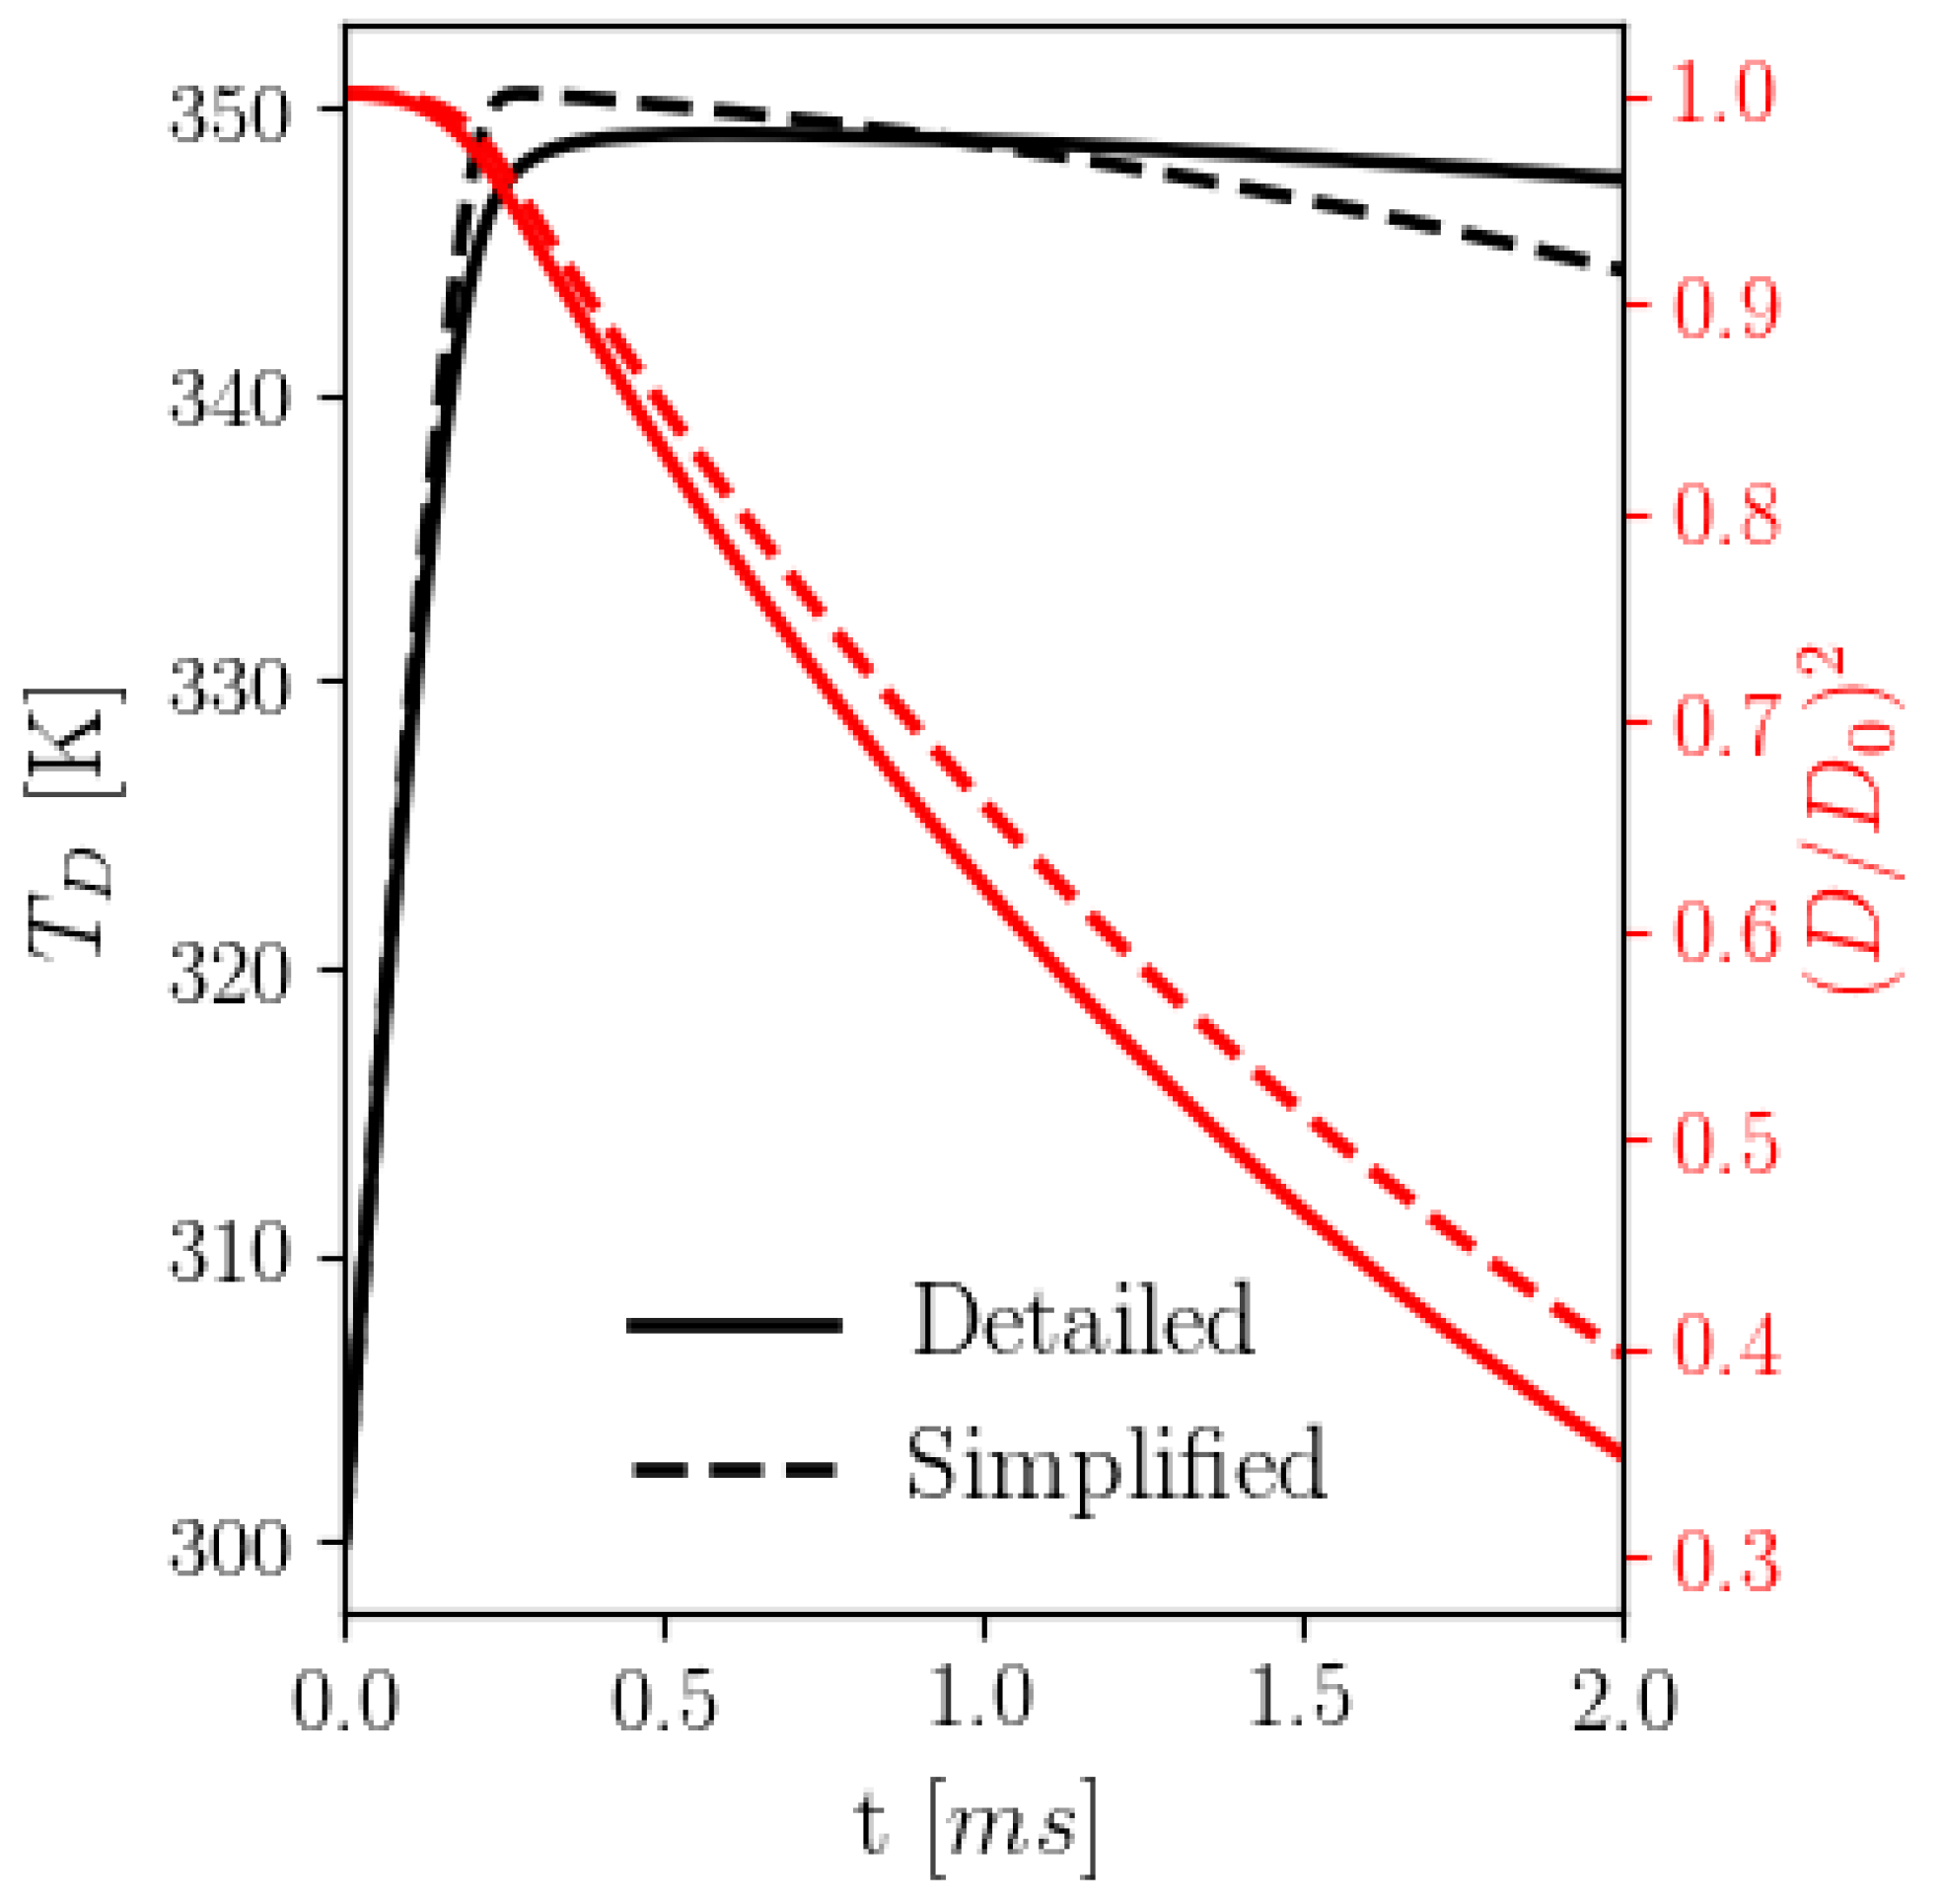
3.3. Semi-Empirical Relations

To study laser heating and evaporation of the ensemble of droplets, a more simplified model is attractive in terms of computational resources and robustness. Following the work in the literature [23,25], we used a quasi-steady assumption and considered continuous laser heating to obtain the mass and heat flux at the droplet interface. The set of Equations (2) and (4) has been integrated using a fourth-order Runge–Kutta method, with the expressions for the energy flux w ^ f = w f / I L 0 R 0 2 and for the mass flux m f given as follows.
m f = 1 R D ρ g D v l n 1 Y v , 1 Y v , 0
w ^ f = C p , g ( T D T g , ) I L 0 R 0 2 · m f e x p ( ( m f R D C p , g ) / K g ) 1 m f 3 2 I L 0 R 0 2 ρ v 2
Figure 14 shows the comparison between the results from the two-dimensional model and the simulation results with these semi-empirical expressions for fluxes. It is seen that the semi-empirical model predicts a higher peak temperature and shallower droplet shrinkage rate compared to the detailed model, but it captures the same temporal dynamics as observed in the detailed model. So the formulated expressions could be used as alternatives in studies related to an ensemble of droplets.

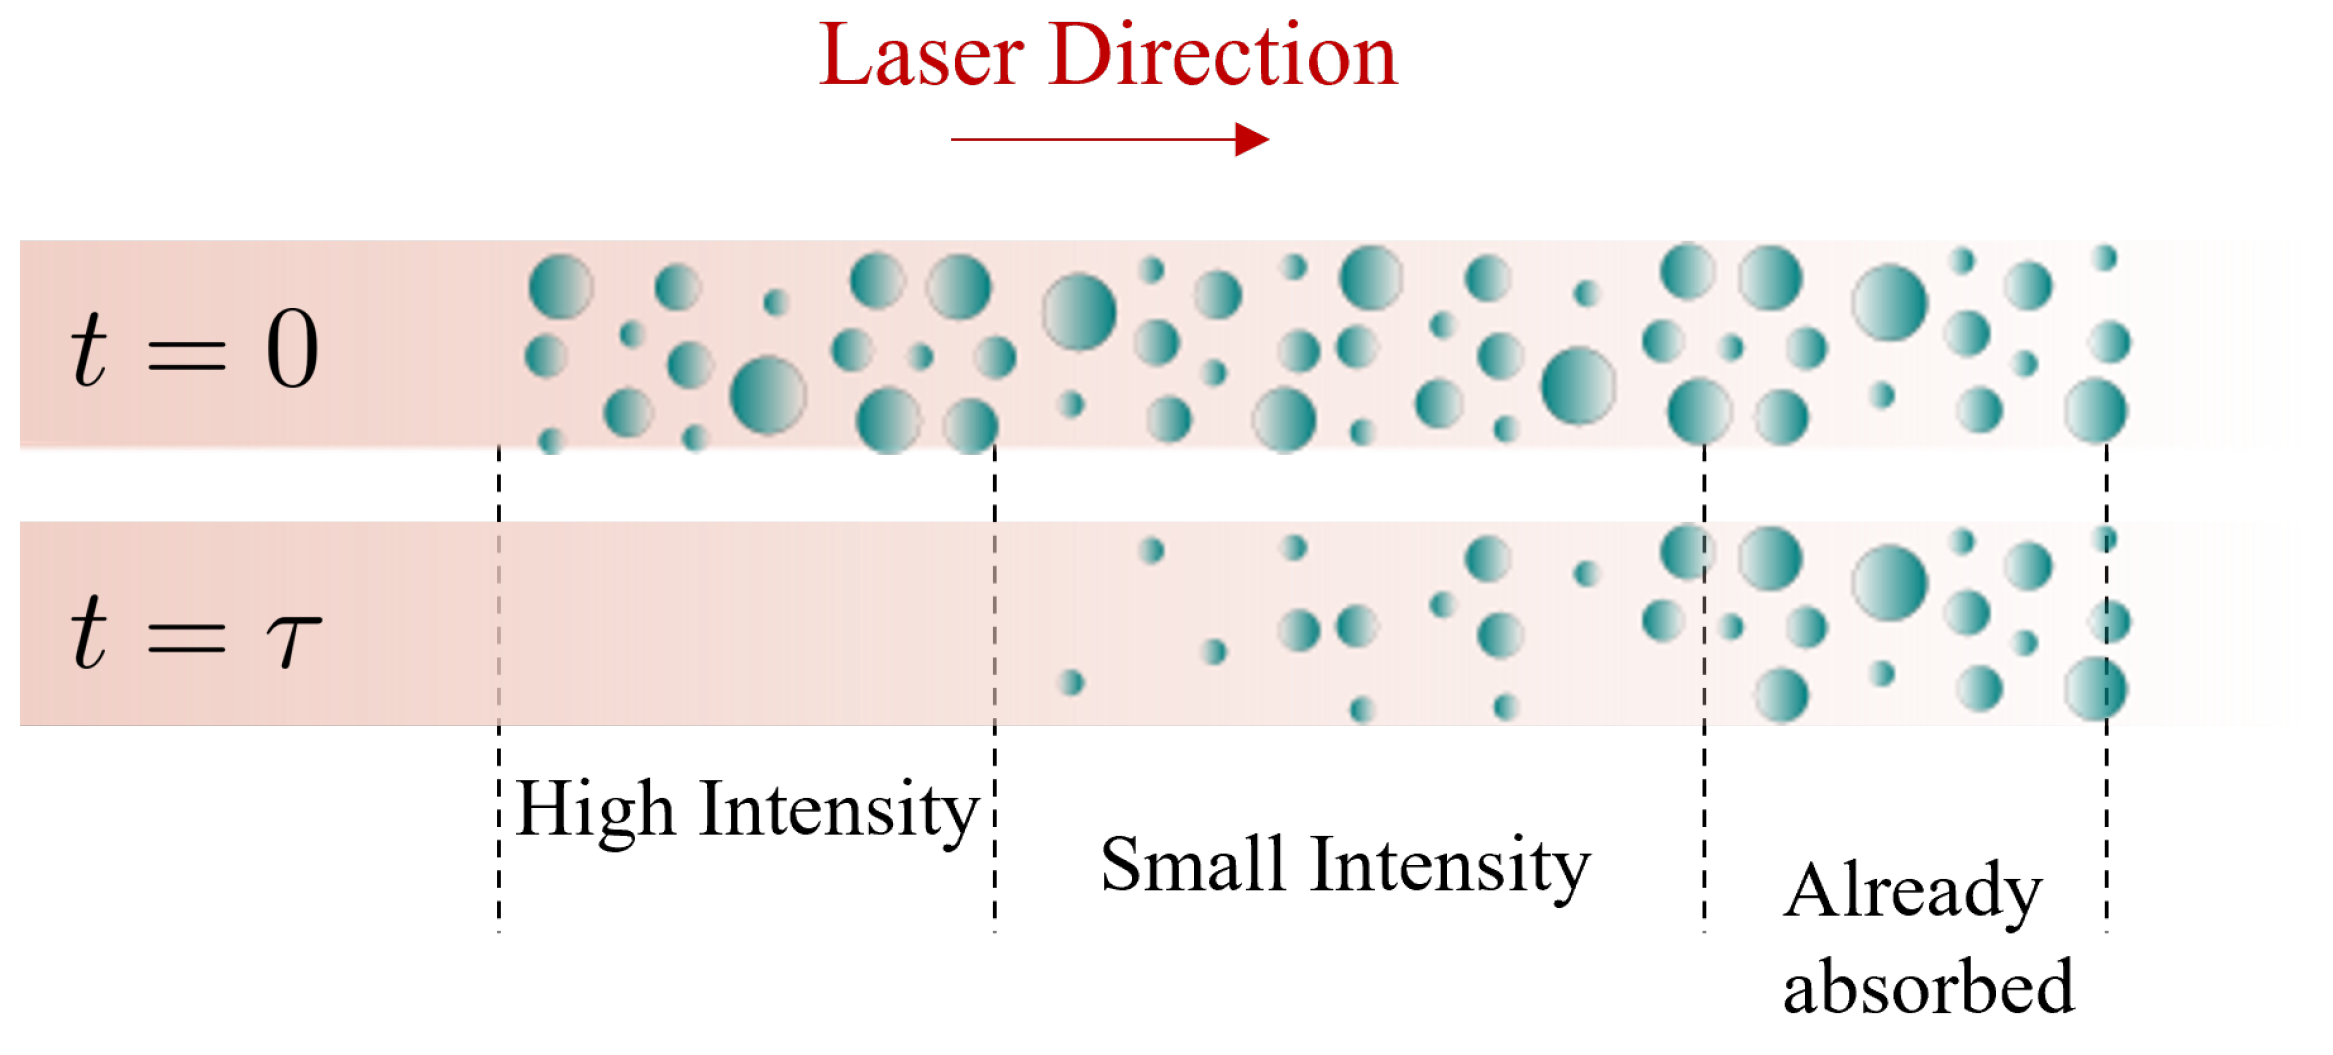
3.4. Laser Bleaching Effect

The absorption of laser radiation by liquid droplets suspended in gas makes it possible to use lasers for bleaching/clearing of the droplets along the laser propagation path. The desired path can be cleared of droplets to improve long-range communication, remote sensing applications, etc. Based on the simulation results from previous sections, we provide a qualitative description of the laser bleaching process for droplets. Consider a laser pulse propagating in air with some distribution of liquid droplets (Figure 15). Liquid droplets exceeding the boiling temperature evaporate significantly faster [15] than droplets in diffusive mode of evaporation. Thus, we can identify three different regions along the laser path. The region close to the laser source is not attenuated and has a high intensity. In this region, droplets of all sizes (≈microns) evaporate very fast due to the transition to the boiling regime. The next region has smaller intensity due to the prior partial absorption of the laser radiation. In this region, we have fast evaporation of larger droplets as they undergo a transition to the boiling regime and a gradual decrease in the size of the remaining smaller droplets. With successive attenuation and diffraction spread at longer distances, the effect of the laser radiation is not seen, and droplets remain undisturbed. Thus, the gradual evaporation of droplets over time produces the laser bleaching effect.

4. Conclusions

A mathematical model for heating and evaporation of the isolated fuel droplet by continuous and pulsed laser irradiation has been developed. We extended the capabilities of OpenFOAMv6 by adding laser absorption, evaporation, thermophysical models, and custom boundary conditions. The developed solver accurately captured the dynamics of laser heating and evaporation of the ethanol droplet in the diffusion-dominated heating regime and can be extended to include a laser plasma formation and plasma species behavior at the liquid interface. For continuous heating, a size of R c r exists for the specified laser parameters such that droplets of size R > R c r undergo a transition to the boiling regime and rapid extinction, while the droplets with R < R c r still maintain a slow decay of their size. For a single pulse laser heating with the peak irradiance close to the transition to the boiling regime, temporal dynamics of the droplet temperature followed the same dependence regardless of the droplet size. Appropriate normalization of time with the peak laser intensity unifies the dynamics of the droplet shrinkage and cooling for different droplet sizes and laser intensities. It should be noted that the inclusion of the evaporation process, conductive–convective cooling, compared with the cases where all the absorbed energy goes to droplet heating significantly decreases the maximum droplet temperature, and those effects cannot be neglected. On the basis of the simulated results, we have provided a qualitative explanation of the laser bleaching effect owing to the selective absorption of laser radiation by the ensemble of droplets. The developed model and results, although mainly related to isolated ethanol droplets, are applicable to the ensemble of isolated droplets and to various liquids and should be beneficial for novel applications in laser propagation and remote sensing. Furthermore, an increase of the laser intensity will lead to the ionization and laser plasma formation in the vapor layer, which will change the heat and mass transfer dynamics. This will provide an additional tool to control heating and evaporation processes using the laser pulse and needs further investigation.

Author Contributions

Methodology, A.T.; Software, S.P.; Validation, S.P.; Formal analysis, S.P.; Resources, A.T. and M.S.; Writing—original draft, S.P.; Writing—review & editing, A.T. and M.S.; Supervision, A.T.; Project administration, A.T. and M.S.; Funding acquisition, A.T. and M.S. All authors have read and agreed to the published version of the manuscript.

Funding

This work is partially supported by the Princeton Collaborative Research Facility (PCRF), supported by the U.S. Department of Energy (DOE) under Contract No. DE-AC02-09CH11466. S.P. and A.T. also acknowledge support from the U.S. DOE Office of Science Award No. DE-SC0022063.

Data Availability Statement

The data that support the findings of this study are provided, other extended materials can also be provided by the corresponding author upon reasonable request.

Acknowledgments

Part of this research was conducted using the advanced computing resources of the TERRA clusters provided by Texas A&M High Performance Research Computing.

Conflicts of Interest

The authors declare no conflict of interest.

Appendix A. Thermo-Physical and Optical Properties

Appendix A.1. Ethanol Liquid

Latent heat of vaporization (J/kg):
L = 1.0947 · 10 6 exp 0.4475 T / 513.9 1 T / 513.9 0.4989
Specific heat capacity in (kJ/(kg·K)), where τ = T / 1000 . C p , l = 1.04721599 + 15.6271404 τ 107.941020 τ 2 + 310.825090 τ 3 241.911840 τ 4
Density (kg/m 3 )
ρ l = 276 · ( 0.27688 ) ( 1 T / 516.25 ) 0.23670

Appendix A.2. Ethanol Vapor

Diffusivity in air (m 2 /s)
D v , a = 0.10107 + 5.6275 · 10 4 T + 5.8314 · 10 7 T 2 · 10 4
Thermal conductivity (W/(m·K))
K v = 1.3405 · 10 2 + 7.0239 · 10 5 T + 9.0124 · 10 8 T 2 3.6957 · 10 11 T 3
Dynamic viscosity (Pa·s)
μ v = ( 1.8086 + 3.0504 · 10 1 T 3.9837 · 10 5 T 2 2.5788 · 10 9 T 3 ) · 10 7

Appendix A.3. Optical Properties

Ethanol refractive index, at λ = 1064 nm
n = 1.3547 i 9.6524 · 10 7
Water refractive index, at λ = 1064 nm
n = 1.326 i 1.15 · 10 6
Water refractive index, at λ = 10.6 μ m
n = 1.179 i 0.0852

References

  1. Heywood, J.B. Internal Combustion Engine Fundamentals; McGraw-Hill Education: Berkshire, UK, 2018. [Google Scholar]
  2. Hou, X.; Choy, K.L. Processing and applications of aerosol-assisted chemical vapor deposition. Chem. Vap. Depos. 2006, 12, 583–596. [Google Scholar] [CrossRef]
  3. Reutzsch, J.; Kieffer-Roth, C.; Weigand, B. A consistent method for direct numerical simulation of droplet evaporation. J. Comput. Phys. 2020, 413, 109455. [Google Scholar] [CrossRef]
  4. Sazhin, S.S. Modelling of fuel droplet heating and evaporation: Recent results and unsolved problems. Fuel 2017, 196, 69–101. [Google Scholar] [CrossRef]
  5. Williams, F.A. Combustion Theory; CRC Press: Boca Raton, FL, USA, 2018. [Google Scholar]
  6. Sazhin, S.; Abdelghaffar, W.; Krutitskii, P.; Sazhina, E.; Heikal, M. New approaches to numerical modelling of droplet transient heating and evaporation. Int. J. Heat Mass Transf. 2005, 48, 4215–4228. [Google Scholar] [CrossRef]
  7. Tonini, S.; Cossali, G. An exact solution of the mass transport equations for spheroidal evaporating drops. Int. J. Heat Mass Transf. 2013, 60, 236–240. [Google Scholar] [CrossRef]
  8. Zhang, H. Evaporation of a suspended droplet in forced convective high-pressure environments. Combust. Sci. Technol. 2003, 175, 2237–2268. [Google Scholar] [CrossRef]
  9. Abramzon, B.; Sirignano, W. Droplet vaporization model for spray combustion calculations. Int. J. Heat Mass Transf. 1989, 32, 1605–1618. [Google Scholar] [CrossRef]
  10. Bruggeman, P.; Kushner, M.J.; Locke, B.R.; Gardeniers, J.G.; Graham, W.; Graves, D.B.; Hofman-Caris, R.; Maric, D.; Reid, J.P.; Ceriani, E.; et al. Plasma–liquid interactions: A review and roadmap. Plasma Sources Sci. Technol. 2016, 25, 053002. [Google Scholar] [CrossRef] [Green Version]
  11. Asakawa, Y. Promotion and retardation of heat transfer by electric fields. Nature 1976, 261, 220–221. [Google Scholar] [CrossRef]
  12. Dumitrache, C.; VanOsdol, R.; Limbach, C.M.; Yalin, A.P. Control of early flame kernel growth by multi-wavelength laser pulses for enhanced ignition. Sci. Rep. 2017, 7, 1–8. [Google Scholar] [CrossRef]
  13. Tropina, A.; Miles, R.; Shneider, M.N. Mathematical model of dual-pulse laser ignition. J. Propuls. Power 2018, 34, 408–414. [Google Scholar] [CrossRef]
  14. Shneider, M.; Zheltikov, A.; Miles, R. Tailoring the air plasma with a double laser pulse. Phys. Plasmas 2011, 18, 063509. [Google Scholar] [CrossRef] [Green Version]
  15. Kucherov, A.N. Clearing of a polydisperse water aerosol by a laser pulse in the diffusive—Convective regime. Quantum Electron. 2006, 36, 363. [Google Scholar] [CrossRef]
  16. Bergthorson, J.M.; Thomson, M.J. A review of the combustion and emissions properties of advanced transportation biofuels and their impact on existing and future engines. Renew. Sustain. Energy Rev. 2015, 42, 1393–1417. [Google Scholar] [CrossRef]
  17. Al Qubeissi, M.; Al-Esawi, N.; Sazhin, S.S.; Ghaleeh, M. Ethanol/gasoline droplet heating and evaporation: Effects of fuel blends and ambient conditions. Energy Fuels 2018, 32, 6498–6506. [Google Scholar] [CrossRef]
  18. Pinheiro, A.P.; Vedovoto, J.M.; da Silveira Neto, A.; van Wachem, B.G. Ethanol droplet evaporation: Effects of ambient temperature, pressure and fuel vapor concentration. Int. J. Heat Mass Transf. 2019, 143, 118472. [Google Scholar] [CrossRef]
  19. Dombrovsky, L.; Sazhin, S. Absorption of thermal radiation in a semi-transparent spherical droplet: A simplified model. Int. J. Heat Fluid Flow 2003, 24, 919–927. [Google Scholar] [CrossRef]
  20. Dombrovsky, L.; Sazhin, S.S.; Heikal, M.R. Computational model of spectral radiation characteristics of diesel fuel droplets. Heat Transf. Res. 2004, 35. [Google Scholar] [CrossRef]
  21. Hergert, W.; Wriedt, T. The Mie Theory: Basics and Applications; Springer: Berlin, Germany, 2012; Volume 169. [Google Scholar]
  22. Park, B.S.; Armstrong, R.L. Laser droplet heating: Fast and slow heating regimes. Appl. Opt. 1989, 28, 3671–3680. [Google Scholar] [CrossRef]
  23. Davies, S.; Brock, J.R. Laser evaporation of droplets. Appl. Opt. 1987, 26, 786–793. [Google Scholar] [CrossRef]
  24. Abramzon, B.; Sazhin, S. Droplet vaporization model in the presence of thermal radiation. Int. J. Heat Mass Transf. 2005, 48, 1868–1873. [Google Scholar] [CrossRef]
  25. Zardecki, A.; Armstrong, R.L. Energy balance in laser-irradiated vaporizing droplets. Appl. Opt. 1988, 27, 3690–3695. [Google Scholar] [CrossRef] [PubMed] [Green Version]
  26. Rosner, D.E. Transport Processes in Chemically Reacting Flow Systems; Courier Corporation: Washington, DC, USA, 2012. [Google Scholar]
  27. Khasanshin, T.; Aleksandrov, A. Thermodynamic properties of ethanol at atmospheric pressure. J. Eng. Phys. 1984, 47, 1046–1052. [Google Scholar] [CrossRef]
  28. Yaws, C.L. Thermophysical Properties of Chemicals and Hydrocarbons; William Andrew: Norwich, NY, USA, 2008. [Google Scholar]
  29. Yaws, C.L. Transport Properties of Chemicals and Hydrocarbons; William Andrew: Norwich, NY, USA, 2014. [Google Scholar]
  30. Kedenburg, S.; Vieweg, M.; Gissibl, T.; Giessen, H. Linear refractive index and absorption measurements of nonlinear optical liquids in the visible and near-infrared spectral region. Opt. Mater. Express 2012, 2, 1588–1611. [Google Scholar] [CrossRef]
  31. Jasak, H. OpenFOAM: Open source CFD in research and industry. Int. J. Nav. Archit. Ocean. Eng. 2009, 1, 89–94. [Google Scholar]
  32. Saharin, S.B.; Lefort, B.; Morin, C.; Chauveau, C.; Le Moyne, L.; Kafafy, R. Vaporization characteristics of ethanol and 1-propanol droplets at high temperatures. At. Sprays 2012, 22. [Google Scholar] [CrossRef]
Figure 1. Schematic of laser heating of a droplet in ambient gas (not to scale).
Energies 16 00388 g001
Figure 3. Block scheme of the numerical solver built in OpenFOAM.
Energies 16 00388 g003
Figure 4. Normalized diameter squared against normalized time, lines represent simulation results and symbols represent experimental results from [32].
Energies 16 00388 g004
Figure 5. Computational domain specifications used during verification.
Energies 16 00388 g005
Figure 6. Temporal evolution of the droplet temperature. Solid line, results from this work for a fine grid (8750 cells); dotted lines, results for a coarse grid (5600 cells); and dashed line, results from Armstrong’s model [22]; water droplet of R 0 = 10 μ m at 300 K, λ = 10.6 μ m, I 0 = 10 7 W/m 2 .
Energies 16 00388 g006
Figure 7. Temporal evolution of the droplet temperature, left axis and black lines, and the normalized surface area, right axis and red lines, for water (solid lines), and ethanol (dashed lines). R D = 10 μ m, I L 0 = 10 10 W/m 2 , the continuous laser heating source.
Energies 16 00388 g007
Figure 8. Temporal evolution of ethanol droplet heating and evaporation during continuous heating; (a) normalized radius, (b) droplet temperature, (c) evaporation mass flux, and (d) conduction and convective heat flux. Solid lines represent droplet of size R D = 10 μ m, and dashed lines represent droplet of size R D = 40 μ m; I L 0 = 10 10 W/m 2 .
Energies 16 00388 g008
Figure 9. Time required to reach boiling temperature normalized by FWHM against the peak laser intensity. Analytical results are normalized for t p = 15 ns. Symbols show results for two cases with same integrated intensity but different FWHM.
Energies 16 00388 g009
Figure 10. Velocity vectors overlaid on the contours of mass fraction of ethanol at 1 ms for pulsed laser heating. t p = 10 ns, I L 0 = 1.0 × 10 14 W/m 2 , R D 0 = 25 μ m.
Energies 16 00388 g010
Figure 11. Temporal evolution of ethanol droplet parameters; (a) normalized radius, (b) droplet temperature, (c) evaporation mass flux, and (d) conduction and convective heat flux normalized by I L 0 R D 2 for cases from Table 1.
Energies 16 00388 g011
Figure 12. Temporal evolution of ethanol droplet parameters for cases shown in Table 1; (a) normalized surface area, (b) droplet temperature normalized by maximum temperature. The normalized time t ^ = t ( I L 0 / 10 14 ) 2.11 / R D 0 2 .
Energies 16 00388 g012
Figure 13. Temporal evolution of (a) normalized surface area and (b) droplet temperature for pulsed laser heating of ethanol droplets R 0 = 10 μ m, 25 μ m, 40 μ m with laser of λ = 1064 nm, I 0 = 0.5 × 10 14 W/m 2 , 100 KHz repetition rate.
Energies 16 00388 g013
Figure 14. Temporal evolution of the droplet temperature, left axis, and the normalized surface area, right axis, for the detailed model (solid lines), and semi-empirical model (dashed lines). Results are shown for R D = 20 μ m, I L 0 = 10 10 W/m 2 for the continuous laser heating case.
Energies 16 00388 g014
Figure 15. Schematic showing the laser bleaching effect.
Energies 16 00388 g015
Table 1. Droplet radius and intensity range for the case of pulsed laser heating.
R D , μ m10 μ m25 μ m40 μ m
I L 0 ,   W/m 2 0.5 × 10 14 1 × 10 14 5 × 10 14
Disclaimer/Publisher’s Note: The statements, opinions and data contained in all publications are solely those of the individual author(s) and contributor(s) and not of MDPI and/or the editor(s). MDPI and/or the editor(s) disclaim responsibility for any injury to people or property resulting from any ideas, methods, instructions or products referred to in the content.

