1. Introduction
Batteries are essential in applications ranging from consumer electronics through to Electric Vehicles (EVs), Uninterruptible Power Supplies (UPSs), Energy Storage Systems (ESSs), etc. A Battery Management System (BMS) is one of the essential tools for the efficient, reliable, and safe operation of battery modules. The accurate and efficient estimations of State of Charge (SOC) and State of Health (SOH) are the critical cores of a BMS. They are important tools for verifying battery performance and avoiding unexpected failures. Due to the complicated electrochemical reaction in their practical and dynamic applications, it is difficult to accurately estimate batteries’ SOH [
1,
2,
3]. The conventional classifications of SOH Estimation (SOH-E) methods include direct assessment and model-based and data-driven estimations [
4,
5,
6,
7,
8,
9,
10,
11,
12,
13,
14,
15,
16,
17,
18,
19,
20,
21,
22,
23,
24,
25,
26,
27,
28]. Detailed comparisons of different SOH-E methods will be provided in
Section 2.
From 2016 to 2021, the global battery market rose at a growth rate of approximately 4.15% annually, i.e., to USD 17.25 billion in 2021. The growth of ESSs, EVs, and 5G base stations has considerably driven the battery market’s expansion. About 94.8% of global battery markets are nickel-based, lithium-based, and lead–acid batteries [
29,
30,
31,
32,
33]. As a result, more batteries will be retired from EVs and 5G communication base stations in the foreseeable future. The SOH of a battery is an important parameter with which to determine whether the battery has aged and should be retired. Generally, when the SOH metric of a battery drops to 70–80%, the battery is no longer suitable for usage and should be retired [
29]. It is estimated that by 2030, EVs will result in retired batteries of about 100–200 GWh due to the inability to meet the EV usage requirements. Those retired batteries with different degradation capacities could be classified and used in ESSs and other mobility applications.
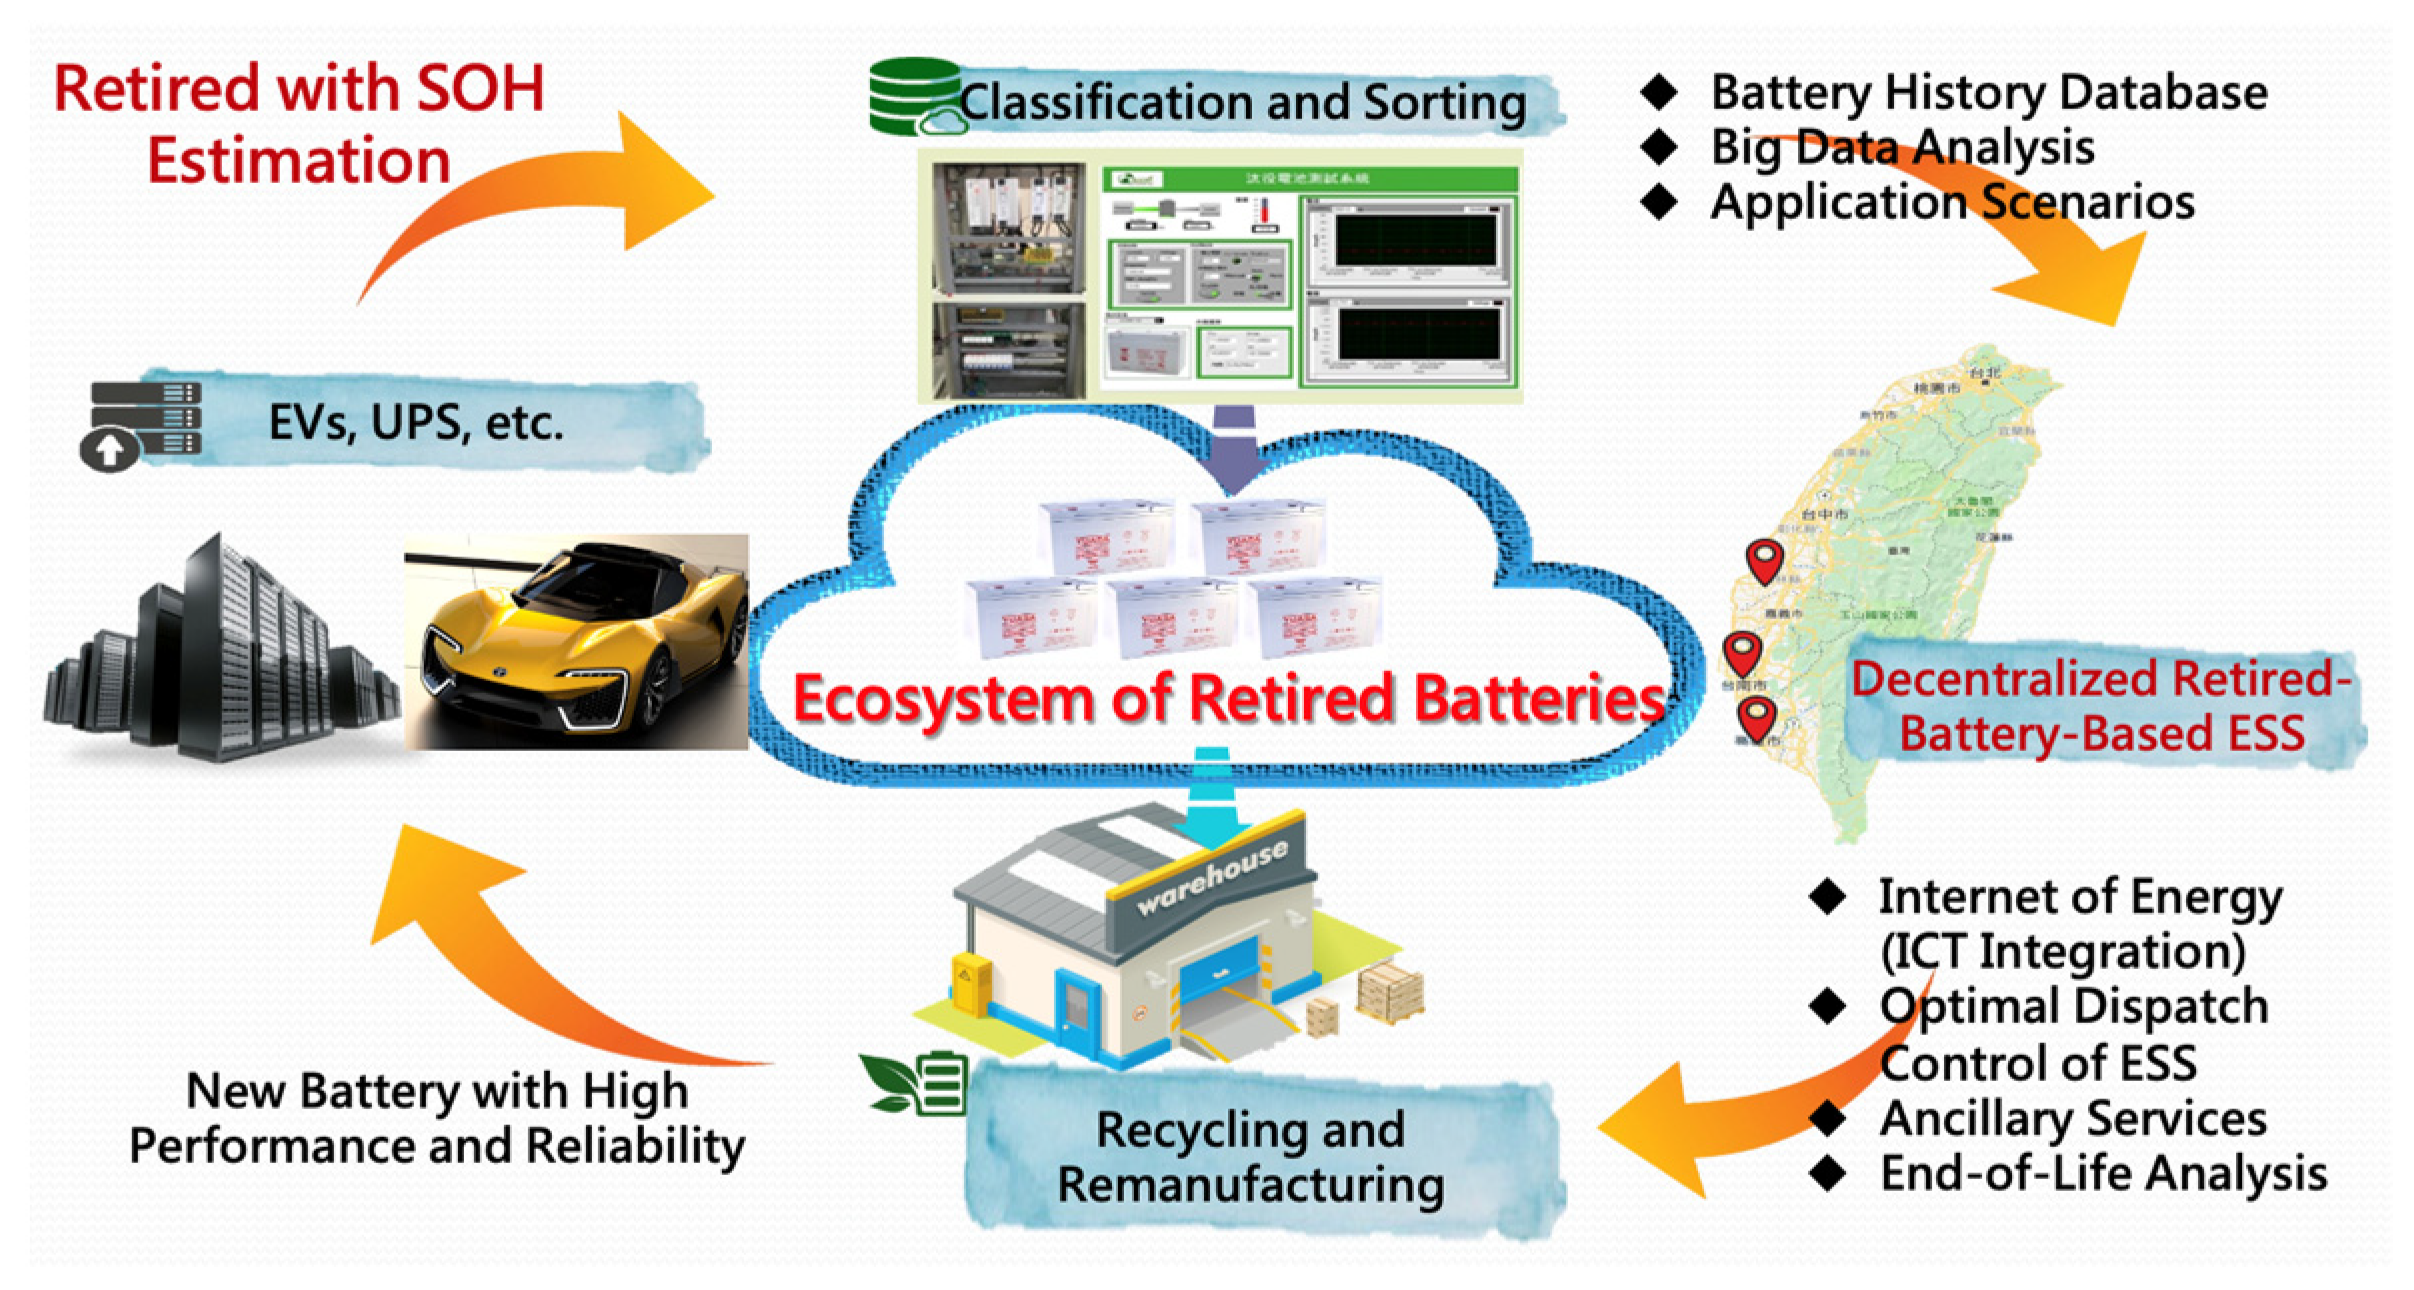
Figure 1 illustrates the possible battery cycle ecosystem. New high-performance and reliable batteries can be used in EVs and UPSs in communication base stations and data centers. When a battery has expired or its SOH metric has dropped to 70–80% [
29], the battery should be retired. An SOH-E using a battery history database and data analysis can be applied to classify and sort retired batteries. The reuse scenarios can then be determined based on the degradation capacity of retired batteries. For example, retired battery-based ESSs can be constructed by integrating them with the internet of energy and optimal dispatch control and be joined to the ancillary services of power system operation. Finally, an end-of-life analysis can be conducted, and thus the battery will be recycled and remanufactured. Reusing batteries retired from UPSs and EVs can decrease pollution, extend the battery life cycle, and be used to construct a battery cycle ecosystem.
Generally, a comprehensive and laborious charge-and-discharge (CHA-DISCH) procedure is executed to acquire complete measurements and then used to accurately calculate the SOH. Obtaining full CHA-DISCH measurements may take 12 h for a commercialized lead–acid battery. Due to the limited time of the employed analyses, the estimation of SOH levels for many retired batteries using the conventional methods is almost unrealistic. Therefore, different SOH assessment methods have been proposed [
4,
5,
6,
7,
8,
9,
10,
11,
12,
13,
14,
15,
16,
17,
18,
19,
20,
21,
22,
23,
24,
25,
26,
27,
28]. Most of these methods have not been tested and validated using operational, commercialized batteries, nor have they considered the effects of retired batteries. This paper proposes an accurate and efficient SOH-E using the actual discharge information of retired batteries. A battery data acquisition system is implemented to obtain retired batteries’ CHA-DISCH data. These measurements are separated into sub-data of different time intervals; then, the specially designed features are extracted from the sub-data for SOH-E. These features are exploited to train Neural Networks (NNs) and to evaluate the retired batteries’ SOH. Using the proposed method, any measurement of the discharge data can be used as the initial point. Consequently, after feature value extraction, the SOH can be estimated in 30 min. Our experiments used retired lead–acid batteries. The batteries’ rated voltage and capacity are 12 V and 90 Ah, respectively. Two feature value extractions and a Backpropagation NN (BPNN) and a Long-Short-Term-Memory NN (LSTMNN) are designed to estimate SOH. The experimental results, which take different feature value extractions with various time intervals and NN methods with multiple hidden layers and neurons into account, indicate that the SOH estimated in 30 min via the proposed method can achieve a Root-Mean-Square Error (RMSE) of less than 3%.
The main achievements of this paper are as follows:
An accurate and efficient SOH-E is proposed using the actual discharge information of retired batteries.
A battery data acquisition system for acquiring retired batteries’ CHA-DISCH data is designed.
The SOH-E performances of two feature value extractions and two neural networks are compared.
The retired batteries are used and tested in experiments.
It is determined that the proposed method can accurately and effectively estimate the retired batteries’ SOH levels in about 30 min. In addition, the RMSE verified by the retired batteries is lower than 3%.
There will be an increasing number of retired batteries in the foreseeable future. The proposed SOH-E can reduce pollution, extend battery life cycle values, and used to construct a battery cycle ecosystem.
2. Basic Concepts of SOH-E
Batteries’ SOH can be evaluated by the measured and rated capacities and can be expressed as [
4]
where
and
are the rated and measured capacities, respectively.
The conventional classifications of SOH-E methods include direct estimation, model-based estimation, and data-driven estimation [
4,
5,
6,
7,
8,
9,
10,
11,
12,
13,
14,
15,
16,
17,
18,
19,
20,
21,
22,
23,
24,
25,
26,
27,
28]. The traditional direct estimation methods include coulomb counting, open-circuit voltage, and impedance spectroscopy [
7,
8,
9,
10]. The coulomb-counting method requires a complete and inefficient CHA-DISCH procedure [
7]. Then, SOH can be calculated by dividing the discharge capacity by the rated capacity, as shown in (1). Apart from being a time-consuming procedure, coulomb counting can accurately assess batteries’ SOH. However, the Depth of Discharge (DoD) needs to be considered to prevent damaging the batteries in practical applications. The open-circuit voltage method uses the relationship between the open-circuit voltage and SOH to assess batteries’ SOH. Ref. [
8] combined incremental capacity analysis and open-circuit voltage to enhance the SOH-E under different temperatures. The impedance spectroscopy used in the study employed the wide frequency impedance spectrum to compute electrochemical model parameters and was then used to assess SOH [
9]. The integration of battery impedance spectroscopy into a battery management system to reduce the number of inductors and switch components was proposed in [
10].
The commonly used model-based estimation methods include the Kalman filter, particle filter, and statistical techniques [
11,
12,
13,
14,
15]. A Kalman filter with dual extended and unscented functionalities is a robust algorithm that describes and solves the nonlinear state equations of a system based on the prior measurements and has been employed to assess SOH [
11]. A particle filter uses the particles generated and updated recursively from a nonlinear approach to approximate a probability density function. Ref. [
12] applied the particle filter and Monte Carlo sampling methods to estimate SOC and SOH. An enhanced particle filter method combining an unscented Kalman filter was proposed in [
13] to enhance estimation accuracy. Statistical techniques expressed in the form of a regression analysis can also be used to predict SOH. An electrochemically based least-squares method was proposed to identify the degradation parameters of batteries and, consequently, predict SOH [
14]. Ref. [
15] used a high-order autoregressive model to predict SOH and a particle swarm optimization algorithm was employed to avoid a human-related subjective determination of order.
There are many data-driven estimation methods. They can be classified as artificial NNs [
16,
17,
18,
19,
20,
21,
22,
23], extreme learning machines [
24,
25], support vector machines [
26,
27], etc. Artificial NN simulates the human brain’s behavior, with artificial neurons organized by the input layer, hidden layers, and output layer. Different artificial NNs have been designed and used for SOH assessment. Ref. [
16] proposed an NN to estimate SOH using a backtracking search algorithm. An online SOH-monitoring method based on the fusion of partial incremental capacity and a feed-forward NN was represented in [
17]. A convolutional NN for the estimation of battery capacity based on current, voltage, and charge capacity measurements during a partial charge cycle was proposed in [
18]. SOH assessment based on impedance spectroscopy and a recurrent NN and LSTMNN was proposed in [
19,
20], respectively. Ref. [
21] represented a rapid SOH-E for retired lead–acid batteries, but comprehensive experimental results were not obtained. Ref. [
22] proposed an improved feedforward-long short-term-memory-modeling system for SOC prediction with a sliding balance window of dimensional current–voltage–temperature variation vectors. A detailed review of deep convolutional NNs targeted towards the multi-timescale state prediction of lithium-ion batteries was proposed in [
23]. An extreme learning machine is similar to an NN, but its connection weights between the output and hidden layers cannot be adjusted. It provides quicker performance than traditional NNs in terms of learning accuracy. Ref. [
24] used the variation of the two resistance values calculated from the Thevenin equivalent model as a health factor. The extreme learning machine was employed to estimate battery life. An SOH-E method that used a hierarchical extreme learning machine to enhance the robustness and accuracy of estimation was represented in [
25]. The key concept of a support vector machine is to find a small set of vectors from a large number of data sets in order to describe the system effectively. A model that combined particle swarm optimization and a support vector machine to predict SOH degradation trends was proposed in [
26]. An alternate health indicator used to measure battery degradation was proposed in [
27]. The authors also compared the SOH assessment accuracies of the statistical regression model and the support vector machine model. There are some special techniques for the analysis of battery characteristics. For example, ref. [
28] proposed a two-pulse test to determine the SOH of valve-regulated lead–acid batteries. The specially design pulse test and electrical battery model needed to be integrated into SOH-E.
Different SOH-E methods have their own characteristics and estimation accuracies. Detailed comparisons can be found in [
4,
5,
6]. The estimation errors of direct assessment are commonly about 1–5%. Integrating other SOH-E methods into a direct assessment can enhance prediction accuracy. Most model-based estimations have prediction errors of less than 10%. The Kalman-filter-based SOH-E method usually outperforms other model-based estimation methods. Data-driven estimation methods have a large error margin, which may vary from less than 1% to 10%. Even though comparisons have been discussed in [
4,
5,
6], it is difficult to directly state which method offers the best performance due to the different tested batteries and conditions. Moreover, most of these methods have not been tested and validated using operated commercialized batteries, nor have they considered the effects of retired batteries. Therefore, this paper proposes an accurate and efficient SOH-E technique using the discharge information of actually retired batteries.
3. Experimental Platform and Data Acquisition
To avoid damaging batteries in real applications, the DoD of a battery is commonly set between 50% to 80% of the rated capacity. The SOH with DoD can be written as
The DoD is set as 70% in the following experiments. The SOH is rewritten as in the Equation (3).
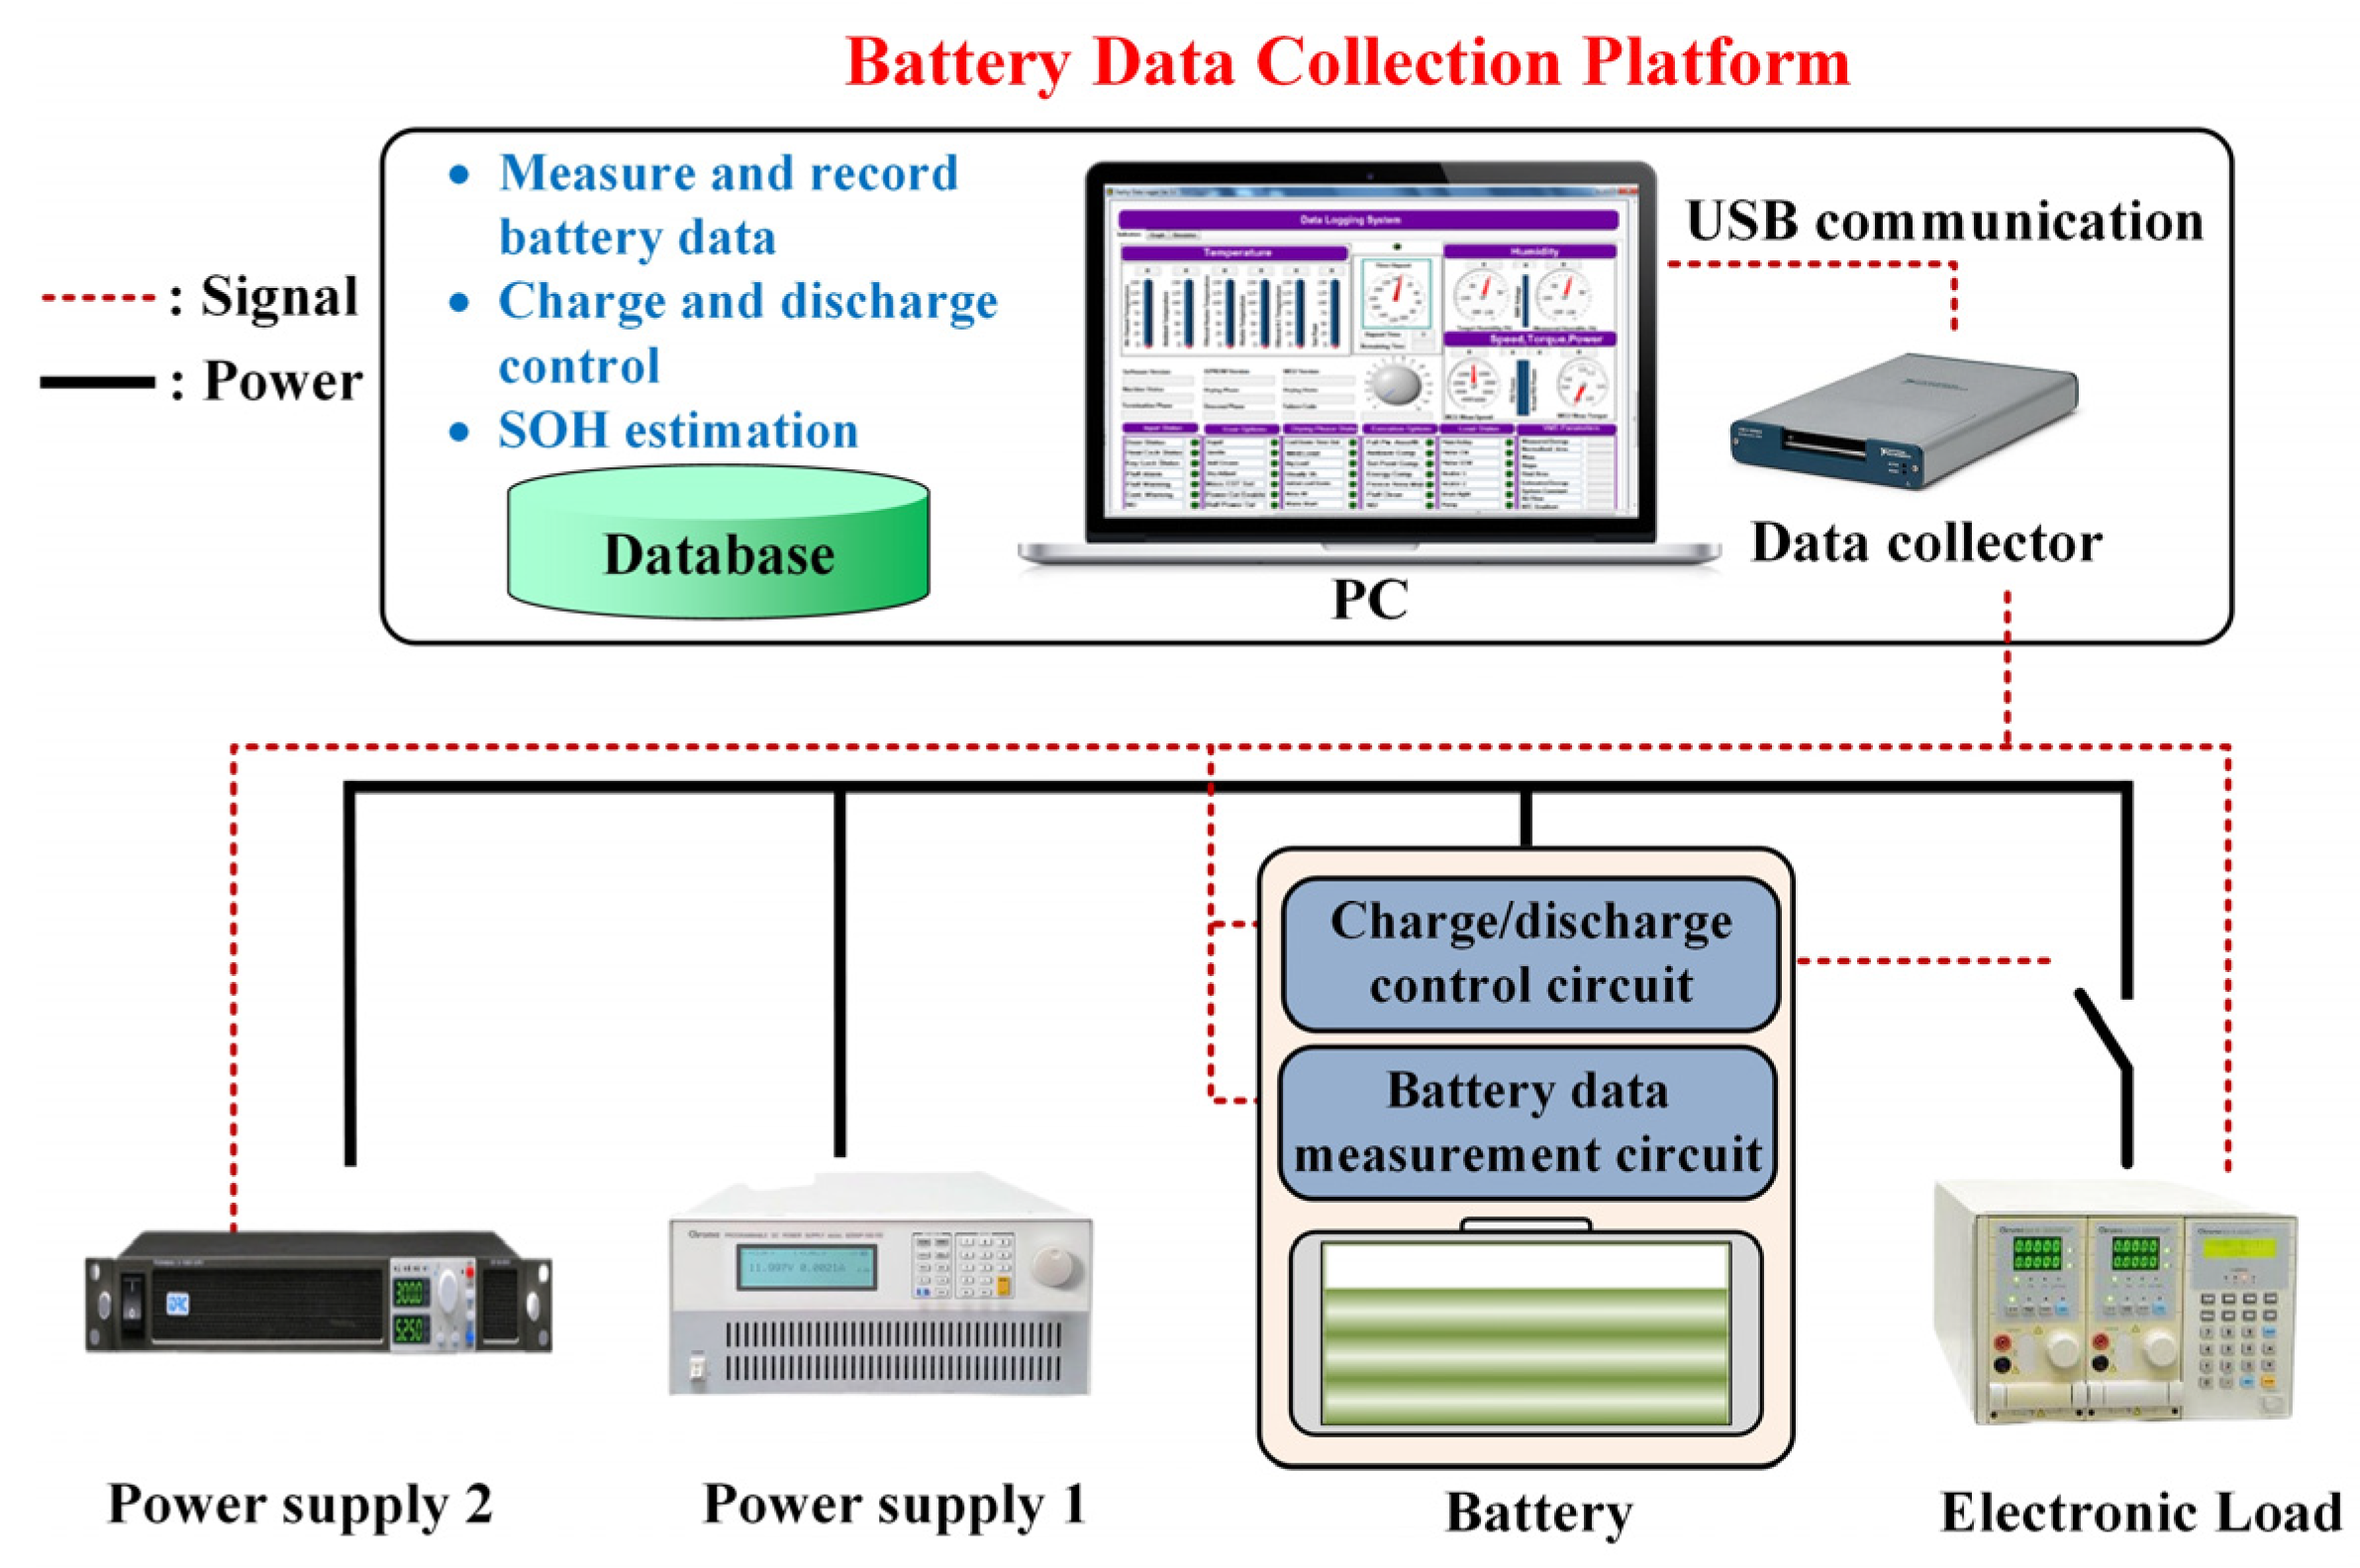
Herein, a lead–acid battery is considered as the study object, and its SOH is evaluated by (3) with a Constant-Current (CC) and Constant-Voltage (CV) charge and the following CC discharge. The SOH-E platform comprises the SOH-E and data acquisition system. The proposed SOH-E method utilizes the features extracted from the discharge information to evaluate the SOH levels. The data acquisition system can organize the CHA-DISCH commands, record the CHA-DISCH data, and formulate the sub-data for the SOH-E. The configuration of the proposed battery data acquisition system is illustrated in
Figure 2. The system acquires comprehensive CHA-DISCH data from batteries with different aging capacities, including SOCs, temperatures, currents, voltages, etc. Moreover, the system can remotely organize the CHA-DISCH schedule, record measurements in the database, and evaluate SOH.
It can be seen from
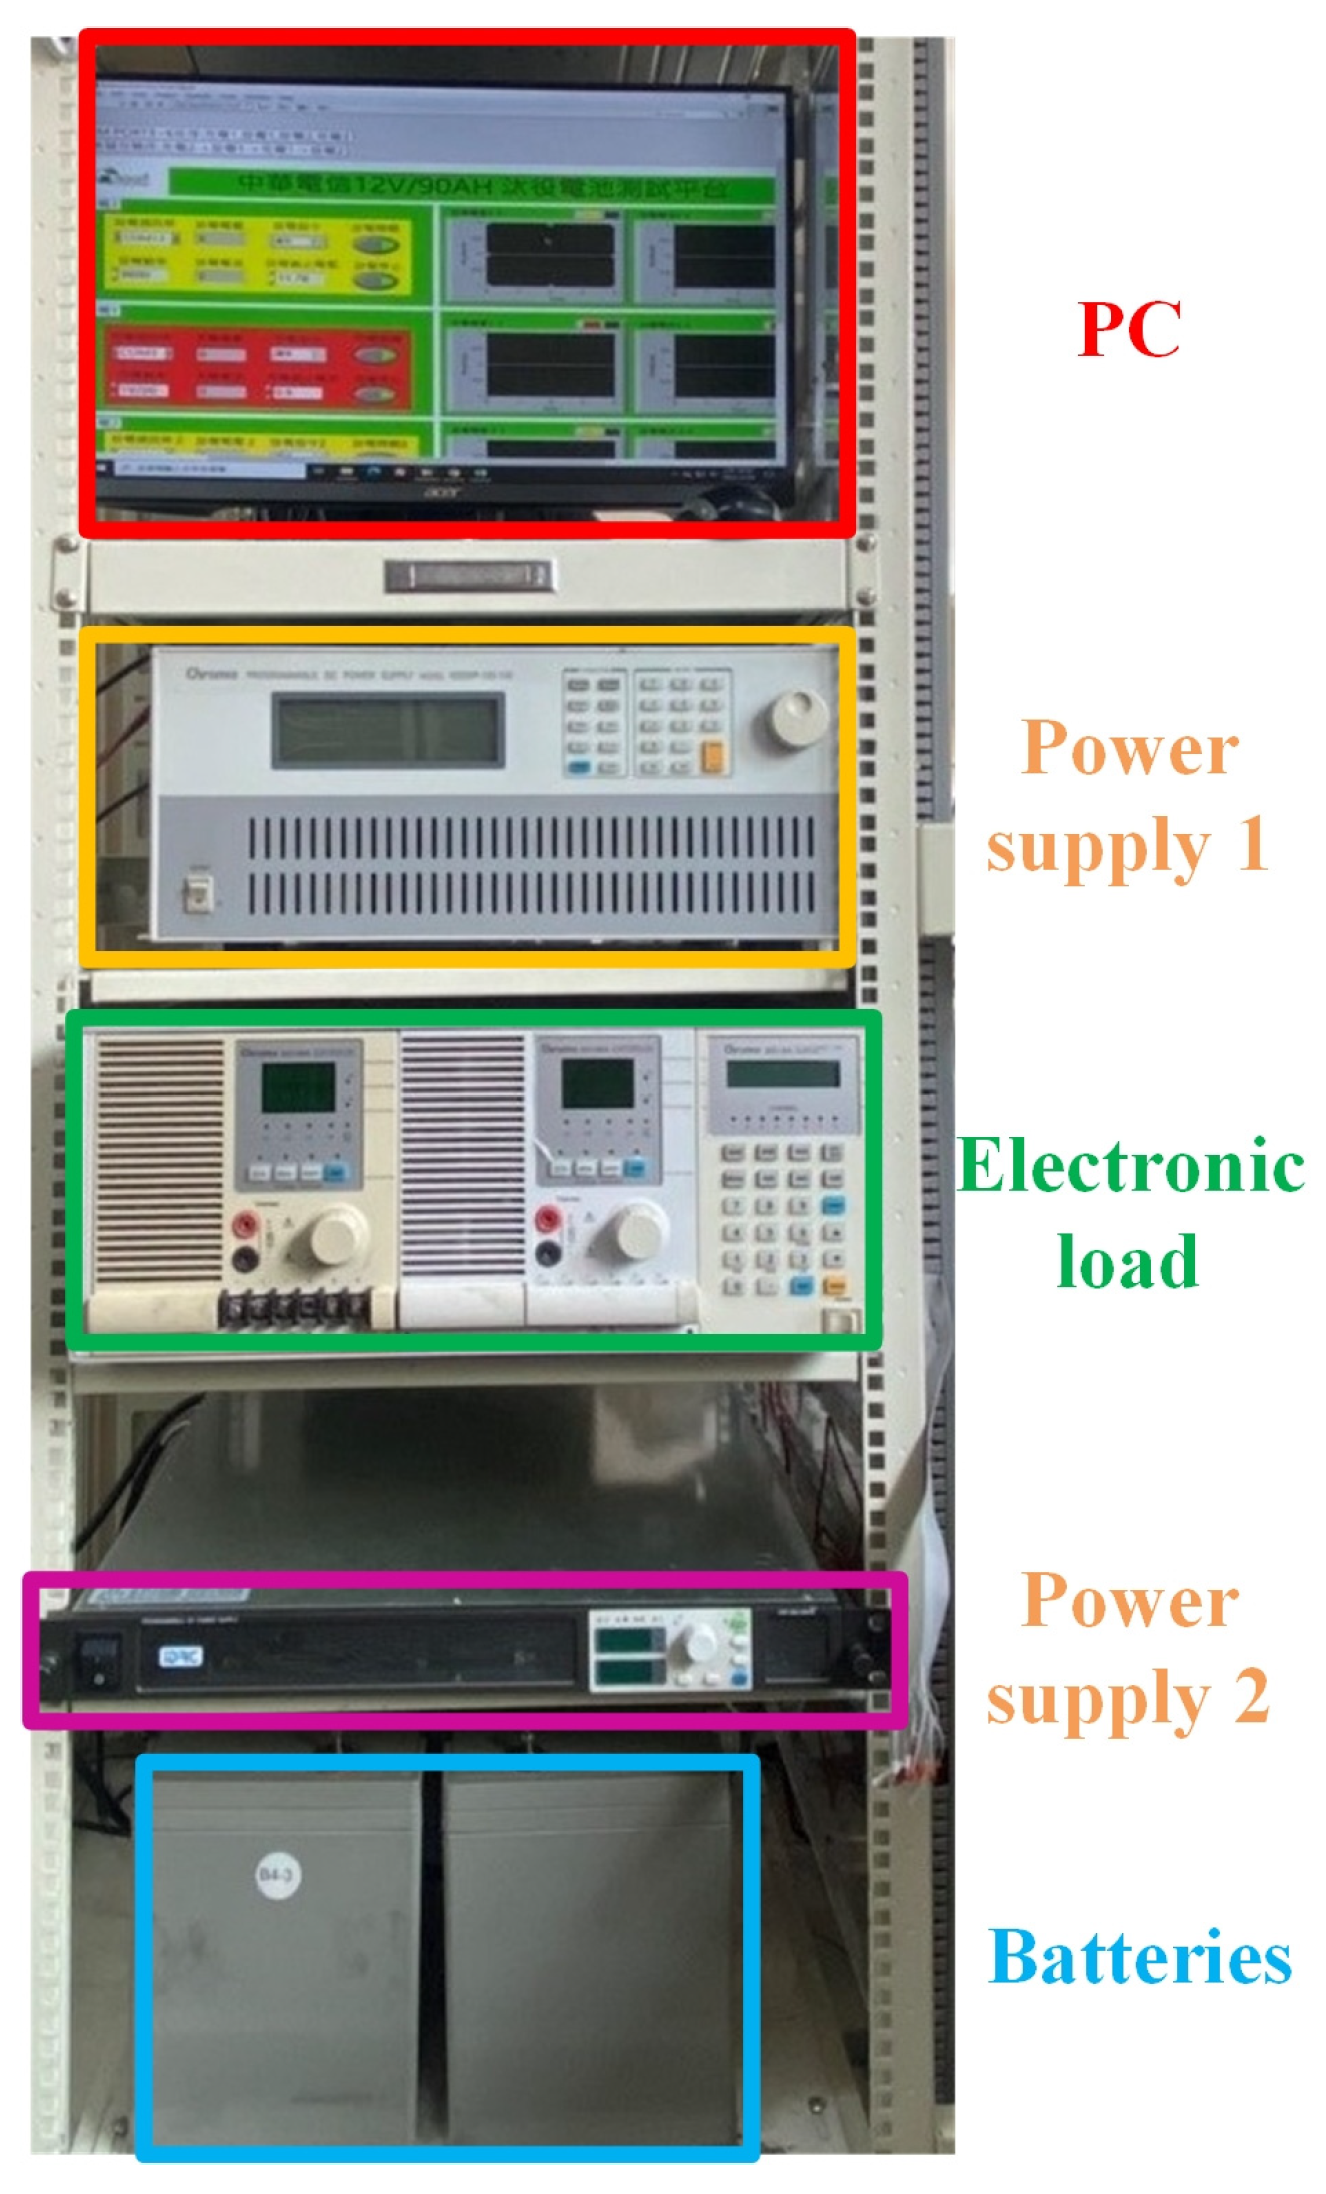
Figure 2 that the primary devices for the proposed system include the electronic load, power supplies, and a PC. The CHA-DISCH control circuit, composed of relays, organizes the CHA-DISCH schedule. The battery data measurement circuit, consisting of operational amplifiers and resistors, is used to convert the battery voltage and current into the measured range of the data collector. The data collector’s resolution and maximum input frequency are 32 bits and 5 MHz, respectively. The operating temperature ranges from 0 °C to 50 °C. The main hardware of the battery data acquisition system is shown in
Figure 3. The CHA-DISCH control circuit and hardware of the battery data acquisition system are located behind the devices shown in
Figure 3; therefore, they are not visible in the image. The platform also uses other retired batteries; therefore, two power supplies are shown in
Figure 1 and
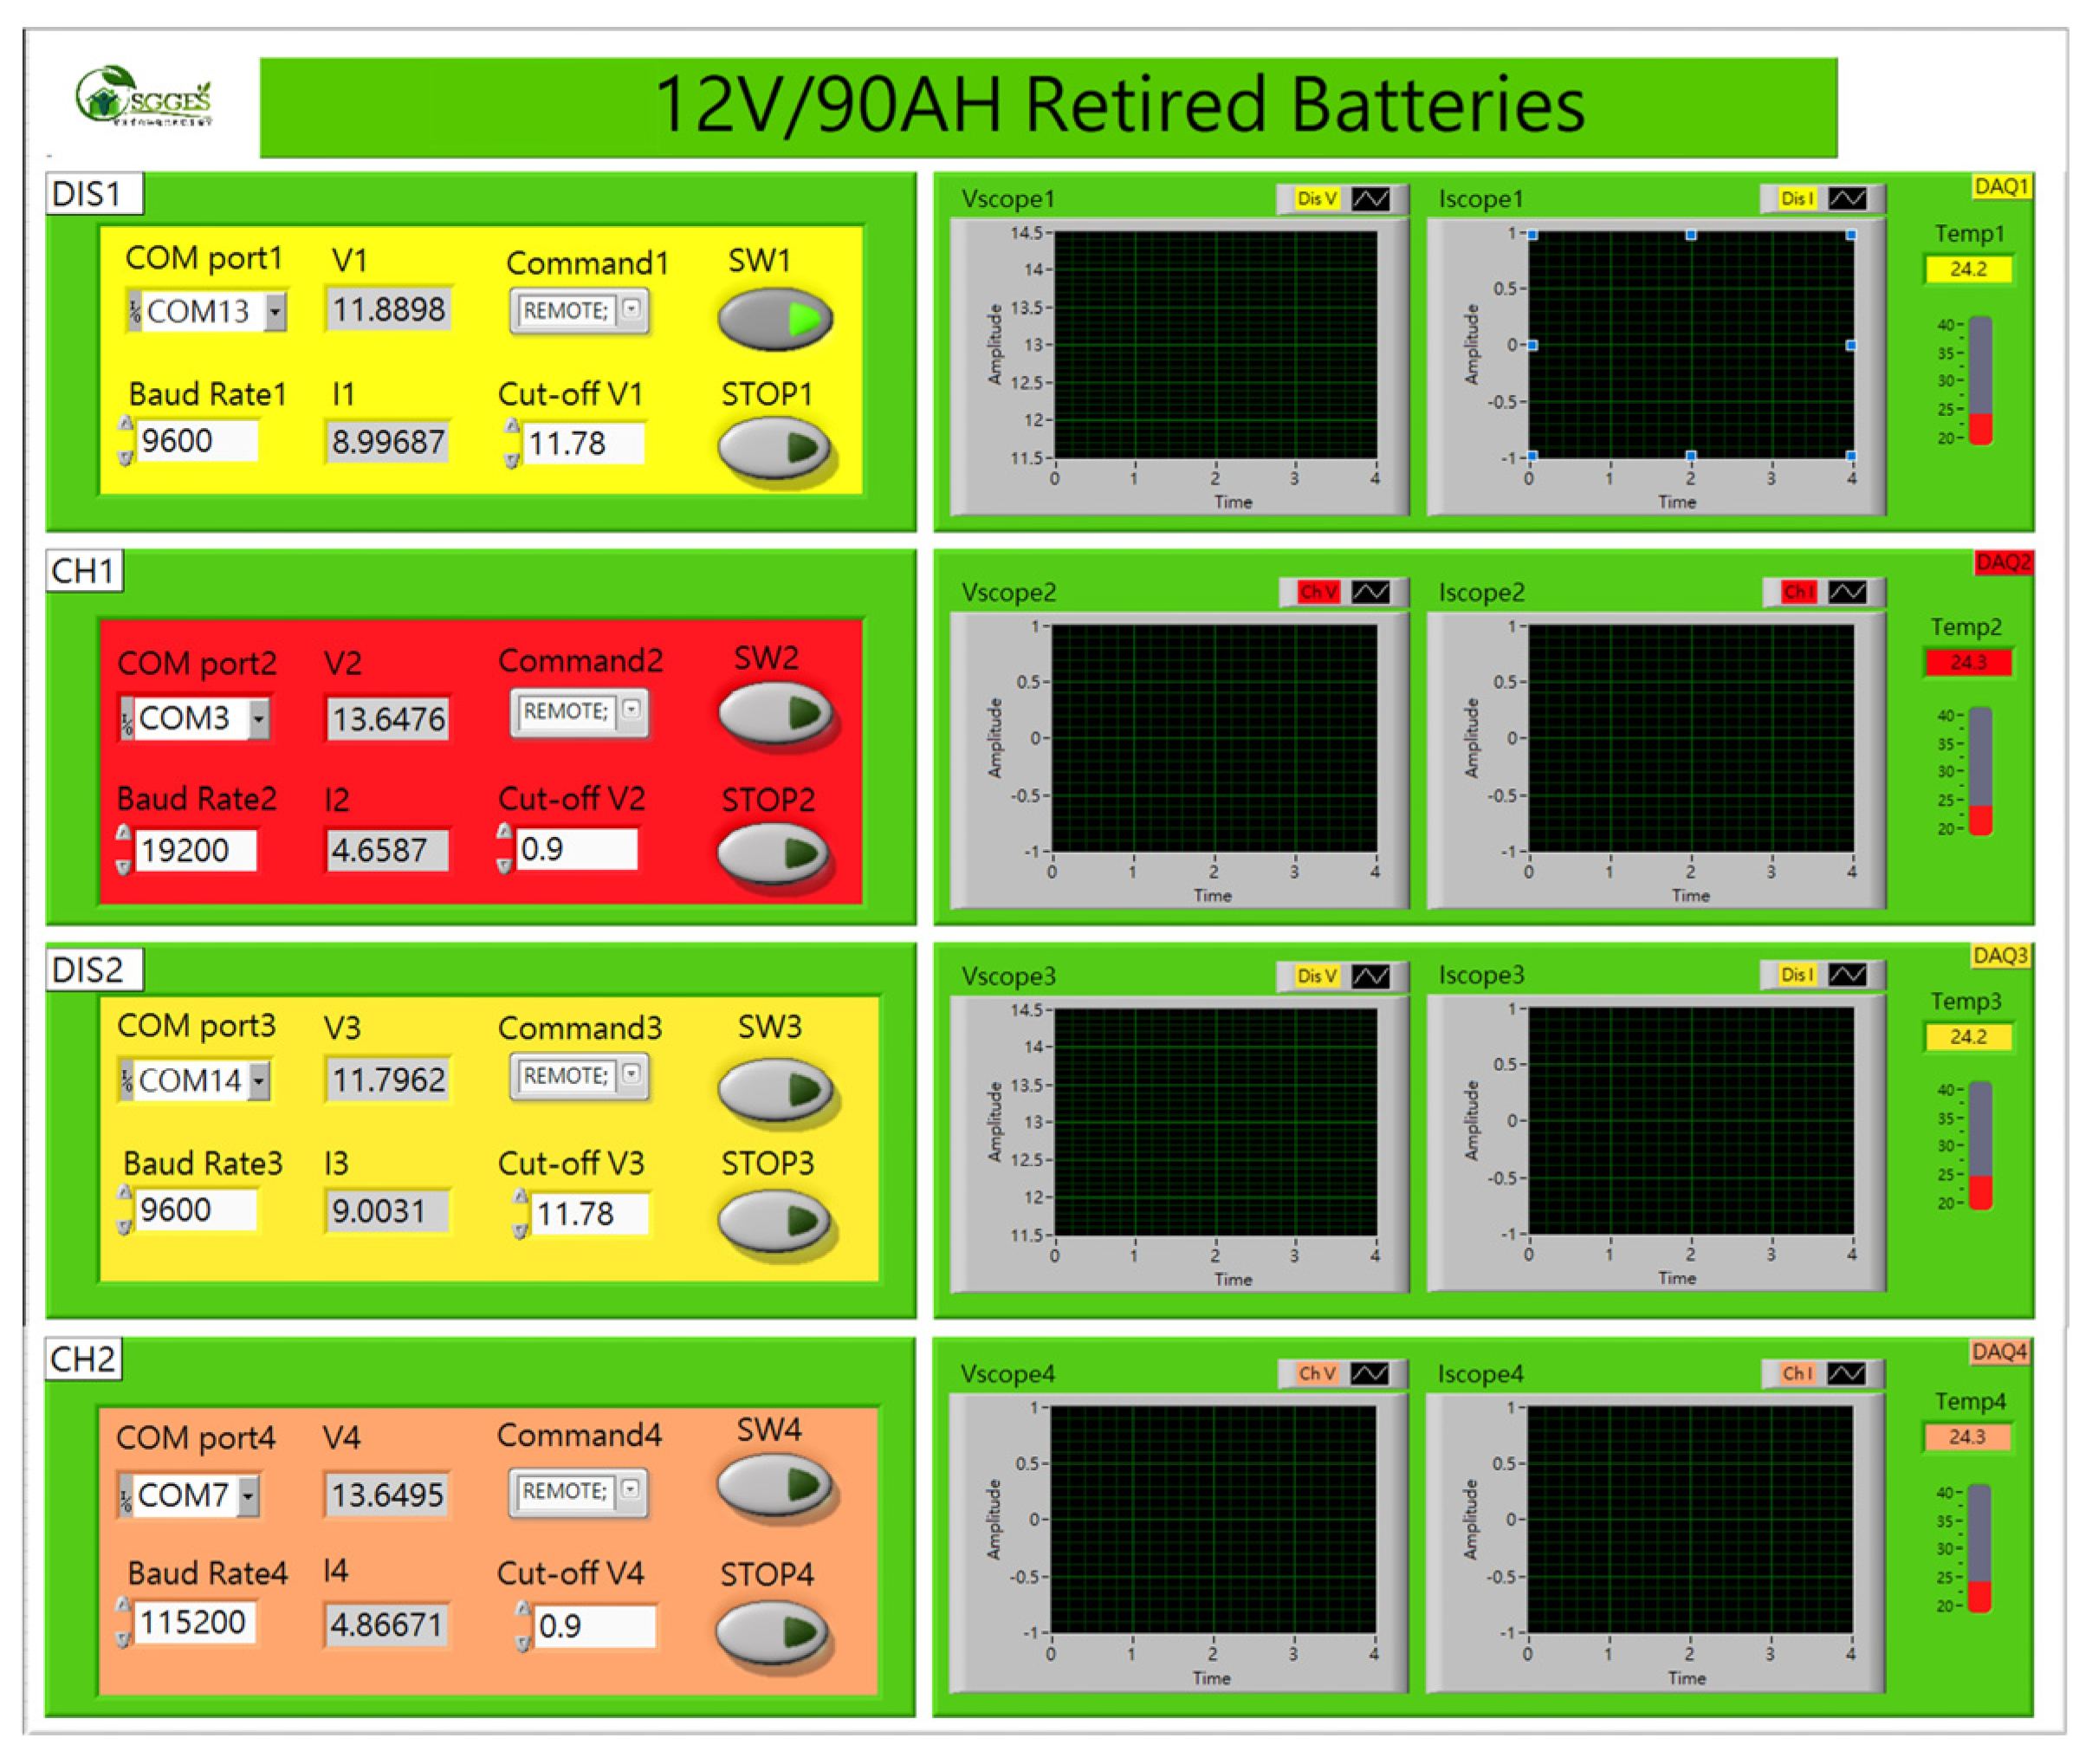
Figure 2. Only one power supply is used for the retired lead–acid batteries. The Human–Machine Interface (HMI) of the acquisition system designed by LabVIEW [
34] is illustrated in
Figure 4. The HMI is exploited to choose the communication protocol, including the baud rate and COM port; arrange the CHA-DISCH schedule; observe the CHA-DISCH current and voltage waveforms; record the CHA-DISCH data; and evaluate battery SOH. All measurements were saved in the database and shown in the HMI.
In these experiments, retired lead–acid batteries of the UXH90-12I variety (Taiwan Yuasa Battery Co., Ltd., Taipei, Taiwan) [
35] that had expired following their use in communication base stations were utilized. The detailed specifications of the UXH90-12I batteries, including their appearance, dimensions, weight, nominal capacity, internal resistance, voltage of CV charge, voltage at 70% DoD, etc., are shown in
Table 1. The CC charge and CC discharge are both set at the current of 10% of the rated capacity (0.1 C/9 A).
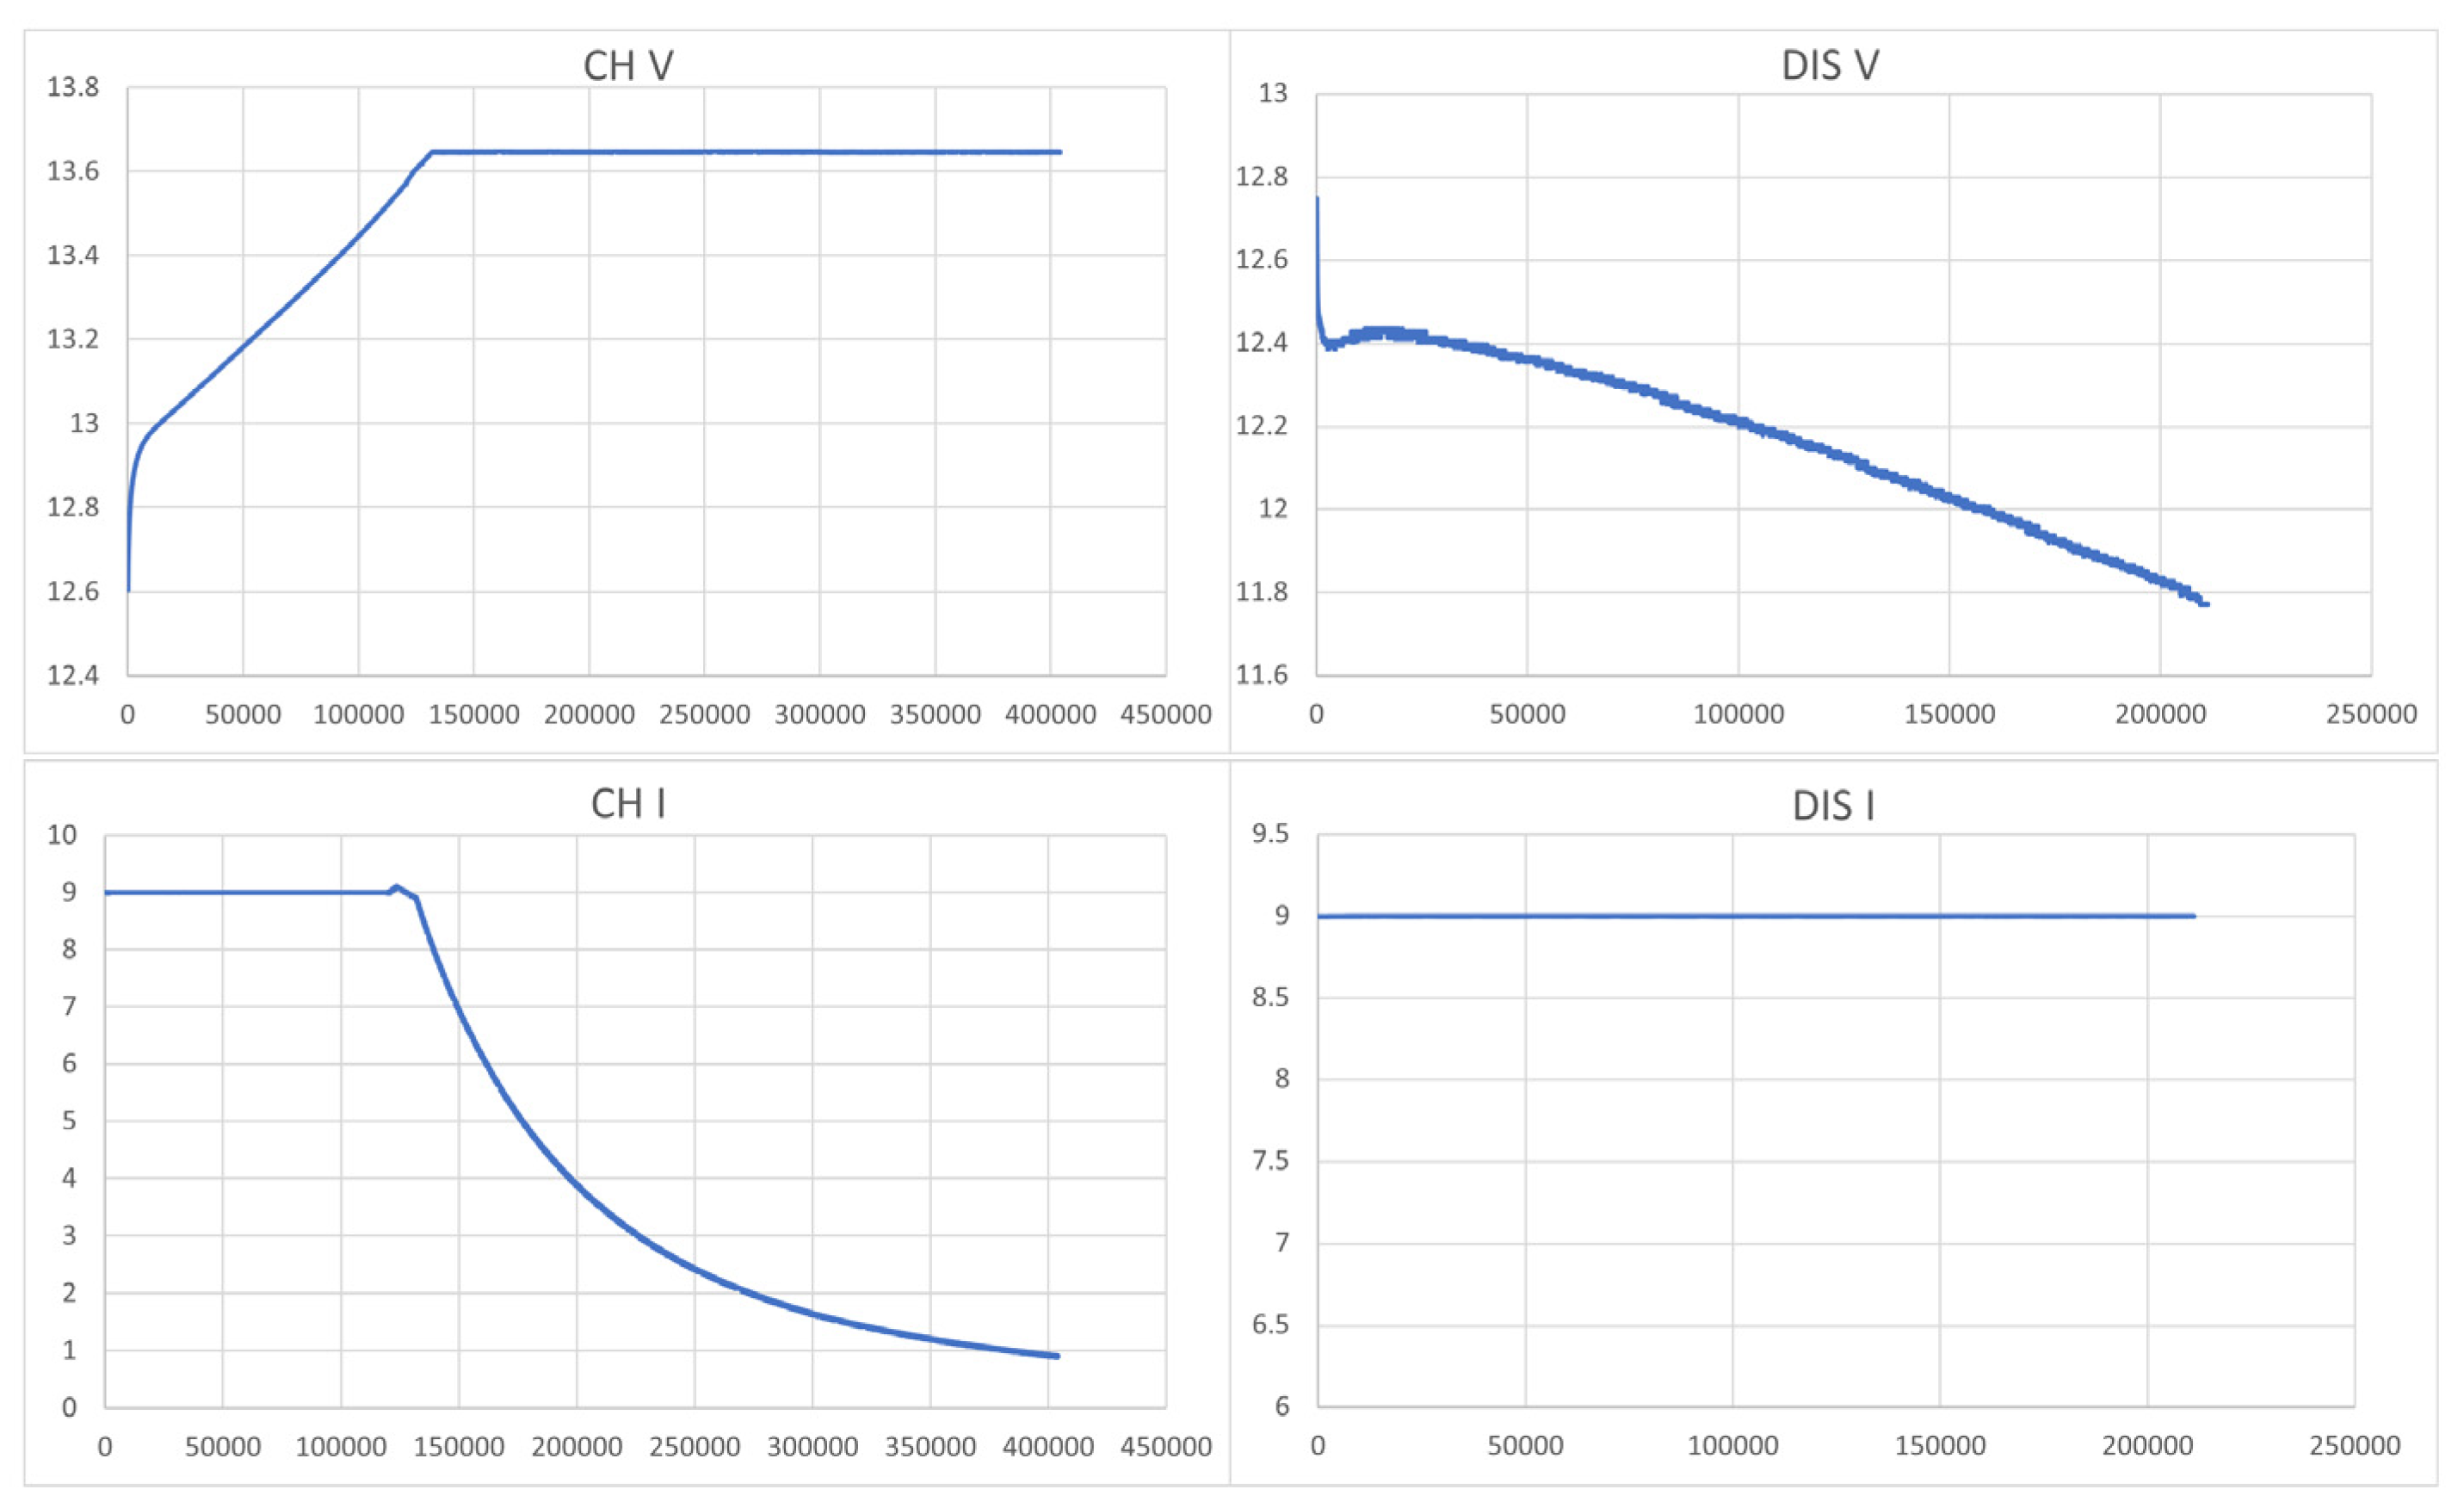
Figure 5 illustrates the voltages and currents of a whole CHA-DISCH procedure for a retired lead–acid battery, where ”CH I”, “DIS I”, “CH V”, and “DIS V” are the channels of charge current, discharge current, charge voltage, and discharge voltage, respectively. The charge shown in
Figure 5 is from CC to CV and the discharge is CC. The unit of the
x-axis in
Figure 5 is 0.1 s.
4. Proposed SOH-E Methodology
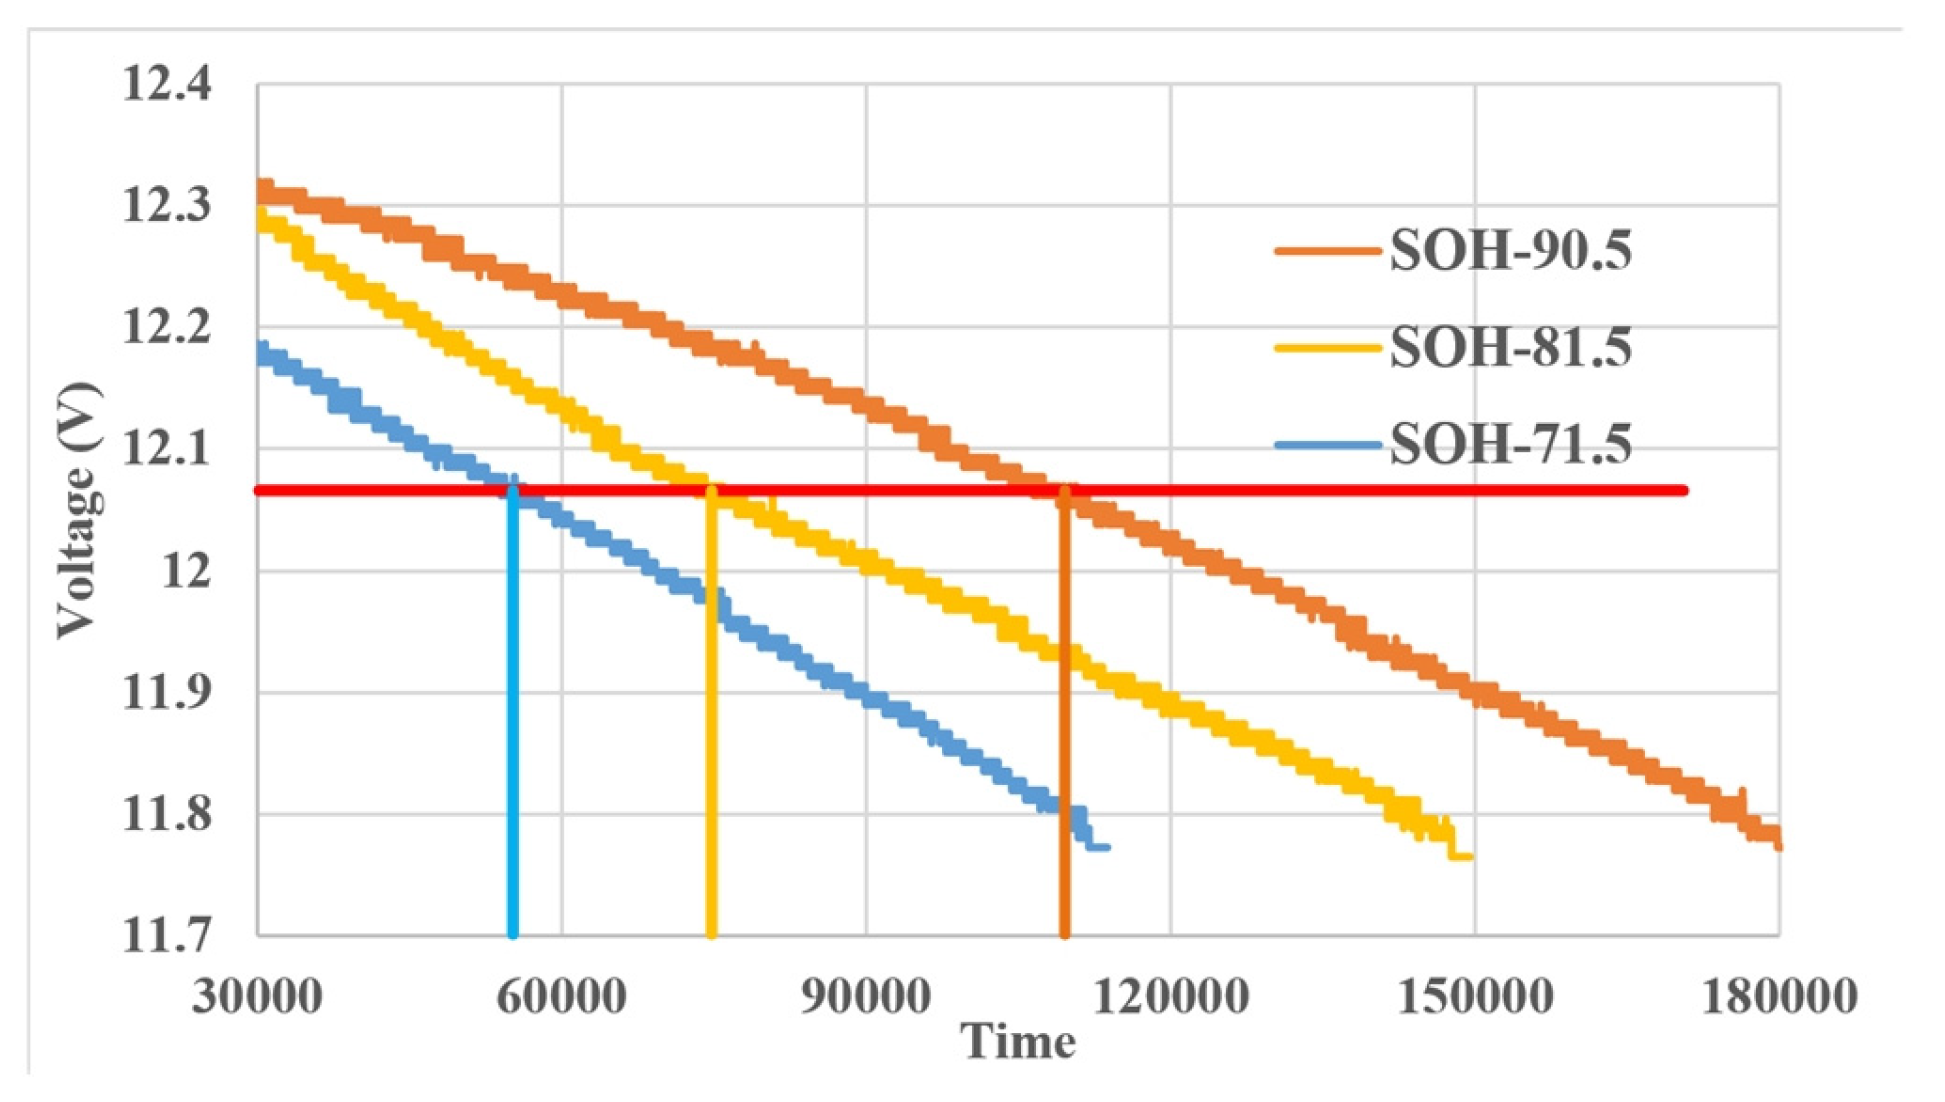
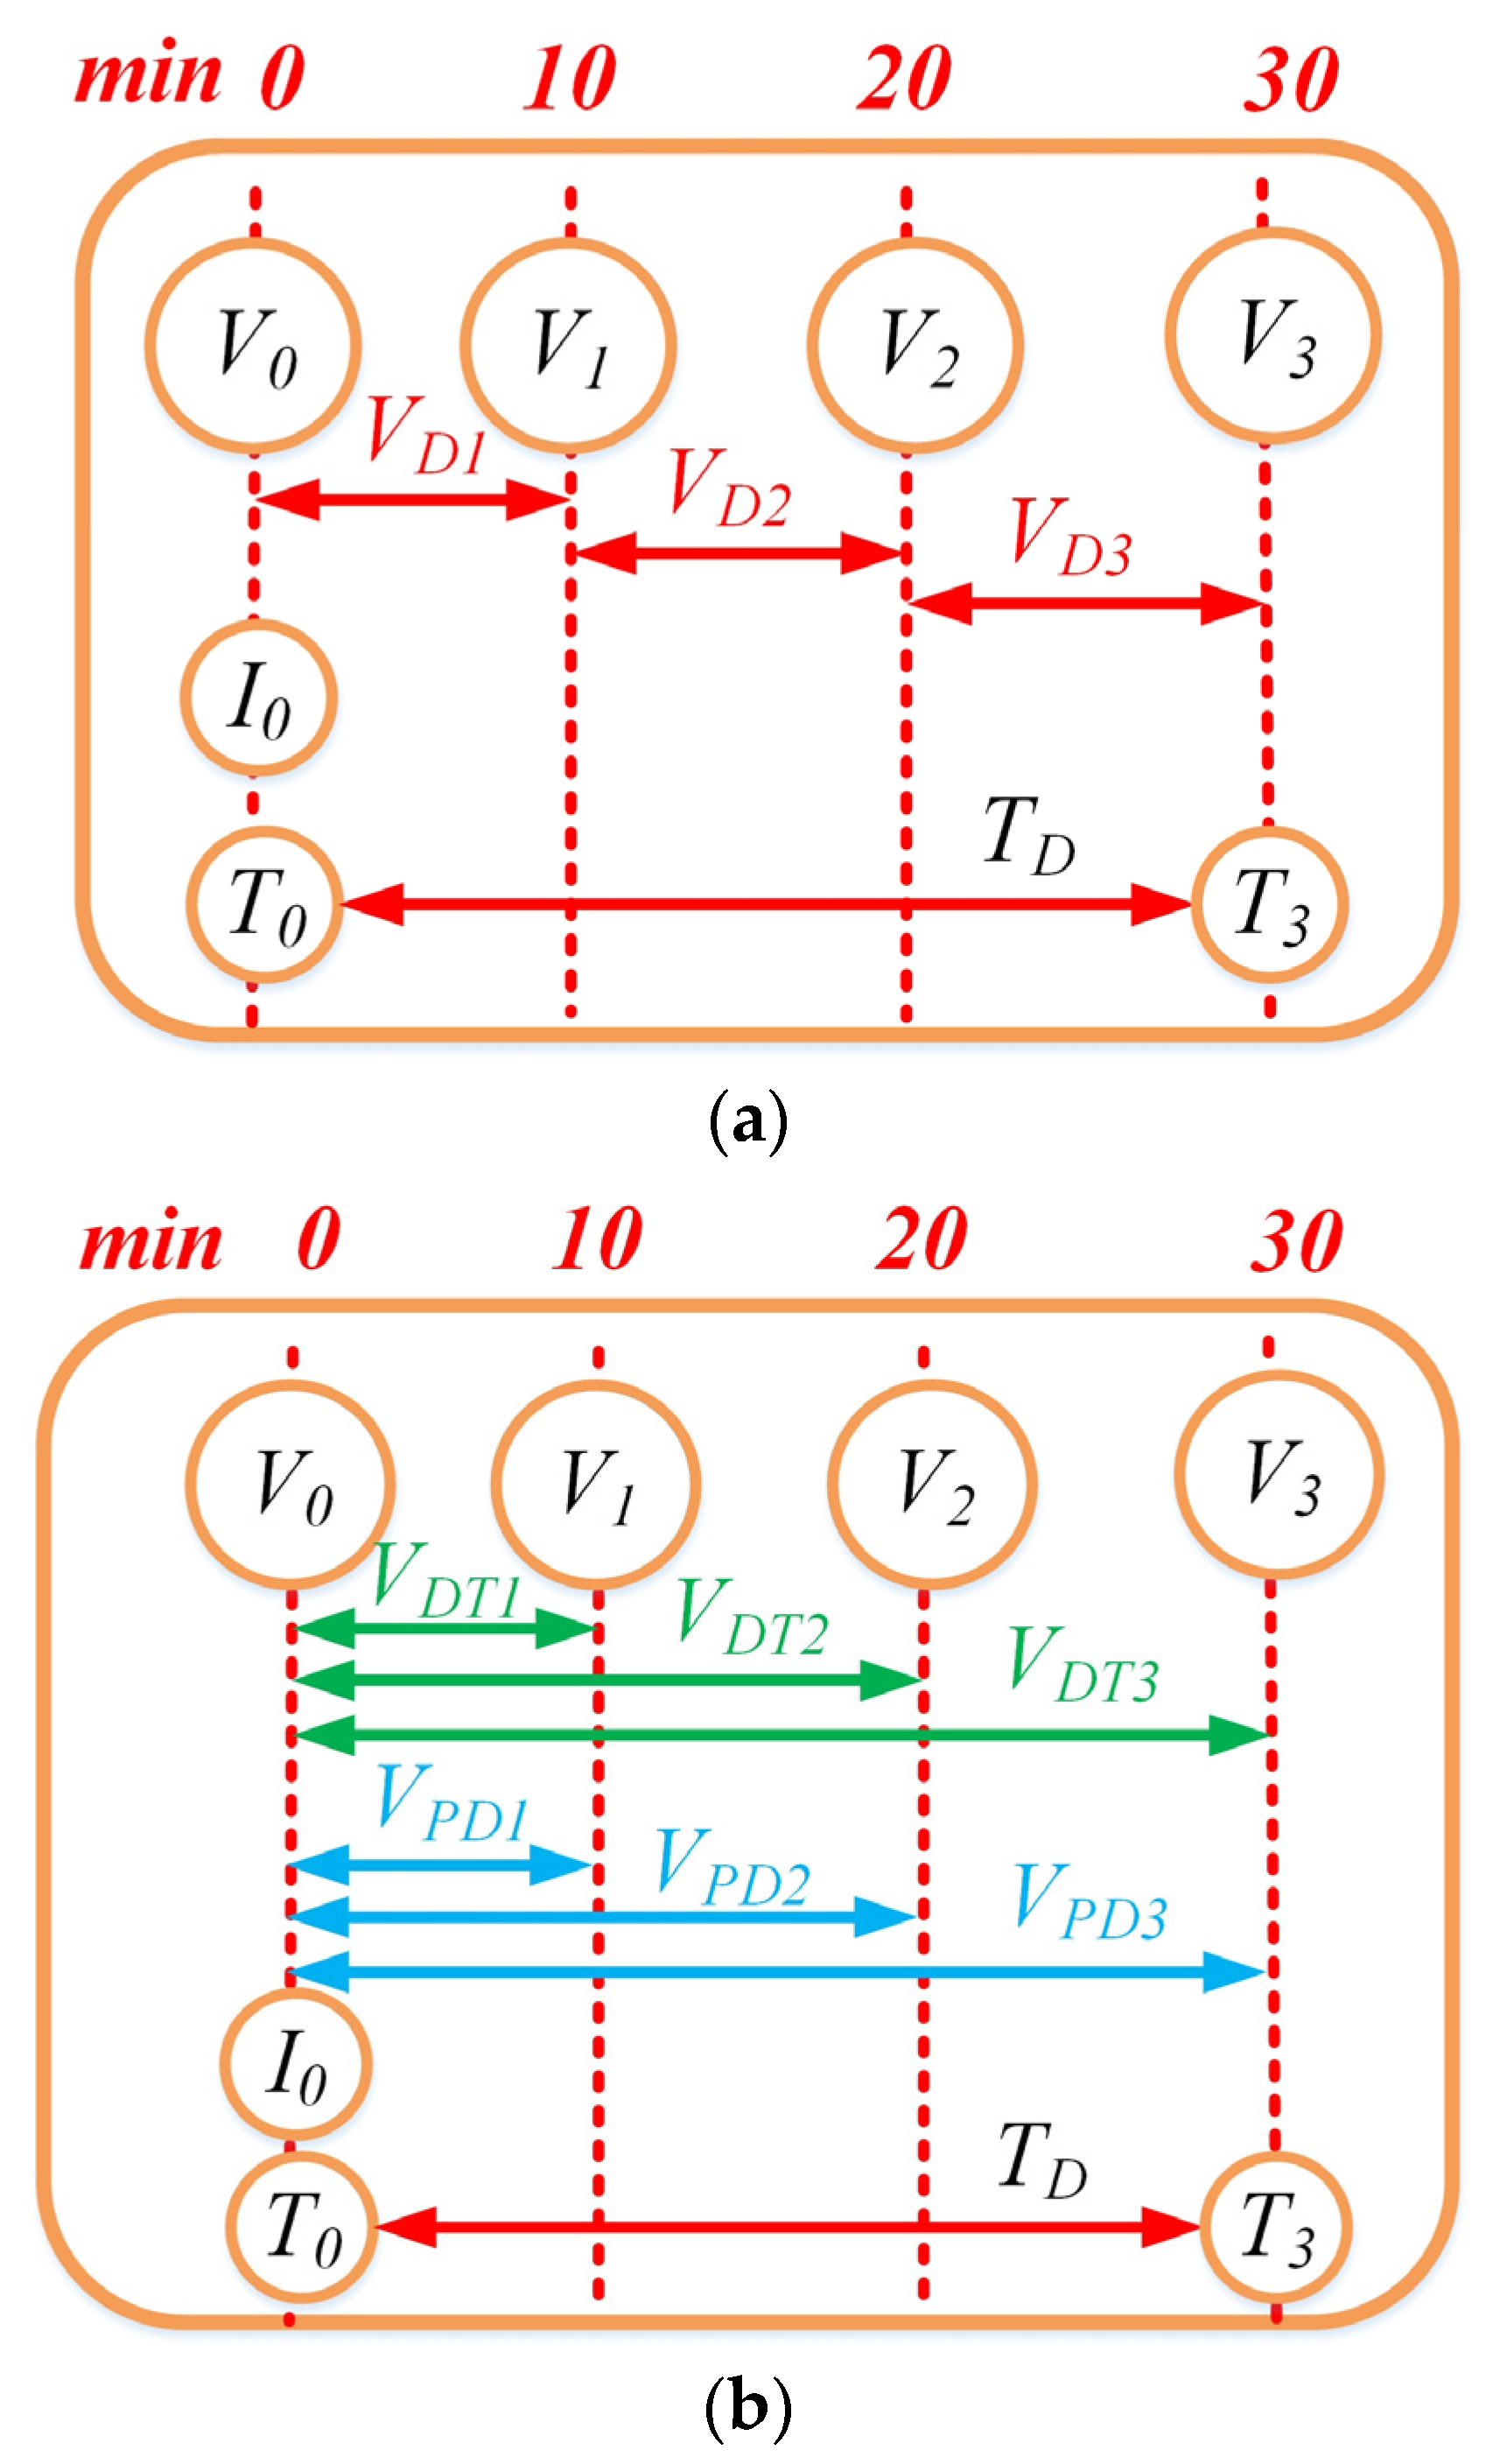
Figure 6 illustrates the discharge voltage profiles for batteries with the SOH levels of 71.5%, 81.5%, and 90.5% measured by the proposed battery acquisition system and calculated by (3).
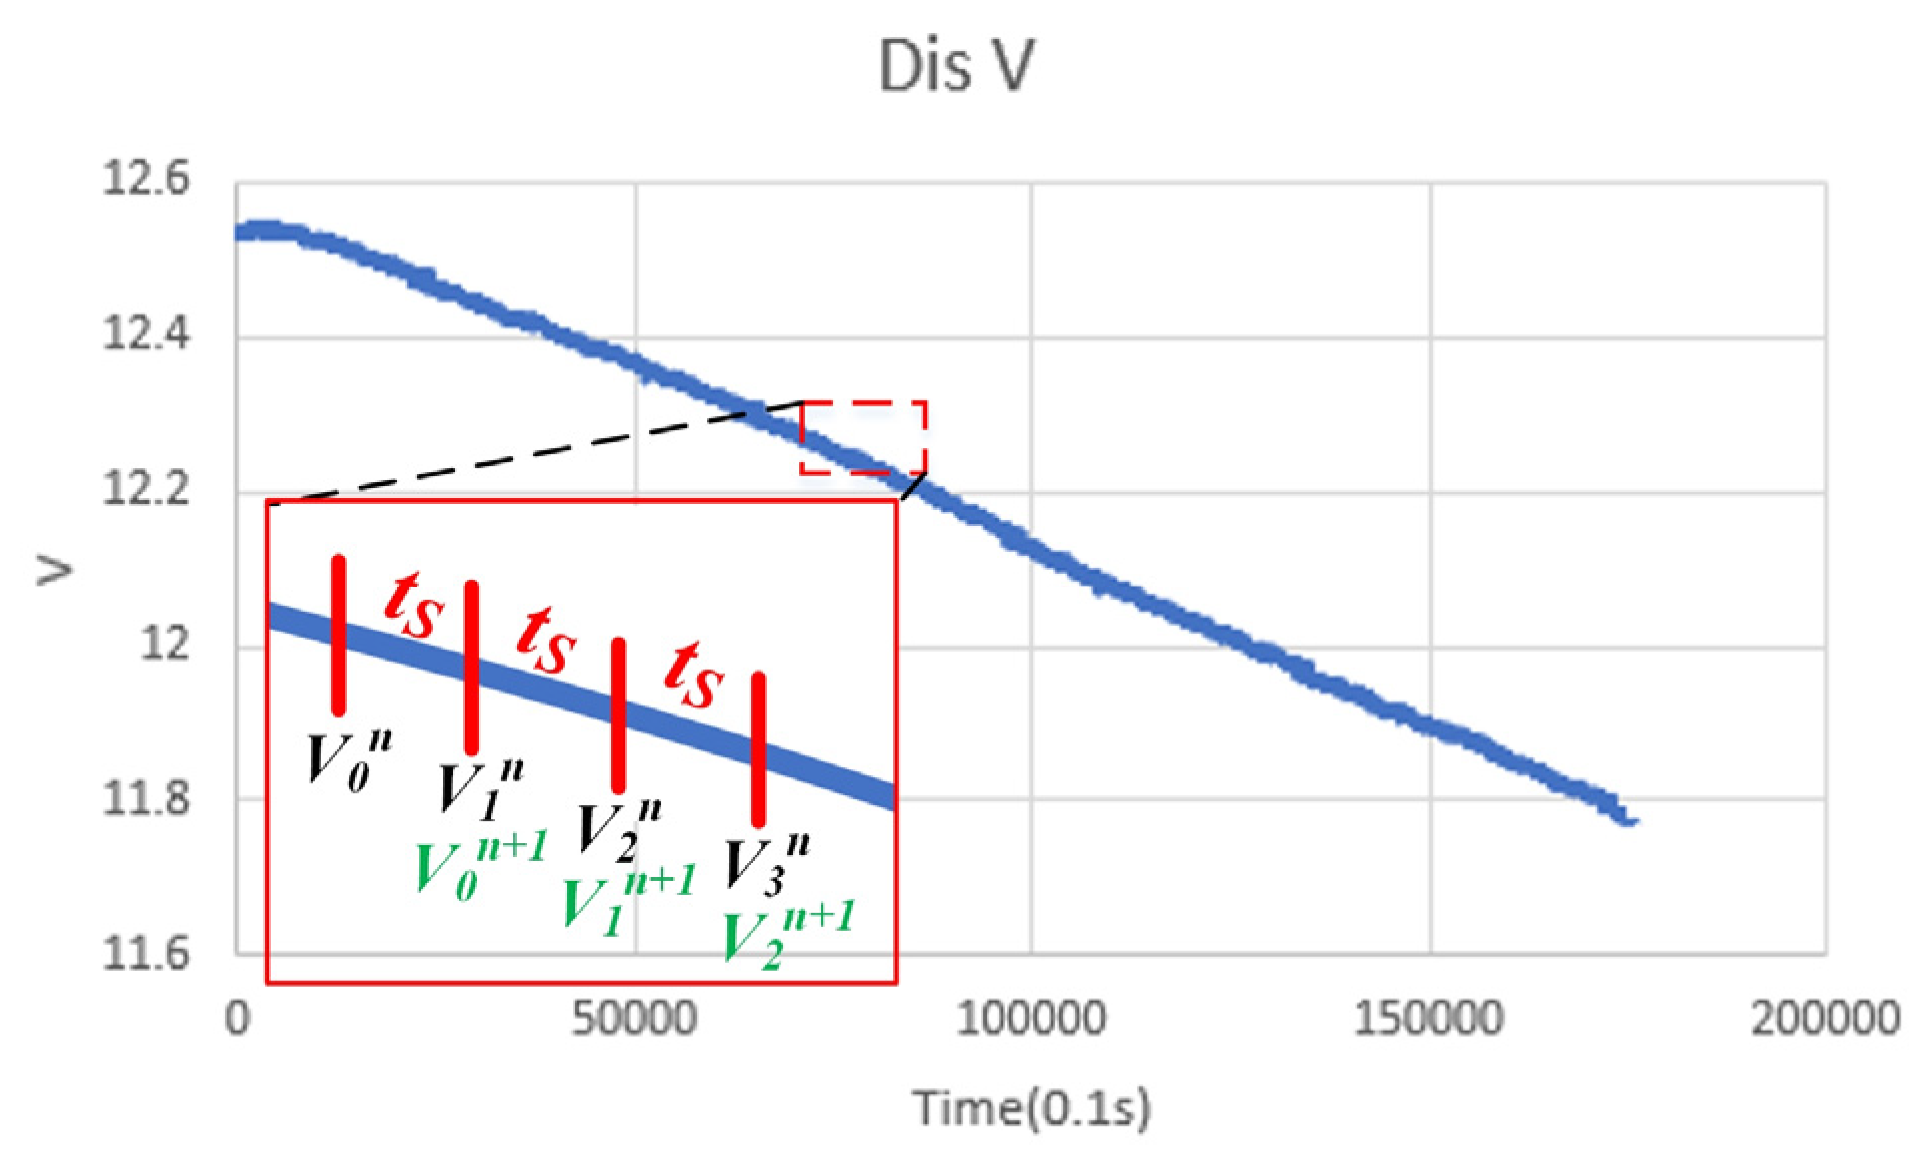
Figure 6 indicates that SOH can be estimated from the discharge voltages and discharging time. Therefore, the features can be designed based on the observations. Some features, such as the discharge voltage difference, the discharge voltage variation over time, discharge voltage percentage deviation, etc., can be extracted for SOH-E. The acquired measurements can be separated into sub-datasets in a specified time interval and utilized to extract the features for SOH-E. The basic concepts of attaining the sub-dataset are shown in
Figure 7, where
tS is the specified time interval, and
n and
n + 1 are the
nth and (
n + 1)th sub-datasets.
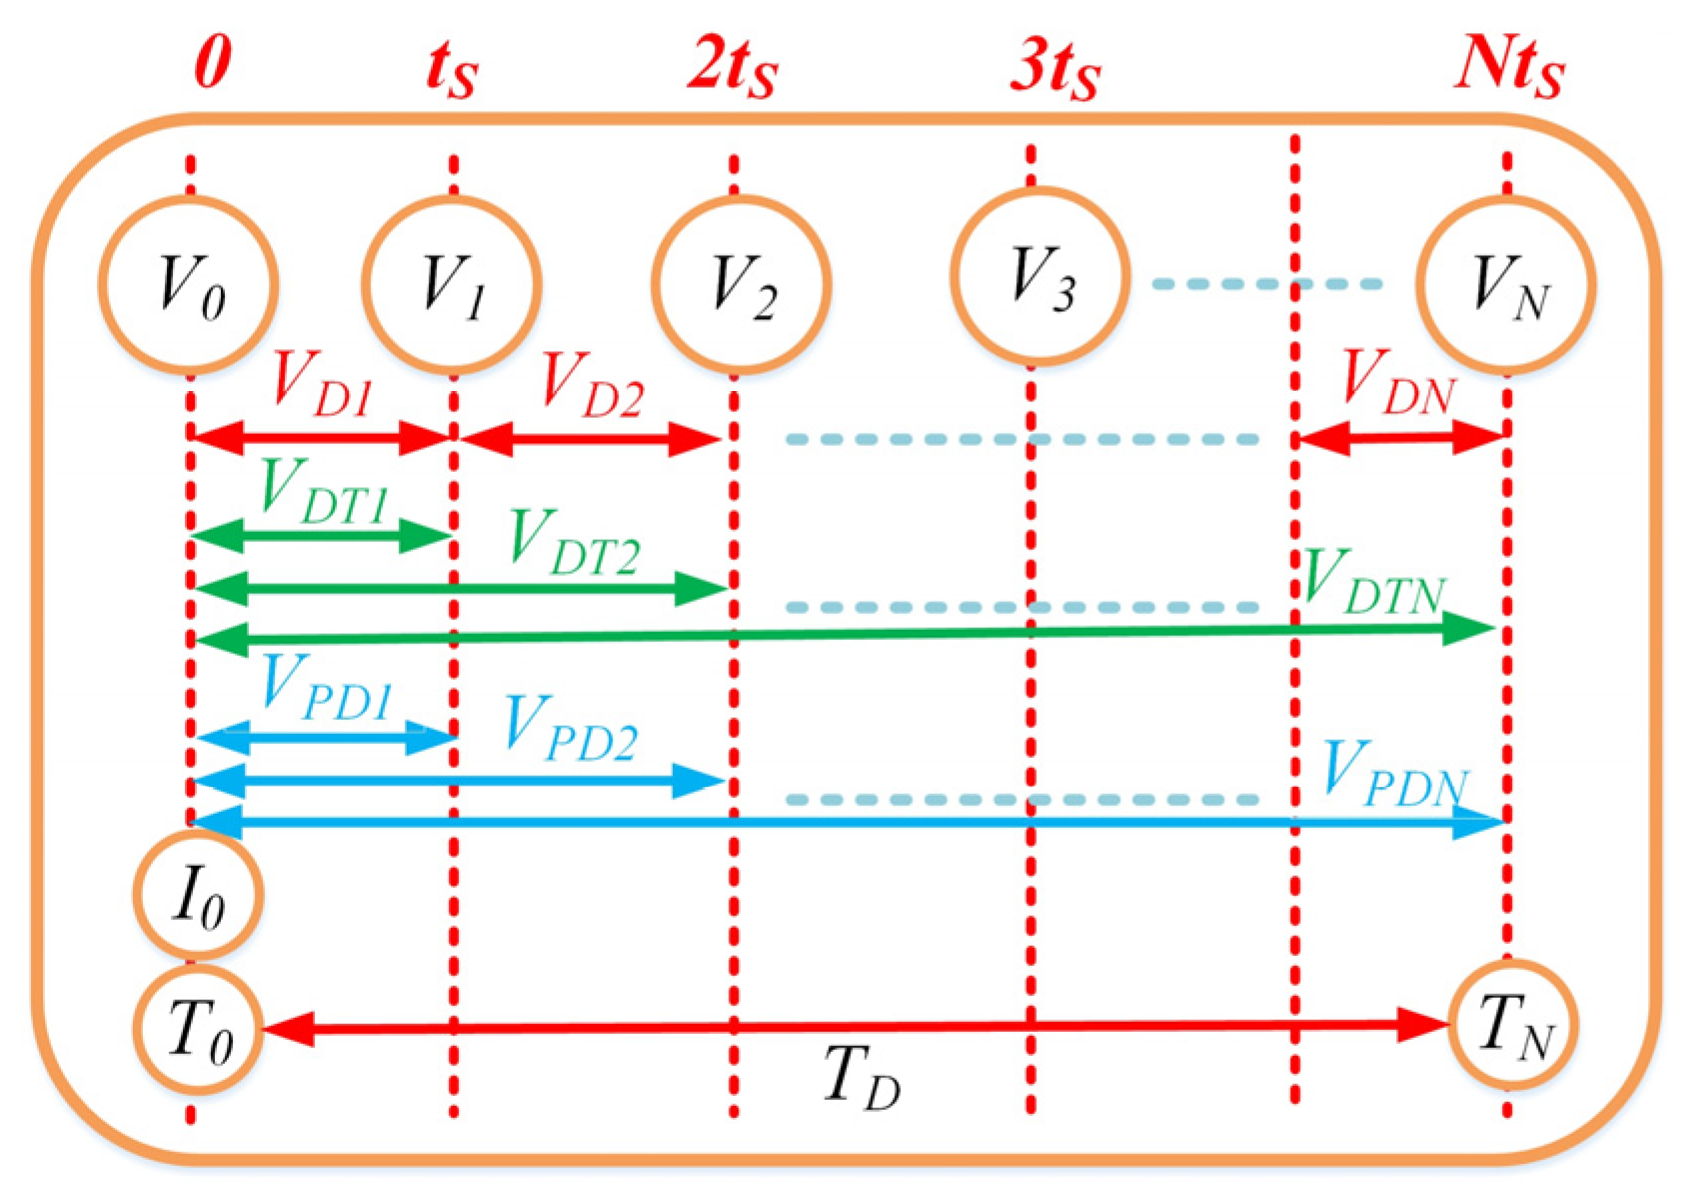
Figure 8 shows the basic concept of the feature value extraction method. In
Figure 8, the discharge voltage difference, discharge voltage variation over time, discharge voltage percentage deviation, and temperature difference can be calculated as follows:
where
and
denote the initial voltage and measured voltage at the
ith
tS.
,
, and
are the discharge voltage difference, discharge voltage variation over time, and discharge voltage percentage deviation between
t = 0 to
t =
i ×
tS, respectively.
TN and
T0 are the temperatures measured at
t = 0 and
t =
N ×
tS, respectively.
TD is the temperature variation.
I0 is the discharge current.
To effectively observe the voltage change in the discharge procedure, it is recommended that the minimum time interval,
tS, and total time for SOH-E are set to 5 min and 30 min, respectively, for retired batteries of the UXH90-12I variety. The time intervals and the number of features will significantly affect the SOH-E’s accuracy and will be tested in
Section 5. This paper proposes two different feature value extractions calculated from the sub-datasets and used in the experiments. The first feature value extraction is based on the observation documented in
Figure 7 in which the voltages and voltage differences are closely related to the SOH. Therefore, the discharge current, discharge temperature difference, discharge voltages, and discharge voltage differences are used. Taking a
tS of 10 min as an example,
Figure 9a depicts a schematic diagram of the first feature value extraction, where
V0,
V1,
V2,
V3,
I0,
TD,
VD1,
VD2, and
VD3 are used. Extending from the first feature value extraction, the values of discharge voltage variation over time and discharge voltage percentage deviation are added.
Figure 9b illustrates the schematic diagram of the second feature value extraction, where
V0,
V1,
V2,
V3,
I0,
TD,
VDT1,
VDT2,
VDT3,
VPD1,
VPD2, and
VPD3 are used.
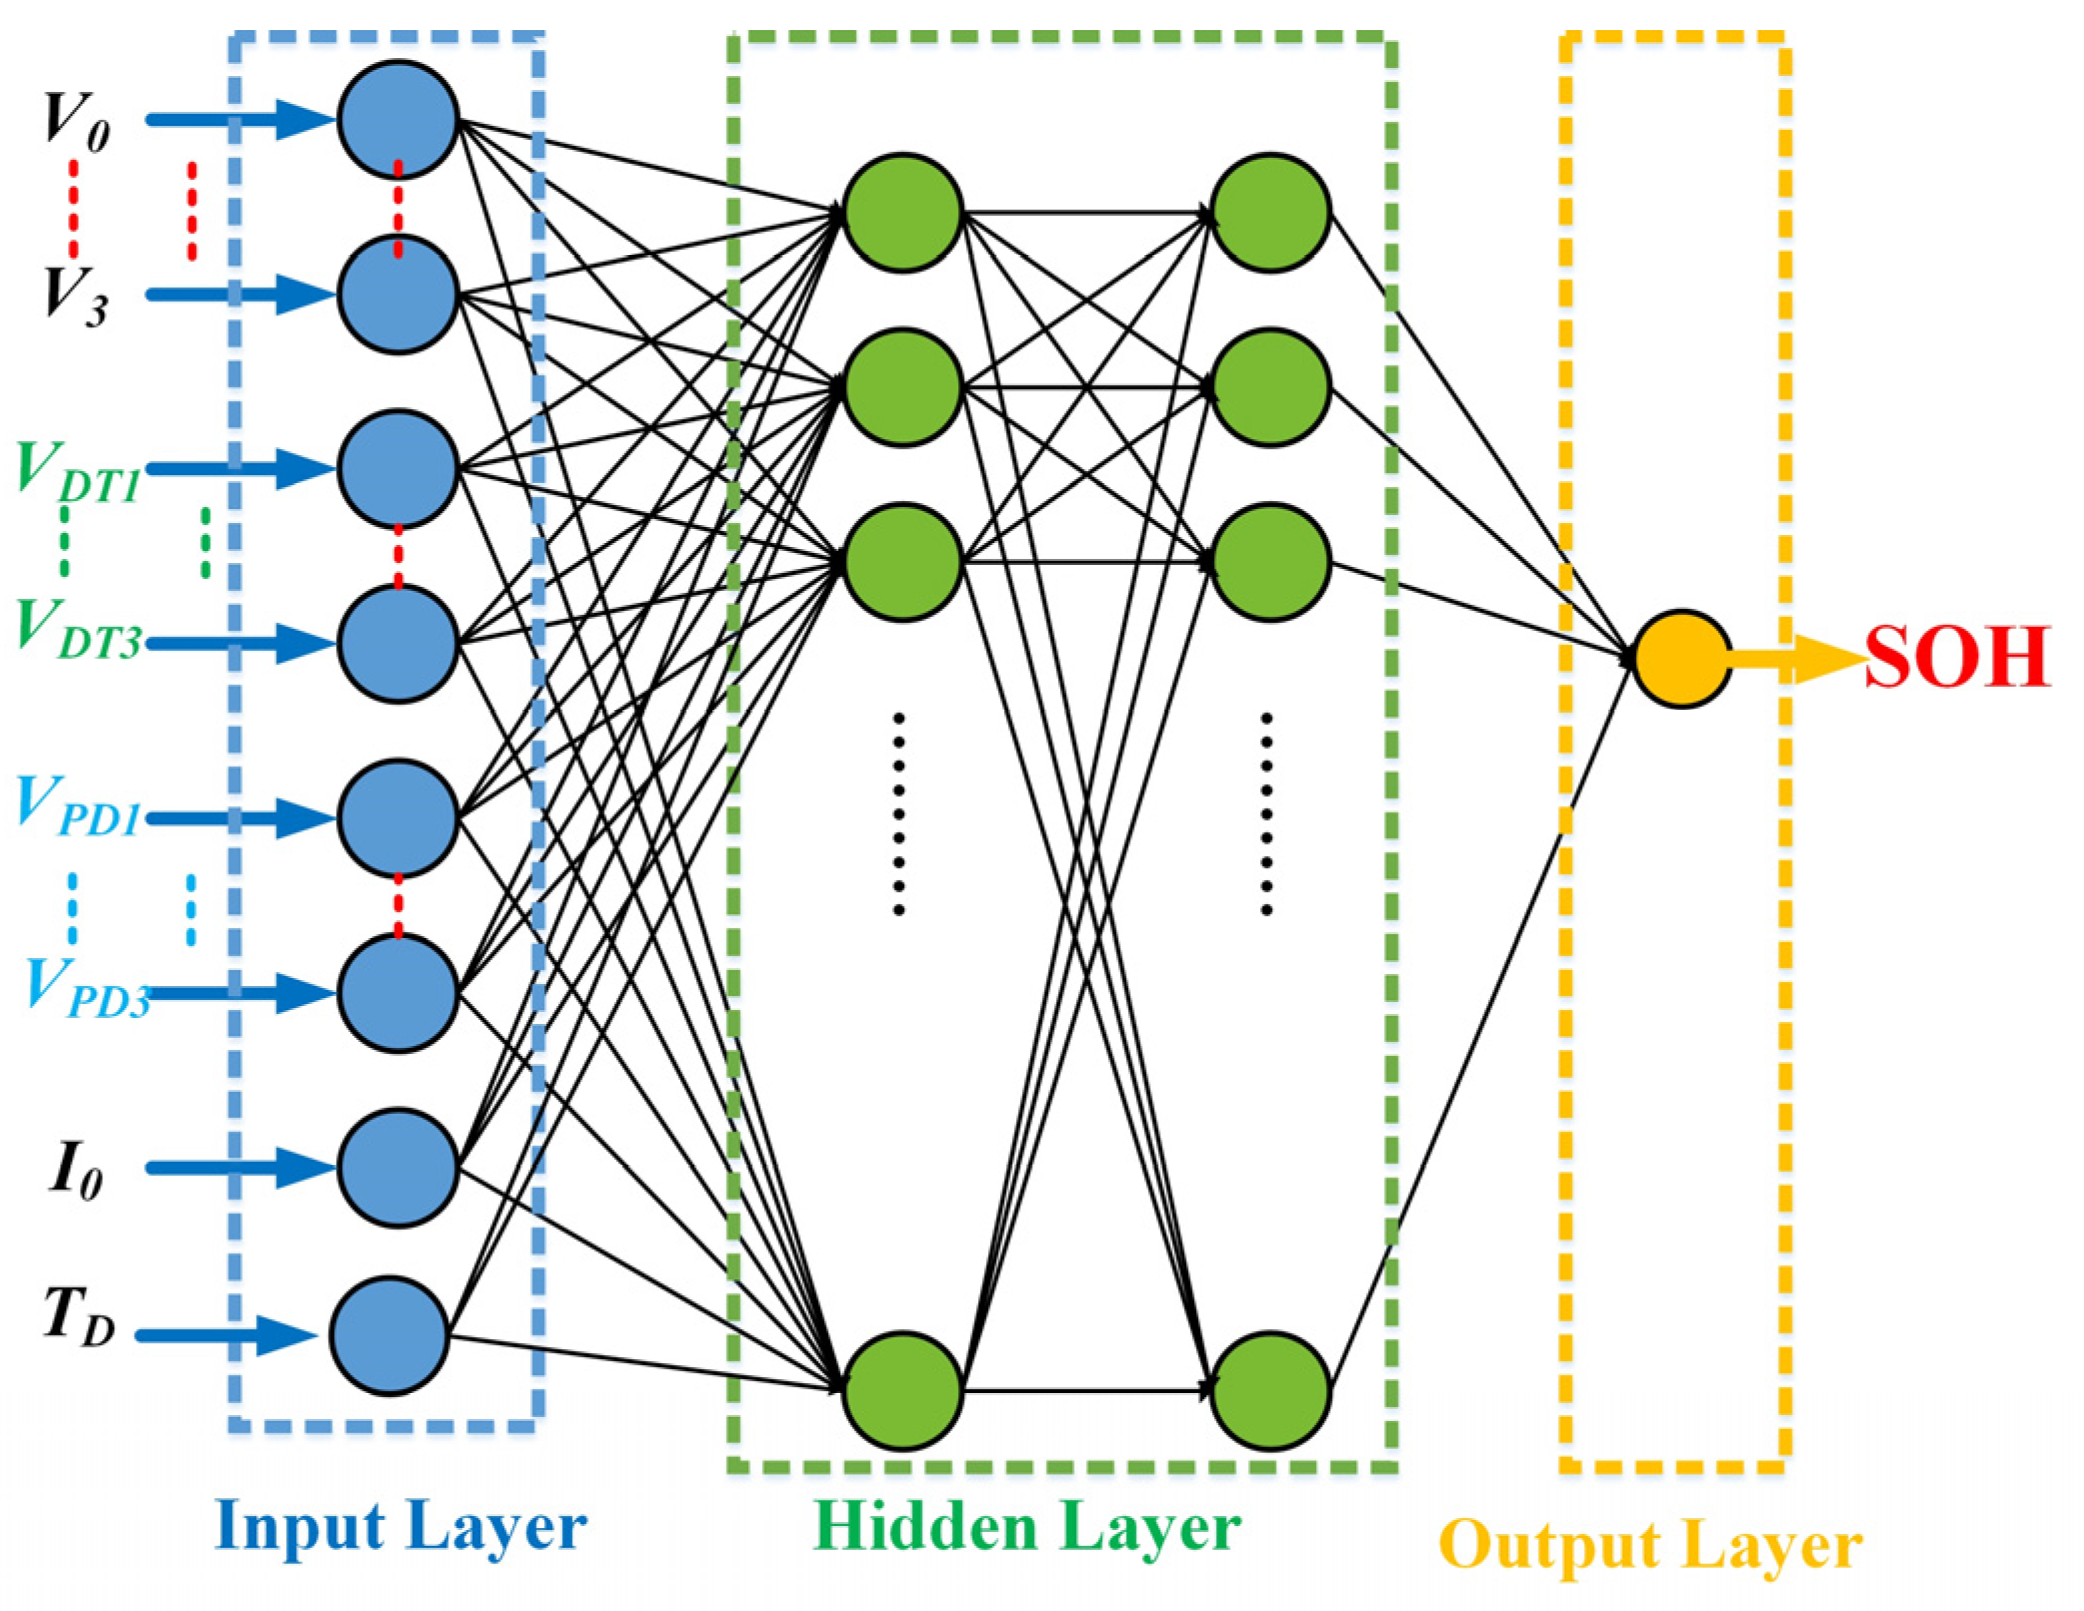
Figure 10 is the architecture of the BPNN used for the second feature value extraction of the proposed SOH-E. It can be observed that the 12 features extracted in 30 min were used; therefore, the SOH can be calculated in about 30 min after the BPNN has been successively trained. For simplification, only the example with a time interval of 10 min is shown in
Figure 9 and
Figure 10; however, the simulation results with intervals of 5 and 15 min are also tested. Aside from the BPNN, LSTMNN is also implemented to estimate SOH in this paper. The detailed descriptions and applications of BPNN and LSTMNN can be found in [
36] and are not discussed herein due to limited space. Note that the charge data can also be used for SOH-E; however, with respect to retired batteries, the use of only discharge data can reduce the equipment investment.
5. Test Results and Discussions
The following experiments utilize one hundred retired lead–acid batteries, of the UXH90-12I variety [
35], which originated from communication base stations. The specifications of the UXH90-12I batteries are listed in
Table 1.
Table 2 shows the batteries’ SOH levels calculated by the complete CHA-DISCH procedures. In
Table 2, “R” is the internal resistance measured by HIOKI BT3554 [
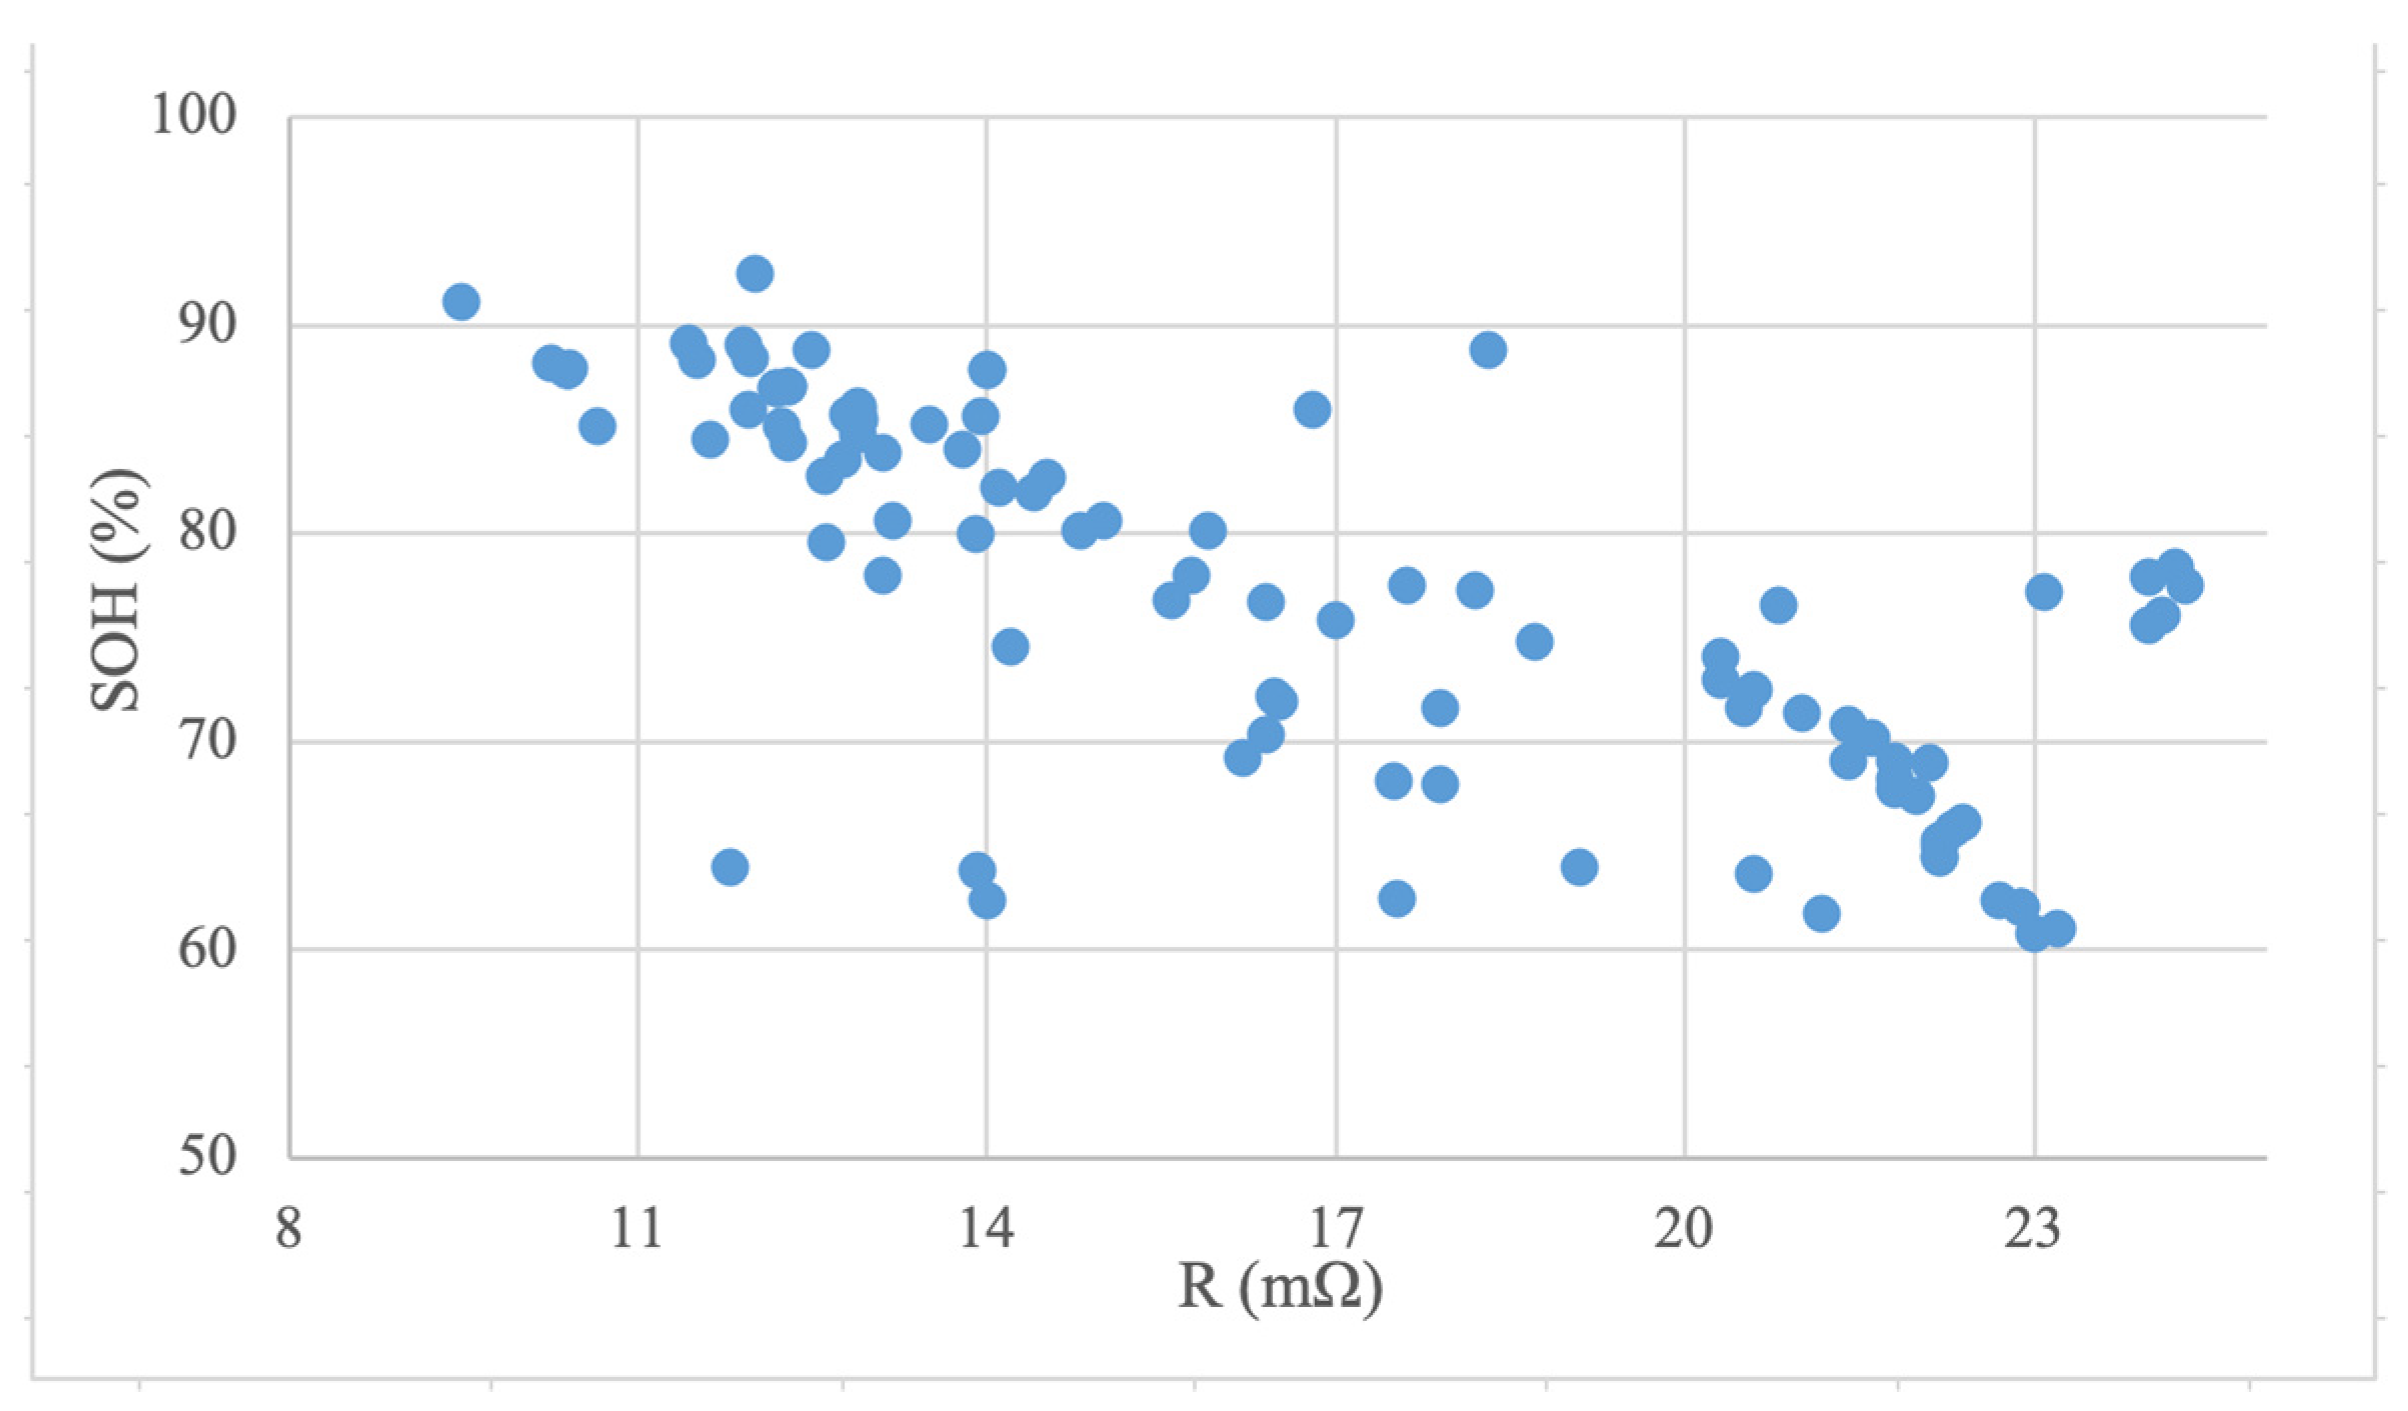
37]. The rated internal resistance of a new UXH90-12I battery is 3.5 mΩ, but the internal resistances of the retired batteries are significantly higher than that of the new battery. The temperature at which internal resistance was measured was about 32 °C. Internal resistance can be one of the bases for SOH-E.
Figure 11 shows the correlation between SOH (%) and R (mΩ). It can be observed that higher internal resistance usually means poorer SOH; however, there is no absolute relationship. The correlation coefficient calculated from
Table 2 is 0.748. Due to the need for additional measurement equipment and the difficulty of applying it online for each battery, the internal resistance is not included in the feature value extraction of the proposed SOH-E.
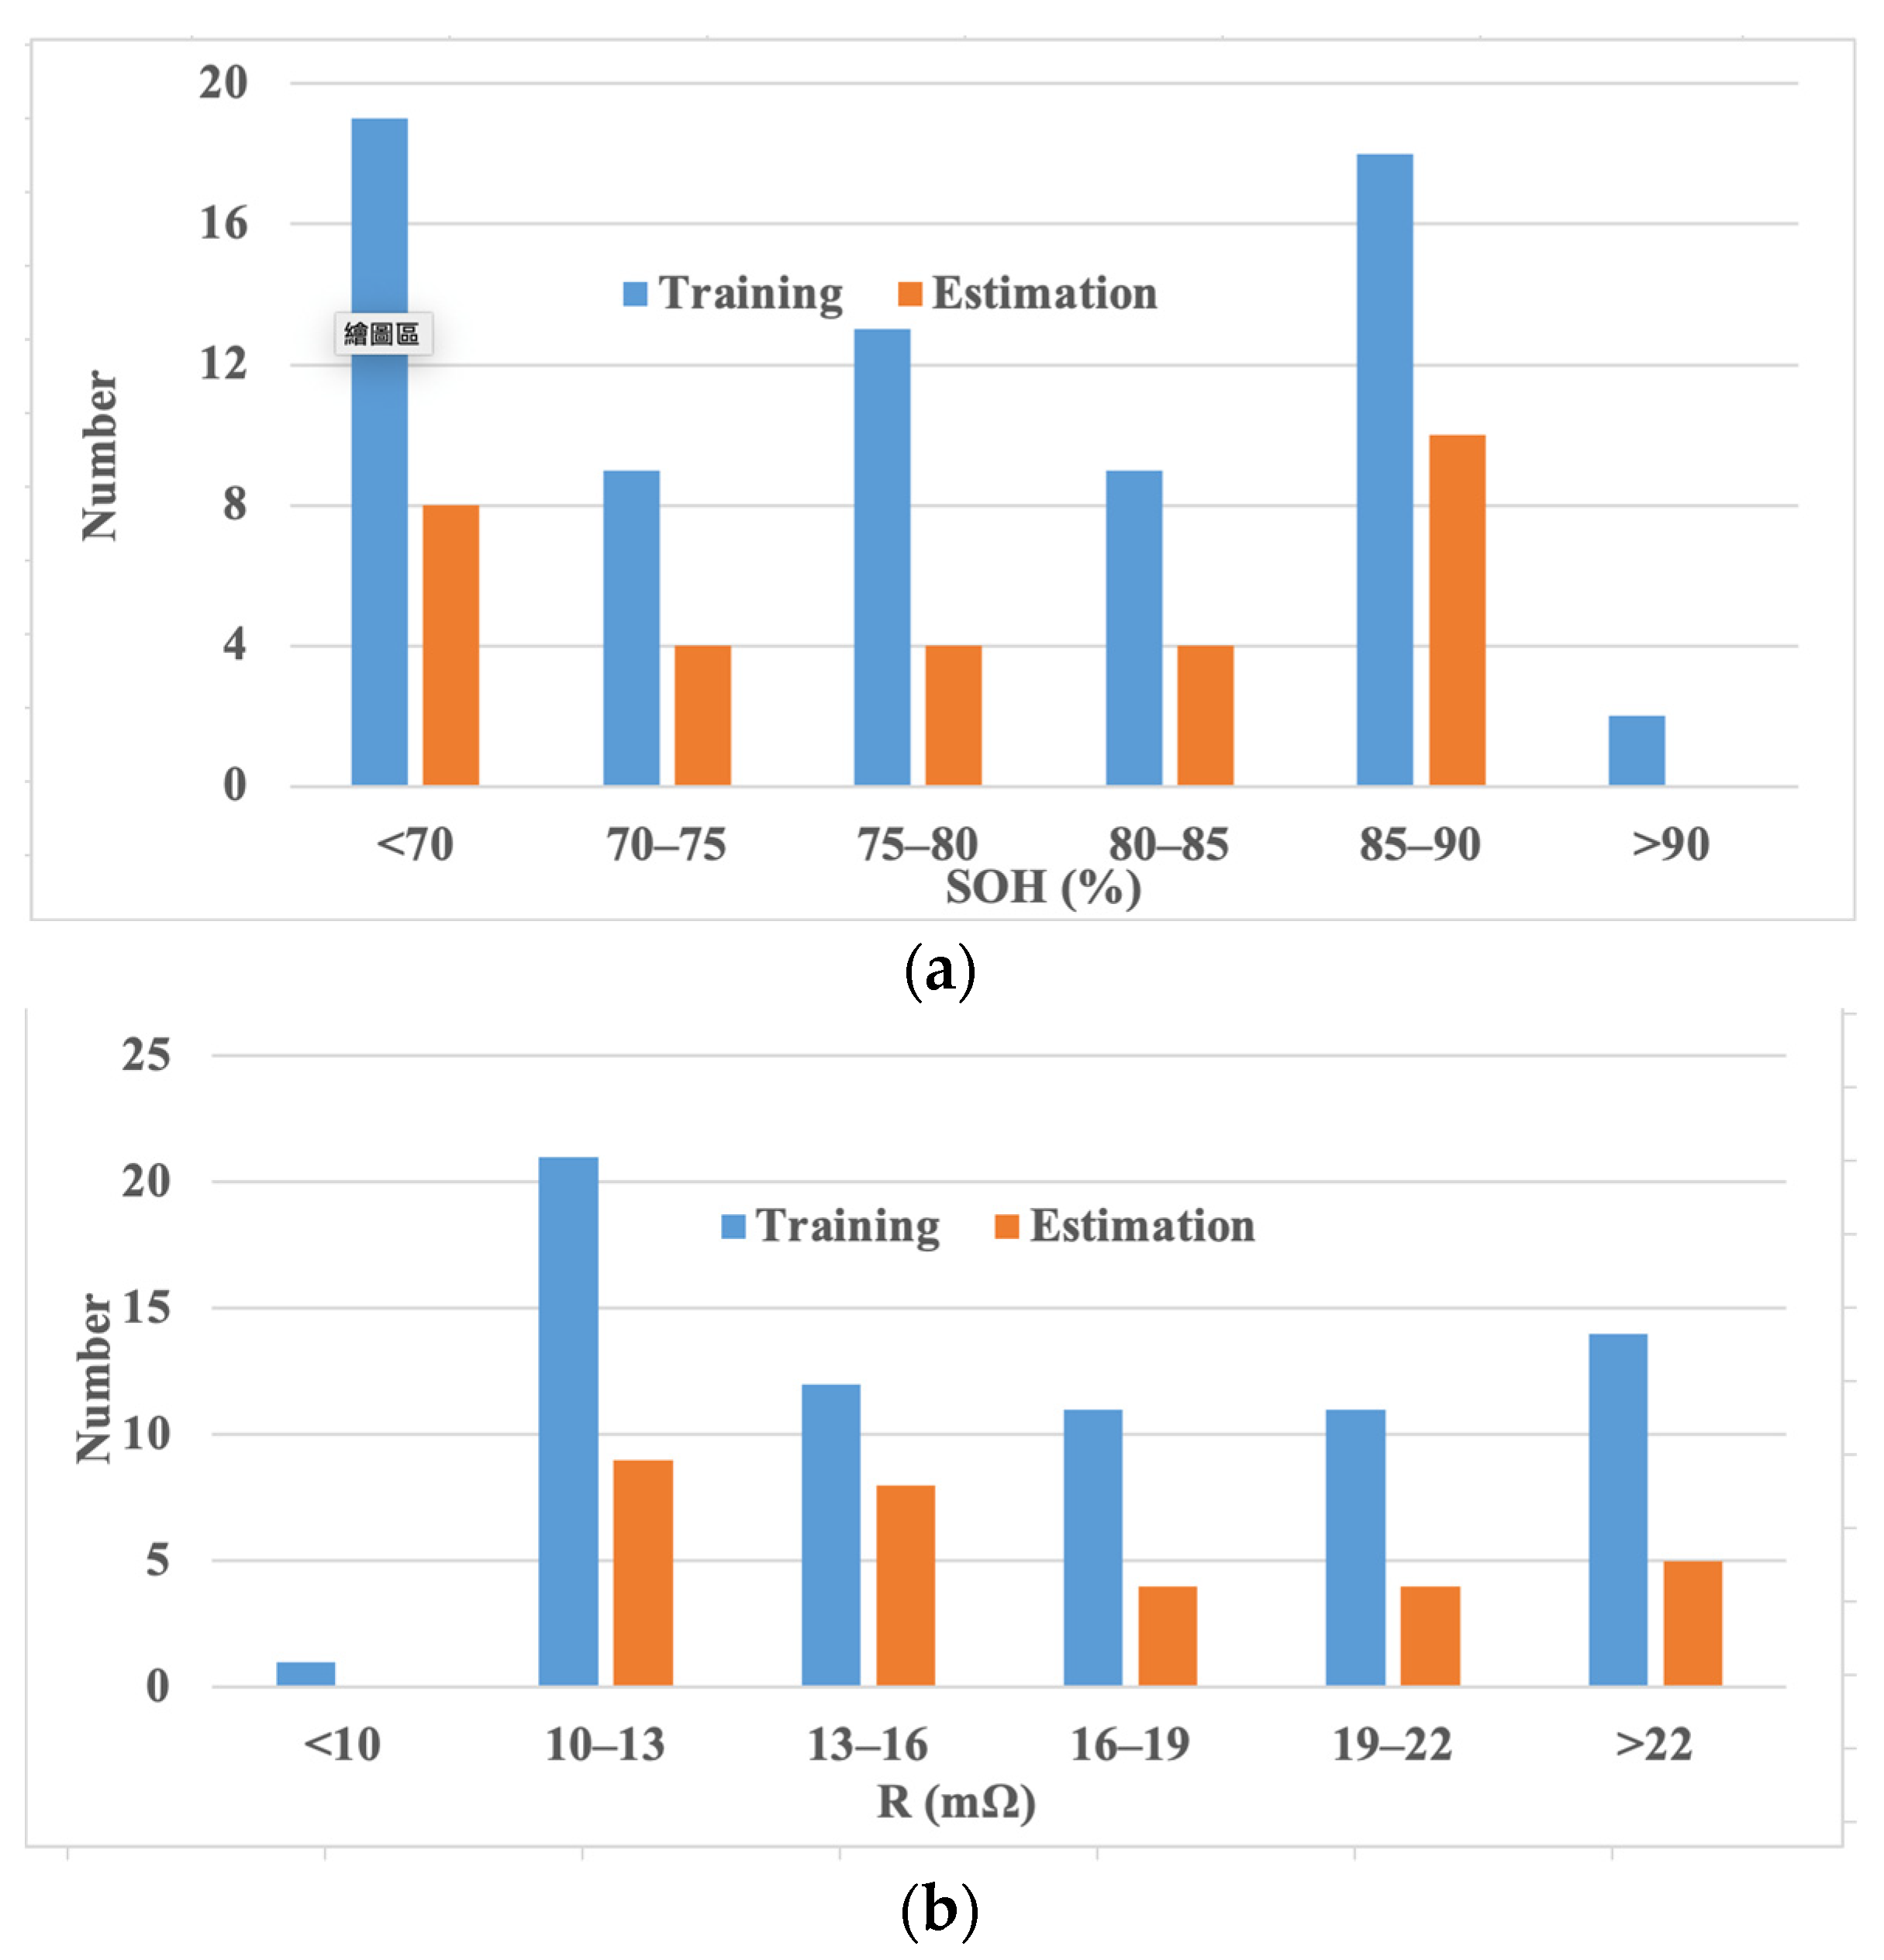
A total of 70% of the retired batteries listed in
Table 2 were used to train the BPNN and LSTMNN according to the feature value extractions illustrated in
Figure 9. The remaining 30% of the batteries were utilized to confirm the estimation accuracies.
Figure 12 shows the number of retired batteries for the intervals of SOH (%) and R (mΩ) used for the training and assessment procedures. It can be observed that the quantities of retired batteries with SOH less than 70% used for training and assessment were 19 and 8, respectively. The number of retired batteries with R(mΩ) between 10 and 13 used for the training and assessment were 21 and 9, respectively. The total numbers of retired batteries used for training and assessment were 70 and 30, respectively. The comparative accuracy indices include the Maximum Error (MxE), Minimum Error (MnE), Mean Absolute Error (MAE), and RMSE. The MAE and RMSE were determined by (7) and (8), respectively.
where
and
are the MAE and RMSE of the batteries’ SOH, respectively.
and
are the estimated and measured SOH levels, respectively. The number of SOH-Es is
n.
Different feature value extractions and time intervals might change the SOH-E accuracy and, consequently, were tested, for which the results are shown in the following material.
Table 3 lists the accuracy comparisons of the BPNN-based SOH-E for two feature extractions. The time interval,
tS, is set as 5 min. For the first feature extraction, the values of
V0,
V1,
V2,
V3,
V4,
V5,
V6,
VD1,
VD2,
VD3,
VD4,
VD5,
VD6,
I0, and
TD are used as the input data. The number of features is 15. For the second feature extraction, the values of
V0,
V1,
V2,
V3,
V4,
V5,
V6,
VDT1,
VDT2,
VDT3,
VDT4,
VDT5,
VDT6,
VPD1,
VPD2,
VPD3,
VPD4,
VPD5,
VPD6,
I0, and
TD are used as the input data. The number of features is 21. The numbers of hidden layers and neurons for the BPNN used in
Table 3 are 3 and 500, respectively. The RMSE, MAE, and MxE of the first feature value extraction are 3.34%, 2.58%, and 16.38%, respectively. The RMSE, MAE, and MxE of the second feature value extraction are 2.81%, 2.23%, and 9.93%, respectively.
Table 3 shows that the second feature value extraction outperforms the first feature value extraction since the discharge voltage variation over time and discharge voltage percentage deviation, as defined in (5) and (6), respectively, are designed as features for SOH-E. In the following comparisons, only the second feature value extraction is investigated.
Table 4 lists the accuracy comparison of the BPNN-based SOH-E for different time intervals. Three time intervals—5, 10, and 15 min, for which the numbers of features are 21, 12, and 9, respectively—were tested.
Table 4 shows that the time interval has no significant effect on the RMSE and MAE, but MxE when the time interval is 5 min—marked in red—performs better. According to the above results, the 5 min interval with the second feature value extraction is the better choice. To improve computational efficiency while performing fewer measurements, an RMSE of 2.87% can still be achieved at 15 min intervals. This indicates that only nine features extracted in 30 min can obtain acceptable SOH-E. The voltage change in the discharge is too small to be distinguished while the time interval is less than 5 min; therefore, further data points were not simulated for inclusion in
Table 4.
Different NN methods with various hidden layers and neurons may significantly affect the accuracy of SOH-E and, therefore, are further simulated and discussed.
Table 5 and
Table 6 list the SOH-E of BPNN and LSTMNN under the hidden layers of 1, 2, and 3 and the neurons of 100, 300, and 500, respectively. Through the training data of 70 retired batteries and verification data of 30 retired batteries, the lowest RMSEs for SOH-E of BPNN and LSTMNN are 2.79% and 2.73% under 3 hidden layers with 300 neurons and 2 hidden layers with 100 neurons, respectively. The lowest MAEs for SOH-E of BPNN and LSTMNN are 2.24% and 2.23% under 3 hidden layers with 300 neurons and 3 hidden layers with 100 neurons, respectively. The average RMSE and MAE of BPNN under different hidden layers and neurons as listed in
Table 5 are 2.96% and 2.38%, respectively. The average RMSE and MAE of LSTMNN under different hidden layers and neurons as listed in
Table 6 are 2.81% and 2.25%, respectively. The average performance of LSTMNN is slightly better than BPNN; however, both NNs obtain similar results. Note that the proposed method can start SOH-E from any measurement point.
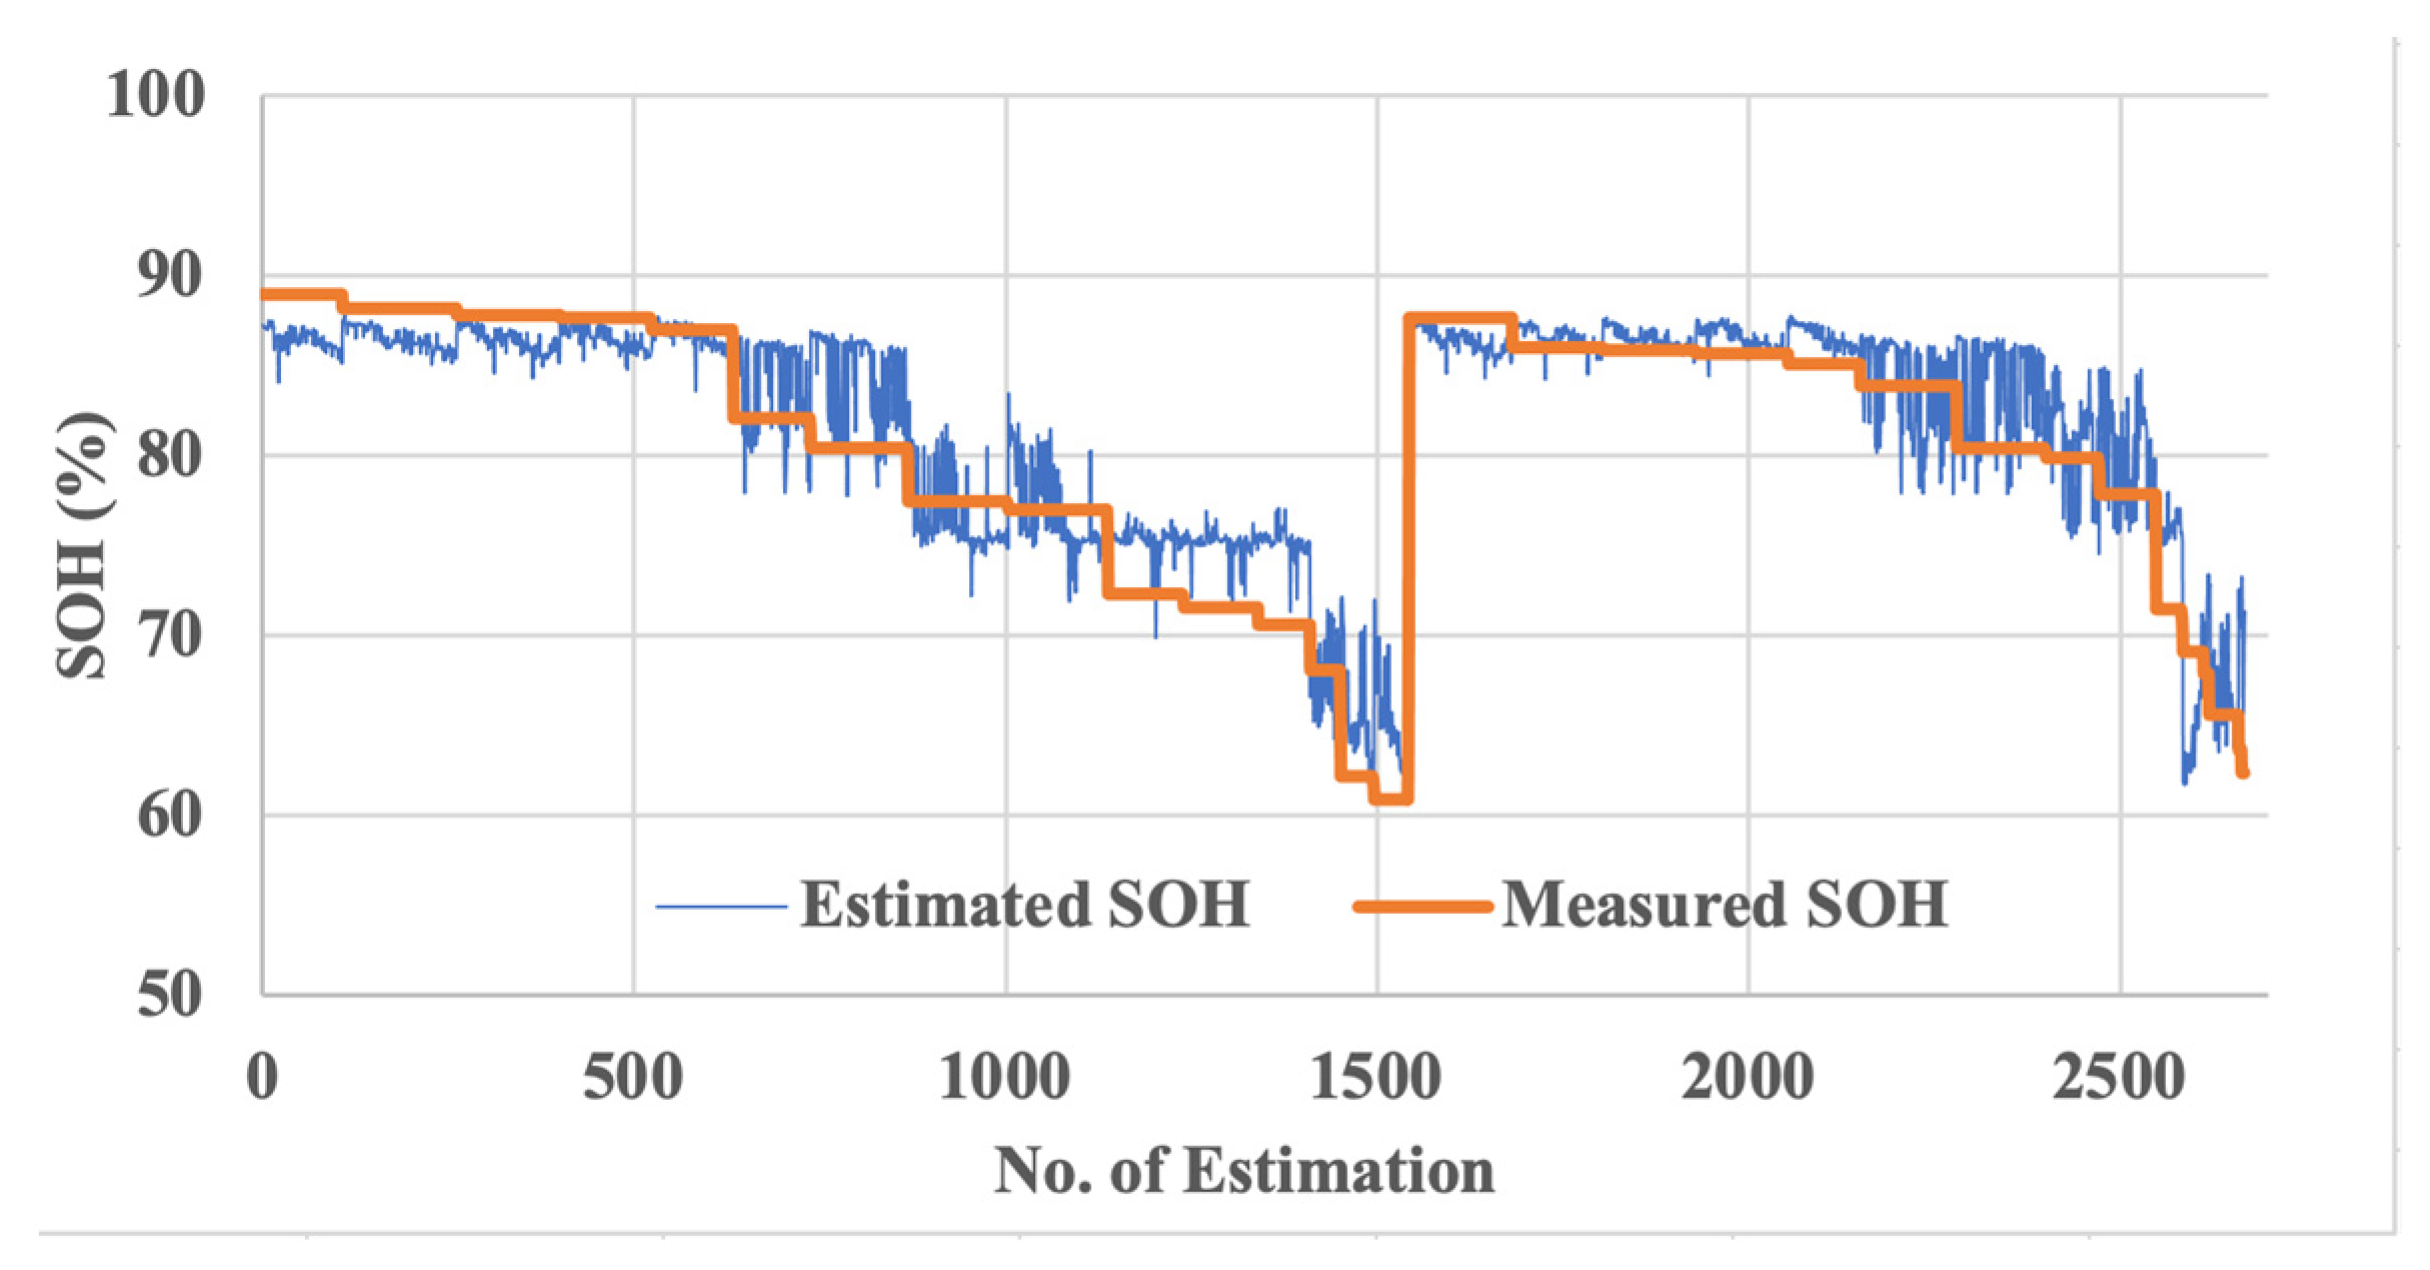
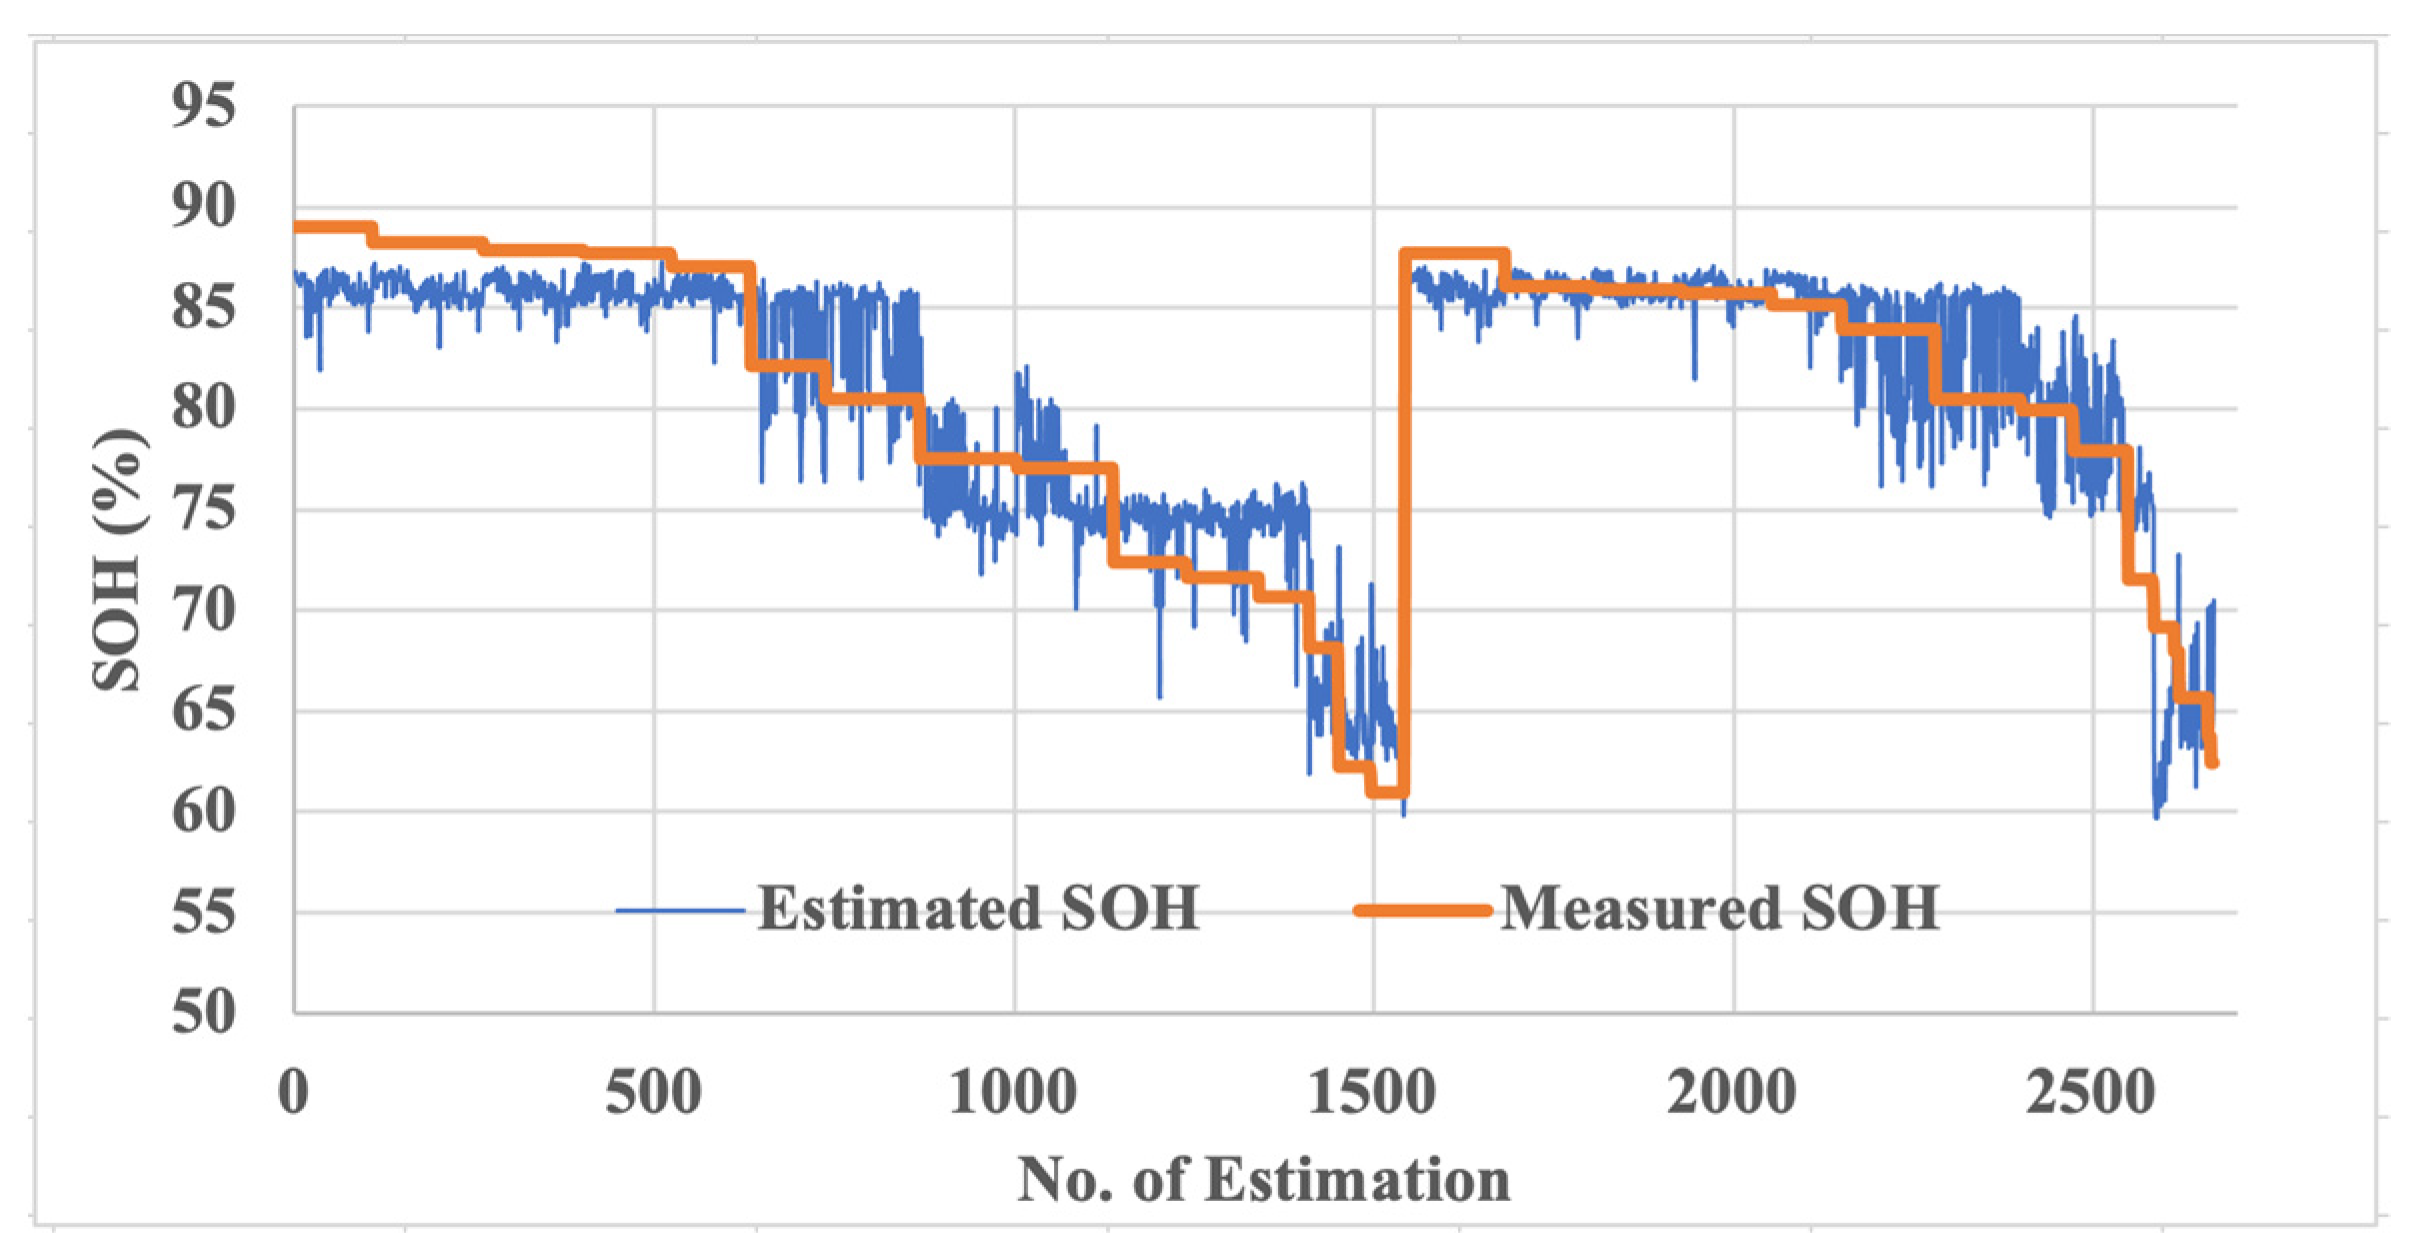
Figure 13 and
Figure 14 show parts of the SOH-E from different measurement points for BPNN and LSTMNN under 3 hidden layers with 300 neurons and 2 hidden layers with 100 neurons, respectively.
Figure 13 and
Figure 14 indicate that the starting point of the measurement does not significantly affect the results of SOH-E. Compared with the SOH-E methods represented in [
4,
5,
6,
7,
8,
9,
10,
11,
12,
13,
14,
15,
16,
17,
18,
19,
20,
21,
22,
23,
24,
25], the proposed method can accurately and effectively estimate the SOH of retired batteries in about 30 min. In addition, the RMSE verified by the retired batteries is lower than 3%. Although the probability of occurrence is small, it can be seen from
Table 5 and
Table 6 that some SOH-Es still have significant errors. In addition to improving them through the use of more training data, integrating different NNs along with varying the data used for the feature extractions may also reduce the maximum estimation error and will be investigated in the future.
6. Conclusions
This paper proposed an accurate and efficient SOH-E method using the actual discharge data of retired batteries. A battery data acquisition system was implemented to attain retired batteries’ CHA-DISCH data. Then, the measurements were separated into sub-data of different time intervals and the features extracted from the sub-data were exploited for SOH-E. The features were utilized to train a BPNN and LSTMNN and applied to evaluate SOH levels. One hundred retired lead–acid batteries were utilized in the experiments. Different time intervals and NNs were simulated. Three time intervals—5, 10, and 15 min, for which the number of features were 21, 12, and 9, respectively—were tested. It was determined that the time interval has no significant effect on the RMSE and MAE; however, the MxE performed better when the time interval was 5 min. The SOH-E of BPNN and LSTMNN under 1, 2, and 3 hidden layers and with 100, 300, and 500 neurons, respectively, were simulated. The average performance of the LSTMNN was slightly better than the BPNN; however, both NNs obtained similar results. The experimental results demonstrated that SOH can be estimated in 30 min and that the RMSE verified by actually retired batteries is less than 3%. It can be observed that the utilization of discharge voltage variation over time and discharge voltage percentage deviation as features can effectively enhance SOH-E accuracy. This paper used discharge data for SOH-E; however, the charging data and the combination of CHA-DISCH data can also be used for SOH-E. Moreover, the proposed SOH-E can also be extended to retired lithium-ion batteries. These issues will be investigated in the future.


