Article

Experimental Measurement and Theoretical Prediction of Bubble Growth and Convection Heat Transfer Coefficient in Direct Contact Heat Transfer

1
Engineering Research Center of Metallurgical Energy Conservation and Emission Reductio, Ministry of Education, Kunming University of Science and Technology, Kunming 650093, China
2
National Joint Engineering Research Center of Energy Saving and Environmental Protection Technology in Metallurgy and Chemical Engineering Industry, Kunming University of Science and Technology, Kunming 650093, China
3
Faulty of Metallurgical and Energy Engineering, Kunming University of Science and Technology, Kunming 650093, China
4
Faulty of Science, Kunming University of Science and Technology, Kunming 650093, China
*
Author to whom correspondence should be addressed.
These authors have contributed equally to this work.
Energies 2023, 16(3), 1069; https://doi.org/10.3390/en16031069
Submission received: 20 November 2022 / Revised: 15 December 2022 / Accepted: 19 December 2022 / Published: 18 January 2023
(This article belongs to the Special Issue Advanced Analysis of Heat Transfer and Energy Conversion)

Abstract

:
The measurement of the two-phase contact area is very important to determine the heat transfer coefficient in the process of direct contact heat transfer, but the direct measurement of the two-phase contact area is a difficult problem. The experiments are carried out utilizing a cylindrical Perspex tube of 100 cm in total height and 15 cm inner diameter. The active column height throughout the experiments is taken to be equal to 50 cm. Liquid Therminol®66 with four different initial temperatures (50 °C, 60 °C, 70 °C and 80 °C) is used as a continuous phase, while liquid R245fa at a constant temperature of 23 °C is used as a dispersed phase. In this paper, the empirical correlations between bubble growth and local convection heat transfer coefficient are obtained through modeling and measurement, and its correctness is verified by experiments. The results show that the bubble diameter is positively correlated with continuous phase temperature, flow rate ratio, and height, but the local convection heat transfer coefficient is negatively correlated with continuous phase temperature, flow rate ratio, and height. At the same time, it is found that the maximum error between the actual bubble diameter and the theoretical bubble diameter is 7%, and the error between the heat flux calculated by the local convection heat transfer coefficient and the actual heat flux is within 10%. This study provides theoretical guidance for an in-depth understanding of the direct contact heat transfer process and the development of high-efficiency waste heat recovery systems.

1. Introduction

A direct contact heat exchanger (DCHE) is a device that directly contacts cold and hot media for heat exchange [1]. A DCHE has great potential for waste heat recovery owing to its advantage of a low-temperature drive (10–100 °C) [2,3,4,5]. To date, many scholars have reported on single bubble dynamics [6,7,8,9,10], bubble group distribution uniformity [11,12,13,14,15,16], and volumetric heat transfer coefficient (VHTC) measurements [17,18,19,20,21,22,23,24,25,26,27,28]. However, determining the heat transfer area is also a key scientific issue in explaining the heat transfer process of the DCHE.
Recently, numerous studies have reported bubble dynamics [6,7,8,9,10]. Edel et al. [6] investigated the flow boiling properties of water in a single brass microchannel. According to the experimental results, the growth rate of bubbles enhances with the increase in wall superheat. As the mass flow increases, the bubble growth is inhibited. Cai et al. [7] established a novel model for the basic heat transfer and mass diffusion mechanism of bubble growth in a homogeneously superheated ethanol–water mixture, showing that the afterward period of bubble growth was primarily affected by mass diffusion. Ghazivini et al. [9] introduced research progress on the bubble growth mechanism and bubble dynamics in boiling. The determination of the empirical correlation formula for the boiling heat transfer coefficient must take into account the bubble dynamics. Mao et al. [10] used a high-speed digital camera to visualize bubble growth characteristics when the supercooled pool was boiling. The experimental results showed that the bubble growth was slow due to the increase in liquid subcooling. Researchers have discussed the heat transfer process from the perspective of a single bubble. However, the study of a single bubble can only be used as a reference and qualitative explanation in engineering practice. This is because it cannot accurately describe the overall state and performance of the heat exchanger. Therefore, it is necessary to explore the relationship between the bubble group and heat transfer performance.
Recently, some studies have also discussed the relationship between bubble group uniformity and the DCHE heat transfer process [11,12,13,14,15,16]. Xu et al. [11,12] used the L2-Star discrepancy uniform coefficient (UCLD) method to evaluate the bubble mixing time. The linear connection was found between the flow pattern of the bubble group and the heat transfer in a DCHE. Xiao et al. [13,14,15] studied the layout of bubble groups in a DCHE both theoretically and experimentally. The experiment indicated that there was a good fitting relation among the uniformity of the bubble group distribution and the heat transfer performance. Sun et al. [16] proposed an average distance method to measure the uniformity of bubble group distribution in a DCHE. The bubble groups in the DCHE were treated as random points. The dimensional distribution of the bubble group was determined by calculating the average distance between bubbles. Xu et al. discussed the heat transfer process from the perspective of bubble group uniformity. The experimental results show that there was a good fitting relationship between the uniformity of bubble group distribution and heat transfer performance. The uniformity of the bubble group can describe the trend of the heat transfer performance. However, it cannot accurately characterize the heat transfer performance. Thus, the heat transfer performance can be accurately expressed by calculating the VHTC.
The contact area of the gas–liquid two-phase is difficult to determine owing to the movement and growth of the dispersed phase. The VHTC has been used as an indicator to characterize the direct contact heat transfer performance in many studies [17,18,19,20,21,22,23,24,25,26,27,28]. Mahood et al. [19,21] used a short column to conduct experimental research on the VHTC of a direct contact condenser. They concluded that the VHTC decreases with increasing time and continuous phase mass flow. Nomura et al. [22,23,24] studied a DCHE using erythritol as the phase change material. The correlation equation of the VHTC was derived in the process of phase change heat. Barabash et al. [25] used the internal volume of a short vertical tube as the active area for heat and mass transfer. The empirical relationship between heat and mass transfer was obtained. Fu et al. [26,27,28] studied the area of the liquid–liquid direct contact interface during the heat transfer process of direct contact vaporization. The correlation formula for the VHTC was determined. The VHTC has been used to evaluate heat transfer performance in many studies, but it cannot accurately reflect the heat transfer process. The continuous phase volume is mistaken for the contact volume of the dispersed and continuous phases. However, the dispersed phase was not in contact with all the continuous phases. Therefore, it is necessary to accurately describe the direct contact heat transfer performance by determining the two-phase contact area and obtaining convective heat transfer coefficient.
The goal of this study was to solve the difficulty of measuring the contact area of two phases in the process of direct contact heat transfer. Therefore, the empirical relationship between bubble growth and the local convection heat transfer coefficient was established and verified through models and experiments. In this investigation, the convective heat transfer coefficient accurately characterized the heat transfer performance of the DCHE and described the heat transfer process.

2. Experimental and Research

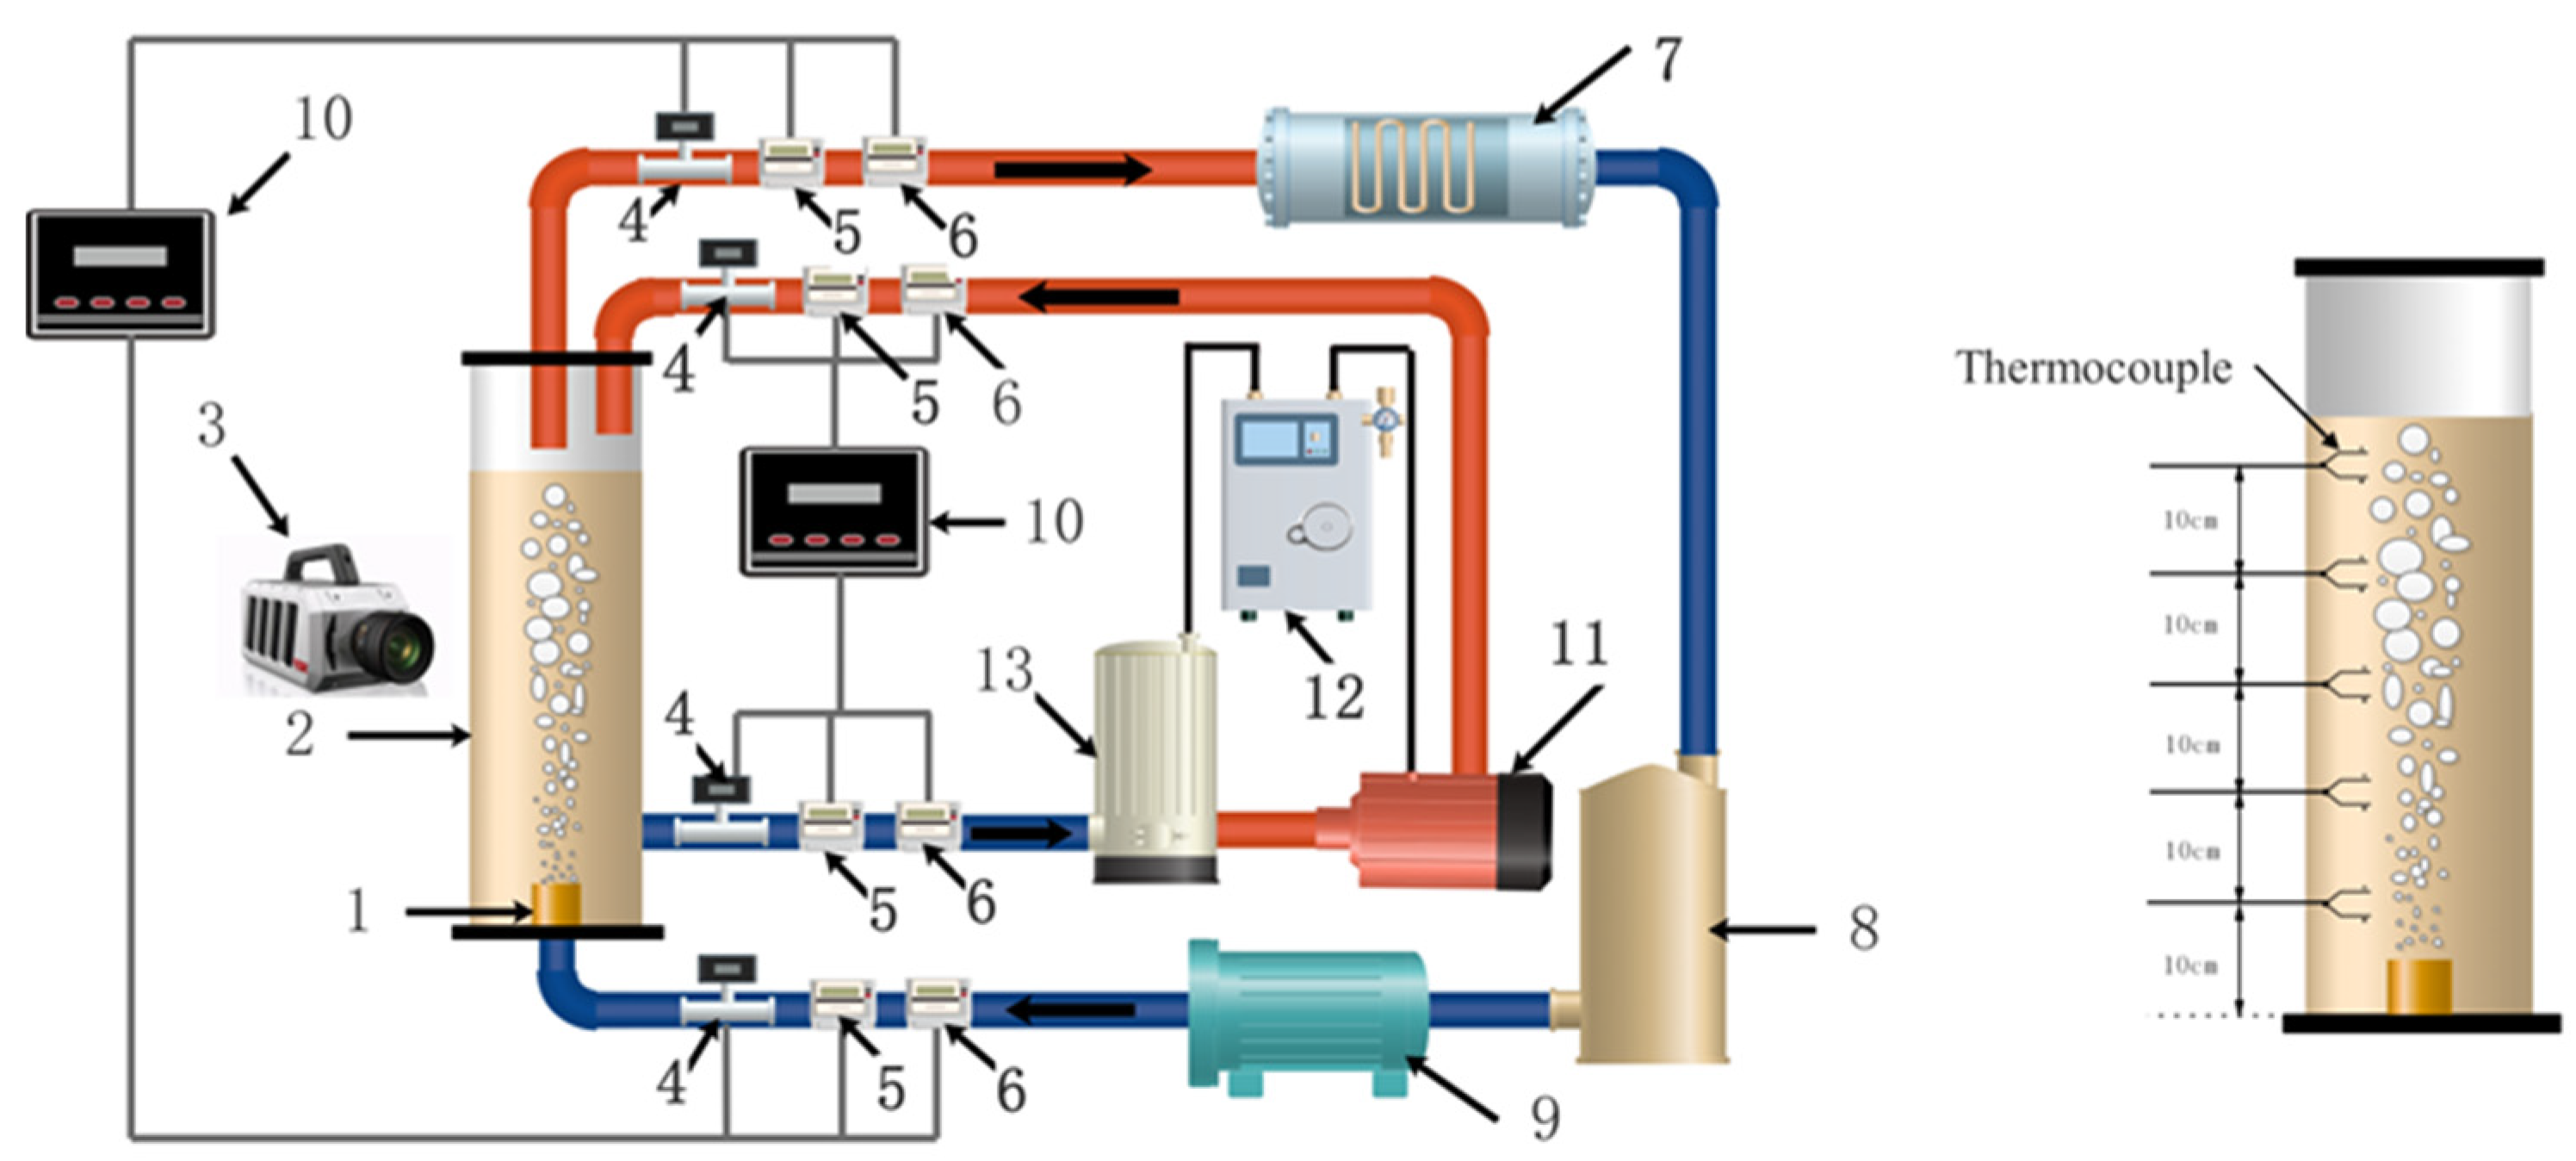
2.1. Experimental Setup

The experimental setup is shown in Figure 1. The experimental procedure was composed of the Therminol®66 circulation and R245fa circulation. The Therminol®66 circulation loop consists of a DCHE, gear oil pump (ZCY-1.08, Wenzhou City, Zhejiang Province, China), temperature controller (MDBK-1P-1.1, Jinhua City, Zhejiang Province, China), and an electric heating device (YKX, Yancheng City, Jiangsu Province, China). The overall height of the DCHE was 100 cm, the inner diameter was 15 cm, and the effective height was 50 cm. The R245fa circulation loop consists of a DCHE, condenser, centrifugal pump (ISG25-125, Shanghai City, China), and liquid storage tank. The thermophysical properties of the continuous phase are exhibited in Table 1. The thermophysical characteristics of the dispersed phase are exhibited in Table 2.

2.2. Experimental Process

Therminol®66 (continuous phase) in the DCHE was heated by a heater and afterward supplied to the heat exchanger by an oil pump. First, therminol®66 was heated to the desired temperature in a heater. Then, Therminol®66 was injected from the upper end of the DCHE in a continuous state, and it was ensured that the liquid level reached the required liquid level. There were flowmeters (DN12, Target Type Flowmeter, Huai’an City, Jiangsu Province, China) and a temperature gauge (XMT-101, Nanjing City, Jiangsu Province, China) and pressure gauge (2088, Shanghai City, China), which were used to gauge the flow, temperature, and pressure of the inlet and outlet of Therminol®66. The constant temperature (23 °C) liquid R245fa was sent from the refrigerant storage tank to the DCHE through a centrifugal pump. The liquid mass flow at the inlet of the R245fa was gauged by a flowmeter (DN8, Target Type Flowmeter, Huai’an City, Jiangsu Province, China). In order to gauge the R245fa gas mass flow at the outlet, a flowmeter (DN6, Target Type Flowmeter, Huai’an City, Jiangsu Province, China) was installed. In the DCHE, R245fa and Therminol®66 perform direct contact heat exchange. The R245fa underwent a phase change from liquid to gas. Finally, the R245fa steam entered the condenser from the top through the seamless steel pipe. In the condenser, the R245fa steam was condensed and returned to the R245fa storage tank.
Five standard thermocouples were used for the measure temperatures at different locations. These thermocouples were fixed at different heights in the axial direction of the direct contact heat exchanger (Z1 = 10 cm, Z2 = 20 cm, Z3 = 30 cm, Z4 = 40 cm, and Z5 = 50 cm). The thermocouples were connected to a temperature recorder (TS-16A, Shenzhen City, Guangdong Province, China). The measured temperature was displayed on the screen.
The first step in the experiment was to heat the Therminol®66. The heater is operated by a temperature controller to ensure that the heat transfer oil reaches the required temperature (50 °C, 60 °C, 70 °C, 80 °C). Then, the Therminol®66 was injected into the DCHE. During the experimental cycle, the heat transfer oil inlet temperature was kept constant. The efficacious height of the Therminol®66 remained constant in dynamic equilibrium.
When the Therminol®66 reached the required temperature, the refrigerant was supplied to start the experiment. The flow rate of the refrigerant was operated using a centrifugal pump. The instrument was calibrated before the start of the operation. During the experiment, the temperature, the pressure, and the flow rate of the entrance and export of the R245fa and Therminol®66 were recorded every second. When the R245fa and the Therminol®66 started to exchange heat, a high-speed camera was used to capture the heat exchange process of the refrigerant in the heat exchanger. After each set of experiments, the test bench must be cooled to a temperature below 20 °C. Lastly, the refrigerant vapor was condensed into a liquid state by the condenser and then sent back to the liquid storage tank. The experimental working conditions are shown in Table 3.

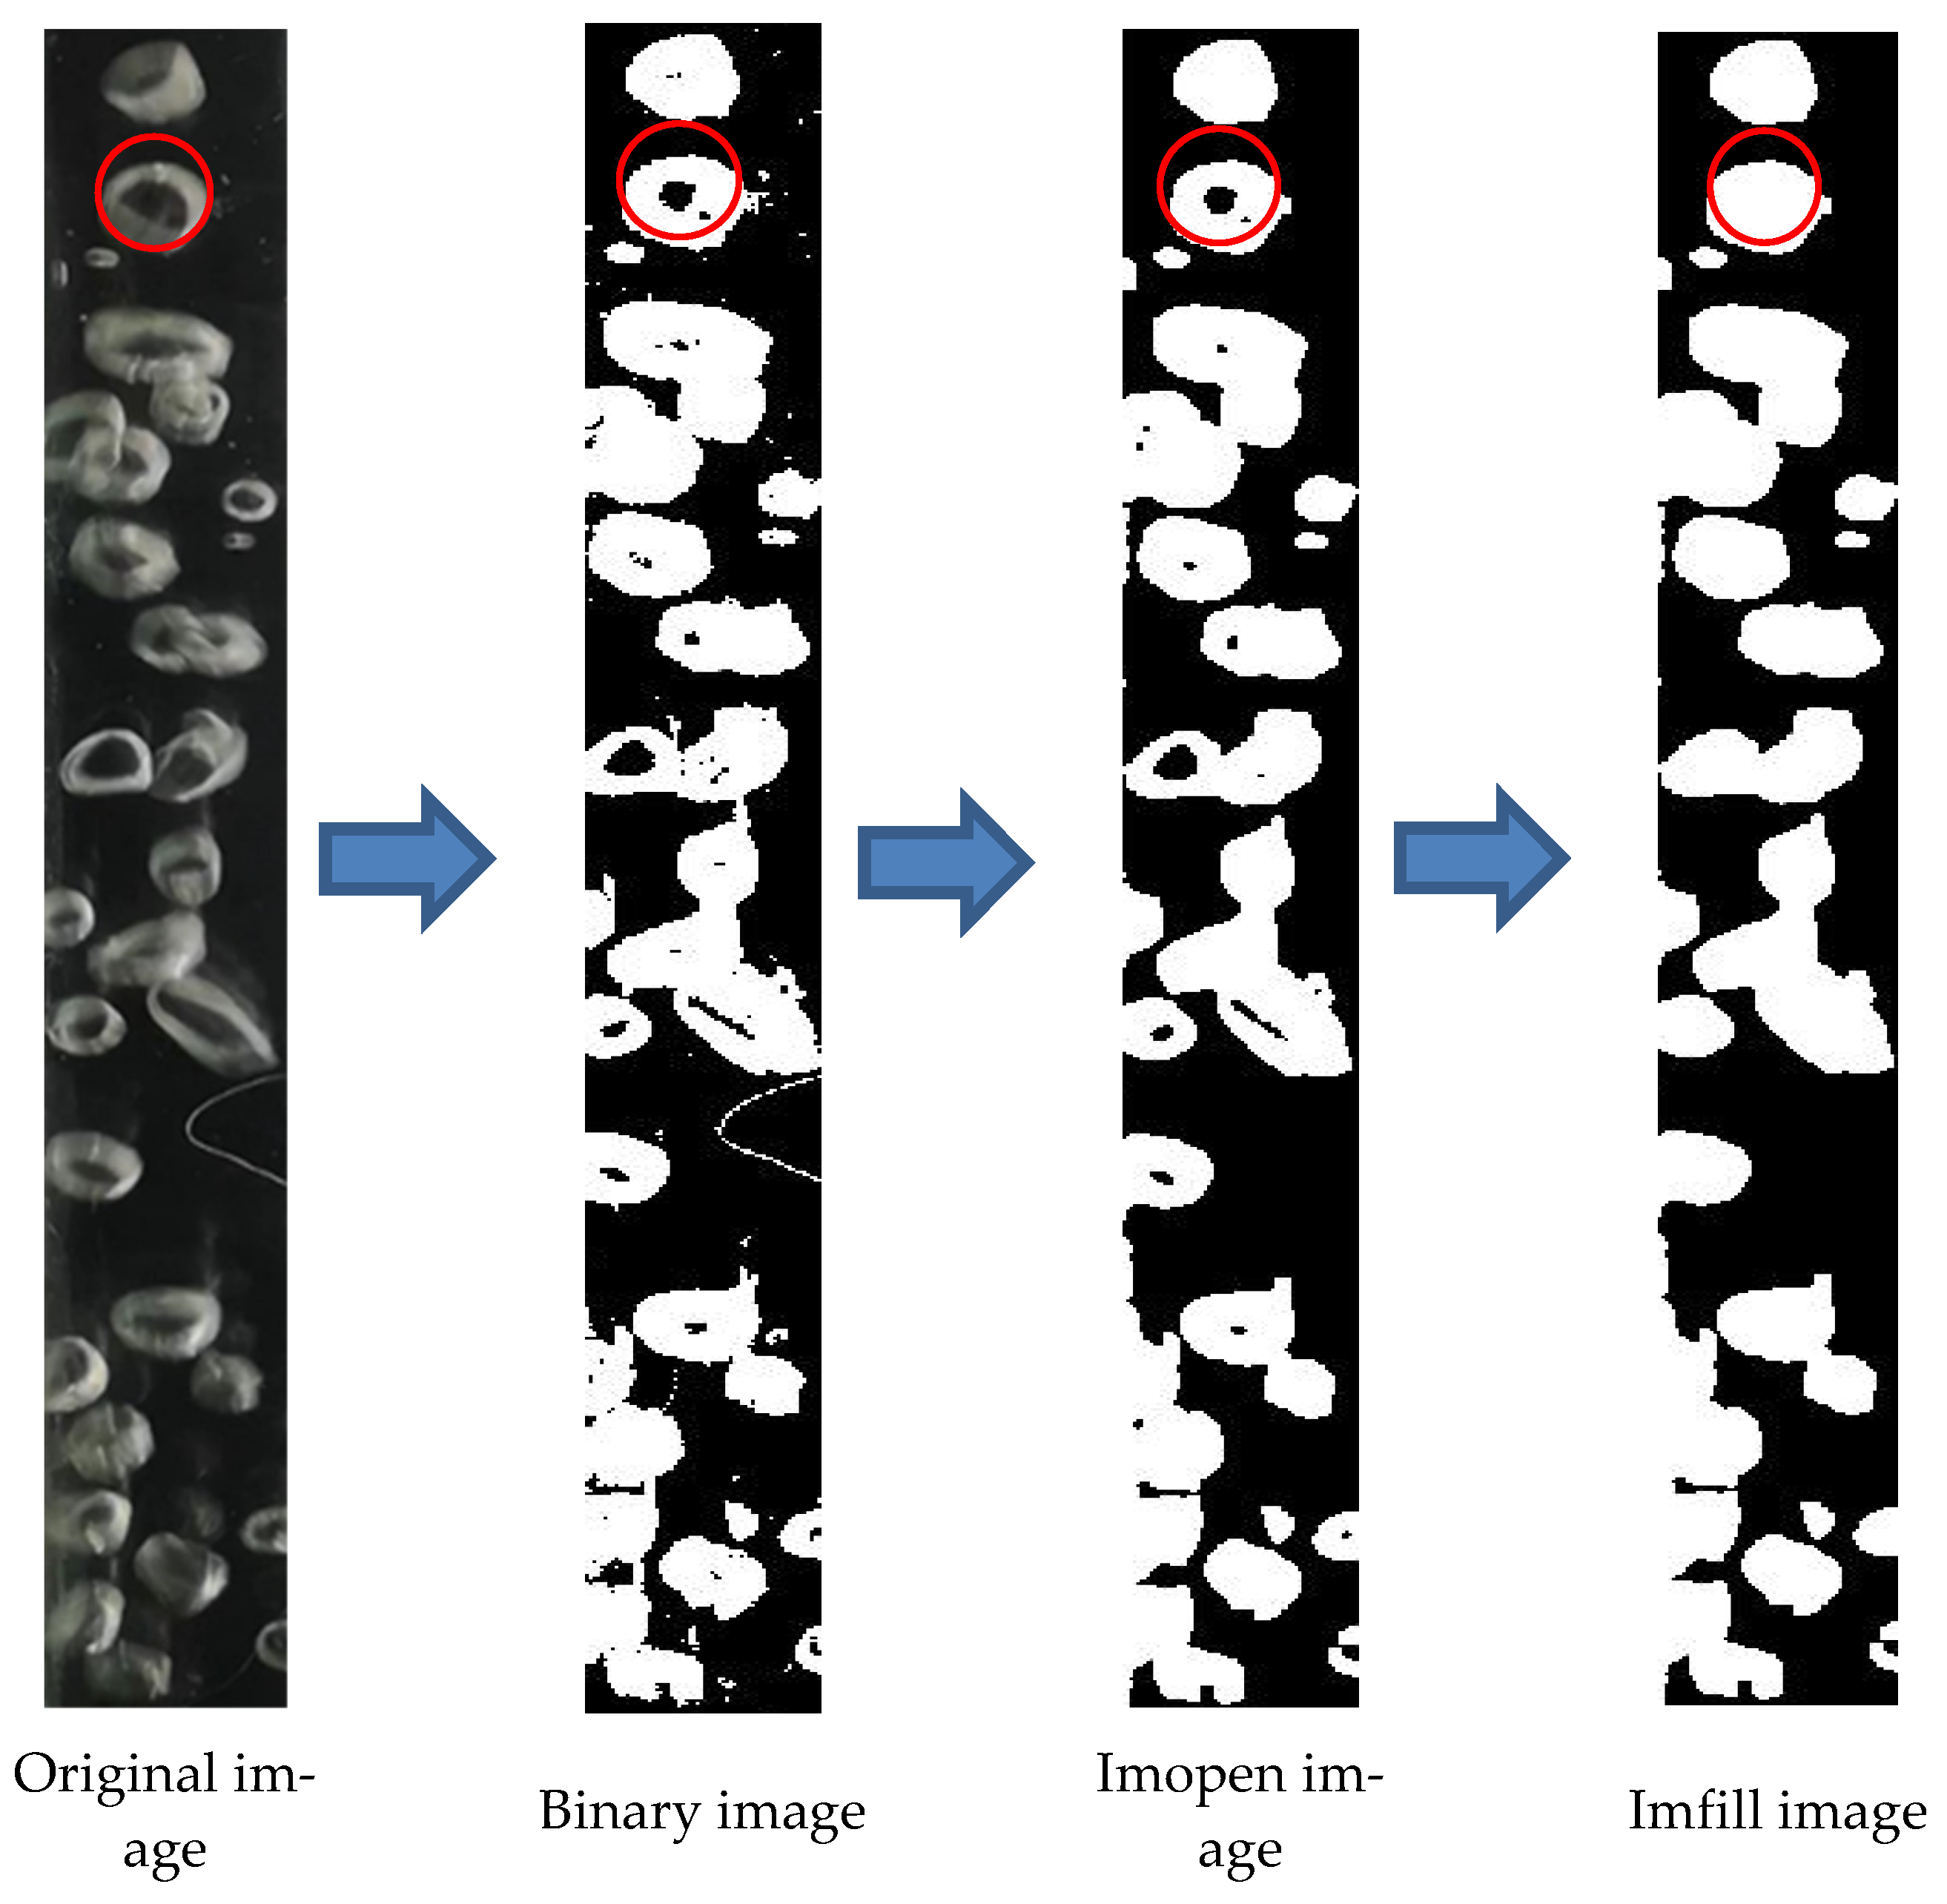
2.3. Image Processing and Recognition Process

To observe the growth process of the dispersed phase bubbles in the two phases (R245fa and Therminol®66) in the DCHE, a high-speed camera (5F01M, Revealer, China) was used to capture the bubble growth process. The bubble growth process was recorded by a high-speed camera at a speed of 800 frames per second.
Figure 2 shows the image processing procedure and is detailed as follows: (1) original image. Screenshot software (KMPlayer) was used to capture screenshots of the captured videos, taking screenshots every 0.01 s. The original image was preprocessed in grayscale; it is converted into a grayscale image to reduce storage space and improve operational efficiency; (2) binary image. It converts grayscale images to binary images; (3) imopen image. The imopen function should be used not only to eliminate image noise by corroding and expanding the image but also to remove tiny points and smooth the boundaries of larger points without significantly changing the image size. Therefore, the white area represents the bubble, and the remaining black area represents the liquid phase; (4) imfill image. The imfill function was used to fill the “hole” in the image area.
Finally, the region-props functions in the MATLAB software were used to identify the bubbles, and the centroid coordinate, area, and diameter of the bubbles were ob-tained.

2.4. Uncertainty Analysis

The uncertainty of the experimental direct measurement data was determined utilizing Equation (1) with 94% certainty interval [29]. The uncertainties of the CHTC and heat transfer quantity were calculated using the uncertainty formula [30]. In this research, the maximum uncertainty of the flowmeter was 0.8%, and the measuring scope of was 50–400 kg/h. The measuring scope of the thermocouple is 0–200 °C. The temperature transducers were connected to a data logger, and the reference zero point was aligned. The measurement and recording precision of the temperature transducers were assessed as ±1.2 °C and ±0.6 °C, respectively. Thus, the indeterminacy of temperature measuring was ±1.34 °C. The measuring precision of Therminol®66 fluid level and evaporator diameter were both ±0.02 m. Consequently, the uncertainty of the liquid level volume was 4.6%.
X r = P K 2 + B K 2
where PK represents the precision stint of the apparatus, and BK was the error stint.

3. Empirical Correlations

3.1. Bubble Diameter Correlation

The two-phase contact area was determined by calculating the bubble diameter in the DCHE. To simplify the calculation of the bubble diameter, it was necessary to make assumptions regarding the dispersed phase bubbles in the DCHE.
(1)
The bubble was regarded as rigid, and only the volume changes without deformation during the ascending process. The equivalent ball diameter was considered to be the bubble diameter.
(2)
The bubbles were considered not to merge or break during the ascending process.
(3)
The dispersed phase vapor was not retained in the continuous phase.
Based on the above assumptions, Mori et al. [31] calculated the bubble diameter (DM) using heat balance.
      π D M 2 h Δ T d t ρ d v h f g π D M 2 d D M
where DM, h, ∆T, ρdv, and hfg represent the theoretical bubble diameter, instantaneous convection heat transfer coefficient of the surface area of the spherical two-phase bubble, temperature difference between the R245fa and Therminol®66, vapor phase density of the dispersed phase, and latent heat of condensation, respectively.
The calculation formula of ∆T was:
  Δ T = Δ T m i n + Δ T m a x Δ T m i n Z H
where ∆Tmin, ∆Tmax, H, and Z represent the minimum temperature difference between the continuous and dispersed phases, maximum temperature difference between the continuous and dispersed phases, continuous phase liquid level, and position of the bubble, respectively.
The calculation formulas of ∆Tmin and ∆Tmax were as follows:
T m a x = m a x T c , i n T d , o u t , T c , o u t T d , i n
  T m i n = m i n T c , i n T d , o u t , T c , o u t T d , i n
where Tc,in, Tc,out, Td,in, and Td,out represent the inlet temperature of the continuous phase, outlet temperature of the continuous phase, inlet temperature of the dispersed phase, and outlet temperature of the dispersed phase, respectively.
The formula of Nusselt number proposed by Moalem-Maron [32] was as follows,
N u = C 1 P e 0.5 = h D M λ c
where Nu, Pe, and λc represent the Nusselt number, Peclet number, and thermal conductivity of the continuous phase, respectively. According to Shimizu et al. [33], the calculation formula for C1 was as follows:
C 1 = 0 t v D M N u Δ T d t 0 t v D M P e 0.5 Δ T d t
where t v represents the time required for complete evaporation. According to the experimental conditions, C1 was 2 π 0.5 .
In previous studies, Vikas Chaurasiya et al. [34] found that when Ste (Stefan number) was fixed, the melting process becomes fast with increasing the value of Pe, i.e., Pe accelerated the transition process and changed the thermal conductivity. The Peclet number can be expressed as follows:
P e = U r D M d
where Ur, and d represent the relative speed of the R245fa and Therminol®66, and the thermal diffusivity of the R245fa, respectively. By substituting Equations (7) and (8) into Equation (6), the expression for h can be obtained as follows:
h = 2 π 0.5 U r 0.5 λ c D M 0.5 d 0.5
The relationship between bubble rise height and bubble velocity was calculated as follows:
  d z = U d t
where U represents the rising speed of the bubble. Substituting Equations (9) and (10) into Equation (2), and simplifying it was as follows:
  D M 0.5 d D M = 2 π 0.5 U r d 0.5 λ c ρ d v h f g U 1 Δ T d Z
Equation (11) was integrated. Z = 0 and DM = D0 was substituted into Equation (11) as follows:
    2 3 D M 1.5 = 2 π 0.5 U r d 0.5 λ c ρ d v h f g U 1 Δ T Z + 2 3 D 0 1.5
To simplify Equation (12), the ratio w was introduced as follows:
  w = U r U
where w represents the ratio of relative velocity to bubble velocity. Equations (3) and (13) were substituted into Equation (12), as follows:
D M = { D 0 1.5 + 3 1 π d U r 0.5 × λ c ρ d v h f g × w × Δ T m i n × Z + Δ T m a x Δ T m i n Z 2 H } 2 3
where D0 represents the nozzle diameter. Prasser et al. [35] found that the growth of bubbles with different pipe diameters was significantly different. In addition, Vafaei et al. [36] found that the diameter of the spray nozzle has a forceful effect to bubble growth. In the DCHE heat exchange process, it was indispensable to discuss the effect of the diameter of the DCHE and nozzle diameter on bubble growth. Therefore, to obtain a more accurate relationship, the constant C2 = D 0 d C 3 was introduced to modify Equation (14). When C3 was −0.125, its correlation was as high as 0.998235. Thus, when C2 was D 0 d 0.125 , the relationship between bubble growth was as follows:
  D M = D 0 d 0.125 { D 0 1.5 + 3 1 π d U r 0.5 × λ c ρ d v h f g × w × Δ T m i n Z + Δ T m a x Δ T m i n Z 2 H } 2 3
where d denotes the diameter of the heat exchanger. The heat exchange area can be determined by the bubble diameter.

3.2. Local Convection Heat Transfer Coefficient Correlation

It was difficult to determine the two-phase contact area in the DCHE. Therefore, an empirical correlation of the local convection heat transfer coefficient correlation between R245fa and Therminol®66 can be derived.
Mori et al. [31] considered that the local convection heat transfer coefficient can be calculated by Equation (16).
h Z = n π D M 2 h
where hZ and n represent the local convection heat transfer coefficient and number of local two-phase bubbles, respectively. DM and h have already been derived in 3.1. By substituting Equations (9) and (15) into Equation (16), the expression for hZ can be obtained as follows:
  h Z = 2 n λ c π U r d 0.5 D M 3 2
In order to obtain an accurate correlation of the local CHTC, the effects of the temperature of the R245fa and Therminol®66 were considered. Therefore, the constant C3 = T c T d C 4 was introduced to modify Equation (17). When C4 was 4, its correlation was as high as 0.997612. Thus, when C3 was T c T d 4 , the empirical correlation of local convection heat transfer coefficient was as follows:
h Z = 2 n λ c π U r d 0.5 D M 3 2   T c T d 4

3.3. Calculation of QT and QZ

During direct contact heat transfer, Baqir et al. [37] believed that latent heat dominated phase transformation, so the actual heat flux (QT) can be calculated as the following formula:
Q T = m d H d , o u t H d , i n
where m d , H d , o u t , and H d , i n represent the mass flow rate of the R245fa, outlet enthalpy of the dispersed phase, and inlet enthalpy of the dispersed phase, respectively.
According to Equation (18), the local convection heat transfer coefficient was obtained. The theoretical heat transfer quantity (QZ) was calculated as follows:
Q Z = h Z A T t m
where A and ∆Ttm represent the heat exchange area and logarithmic average temperature difference between the R245fa and Therminol®66, respectively.
The calculation of A was as follows:
      A = i = 1 n 4 π r i 2 = i = 1 n π D i , M 2
where i,  r i , and D i , M represent the variable, theoretical radius of the i-th bubble, and theoretical diameter of the i-th bubble, respectively.
The calculation of ∆Ttm was as follows:
      T t m = T m a x T m i n l n T m a x T m i n

4. Results and Discussion

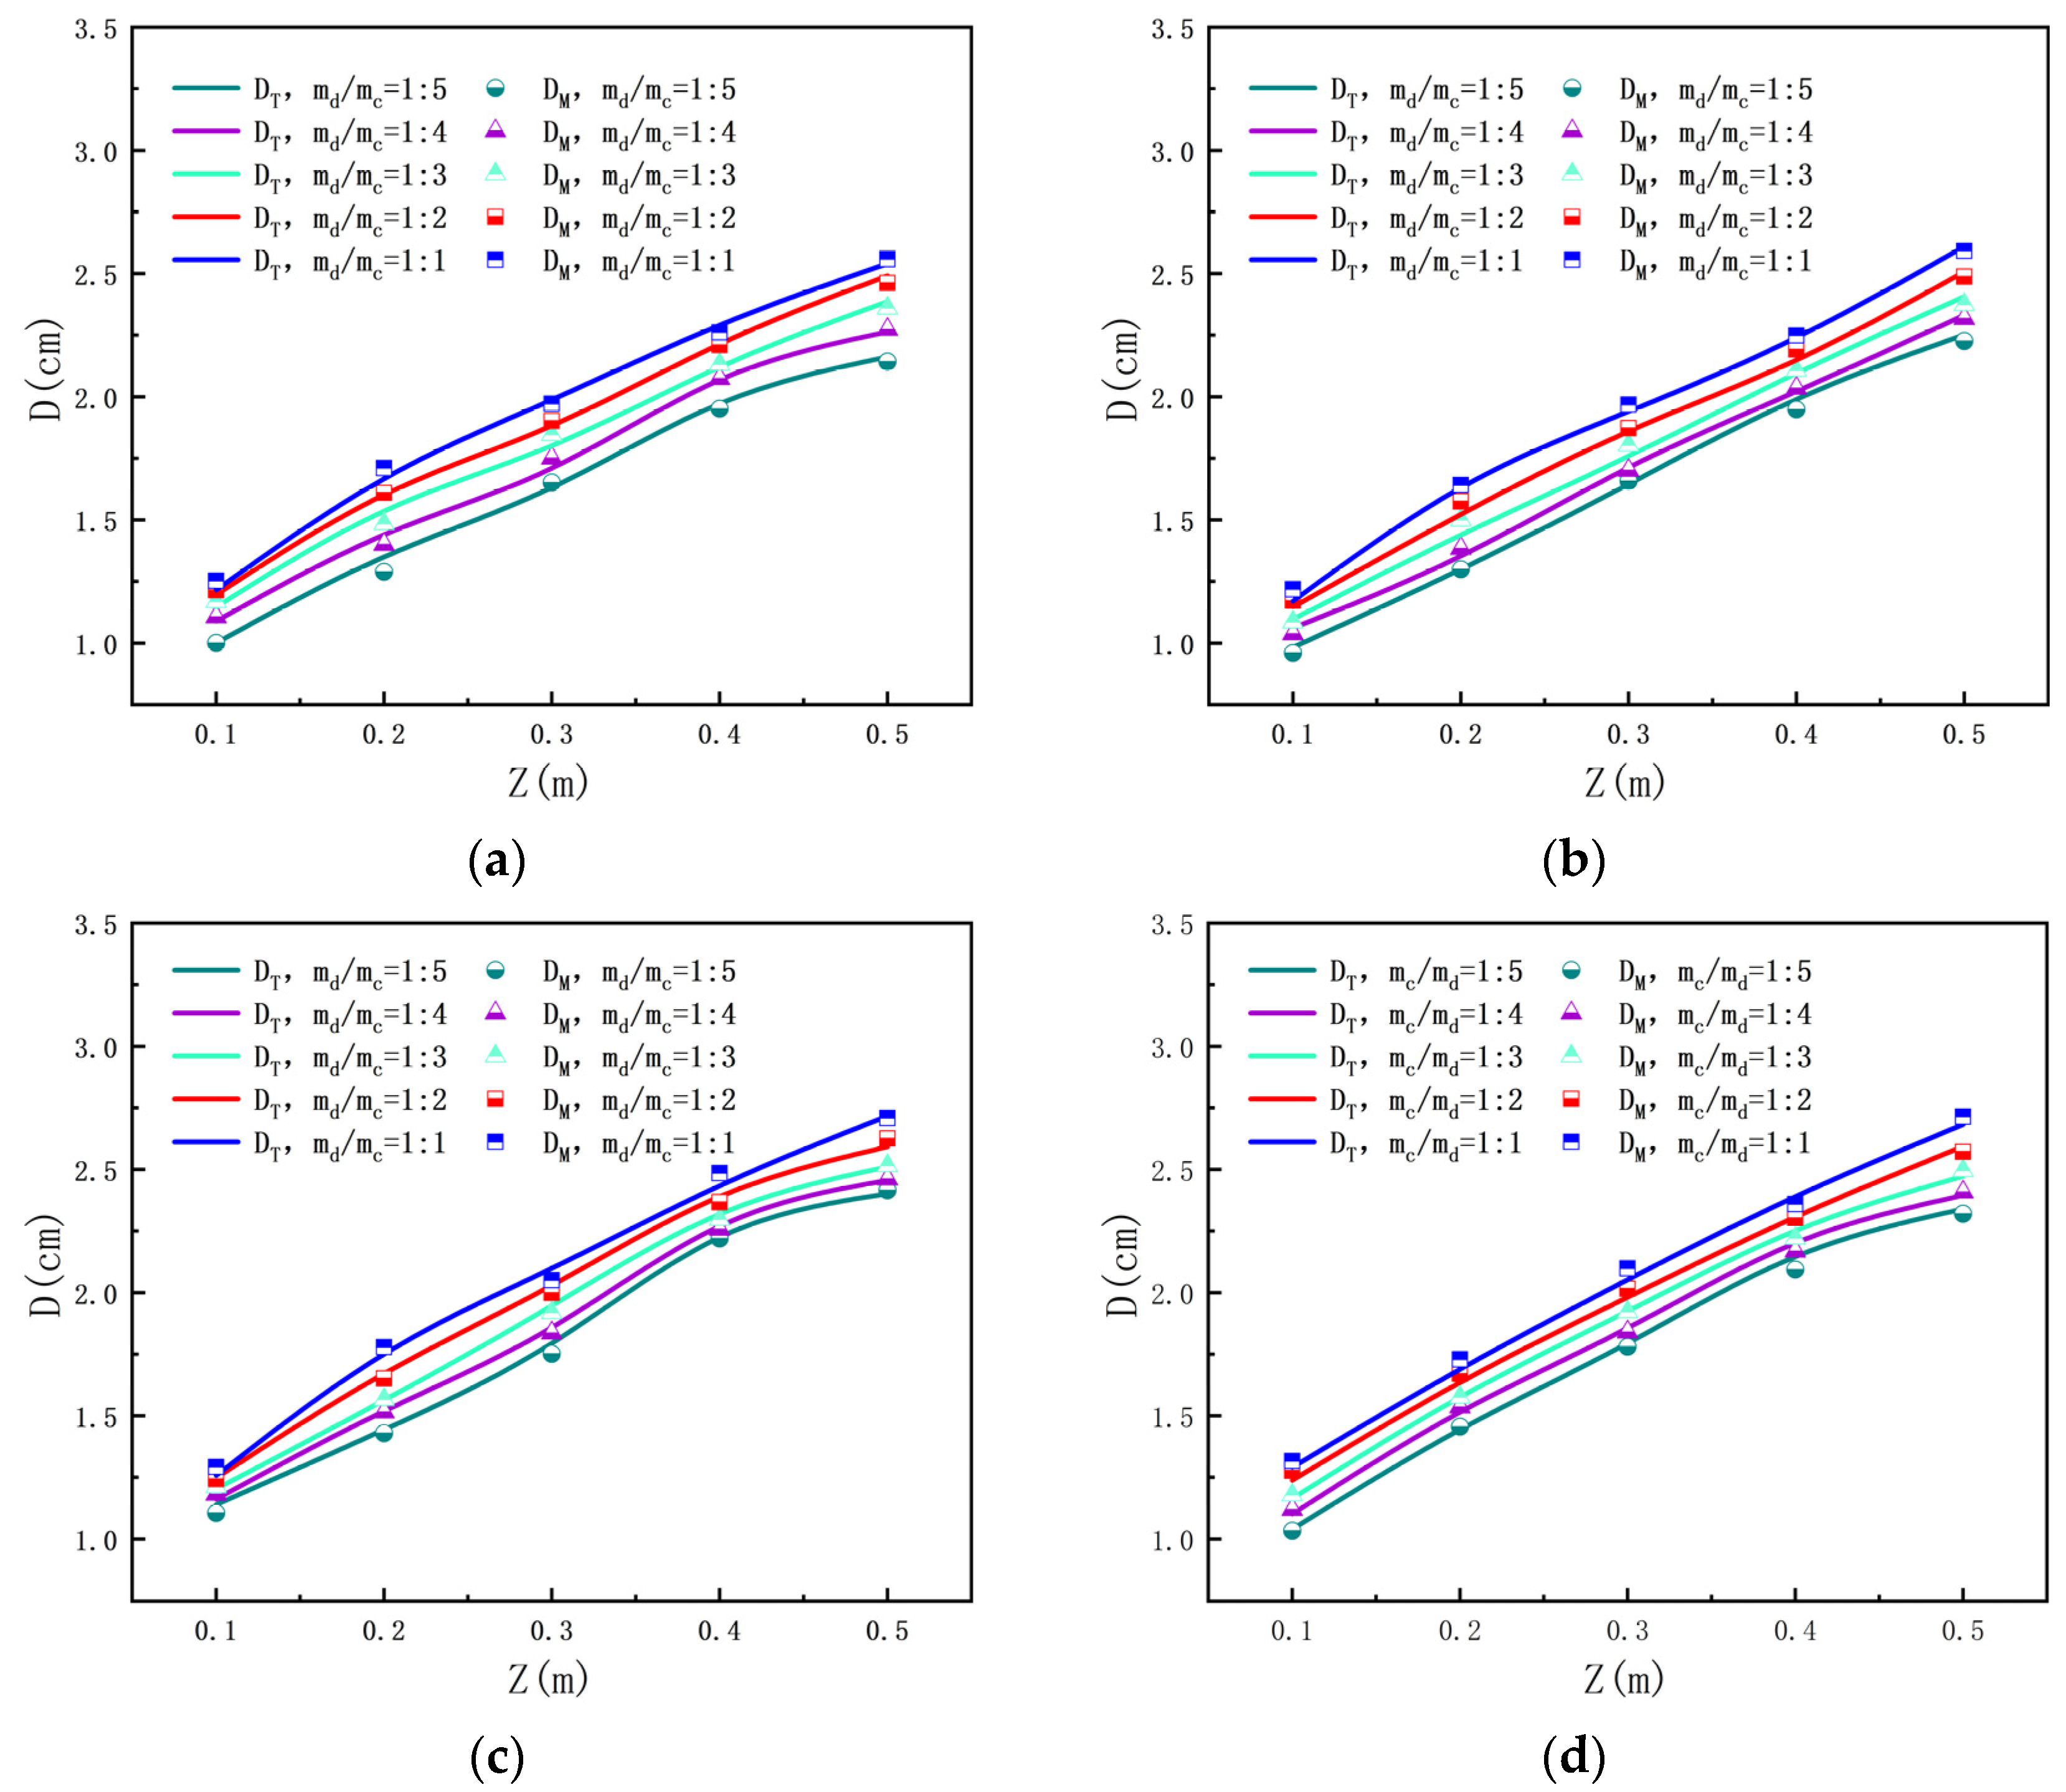
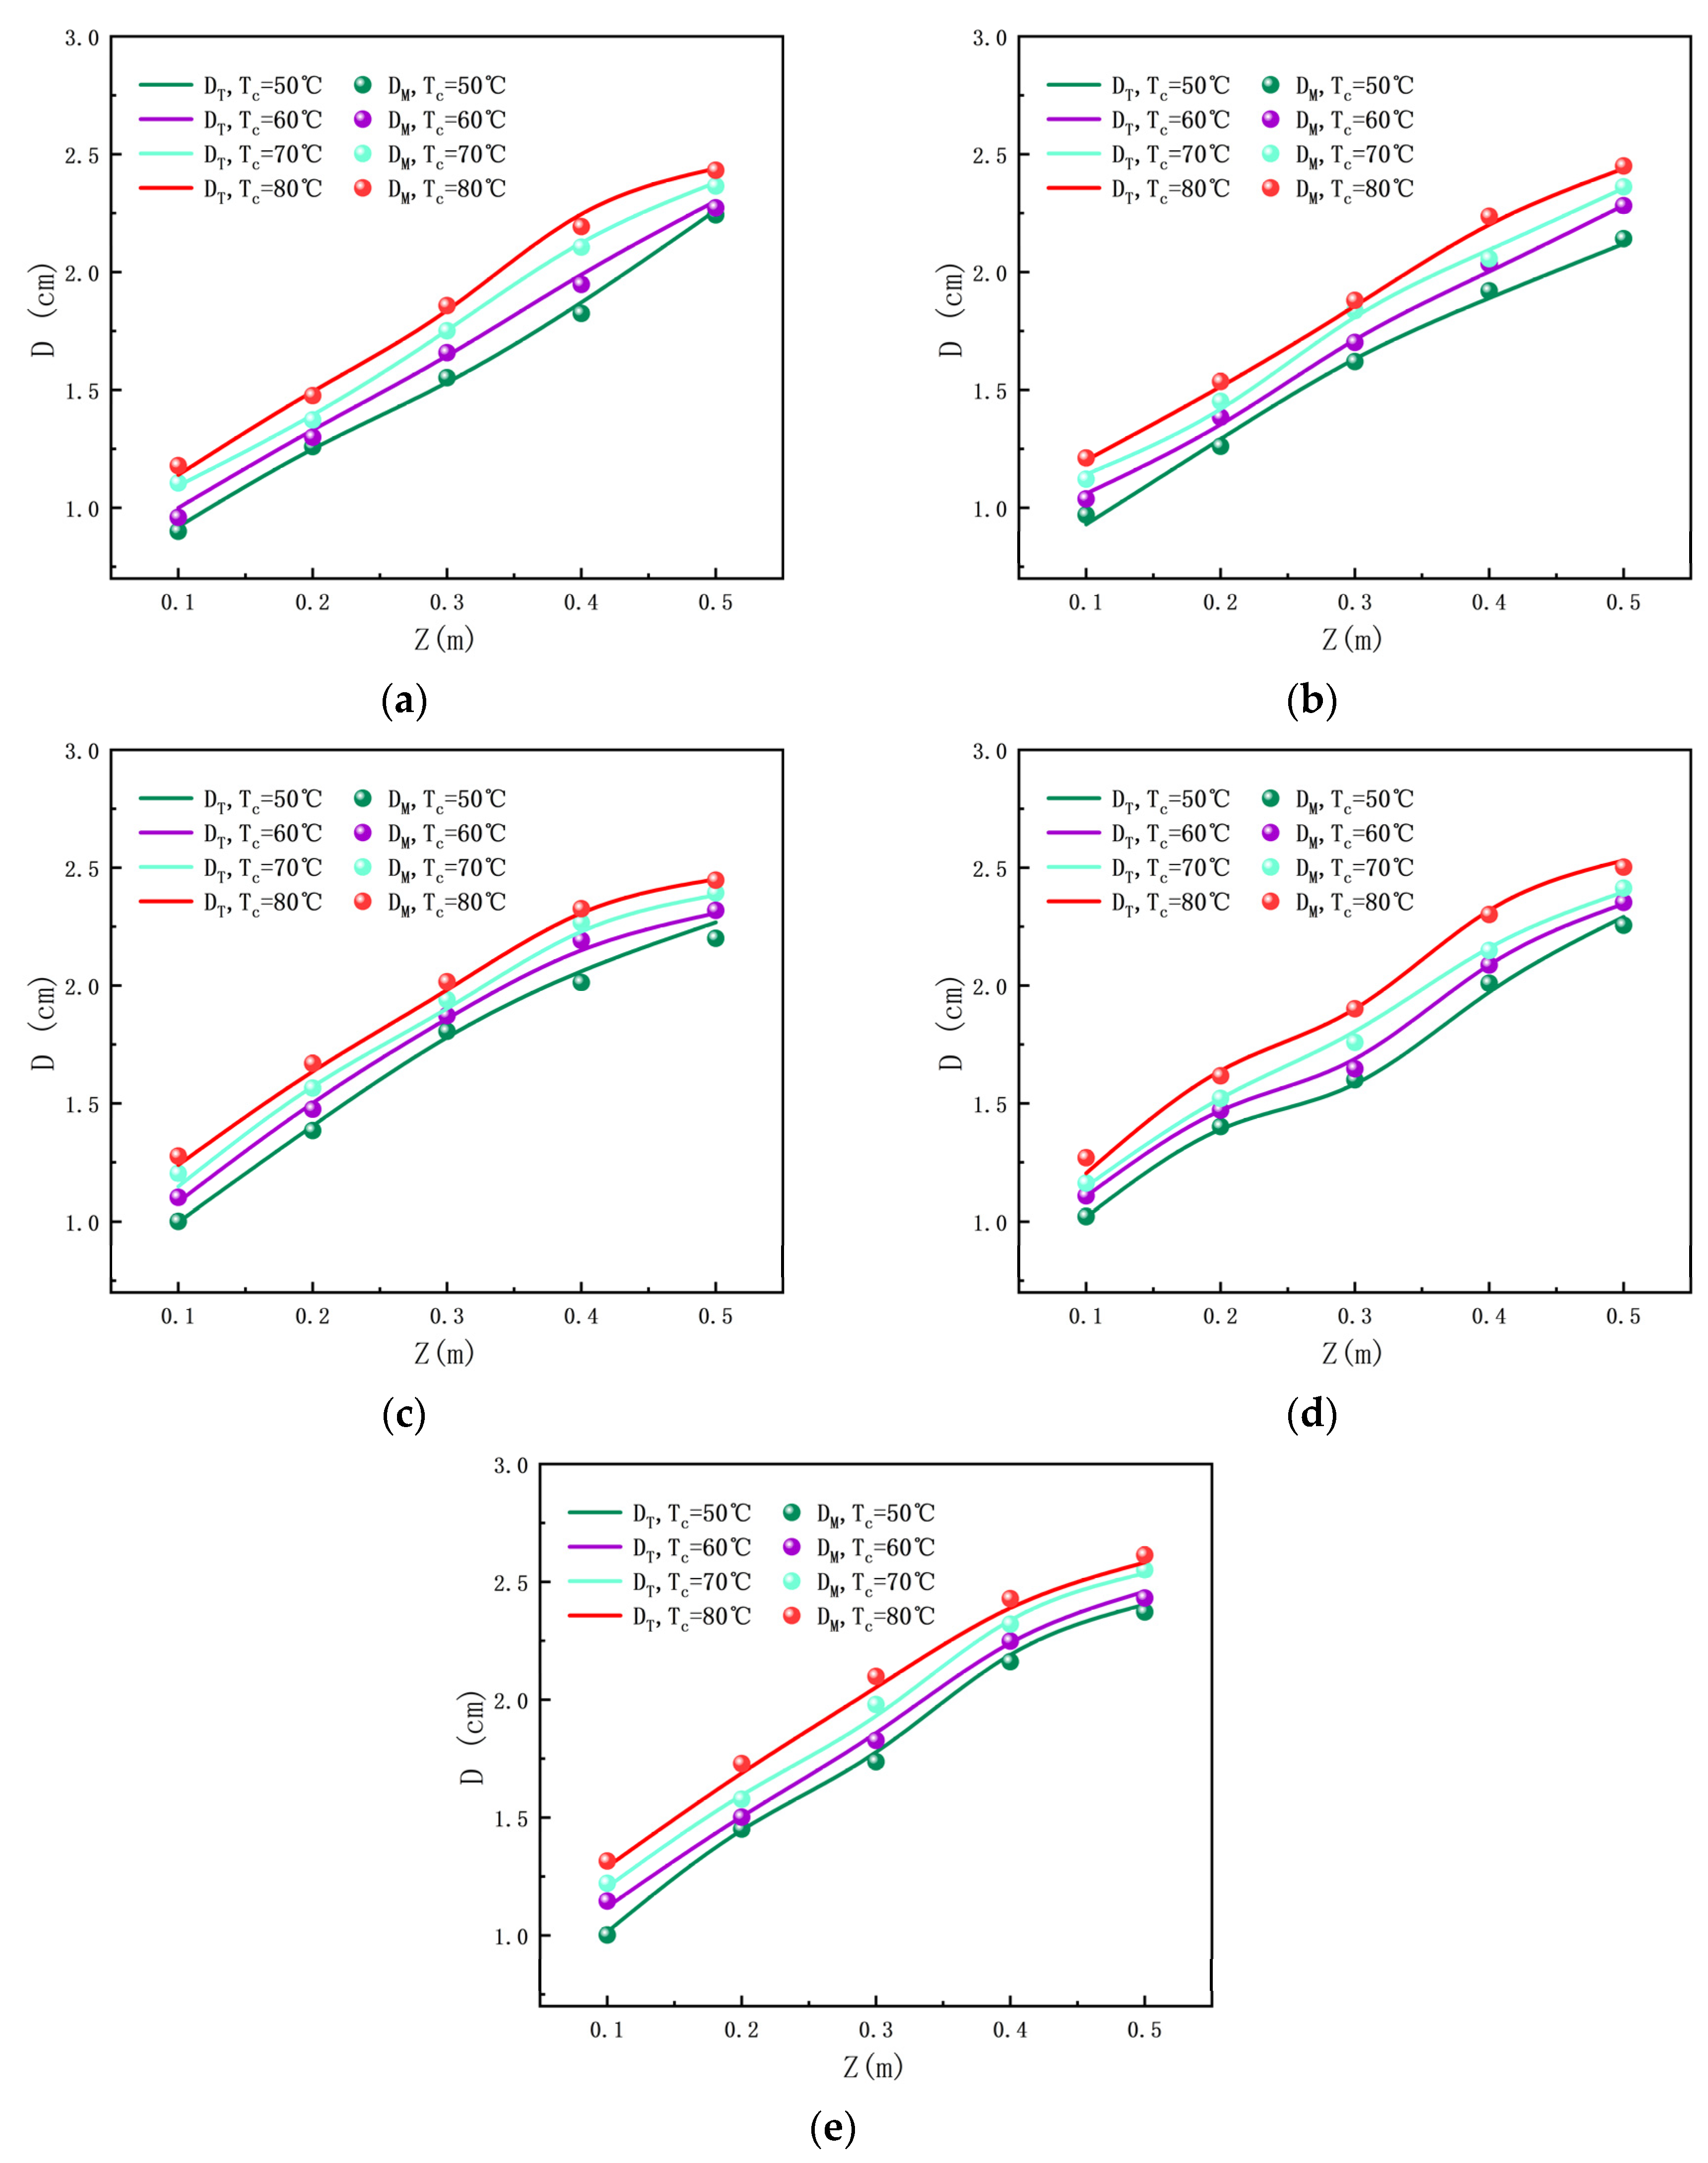
4.1. Bubble Diameter

The growth process of dispersed phase bubbles was observed using a high-speed camera. Digital image processing was used to process bubbles to obtain their actual diameter (DT). However, the actual diameter of the bubble can only be obtained through complex image processing. Therefore, the bubble’s thermal balance formula was used to derive the bubble’s theoretical diameter (DM) growth formula, thereby simplifying the image processing.
The relationship between bubble diameter and height is shown in Figure 3 and Figure 4. Figure 3 and Figure 4 show that, with the same temperature, the bubble diameter increased with an increase in height. Therefore, the bubble diameter increased with height [38]. Another reason was that an increase in height caused a decrease in pressure. The decrease in pressure will lead to an increase in buoyancy, decrease in basset force, and liquid resistance. Therefore, decrease in pressure leads to the enlargement of the bubble diameter.
Figure 3 also shows the relationship between the bubble diameter and flow rate ratio. Figure 3 shows the positive correlation between bubble diameter and flow ratio at the same temperature. The bubble diameter was largest when the flow rate ratio was 1:1. This was because the flow rate of the R245fa was constant, and an increase in the flow ratio indicated a decrease in the flow rate of the Therminol®66. Consequently, the viscous shear force caused by the Therminol®66 decreased. Therefore, the time for the bubble to overcome the Young–Laplace force became longer, and the bubbles continued to grow.
Equation (15) shows that the thermophysical properties of the Therminol®66 have a significant effect on bubble growth. Figure 4 shows the relationship between the bubble diameter and Therminol®66 temperature. When the temperature of the Therminol®66 increased, the bubble diameter also increased. Figure 4a shows that when the flow ratio was 1:1, the continuous phase temperature was 80 °C, and the bubble diameter was the largest. This was because the influence of temperature on bubble size was attributed to the change in physical properties. At the same time, the increase in temperature led to a decrease in liquid density, viscosity, surface tension, and gas density and an increase in saturated vapor pressure. The saturated vapor pressure in this experiment cannot be ignored, resulting in the bubble diameter increasing with temperature [39].
Figure 3 and Figure 4 show the relationship between DT and DM under different working conditions. Figure 3 and Figure 4 show the trend of the bubble diameter growth correlation close to that of the experimental data. This was because the correlation considers that the diameter of the heat exchanger and nozzle affected bubble growth. As shown in Figure 3 and Figure 4, the DM was evenly distributed around DT. When the continuous phase temperature was 50 °C, the flow rate ratio was 1:1, and the height was 0.2 m, the error between DM and DT was 7 %. This was presumably because the growth of bubbles in the Therminol®66 was imperfect. The pressure of the R245fa affects the change in viscous shear force and further affects the growth of bubbles [40]. Further development and modification of the proposed correlation are required in future studies to investigate the effects of multiple parameters.
The bubble growth correlations under different working conditions obtained by different researchers are listed in Table 4. The experimental data are taken into the bubble growth equations in Table 4 to obtain the bubble diameter. Figure 5 shows several bubble growth correlations proposed by previous researchers to compare the correlation and experimental results in this study. Figure 5 shows that, compared to the other correlations, an improvement of the correlation was necessary. The prediction results of Mahood were consistent with the experimental data in the period of bubble growth beforehand. However, there was a large difference between Mahood’s findings and the experimental data in the period afterward. Figure 5 shows that the bubble growth correlation proposed in this study was the most consistent with the experimental data. This was owing to the bubble growth correlation, which considers the effect of the diameter of the heat exchanger.

4.2. Local Convective Heat Transfer Coefficient

The calculation of the convective heat transfer coefficient had always been a problem in the DCHE. Previous studies had shown that the Nusselt number represented a criterion number for the intensity of the convective heat transfer coefficient and also represented the ratio of the thermal conductivity of the fluid layer to the convective thermal resistance. At the same time, Vikas Chaurasiya et al. [49] discussed the one-dimensional moving boundary problem and analyzed the influence of size change on heat conduction and convection effects. In addition, many scholars had obtained empirical correlations between the convective heat transfer coefficient of other types of heat exchangers. In this study, an empiric correlation of the local convective heat transfer coefficient between R245fa and Therminol®66 in the heat transfer process was derived. According to Equation (18), the local convective heat transfer coefficient of the DCHE was calculated.
As shown in Equation (18), the continuous phase temperature and local convective heat transfer coefficient were closely linked. Figure 6 shows the relationship between the temperature of Therminol®66 and local convective heat transfer coefficient. Figure 6 also shows that the Therminol®66 temperature rises while the flow rate ratio and height remain unchanged, and the local convective heat transfer coefficient showed a downward trend with the Therminol®66 temperature increase. This was because when the Therminol®66 temperature increased, Pr and λc decreased, whereas Re increased. However, the increase in Re was smaller than the decrease in Pr and λc, which caused the local convective heat transfer coefficient to decrease with increasing temperature. Another reason was that the bubble diameter increases with the increase in continuous phase temperature. This caused thermal resistance (gas phase thermal resistance) to form inside the bubble. The heat transfer between two phases was affected by thermal resistance, which led to the reduction in the local convection heat transfer coefficient [26].
Figure 7 shows the connection between the flow rate ratio and local convective heat transfer coefficient. When the other operating conditions were same, the flow rate ratio was different. The local convective heat transfer coefficient was negatively correlated with the flow rate ratio. When the other working conditions were the same, and the flow rate ratio was 1:5, the local convective heat transfer coefficient was the largest. In the direct contact heat transfer process, when the flow rate ratio decreased, the Therminol®66 flow rate increased. As the flow rate of Therminol®66 increased, the flow velocity also increased. The increase in continuous phase velocity increased the disturbance in the pipe and destroyed the boundary layer. This led to a local convective heat transfer coefficient increase. At the same time, the low flow rate ratio meant that there was enough energy in the heat exchanger for heat exchange.
The relationship between the local convective heat transfer coefficient and height is shown in Figure 6 and Figure 7, respectively. Figure 6 and Figure 7 show that the local convective heat transfer coefficient decreased as the height increased. This was due to the phase change of the R245fa being at the bottom in the DCHE. The liquid R245fa absorbs the heat of the Therminol®66, and the R245fa changes from liquid to vapor. The latent heat of vaporization of the R245fa dominated the direct contact heat transfer process. This led to the phenomenon that the lower the height, the higher the local convective heat transfer coefficient. Another reason was that the temperature difference at the bottom of the DCHE was the largest, which provided more energy for dispersed phase evaporation. The driving force of temperature difference was the strongest at the bottom of the heat exchanger. Therefore, the heat transfer coefficient was maximum at the bottom.

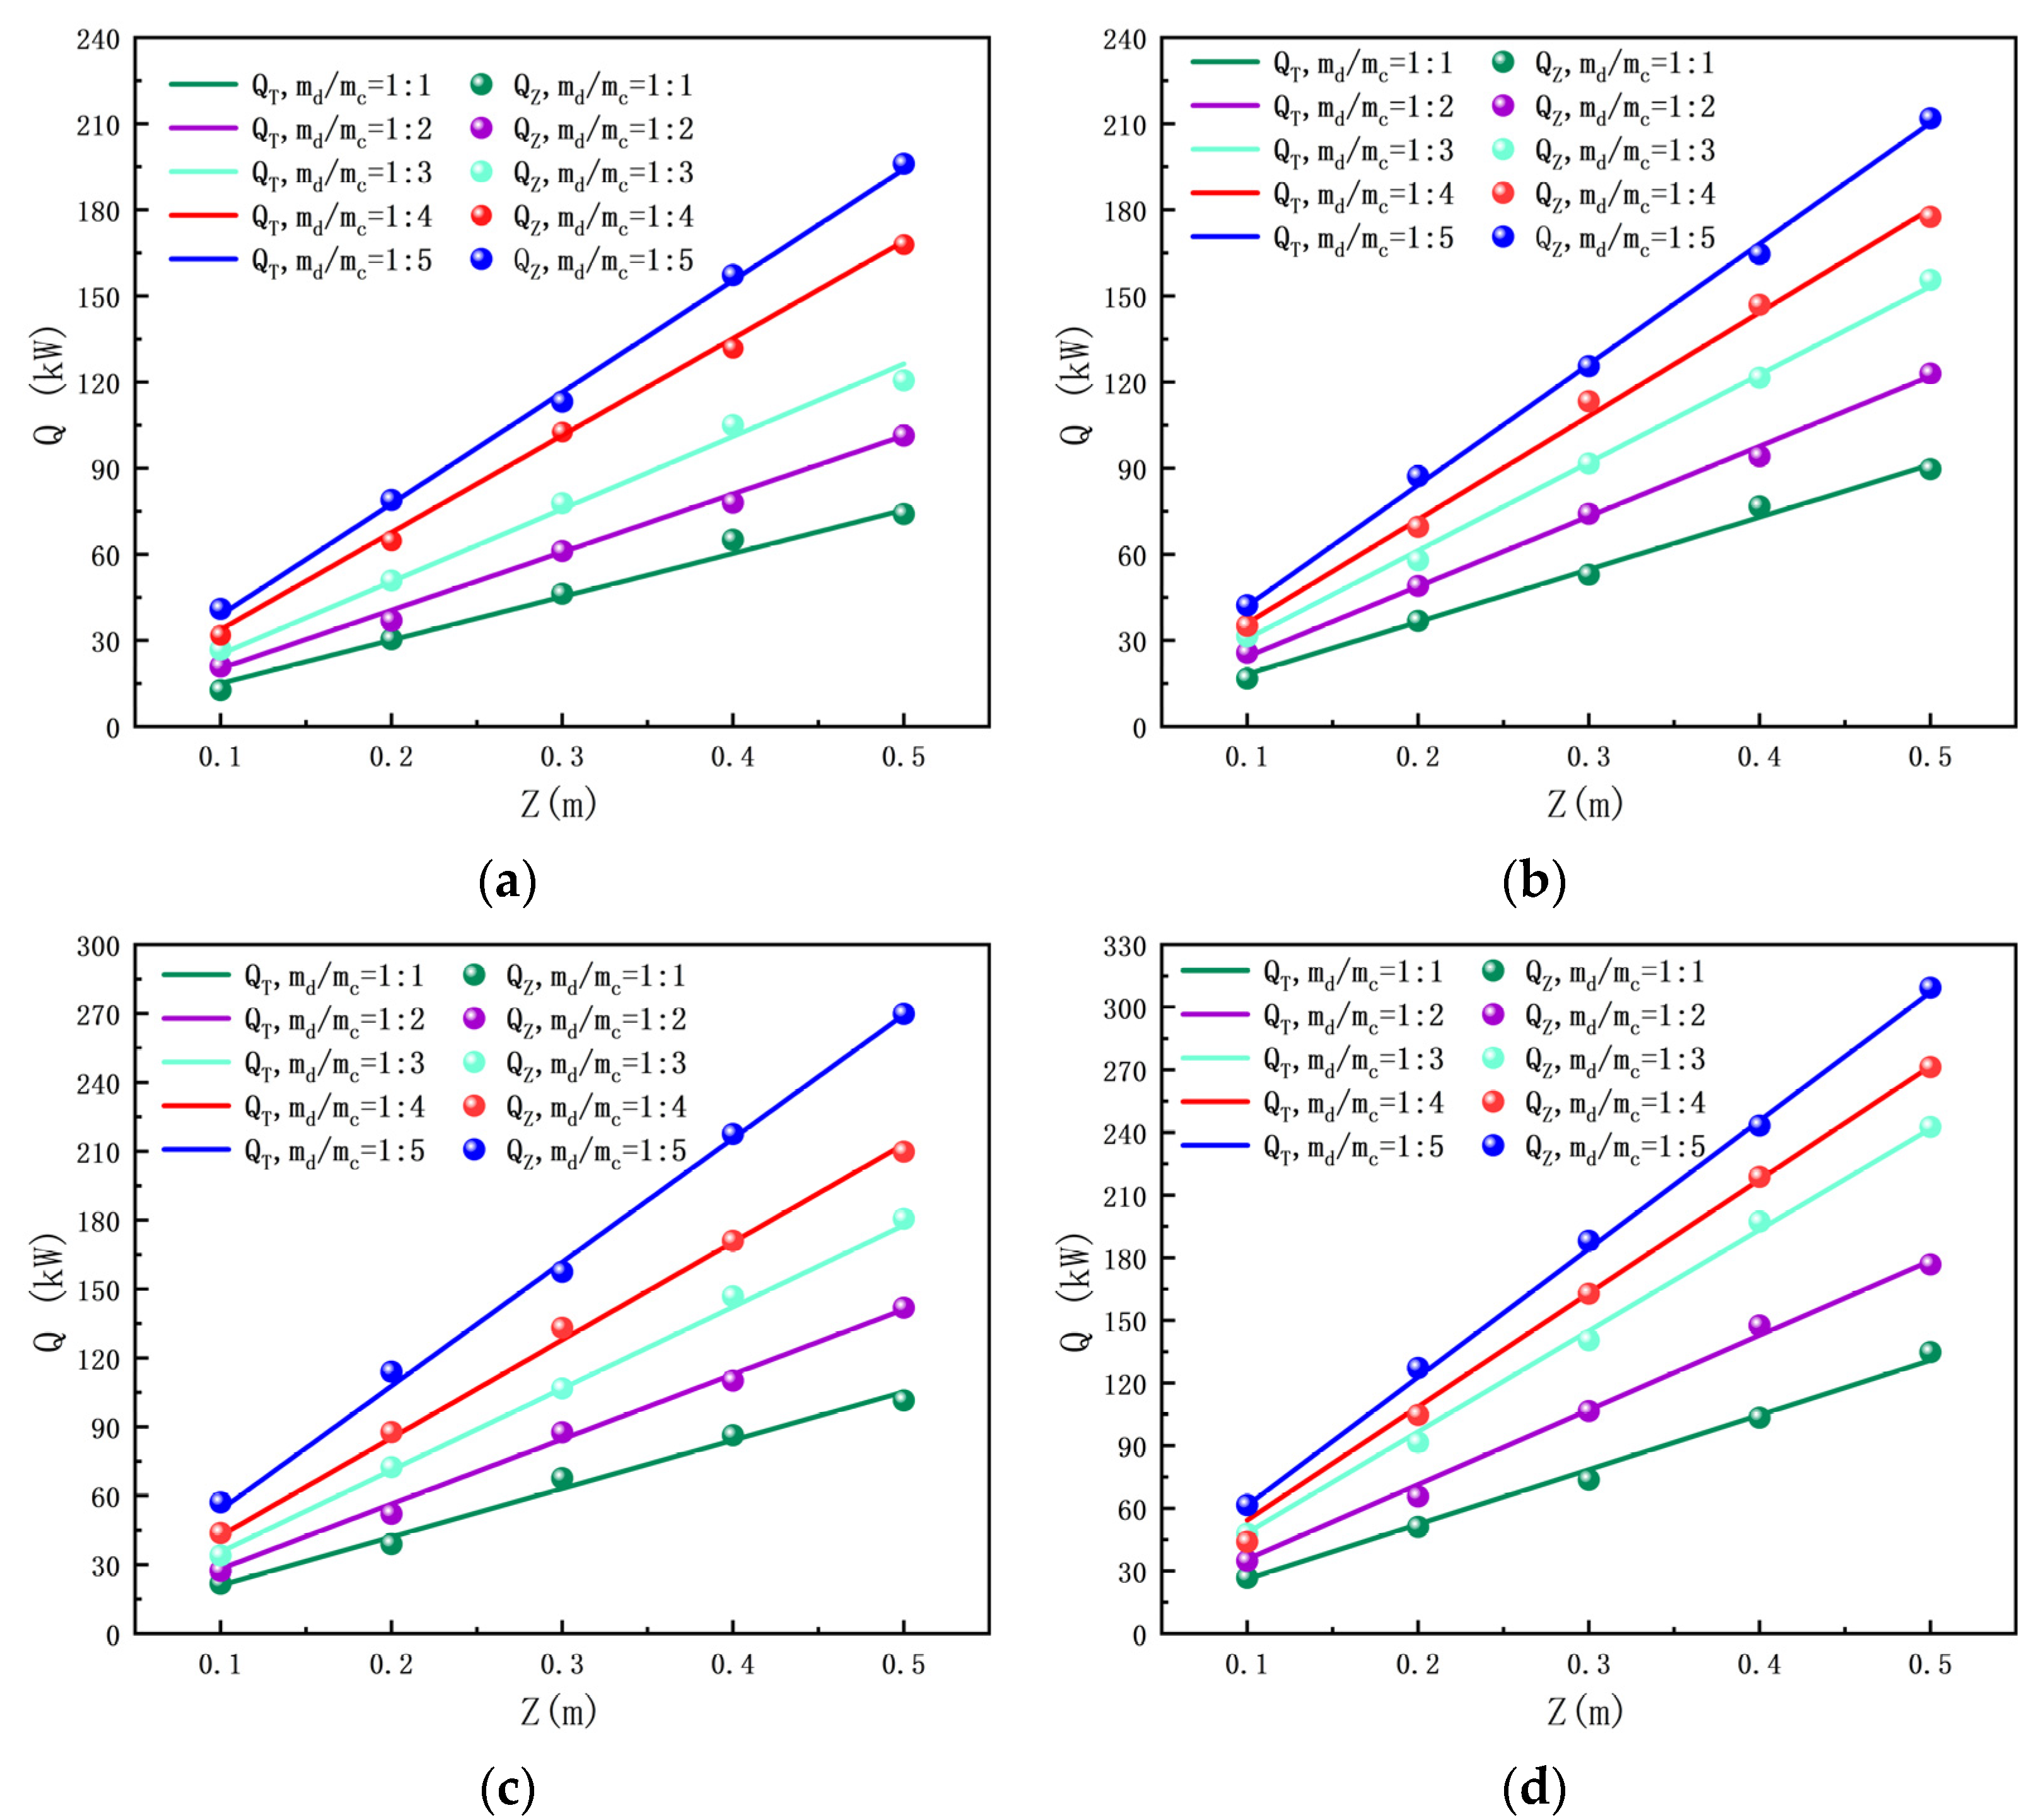
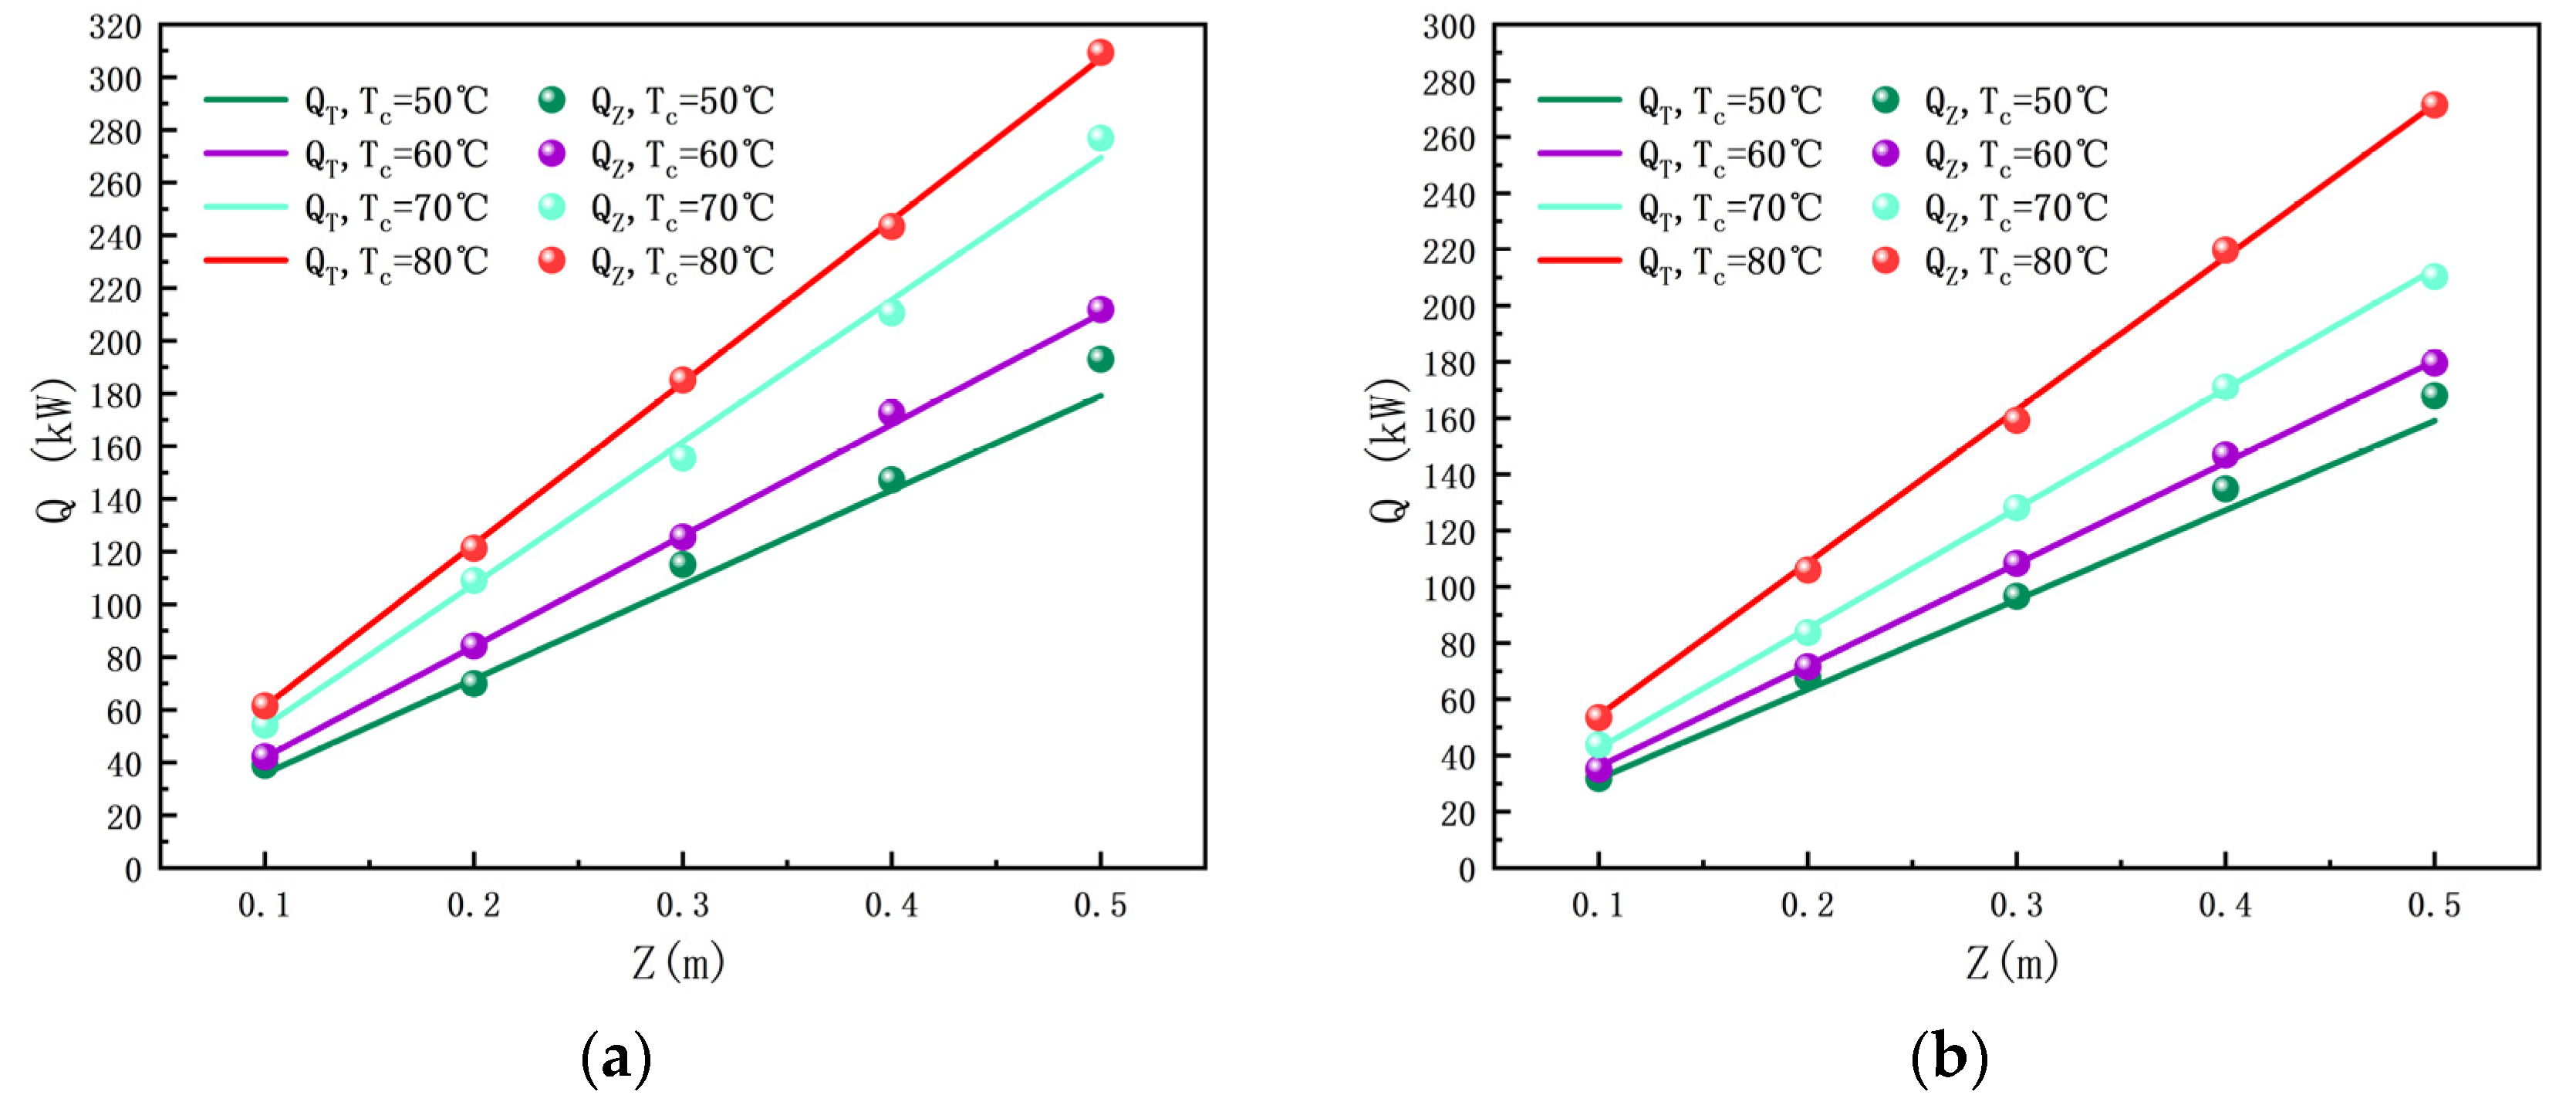
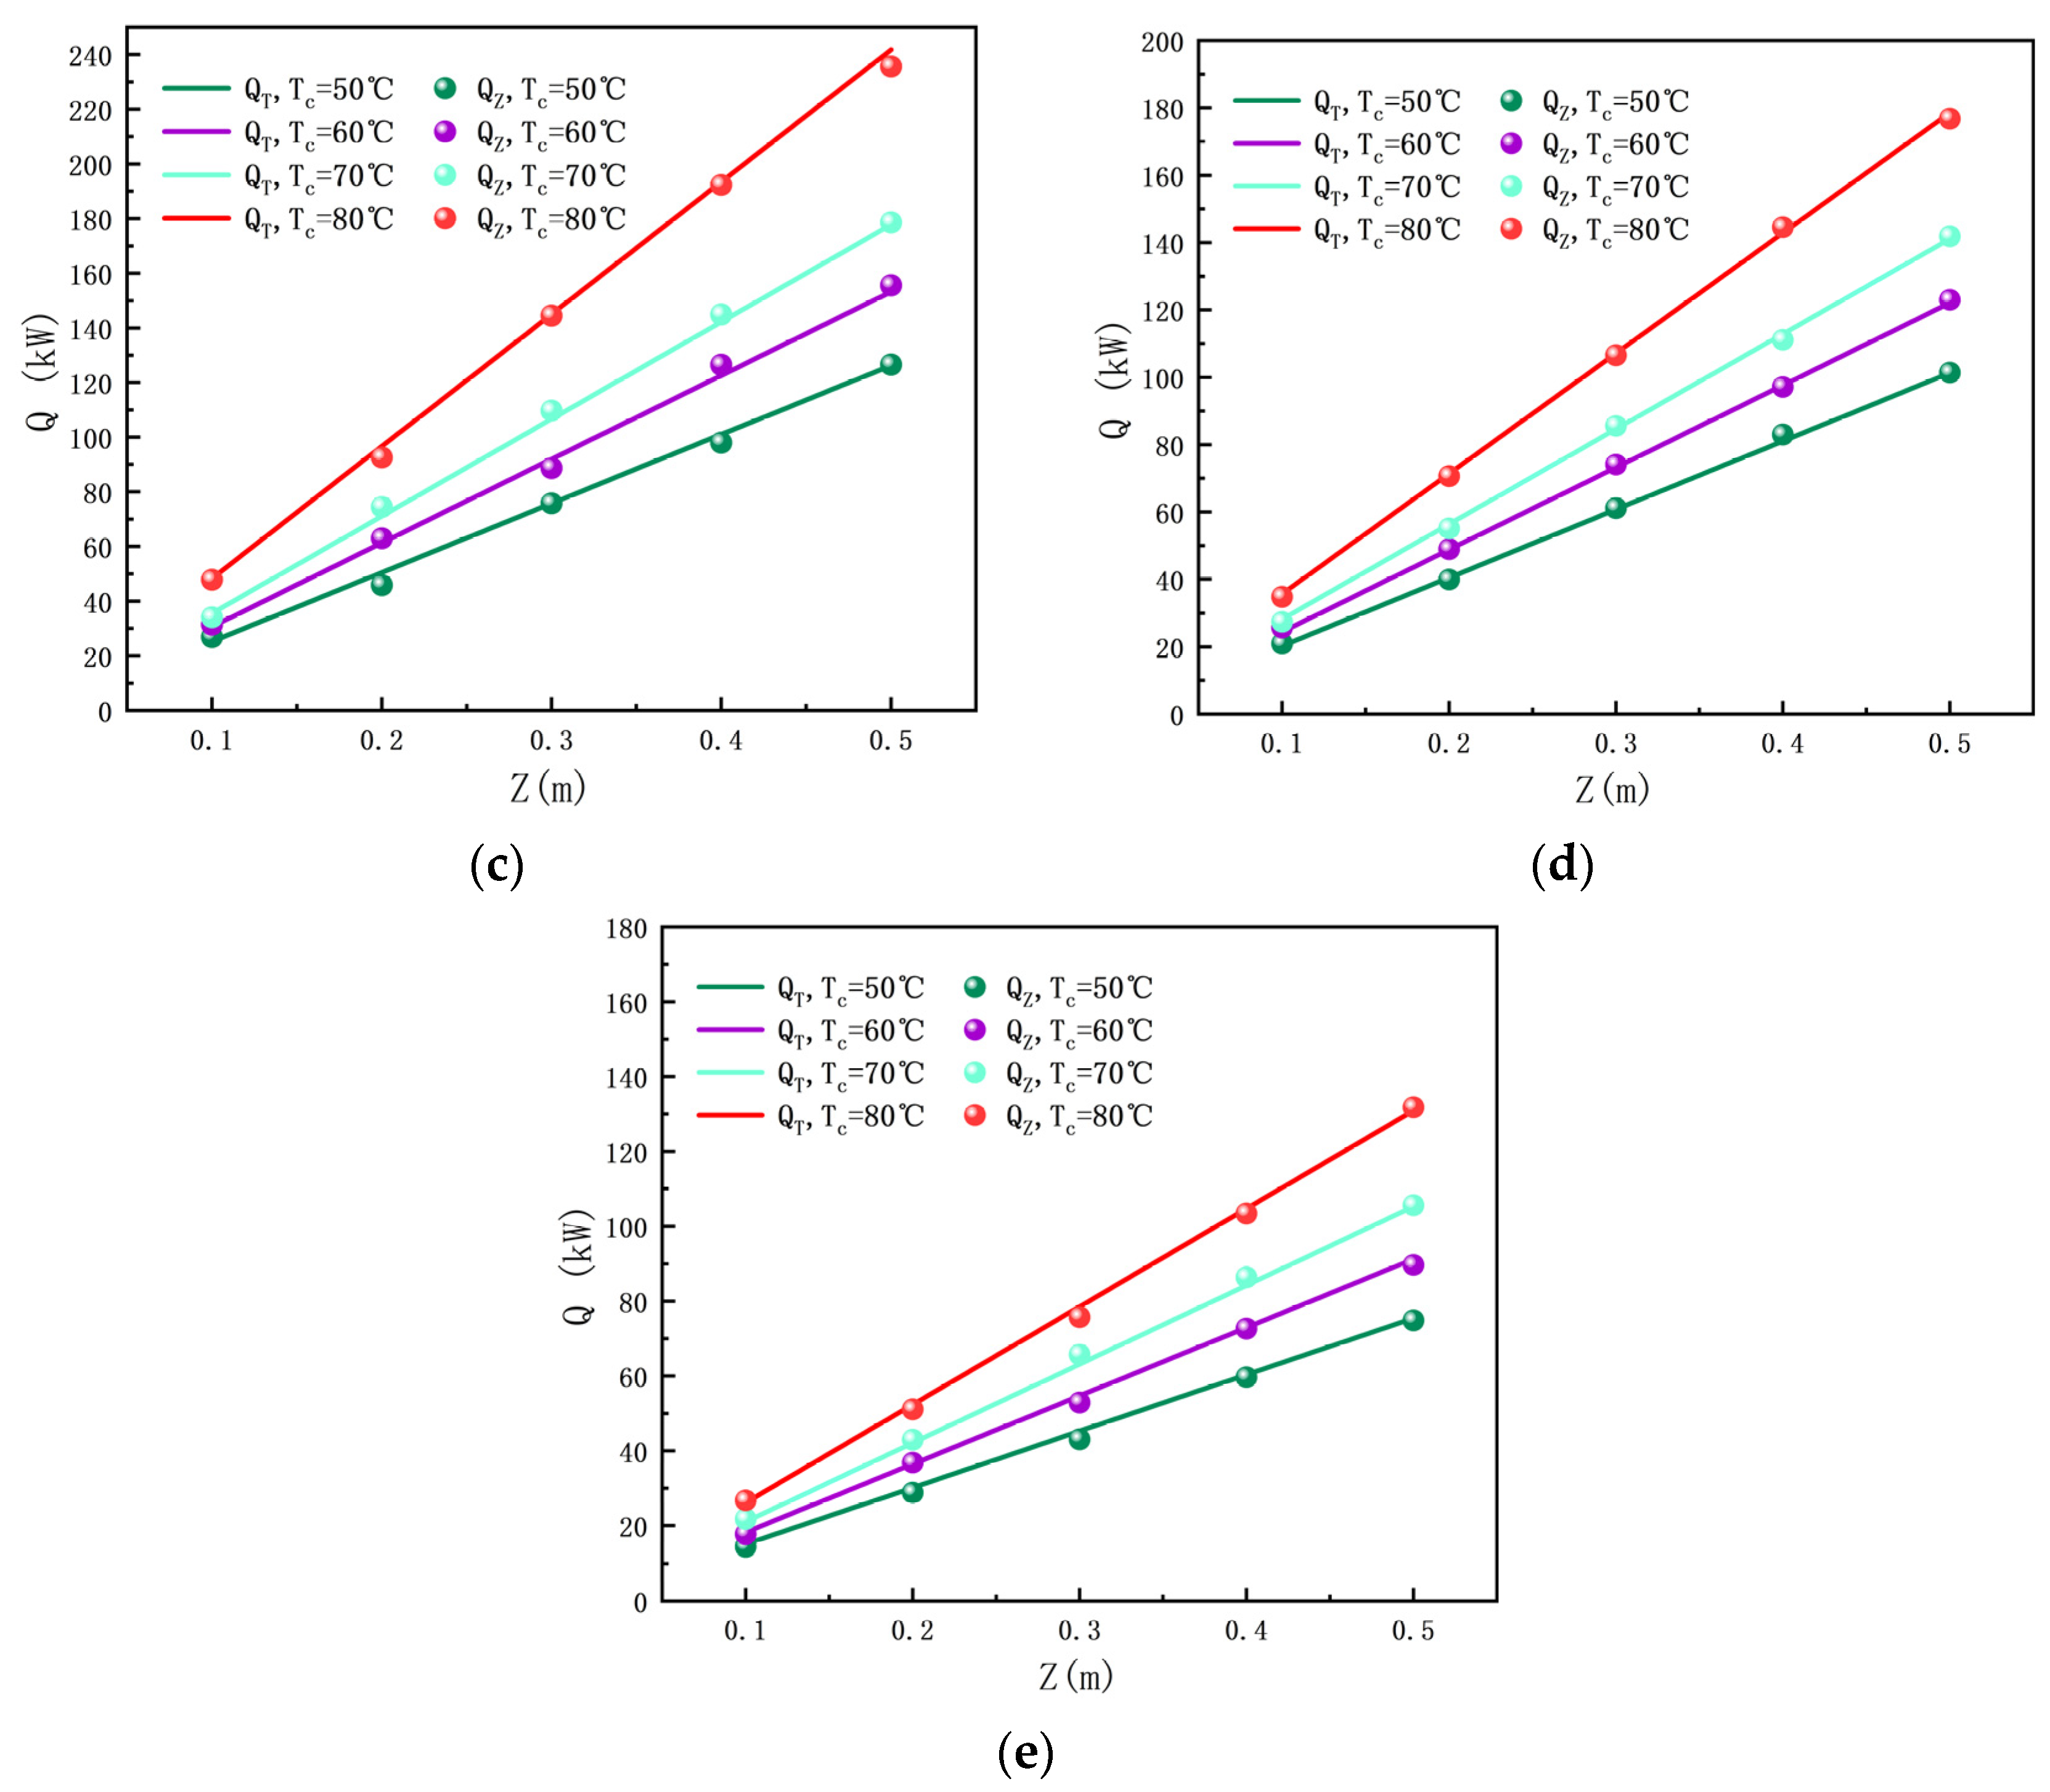
4.3. Heat Transfer Quantity

The convective heat transfer coefficient indicates the heat transfer capacity among the cold and hot fluids. The QZ amount was calculated using the local convective heat transfer coefficient and then compared with QT. The accuracy of the local convective heat transfer coefficient was determined.
Figure 8 and Figure 9 show the relationship between the heat transfer quantity and height. As shown in Figure 8 and Figure 9, when the height increased, the heat transfer quantity also grew. When the height was 0.5 m, the heat transfer quantity reached maximum. As shown in Figure 3, when the height increased, the bubble diameter increased, resulting in an increase in the heat exchange area. The heat exchange area was proportional to the heat transfer quantity; therefore, the heat transfer quantity increased with an increase in continuous phase liquid level.
Figure 8 shows the relationship between the heat flux and flow rate ratio. Figure 8 shows that the flow rate ratio decreased, and the heat flux increased. When the flow ratio was 1:5, the heat flux reached a maximum value. The greater the flow ratio of the continuous phase, the greater the heat quantity provided by the Therminol®66. Therefore, the heat flux increased as the flow rate of the Therminol®66 increased.
Besides the correlation with height, the relationship between the heat transfer quantity and temperature is shown in Figure 9. As the Therminol®66 temperature increased, the heat flux also increased. When the temperature was 80 °C, the heat transfer quantity reached its maximum. This was due to the Therminol®66 temperature increase; the heat provided by the Therminol®66 also increased. Therefore, the heat flux tended to increase.
The relationship between QT and QZ is shown in Figure 8 and Figure 9, respectively. The data calculated according to the correlation formula were consistent with the experimental data (Figure 8 and Figure 9). Due to instrumental and measurement uncertainty, the resulting error between the QT and QZ amounted to 9.4%. (Figure 9a). Within the processing time, the average error between the heat transfer quantity (QZ) calculated by the correlation and the actual heat transfer quantity (QT) was not more than 10%. The simulated curve satisfactorily reproduced the experimentally observed behavior. However, there was an error between the QT and QZ. The goal of this paper was to determine the local convective heat transfer coefficient via the simplest method, while guaranteeing a good agreement in the order of magnitude.
QZ was calculated using the local convective heat transfer coefficient. It was found that QZ and QT were in good agreement. Therefore, the local convective heat transfer coefficient calculated using Equation (18) had a high accuracy. The local convective heat transfer coefficient calculated using Equation (18) reduces the calculation workload and solves the problem of calculating the contact area between the dispersed and continuous phases. This lays the foundation for future research on the DCHE.

5. Conclusions

The heat transfer performance of the DCHE was studied experimentally. However, owing to the direct contact heat transfer process, the contact areas of the two phases were difficult to determine. Therefore, the use of the bubble surface area instead of the two-phase contact area was proposed. This paper proposes to accurately evaluate the heat transfer performance of the DCHE by determining the local convective heat transfer coefficient. Based on the experimental conditions, the bubble growth equation for the direct contact heat transfer process under different working conditions was deduced and verified. An empirical correlation formula of the local convective heat transfer coefficient between R245fa and Therminol®66 was derived and verified. Therefore, these conclusions were drawn in this study:
  • The bubble diameter was related to the height, Therminol®66 temperature, and flow rate ratio. However, the growth of bubbles was significantly affected by the ratio of height and flow rate. At the same time, under different working conditions, the maximum error between the DM and the DT was 7%.
  • The local convective heat transfer coefficient was negatively correlated with the height, Therminol®66 temperature, and flow rate ratio. When the height was 0.1 m, the continuous phase temperature was 50 °C, the flow rate ratio was 5:1, and the local convective heat transfer coefficient reached the maximum.
  • The heat transfer quantity was positively correlated with the continuous phase temperature, height, and flow rate ratio. QZ can be calculated using the empirical correlation formula of the local convective heat transfer coefficient and compared with QT. Under different working conditions, the error range of QZ and QT was within 10%.

Author Contributions

Data curation and writing—original draft preparation, J.Y.; writing—review and editing, B.L.; conceptualization, H.S.; methodology and software, J.X.; investigation, H.W. All authors have read and agreed to the published version of the manuscript.

Funding

This research was funded by the National Natural Science Foundation of China (Project Nos.: 52166004 and U1602272).

Data Availability Statement

Data sharing not applicable.

Conflicts of Interest

The authors declare no conflict of interest.

Nomenclature

Abbreviations
DCHEdirect contact heat exchanger
VHTCvolumetric heat transfer coefficient
Parameters
Xruncertainty of the experimental direct measurement data
PKprecision stint of the apparatus
BKerror stint
DMtheoretical bubble diameter, m
DTactual bubble diameter, m
hinstantaneous convective heat transfer coefficient of the surface area of the spherical
phase bubble, W/m2·°C
∆Ttemperature difference between the R245fa and Therminol®66, K
ρdvvapor phase density of the dispersed phase, kg/m
hfglatent heat of condensation, kJ/kg
∆Tminminimum temperature difference, K
∆Tmaxmaximum temperature difference, K
Hcontinuous phase liquid level, m
Zposition of bubble, m
Tctemperatures of continuous phase, K
Tdtemperatures of dispersed phase, K
Tc,outoutlet temperatures of continuous phase, K
Tc,ininlet temperatures of continuous phase, K
Td,outoutlet temperatures of dispersed d phase, K
Td,ininlet temperatures of dispersed phase, K
NuNusselt number
PePeclet number
λcthermal conductivity of continuous phase, W/(m ·K)
tvtime required for complete evaporation, s
Urrelative speed of the R245fa and Therminol®66, m/s
∈dthermal diffusivity of the R245fa, m2/s
Urising speed of the bubble, m/s
wratio of relative velocity to bubble velocity
D0nozzle diameter, m
hZlocal convective heat transfer coefficient, W/m2·K
nnumber of local two-phase bubbles
QTactual heat transfer quantity, kW
QZtheoretical heat transfer quantity, kW
mdmass flow rate of the dispersed phase, kg/h
Hd,outoutlet enthalpy of the dispersed phase, kJ/kg
Hd,ininlet enthalpy of the dispersed phase, kJ/kg
Atwo-phase contact area, m2
ivariable
ritheoretical radius of the i-th bubble, m
Di,Mtheoretical diameter of the i-th bubble, m
∆Ttmlogarithmic average temperature difference between the R245fa and Therminol®66, K

References

  1. Cui, Z.; Du, Q.; Gao, J.; Bie, R.; Li, D. Development of a direct contact heat exchanger for energy and water recovery from humid flue gas. Appl. Therm. Eng. 2020, 173, 115214. [Google Scholar] [CrossRef]
  2. Maalouf, S.; Boulawz Ksayer, E.; Clodic, D. Investigation of direct contact condensation for wet flue-gas waste heat recovery using Organic Rankine Cycle. Energy Convers. Manag. 2016, 107, 96–102. [Google Scholar] [CrossRef]
  3. Kim, T.Y.; Negash, A.; Cho, G. Experimental and numerical study of waste heat recovery characteristics of direct contact thermoelectric generator. Energy Convers. Manag. 2017, 140, 273–280. [Google Scholar] [CrossRef]
  4. Brückner, S.; Liu, S.; Miró, L.; Radspieler, M.; Cabeza, L.F.; Lävemann, E. Industrial waste heat recovery technologies: An economic analysis of heat transformation technologies. Appl. Energy 2015, 151, 157–167. [Google Scholar] [CrossRef]
  5. Yabuki, T.; Nakabeppu, O. Microscale wall heat transfer and bubble growth in single bubble subcooled boiling of water. Int. J. Heat Mass Transf. 2016, 100, 851–860. [Google Scholar] [CrossRef]
  6. Edel, Z.J.; Mukherjee, A. Experimental investigation of vapor bubble growth during flow boiling in a microchannel. Int. J. Multiph. Flow 2011, 37, 1257–1265. [Google Scholar] [CrossRef]
  7. Cai, C.; Liu, H.; Xi, X.; Jia, M.; Yin, H. Bubble growth model in uniformly superheated binary liquid mixture. Int. J. Heat Mass Transf. 2018, 127, 629–638. [Google Scholar] [CrossRef]
  8. Thiagarajan, S.J.; Yang, R.; King, C.; Narumanchi, S. Bubble dynamics and nucleate pool boiling heat transfer on microporous copper surfaces. Int. J. Heat Mass Transf. 2015, 89, 1297–1315. [Google Scholar] [CrossRef] [Green Version]
  9. Ghazivini, M.; Hafez, M.; Ratanpara, A.; Kim, M. A review on correlations of bubble growth mechanisms and bubble dynamics parameters in nucleate boiling. J. Therm. Anal. Calorim. 2022, 147, 6035–6071. [Google Scholar] [CrossRef]
  10. Mao, L.; Zhou, W.; Hu, X.; He, Y.; Zhang, G.; Zhang, L.; Fu, R. Pool boiling performance and bubble dynamics on graphene oxide nanocoating surface. Int. J. Therm. Sci. 2020, 147, 106154. [Google Scholar] [CrossRef]
  11. Xu, J.; Xiao, Q.; Chen, Y.; Fei, Y.; Pan, J.; Wang, H. A modified L2-star discrepancy method for measuring mixing uniformity in a direct contact heat exchanger. Int. J. Heat Mass Transf. 2016, 97, 70–76. [Google Scholar] [CrossRef]
  12. Xu, J.; Xiao, Q.; Lv, Z.; Huang, J.; Xiao, R.; Pan, J.; Wang, H. New metrics for measuring multiphase mixing effects in a direct-contact heat exchanger. Appl. Therm. Eng. 2019, 147, 592–601. [Google Scholar] [CrossRef]
  13. Xiao, Q.; Pan, J.; Lv, Z.; Xu, J.; Wang, H. Measure of bubble non-uniformity within circular region in a direct-contact heat exchanger. Int. J. Heat Mass Transf. 2017, 110, 257–261. [Google Scholar] [CrossRef] [Green Version]
  14. Fei, Y.; Xiao, Q.; Xu, J.; Pan, J.; Wang, S.; Wang, H.; Huang, J. A novel approach for measuring bubbles uniformity and mixing efficiency in a direct contact heat exchanger. Energy 2015, 93, 2313–2320. [Google Scholar] [CrossRef]
  15. Xiao, Q.; Yang, K.; Wu, M.; Pan, J.; Xu, J.; Wang, H. Complexity evolution quantification of bubble pattern in a gas-liquid mixing system for direct-contact heat transfer. Appl. Therm. Eng. 2018, 138, 832–839. [Google Scholar] [CrossRef]
  16. Sun, H.; Li, Z.; Wang, S.; Xu, J.; Wang, H. Evolution and quantification of distribution uniformity of bubbles using computational geometry. Chem. Eng. Sci. 2022, 247, 116910. [Google Scholar] [CrossRef]
  17. Wen, X.; Liang, C.; Zhang, X. Experimental study on heat transfer coefficient between air and liquid in the cross-flow heat-source tower. Build. Environ. 2012, 57, 205–213. [Google Scholar] [CrossRef]
  18. Kunkel, S.; Teumer, T.; Dörnhofer, P.; Wunder, F.; Repke, J.; Rädle, M. Investigation of heat transfer coefficients in a liquid–liquid direct contact latent heat storage system. J. Energy Storage 2020, 28, 101178. [Google Scholar] [CrossRef]
  19. Mahood, H.B.; Campbell, A.N.; Thorpe, R.B.; Sharif, A.O. Heat transfer efficiency and capital cost evaluation of a three-phase direct contact heat exchanger for the utilisation of low-grade energy sources. Energy Convers. Manag. 2015, 106, 101–109. [Google Scholar] [CrossRef] [Green Version]
  20. Mahood, H.B.; Sharif, A.O.; Al-Aibi, S.; Hawkins, D.; Thorpe, R. Analytical solution and experimental measurements for temperature distribution prediction of three-phase direct-contact condenser. Energy 2014, 67, 538–547. [Google Scholar] [CrossRef]
  21. Mahood, H.B.; Campbell, A.N.; Sharif, A.O.; Thorpe, R.B. Heat transfer measurement in a three-phase direct-contact condenser under flooding conditions. Appl. Therm. Eng. 2016, 95, 106–114. [Google Scholar] [CrossRef]
  22. Nomura, T.; Tsubota, M.; Oya, T.; Okinaka, N.; Akiyama, T. Heat release performance of direct-contact heat exchanger with erythritol as phase change material. Appl. Therm. Eng. 2013, 61, 28–35. [Google Scholar] [CrossRef]
  23. Nomura, T.; Tsubota, M.; Sagara, A.; Okinaka, N.; Akiyama, T. Performance analysis of heat storage of direct-contact heat exchanger with phase-change material. Appl. Therm. Eng. 2013, 58, 108–113. [Google Scholar] [CrossRef]
  24. Nomura, T.; Tsubota, M.; Oya, T.; Okinaka, N.; Akiyama, T. Heat storage in direct-contact heat exchanger with phase change material. Appl. Therm. Eng. 2013, 50, 26–34. [Google Scholar] [CrossRef]
  25. Barabash, P.; Solomakha, A.; Sereda, V. Experimental investigation of heat and mass transfer characteristics in direct contact exchanger. Int. J. Heat Mass Transf. 2020, 162, 120359. [Google Scholar] [CrossRef]
  26. Wang, Y.; Fu, H.; Huang, Q.; Cui, Y.; Sun, Y.; Jiang, L. Experimental study of direct contact vaporization heat transfer on n-pentane-water flowing interface. Energy 2015, 93, 854–863. [Google Scholar] [CrossRef]
  27. Fu, H.; Ma, L.; Wang, H. Direct-Contact Heat Transfer duringn-Pentane Vaporization in a Two-Dimensional Water Column. Chem. Eng. Technol. 2020, 43, 1416–1423. [Google Scholar] [CrossRef]
  28. Fu, H.; Wang, Y.; Huang, Q.; Cui, Y.; Sun, Y.; Jiang, L. Direct contact evaporation heat transfer coefficient and drobble size distribution in a 2D column. Appl. Therm. Eng. 2016, 96, 568–575. [Google Scholar] [CrossRef]
  29. Kim, J.H.; Simon, T.W.; Viskanta, R. Journal of heat transfer policy on reporting uncertainties in experimental measurements and results. J. Heat Transf. 1993, 115, 5–6. [Google Scholar] [CrossRef] [Green Version]
  30. Moffat, R.J. Describing the uncertainties in experimental results. Exp. Therm. Fluid Sci. 1988, 1, 3–17. [Google Scholar] [CrossRef]
  31. Mori, Y.H. An analytic model of direct-contact heat transfer in spray-column evaporators. AIChE J. 1991, 37, 539–546. [Google Scholar] [CrossRef]
  32. Moalem-Maron, D.; Sokolov, M.; Sideman, S. A closed periodic condensation-evaporation cycle of an immiscible, gravity driven bubble. Int. J. Heat Mass Transf. 1980, 23, 1417–1424. [Google Scholar] [CrossRef]
  33. Shimizu, Y.; Mori, Y.H. Evaporation of single liquid drops in an immiscible liquid at elevated pressures: Experimental study with n-pentane and R 113 drops in water. Int. J. Heat Mass Transf. 1988, 31, 1843–1851. [Google Scholar] [CrossRef]
  34. Chaurasiya, V.C.R.K. A numerical study of a moving boundary problem with variable thermal conductivity and temperature-dependent moving PCM under periodic boundary condition. Eur. Phys. J. Plus 2022, 137, 714. [Google Scholar] [CrossRef]
  35. Prasser, H.M.; Beyer, M.; Böttger, A.; Carl, H.; Lucas, D.; Schaffrath, A.; Schütz, P.; Weiss, F.P.; Zschau, J. Influence of the Pipe Diameter on the Structure of the Gas-Liquid Interface in a Vertical Two-Phase Pipe Flow. Nucl. Technol. 2005, 152, 3–22. [Google Scholar] [CrossRef]
  36. Vafaei, S.T.B.A. Theoretical and experimental investigation of quasi-steady-state bubble growth on top of submerged stainless ssteel nozzles. Colloids Surf. A Physicochem. Eng. Asp. 2010, 369, 11–19. [Google Scholar] [CrossRef]
  37. Baqir, A.S.; Mahood, H.B.; Campbell, A.N.; Griffiths, A.J. Measuring the average volumetric heat transfer coefficient of a liquid–liquid–vapour direct contact heat exchanger. Appl. Therm. Eng. 2016, 103, 47–55. [Google Scholar] [CrossRef]
  38. Liu, Q.; Zhang, Y.; Wu, Y.; Lyu, J.; Liu, Q. Bubble Growth in NaCl Solution: Influence of Superheat Temperature and Solution Concentration. Ind. Eng. Chem. Res. 2021, 60, 4440–4452. [Google Scholar] [CrossRef]
  39. Xu, J.H.; Luo, G.S.; Li, S.W.; Chen, G.G. Shear force induced monodisperse droplet formation in a microfluidic device by controlling wetting properties. Lab A Chip 2006, 6, 131–136. [Google Scholar] [CrossRef]
  40. Djeridi, H.; Gabillet, C.; Billard, J.Y. Two-phase Couette–Taylor flow: Arrangement of the dispersed phase and effects on the flow structures. Phys. Fluids 2004, 16, 128–139. [Google Scholar] [CrossRef]
  41. Cooper, M.G. The microlayer and bubble growth in nucleate pool boiling. Int. J. Heat Mass Transf. 1969, 12, 915–933. [Google Scholar] [CrossRef]
  42. Verhaart, H.F.A.R. Growth rate of a gas bubble during electrolysis in supersaturated liquid. Int. J. Heat Mass Transf. 1980, 23, 293–299. [Google Scholar] [CrossRef]
  43. Kocamustafaogullari, G. Pressure dependence of bubble departure diameter for water. Int. Commun. Heat Mass Transf. 1983, 10, 501–509. [Google Scholar] [CrossRef]
  44. Robinson, A.J.; Judd, R.L. The dynamics of spherical bubble growth. Int. J. Heat Mass Transf. 2004, 47, 5101–5113. [Google Scholar] [CrossRef]
  45. Mahood, H.B.; Campbell, A.N.; Thorpe, R.B.; Sharif, A.O. Experimental measurements and theoretical prediction for the volumetric heat transfer coefficient of a three-phase direct contact condenser. Int. Commun. Heat Mass Transf. 2015, 66, 180–188. [Google Scholar] [CrossRef] [Green Version]
  46. Brooks, C.S.; Hibiki, T. Wall nucleation modeling in subcooled boiling flow. Int. J. Heat Mass Transf. 2015, 86, 183–196. [Google Scholar] [CrossRef]
  47. Zhou, J.; Zhang, Y.; Wei, J. A modified bubble dynamics model for predicting bubble departure diameter on micro-pin-finned surfaces under microgravity. Appl. Therm. Eng. 2018, 132, 450–462. [Google Scholar] [CrossRef]
  48. Gao, W.; Qi, J.; Yang, X.; Zhang, J.; Wu, D. Experimental investigation on bubble departure diameter in pool boiling under sub-atmospheric pressure. Int. J. Heat Mass Transf. 2019, 134, 933–947. [Google Scholar] [CrossRef] [Green Version]
  49. Chaurasiya, V.; Wakif, A.; Shah, N.A.; Singh, J. A study on cylindrical moving boundary problem with variable thermal conductivity and convection under the most realistic boundary conditions. Int. Commun. Heat Mass Transf. 2022, 138, 106312. [Google Scholar] [CrossRef]
Figure 1. Schematic diagram of the experiment. 1: nozzle; 2: direct contact heat exchanger; 3: high-speed camera (5F01M, Revealer, China); 4: flowmeter; 5: thermometer; 6: pressure gauge; 7: condenser; 8: liquid storage tank; 9: centrifugal pump; 10: instrument display; 11: gear oil pump; 12: control cabinet; 13: electric heater.
Energies 16 01069 g001
Figure 2. Image processing process.
Energies 16 01069 g002
Figure 3. The relationship between bubble diameter and height (Z) at different temperatures. (a): Tc = 50 °C. (b): Tc = 60 °C. (c): Tc = 70 °C. (d): Tc = 80 °C.
Energies 16 01069 g003
Figure 4. The relationship between bubble diameter and height (Z) under different flow rate ratios. (a): md/mc = 1:5. (b): md/mc = 1:4. (c): md/mc = 1:3. (d): md/mc = 1:2. (e): md/mc = 1:1.
Energies 16 01069 g004
Figure 5. Tc = 60 °C, md:mc = 1:5, comparison of the bubble growth correlation proposed in this paper with experimental data and other correlations [41,42,43,44,45,46,47,48].
Energies 16 01069 g005
Figure 6. The relationship between the local convective heat transfer coefficient and height (Z) under different flow rate ratios. (a): md/mc = 1:5. (b): md/mc = 1:4. (c): md/mc = 1:3. (d): md/mc = 1:2, (e): md/mc = 1:1.
Energies 16 01069 g006aEnergies 16 01069 g006b
Figure 7. The relationship between the local convective heat transfer coefficient and height (Z) at different temperatures. (a): Tc = 50 °C. (b): Tc = 60 °C. (c): Tc = 70 °C. (d): Tc = 80 °C.
Energies 16 01069 g007
Figure 8. The relationship between heat transfer quantity and height (Z) at different temperatures. (a): Tc = 50 °C. (b): Tc = 60 °C. (c): Tc = 70 °C. (d): Tc = 80 °C.
Energies 16 01069 g008
Figure 9. The relationship between heat transfer quantity and height (Z) under different flow rate ratios. (a): md/mc = 1:5. (b): md/mc = 1:4. (c): md/mc = 1:3. (d): md/mc = 1:2. (e): md/mc = 1:1.
Energies 16 01069 g009aEnergies 16 01069 g009b
Table 1. Thermal properties of the continuous phase.
TC (K)ρc (kg/m3)λc (w/(m·k))Ν × 106 (m2/s)
323987.650.116318.58
333980.50.1157513.175
3439730.11527.77
3539690.114555.98
Table 2. Thermal properties of the dispersed phase.
Td (K)ρd,v (kg/m3)hd,L (kJ/kg)hd,v (kJ/kg)
2834.8846212.84411.79
2937.1869225.86419.12
30310.169239.16426.43
31314.124252.27433.71
Table 3. Experimental conditions.
Tc (K)mc (kg·s−1)md (kg·s−1)
323/333/343/3530.080.08
323/333/343/3530.080.16
323/333/343/3530.080.24
323/333/343/3530.080.32
323/333/343/3530.080.40
Table 4. Bubble growth equations proposed by different researchers.
NoReferenceCorrelationsCondition
1Copper [41] R t = 2.5 J a p r 1 0.5 α t 1 2 Water, organic liquids, cryogens and metallic fluids have been used
2Verhaart et al. [42] R t = 3 π 1 2 Ja + 3 π Ja 2 + 2 Ja 1 2 D t 1 2 All experiments have been carried out at a temperature of 291 K and at (sub)atmospheric pressure(s).
3Kacamastaf-aogullari [43] D d = 2.64 × 10 5 θ g ρ 1 ρ v ρ 1 ρ v ρ 1 0.9 The average deviation of the correlation is 33%
4Robinson and Judd [44] R t = 2 Ja α 1 t 1 2 36 ≤ Ja ≤ 63167
5Mahood et al. [45] D = D 0 3 2 3 k c ρ v h f g k v π ε 0.5 U r 0.5 · Z 2 H 2 3 Working fluid = water and pentane
6Brooks et al. [46] d d = 2.11 × 10 3 L O J a N . W N T 0.49 ρ * 0.78 B o o .44 p r 1.72
where B o = q w G h l v ,   J a N . W = c p , l T w T s a t h l v ,   N T = T W T b T w T s a t
J a N . W : 7.6 × 10⁻⁴ − 0.12;
N T : 1.0–99;
ρ   * : 6.4 × 10⁻⁴ − 3.4 × 10⁻²;
B o : 7.3 × 10⁻⁵ − 1.0 × 10⁻³;
7Zhou et al. [47] D s = 0.08 J a 0.6 2 θ / g ρ 1 ρ v
8Gao et al. [48] D d = 2 30 15 gt g 2
Disclaimer/Publisher’s Note: The statements, opinions and data contained in all publications are solely those of the individual author(s) and contributor(s) and not of MDPI and/or the editor(s). MDPI and/or the editor(s) disclaim responsibility for any injury to people or property resulting from any ideas, methods, instructions or products referred to in the content.

