Article

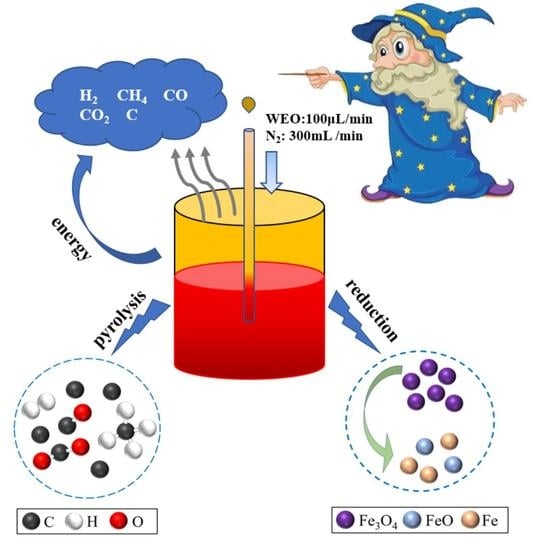
Cracking of Waste Engine Oil in the Presence of Fe3O4

1
State Key Laboratory of Complex Nonferrous Metal Resources Clean Utilization, Kunming University of Science and Technology, Kunming 650093, China
2
Faculty of Metallurgical and Energy Engineering, Kunming University of Science and Technology, Kunming 650093, China
*
Author to whom correspondence should be addressed.
Energies 2023, 16(2), 655; https://doi.org/10.3390/en16020655
Submission received: 22 November 2022 / Revised: 25 December 2022 / Accepted: 25 December 2022 / Published: 5 January 2023
(This article belongs to the Special Issue Advanced Analysis of Heat Transfer and Energy Conversion)

Abstract

:
Waste engine oil (WEO), as a waste resource, has not been fully exploited. Using WEO as a reductant for copper slag cleaning is quite meaningful. Fe3O4 is an important element in copper slag cleaning. So the laws of thermal cracking of WEO at different temperatures and the effect on thermal cracking of WEO in the presence of Fe3O4 were investigated. The results show that the high-temperature cracking of WEO mainly produces H2, CO, CH4, CO2, and small molecules such as C. Raising the temperature is good for the cracking of WEO. When the temperature rises from 700 °C to 1300 °C, the total amount of gases produced by cracking 700 μL of WEO increases from 177.08 mL to 1010.2 mL. At 1300 °C, the total amount of gases produced by the cracking of WEO in the presence of Fe3O4 was 1408.11 mL. The result indicates that Fe3O4 can promote the pyrolysis of waste oil. This research provides a novel approach to the clean utilization of WEO.

Graphical Abstract

1. Introduction

The main energy source in today’s society is fossil energy, mainly coal, oil, and natural gas, and, as fossil energy, it is non-renewable. As human demand for energy continues to increase and more attention is being paid to the development of renewable energy sources, full utilization of waste resources, and the treatment of waste with waste, turning waste into treasure.
Energy shortage and environmental pollution are the two major problems facing China at present. With the increasing number of various types of transportation, the amount of waste oil produced is also huge; if not reasonably recycled, it will cause serious environmental pollution [1]. The WEO refers to the oil mixed with water, dust, and metal powder generated by the wear of the machine parts, which causes the color to turn black and the viscosity to increase. The second refers to the gradual deterioration of engine oil, resulting in organic acids, gums, and asphalt-like substances. According to estimates, China’s various types of engineering machinery and equipment, automobiles, ships, aircraft trains, and other large machinery, produce 25 to 30 million tons of WEO each year. According to the relevant departments, the recycling rate of WEO is only about 20% [2,3]. According to the latest statistics, as of March 2022, the number of motor vehicles in the country reached 402 million. If an oil change is calculated by an average of 4 L (1.6 exhaust volume), the WEO produced by motor vehicles can reach 1.608 × 10⁹ L per year. The main components of WEO are still base oil and a small amount of additives, but its internal composition is more complex and contains a certain amount of substances harmful to humans, such as carcinogenic polycyclic aromatic hydrocarbons, polychlorinated biphenyls, and heavy metal elements [4,5]. If WEO is discharged directly, it will cause serious environmental pollution because it does not degrade naturally. Currently, the way to utilize WEO worldwide is by recycling it. The use of WEO as an additive or auxiliary material to improve the performance of asphalt binders is also an important way to treat WEO. Some scholars used WEO to improve the properties of asphalt mixes with improved aging resistance [6,7,8,9,10]. From both environmental protection and resource utilization, it is necessary to recycle and scientifically dispose of and utilize WEO.
Numerous studies have shown that pyrolysis is an environmentally friendly way to treat waste, which refers to heating waste under air-isolated conditions to obtain a three-phase product of gas, liquid, and solid. Kim et al. [11] analyzed low-temperature pyrolysis of WEO in a tubular reactor after referring to the pyrolysis behavior of organic materials such as coal, waste tires, and waste plastics, explored the effects of pyrolysis temperature and reaction time on the yield of gas, solid, and oil phases, and proposed a corresponding kinetic model for pyrolysis, which is a great guide for the design of future pyrolysis reactors. Su et al. [12,13,14] conducted an experimental study on catalytic pyrolysis of WEO in a microwave oven using the characteristics of rapid, energy-efficient, and targeted microwave heating. The carbon-based material was placed at the bottom of the microwave oven, and then a mixture of WEO and catalyst was added to prepare pyrolysis oil by pyrolysis under the action of microwave radiation. Lázaro et al. [15] used a fluidized bed reactor to co-pyrolyze WEO with coal slurry and found that the WEO and coal slurry had a synergistic effect and the quality of the co-pyrolysis products was better than that of the WEO pyrolysis products alone. The content of benzene, toluene, and xylene in the pyrolysis oil increased, and the content of methane and ethylene in the pyrolysis gas increased significantly, while the heavy metals in the WEO were transferred to the coke, which could reduce the metal content in the pyrolysis oil and thus improve the quality of the pyrolysis oil. Blanco et al. [16,17] conducted a large number of systematic studies on microwave pyrolysis of WEO, exploring the yield and properties of pyrolysis oil and pyrolysis gas under microwave heating and investigating the effect of pyrolysis process parameters on them. The results showed that the maximum yield of pyrolysis oil could reach 88% and was mainly composed of light aliphatic and aromatic hydrocarbons; the maximum yield of pyrolysis gas could reach 41%, of which light-saturated hydrocarbons accounted for the majority. In addition, some scholars added catalysts, including zeolites and pyrolytic coke, to the process of pyrolysis and found that the addition of appropriate catalysts can selectively increase the yield of some products.
In the pyrolysis technology of WEO, various metals and impurities, such as metal oxides contained in the WEO itself, can also be directly used as catalysts so that the WEO can be used without removing the metals and their oxide impurities in the pretreatment, reducing the pyrolysis process and the cost of catalyst preparation. Metal oxides are an important class of catalysts in oil cracking. Zouad et al. [18] studied the effect of the dosing ratios of MgO and Al2O3 at different temperatures on the quality of diesel fuel produced by the pyrolysis of WEO using MgO and Al2O3 as catalysts. When 1–2% MgO was dosed, the performance of diesel fuel could be closer to that of conventional products. Bhaskar et al. [19] investigated the effect of catalyst properties on the pyrolysis process of WEO and demonstrated that Fe2O3 catalysts improve the product performance of catalytic cracking reactions and greatly reduce the sulfur content of the liquid fraction (from 1640 ppm to 99 ppm) through a comparative study of Fe2O3, Fe/Al2O3 and Fe/SiO2-Al2O3 systems. Abdul-Raouf [20] co-pyrolyzed WEO with waste tires and investigated the effect of reaction conditions on pyrolysis products. The results showed that both the Al2O3 catalyst and high temperature were favorable for the production of paraffinic hydrocarbons. The cracking behavior of waste cooking oil at 600 °C–1300 °C and in the presence of Fe3O4 was investigated by Zhou et al. [21]. The results indicated that high temperature could promote oil cracking. Therefore, in order to realize the resource utilization of WEO and use WEO as a reductant for copper slag cleaning, Fe3O4 is an important element in copper slag cleaning. So the laws of thermal cracking of WEO at different temperatures and the effect on thermal cracking of WEO in the presence of Fe3O4 were investigated. We tried to provide theoretical support for resource utilization of WEO in the future.

2. Materials and Methods

2.1. Materials

The elemental composition of WEO is listed in Table 1. Its main elements are C, H, O, N, and S. Element C accounts for 83.52%, and element H accounts for 13.88%, of which the total content of elements C and H is about 97.4%. The composition of WEO is listed in Table 2, and the main component of WEO is alkane oil, with a content of about 90.98%. The density of WEO is about 0.89 g/cm3. The purity of 99% and 75 μm particle size of Fe3O4 powder were used for the experiment.

2.2. Methods

2.2.1. WEO Thermogravimetric Experiment

Thermogravimetry is a thermal analysis method that can determine the mass change of the tested sample at different programmed temperatures. The data measured by the thermogravimetric analyzer are plotted against the change in sample mass and temperature, and the curve is analyzed to obtain the different stages through which the sample reacts thermally, and the change in mass at each stage is recorded.
The thermogravimetric test of WEO is carried out on a thermogravimetric instrument, using nitrogen as a protective gas, at a speed of 50 mL/min, with an initial temperature of 40 °C, end temperature of 900 °C, and a temperature of 10 °C/min speed. The thermogravimetric experiments were carried out in two groups: (1) WEO was placed in a crucible; (2) a mixture of WEO and Fe3O4 was placed in a crucible.

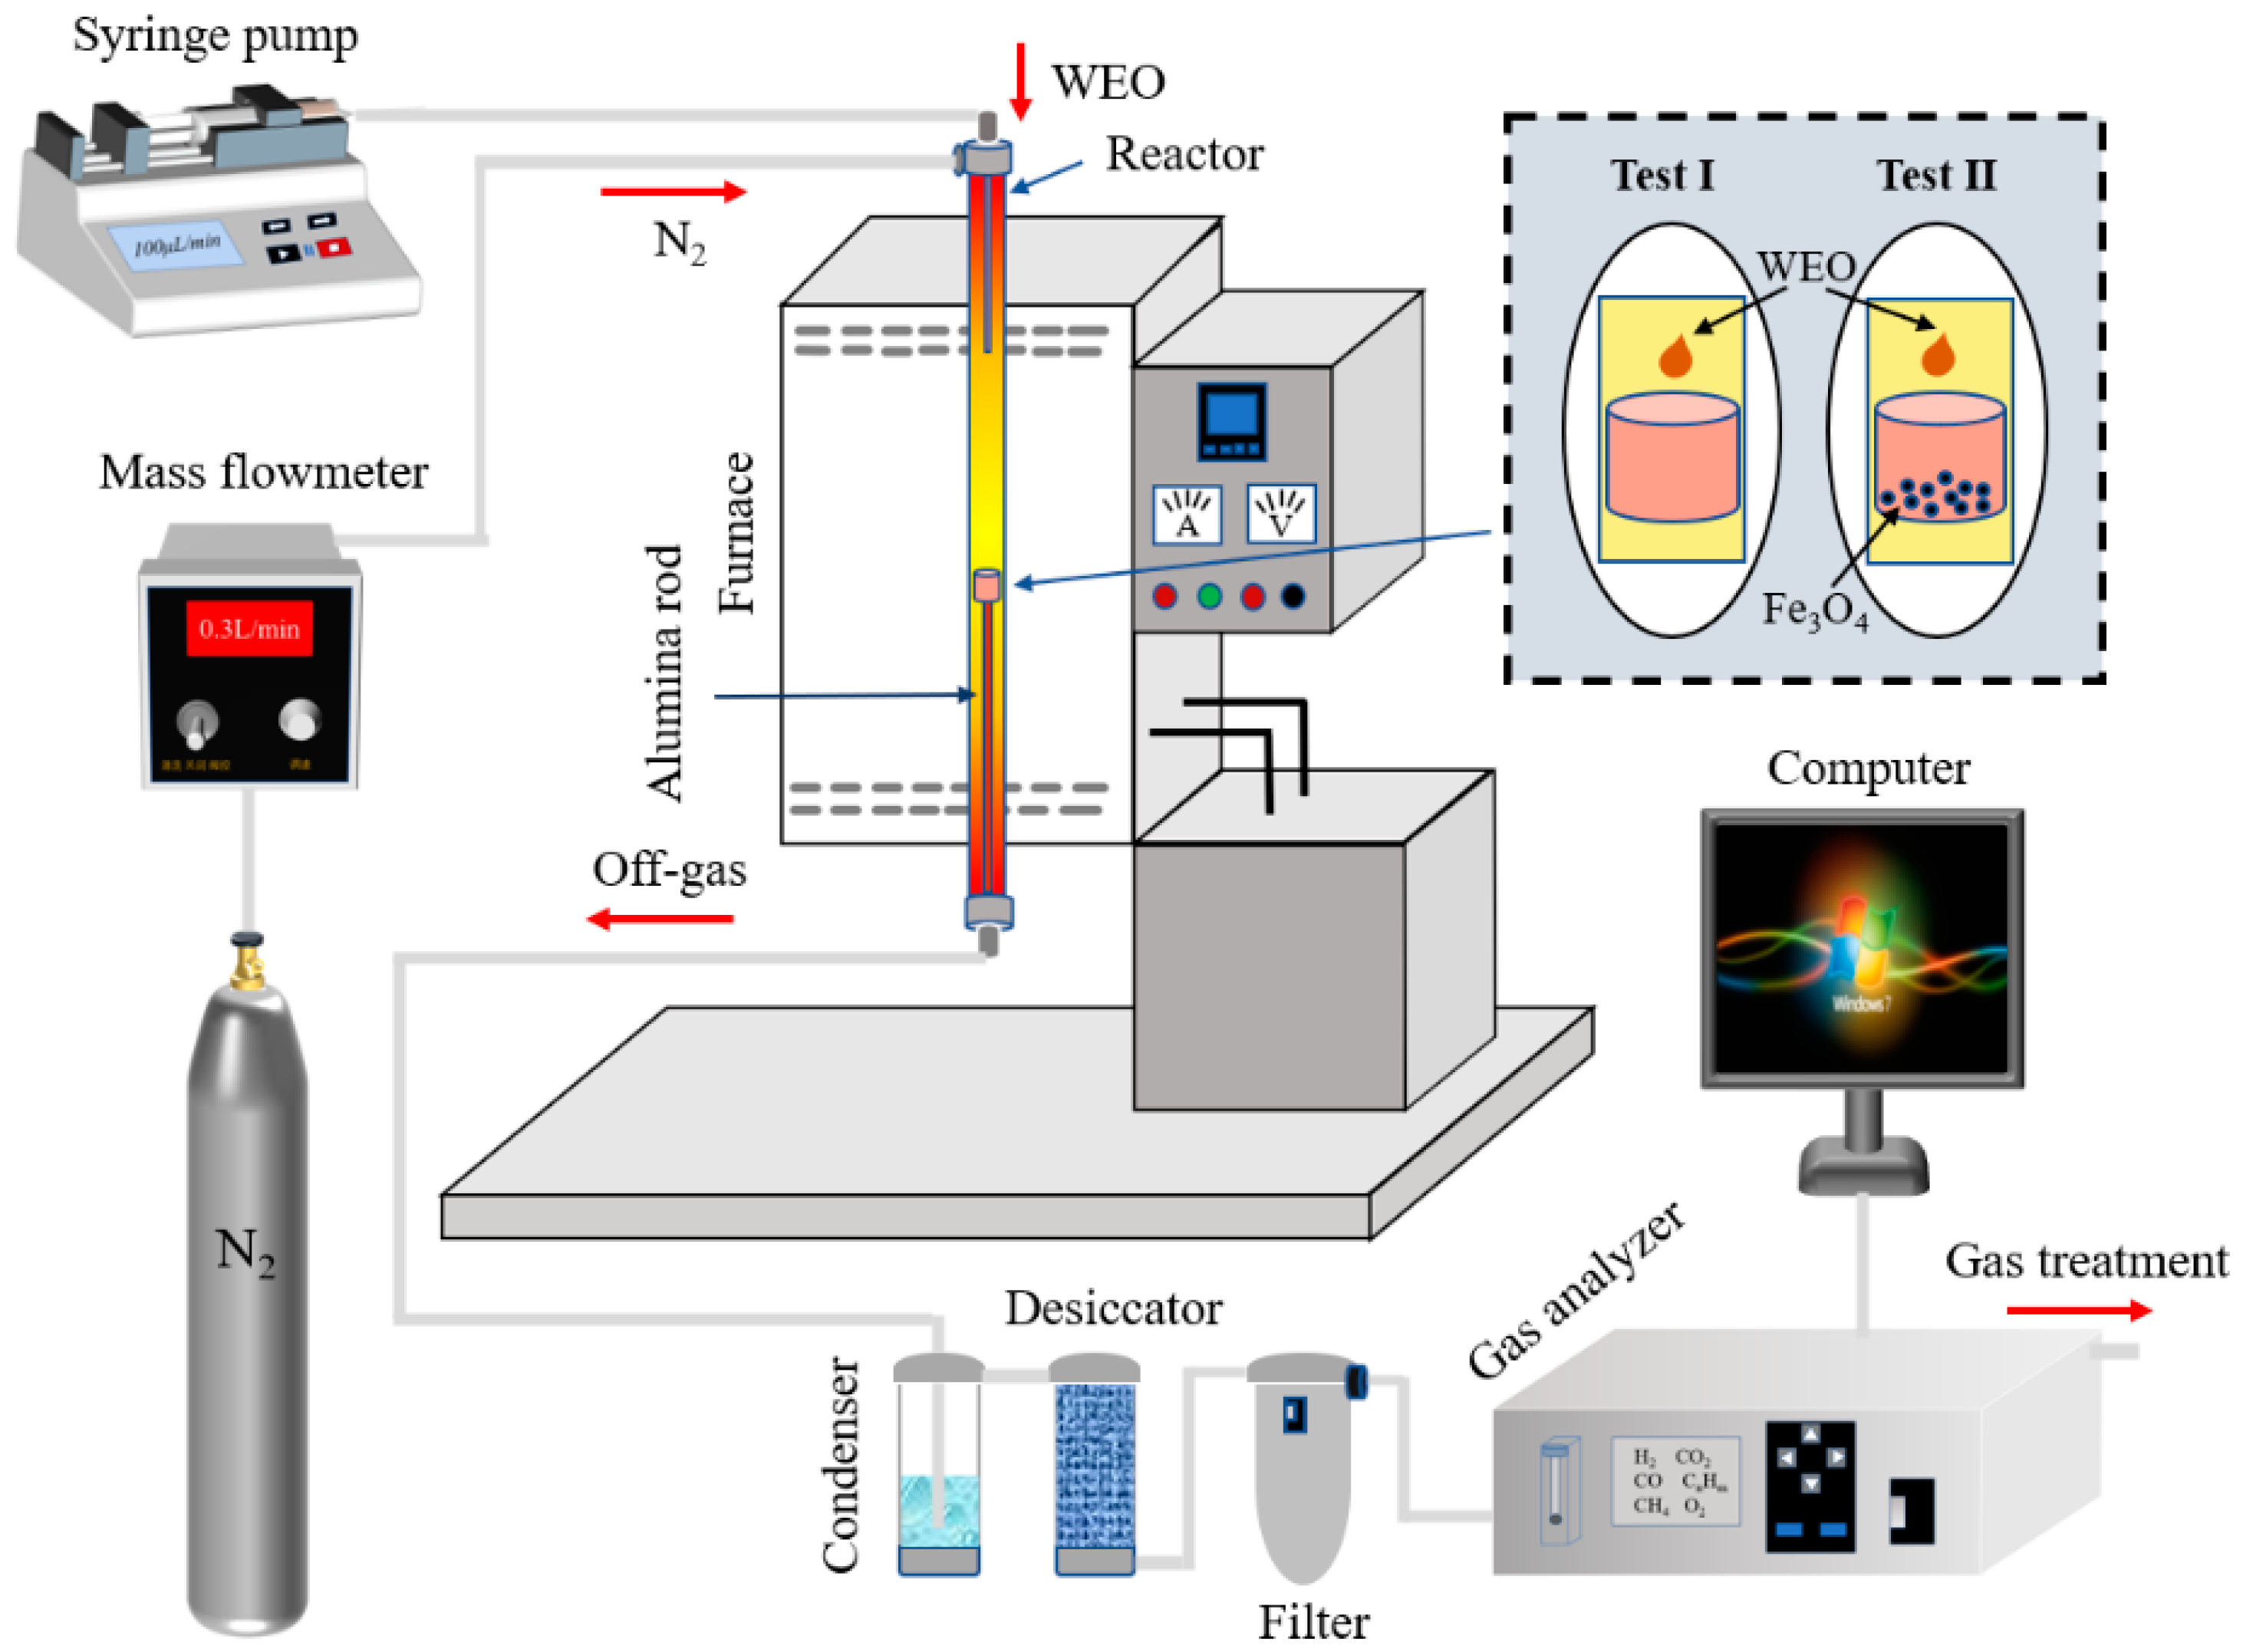
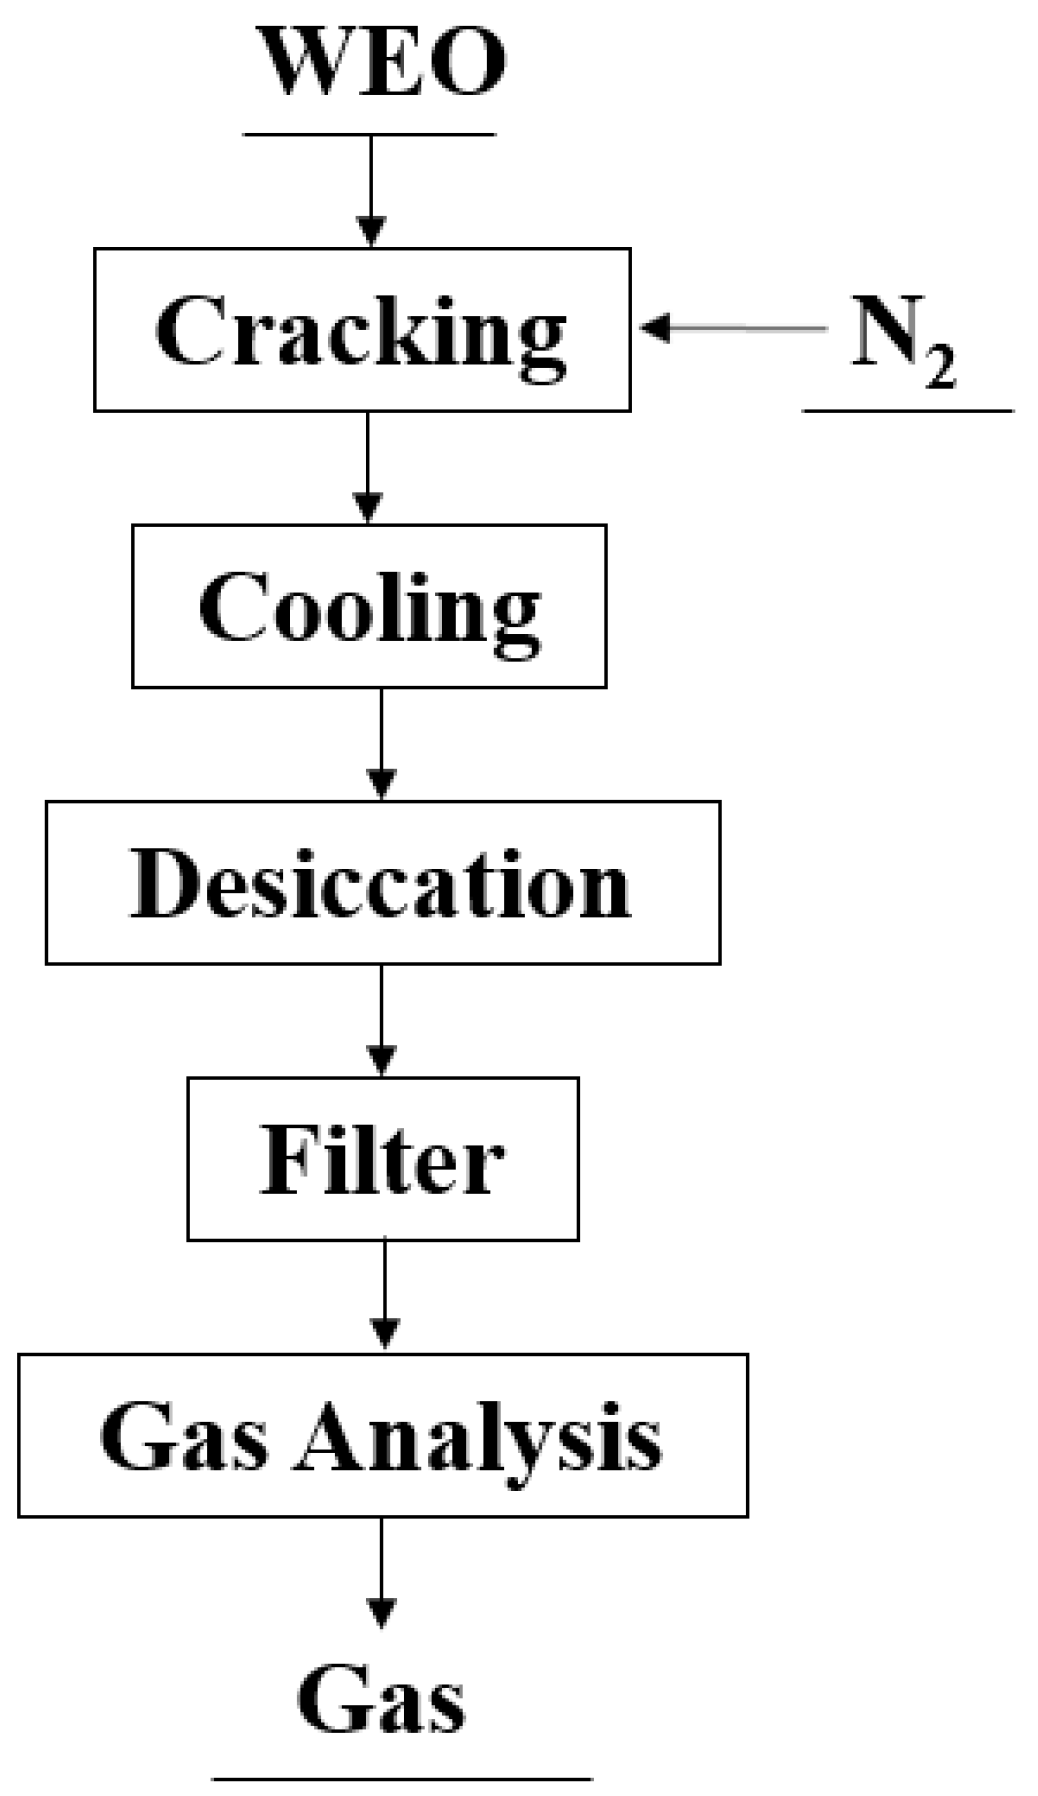
2.2.2. Thermal Cracking of WEO

Thermal cracking experiments of WEO were performed in the apparatus, as shown in Figure 1. The device is mainly composed of a fuel injection device, WEO cracking device, cooling device, drying device, and dust removal device. The working flow chart is shown in Figure 2. The reaction is carried out in a vertical tube furnace, where a crucible is placed in the constant temperature zone and supported by a corundum rod at the bottom of the crucible. N2 was used as the protective gas and the carrier gas required for the cracking process during the reaction; the flow rate of N2 was controlled by a mass flow meter at 300 mL/min. The tube furnace is heated to the desired temperature at a heating rate of 10 °C/min, and the oil cracking started 5 min later. The oil feed rate and oil feed time are precisely controlled by the syringe pump, and the flow rate of oil is 100 μL/min and the oil feed time is 7 min. The WEO is preheated before feeding, and the oil is placed in an oven with a constant temperature of 50 °C for 40 min to improve the fluidity of the oil. The gas produced by cracking is discharged from the reactor with the carrier gas, and after passing through the cooling, drying, and dust removal devices, it is passed to the online gas analyzer for qualitative and quantitative analysis of the gas composition and the analysis results are entered by the computer.
The experiments of thermal cracking of WEO were conducted in two groups, which were recorded as test one and test two. In test one, WEO was injected into an empty corundum crucible when the target temperature was reached. In test II, 1.5 g of Fe3O4 powder was placed in the corundum crucible and heated to the target temperature with the furnace, and then injected with WEO. Test one was used as a control experiment to better elucidate the effect of Fe3O4 on the cracking of WEO. When the gas analyzer showed that the fraction of cracked gas was zero, the experiment ended, and the gas analyzer and other related instrumentation were turned off. The Fe3O4 was allowed to cool with the furnace, and when the high-temperature tube furnace cooled to room temperature, the Fe3O4 sample was removed for analysis.
The instantaneous volume fractions of H2, CH4, CO, CO2, and CnHm in the gas mixture are detected using an online gas analyzer. The instantaneous volume fraction of N2 can be calculated by Equation (1).
X N 2 t = 100 % X H 2 t X CH 4 t X CO t X CO 2 t X C n H m t
The formula X i t is the instantaneous volume fraction of the gas species (i: H2, CH4, CO, CO2, CnHm).
Then, the instantaneous total gas flow is calculated according to Equation (2).
Q ( t ) = 300   mL / min X N 2 t
Therefore, the total content of each gas in the cracking process can be calculated according to Equation (3).
Y i = 0 t Q ( t ) Z i t d t
Yi is the total flow through the gas analyzer at the time; Z i t is the volume fraction of each gas at the time; i is the gas component type (i: H2, CH4, CO, CO2, CnHm).

2.2.3. Instruments

The cracking experiments were carried out in a vertical tube furnace (Model: STGL-40-17) with a temperature accuracy maintained at ±1 °C and a maximum rated temperature of 1700 °C, which can ensure the smooth conduct of the experiments. The thermogravimetric experiments were done via NETZSCH STA 449F3 simultaneous thermal analyzer. Infrared spectroscopy of waste motor oil pyrolysis was carried out with a Fourier transform infrared spectrometer. TYD01 series laboratory syringe pumps were used to ensure continuous and uniform injection of WEO. The Gas board-3100 online gas analyzer allows qualitative and quantitative analysis of the gas composition generated by cracking. The content of elements in WEO was determined using a PERKIN PE2400 Series II Elemental Analyzer. The physical phases of the samples were analyzed using an X-ray diffractometer of type Xpert 3 powder. The tungsten filament scanning electron microscope was used to observe and analyze the microstructure of the samples.

3. Results and Discussion

3.1. Thermal Cracking of WEO

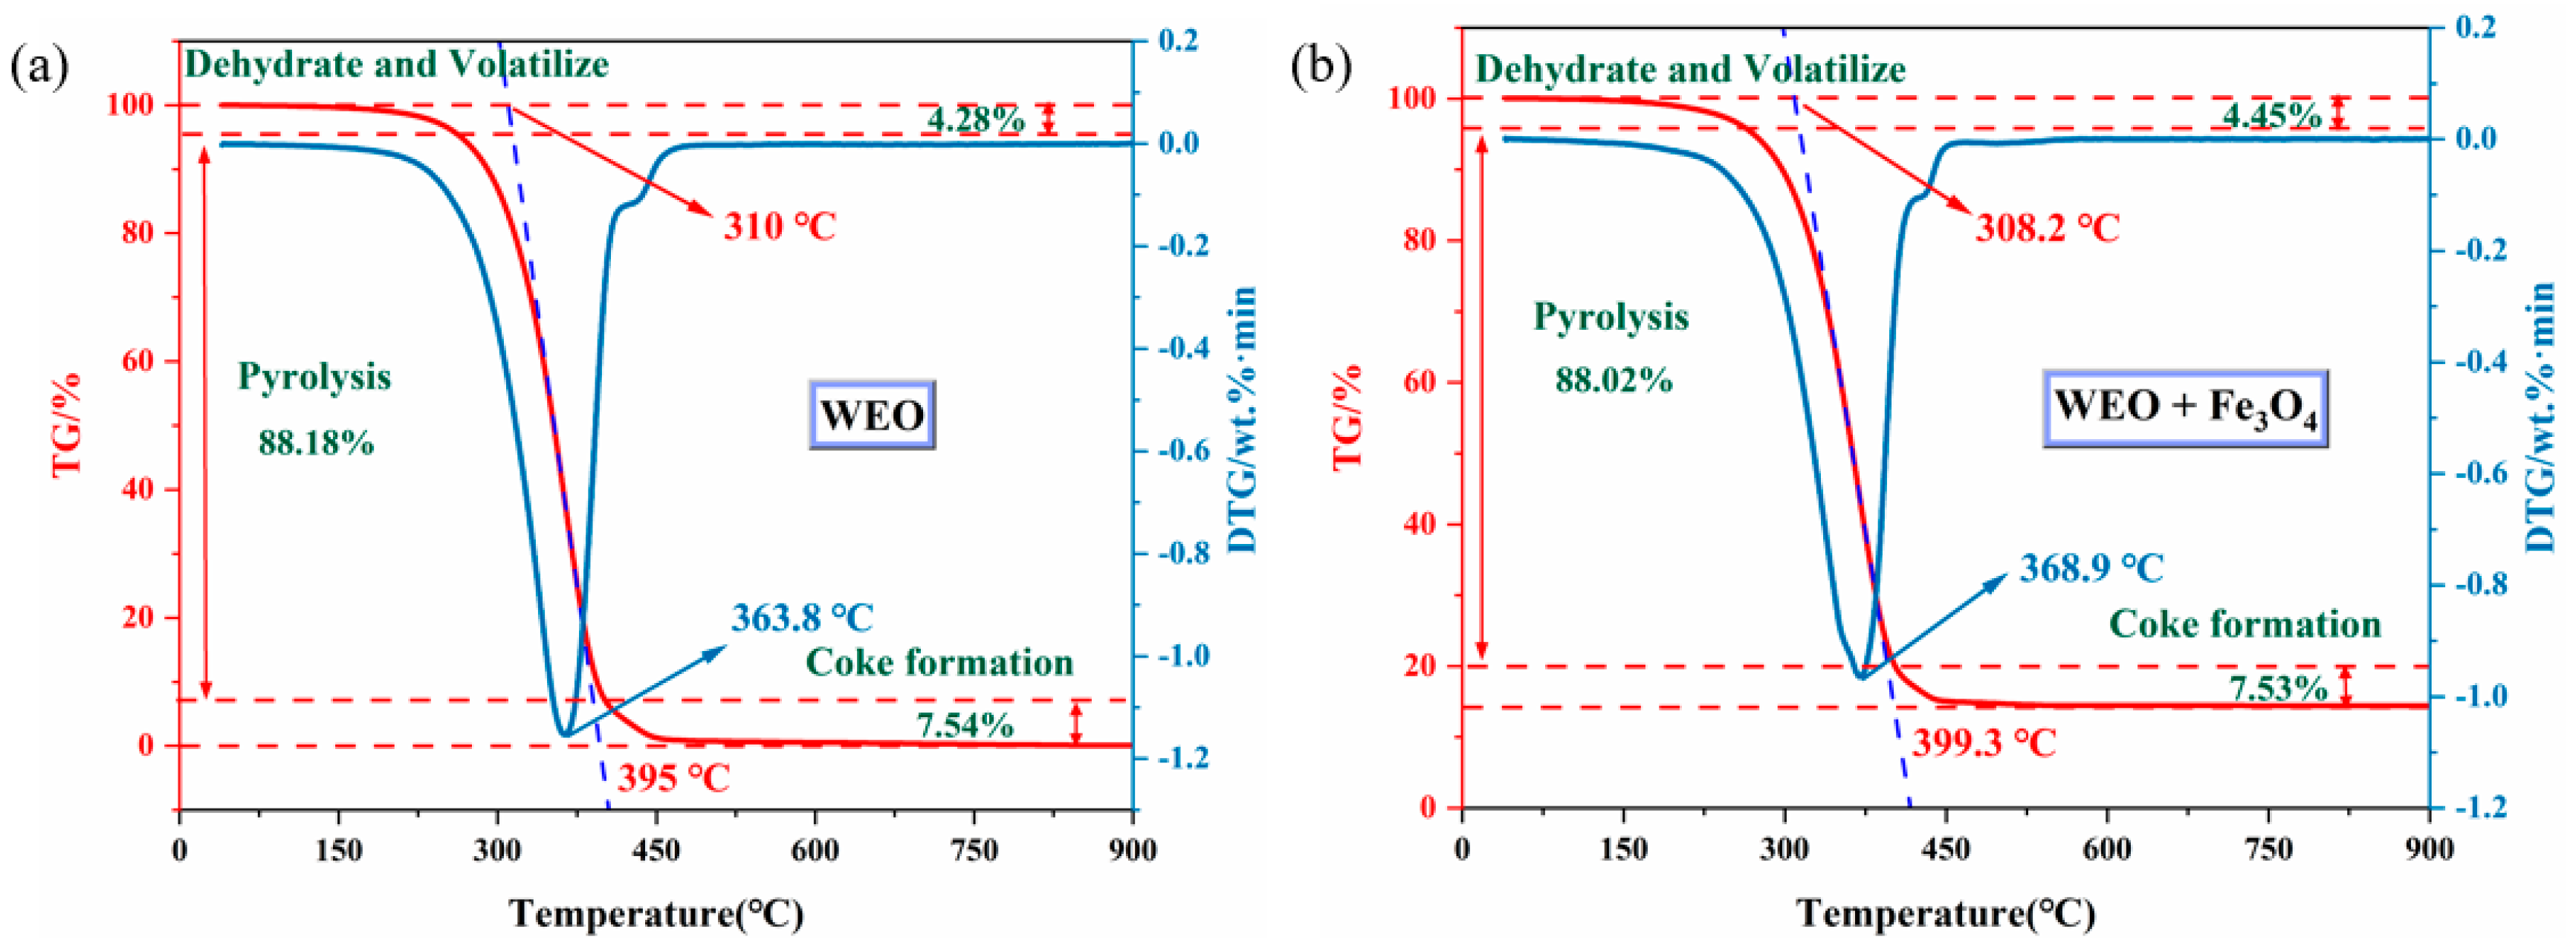
3.1.1. Thermogravimetric Analysis of WEO Pyrolysis

Thermogravimetric analysis was performed on the WEO, and the TG-DTG curves of the WEO and the mixture of WEO and Fe3O4 are shown in Figure 3. As can be seen from the figure, the TG-DTG curves of Figure 3a,b are basically similar. The TG curve can be divided into three stages. The first stage (40 °C to 260 °C) mainly comes from the mass loss of low boiling point molecules and volatile components. The mass loss rate is about 4.28%. The second stage (260~400 °C) consists mainly of the cleavage and volatilization of some macromolecular components. The mass loss rate is about 88.18%. The third stage (400~900 °C) is mainly from carbon precipitation reactions.

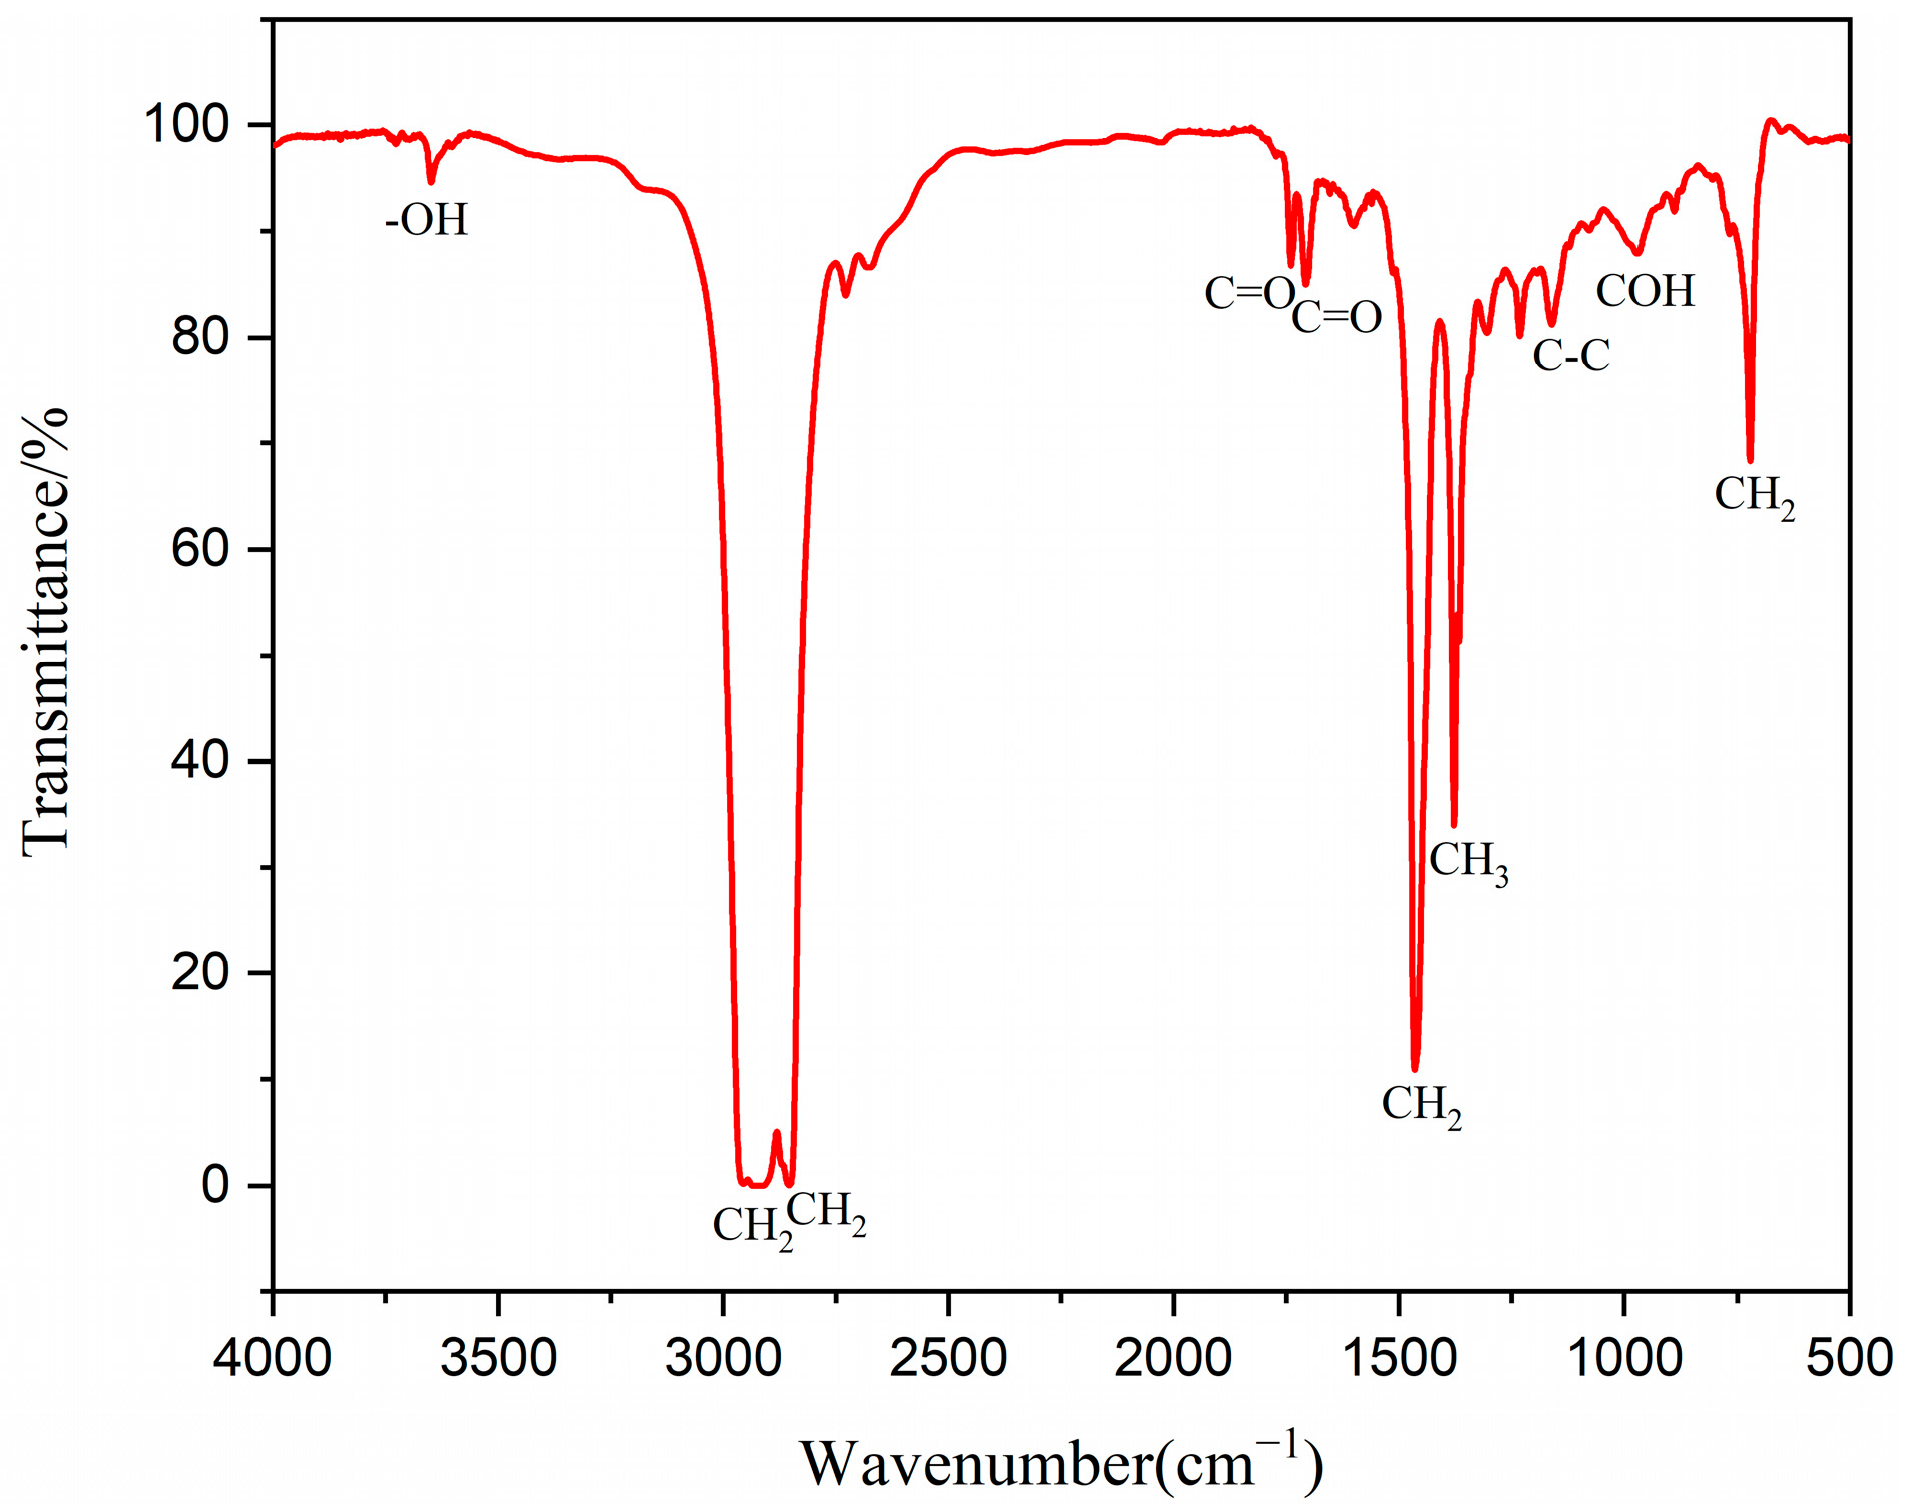
3.1.2. FTIR Analysis

The results of the infrared spectral analysis of WEO are shown in Figure 4, and compared with other oils, WEO showed significant differences in each absorption band [22], mainly in terms of intensity. Wave numbers at 3649 cm−1 can be attributed to O–H bond stretching vibrations, indicating the presence of substances such as ethanol, carboxylic acids, phenols, or water in the sample [23]. As the WEO composition analysis shows, the WEO contains about 0.42 wt.% moisture, consistent with the analytical results of other biomass oil samples. Two stronger spectral bands are observed for wave numbers located at 2924 cm−1 and 2853 cm−1, corresponding to the asymmetric and symmetric stretching motion of CH2, respectively. This means that the WEO contains saturated alkanes. The wave numbers are located in the 1740 cm−1 and 1707 cm−1 spectral bands, which are C=O stretching vibrations and should be caused by ketones, carboxylic acids, aldehydes, or esters. The wave number is 1464 cm−1 for CH2 variable-angle motion or CH3 asymmetric variable-angle vibration. When the wave number is located at 1377 cm−1, it is the bending vibration of CH3. When the wave numbers are 1160, 971, and 721 cm−1, the presented spectral bands correspond to the asymmetric stretching vibration of the C–C bond, the COH out-of-plane bending vibration, and the CH2 in-plane wobble, respectively. It shows that WEO contains a variety of fatty acids. The diversity of functional groups indicates the complex nature of the chemical composition of WEO; however, as the temperature increases, all of the above organic functional groups gradually weaken and disappear, followed by the formation of small molecules.

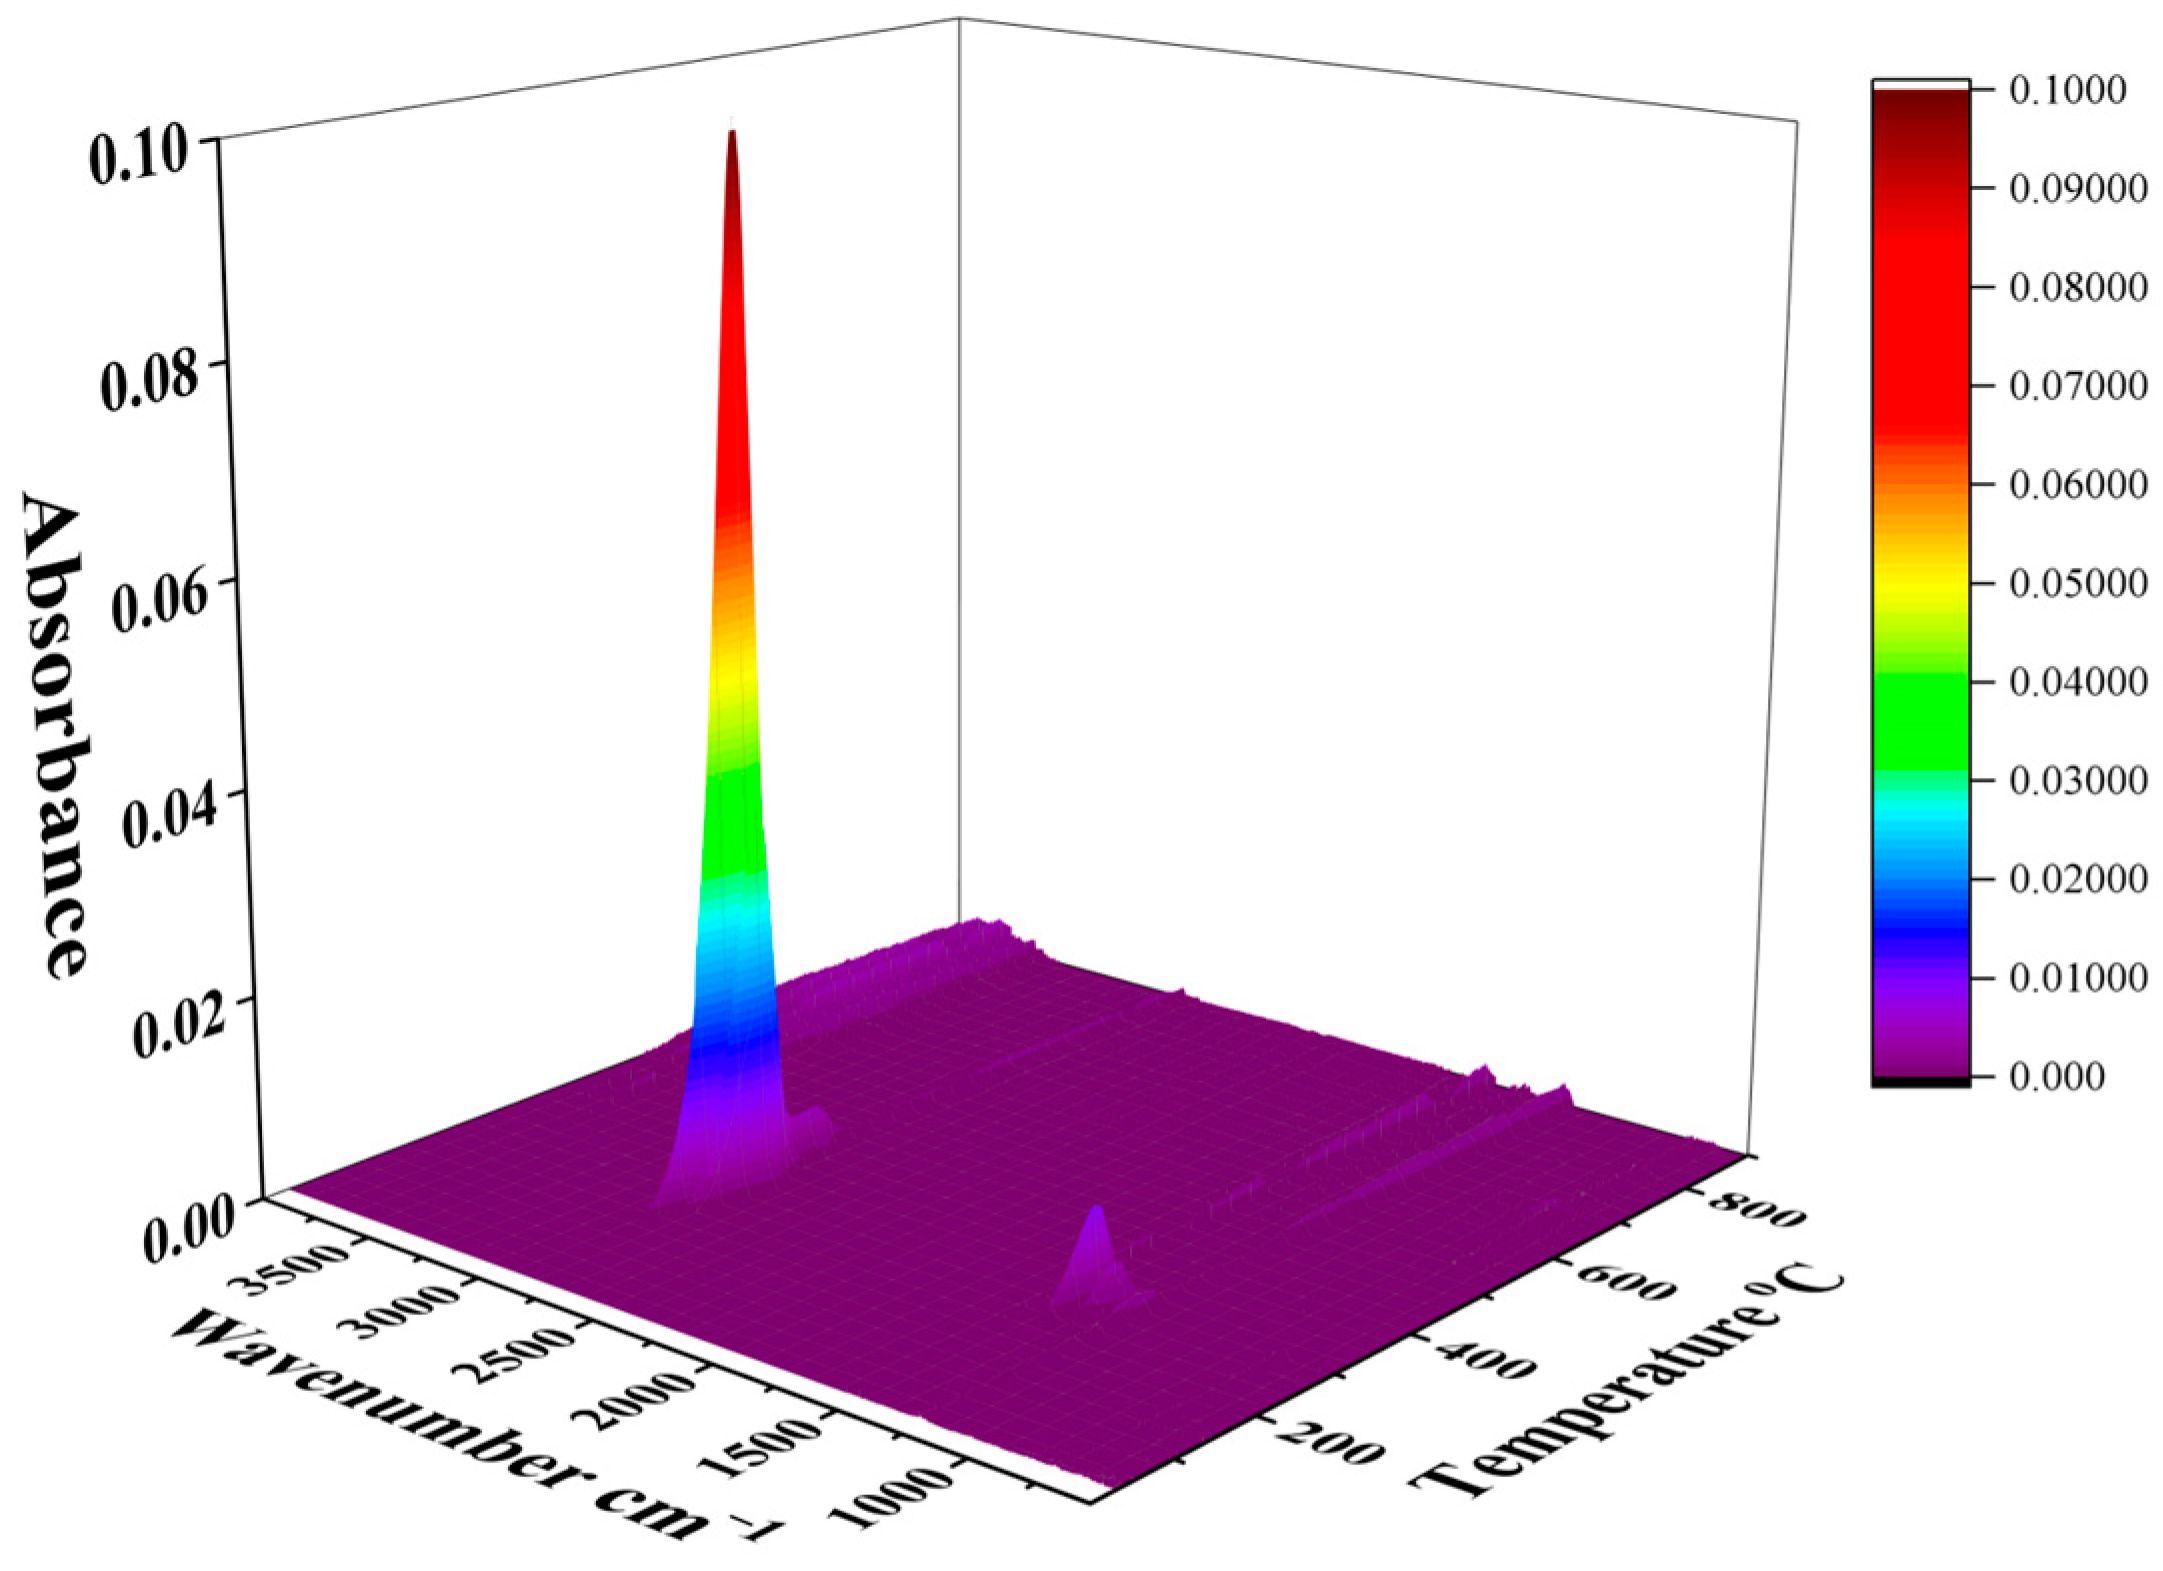
3.1.3. Infrared Spectroscopic Analysis of WEO Pyrolysis

The infrared spectrum of WEO is shown in Figure 5, from which the gaseous products and the main functional groups can be obtained. The absorption peak in the range of 3950–3500 cm−1 is the H2O vibration peak. Two absorption peaks appeared at the wavelengths of 2930 cm−1 and 2860 cm−1, representing the asymmetric expansion vibration of CH2 and the symmetric stretching vibration of CH2, respectively, and indicating the growth of long-chain alkanes during the pyrolysis of WEO. CH4 in alkanes occurs mainly due to the cleavage of aromatic side chains in waste engine oils, the cleavage of C–C bonds of oxygenated compounds in the cleavage intermediates, and the decomposition of long-chain hydrocarbons.

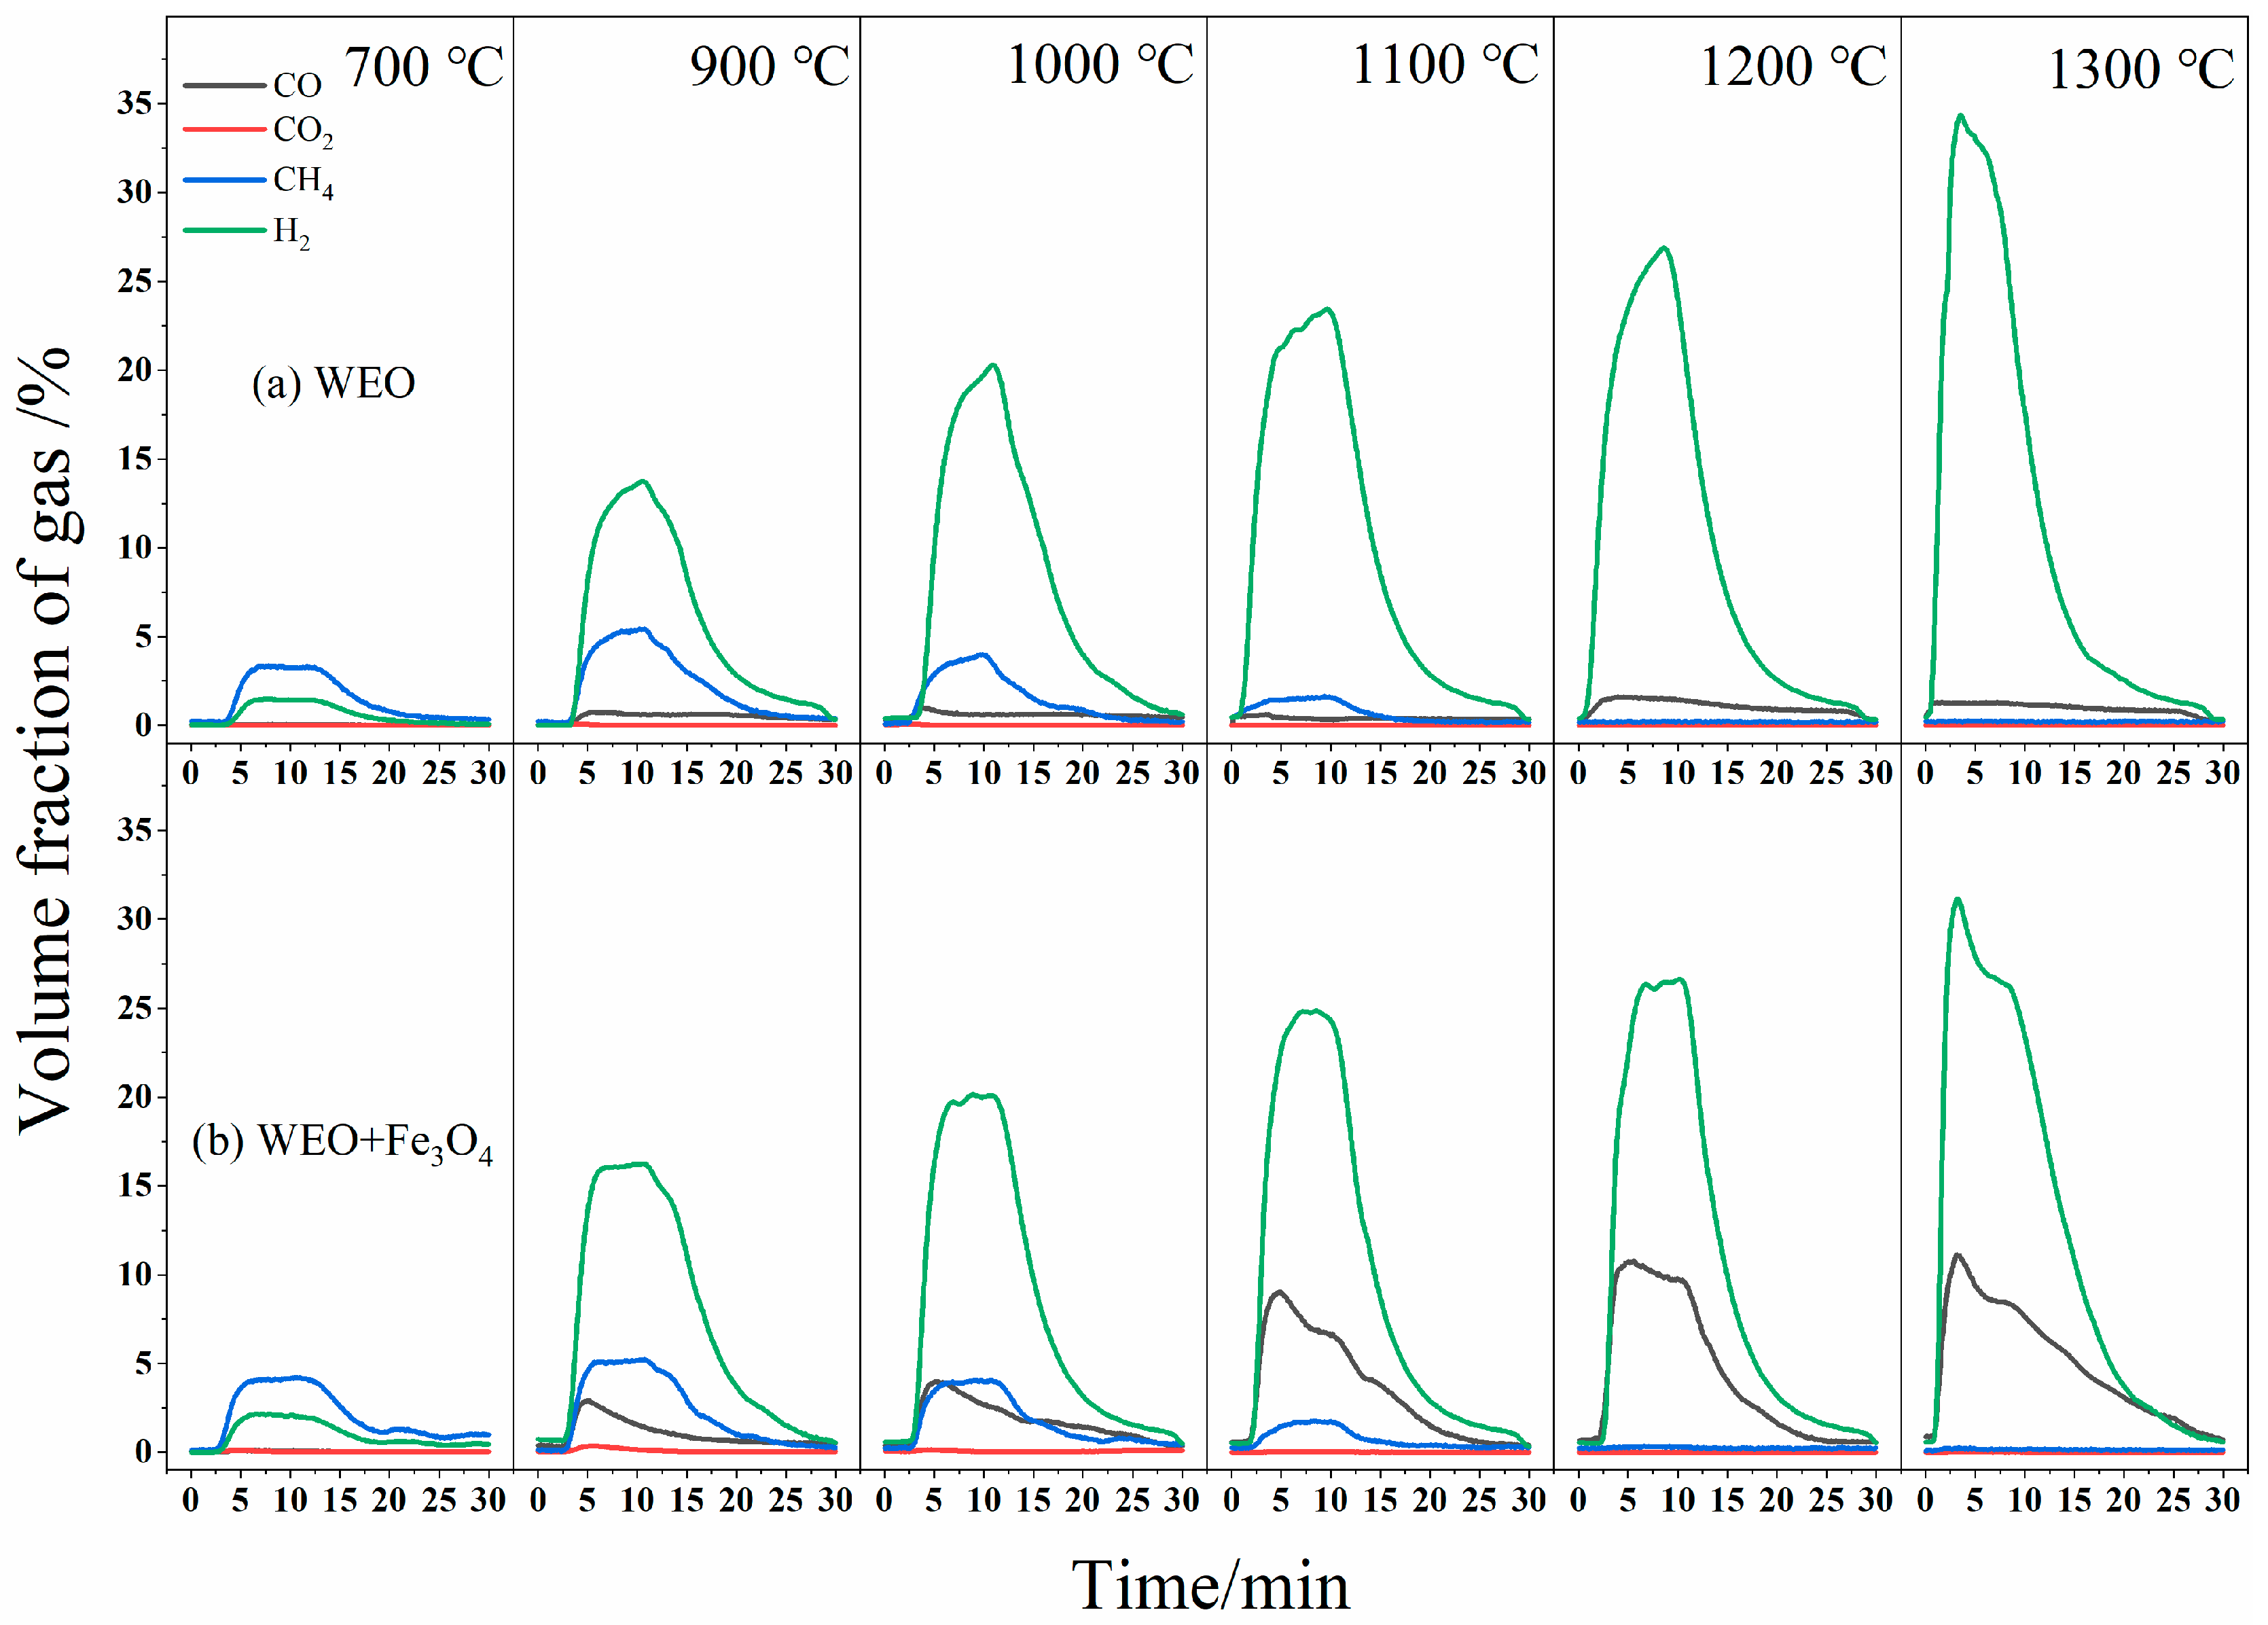
3.2. Thermal Cracking Characteristics of WEO
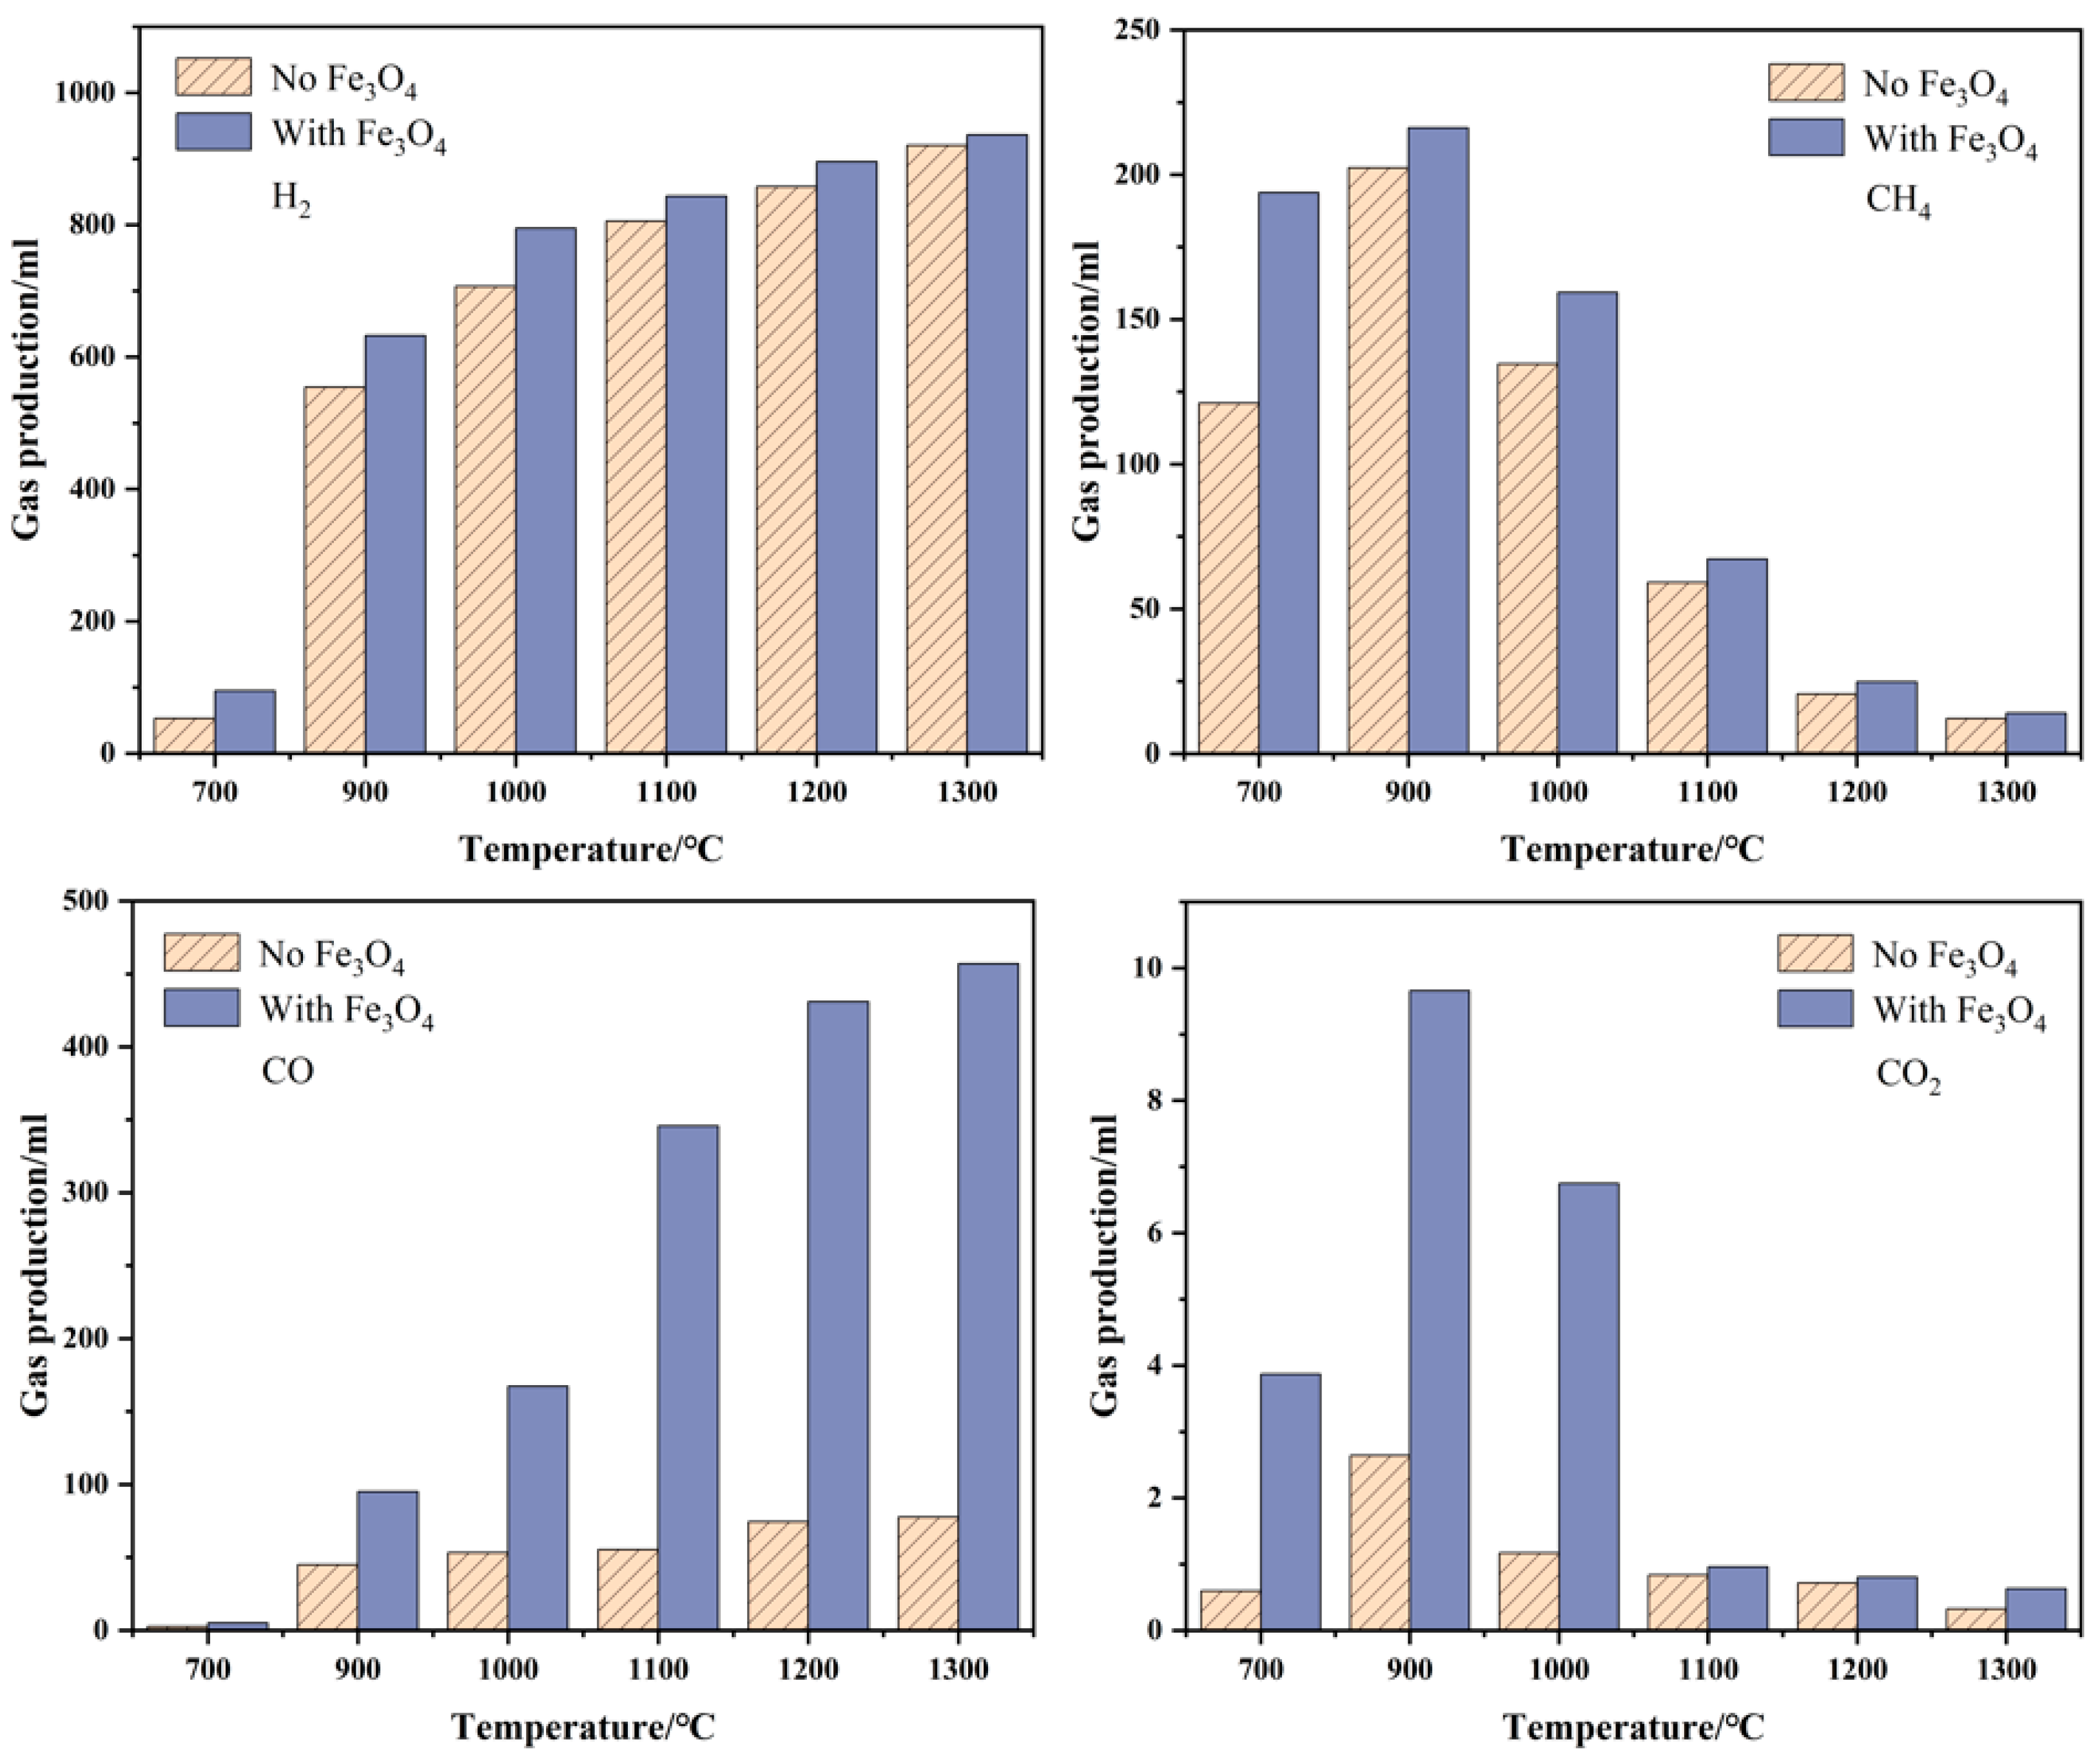
In order to study the law of direct cracking of WEO, a series of experiments of thermal cracking at different temperatures were conducted, and the cracking temperatures were controlled at 700 °C, 900 °C, 1000 °C, 1100 °C, 1200 °C, and 1300 °C, respectively. The reaction mechanism of WEO cracking is shown in Figure 6.
The variation pattern of cracking gas volume fraction with oil feed time at each temperature and in the presence of Fe3O4 is shown in Figure 7. The oil feeding time is controlled at 7 min; the whole oil-feeding process has continuity, and the concentration of product gas in the furnace increases with the continuous feeding of WEO in the early stage of cracking, corresponding to the increasing trend of the volume fraction of each component. The WEO feed ends, and the whole process enters a later stage when the concentration of the gas in the furnace starts to decrease, the volume fraction of each component corresponding to it decreases and is discharged with the carrier gas.
Figure 7 shows the specific variation characteristics of cracking gas volume fraction with WEO injection time for each temperature. It can be seen that the time corresponding to the peak of each gas volume fraction at increasing temperature shifts forward, a phenomenon that indicates that high temperature accelerates the cracking rate of WEO. The figure shows that the volume fraction of H2 in the cracking gas increases significantly at the peak when the temperature increases; CO has the same trend of change as H2, while CH4 and CO2 show a trend of first increasing and then decreasing.

3.2.1. Hydrogen

The mass fraction of hydrogen in WEO is only 13.88%, and hydrogen, as the lightest element in nature, will undoubtedly account for the largest volume in the resulting gas mixture if it is completely transformed into H2 when cracked at high temperature. Gas production of WEO at different pyrolysis temperatures is shown in Figure 8. At 700 °C, the instantaneous volume fraction of hydrogen is low, and the total amount of H2 produced from 700 μL of WEO is about 52.74 mL during the whole process. The increase in temperature intensifies the cleavage of each oil molecule and the subsequent significant increase in H2 production. The yield of H2 rose from 52.74 mL to 554.4 mL when the temperature was increased to 900 °C; the yield of H2 increased to 920.05 mL when the temperature was raised to 1300 °C. The total H2 produced by cracking 700 μL of WEO at 1300 °C was calculated to be 91.08% of the total gas mixture. In the cracking process of WEO, in addition to the direct generation of H2 from the cracking of organic macromolecules, H2 can be generated from the secondary cracking of methane and the conversion reaction of water and gas in the system, as shown in Equation (4).
C + H 2 O H 2 + CO                             Δ r G m θ = 135129 142.47 T   ( J / mol )
The hydrogen yield in the presence of Fe3O4 is higher than the amount of hydrogen produced by direct cracking of WEO. The increase in temperature favored the increase in H2 yield, which increased from 94.45 mL to 936.45 mL when the temperature was increased from 700 °C to 1300 °C. Fe3O4 has two roles in the WEO cracking system: one as a catalyst to catalyze the cracking of WEO to transform it into small molecule gas, mainly at the low-temperature stage; the other as an oxidizer to consume part of the reducing products. In addition to the partial consumption of H2 by reducing Fe3O4, H2 can be produced by both the secondary cracking of methane and the water–gas conversion reaction.

3.2.2. Methane

CH4 is one of the main products generated from the cracking of WEO, and its change trend shows an increase followed by a decrease. According to the relevant literature, methane is produced from the breakage of the side chain of the benzene ring [24]. At 700 °C, the CH4 gas yield was greater than the H2, CO, and CO2 yields, specifically 121.14 mL. As the temperature increased to 900 °C, the CH4 production increased and reached a maximum value of about 202.44 mL. The total CH4 produced by cracking 700 μL of WEO at 900 °C was calculated to be 25.2% of the total gas mixture. As the cracking temperature continued to increase, the methane yield began to decrease, and when the temperature was 1300 °C, the yield decreased to 12.18 mL. Methane has secondary cracking characteristics. When the temperature is lower than 1000 °C, the total amount of methane produced by the cracking of WEO is greater than the amount of methane produced by its secondary cracking, resulting in an increase in methane production. When the temperature rises above 900 °C, the rate of methane’s cracking accelerates, and the resulting consumption is greater than the amount of CH4 produced by the cracking of WEO, indicating that high temperatures (>900 °C) are not conducive to the production of methane gas. The methane cracking can be expressed by Equation (5).
CH 4 C + 2 H 2       Δ r G m θ = 85457 109.5 T   ( J / mol )
In the presence of Fe3O4, the methane yield reached a maximum value of about 216.24 mL at 900 °C and decreased with the increase in temperature. When the temperature was increased to 1300 °C, the methane yield was only 14.04 mL. The methane yield in the presence of Fe3O4 is slightly greater than that of direct cracking of WEO. Methane is reductive at high temperatures and participates in the reduction of Fe3O4, consuming some of the methane [25]. However, Fe3O4 promotes the cracking of WEO and produces more methane gas.

3.2.3. Carbon Monoxide and Carbon Dioxide

The production of CO and CO2 mainly originates from the decarbonylation or decarboxylation during the cleavage of organic molecules [26]. From Figure 8, it can be seen that CO production showed an increasing trend with increasing temperature, and CO2 production showed a trend of first increasing and then decreasing with increasing temperature. The temperature was increased from 700 °C to 1300 °C, and the CO yield increased from 2.6 mL to 77.64 mL. The CO2 yield reaches its maximum at 900 °C with about 2.64 mL. The increase in temperature intensifies the thermal cleavage of organic molecules, thus increasing the yield of small molecule gases. The presence of other components in the cracking system, such as C or H2O, will cause the CO and CO2 gases in the reactor to undergo conversion again. The carbon monomers generated from the cracking of WEO react with CO2 in the reactor by Boudouard reaction (as shown in Equation (6)), which makes some of the carbon gasify and consume CO2 while increasing the concentration of CO in the reactor. At high temperatures, it is difficult for CO2 to exist stably because it transforms into CO.
C +   CO 2 2 CO                                             Δ r G m θ = 170707 174.47 T     ( J / mol )
Under the action of Fe3O4, the CO yield was only 5.07 mL at 700 °C. At low temperatures, the carbonyl action and decarboxylation reaction were difficult to carry out, resulting in low CO and CO2 yields. After the temperature was increased to 900 °C, the CO production increased linearly, and the CO2 decreased. At 1300 °C, the CO production reached a maximum value of about 456.99 mL, which was an increase of about 379.35 mL compared with the amount of CO produced by direct cracking of WEO. Fe3O4 can provide oxygen ions in the system during the cracking of WEO. The redox reaction occurs when the carbon from the cracking is adsorbed on the surface of Fe3O4 particles. The Boudouard reaction causes the carbon to gasify and the resulting CO to participate in the reduction of iron oxides, while the resulting CO2 gas participates in the carbon gasification reaction again so that the carbon in the system is transformed into CO and CO2, and the iron oxides and reduces.

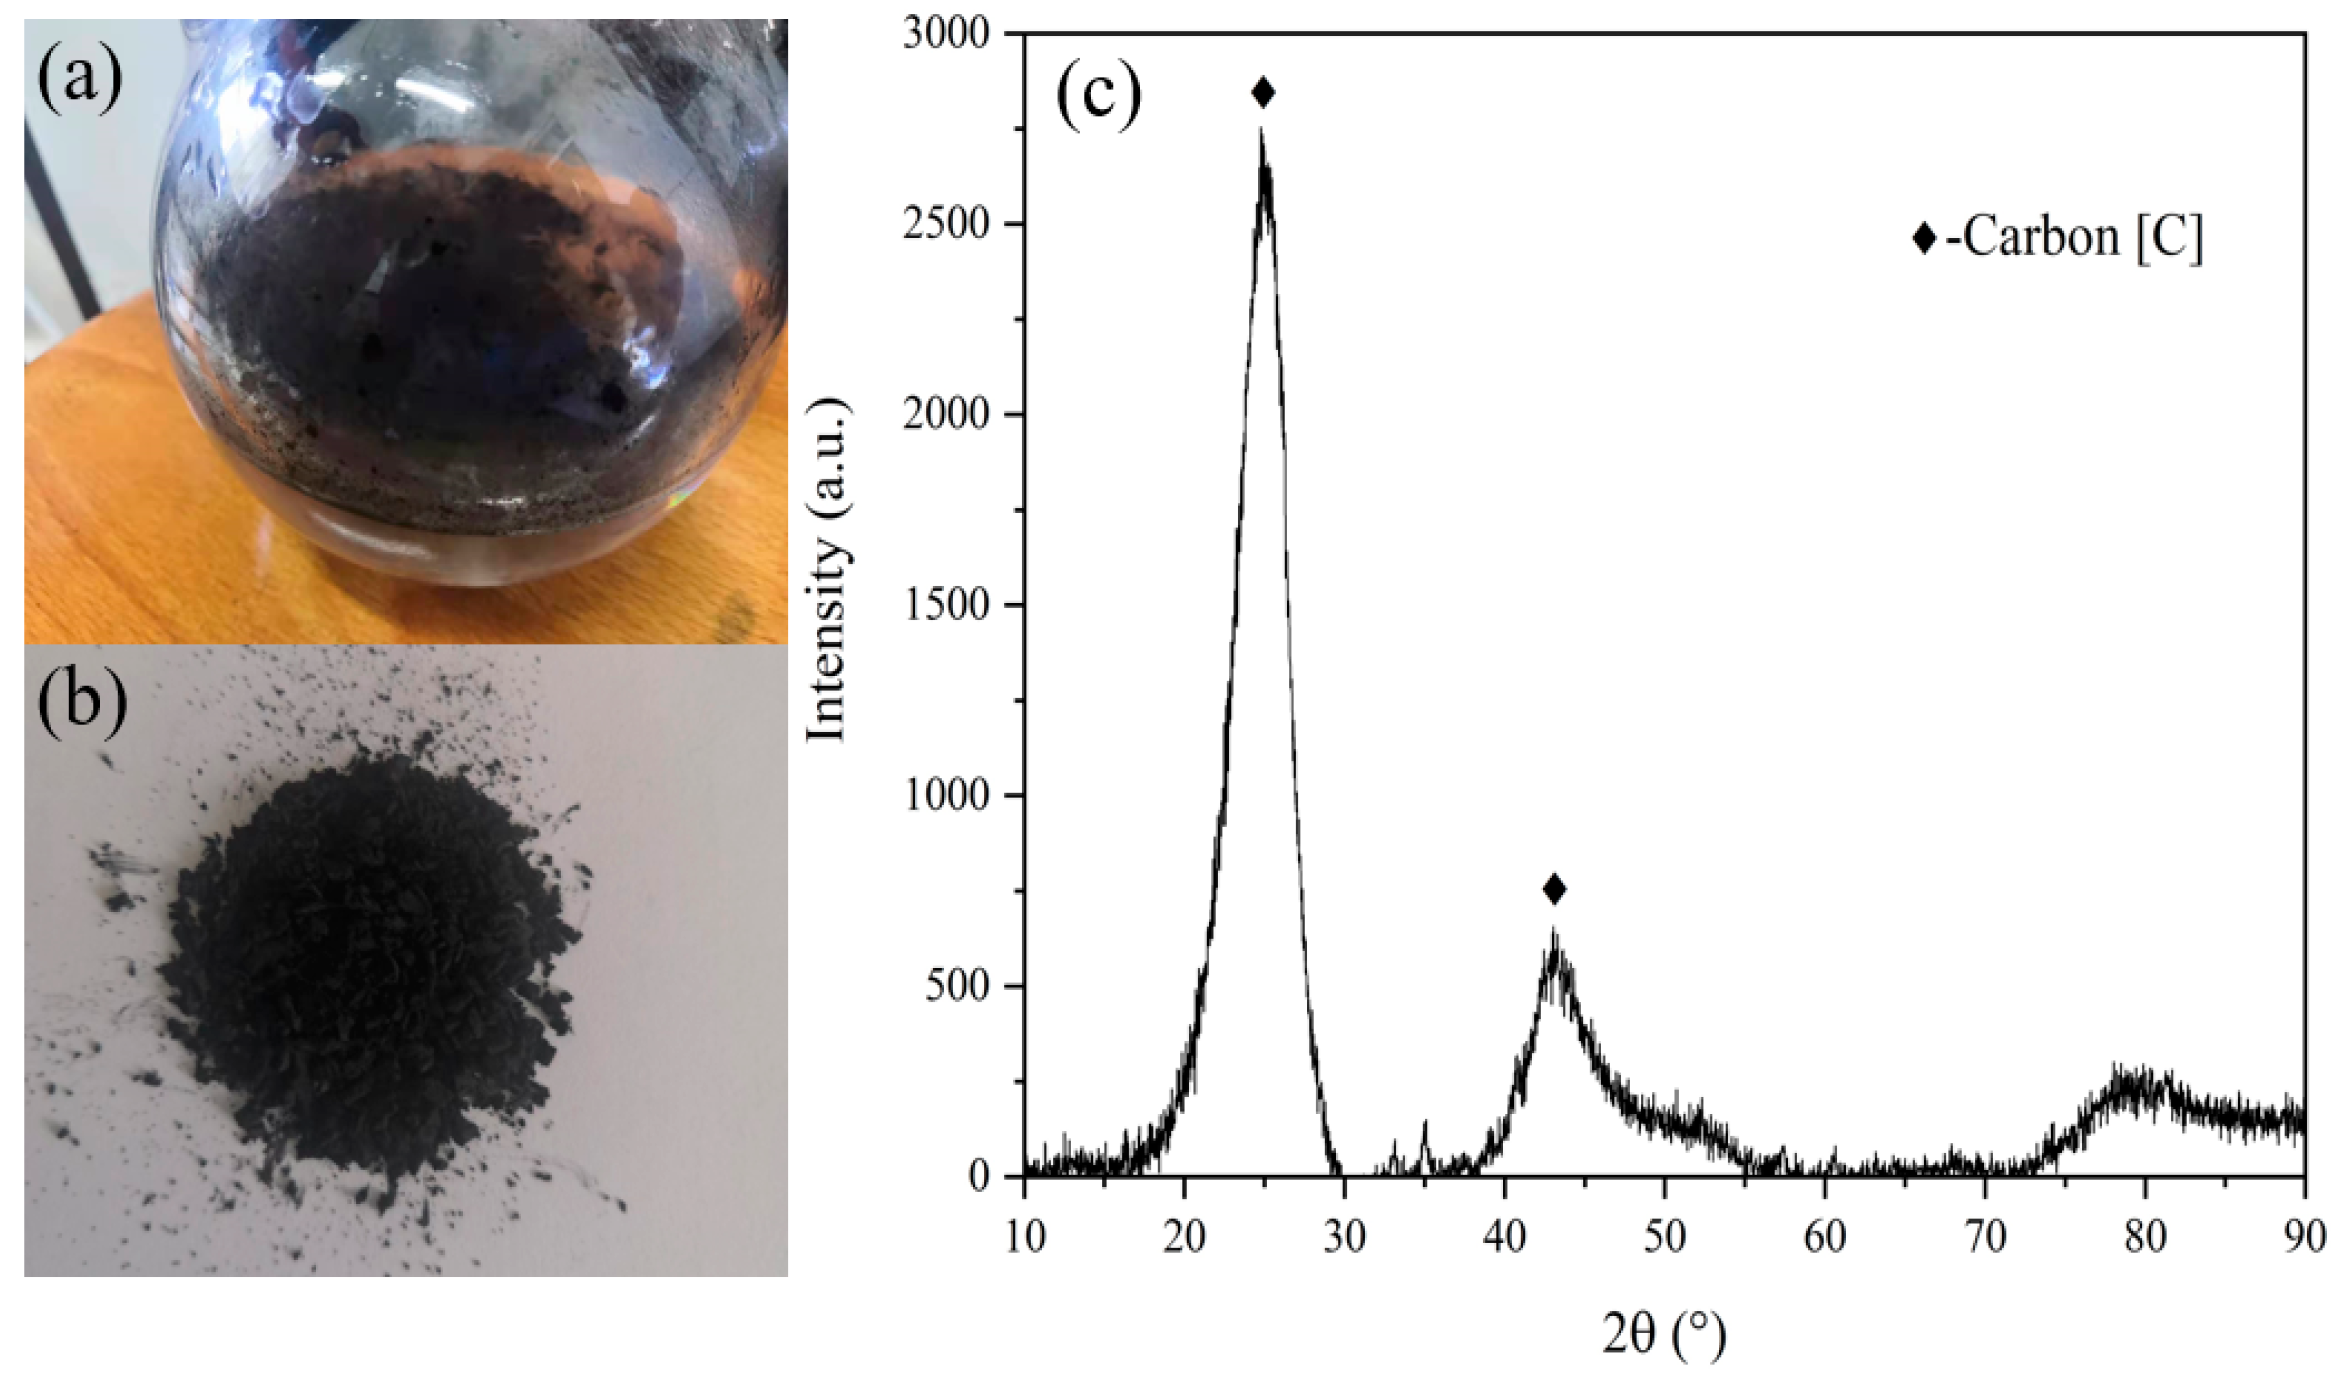
3.2.4. Carbon Deposition

As seen from Table 1, the elemental carbon content of WEO is about 83.52%, and the high-temperature cracking products of WEO, in addition to small molecules of gas, there should be a large amount of singlet carbon generated. Carbon is powder particles, and a large amount of carbon accumulation will cause a carbon accumulation phenomenon. The fine particles of carbon monomers produced by cracking will be partially discharged from the reactor with the carrier gas and into the water cooler, as shown in Figure 9.
The occurrence of carbon buildup was confirmed by collecting and drying the black powder in the water cooler and then performing XRD physical phase analysis.
The carbon monomers produced by cracking are adsorbed on the surface of Fe3O4 particles and subsequently converted to CO and CO2, resulting in a lower rate of carbon accumulation. However, some carbon monomers are still produced and are exited from the furnace with the N2. SEM-EDS analysis of cracking carbon is shown in Figure 10.

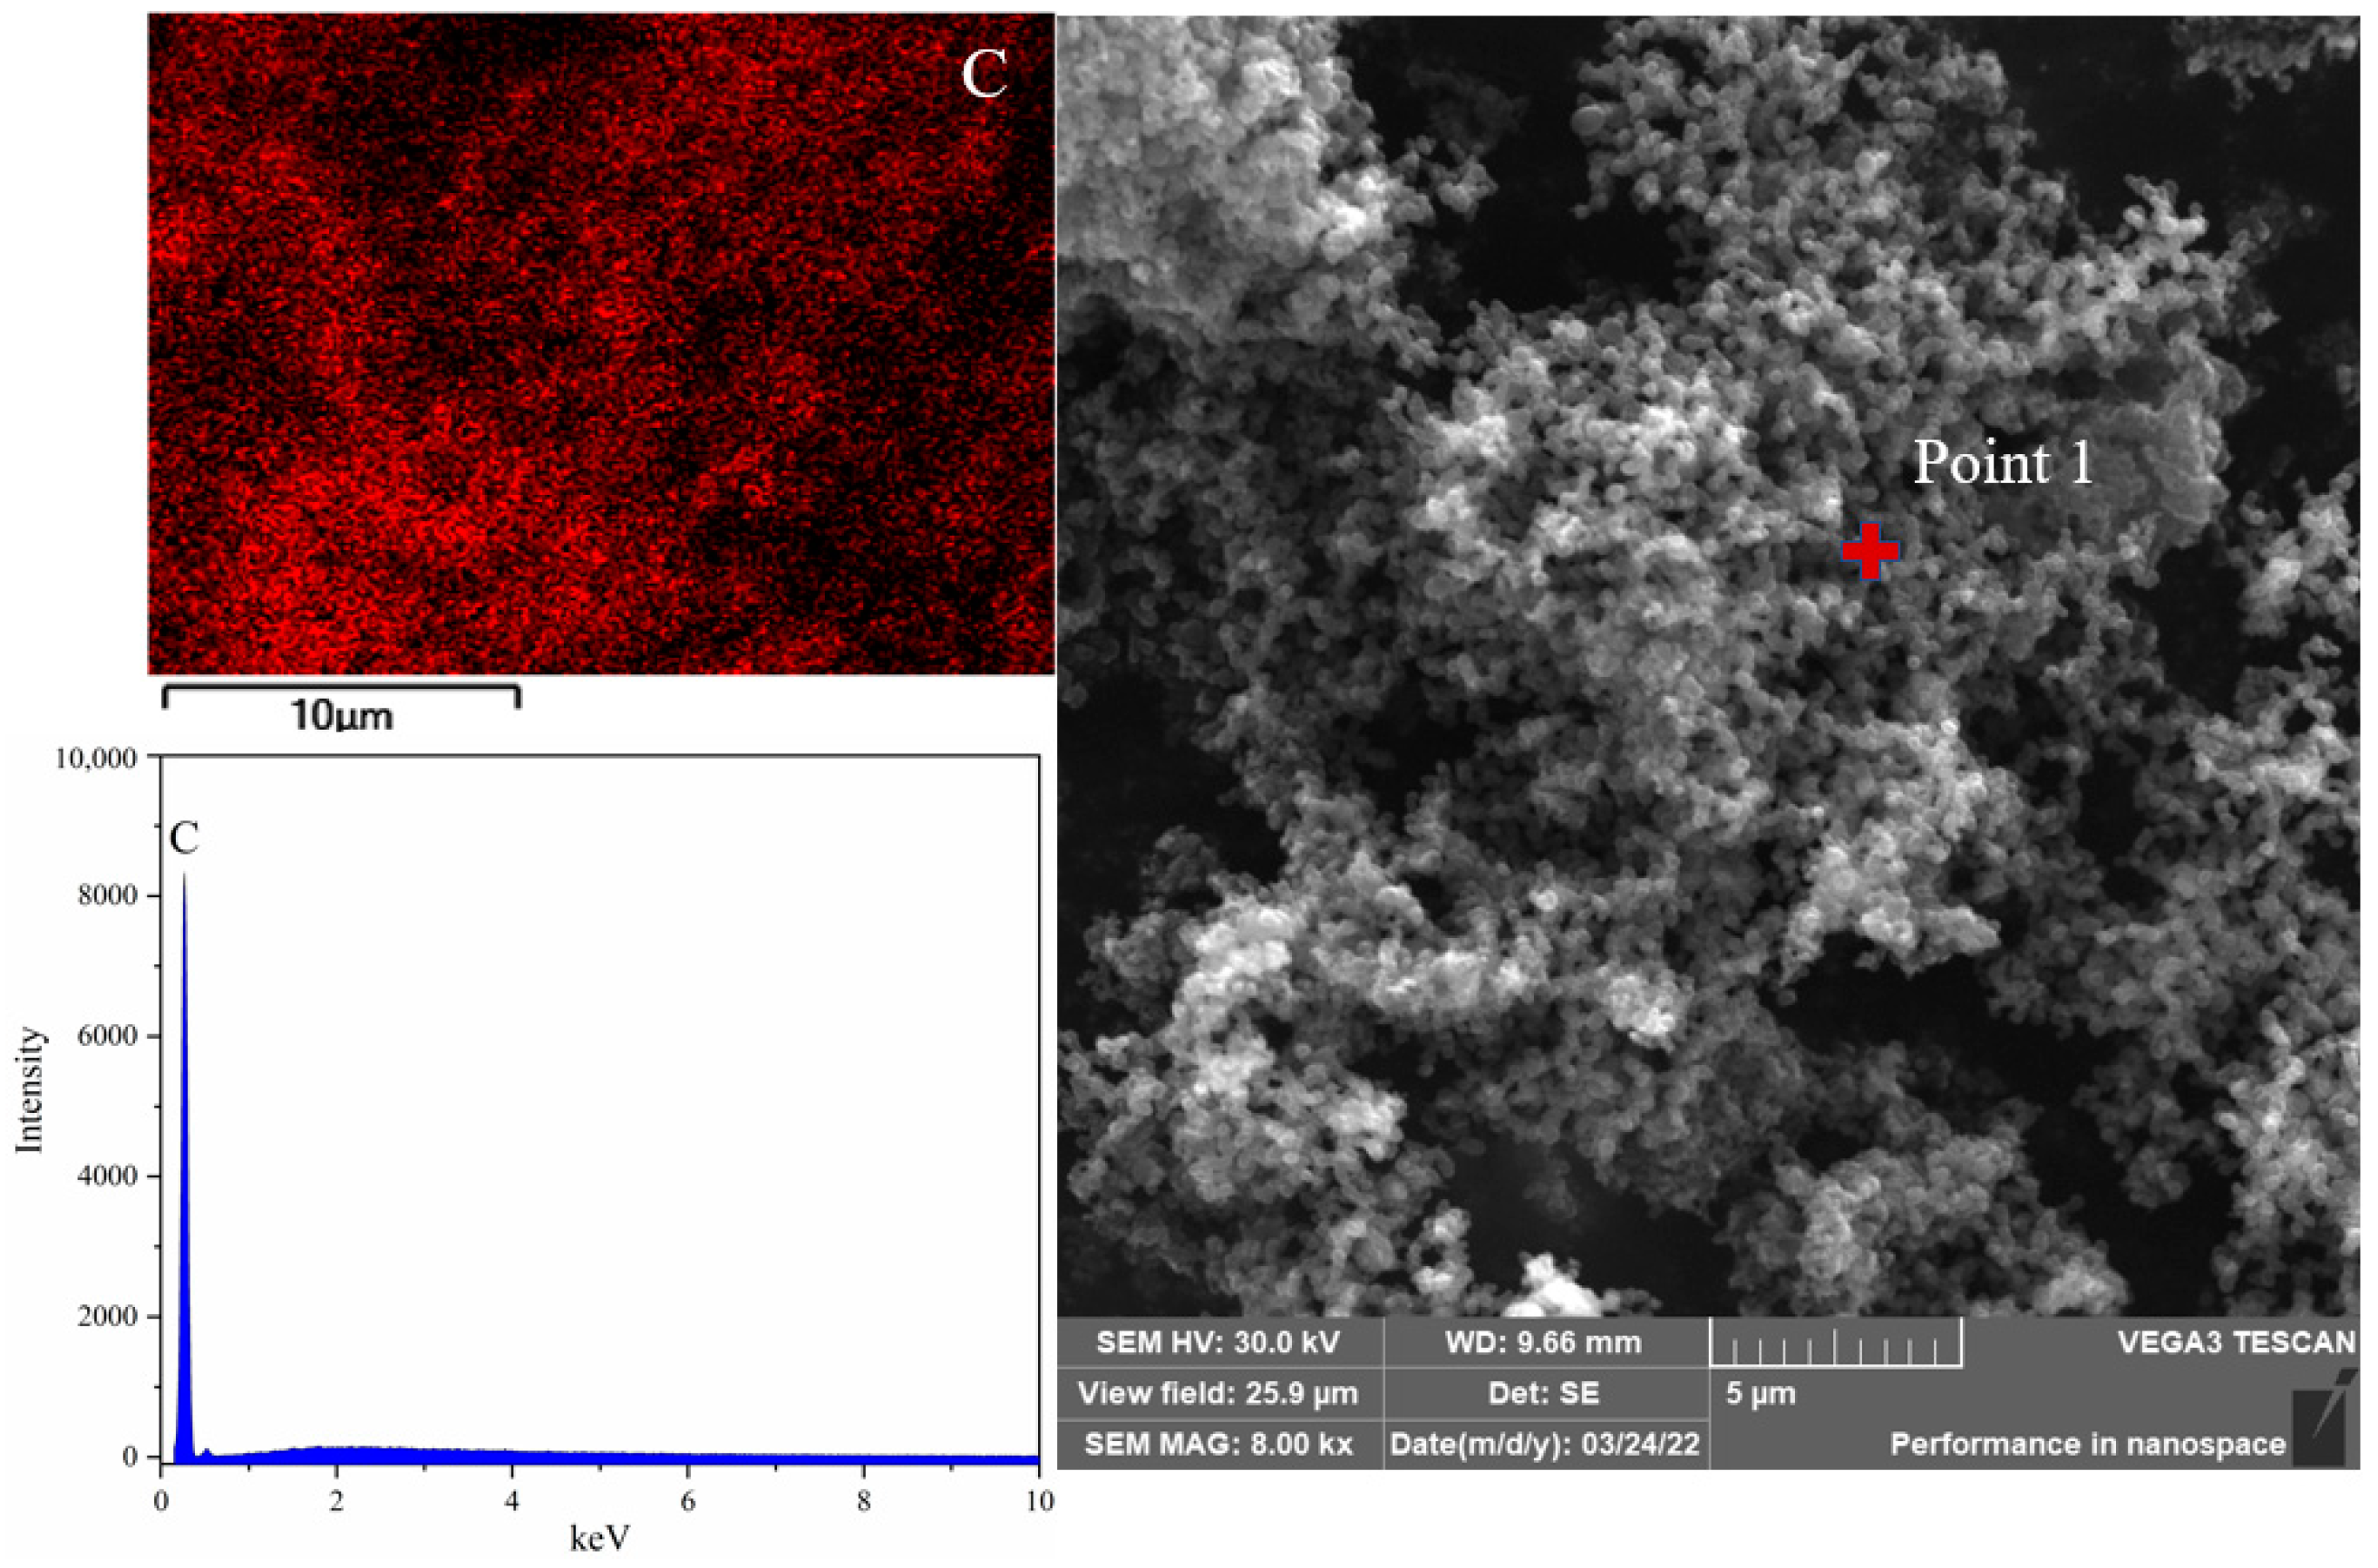
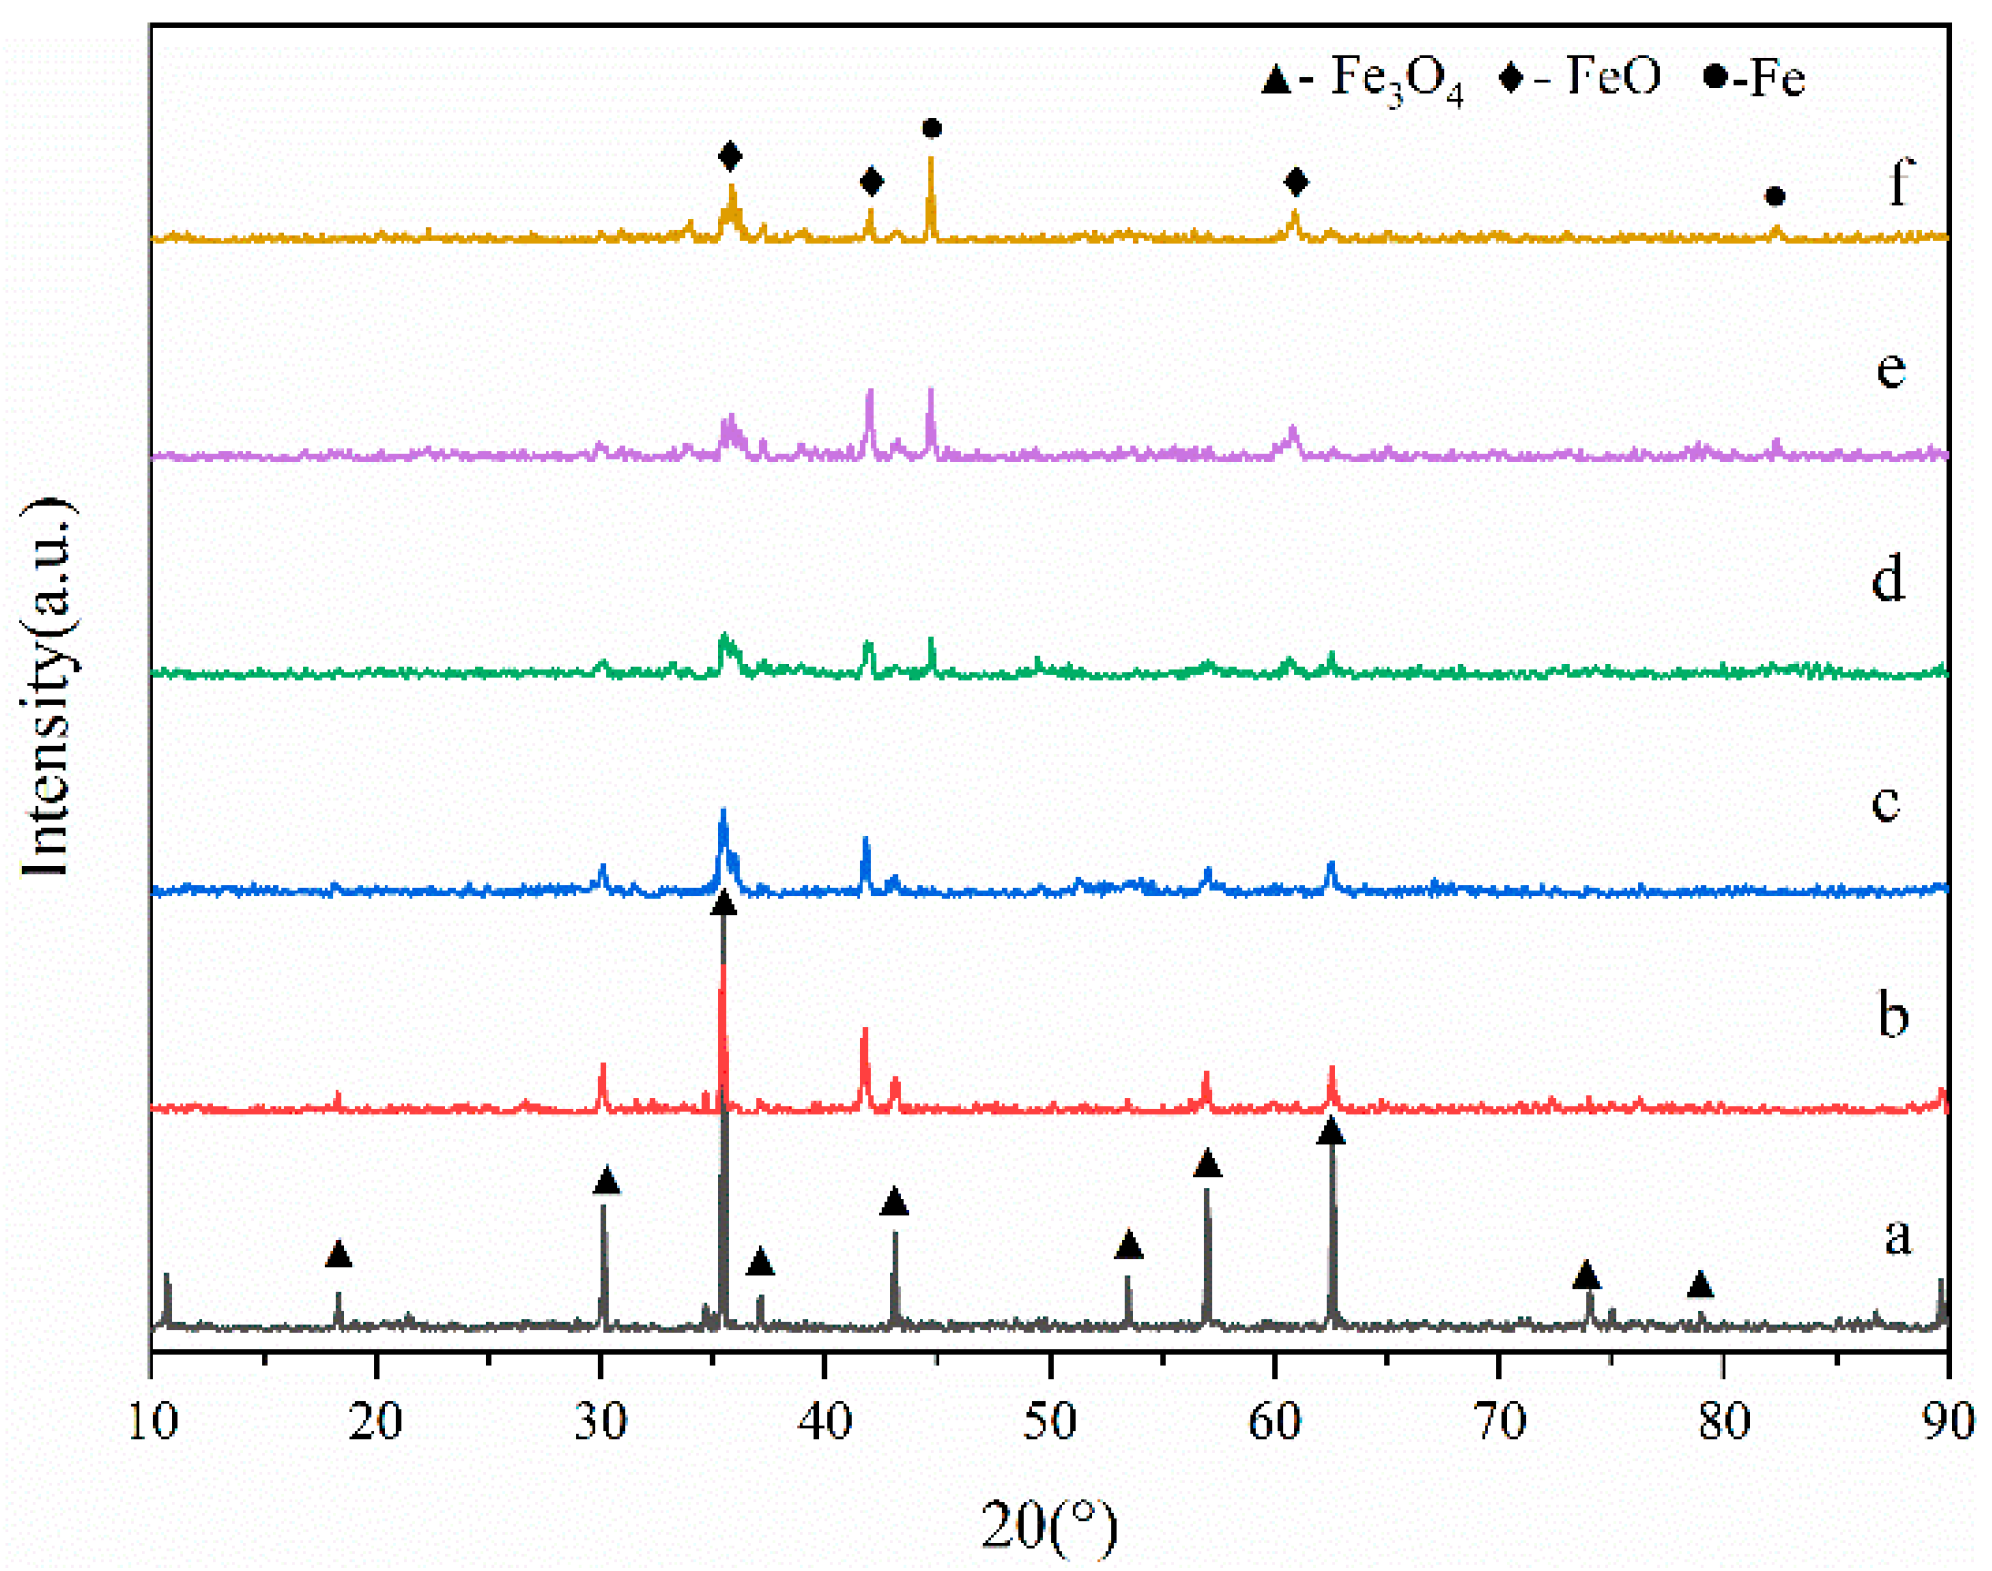
3.2.5. Solid Product Analysis

After the Fe3O4 action of WEO cracking at various temperatures, the solid products were analyzed by XRD, and the changes in the physical phase profiles are shown in Figure 11. Three Fe phases were cumulatively detected in the samples, namely Fe3O4, FeO, and Fe phases. As shown in Figure 11, only Fe3O4 diffraction peaks were present in the XRD pattern of the sample at 700 °C. At this temperature, Fe3O4 was not reduced due to the kinetic conditions. This indicates that Fe3O4 mainly acts as a catalyst at low temperatures, resulting in a slight increase in the production of H2, CH4, and CO. As the temperature rises to 900 °C, the Fe3O4 phase in the sample transforms into the FeO phase. When the temperature is greater than 1100 °C, the obvious metallic iron diffraction peaks appear in the sample; as the temperature increases, Fe3O4 reduction intensifies, consuming part of the reduction products, while the metallic iron phase in the sample increases, corresponding to the enhancement of diffraction peaks. The presence of the FeO phase in the sample despite the temperature increase to 1300 °C is mainly attributed to the fact that this reduction reaction is limited by kinetic conditions, and the continuous passage of nitrogen during the reaction reduces the contact time of the reduced products with Fe3O4.

4. Conclusions

The thermal cracking behavior of WEO is divided into three stages: the volatilization stage of small-molecule low-boiling-point components, the cracking stage of large-molecule components, and the carbonization stage of WEO. When the temperature rises from 700 °C to 1300 °C, the total amount of gases produced by cracking 700 μL of WEO increases from 177.08 mL to 1010.2 mL. At 700 °C, the direct cracking of 700 μL of WEO produces only 52.74 mL H2, 121.14 mL CH4, 2.6 mL CO, and 0.6 mL CO2. The increase in temperature facilitates the direct cracking and gasification of WEO, but the carbon gasification makes it difficult for CO2 to exist stably at high temperatures. At 1300 °C, direct cracking of 700 μL of WEO will produce 920.05 mL H2, 12.18 mL CH4, 77.64 mL CO, and 0.33 mL CO2. At 1300 °C, 700 μL of WEO produced 936.45 mL of H2, 14.04 mL of CH4, 456.99 mL of CO, and 0.63 mL of CO2 in the presence of 1.5 g of Fe3O4. Fe3O4 can catalyze the cracking of WEO; Fe3O4 reduces during the high-temperature cracking of WEO, and the physical phase transforms into FeO and metallic iron, consuming part of the reduced products. Fe3O4 can be used as an oxidizing agent to partially oxidize and crack WEO. The clean utilization of WEO is realized.

Author Contributions

J.G.: Conceptualization, Methodology, Software, Writing—original draft; B.L.: Resources, Writing—original draft; Y.W.: Data curation, Writing—original draft; S.Z.: Formal analysis, Data curation, Writing—review and editing, Supervision; H.W.: Funding acquisition, Supervision. All authors have read and agreed to the published version of the manuscript.

Funding

This work was supported by the Basic Research Special Project of Yunnan Province (202101AW070007).

Data Availability Statement

Data sharing is not applicable to this article.

Conflicts of Interest

The authors declare no conflict of interest.

Abbreviations

Q ( t ) The instantaneous total gas flow
WEOWaste engine oil
X N 2 t The instantaneous volume fraction of N2
X i t The instantaneous volume fraction of gas species (i: H2, CH4, CO, CO2, CnHm)
Y i The total amount of each gas
Z i t The volumefraction of each gas at time (i: H2, CH4, CO, CO2, CnHm)

References

  1. Maceiras, R.; Alfonsín, V.; Morales, F.J. Recycling of waste engine oil for diesel production. Waste Manag. 2016, 60, 351–356. [Google Scholar] [CrossRef] [PubMed]
  2. Boughton, B.; Horvath, A. Environmental assessment of used oil management methods. Environ. Sci. Technol. 2004, 38, 353–358. [Google Scholar] [CrossRef] [PubMed] [Green Version]
  3. Agamuthu, P.; Abioye, O.P.; Aziz, A.A. Phytoremediation of soil contaminated with used lubricating oil using jatropha curcas. J. Hazard. Mater. 2010, 179, 891–894. [Google Scholar] [CrossRef] [PubMed]
  4. Nivedita, P.; Krushna, P.S.; Pravin, K.K. Characterization of waste engine oil derived pyrolytic char (WEOPC): SEM, EDX and FTIR analysis. Mater. Today Proc. 2021, 38, 2866–2870. [Google Scholar] [CrossRef]
  5. Hamawand, I.; Yusaf, T.; Rafat, S. Recycling of waste engine oils using a new washing agent. Energies 2013, 6, 1023–1049. [Google Scholar] [CrossRef]
  6. Vks, A.; Rk, B.; Aps, A. Laboratory investigation of bituminous concrete using reclaimed asphalt pavement and waste engine oil. Mater. Today Proc. 2022, 59, 1591–1598. [Google Scholar] [CrossRef]
  7. Chen, A.; Hu, Z.; Li, M.; Bai, T.; Xie, G.; Zhang, Y.; Li, Y.; Li, C. Investigation on the mechanism and performance of asphalt and its mixture regenerated by waste engine oil. Constr. Build. Mater. 2021, 313, 125411. [Google Scholar] [CrossRef]
  8. Al-Mutlaqa, S.; Mahal, E.; Yahya, R.; Mahal, A. Effect of chlorination on the assessment of waste engine oil modified asphalt binders. Pet. Sci. Technol. 2019, 37, 617–628. [Google Scholar] [CrossRef]
  9. Liu, S.; Meng, H.; Xu, Y.; Zhou, S. Evaluation of rheological characteristics of asphalt modified with waste engine oil (WEO). Pet. Sci. Technol. 2018, 36, 475–480. [Google Scholar] [CrossRef]
  10. Fernandes, S.R.M.; Silva, H.M.R.D.; Oliveira, J.R.M. Developing enhanced modified bitumens with waste engine oil products combined with polymers. Constr. Build. Mater. 2018, 160, 714–724. [Google Scholar] [CrossRef]
  11. Kim, S.S.; Kim, S.H. Pyrolysis kinetics of waste automobile lubricating oil. Fuel 2000, 79, 1943–1949. [Google Scholar] [CrossRef]
  12. Lam, S.S.; Liew, R.K.; Cheng, C.K.; Chase, H.A. Catalytic microwave pyrolysis of waste engine oil using metallic pyrolysis char. Appl. Catal. B Environ. 2015, 176, 601–607. [Google Scholar] [CrossRef] [Green Version]
  13. Lam, S.S.; Russell, A.D.; Chase, H.A. Microwave pyrolysis, a novel process for recycling waste automotive engine oil. Energy 2010, 35, 2985–2991. [Google Scholar] [CrossRef]
  14. Lam, S.S.; Russell, A.D.; Chase, H.A. Pyrolysis using microwave heating: A sustainable process for recycling used car engine oil. Ind. Eng. Chem. Res. 2010, 49, 10845–10851. [Google Scholar] [CrossRef]
  15. Lázaro, M.J.; Moliner, R. Co-pyrolysis of a mineral waste oil/coal slurry in a continuous-mode fluidized bed reactor-ScienceDirect. J. Anal. Appl. Pyrolysis 2002, 65, 239–252. [Google Scholar] [CrossRef]
  16. Blanco, P.H.; Wu, C.; Onwudili, J.A.; Williams, P.T. Characterization and evaluation of Ni/SiO catalysts for hydrogen production and tar reduction from catalytic steam pyrolysis-reforming of refuse derived fuel. Appl. Catal. B Environ. 2013, 134, 238–250. [Google Scholar] [CrossRef]
  17. Shen, Y.; Zhao, P.; Shao, Q.; Ma, D.; Takahashi, F.; Yoshikawa, K. In-situ catalytic conversion of tar using rice husk char-supported nickel-iron catalysts for biomass pyrolysis/gasification. Appl. Catal. B Environ. 2014, 152, 140–151. [Google Scholar] [CrossRef]
  18. Zouad, Y.; Tarabet, L.; Khiari, K.; Mahmoud, R. Effect of heating rate and additives (MgO and Al2O3 ) on a diesel like-fuel issued from waste engine oil pyrolysis. Pet. Sci. Technol. 2019, 37, 1184–1193. [Google Scholar] [CrossRef]
  19. Bhaskar, T.; Uddin, M.A.; Muto, A.; Sakata, Y.; Omura, Y.; Kimura, K.; Kawakami, Y. Recycling of waste lubricant oil into chemical feedstock or fuel oil over supported iron oxide catalysts. Fuel 2004, 83, 9–15. [Google Scholar] [CrossRef]
  20. Abdul-Raouf, M.E.; Maysour, N.E.; Abdul-Azim, A.; Amin, M.S. Thermochemical recycling of mixture of scrap tyres and waste lubricating oil into high caloric value products. Energy Convers. Manag. 2010, 51, 1304–1310. [Google Scholar] [CrossRef]
  21. Zhou, S.; Wei, Y.; Zhang, S.; Li, B.; Wang, H. Reduction of copper smelting slag using waste cooking oil. J. Clean. Prod. 2019, 236, 117668. [Google Scholar] [CrossRef]
  22. Zhou, L.; Zong, Z.; Tang, S.; Zong, Y.; Xie, R.; Ding, M.; Zhao, W.; Zhu, X.; Xia, Z.; Wu, L.; et al. FTIR and mass spectral analyses of an upgraded Bio-oil. Energy Sources Part A Recovery Util. Environ. Eff. 2009, 32, 370–375. [Google Scholar] [CrossRef]
  23. Ben Hassen-Trabelsi, A.; Kraiem, T.; Naoui, S.; Belayouni, H. Pyrolysis of waste animal fats in a fixed-bed reactor: Production and characterization of bio-oil and bio-char. Waste Manag. 2013, 34, 210–218. [Google Scholar] [CrossRef] [PubMed]
  24. Meier, H.F.; Wiggers, V.R.; Zonta, G.R.; Scharf, D.R.; Simionatto, E.L.; Ender, L. A kinetic model for thermal cracking of waste cooking oil based on chemical lumps. Fuel 2015, 144, 50–59. [Google Scholar] [CrossRef]
  25. Zhou, S.; Wei, Y.; Peng, B.; Li, B.; Wang, H. Reduction kinetics for Fe2O3/NiO-doped compound in a methane atmosphere. J. Alloys Compd. 2017, 735, 365–371. [Google Scholar] [CrossRef]
  26. Periyasamy, B. Reaction pathway analysis in thermal cracking of waste cooking oil to hydrocarbons based on monomolecular lumped kinetics. Fuel 2015, 158, 479–487. [Google Scholar] [CrossRef]
Figure 1. Experimental device.
Energies 16 00655 g001
Figure 2. Working flow chart.
Energies 16 00655 g002
Figure 3. TG−DTG curve of (a) WEO and (b) WEO with Fe3O4 at a heating rate of 10 °C/min.
Energies 16 00655 g003
Figure 4. FTIR spectrum of WEO.
Energies 16 00655 g004
Figure 5. Three-dimensional FTIR spectra of pyrosis gas products from WEO.
Energies 16 00655 g005
Figure 6. Reaction mechanism of WEO cracking.
Energies 16 00655 g006
Figure 7. The volume fraction of produced gas as a function of time, (a) WEO cracking directly; (b) WEO cracking with 1.5 g Fe3O4.
Energies 16 00655 g007
Figure 8. Gas production of WEO at different pyrolysis temperatures.
Energies 16 00655 g008
Figure 9. Carbon deposition during cracking process, (a) flask for cooling; (b) collected carbon from the flask (a); (c) XRD pattern of generated carbon.
Energies 16 00655 g009
Figure 10. SEM-EDS analysis of cracking carbon.
Energies 16 00655 g010
Figure 11. XRD patterns of Fe3O4 samples, (a) 700 °C; (b) 900 °C; (c) 1000 °C; (d) 1100 °C; (e) 1200 °C; (f) 1300 °C.
Energies 16 00655 g011
Table 1. Element analysis of WEO.
ElementCHONS
Content (wt.%)83.5213.881.251.220.13
Table 2. Composition analysis of WEO.
CompositionContent (wt.%)
Alkane oil90.98
Ethylene glycol0.13
Phthalate1.41
Formic acid0.39
Caprolactam0.37
Polysiloxane6.25
Moisture0.42
Disclaimer/Publisher’s Note: The statements, opinions and data contained in all publications are solely those of the individual author(s) and contributor(s) and not of MDPI and/or the editor(s). MDPI and/or the editor(s) disclaim responsibility for any injury to people or property resulting from any ideas, methods, instructions or products referred to in the content.

