1. Status of PV Deployment towards Climate Neutrality
There are a wide range of models predicting how much solar electricity can contribute to helping achieve climate neutrality. The average of the 311 Integrated Assessment Report scenarios used in the IPCC 1.5 °C Special Report [
1] was 12.5 PWh/year. Estimates of researchers in the PV community reveal that in 2050 solar electricity could contribute 41 to 96 PWh/year [
2,
3]. The corresponding installation figures would be between 10 and 67 TWp of solar photovoltaics.
At the end of 2021, the worldwide installed capacity of photovoltaic electricity generation systems was 965 GWp and the European Union accounted for roughly 18% or 171 GWp [
4]. In 2022, the benchmark of 1 TW was reached and with an annual addition of about 230 GWp at the end of the year, the total of 1.2 TWp was exceeded [
5]. The EU installed over 41 GWp in 2022, less than half that of China with 98.3 GWp. While a lot of the recent PV capacity additions can be attributed to utility-scale projects, the early success of PVs can be largely attributed to the cost reduction through technological learning, scale-up, and the necessary industrialization efforts, which were spurred by the rooftop PV programs implemented in countries such as Japan and Germany [
6]. These were complemented by educational efforts and student exchange programmes that allowed the development of entrepreneurship, for example, in PV manufacturing in China [
6,
7]. In some countries today, private individuals still own large shares of renewable capacity, such as in Germany, with 30% in 2019 [
8].
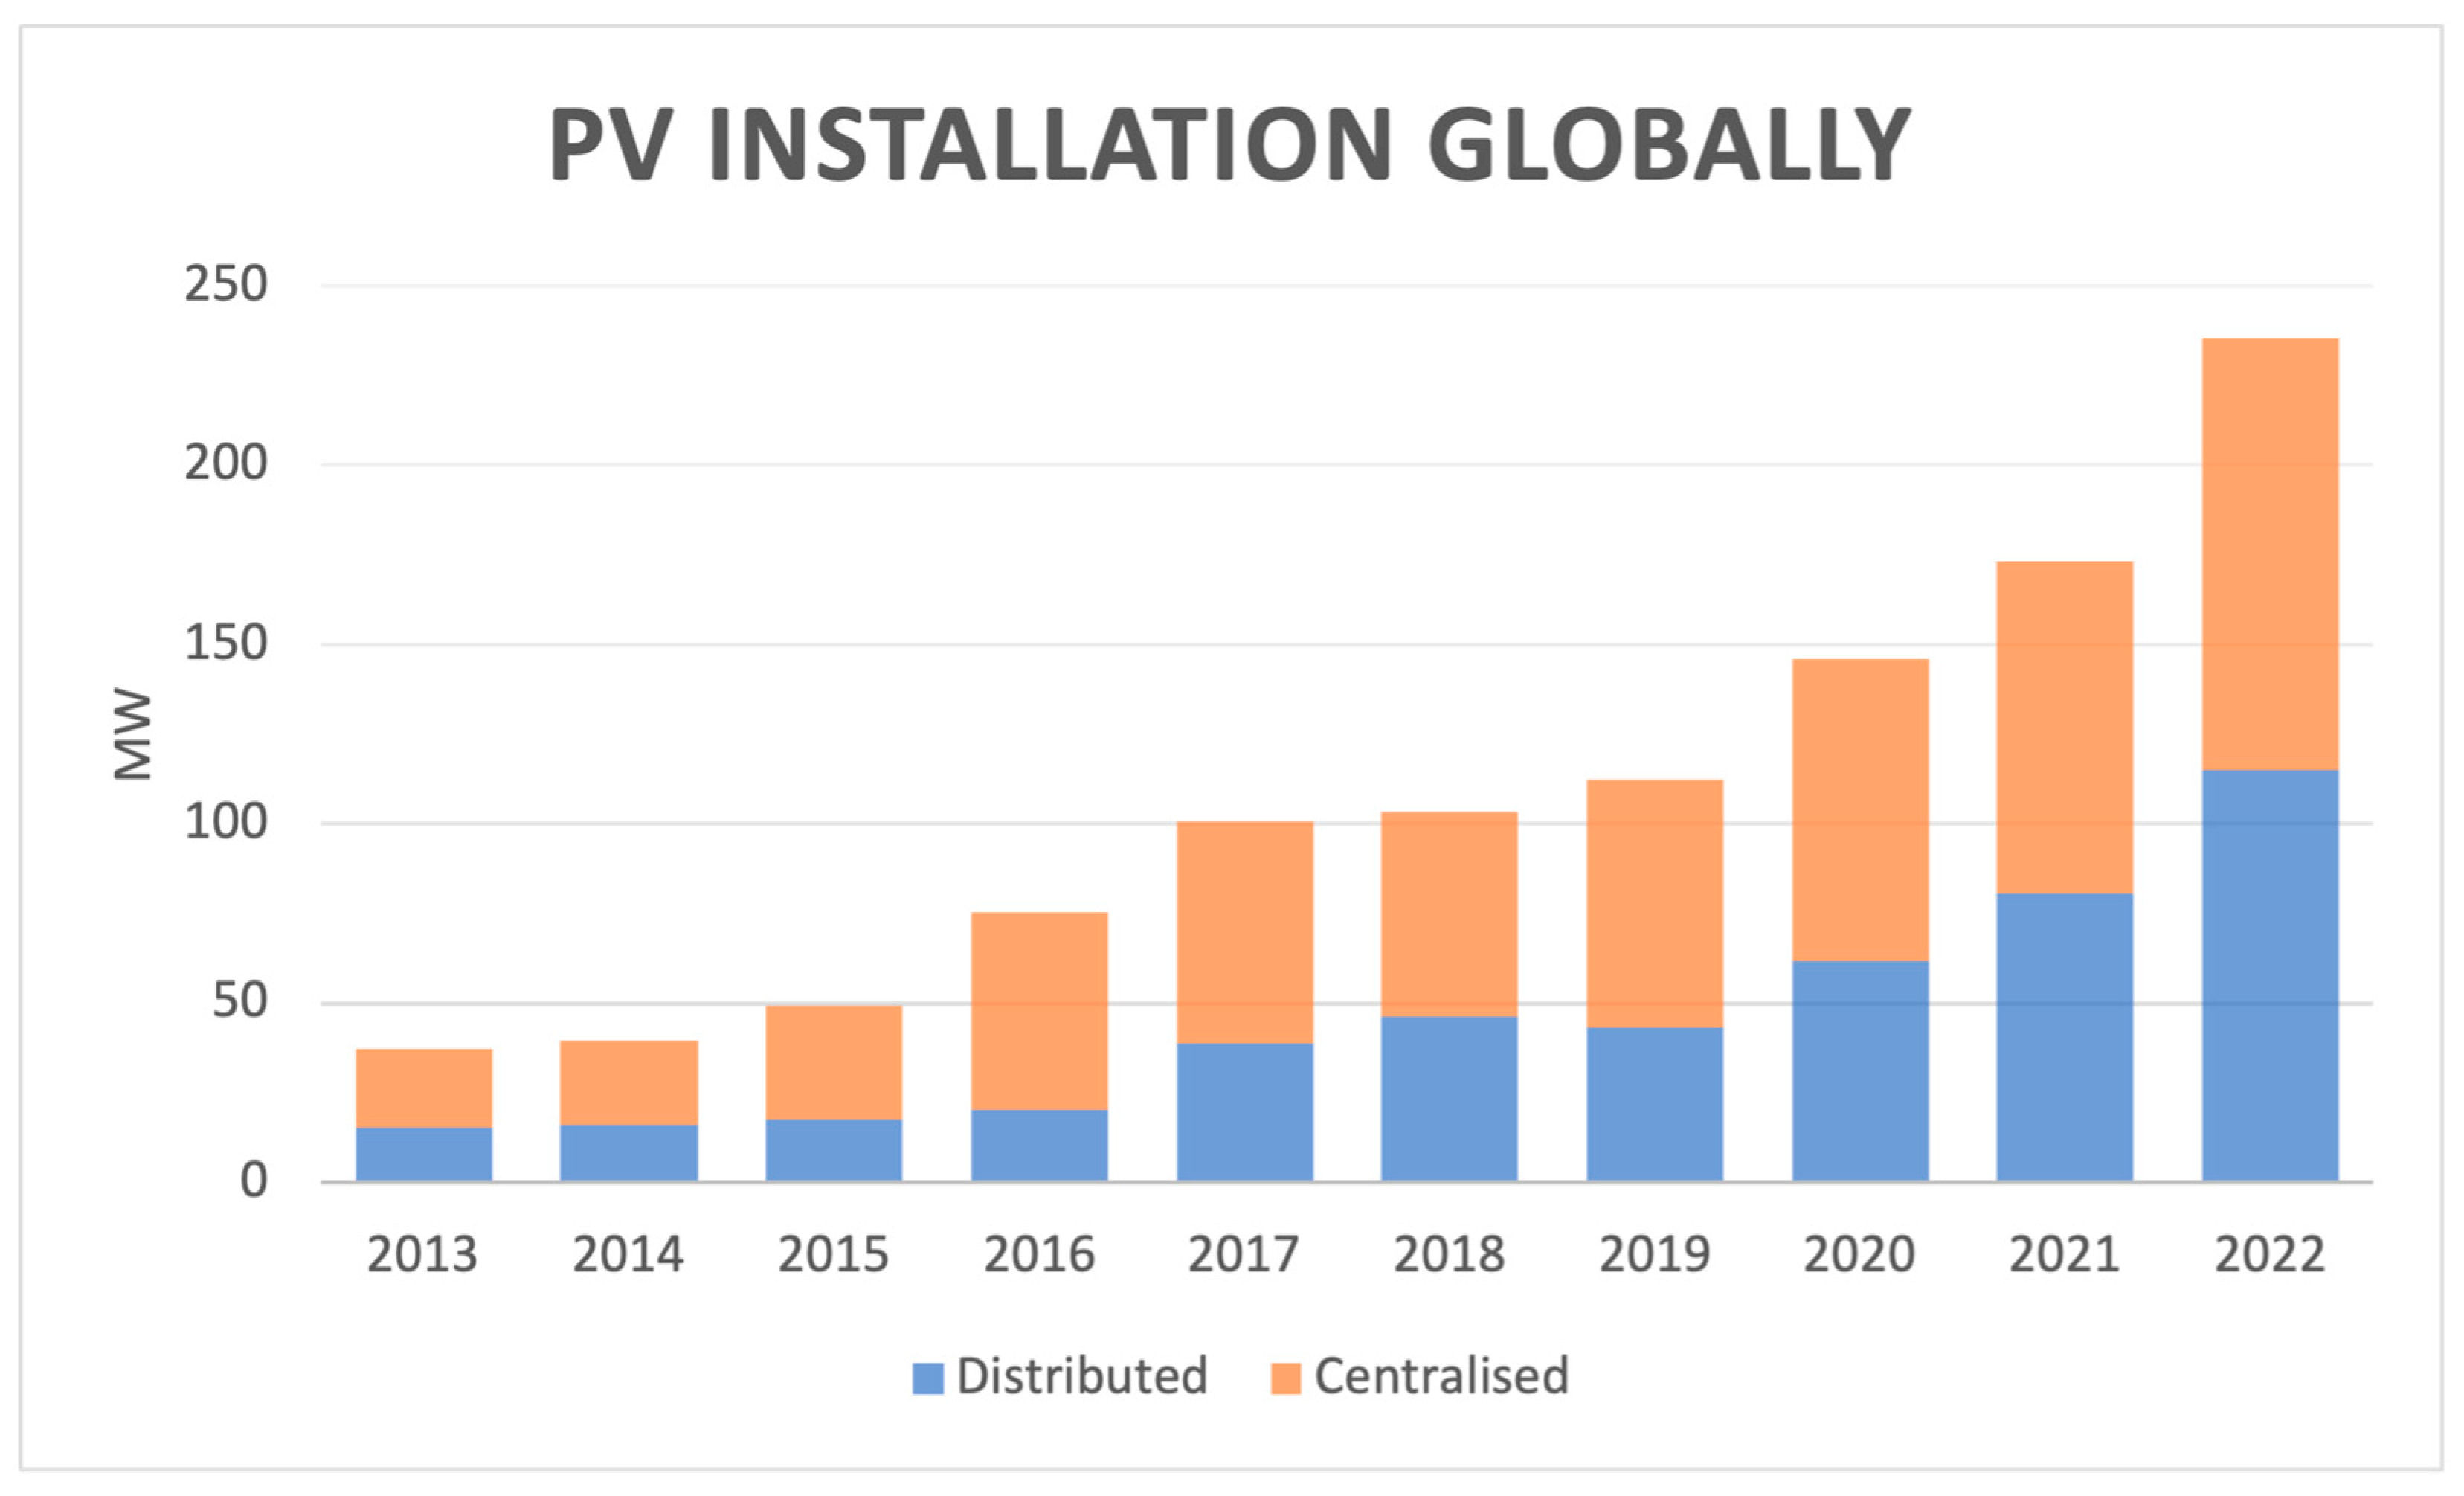
In recent years, the deployment of rooftop PVs has again gained importance, and in 2022, 48% of the PV additions worldwide were rooftop PVs [
9] (see
Figure 1). Especially for the installation of small-scale PVs, local learning continues to play an important role [
6]. To accurately assess the bankability of PV projects before installation, be it utility or small scale, GIS-based solar radiation information has evolved as an essential decision support [
10]. Especially for small-scale projects, offering these GIS tools as a freely accessible service is an important public good.
A faster deployment of solar energy installations is needed for the transition towards climate neutrality [
1]. Except for countries without land-use constraints, this requires more rooftop PVs and other more innovative forms of deployment, such as Agri-Photovoltaics [
11] or floating PVs [
12]. Consequently, many world regions continue to invest in policies that are targeting an acceleration in rooftop PV deployment: the European Union with the European Solar Rooftops Initiative in 2022 [
13], China with the Whole County PV program in 2021 [
14,
15], and the United States with, e.g., the launch this year, 2023, of the
$7 billion competition to fund residential solar programmes [
16]. For regions with a lack of access to clean electricity, such as Sub-Saharan Africa, smaller-scale PV projects with local mini-grids play a key role in improving the living conditions of their citizens. While financial incentives and grants play a key role in related support programmes, publicly accessible decision-support tools driven by education and science can play a critical role in ensuring the success of these support policies [
17,
18].
In this perspective paper, in
Section 2, we introduce the side event on PV resources at COP27 and mention some of the challenges observed for PV deployment. In
Section 3, we first outline some of the more evident benefits of education and science-driven tools for PV deployment. In
Section 4, a short overview of education and science-driven tools in the solar domain is presented. In
Section 5, we showcase a few specific existing instruments for education (
Section 5.1), data-driven tools (
Section 5.2), and the consideration of local communities (
Section 5.3), which have already shown their relevance in the PV sector, and which were presented at the COP27 side event. Through a forward-looking perspective, we analyse in
Section 6 some of the strengths, weaknesses, opportunities, and threats of these tools.
2. COP27 Side Event on PV Resources towards Climate Neutrality
Recognising all these needs, in November 2022, the European Commission organized an online European Union side event at COP27 on PV resources towards climate neutrality. Speakers presented the latest developments on PV mapping for cities, complemented by African ground experience at a local level for energy policy implementation. They also showed the relevance of distance-learning experiences for solar energy and the importance of continuing to support cost-free tools for solar energy assessment, such as the PVGIS or the SolarCity simulator. This side event on PV resources was in the top 20% of the most viewed EU side events with 137 unique viewers (on the streaming platform used for COP27 alone). This perspective article provides a summary of the COP27 side event. At the event, attendees were asked to provide their input on what they thought were the crucial challenges to deploying solar PV faster.
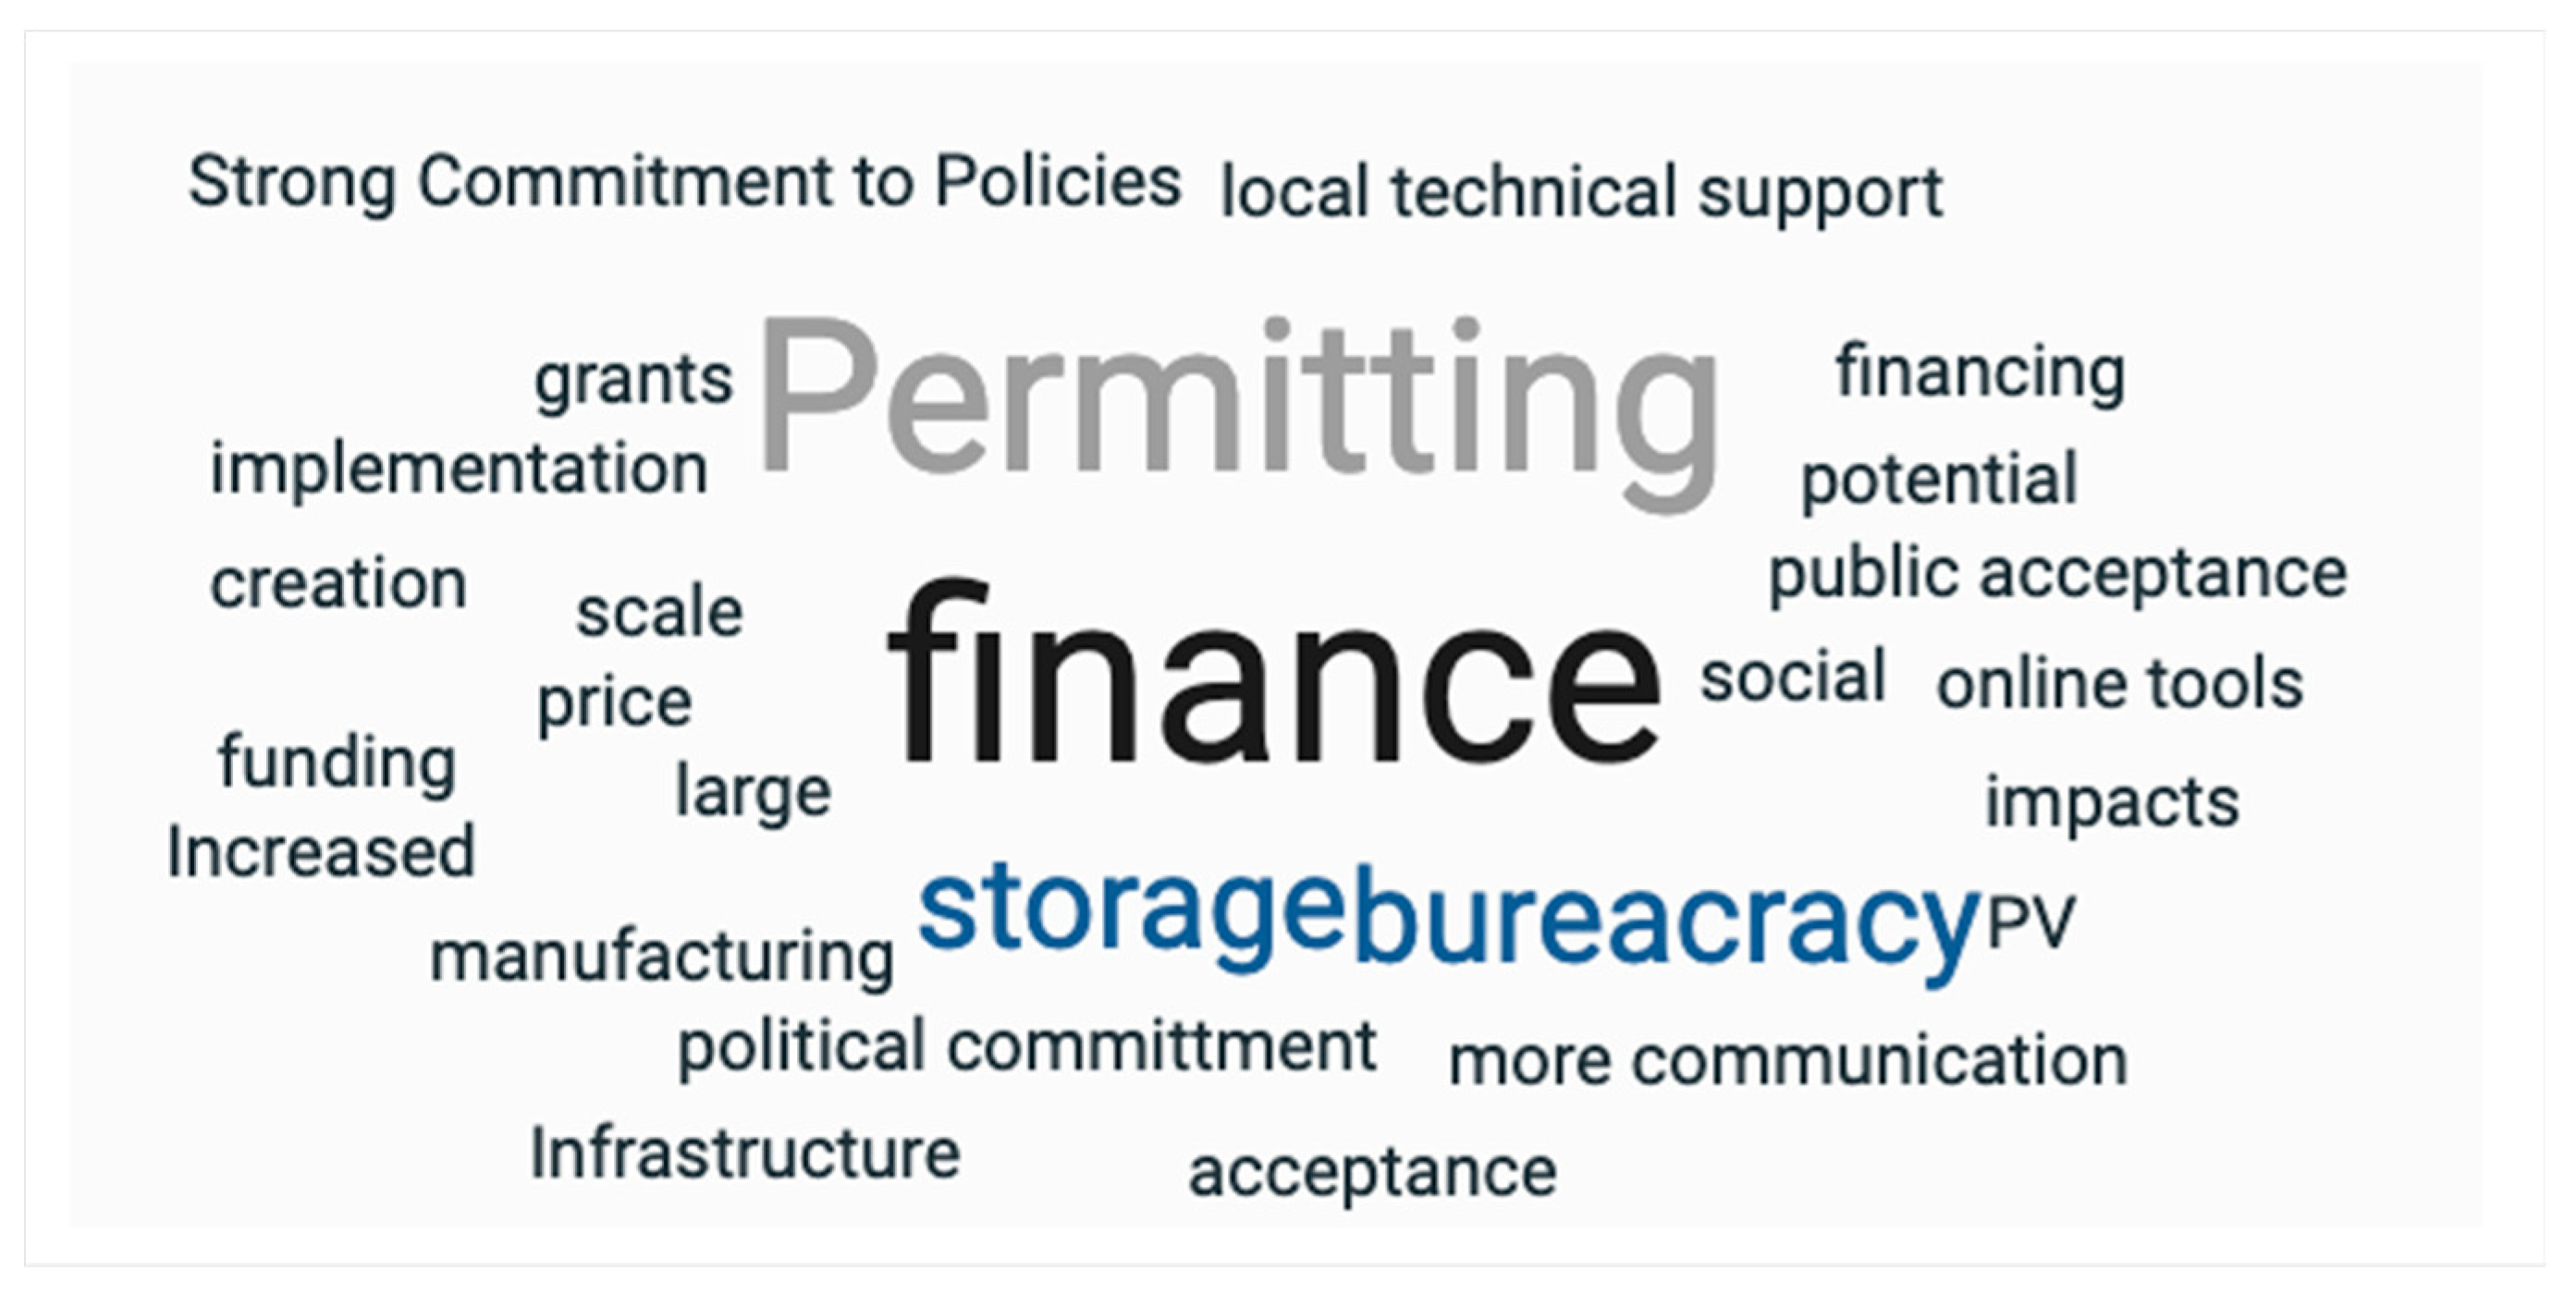
Figure 2 depicts a word cloud that highlights the audience’s perception of the main barriers hindering the faster scale-up of solar PVs, which include permitting, finance, the lack of electricity storage, and excessive bureaucracy.
Compared to 2010, the worldwide benchmark price for residential PV systems has decreased from USD 6290 per kWp to USD 1830/kWp in the first half of 2023 [
19]. In competitive markets like that of Australia, system prices are well below USD 1000/kWp. The system price for residential PV installations is very dependent on building codes, permitting requirements, and the competitiveness of the local PV market. Despite similar hardware prices, the pricing of residential systems is different than that of large systems, where international competition drives down system prices. The International Energy Agency (IEA) estimates that the annual investments in Africa fall short of being sufficient to achieve access and sustainability targets by more than half [
20]. The affordability and risks are key elements in financing energy access in Africa. In developing countries, the absence of financial support (i.e., subsidies and grants) has hindered many energy access projects. Without these, project developers cannot mobilise enough capital for energy access projects. The unprecedented cost decrease can help to alleviate the affordability issue (IRENA statistics showed that globally the weighted average total installed cost of PV projects commissioned in 2021 was USD 857/kilowatt (kW), 82% lower than in 2010) [
21]. Investment in Sub-Saharan African countries is considered more risky, as the financial market has three times higher capital costs than those of developed countries. The majority of the projects are unable to fully recoup the investment costs from users. De-risking and supporting consumers is vital. Apart from additional financing instruments, all forms of knowledge sharing can contribute to de-risking the projects.
In the COP27 side event on solar PVs, the audience also pointed out other challenging factors, such as public acceptance, social aspects, communication, and political commitment. Aspects that could foster a faster PV deployment, such as potential analysis and online tools, were also mentioned.
3. The Role of Education, and Science-Driven Tools for PV Deployment
As mentioned above, there is an urgent need to drastically increase PV deployment everywhere to achieve climate neutrality. To support this, and at the speed we need it, it is essential to use data-driven tools and make the right investment in relevant and up-to-date education on the topic. Some of the key benefits of this are:
The availability of non-commercial tools that are easy to use can help citizens assess the installation potential of solar PVs on their rooftops. This could boost the deployment of more decentralized and distributed systems for self-consumption and increase the share of prosumers. With these tools, homeowners can then have an easy way to make a first assessment before reaching out to specialized companies, and they can also use these tools as independent sources for comparison.
Some companies working in the solar sector, especially small ones, benefit from non-commercial specialized software as part of their process, as they may not have the critical mass to develop their own tools for this or buy the required licenses.
The use of reliable tools can assist in increasing confidence in PV investments, as potential investors can rely on data-driven information, ideally from several sources, before venturing into these investments.
Many researchers also tend to prefer non-commercial tools for their analyses, especially tools that they trust will continue to be maintained and updated in the future. Open-source software, in particular, enables researchers to add newer functionality and have a deeper understanding of the existing version.
For decision-makers and local governments, it is essential to have access to the right tools to help make informed decisions.
Solar education is also a good investment. Having more people educated on solar matters can help scale up in the medium-long term and make sure the job market on the topic will be able to fill the necessary positions with the required expertise. Another benefit of non-commercial tools and online courses is that they can be used for educational purposes at no extra cost for the institutions or the users.
There is an increasing focus on the public acceptance of photovoltaics, in the context of land use limitation and aesthetics, but also more and more conversations focus on the importance of citizen engagement, for which both solar education and non-commercial tools can be relevant enabling tools.
It is essential to further consider the specific needs of local communities in combination with these tools to make sure the needs of local stakeholders at different levels are taken into consideration, as we will showcase below.
At the COP27 side event and in this perspective paper, we focus on a small selection of educational and science-driven tools for the support of PV deployment and showcase the synergies that could further help accelerate solar deployment.
4. Overview of Educational and Science-Driven Tools to Support PV Deployment
There is a wealth of existing tools for education on and resource assessment of PVs. One of the first online learning resources developed for education on PVs is PVeducation.org, which was launched in 2008 [
22]. Since then, other online courses have followed, such as the Massive Online Open Course (MOOC) on solar energy from TU Delft that we will delve into below, or more specialised programmes, such as an online course on Building-Integrated Photovoltaics that has been developed by a consortium of several universities [
23].
With the increasing deployment of PVs, a larger number of GIS-based solar resource assessment tools have been developed. In 2001, the PVGIS was among the first tools that had been made publicly available [
24]. There are other non-commercial solar software alternatives, such as NREL’s PVWatts mainly for U.S.A. [
25] or SAM [
26], and a variety of commercial alternatives, for example, the SolarGIS, Meteonorm, Aurora, HelioScope, PVSyst, PVcase, Solcast, PV*SOL, Anderson Optimization, pvDesign, Energy Toolbase, or Terabase. They cover and specialize in different aspects of the PV plant lifecycle, including finance simulations.
Recently, several tools have been published that focus on supporting photovoltaic deployment in cities and urban areas [
27,
28], considering also the integration with cultural heritage and protected areas [
29]. There has been a rapid development of a wide range of solar cadastres including rooftops and, sometimes, façades [
30,
31,
32,
33,
34,
35], with more recent research being on dynamic solar cadastres, which shift from annual sums to time series of higher granularity [
36]. A broader review of the tools for urban decarbonisation is presented in [
37], including spatio-temporal energy-modelling tools for integrated demand–supply analyses of urban energy systems at district and city scales.
5. Showcases
This section presents examples of four initiatives, in the context of education and science-based open tools, which are contributing to facilitating the increase of solar PV installations in different ways. They were presented and discussed at the COP27 side event: (1) solar-related education from the Delft University of Technology, (2) the SolarCity simulator by IRENA, (3) the PVGIS by the European Commission, and (4) the EU-funded studies in Benin. The authors acknowledge that there exist many other successful examples, and this paper does not intend to make a comprehensive collection of these, but only showcase a few of them covering different aspects concerning PV deployment.
5.1. Education on PV Profiles: Delft University of Technology
The Delft University of Technology is located in the Netherlands and represents one of the top engineering universities in Europe (TU Delft Rankings: online-learning.tudelft.nl/rankings, last visited on 30 November 2023). The university has a strong portfolio on energy transition that was pioneered in 2013 with the release of the first MOOC on Solar Energy. This MOOC addresses topics relevant to PV solar-cell engineering at the undergraduate university level, from the basics of semiconductor physics and optics to the design of simple PV systems. This MOOC has quickly become very popular worldwide, underlining the need for education in this field.
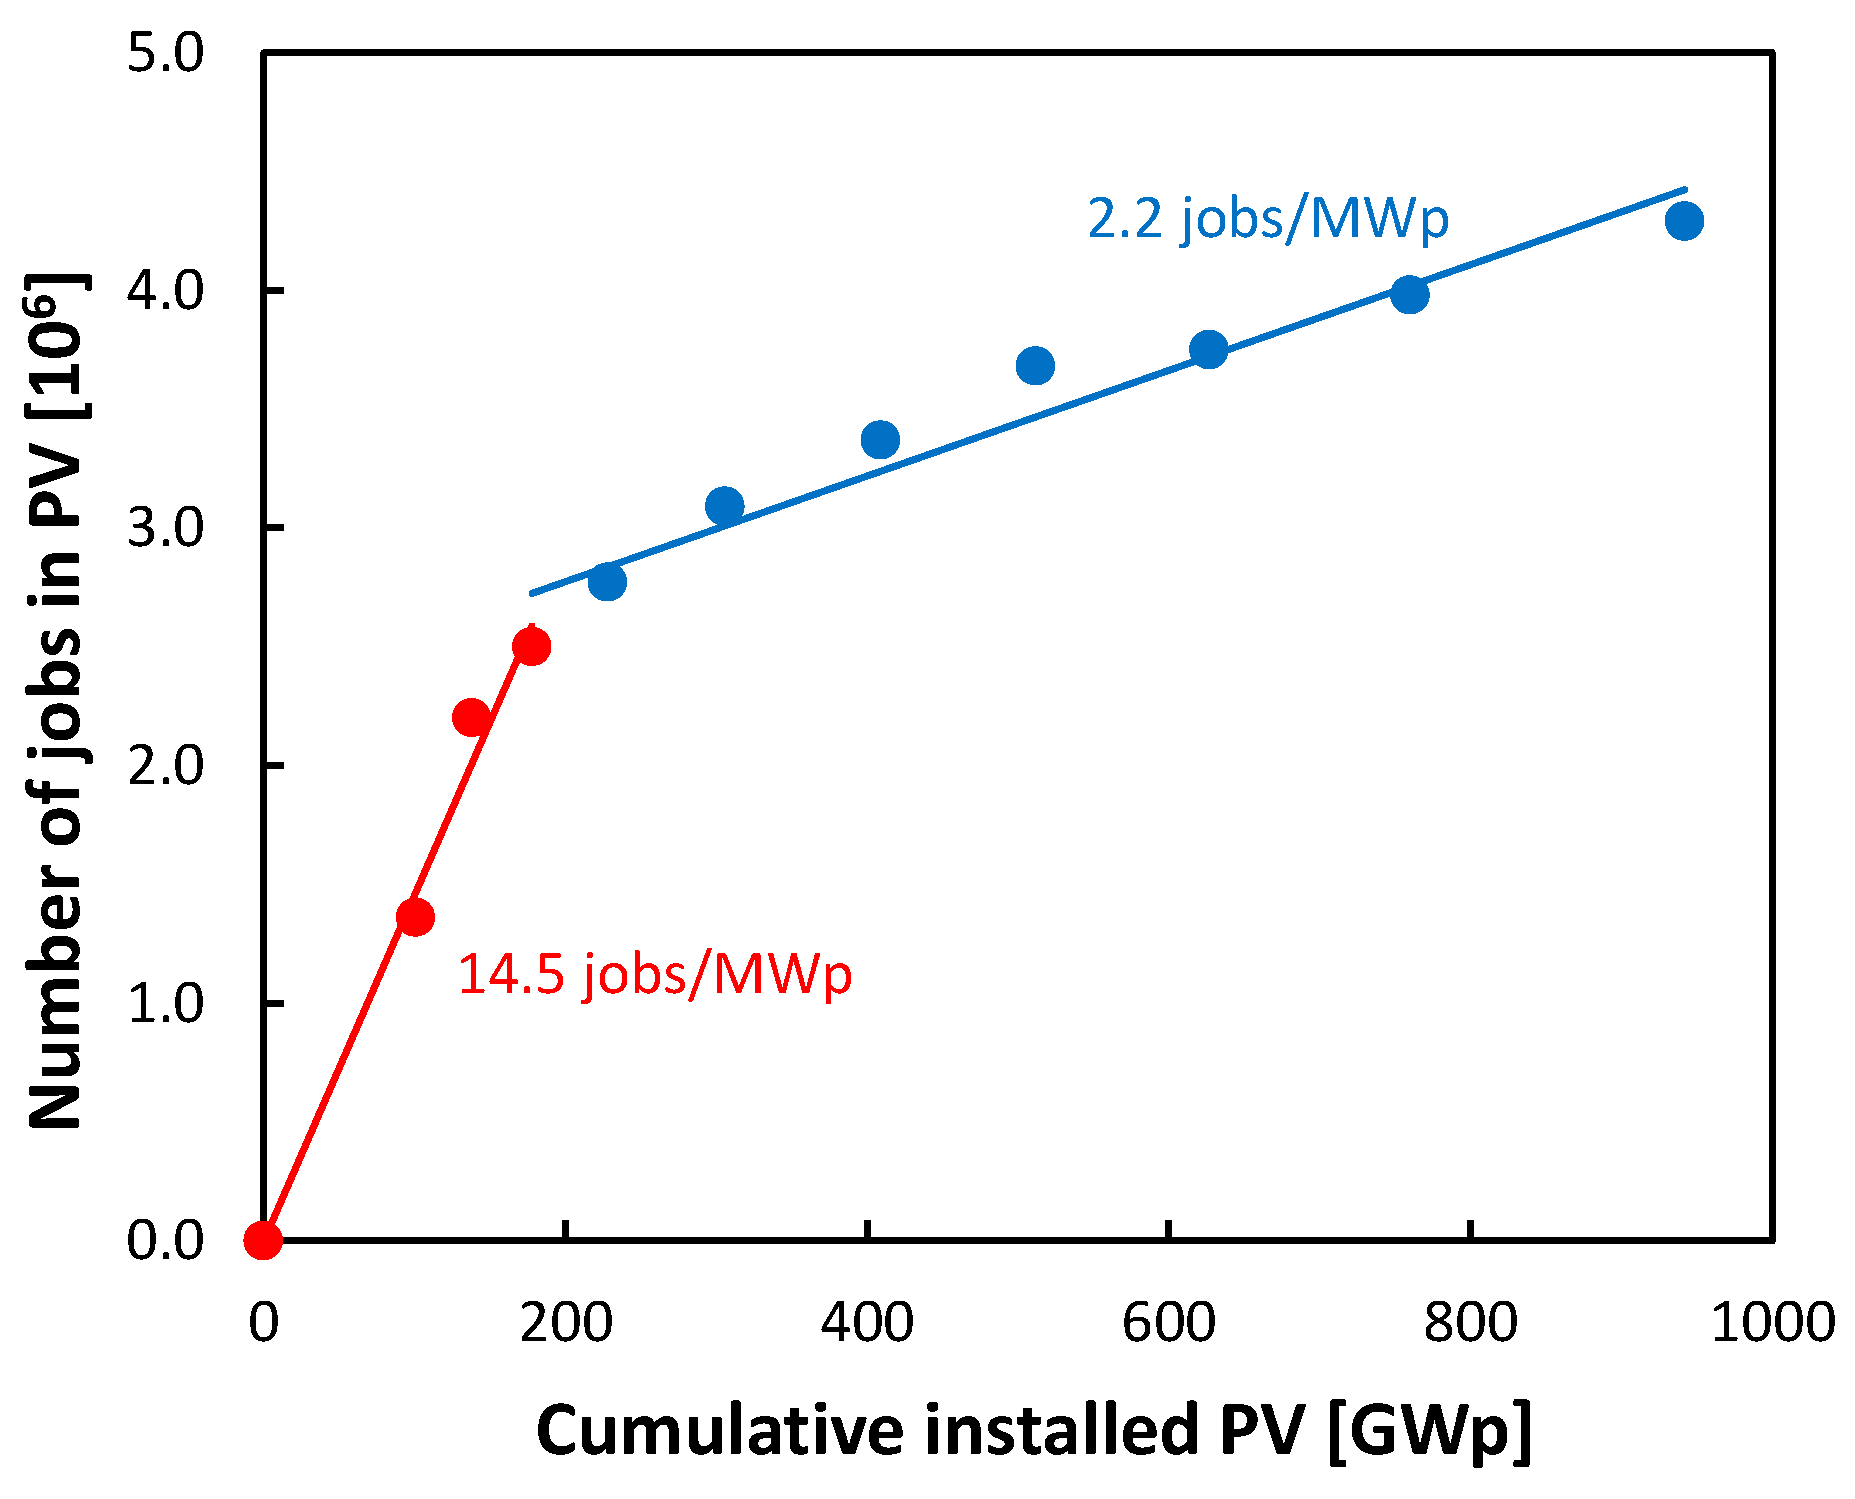
With the expansion of the PV field, the number of jobs in this field is increasing currently at a rate of more than 2 jobs per MWp installed PV power (see
Figure 3, where information from Page 118 in REN21 [
38] and Page 11 from IRENA [
39] has been considered). According to the annual review of IRENA [
39], since 2013, more than 250,000 jobs have been created worldwide per year for solar PVs. Currently, the total number of direct and indirect jobs in the global photovoltaic sector is 4.3 million. For many jobs, at least some basic understanding of PV solar cells and PV systems is needed, implying a strong case for engineering education in this field. In addition, the largest PV potential is situated in areas of the world where access to high-level engineering education is limited. Therefore, both the increase in the number of people intending to work in the PV field, as well as the access to engineering education, are valid motivations for the development of education in this field.
At the Delft University of Technology, a PV profile consisting of a set of courses has been developed with the aim of educating (young) engineers for the societal demand for PVs everywhere. This profile consists of a so-called MicroMasters developed for the Extension School of the Delft University of Technology by the research group Photovoltaic Materials and Devices. In this MicroMasters, students with a relevant undergraduate engineering background follow online master-level courses, starting from fundamental concepts in the online course of Photovoltaic Energy Conversion to more advanced aspects in the courses of Photovoltaic Technologies and Photovoltaic Systems. These courses are based on accredited on-campus versions that run in master programmes at the Delft University of Technology. On top of the MicroMasters, a range of courses is offered that enables students to deepen their knowledge and skills in specific topics, preparing students for particular positions in the PV field.
Both the MOOC and the MicroMasters courses are in high demand (>half a million learner enrolments), including students from developing countries. An analysis of the data has shown that 25% of the participants are students, whereas 75% are professionals who are working (sometimes for knowledge uptake, sometimes while considering changing their careers). Participants of all ages (from 16 up to 79) have followed the MOOC. In 2013, only 16% were female, and since 2013 we have seen the relative female participation growing from 1% per year to 25% in 2022. One of the latest courses designed and offered during the COVID period is Virtual PV lab, in which the on-campus exercises of the PV education lab are mimicked in an online environment.
The impact of online education is that one can reach out to a significant number of learners who, for various reasons, do not have access to a high-quality education on solar energy. Thanks to the knowledge provided in the online courses, some learners improved their access to electricity by constructing their own photovoltaic systems at home or in their villages. They were empowered to become local game changers. Among many other instances, the impact of online courses can be observed through various examples, such as learners being motivated to establish their own businesses in the solar energy sector, creating specialized financial products to expedite the integration of solar electricity, utilizing the educational materials to teach solar electricity in their respective regions, initiating BSc and/or MSc programs focused on the energy transition, and making career transitions to work in the solar energy industry.
5.2. Science-Based Tools
5.2.1. SolarCity Simulator—IRENA
Through the Global Atlas for Renewable Energy initiative, IRENA supports countries in their transition to sustainable energy systems by developing web-based geospatial information tools for renewable energy assessments. These tools, which include the SolarCity simulator, provide countries with the knowledge to inform renewable energy project planning, policy design, target setting, and market development.
The SolarCity simulator (solarcity.irena.org, last visited on 30 November 2023) assists cities seeking to access affordable and reliable energy from rooftop-mounted solar photovoltaic (PV) systems, lower their carbon footprints, and encourage community participation in the energy transition. The simulator is designed to help households, businesses, and municipal authorities evaluate the prospects for generating electricity and revenue from such installations.
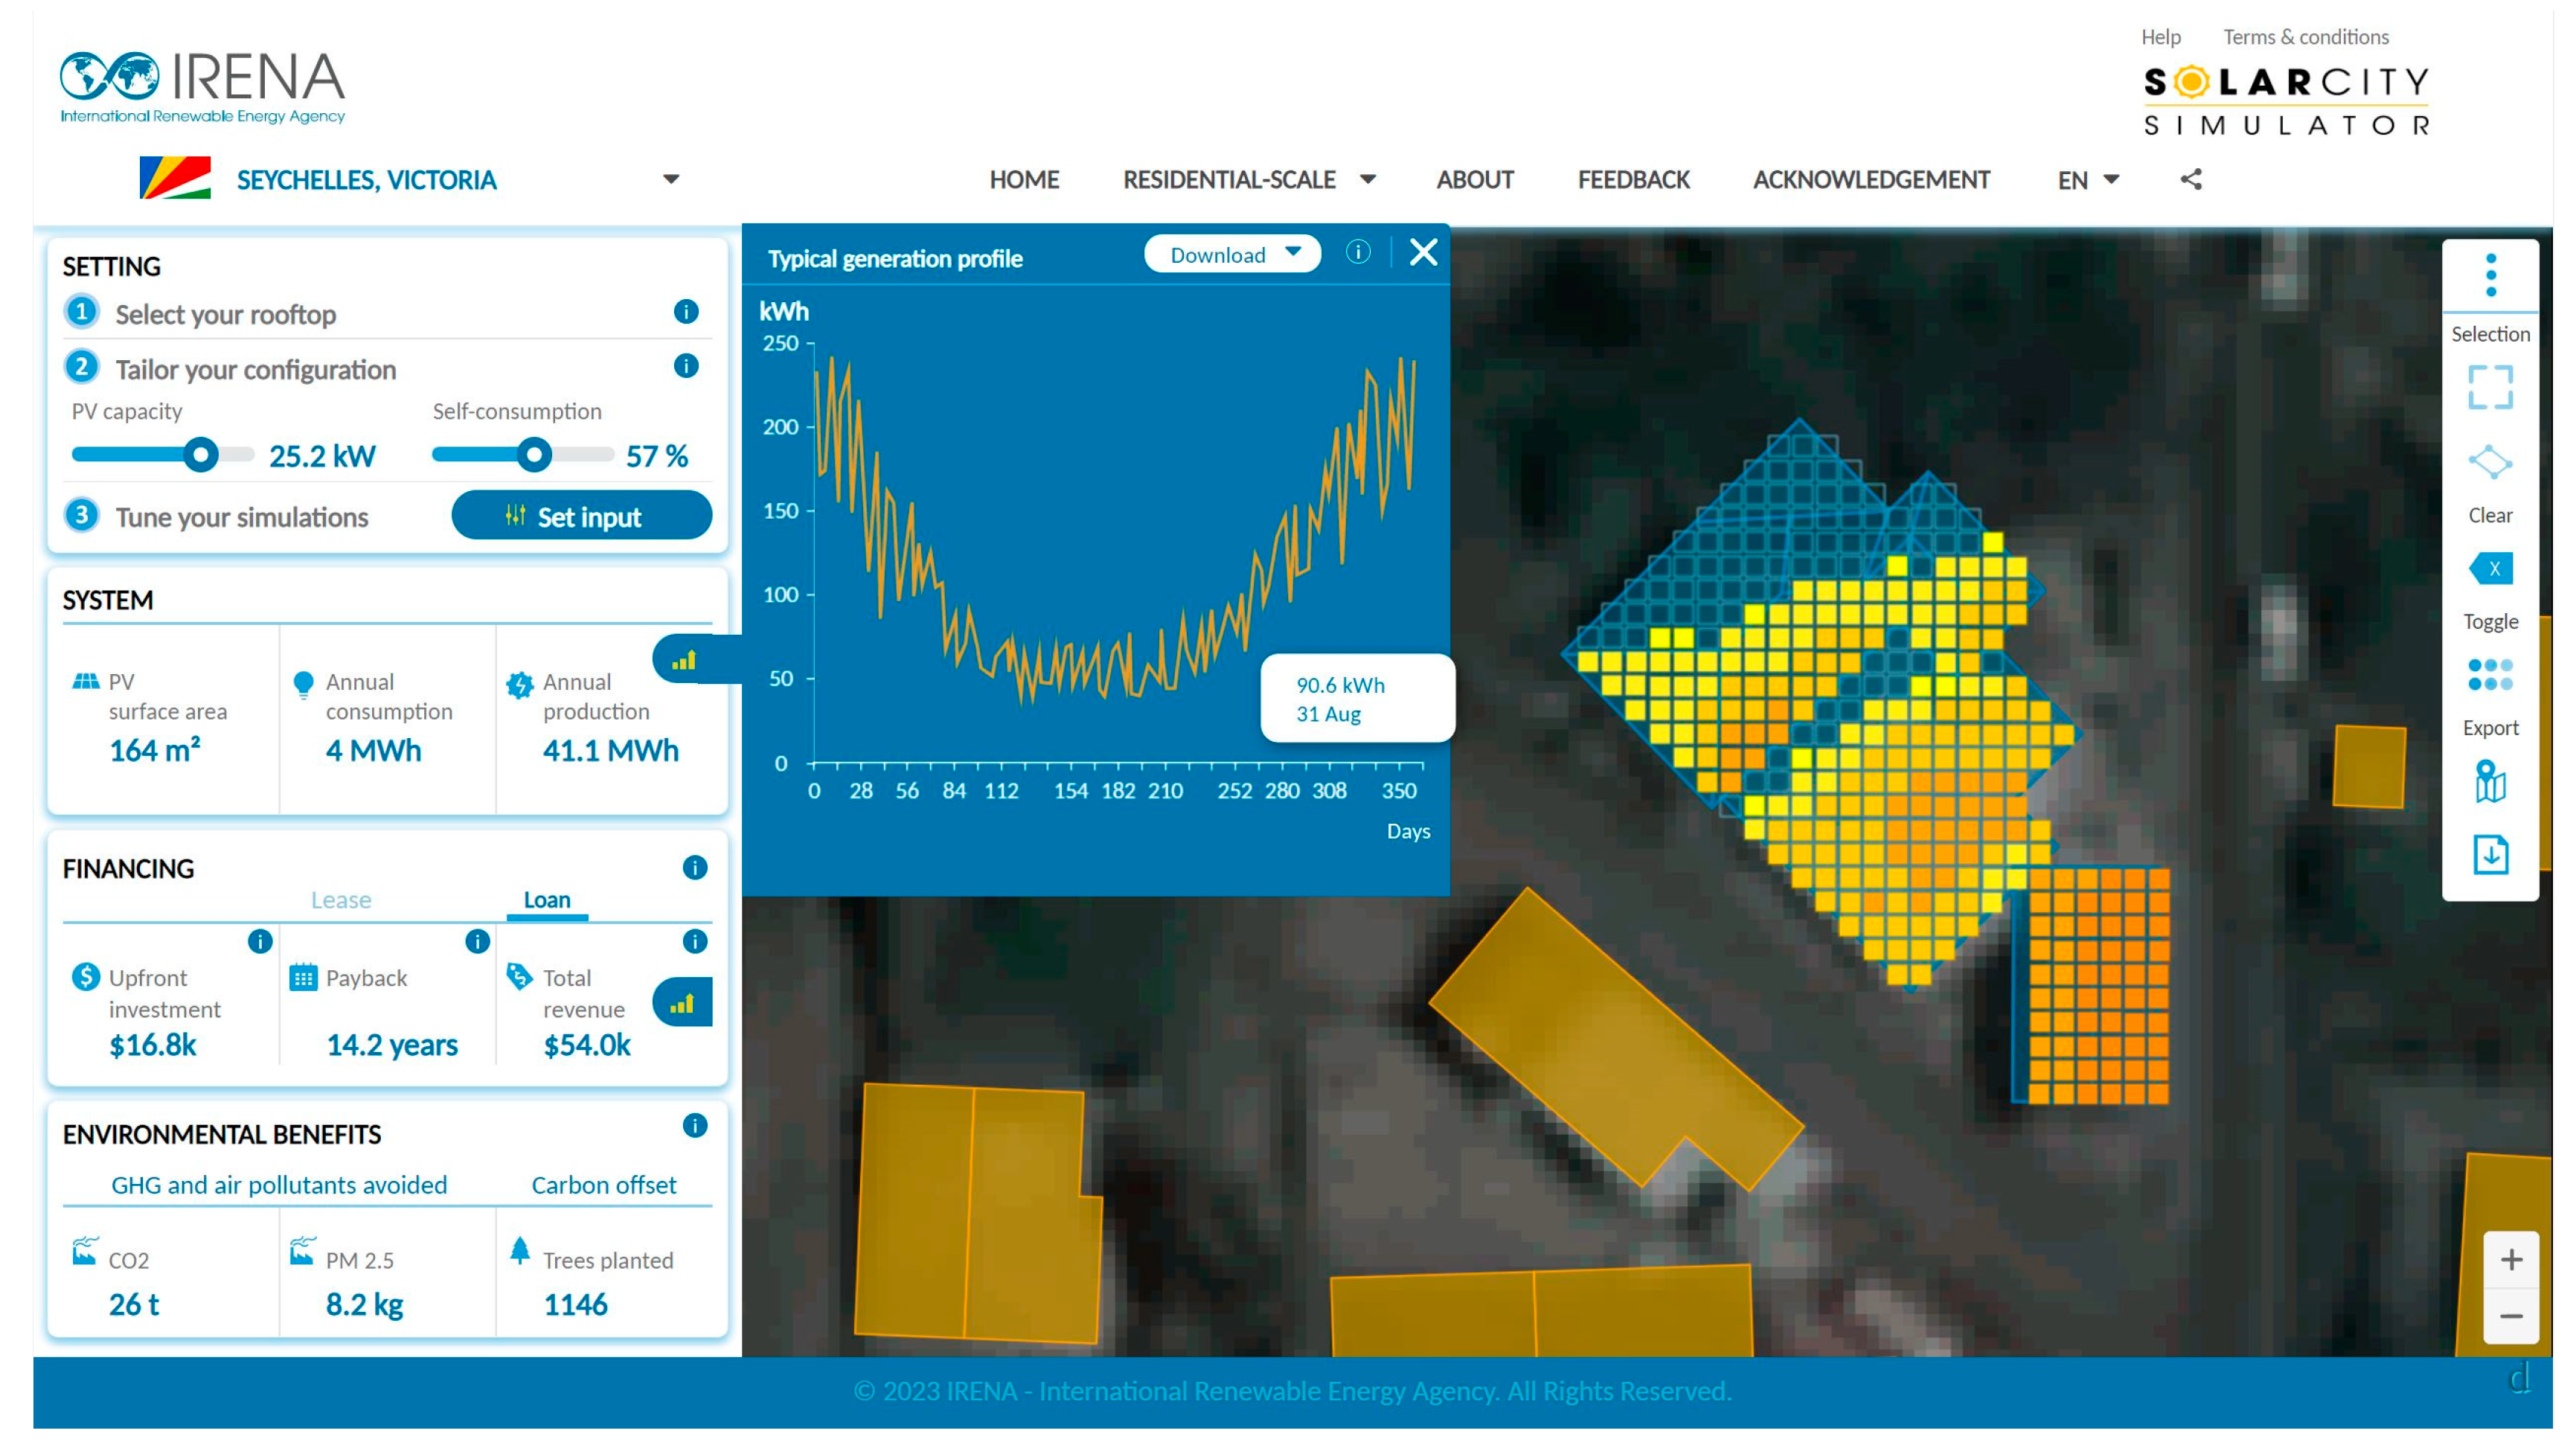
Figure 4 shows a screenshot of the graphical user interface of IRENA SolarCity simulator.
The simulator maps solar energy potential at high spatiotemporal resolution to support project planning and development at the city level. It allows users to assess: (i) the technical potential for different installation scenarios (capacity, panel efficiency, storage) to facilitate target setting; (ii) the financial potential for three case studies (homeowners, investors, governments) to facilitate solar program development; and (iii) the impact of different policy interventions (feed-in tariffs, subsidies, tax credits, and net-metering) on the rooftop solar PV market, as well as their associated social and environmental benefits.
The SolarCity simulator methodology utilises:
A power generation model to estimate the hourly electricity production for each square metre of a given rooftop, based on the city’s typical solar resource profile and 3D building footprint obtained from high-resolution satellite imagery, while also considering the shade and building orientation.
A simplified financial model to calculate a range of economic indicators, such as the payback, equity internal rate of return, and investment cash flow, based on the city’s local context.
Simple metrics to estimate the socio-environmental benefits of sourcing electricity from rooftop solar PV systems, such as the annual avoided carbon emissions, the equivalent number of tropical trees planted, the equivalent number of cars taken off the road, and the number of jobs created.
This methodology has been deployed cost-effectively worldwide, including in locations where the solar potential is high but underutilised. The simulator was first implemented for the districts of Kasese in Uganda and Chongli in China. The methodology has since been scaled up for application in other cities and geographies, including the coastline of Antigua and Barbuda, San Salvador in El Salvador, Bamako in Mali, Port Louis in Mauritius, Ulaanbaatar in Mongolia, Port Louis in Mauritius, Simra-Birgunj in Nepal, three markets in Nigeria, Castries in Saint Lucia, Sao Tome in Sao Tome and Principe, Victoria in the Seychelles, Khartoum in Sudan, Sahinbey in Türkiye, and Abu Dhabi island in the United Arab Emirates.
The next phase in the development of the SolarCity simulator will see a scaling up of the methodology to support more cities, with a view to accelerate the deployment of rooftop solar PV systems. New functionalities will also be integrated within the business case study to further support decision-making, together with improvements in the localisation of buildings and the visualisation of outputs.
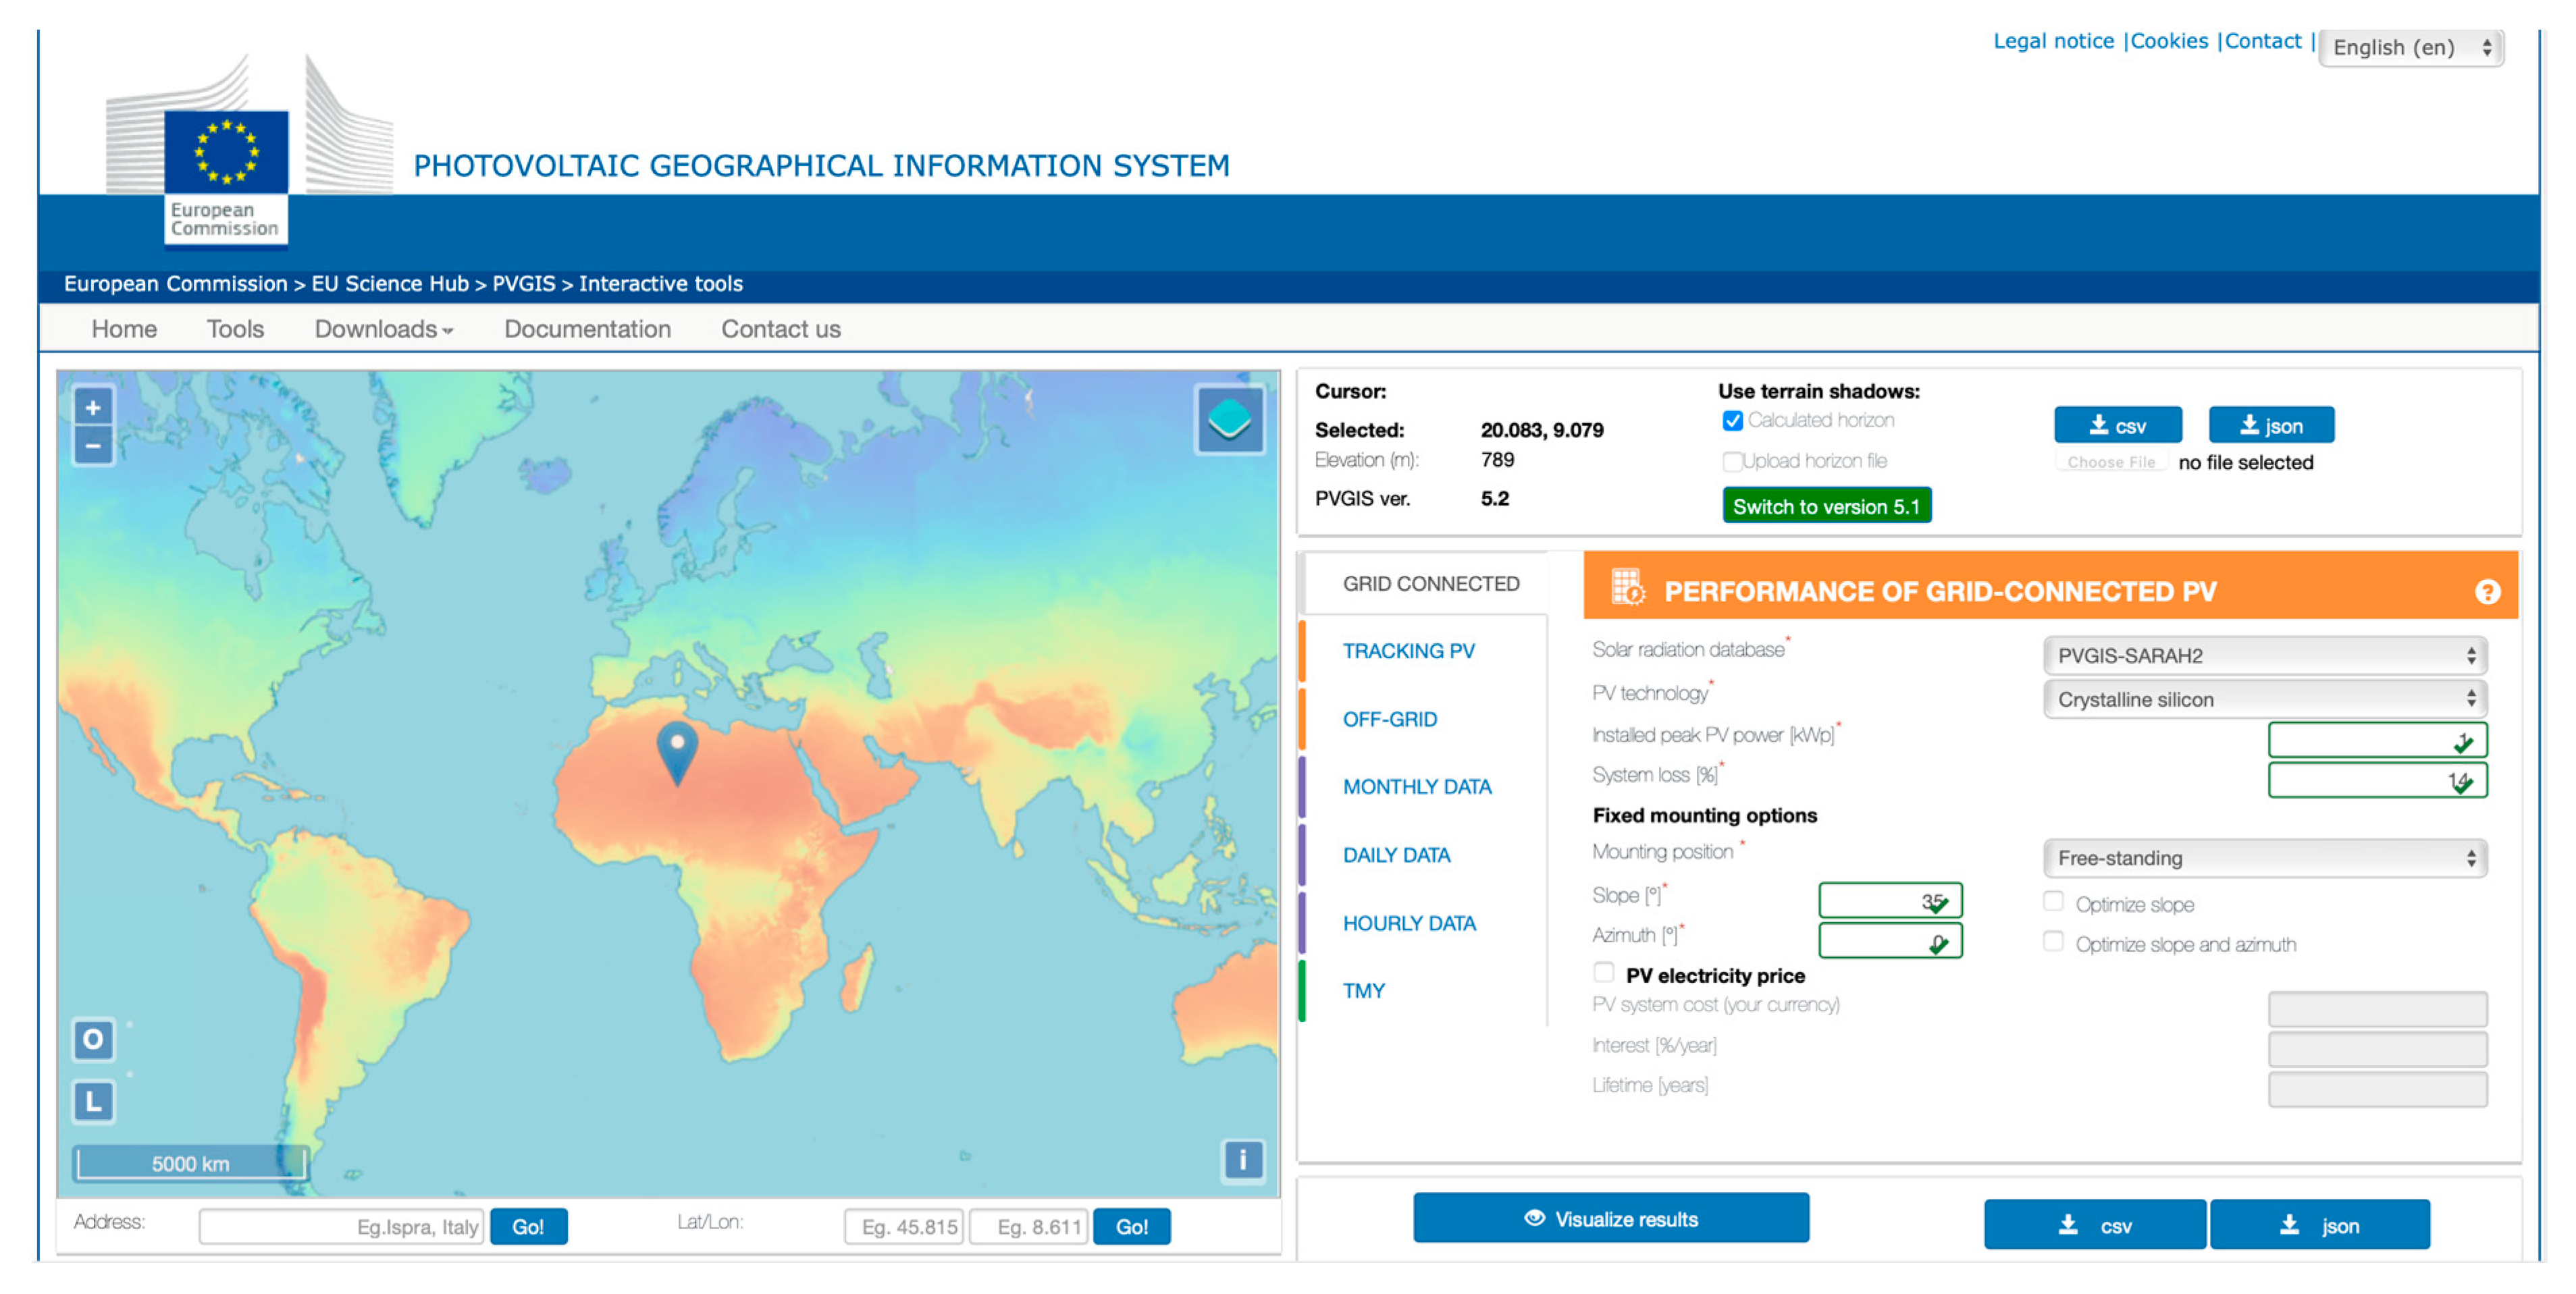
5.2.2. The PVGIS—JRC European Commission
The Joint Research Centre of the European Commission has been supporting the uptake of photovoltaics for more than 20 years with its online Photovoltaic Geographical Information System (PVGIS, re.jrc.ec.europa.eu, last visited on 30 November 2023). Today, this is even more relevant in view of the EU’s commitment to a 55% greenhouse gas reduction by 2030, which requires at least a three-fold increase in the installed PV capacity, and the new commitments in the EU Solar Energy Strategy 2022 [
13], for the European Solar Rooftops Initiative and for the EU building Renovation Wave [
40].
The PVGIS is a web application that allows citizens to extract PV-related data for any location in most parts of the world. More specifically, it provides PV production estimates for different technologies, hourly or aggregated solar radiation, and Typical Meteorological Year (TMY) data. The user can add battery capacity as an additional option including the power consumption profiles in order to assess the viability of battery storage.
Figure 5 shows a screenshot of PVGIS frontend.
It is available for free in five languages (English, French, German, Italian, and Spanish), with no need to register. In addition, it provides an API for more automatic access and for large-scale requests, to create maps, and to embed it into other tools.
The PVGIS started off using ground station data that was 3D interpolated to cover wider areas. The accuracy, spatial, and time resolution have increased over time, thanks to the incorporation of better satellite and reanalysis products that were gradually made available. In 2022, a new release of the PVGIS, version 5.2 [
41,
42], has been made available to users, providing worldwide coverage and more accurate and updated datasets from CMSAF SARAH2 and ECMWF ERA5. Most climatic variables are now obtained from ERA5-Land. This has required a set of data transformation routines to convert the data sources into PVGIS datasets, as well as a patching routine to cover the coastlines with interpolated data from ERA5.
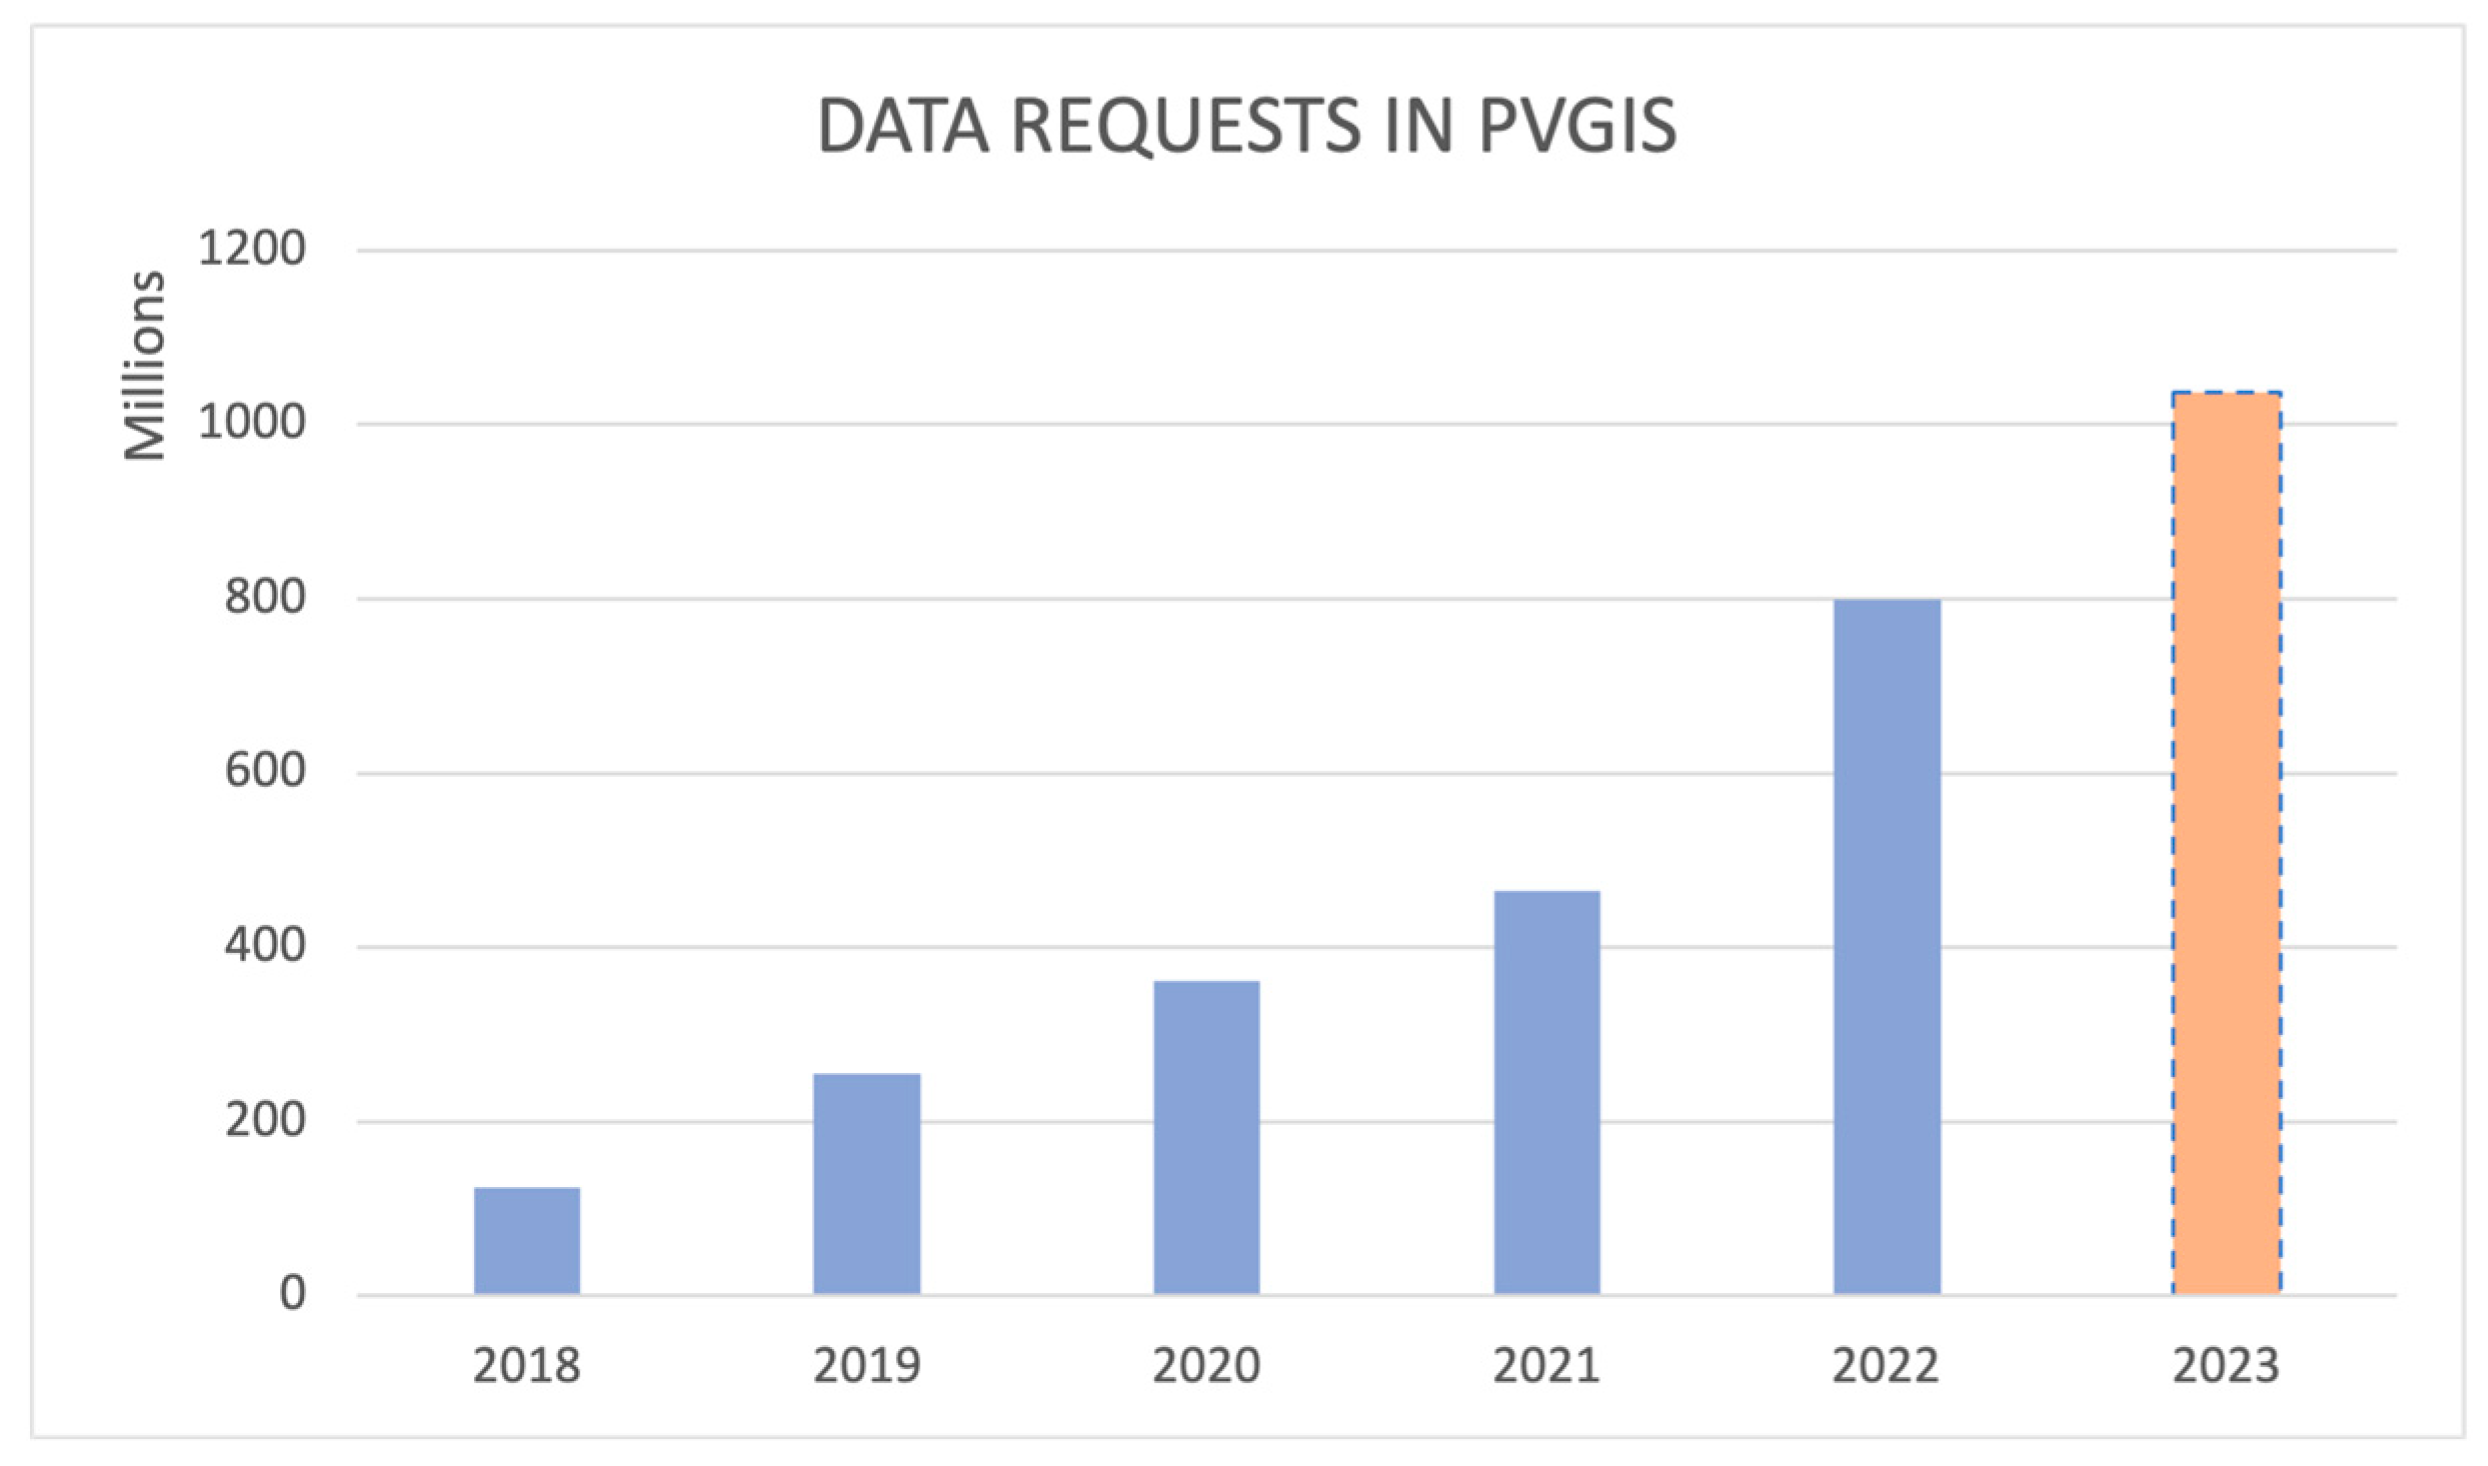
The PVGIS already has a 20-year successful track record. Additionally, its use has significantly grown in 2022, with 6 million unique users and almost 800 million hits, which represents an 85% and 72% increase, respectively, over 2021.
Figure 6 shows the progress in terms of unique users from 2018, the moment from which statistics started to be collected.
As the PV sector grows rapidly, independent, publicly accessible, and free-to-use information sources remain important for citizens and communities all over the world. The PVGIS is a pioneer tool that has become a reference in the sector. Its results can be used as an independent source both for users, installers, and even project developers.
5.3. The Added Value of Considering Local Communities
To offer a snapshot of the role that data-driven tools play in energy policy design and energy planning, we present here examples of three EU-funded initiatives aimed at supporting the development of the energy sector in Benin.
Benin has identified access to modern energy as being key to its economic and social development. Since 2016, the Government of Benin has embarked on a sector reform that has seen a real transformation of the legislative and regulatory framework, promoting sustainable investments in energy infrastructure, including the private sector, and reinforcing its political guidance and the management and control capacities of the state-owned entities in charge. The objectives of the Government Action Program (PAG) from 2021–2026 are highly ambitious: (i) the rate of self-sufficiency for electric energy production is set to increase from 60% in 2020 to 116% by 2026, which means that Benin would transition in this time-frame from an electricity importer to an exporter; (ii) access to electricity is set to increase from 36.45% in 2020 to around 44.40% by 2026; and (iii) the share of renewable energy in the energy mix is set to increase from only 2% in 2020 to 39% by 2026 (Benin national statistics, Directorate-General for Energy Resources, 2020 and Benin’s PAG 2021–2026 [
43]).
Solar energy is of major importance in achieving all of these objectives, given the country’s significant solar potential. Solar energy in Benin is available and well-distributed across the country with a certain consistency throughout the year, despite a seasonal variation of about 16 to 17% on average. The map of the annual Horizontal Global Irradiation of Benin over the period from 1994 to 2018 shows an annual average of 2045 kWh/m2 in the north, 1826 kWh/m2 in the centre, and 1753 kWh/m2 in the south. This leads to an average annual potential of 1607 kWh/kWp in the north, 1461 kWh/kWp in the centre, and 1314 kWh/kWp in the south (Atlas of renewable energies of Benin, 2023). While the penetration rate of solar PV energy in Benin’s energy mix is still low, the commissioning of the solar PV power plant of 25 MWp in Illoulofin (Defissol project) in 2022 has brought important progress. Further advances will be made with the planned doubling of its capacity by 2024 and the upcoming commissioning of four solar PV power plants in Bohicon, Parakou, Djougou, and Natitingou for a total capacity of 50 MW.
In line with the priorities of the Government of Benin and with SDG 7, the European Union’s cooperation in the energy sector in Benin intervenes at two levels: (i) it promotes investments in access to electricity, renewable energies, and energy efficiency, and (ii) provides institutional support and capacity building for the benefit of the sector’s main actors. Through the program of capacity building RECASEB [
44], the EU is financing two projects aimed at developing tools to support decision-making and strategic orientation in the sector and facilitate open access to information and documentation:
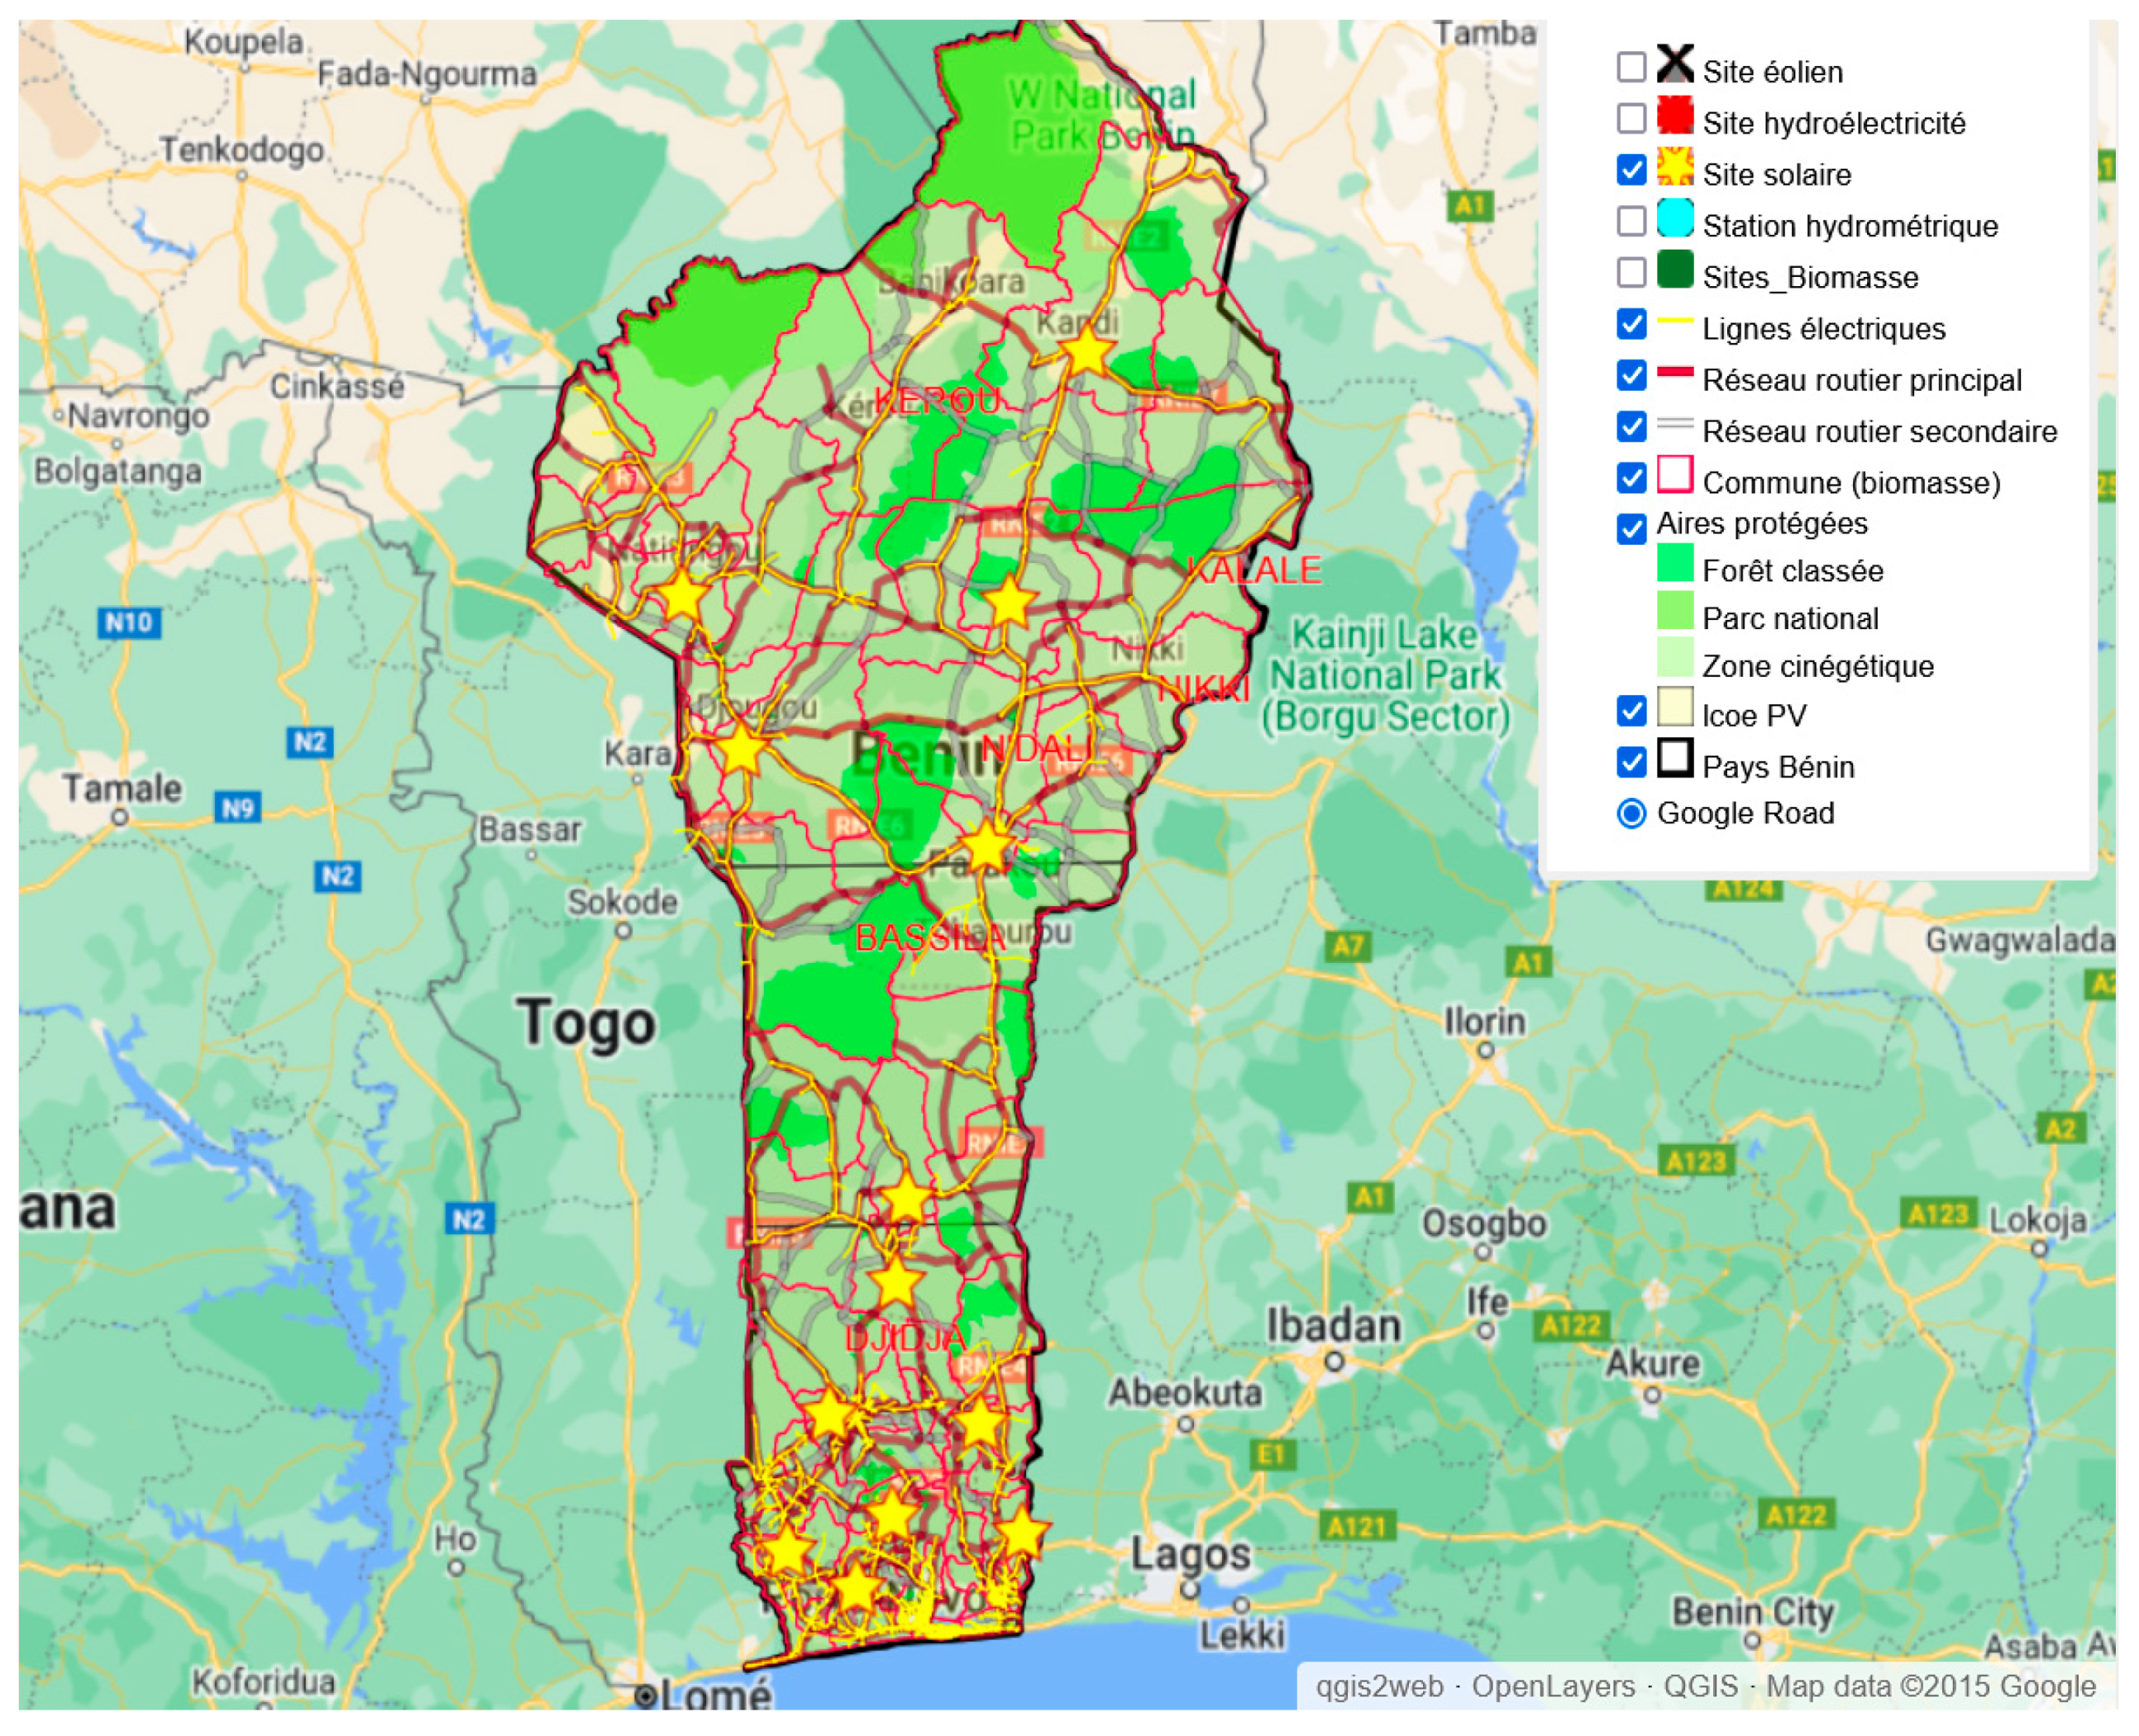
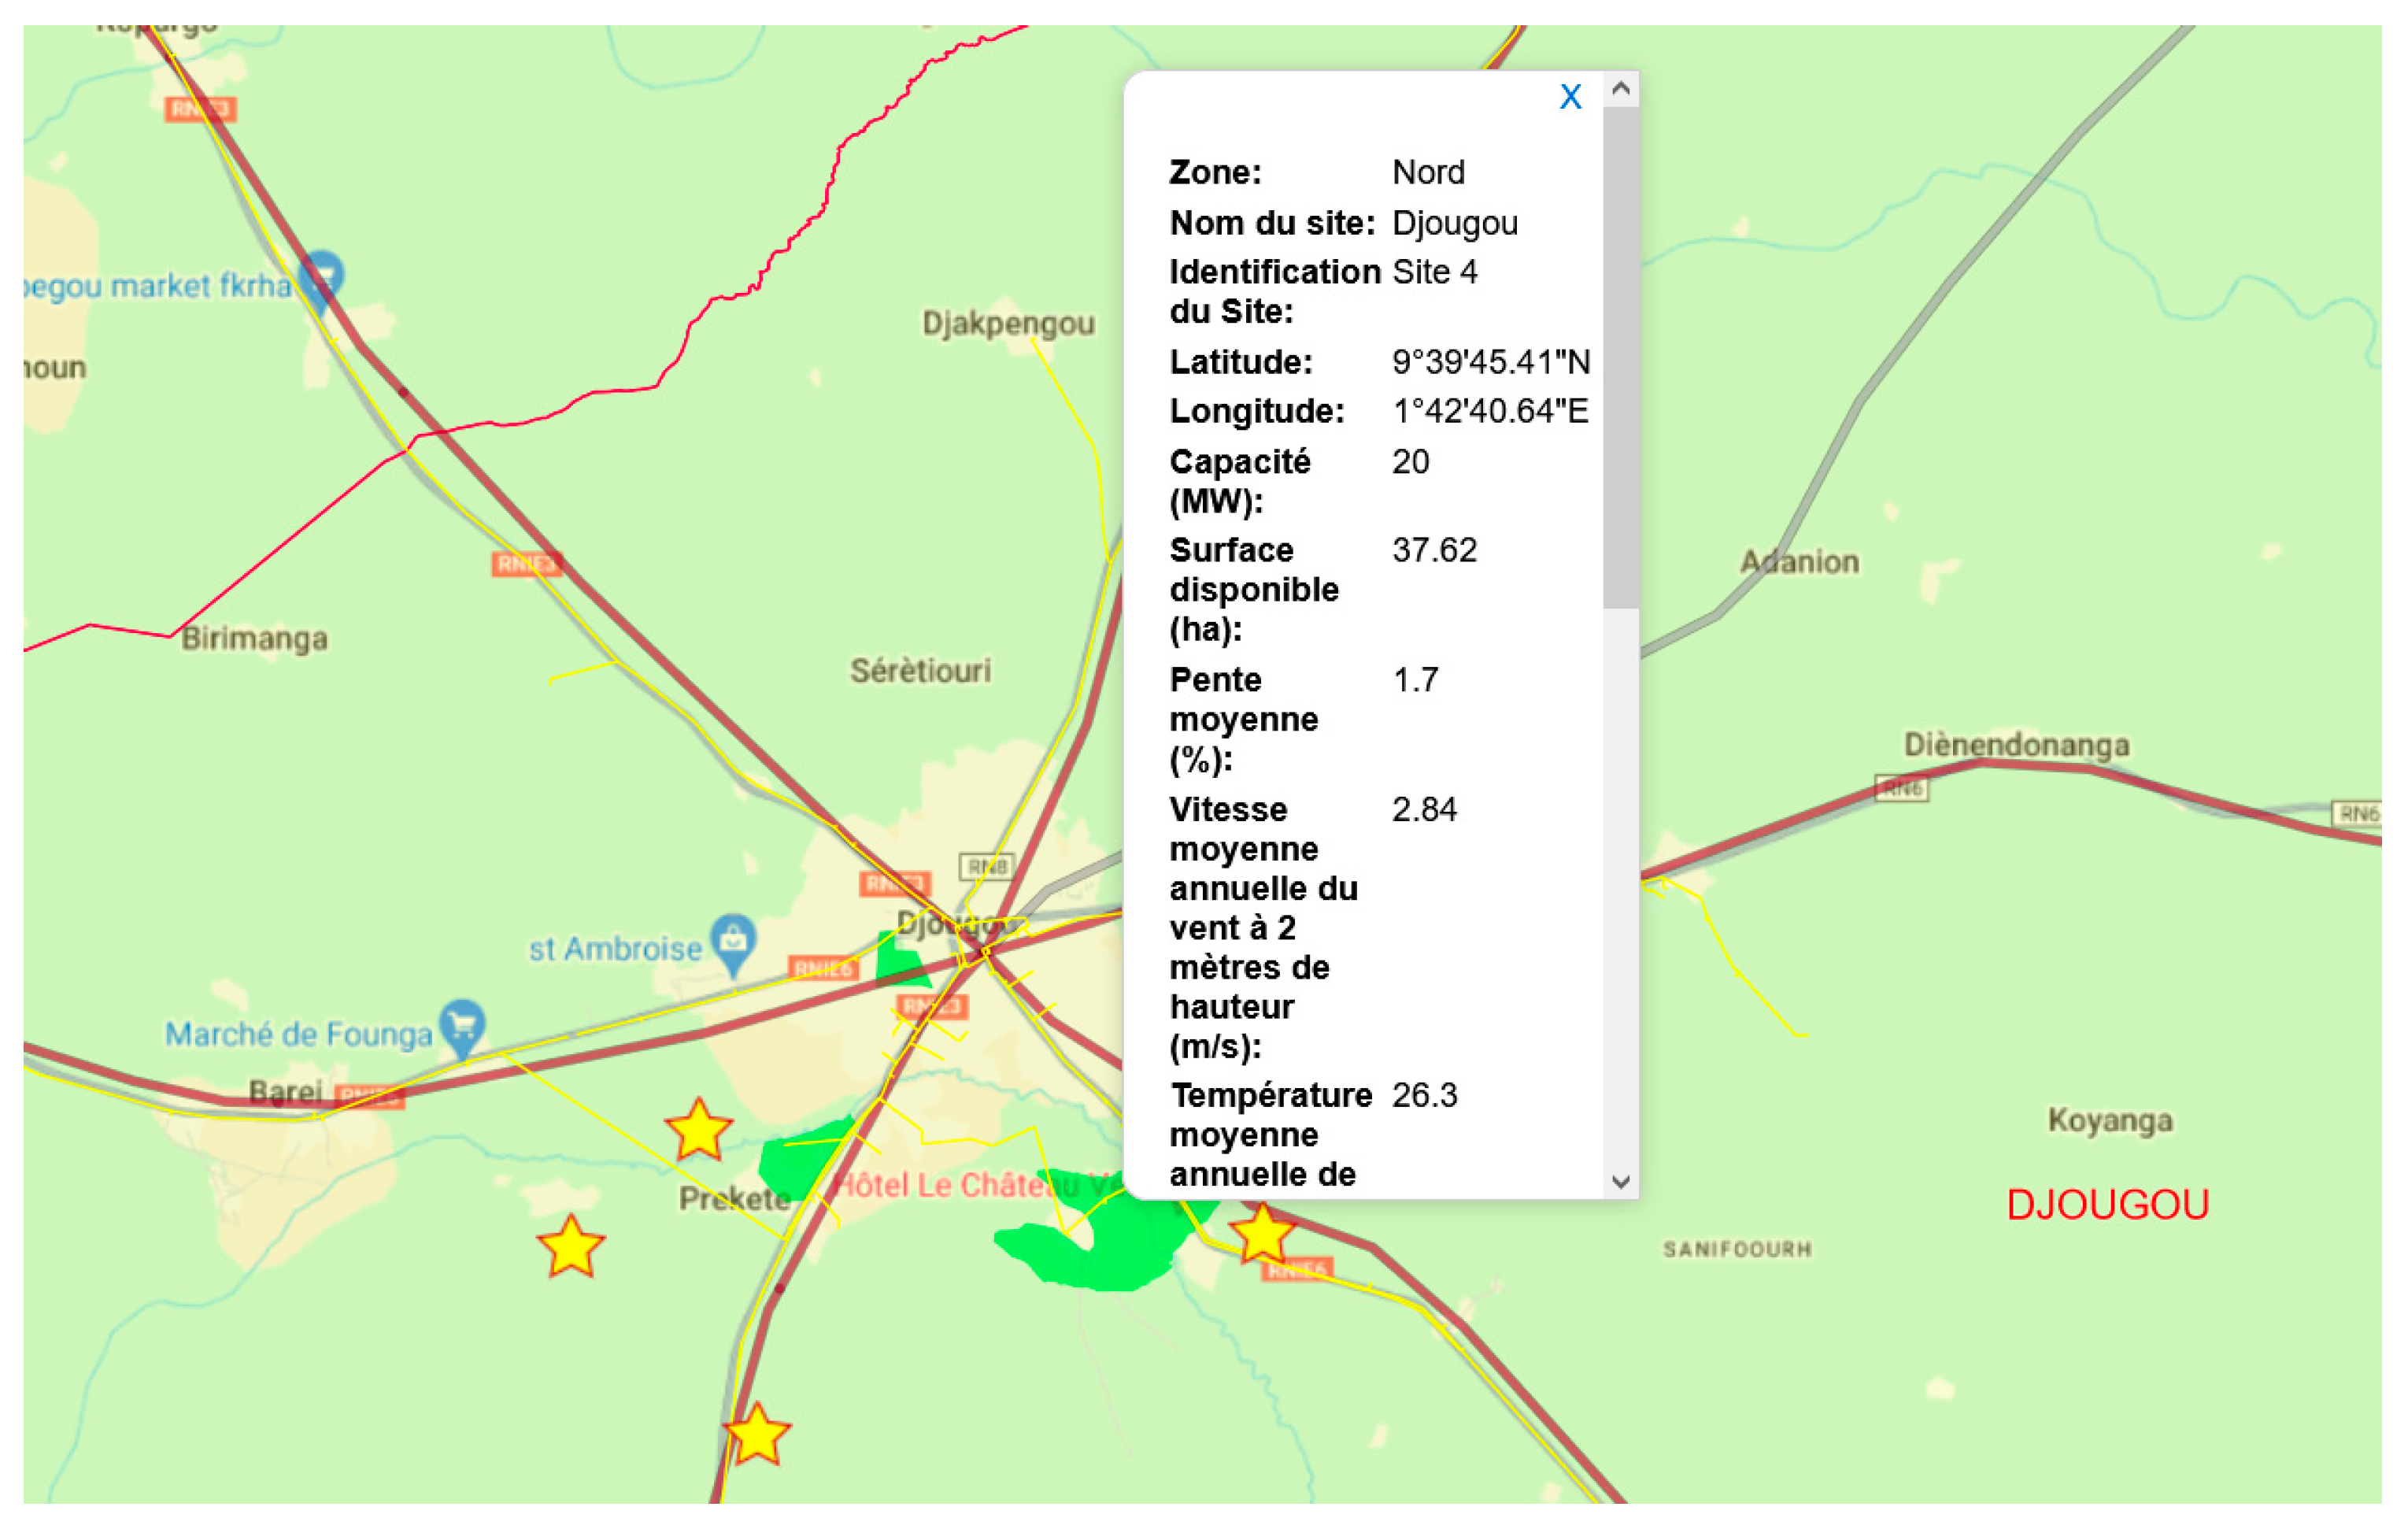
The Study on the Atlas of renewable energies of Benin [
45] has developed a detailed mapping of relevant renewable energy sites (solar, micro-hydro, wind, biomass, tidal) and proposes, in line with national sectoral policies, the most attractive technologies for developers, particularly by determining their levelized cost of electricity (LCOE). The government can use the Atlas as a database of bankable renewable energy projects when setting its priorities, while donors, investors, and developers can use it when targeting specific technologies and/or areas of intervention. To further increase the benefit of rendering the tool accessible to all concerned actors, an interactive website accompanies the Atlas. A multi-criteria analysis of solar PV potential in the three climatic zones of Benin led to the pre-selection of 25 potential sites in the northern zone, 18 in the central zone, and 36 in the southern zone suitable for the implementation of solar PV power plants of between 5 and 50 MWp.
Figure 7 and
Figure 8 show how the Atlas of renewable energies of Benin can be used to map selected PV solar sites and what type of information is made available for a potential PV solar site.
The project of the National Energy Information System in Benin (SINEB) [
46] has developed and will operationalize an open data-oriented platform to share information and documentation related to the country’s energy sector. The SINEB will also be an online tool for the government to elaborate on the sector’s development strategy and the monitoring of its implementation, including through the elaboration of the country’s annual energy balance sheet. It will allow for a faster and more efficient collection of data, harmonized methodologies, and therefore, more reliable data and statistics. The system will be managed through contribution and validation profiles but will also be open to the public.
It is key that the PV mapping tools are adapted to local contexts and that they integrate into their design the needs of local actors at all levels—decision-makers, project developers, investors, and consumers. The involvement of all actors and a certain degree of ownership-taking can further ensure the accuracy of the tools, their suitability for the intended users, and their high utility and durability. Both tools have therefore been developed under the supervision of the Directorate for Energy Planning, Rural Electrification and Regulation (previously, the Directorate-General for Energy Resources) of the inline ministry, and through a participative approach, with the involvement of all concerned structures, and the consultation of donors and financing institutions. Particular attention was given to providing training and capacity-building support to the teams of the final beneficiaries and ensuring the transfer of know-how of the tools’ proper maintenance and upgrade.
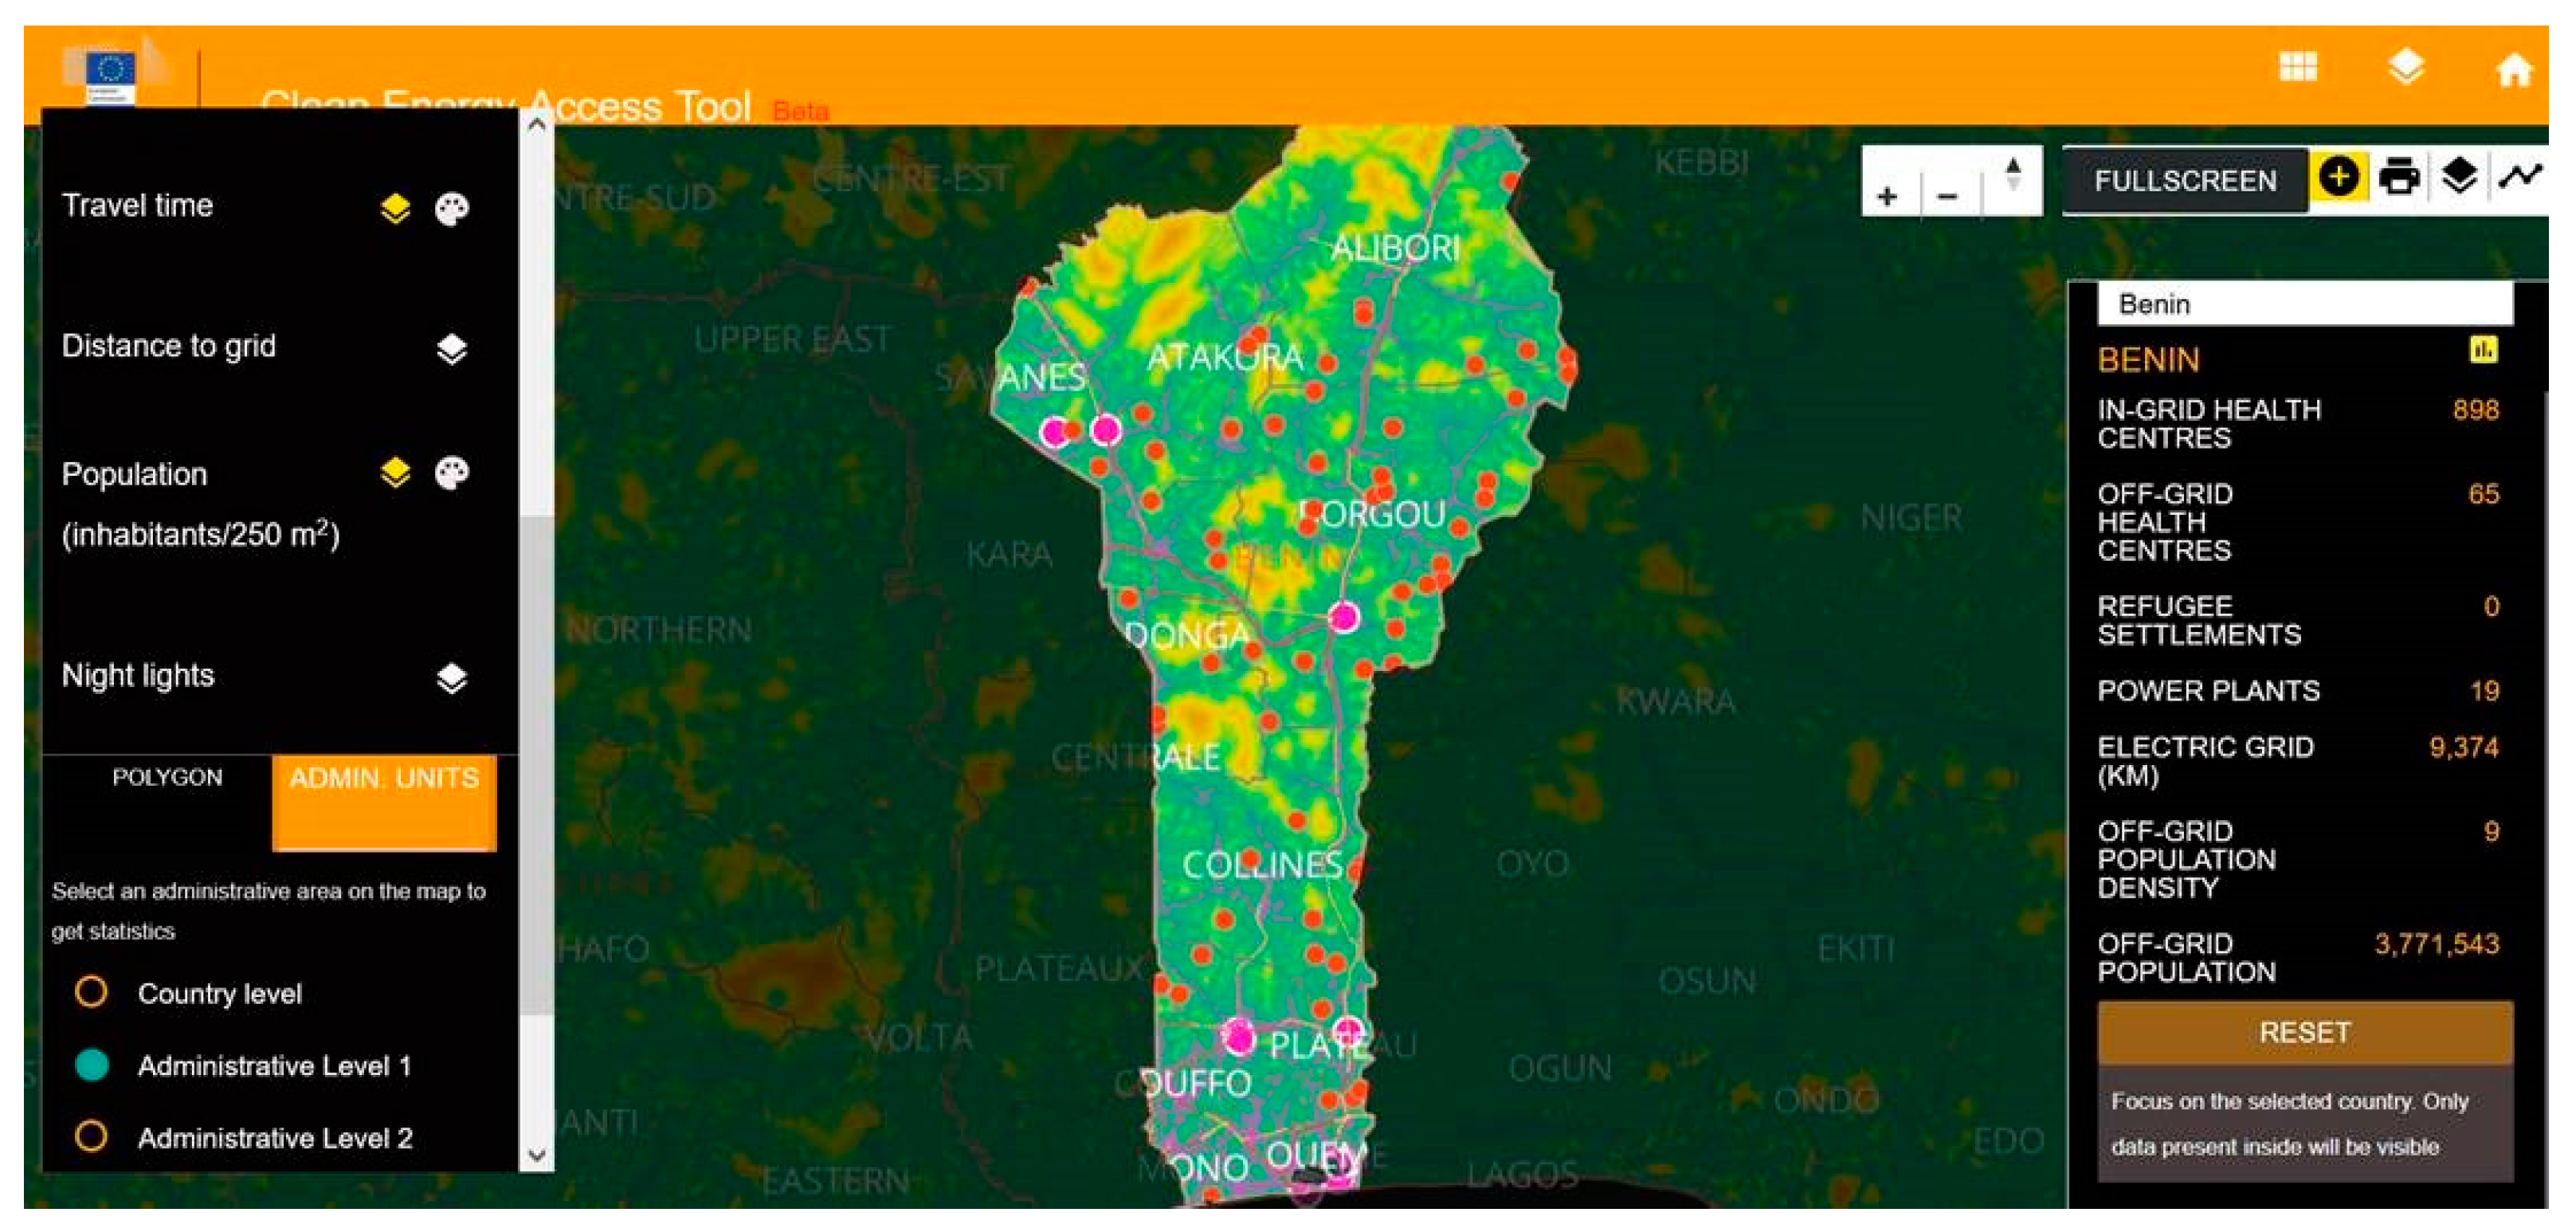
Benin has been selected as a pilot country to test the open-access Clean Energy Access tool [
47,
48] developed by the JRC in the framework of the Africa Knowledge Platform [
49]. The tool focuses on the electrification of health centres in Benin (see
Figure 9), providing a cost estimation of the health centres’ electrification with PVs and autonomous battery systems, an estimation of the power demand, and allowing thus for the optimization of PVs and battery size to meet the demand. The raw data used derives from articles, studies, and open source data, combined with data from other ongoing projects on the ground and benefitted from consultation with the Beninese Ministry of Energy, Ministry of Health, and the Agency for Sanitary Infrastructure, Equipment, and Maintenance. The tool can be further extended to cover educational centres and other consumers, depending on their needs, and shows a high potential for contributing to the preparation of the project for the electrification of 750 socio-community infrastructures, which is identified as a priority project in the PAG 2021–2026.
6. Discussion
At the end of the COP27 event on PV resources towards climate neutrality, attendees were asked to provide ideas about how they thought the impact of PV mapping could be improved. The answers included the use of better data, local best practices, the engagement of local communities, education, and an increase in weather stations. From the event, it was highlighted how 75% of the world’s population lives in an area that has good solar potential, the solar belt, with a rather uniform distribution throughout the year [
50]. There is a need to translate that into actual deployment with a strong emphasis on simplified educational concepts and easy access to PV resource information, which was covered during the event. Additionally, it is crucial to consider the local circumstances and available resources when implementing these initiatives, the specific needs of urban and rural environments, the off-grid systems, and a special focus on educational and health facilities for, e.g., sub-Saharan Africa. Financing, permitting, and stakeholder involvement are very important, and we believe information systems and education can be a powerful way to create confidence in PV investments.
During the stakeholder discussion, many of the complementarities between the online science-driven tools for electrification, resource mapping, and remote teaching were highlighted. Online training could obtain location-specific information that can be fed into the tools, and the tools could be excellent means for certain aspects of the online trainings. In order to explore this in more detail, following the COP27 side event, with the help of selected experts who are contributing to this perspective article, we performed a SWOT analysis for both domains to identify the concrete cooperation possibilities. The relevant information was collected in a SWOT structure to better organise the different perspectives of the stakeholders to enable optimal policy strategies to move forward. It is not based on a large sample of statistical data (the overall participant numbers were 100+, and the sample representativeness cannot be guaranteed in an event like this), but rather it reflects the experts’ opinions on ranking their inputs. We selected the SWOT analysis as it presents the preference structure in a plausible way in cases where collecting large sample statistical data is not possible. Thus,
Table 1 presents the strengths, weaknesses, opportunities, and threads of online science-driven tools; whereas
Table 2 focusses on Remote training.
Based on the qualitative outcomes of the expert meeting and the follow-up SWOT analysis, we identified substantial additionality in a number of impact pathways of the two methodological approaches of online GIS energy tools and remote training facilities for scaling up PV deployment, especially in developing country settings. We believe that using the two toolsets together creates synergies and additional growth in the following impact pathways:
In the case of the employment created by PV deployment, and in particular in the development of policy-setting, the positive effects on employment can partially be offset by the negative effects in the incumbent energy companies. The less-developed the incumbent energy sector, the less effects on employment will be offset. Additionally, the PV sector is usually characterised by a much higher women’s employment percentage compared to fossil-based energy, therefore, we can also estimate positive impacts in this regard.
During remote teaching, potential local knowledge can be accumulated that, if collected in an intelligent way, can be fed into the online tools and platforms. In turn, these can be used in the remote learning curricula. Realizing these synergies could be helpful for accelerating the socio-economic technological processes, adaptation and behavioural changes that are essential to scale up the photovoltaics and achieve the global climate-related goals overall.
In the case of emission reduction potential and capacity growth, the experts also pointed out the value of additionality effects, although it is difficult to make quantitative projections of the level of these synergies.
The tools have already been important for the expansion of renewables in development contexts and will become even more so as they can foster public acceptance, more residential PVs, energy communities, rural electrification, citizen engagement, and limit land-use competition.
The combination of remote learning and GIS and other tools (Africa Knowledge Platform, Energy Industry Geography Lab [
51], Environmental Insights Explorer [
52]) in synergies with Machine Learning, for the better analysis of resource potential and energy demand, will shorten the planning and investment periods to reach the optimal energy solutions. This could also help donors and international financing organizations set up more efficient, higher accessibility electrification schemes for PV-based development (e.g., off-grid systems as well as city-level electrification).
Furthermore, the use of Artificial Intelligence is disrupting the status quo in many domains, and we are convinced that this will also be the case for solar education and energy-related tools. The opportunities and challenges in education are currently a hot topic [
53,
54]. Machine Learning has already been used in the development of GIS planning tools and solar radiation products [
32,
55,
56,
57], but the recent development of deep learning models for image processing and publicly available large language models will facilitate the use of these techniques and increase the range of possibilities for development, e.g., enable the production of solar cadastres at a large scale, enable the estimation of more accurate predictions, increase the resolution of available data, etc. We are seeing, for example, an increase in initiatives leveraging Machine Learning and Big Data techniques to create building stocks at the European scale such as EUBUCCO [
58] or DBSM [
59], with individual building footprints that can enable more accurate estimates of photovoltaic potential at scale, especially combined with information on building height and orientation, rooftop type, etc. These digital building stock models can be further used for disaster risk management, the support of the development and assessment of policies related to energy performance on buildings, and the analyses of different what-if scenarios.
7. Conclusions
In this perspective paper, we have focused on the role of education and decision-support tools to speed up the deployment of photovoltaics. We have highlighted the importance of PVs in the efforts towards climate neutrality and the current context where concepts like public acceptance, energy communities, or land limitation are gaining relevance. We have showcased four initiatives in the context of education and science-based open tools that are contributing to facilitating the increase of solar PV installations in different ways: the solar programs at the DELF University of Technology, the solarCity simulator of IRENA, the PVGIS of the European Commission, and the Atlas of renewable energies in Benin. We have concluded with a qualitative SWOT analysis of both domains to identify the concrete cooperation possibilities. Science-driven tools and remote teaching were identified as two key sources of information creation and sharing domains that can have some positive synergic effects to help accelerate the deployment of photovoltaics by being mindful of local needs, providing adequate training, and helping increase the PV skillset of the workforce.
We have shown how the popularity of some PV-related support tools is growing in parallel with the growth of PV installations. Also, in recent years, the deployment of decentralised PVs is gaining importance, and for this reason, we believe that the popularity and impact of these tools and education initiatives, coupled with local expertise, will further increase in the following years.
Additionally, the future with AI assistance, Big Data technologies, and the increasing availability of more powerful computer resources should further accelerate this trend, allowing for, e.g., the achievement of higher accuracy and automation levels for most energy-related tools, which will help empower citizens and better inform decision-makers on the topic.
While in this perspective paper and related COP27 side event we could only present a limited number of examples in detail, we would like this to also serve as a motivation for other researchers to share their experience with examples of science-based tools and education for accelerating PV deployment.
Author Contributions
Conceptualization, A.M.M., C.T. and S.S.; writing—original draft preparation, A.M.M., C.T., S.S., I.G., R.v.S., A.T., A.J.-W., N.T. and A.S.; writing—review and editing, A.M.M., C.T., S.S., I.G., R.v.S., A.T., A.J.-W., N.T. and A.S.; visualization, A.M.M., I.G., R.v.S. and A.T. All authors have read and agreed to the published version of the manuscript.
Funding
This research received no external funding.
Data Availability Statement
Not applicable.
Conflicts of Interest
The authors declare no conflict of interest.
References
- IPCC. Global Warming of 1.5 °C. An IPCC Special Report on the Impacts of Global Warming of 1.5 °C above Pre-Industrial Levels and Related Global Greenhouse Gas Emission Pathways, in the Context of Strengthening the Global Response to the Threat of Climate Change, Sustainable Development, and Efforts to Eradicate Poverty; IPCC: Geneva, Switzerland, 2018. [Google Scholar]
- Haegel, N.M.; Atwater, H.; Barnes, T.; Breyer, C.; Burrell, A.; Chiang, Y.-M.; De Wolf, S.; Dimmler, B.; Feldman, D.; Glunz, S.; et al. Terawatt-Scale Photovoltaics: Transform Global Energy. Science 2019, 364, 836–838. [Google Scholar] [CrossRef] [PubMed]
- Haegel, N.M.; Verlinden, P.; Victoria, M.; Altermatt, P.; Atwater, H.; Barnes, T.; Breyer, C.; Case, C.; De Wolf, S.; Deline, C.; et al. Photovoltaics at Multi-Terawatt Scale: Waiting Is Not an Option. Science 2023, 380, 39–42. [Google Scholar] [CrossRef] [PubMed]
- Jäger-Waldau, A. Snapshot of Photovoltaics—February 2022. EPJ Photovolt. 2022, 13, 9. [Google Scholar] [CrossRef]
- Jäger-Waldau, A. Snapshot of Photovoltaics—May 2023. EPJ Photovolt. 2023, 14, 23. [Google Scholar] [CrossRef]
- Nemet, G.F. How Solar Energy Became Cheap: A Model for Low-Carbon Innovation; Routledge, Taylor & Francis Group: London, UK; New York, NY, USA, 2019; ISBN 978-0-367-13657-4. [Google Scholar]
- Corkish, R.P. Photovoltaics Education Outreach to the Asia-Pacific Region. In Proceedings of the ISES World Congress 2007 (Vol. I–Vol. V) Solar Energy and Human Settlement, Beijing, China, 18–21 September 2007. [Google Scholar] [CrossRef]
- Loebbe, S.; Sioshansi, F.; Robinson, D. Energy Communities. Customer-Centered, Market Driven, Welfare-Enhancing? Elsevier: Amsterdam, The Netherlands, 2022; ISBN 978-0-323-91135-1. [Google Scholar]
- Snapshot of Global PV Markets; International Energy Agency—Technology Collaboration Programme on Photovoltaic Power Systems: IEA-PVPS; International Energy Agency: Paris, France, 2023.
- Polo, J.; Wilbert, S.; Ruiz-Arias, J.A.; Meyer, R.; Gueymard, C.; Súri, M.; Martín, L.; Mieslinger, T.; Blanc, P.; Grant, I.; et al. Preliminary Survey on Site-Adaptation Techniques for Satellite-Derived and Reanalysis Solar Radiation Datasets. Sol. Energy 2016, 132, 25–37. [Google Scholar] [CrossRef]
- European Commission—Joint Research Centre. Overview of the Potential and Challenges for Agri-Photovoltaics in the European Union; Publications Office of the European Union: Luxembourg, 2023. [Google Scholar]
- Kakoulaki, G.; Gonzalez Sanchez, R.; Gracia Amillo, A.; Szabo, S.; De Felice, M.; Farinosi, F.; De Felice, L.; Bisselink, B.; Seliger, R.; Kougias, I.; et al. Benefits of Pairing Floating Solar Photovoltaics with Hydropower Reservoirs in Europe. Renew. Sustain. Energy Rev. 2023, 171, 112989. [Google Scholar] [CrossRef]
- European Commission. COM/2022/221 Final EU Solar Energy Strategy; European Commission: Brussels, Belgium, 2022. [Google Scholar]
- National Development and Reform Commission Notice on Further Deepening the Market Reform of On-Grid Electricity Price for Coal-Fired Power Generation; National Development and Reform Commission: Beijing, China, 2021.
- National Development and Reform Commission. NDRC Notice on New Energy 2021 On-Grid Electricity Tariff Policy; National Development and Reform Commission: Beijing, China, 2021. [Google Scholar]
- U.S. Environmental Protection Agency. E. Solar for All—Grant Competition to Fund Residential Solar Programs; U.S. Environmental Protection Agency: Washington, DC, USA, 2013. [Google Scholar]
- American Planning Association. Solar Briefing Papers 1: Solar Community Engagement Strategies for Planners; American Planning Association: Chicago, IL, USA, 2012. [Google Scholar]
- Solanki, C.S.; Fernandes, B.G.; Arora, B.M.; Sharma, P.; Agarwal, V.; Patil, M.B.; Vasi, J.; Phatak, D.B.; Atrey, M.; Moudgalya, K.; et al. “Teach a 1000 Teachers”: A Methodology for the Rapid Ramp-up of Photovoltaics Manpower Required for India’s National Solar Mission. In Proceedings of the 2012 38th IEEE Photovoltaic Specialists Conference, Austin, TX, USA, 3–8 June 2012; IEEE: Piscataway, NJ, USA, 2012; pp. 002477–002480. [Google Scholar]
- Bloomberg New Energy Finance. 3Q 2023 Global PV Market Outlook. Available online: https://about.bnef.com/blog/3q-2023-global-pv-market-outlook/ (accessed on 27 November 2023).
- International Energy Agency. Financing Clean Energy in Africa; OECD: Paris, France, 2023; ISBN 978-92-64-71051-1. [Google Scholar]
- IRENA. Renewable Power Generation Costs in 2021; IRENA—International Renewable Energy Agency: Abu Dhabi, United Arab Emirates, 2022. [Google Scholar]
- Koseler, R.; Shapcott, S.; Nelson, K.G.; Husman, J. Work in Progress: Evaluation of an Online Education Portal from the User’s Perspective: An Empirical Investigation of a Photovoltaics (PV) Engineering Learning Portal, pveducation.org. In Proceedings of the 2012 Frontiers in Education Conference Proceedings, Seattle, WA, USA, 3–6 October 2012; IEEE: Piscataway, NJ, USA, 2012; pp. 1–2. [Google Scholar]
- Tabakovic, M.; Fechner, H.; van Leeuwen, J.; Bontekoe, E.; van Sark, W.; Louwen, A.; Arancon, S.; Weiss, I.; Georghiou, G.; Makrides, G.; et al. Development and Implementation of BIPV Courseware for Higher Education and Professionals. In Smart Education and e-Learning 2019; Uskov, V.L., Howlett, R.J., Jain, L.C., Eds.; Smart Innovation, Systems and Technologies; Springer: Singapore, 2019; Volume 144, pp. 209–217. ISBN 9789811382598. [Google Scholar]
- Suri, M.; Huld, T.; Cebecauer, T.; Dunlop, E.D. Geographic Aspects of Photovoltaics in Europe: Contribution of the PVGIS Website. IEEE J. Sel. Top. Appl. Earth Obs. Remote Sens. 2008, 1, 34–41. [Google Scholar] [CrossRef]
- PVWatts Calculator, NREL. Available online: https://pvwatts.nrel.gov/ (accessed on 26 November 2023).
- System Advisor Model Version 2022.11.29 (SAM 2022.11.21); National Renewable Energy Laboratory: Golden, CO, USA, 2022. Available online: https://sam.nrel.gov/ (accessed on 26 November 2023).
- Hofierka, J.; Zlocha, M. A New 3-D Solar Radiation Model for 3-D City Models: New 3-D Solar Radiation Model. Trans. GIS 2012, 16, 681–690. [Google Scholar] [CrossRef]
- Freitas, S.; Catita, C.; Redweik, P.; Brito, M.C. Modelling Solar Potential in the Urban Environment: State-of-the-Art Review. Renew. Sustain. Energy Rev. 2015, 41, 915–931. [Google Scholar] [CrossRef]
- Lucchi, E.; Adami, J.; Peluchetti, A.; Camilo Mahecha Zambrano, J. Photovoltaic Potential Estimation of Natural and Architectural Sensitive Land Areas to Balance Heritage Protection and Energy Production. Energy Build. 2023, 290, 113107. [Google Scholar] [CrossRef]
- Bouty, K. Solar Cadaster in Urban Area Including Verticality. In Proceedings of the ISES Solar World Congress 2019, Santiago, Chile, 3–7 November 2019; International Solar Energy Society: Freiburg im Breisgau, Germany, 2019; pp. 1–10. [Google Scholar]
- Solea: Solar Energy Applications|Athens Solar Cadastre, National Observatory of Athens. Available online: http://solea.gr/athens-solar-cadastre/ (accessed on 25 September 2023).
- Assouline, D. Machine Learning and Geographic Information Systems for Large-Scale Mapping of Renewable Energy Potential. Ph.D. Thesis, École Polytechnique Fédérale de Lausanne, Lausanne, Switzerland, 2019. [Google Scholar] [CrossRef]
- Solar Cadastres in France: Pays de la Loire. Available online: https://www.otovo.fr/a/region-pays-de-la-loire/ (accessed on 27 November 2023).
- Solar Potential of All Roofs in Switzerland: A Climate-Related Service. Available online: https://www.uvek-gis.admin.ch/BFE/sonnendach/?lang=en (accessed on 27 November 2023).
- Google Maps. Platform Solar API. Available online: https://developers.google.com/maps/documentation/solar/overview (accessed on 3 October 2023).
- Amaro e Silva, R. Solar Resource for Cities (Solar Cadastres). In Proceedings of the 8th World Congress on Photovoltaic Energy Conversion, IEA PVPS Task 16 Parallel Event, Milan, Italy, 26–30 September 2022. [Google Scholar]
- Horak, D.; Hainoun, A.; Neugebauer, G.; Stoeglehner, G. A Review of Spatio-Temporal Urban Energy System Modeling for Urban Decarbonization Strategy Formulation. Renew. Sustain. Energy Rev. 2022, 162, 112426. [Google Scholar] [CrossRef]
- REN21. R.N. Global Status Report; REN21 Secretariat: Paris, France, 2021. [Google Scholar]
- Renewable Energy and Jobs Annual Review 2021; International Renewable Energy Agency: Abu Dhabi, United Arab Emirates; International Labour Organization: Geneva, Switzerland, 2021; ISBN 978-92-9260-364-9.
- European Commission. COM/2020/662 Final A Renovation Wave for Europe—Greening Our Buildings, Creating Jobs, Improving Lives; European Commission: Brussels, Belgium, 2020. [Google Scholar]
- Joint Research Centre, European Commission. Release of PVGIS 5.2. Available online: https://Joint-research-centre.ec.europa.eu/pvgis-online-tool/pvgis-releases/pvgis-52_en (accessed on 27 November 2023).
- Amillo, A.G.; Taylor, N.; Martinez, A.M.; Dunlop, E.D.; Mavrogiorgios, P.; Fahl, F.; Arcaro, G.; Pinedo, I. Adapting PVGIS to Trends in Climate, Technology and User Needs. In Proceedings of the 38th European Photovoltaic Solar Energy Conference and Exhibition, Online, 6–10 September 2021. [Google Scholar]
- Presidency of the Republic of Benin. Benin’s Government Action Program (PAG) 2021–2026; Presidency of the Republic of Benin: Cotonou, Benin, 2021. [Google Scholar]
- RECASEB: Program of Capacity Building on the Energy Sector in Benin. Available online: https://energie.gouv.bj/page/projet-renforcement-des-capacites-des-acteurs-du-secteur-de-lenergie-au-benin-recaseb (accessed on 26 November 2023).
- Atlas of Renewable Energies of Benin. Available online: http://extra.isl.fr/ENR_BENIN/documentation/cartes_web/sites_avec_eolien_solaire_biomasse/index.html (accessed on 27 November 2023).
- SINEB: The Project of the National Energy Information System in Benin. Available online: https://www.sineb.bj (accessed on 26 November 2023).
- Joint Research Centre of the European Commission. Clean Energy Access Tool. Available online: https://africa-knowledge-platform.ec.europa.eu/energy_tool (accessed on 27 November 2023).
- Moner-Girona, M.; Kakoulaki, G.; Falchetta, G.; Weiss, D.J.; Taylor, N. Achieving Universal Electrification of Rural Healthcare Facilities in Sub-Saharan Africa with Decentralized Renewable Energy Technologies. Joule 2021, 5, 2687–2714. [Google Scholar] [CrossRef] [PubMed]
- Joint Research Centre of the European Commission. Africa Knowledge Platform. Available online: https://africa-knowledge-platform.ec.europa.eu/ (accessed on 27 November 2023).
- Victoria, M.; Haegel, N.; Peters, I.M.; Sinton, R.; Jäger-Waldau, A.; del Cañizo, C.; Breyer, C.; Stocks, M.; Blakers, A.; Kaizuka, I.; et al. Solar Photovoltaics Is Ready to Power a Sustainable Future. Joule 2021, 5, 1041–1056. [Google Scholar] [CrossRef]
- Joint Research Centre of the European Commission. Energy and Industry Geography Lab. Available online: https://energy-industry-geolab.jrc.ec.europa.eu/ (accessed on 27 November 2023).
- Google. Environmental Insights Explorer. Available online: https://insights.sustainability.google/ (accessed on 27 November 2023).
- Pedró, F.; Subosa, M.; Rivas, A.; Valverde, P. Artificial Intelligence in Education: Challenges and Opportunities for Sustainable Development; UNESCO: Paris, France, 2019. [Google Scholar]
- Chiu, T.K.F.; Xia, Q.; Zhou, X.; Chai, C.S.; Cheng, M. Systematic Literature Review on Opportunities, Challenges, and Future Research Recommendations of Artificial Intelligence in Education. Comput. Educ. Artif. Intell. 2023, 4, 100118. [Google Scholar] [CrossRef]
- Aler, R.; Galván, I.M.; Ruiz-Arias, J.A.; Gueymard, C.A. Improving the Separation of Direct and Diffuse Solar Radiation Components Using Machine Learning by Gradient Boosting. Sol. Energy 2017, 150, 558–569. [Google Scholar] [CrossRef]
- Bamisile, O.; Cai, D.; Oluwasanmi, A.; Ejiyi, C.; Ukwuoma, C.C.; Ojo, O.; Mukhtar, M.; Huang, Q. Comprehensive Assessment, Review, and Comparison of AI Models for Solar Irradiance Prediction Based on Different Time/Estimation Intervals. Sci. Rep. 2022, 12, 9644. [Google Scholar] [CrossRef] [PubMed]
- Song, Z.; Cao, S.; Yang, H. Assessment of Solar Radiation Resource and Photovoltaic Power Potential across China Based on Optimized Interpretable Machine Learning Model and GIS-Based Approaches. Appl. Energy 2023, 339, 121005. [Google Scholar] [CrossRef]
- Milojevic-Dupont, N.; Wagner, F.; Nachtigall, F.; Hu, J.; Brüser, G.B.; Zumwald, M.; Biljecki, F.; Heeren, N.; Kaack, L.H.; Pichler, P.-P.; et al. EUBUCCO v0.1: European Building Stock Characteristics in a Common and Open Database for 200+ Million Individual Buildings. Sci. Data 2023, 10, 147. [Google Scholar] [CrossRef] [PubMed]
- Florio, P.; Giovando, C.; Goch, K.; Pesaresi, M.; Politis, P.; Martinez, A. Towards a Pan-EU Building Footprint Map Based on the Hierarchical Conflation of Open Datasets: The Digital Building Stock Model—DBSM. Int. Arch. Photogramm. Remote Sens. Spat. Inf. Sci. 2023, 48, 47–52. [Google Scholar] [CrossRef]
| Disclaimer/Publisher’s Note: The statements, opinions and data contained in all publications are solely those of the individual author(s) and contributor(s) and not of MDPI and/or the editor(s). MDPI and/or the editor(s) disclaim responsibility for any injury to people or property resulting from any ideas, methods, instructions or products referred to in the content. |
© 2023 by the authors. Licensee MDPI, Basel, Switzerland. This article is an open access article distributed under the terms and conditions of the Creative Commons Attribution (CC BY) license (https://creativecommons.org/licenses/by/4.0/).

 ,
, 


