
Experimental and Numerical Study of Novel Vortex Bladeless Wind Turbine with an Economic Feasibility Analysis and Investigation of Environmental Benefits
 , ,
, ,  and
and 
Abstract
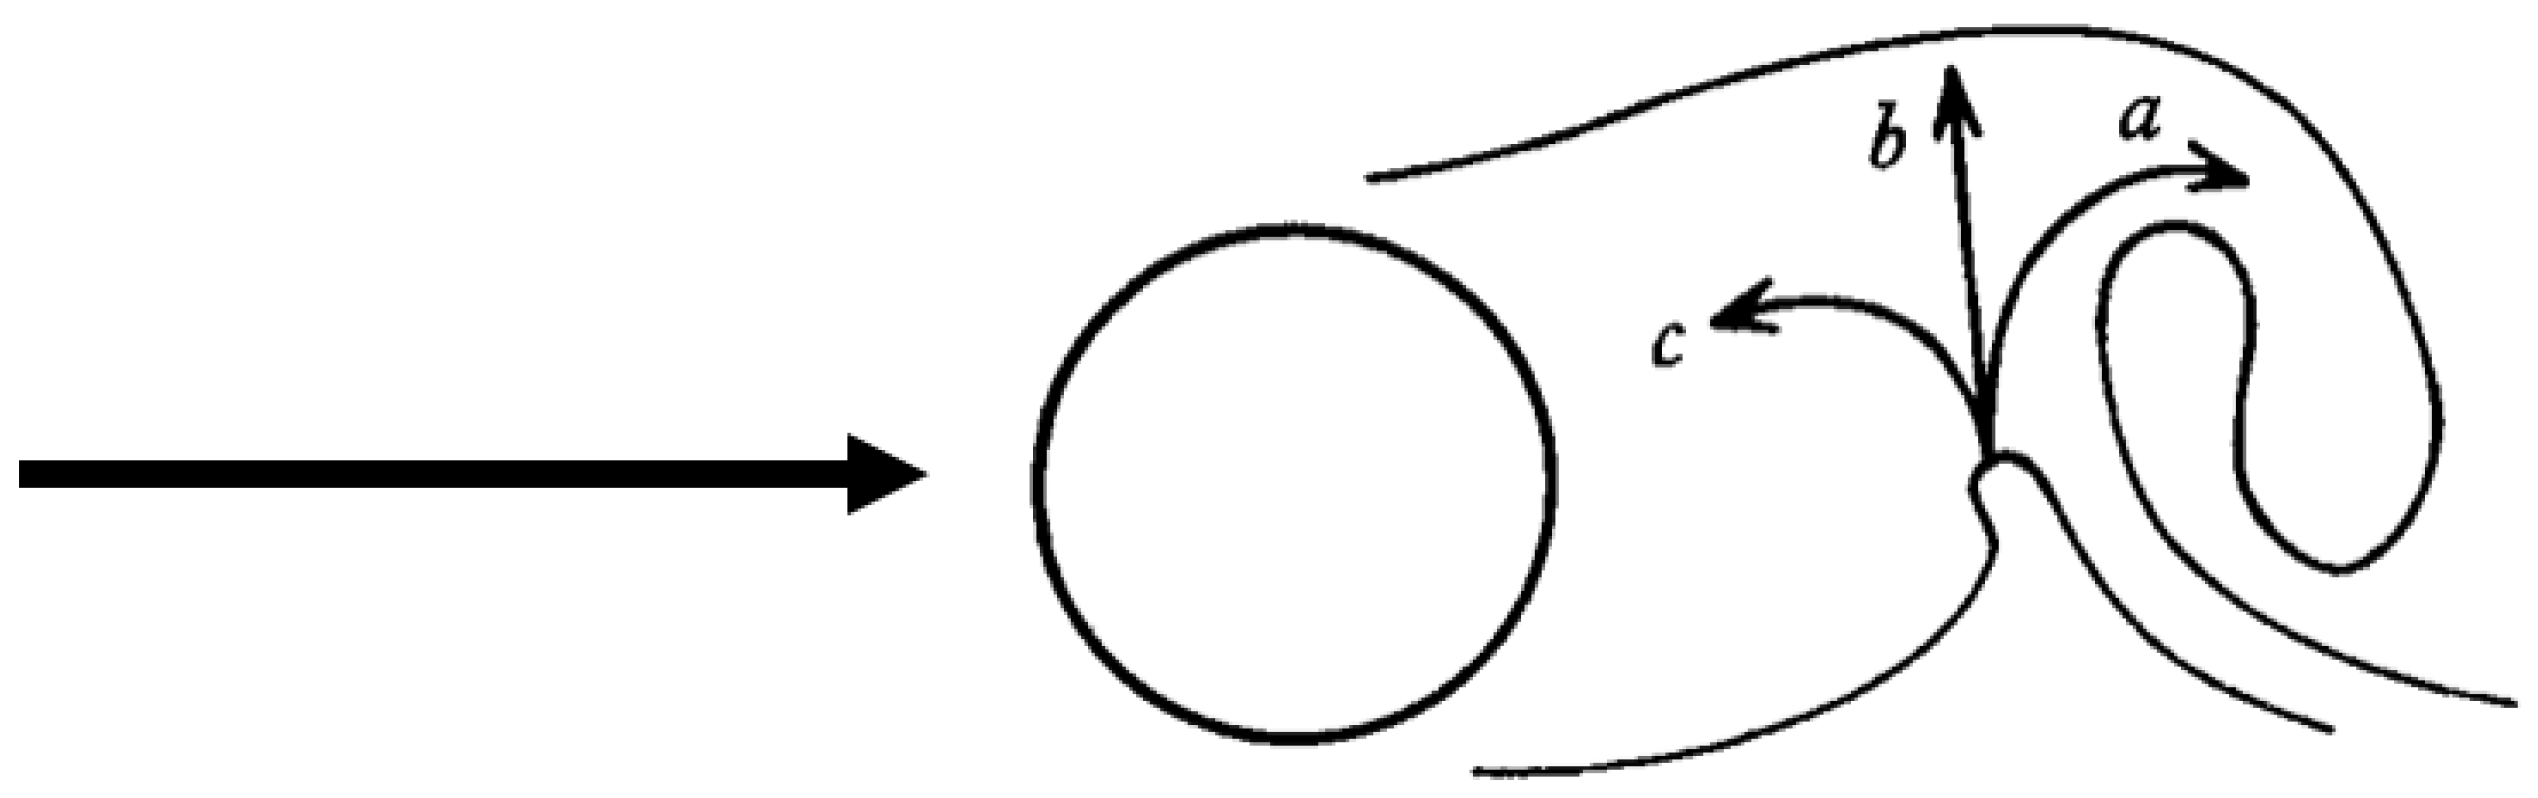
:1. Introduction
2. Methodologies
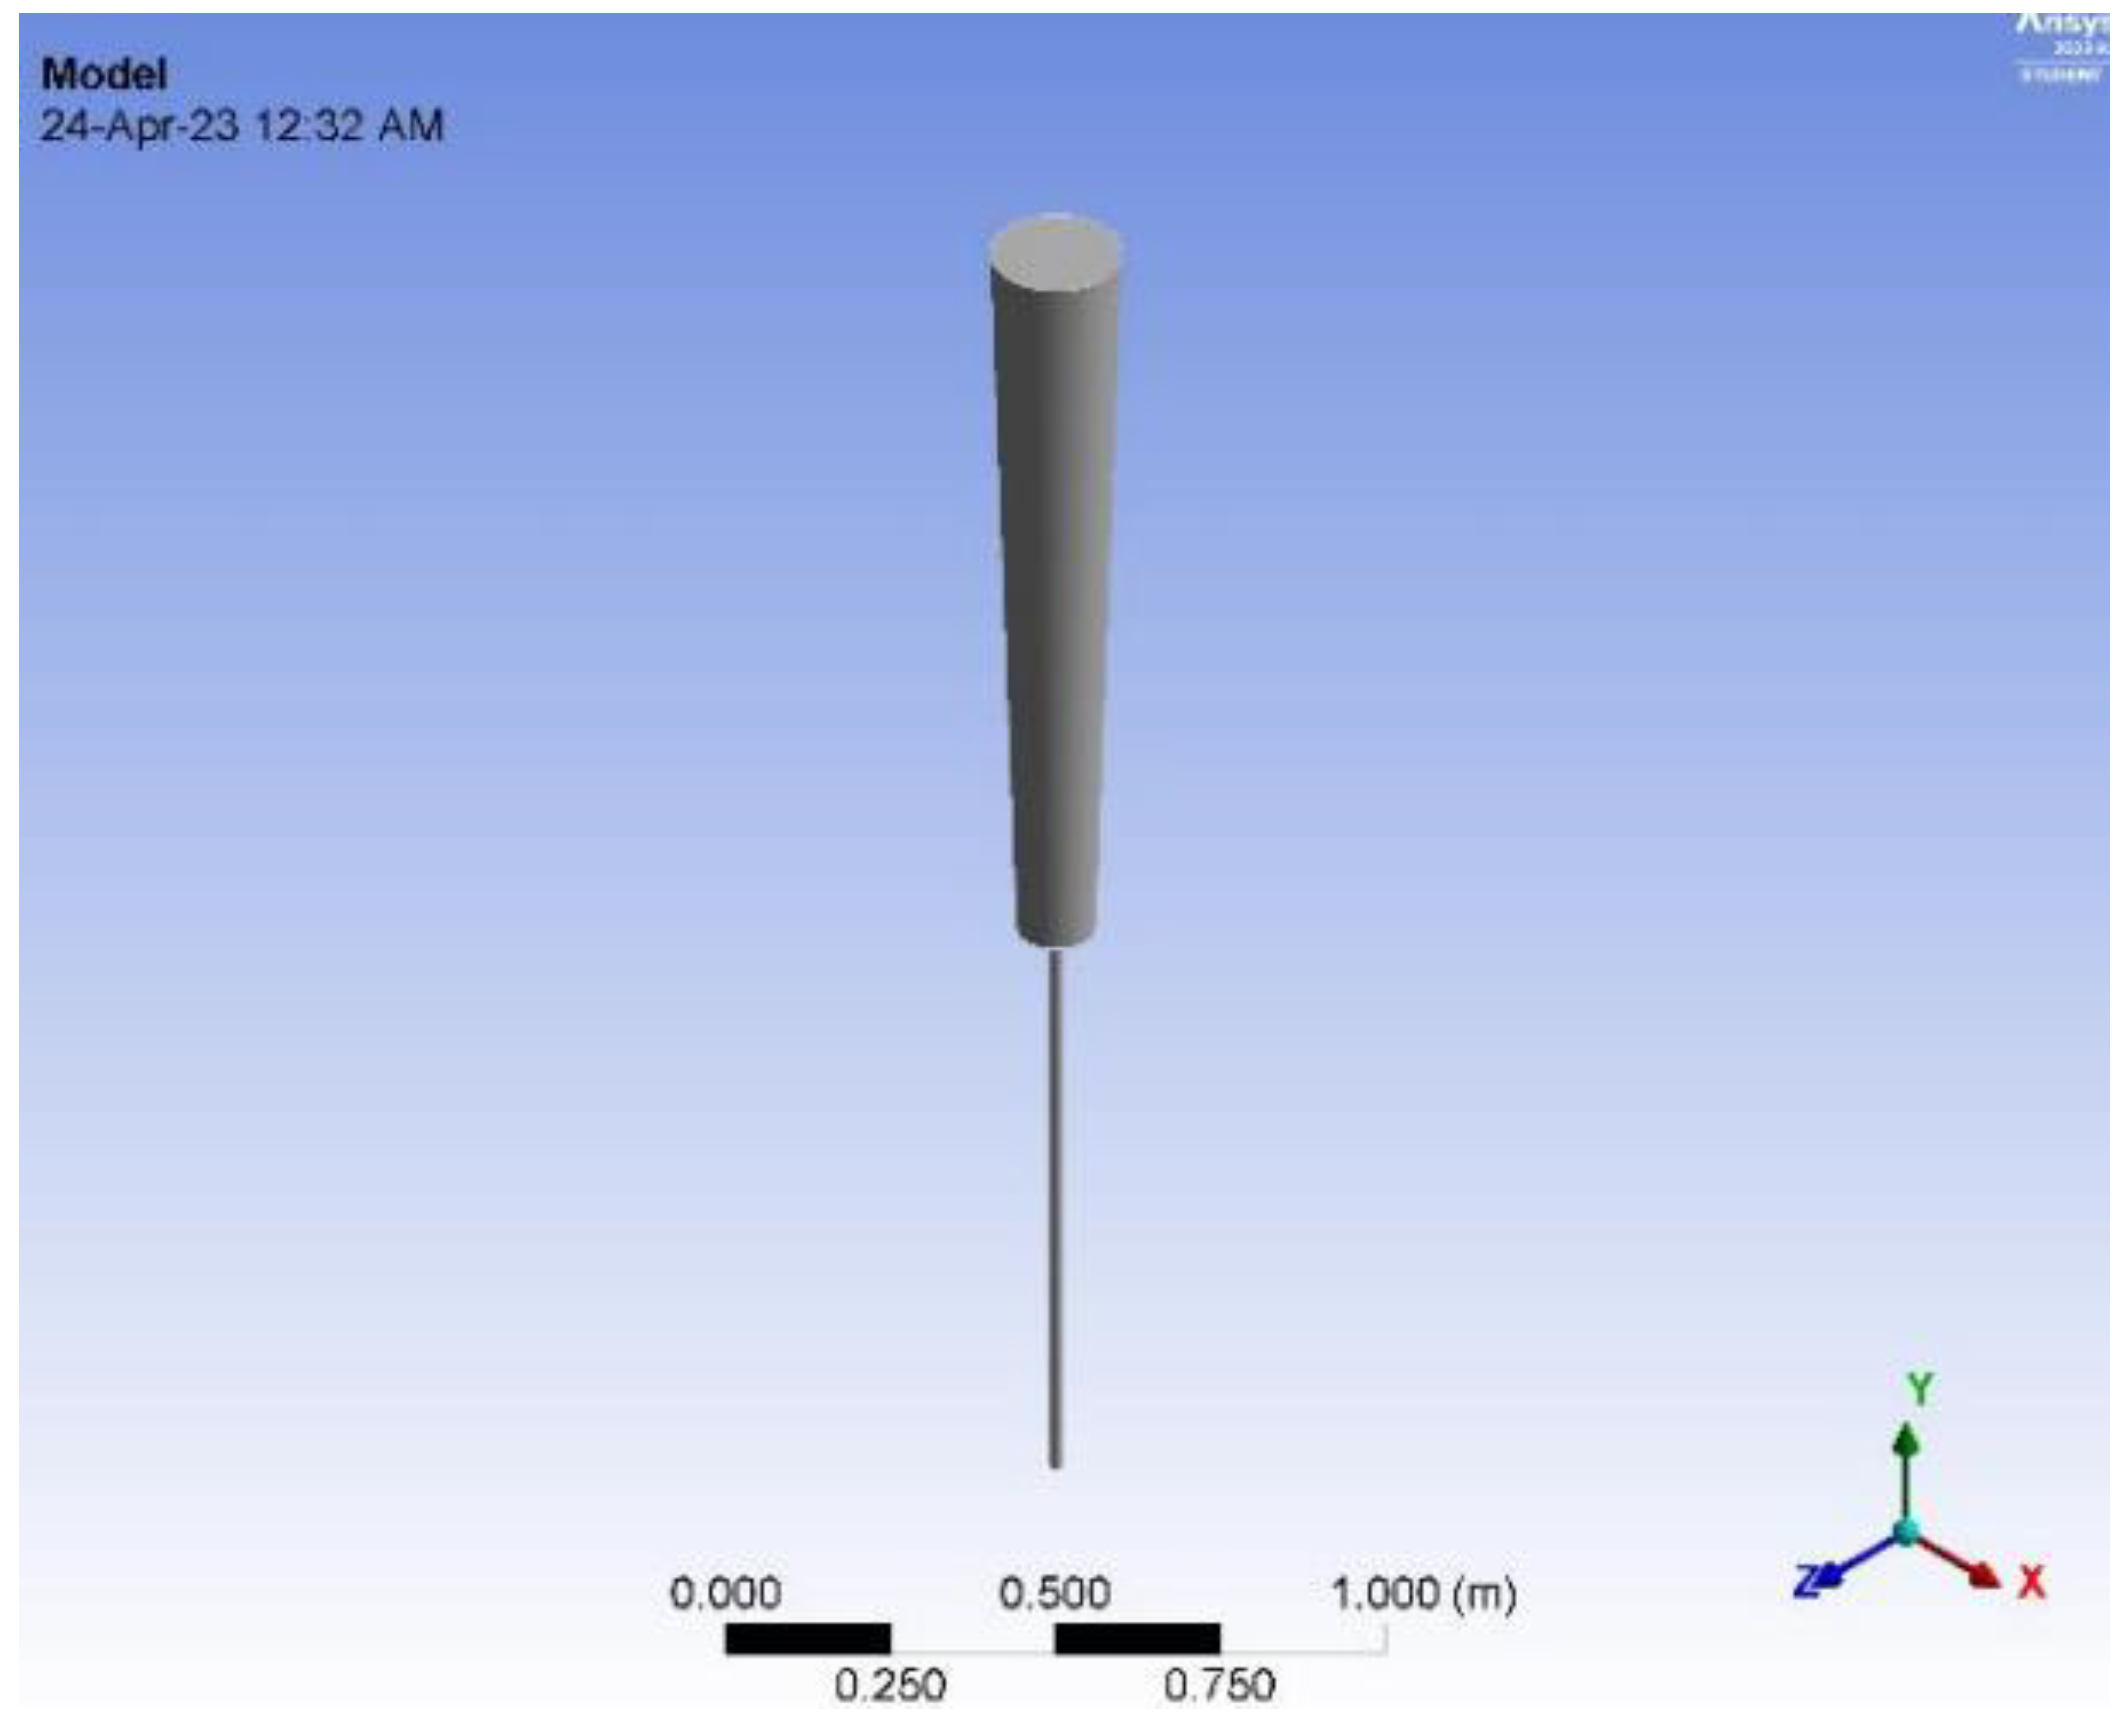
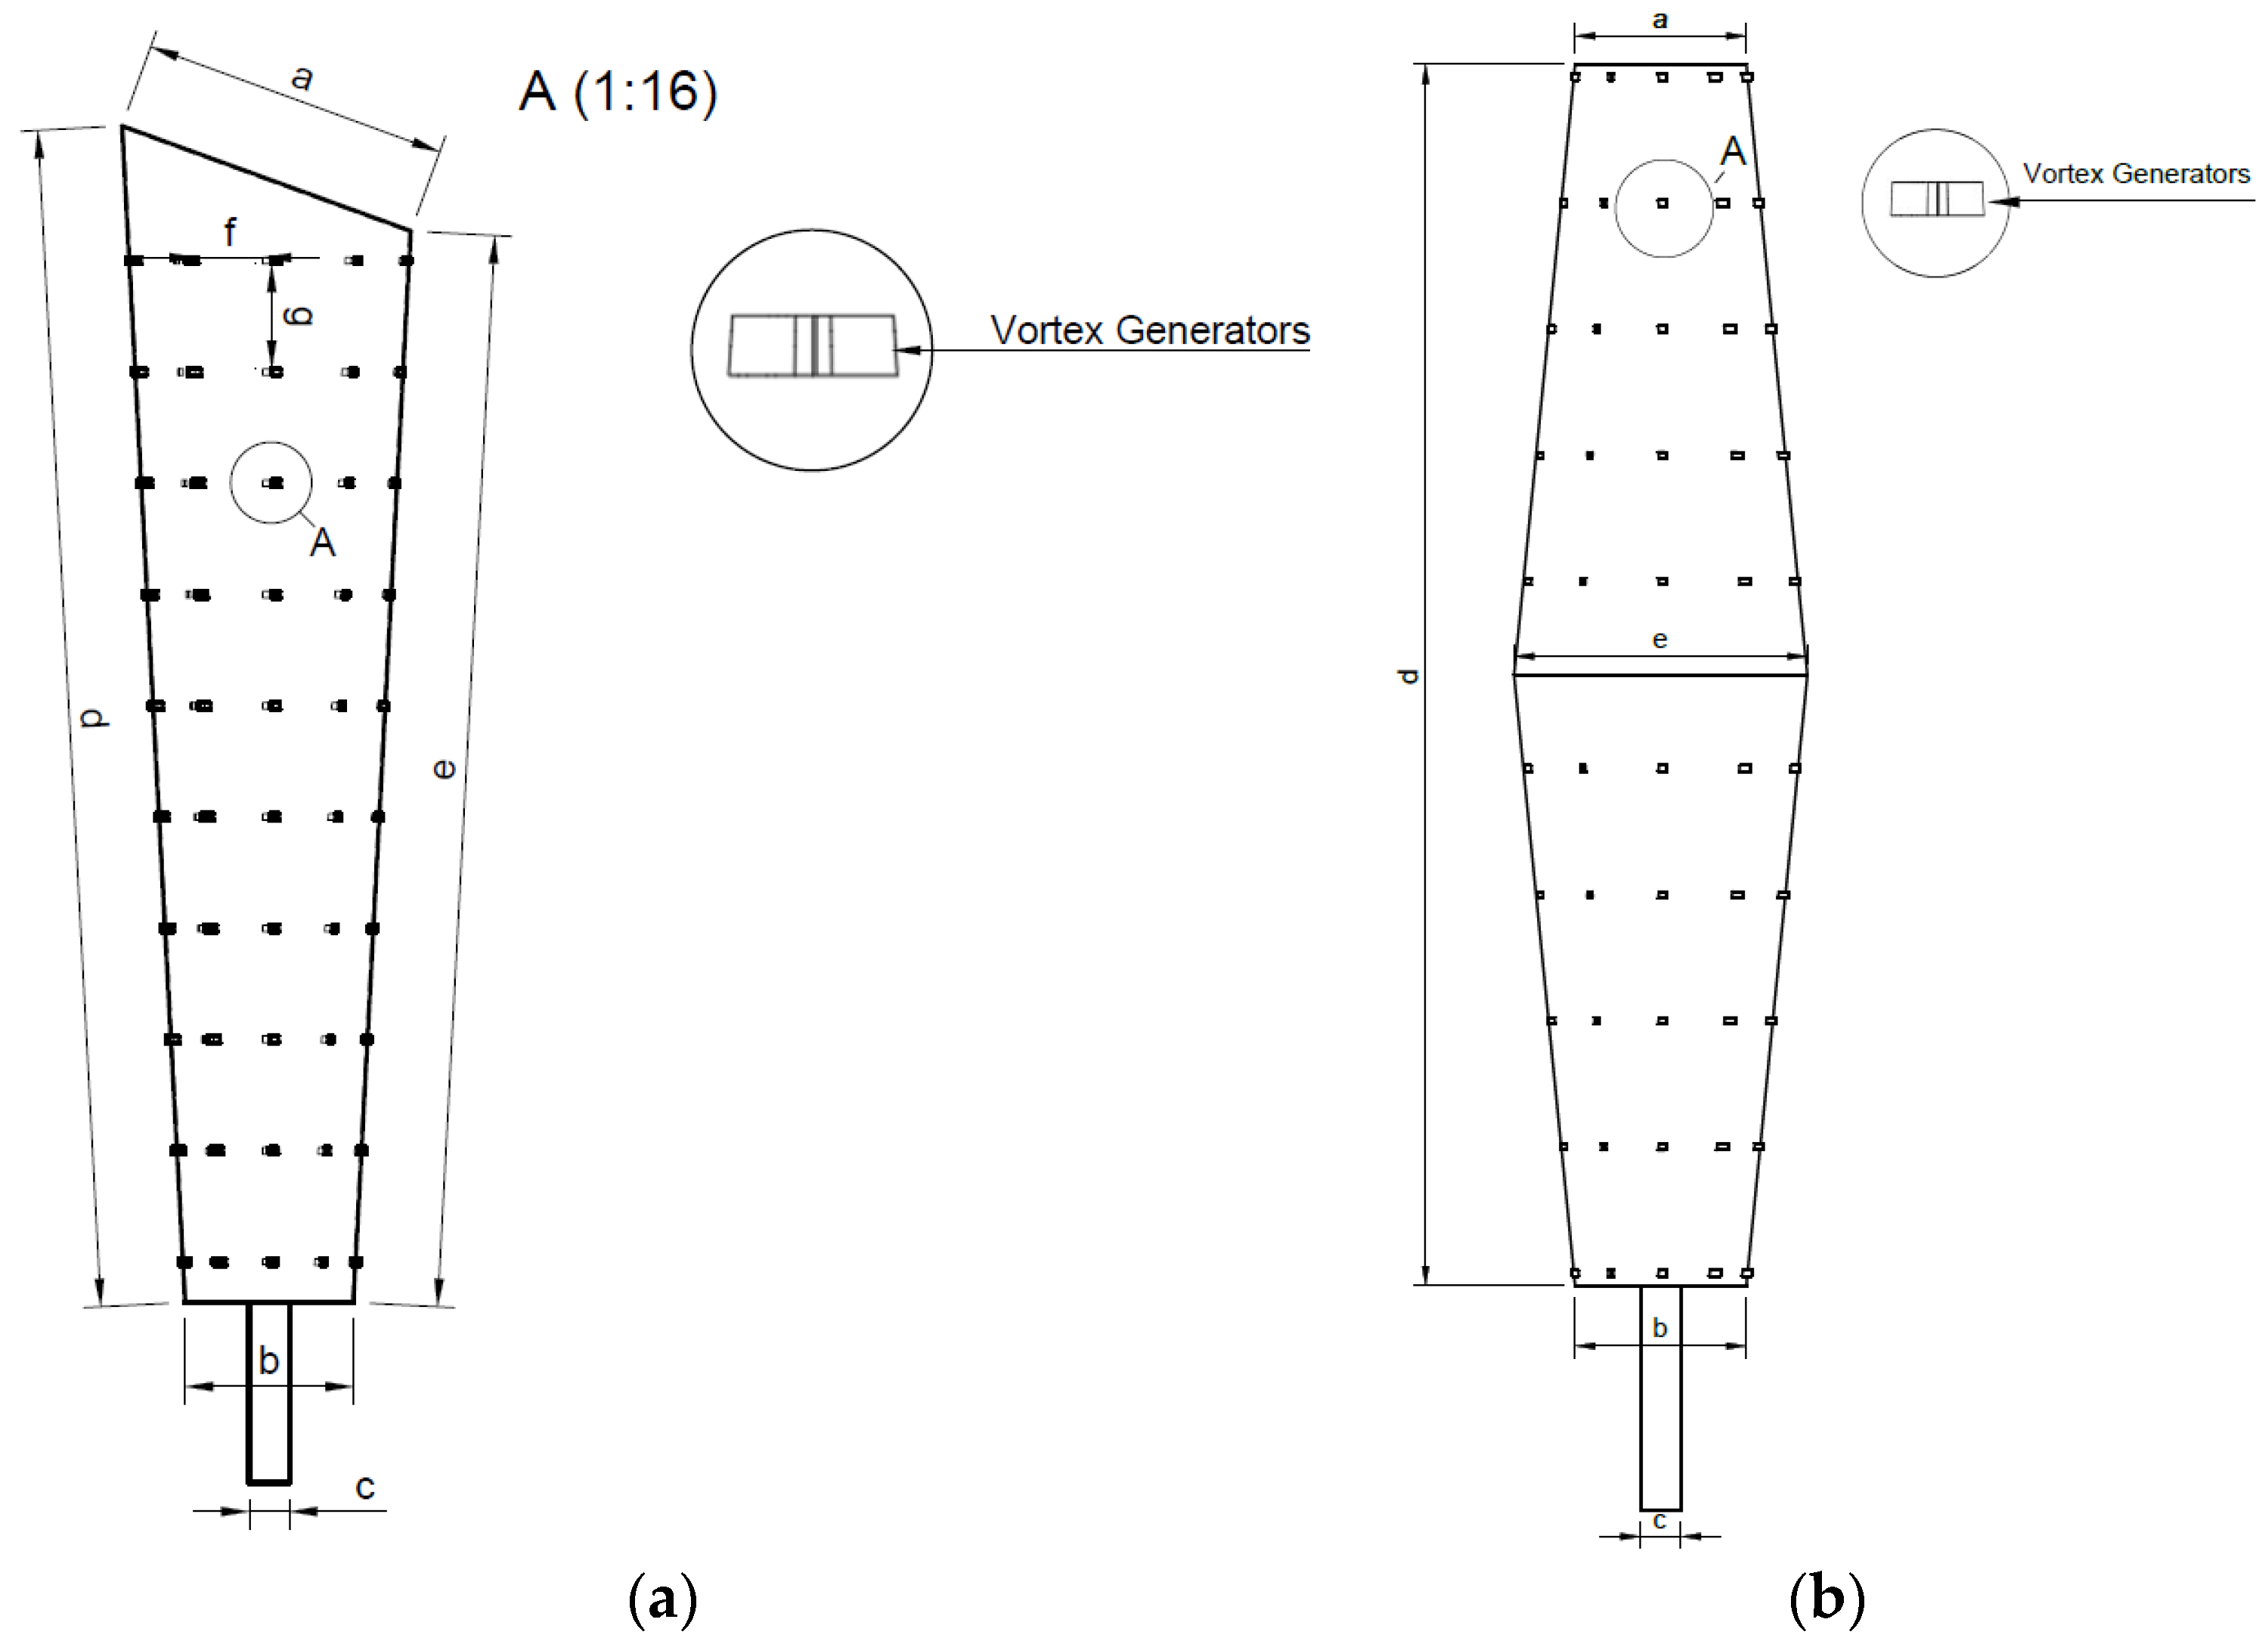
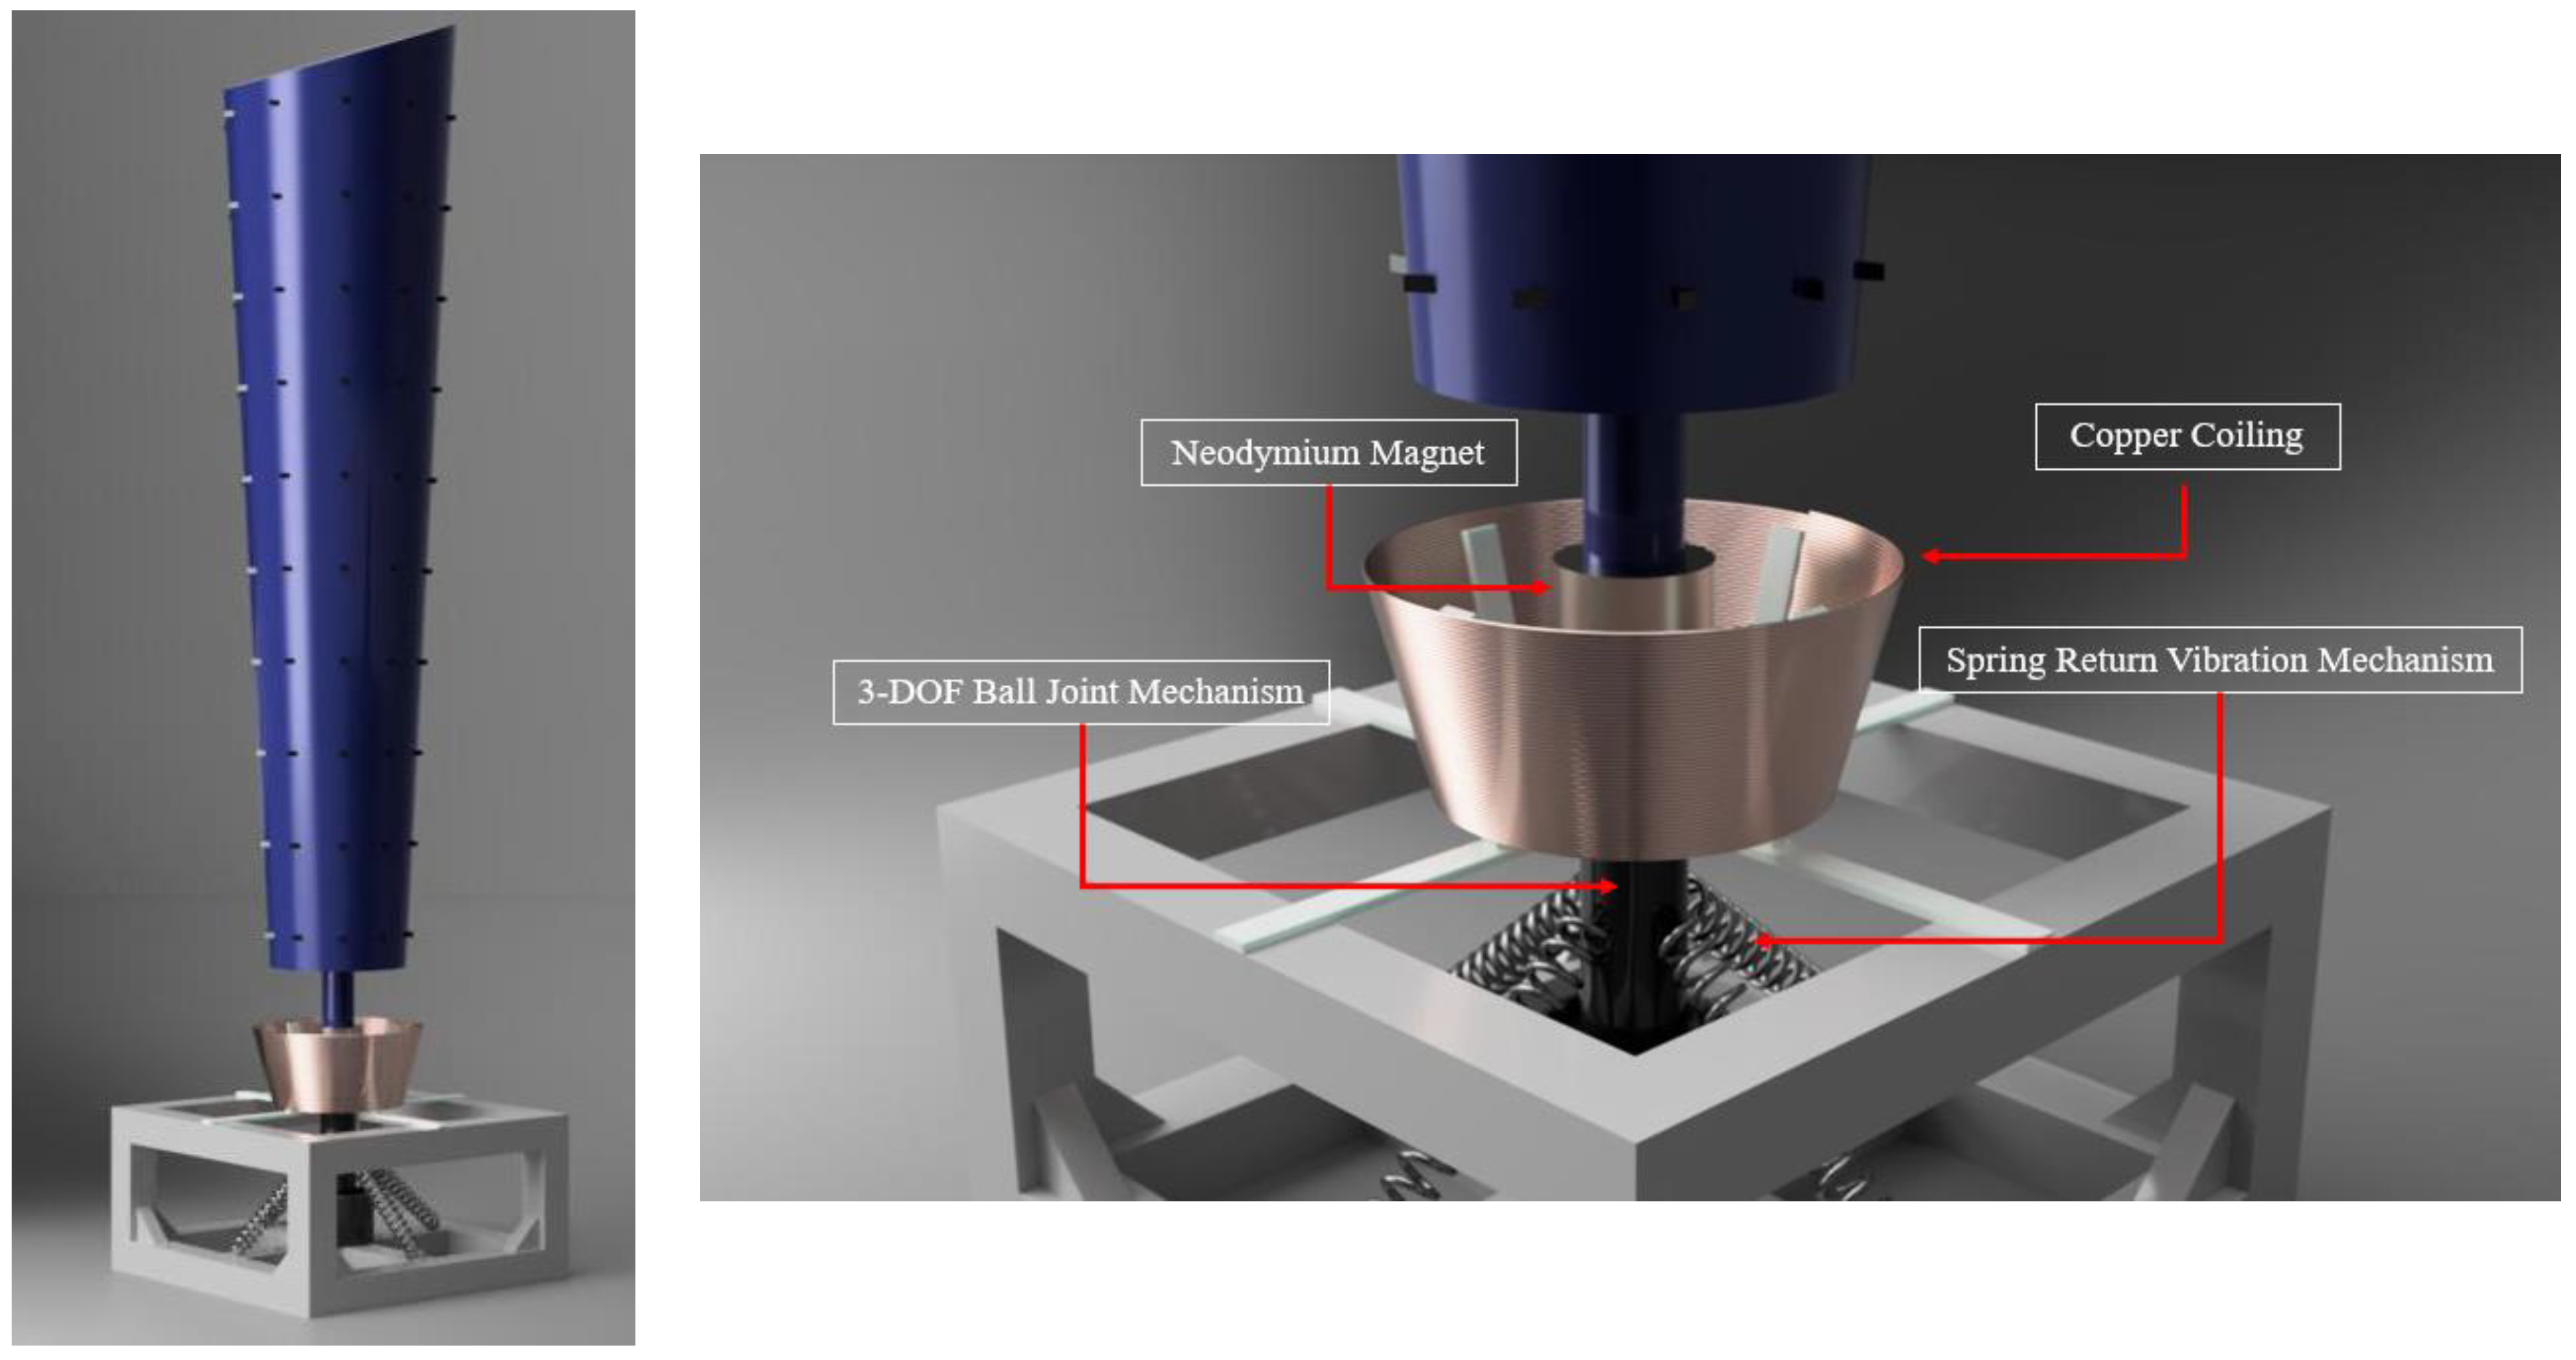
2.1. Design and Components of the VBWT
2.2. Spring-System Selection and Design
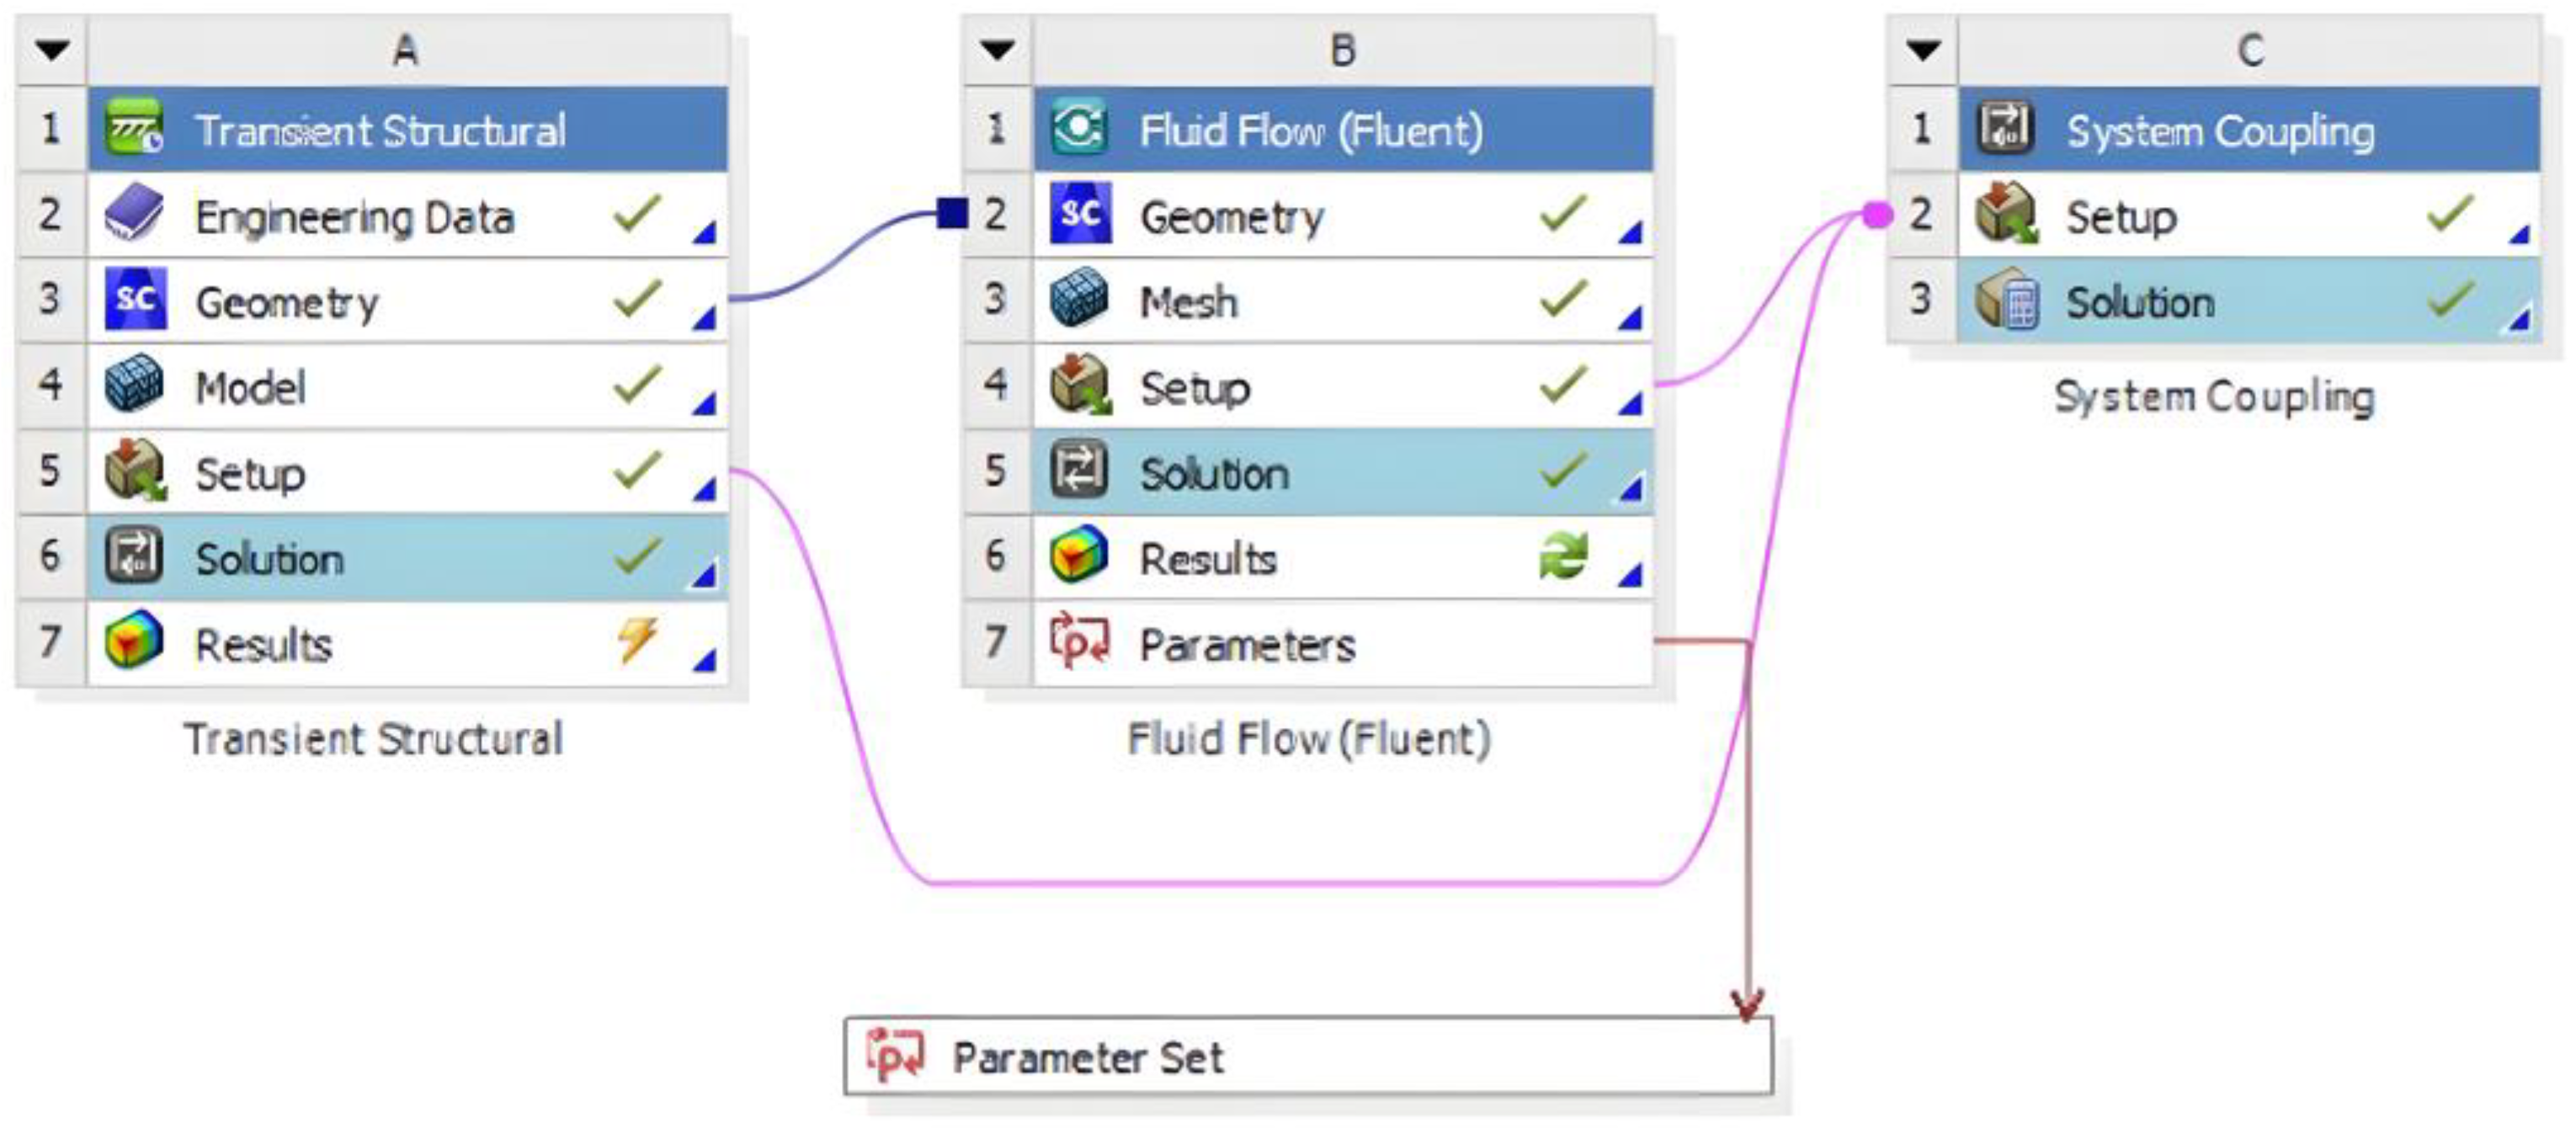
2.3. Simulation Model
2.3.1. CFD-Simulation Set-up and Governing Equations
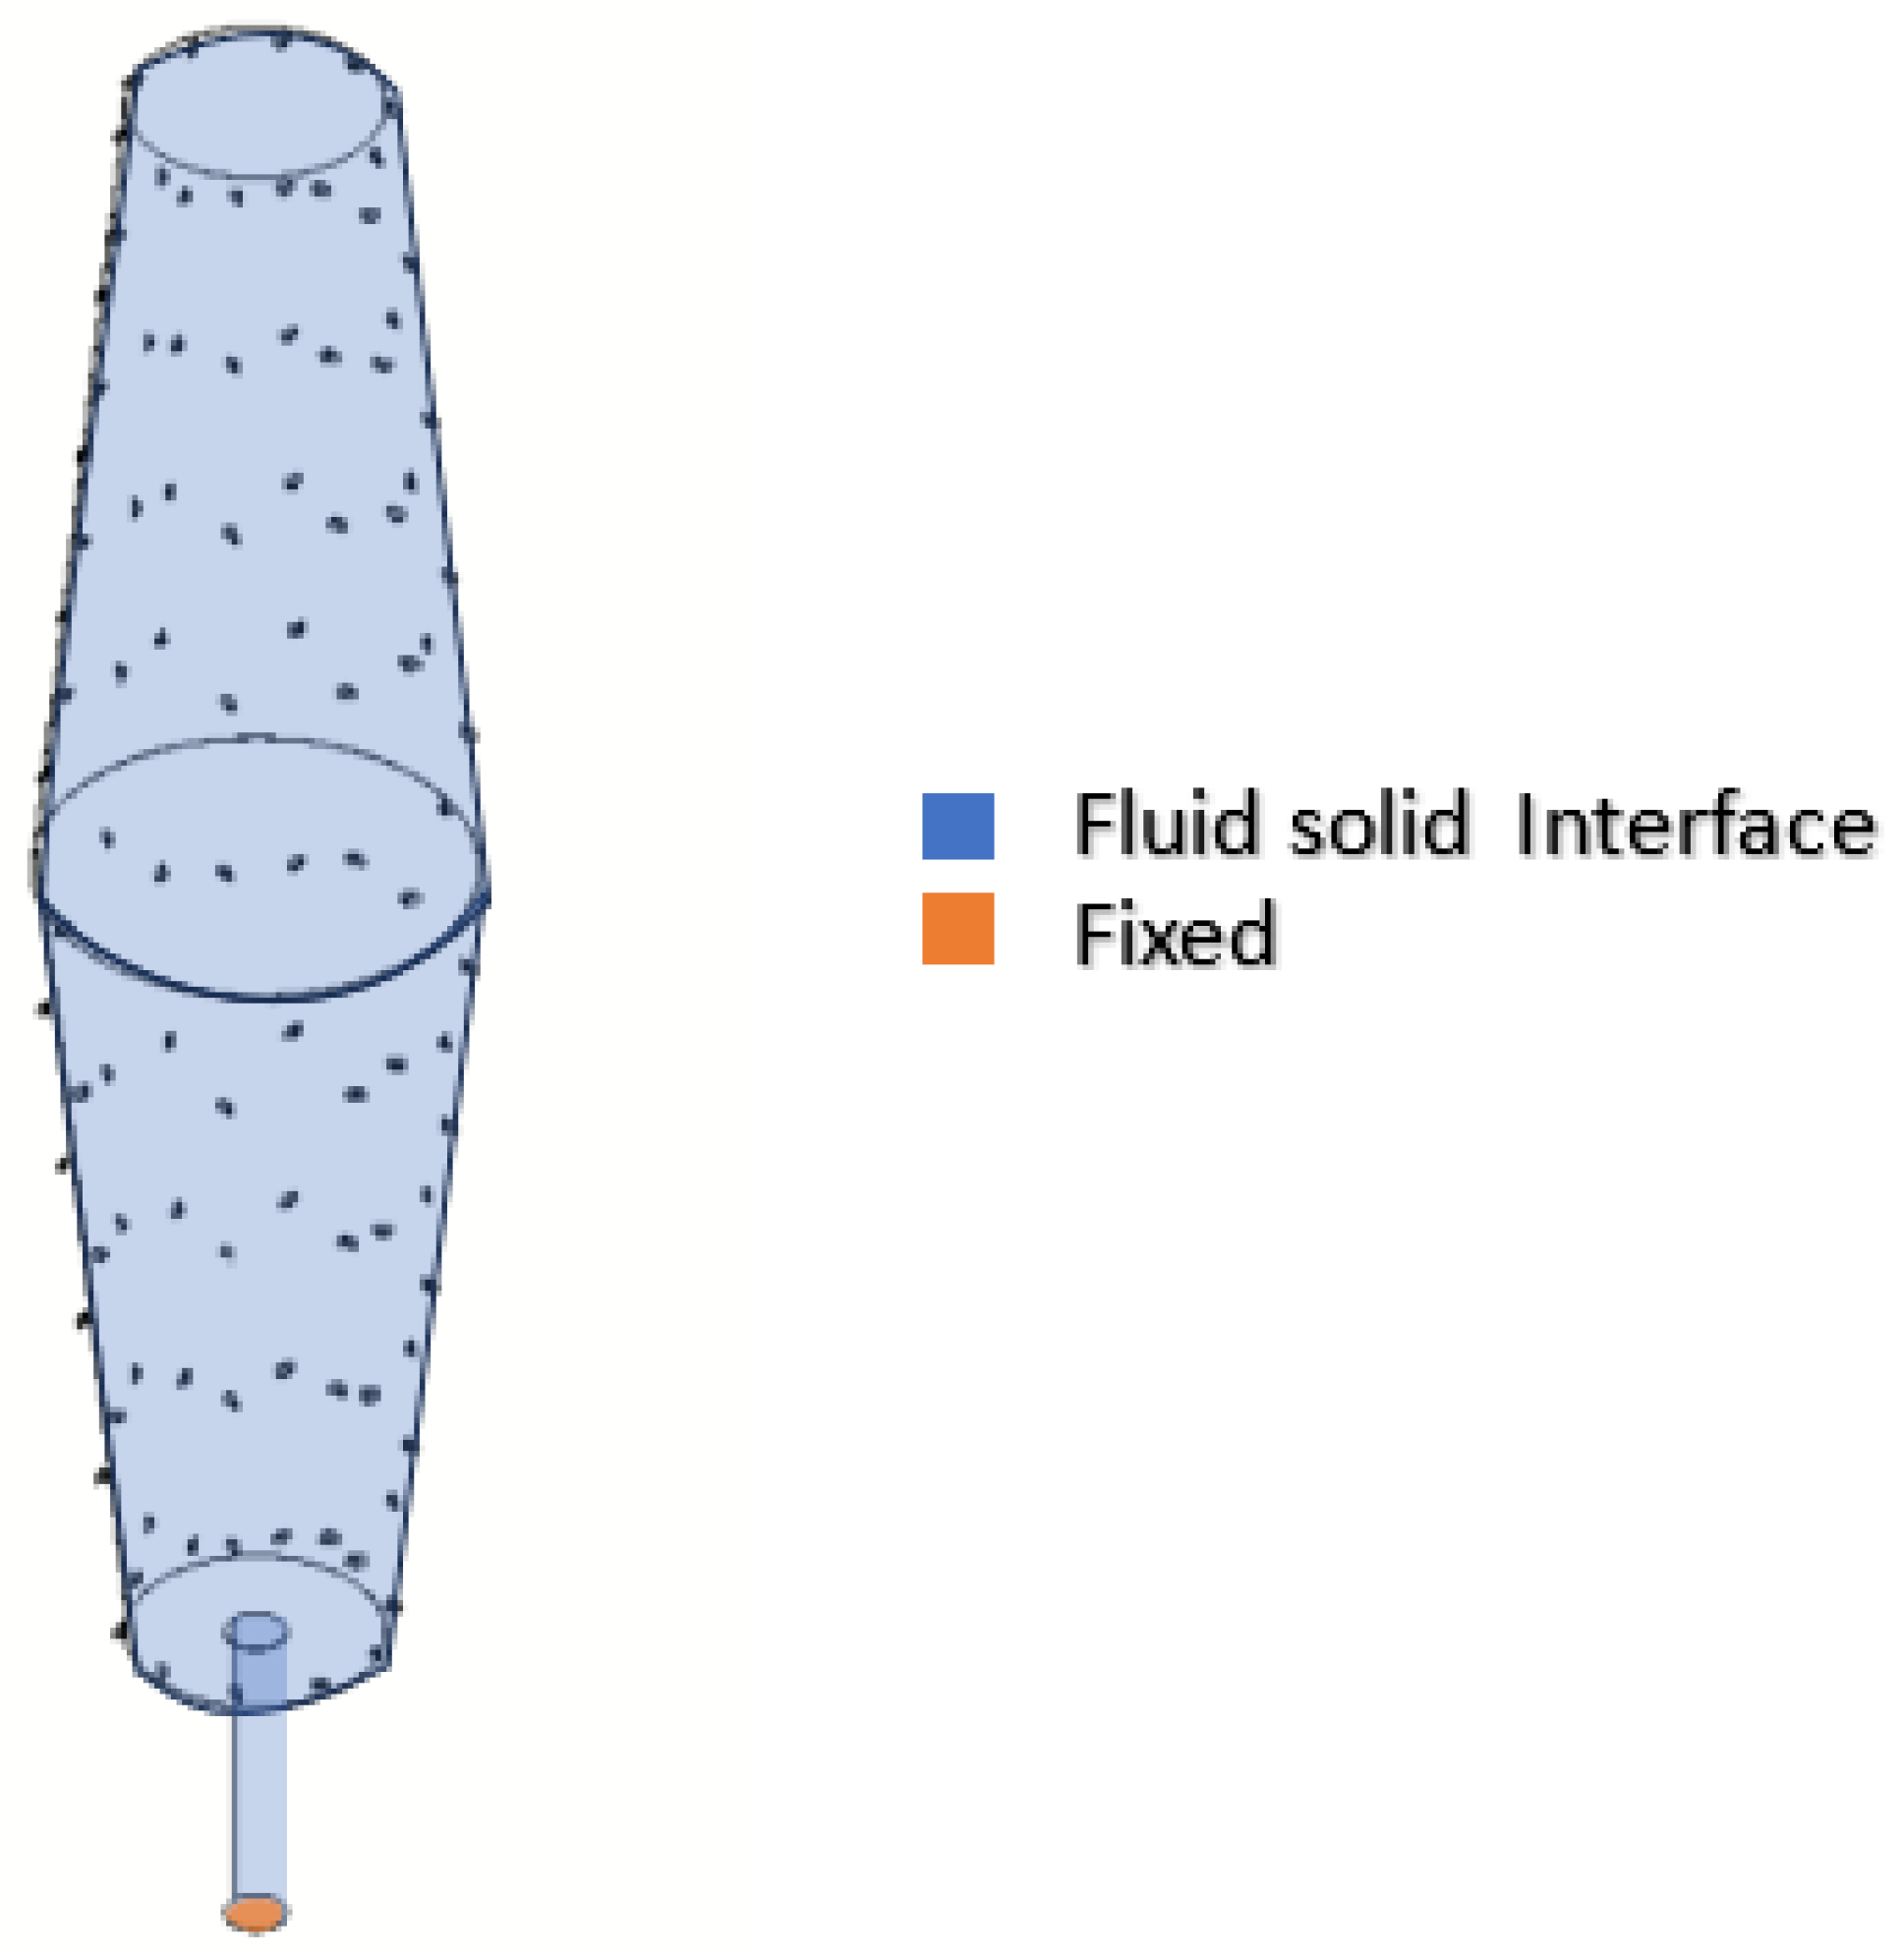
2.3.2. Transient Structural Simulation
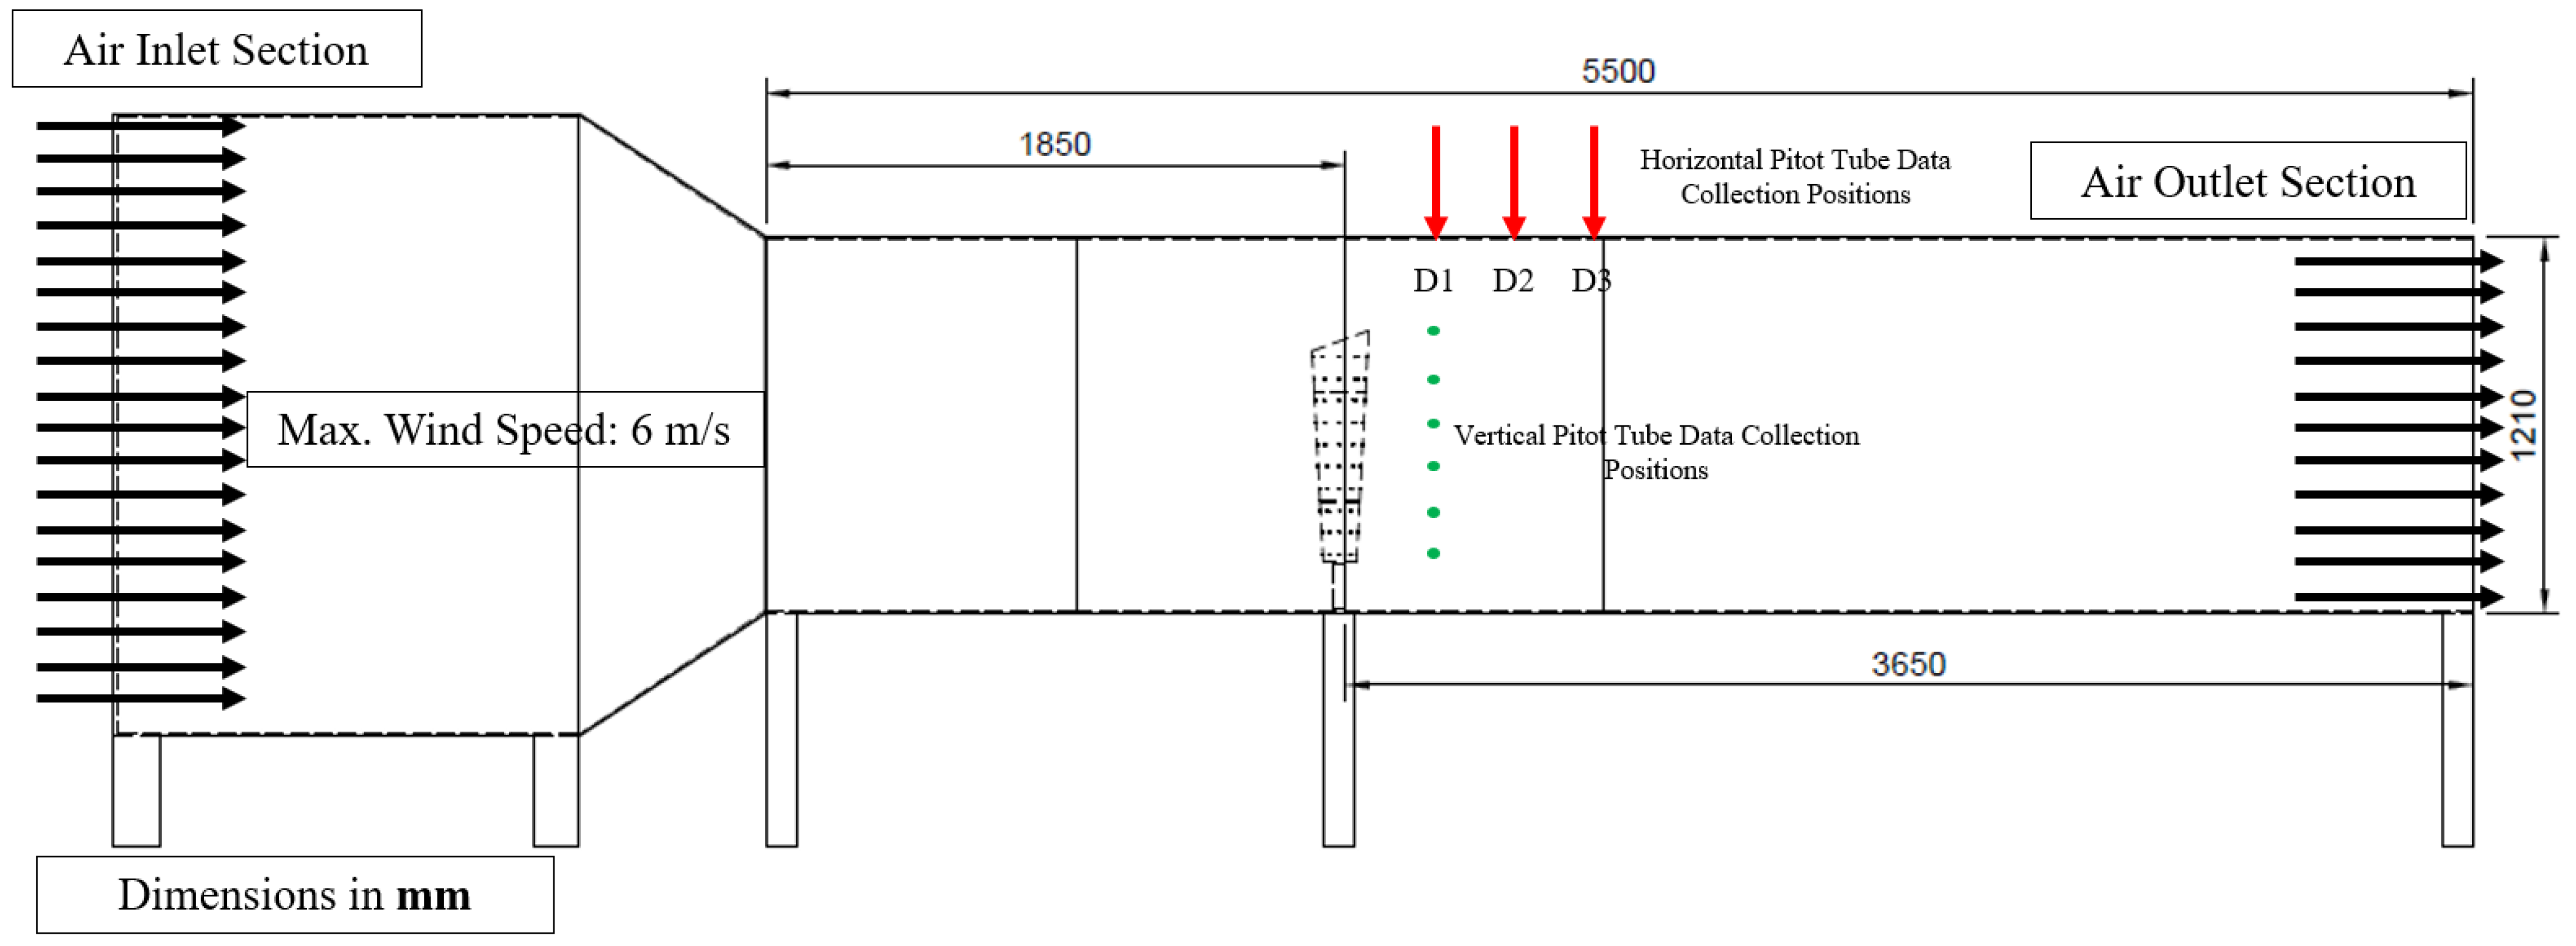
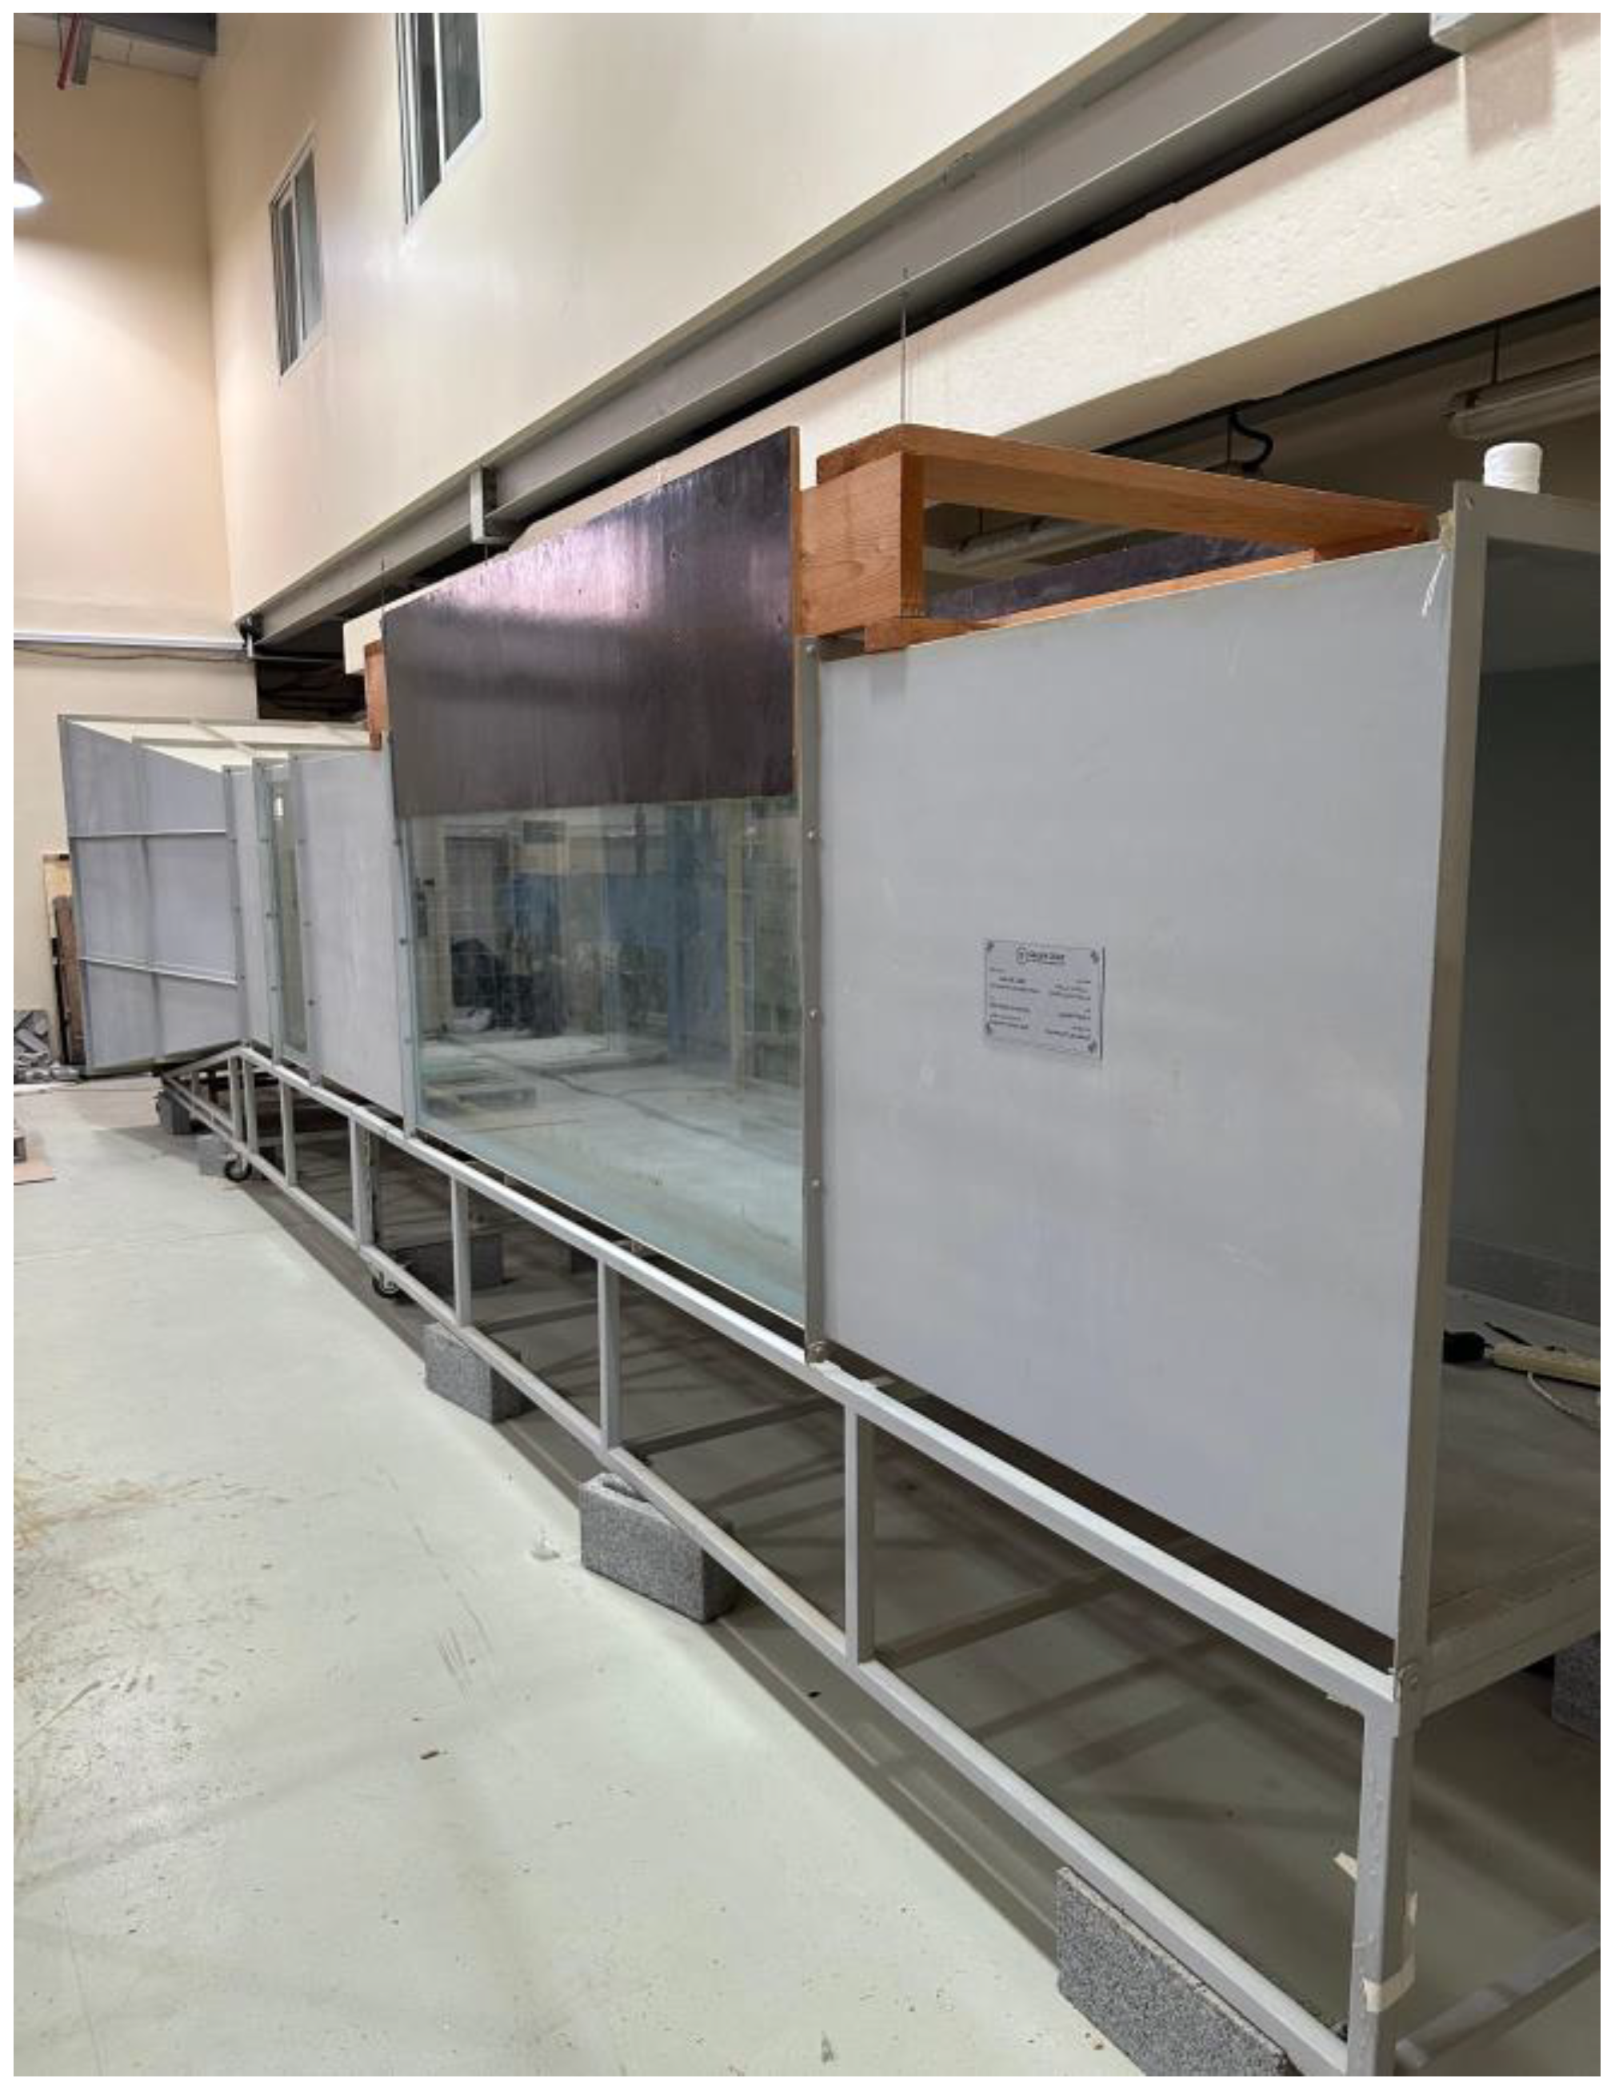
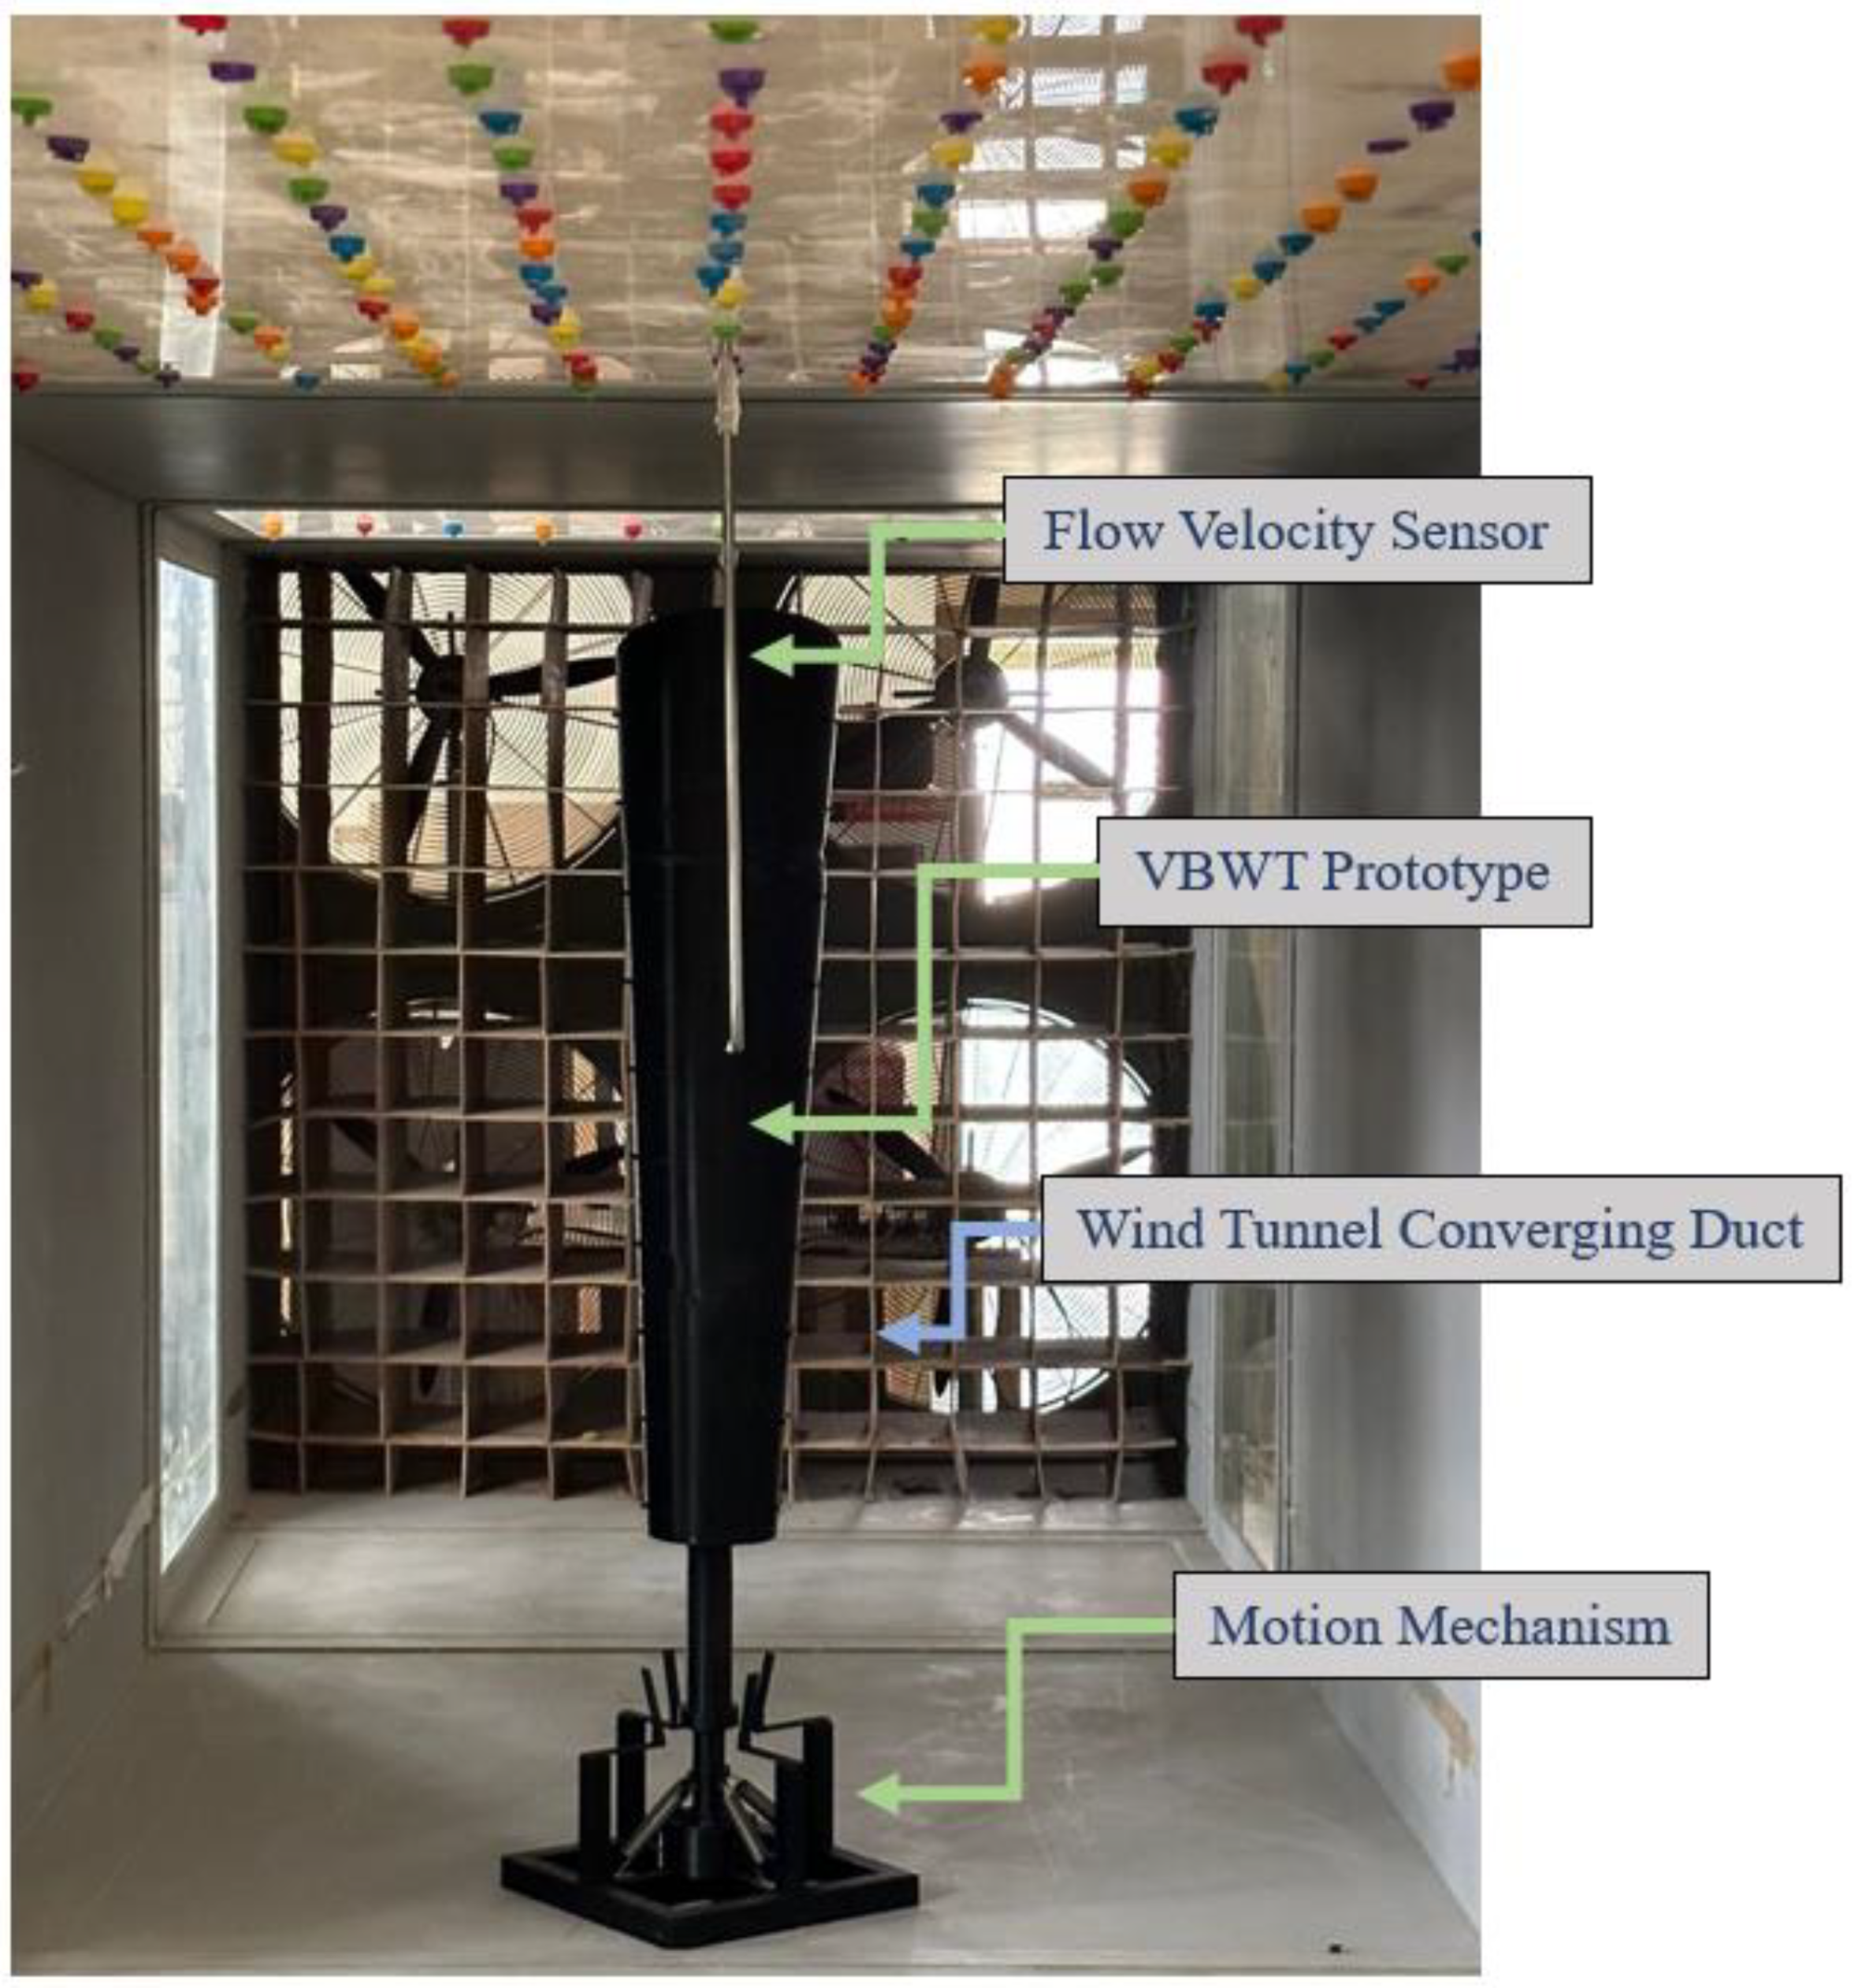
2.4. Experimental Methods
3. Results and Discussion
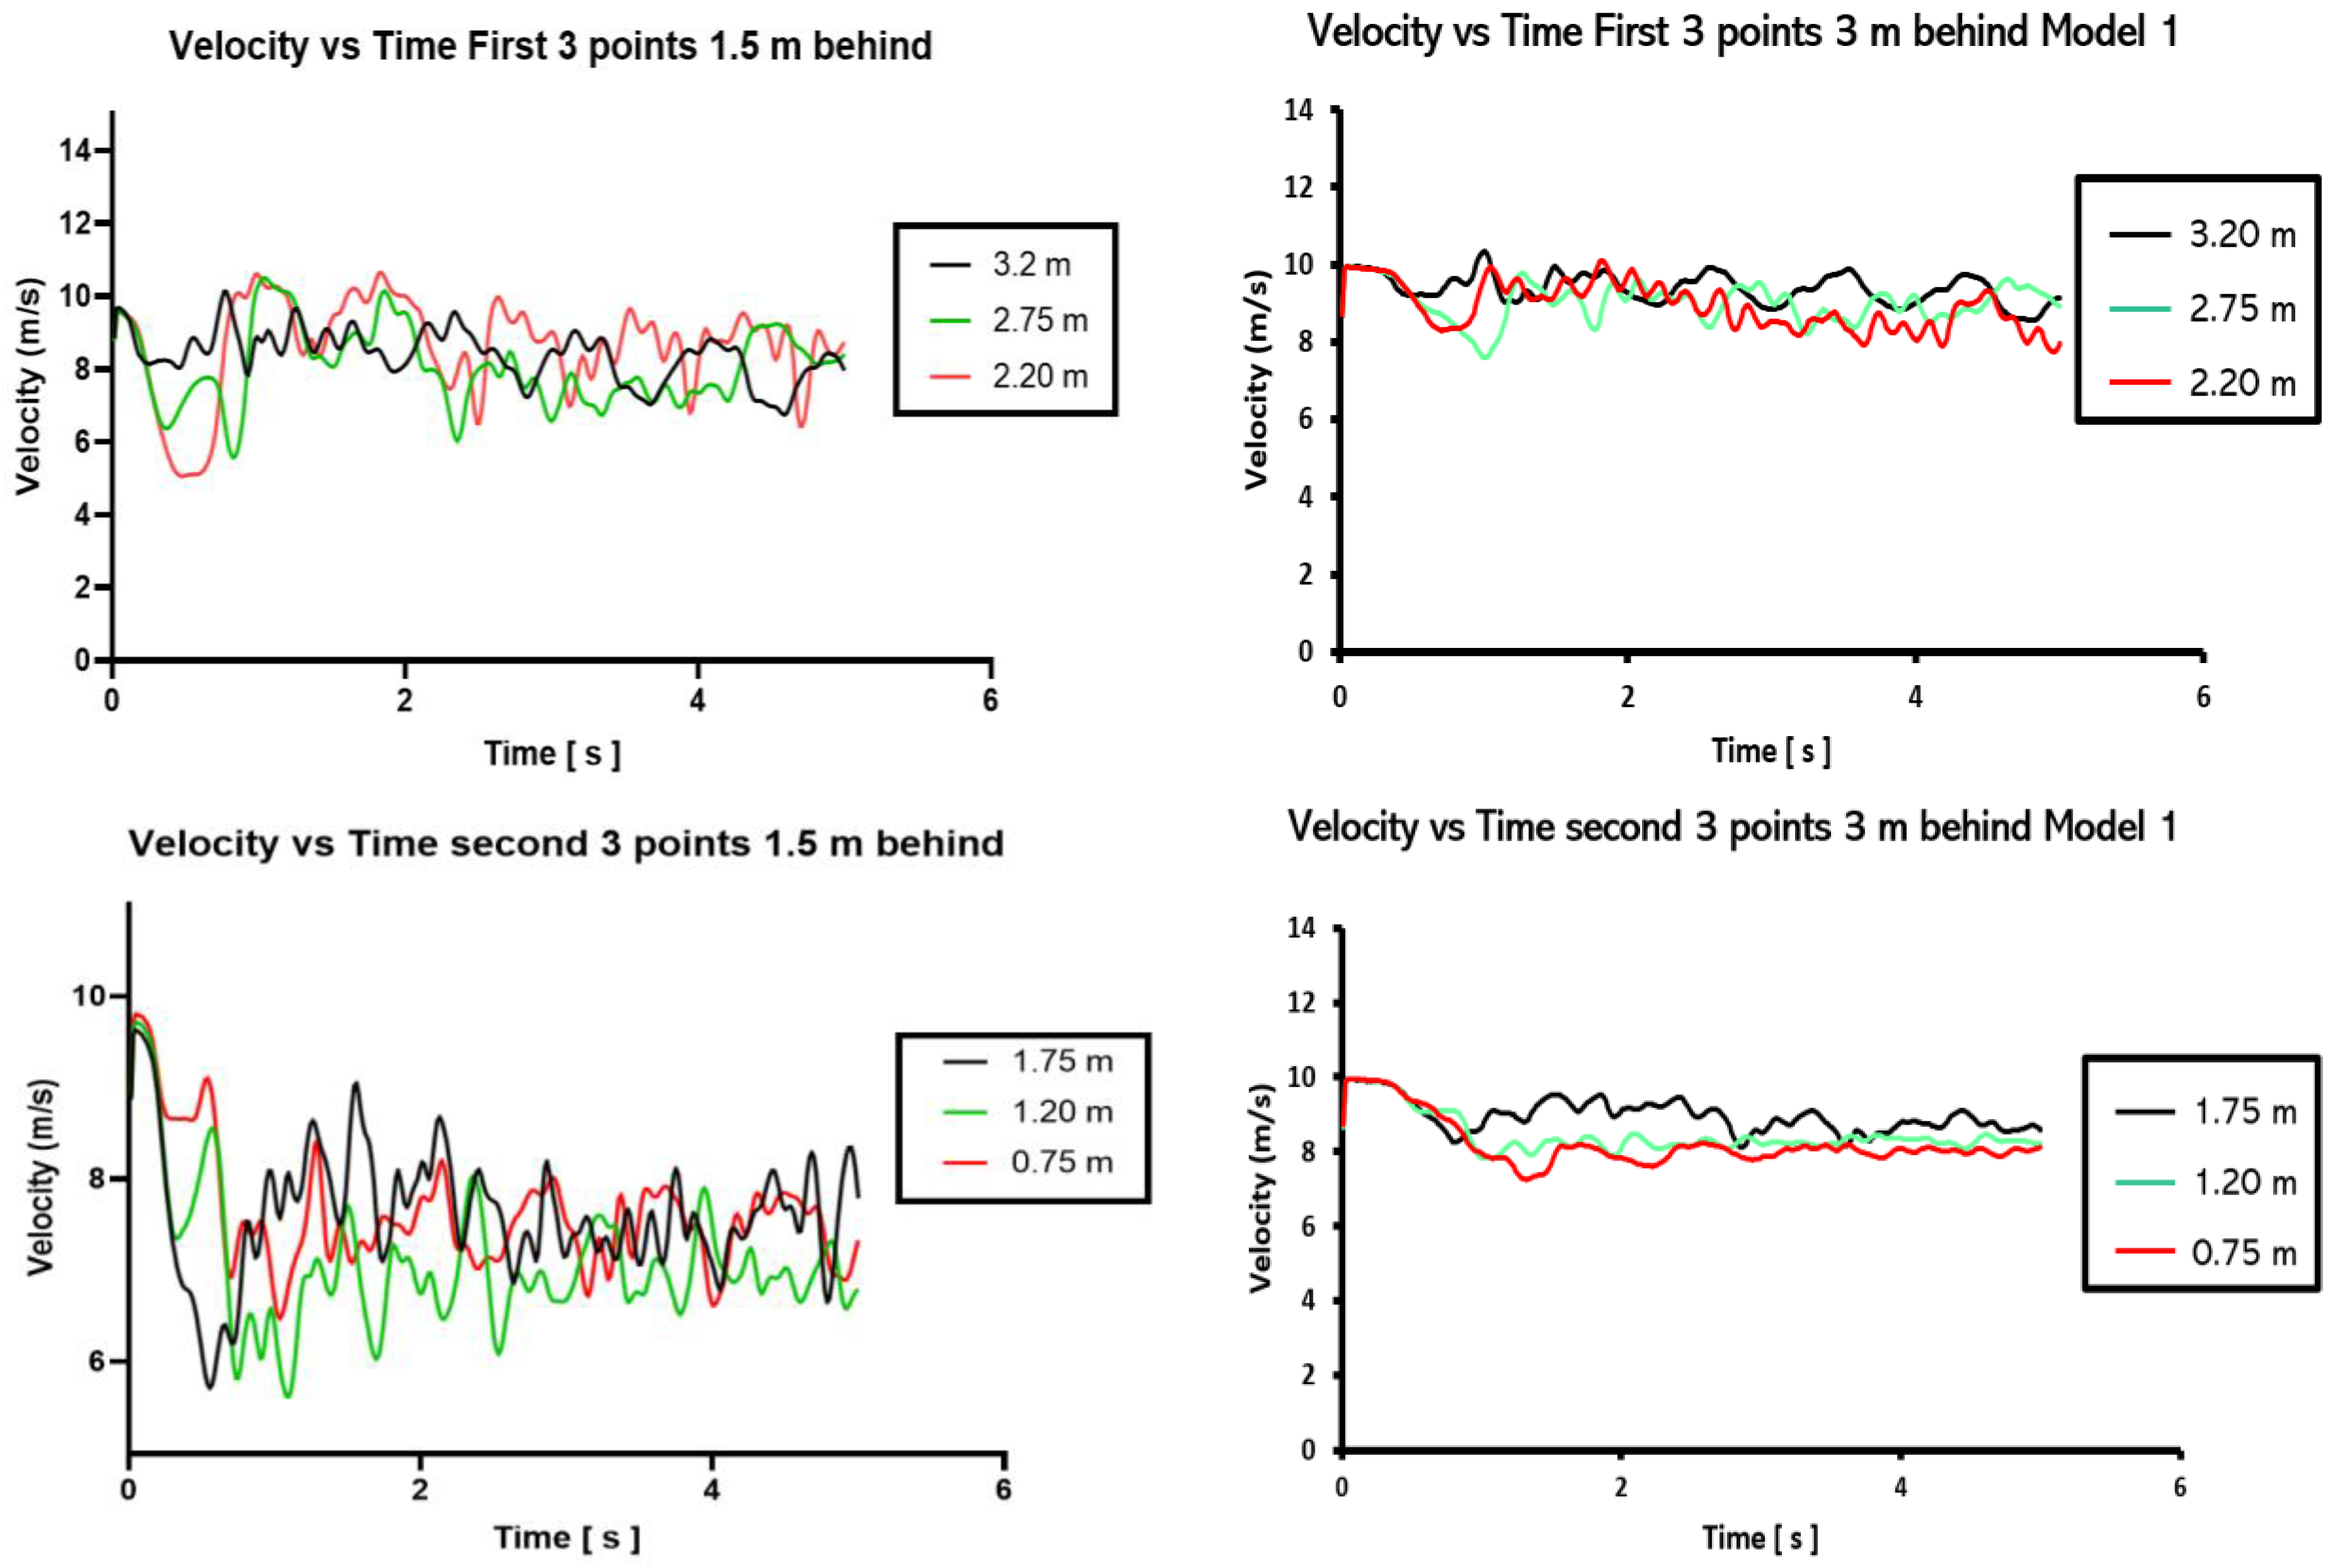
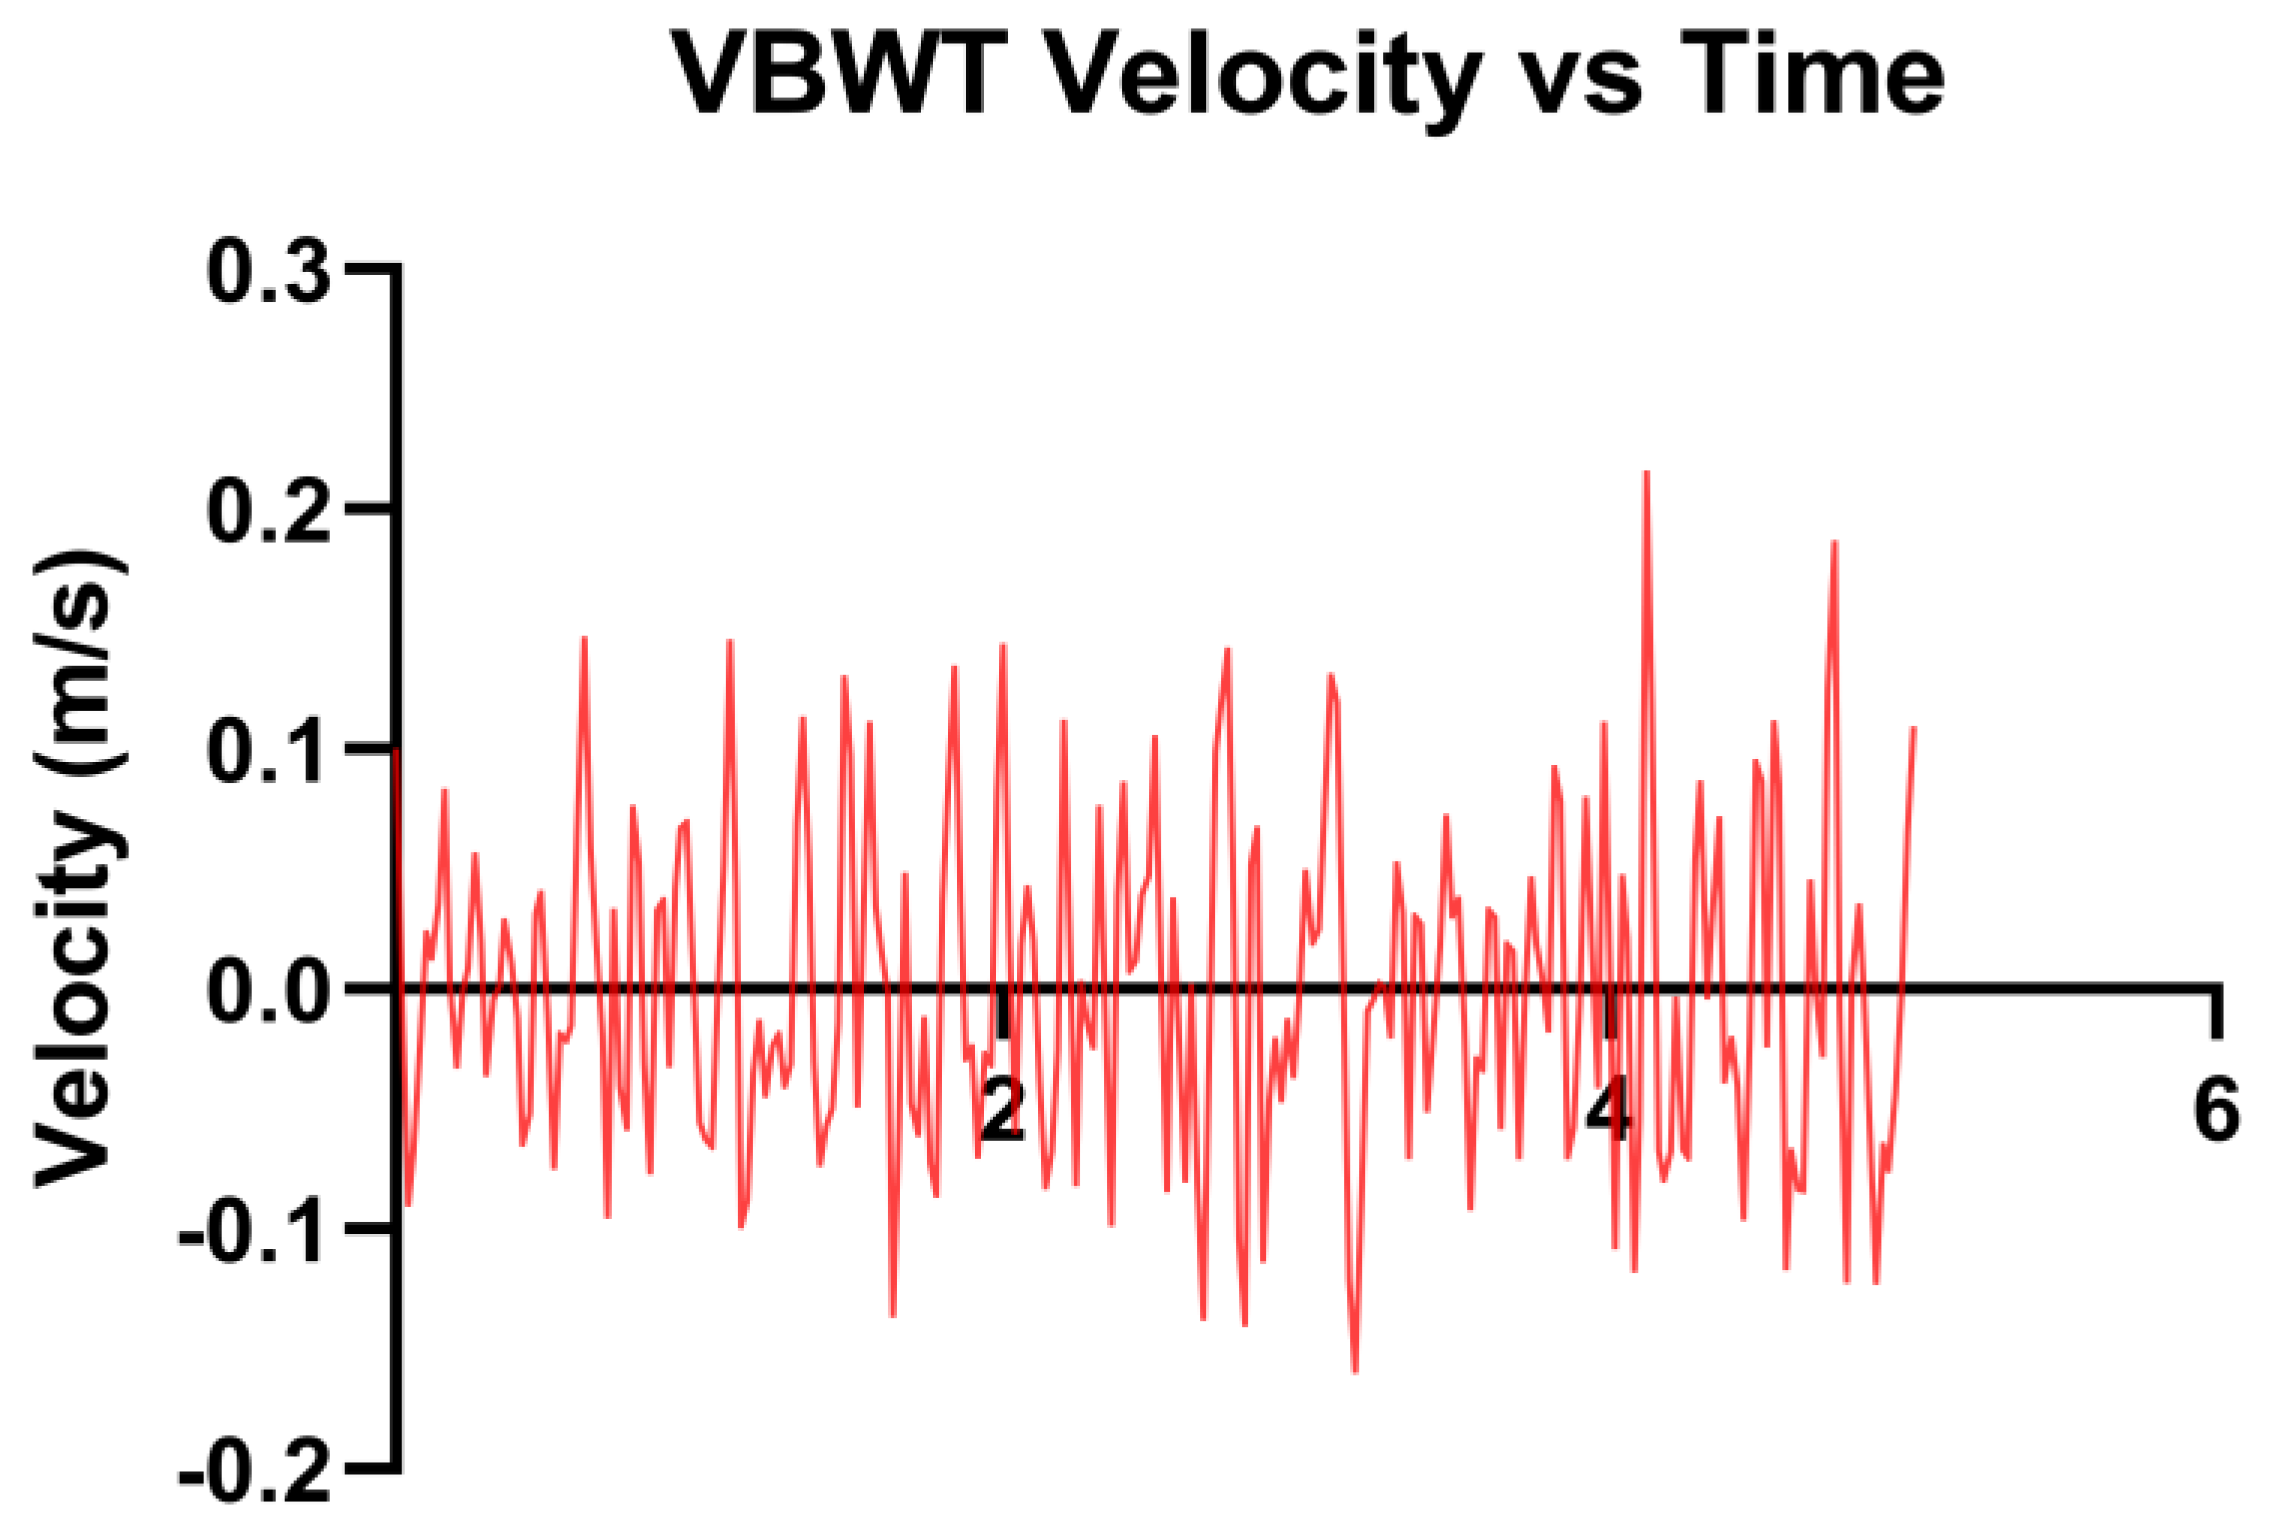
3.1. Two-Way FSI Results for Model 1
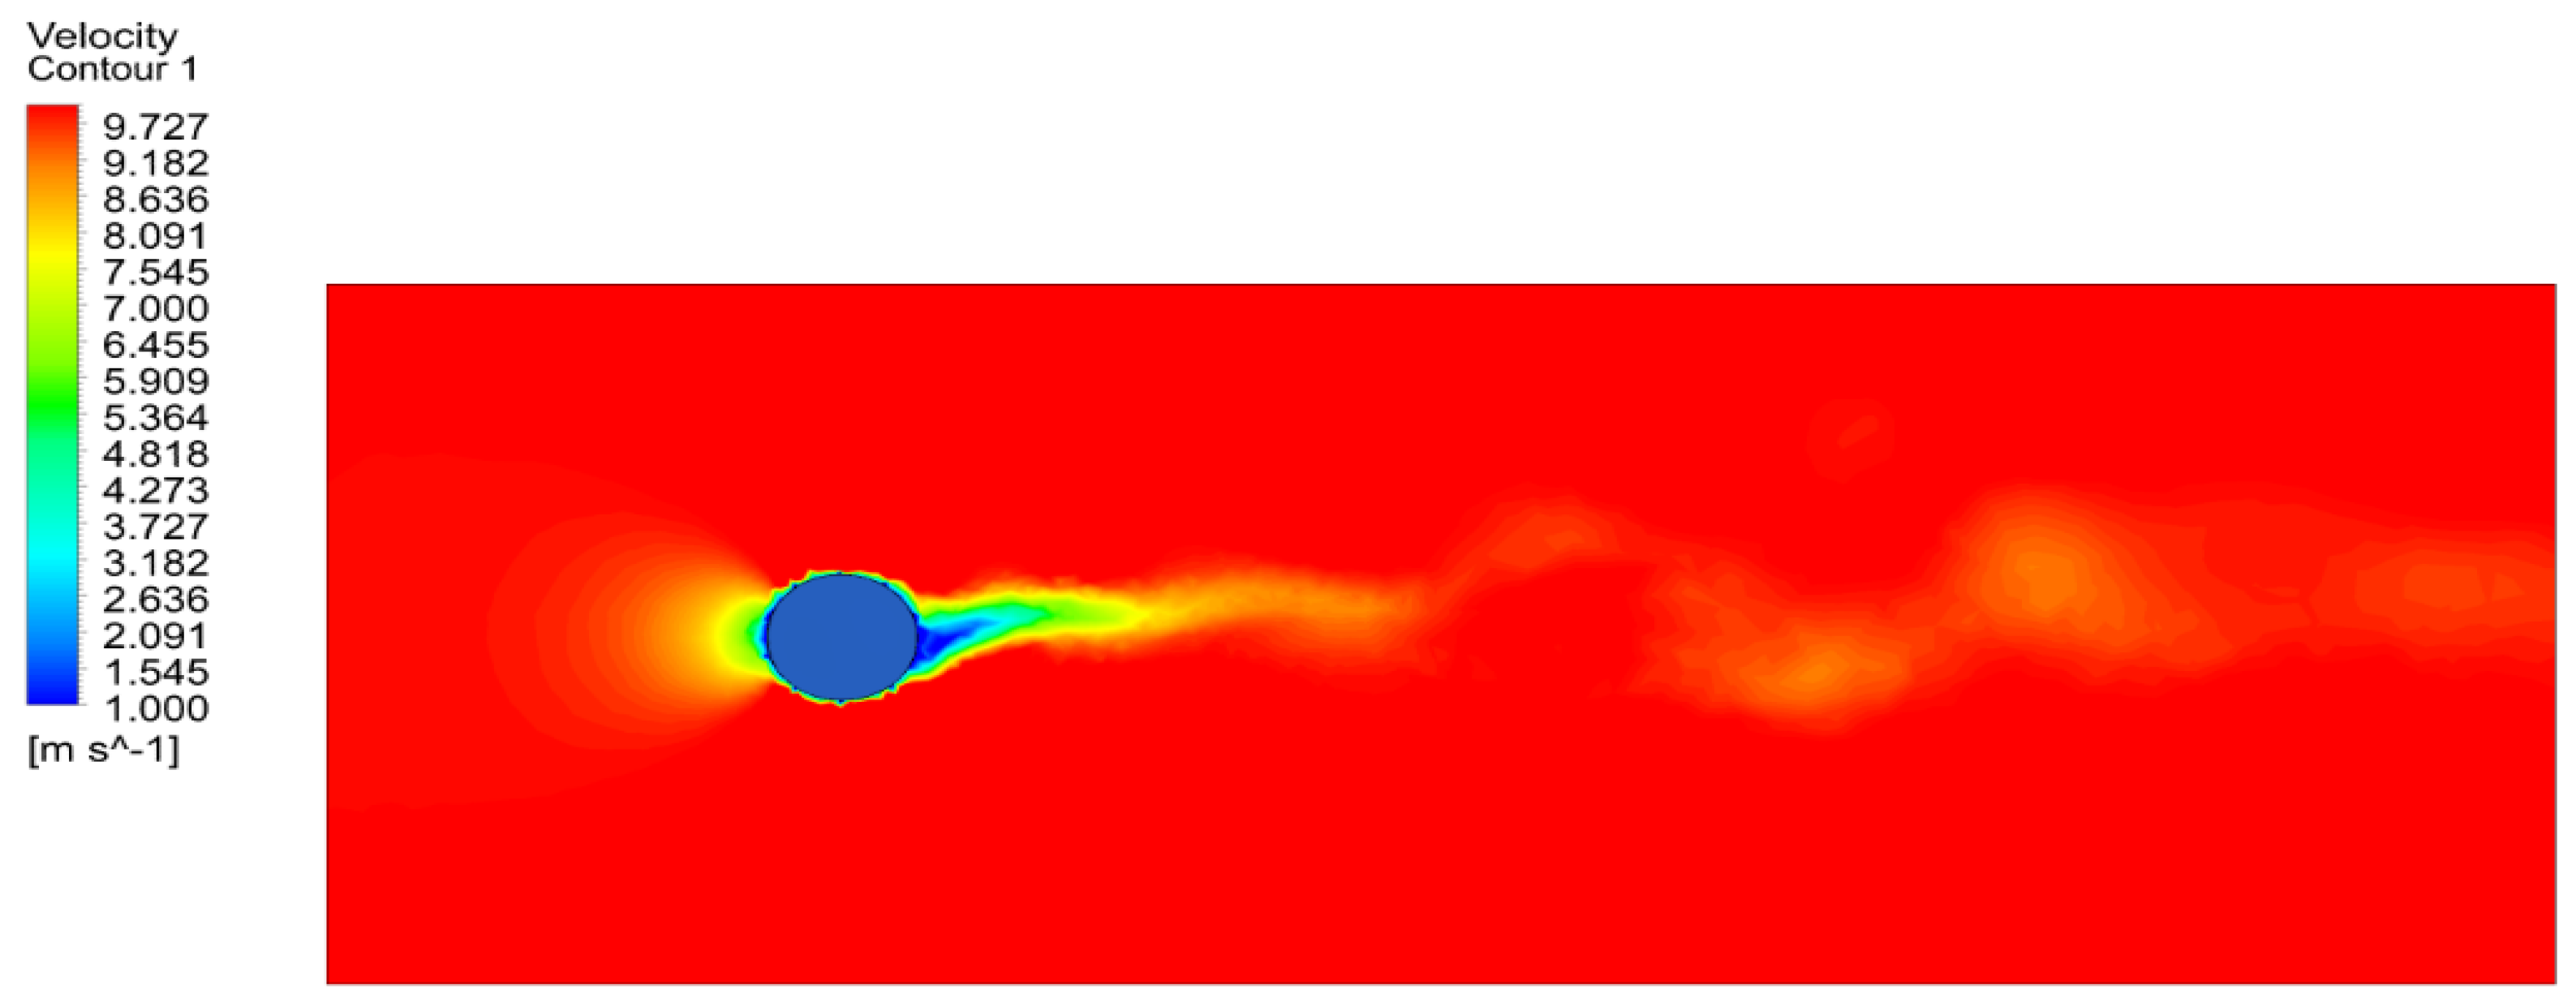
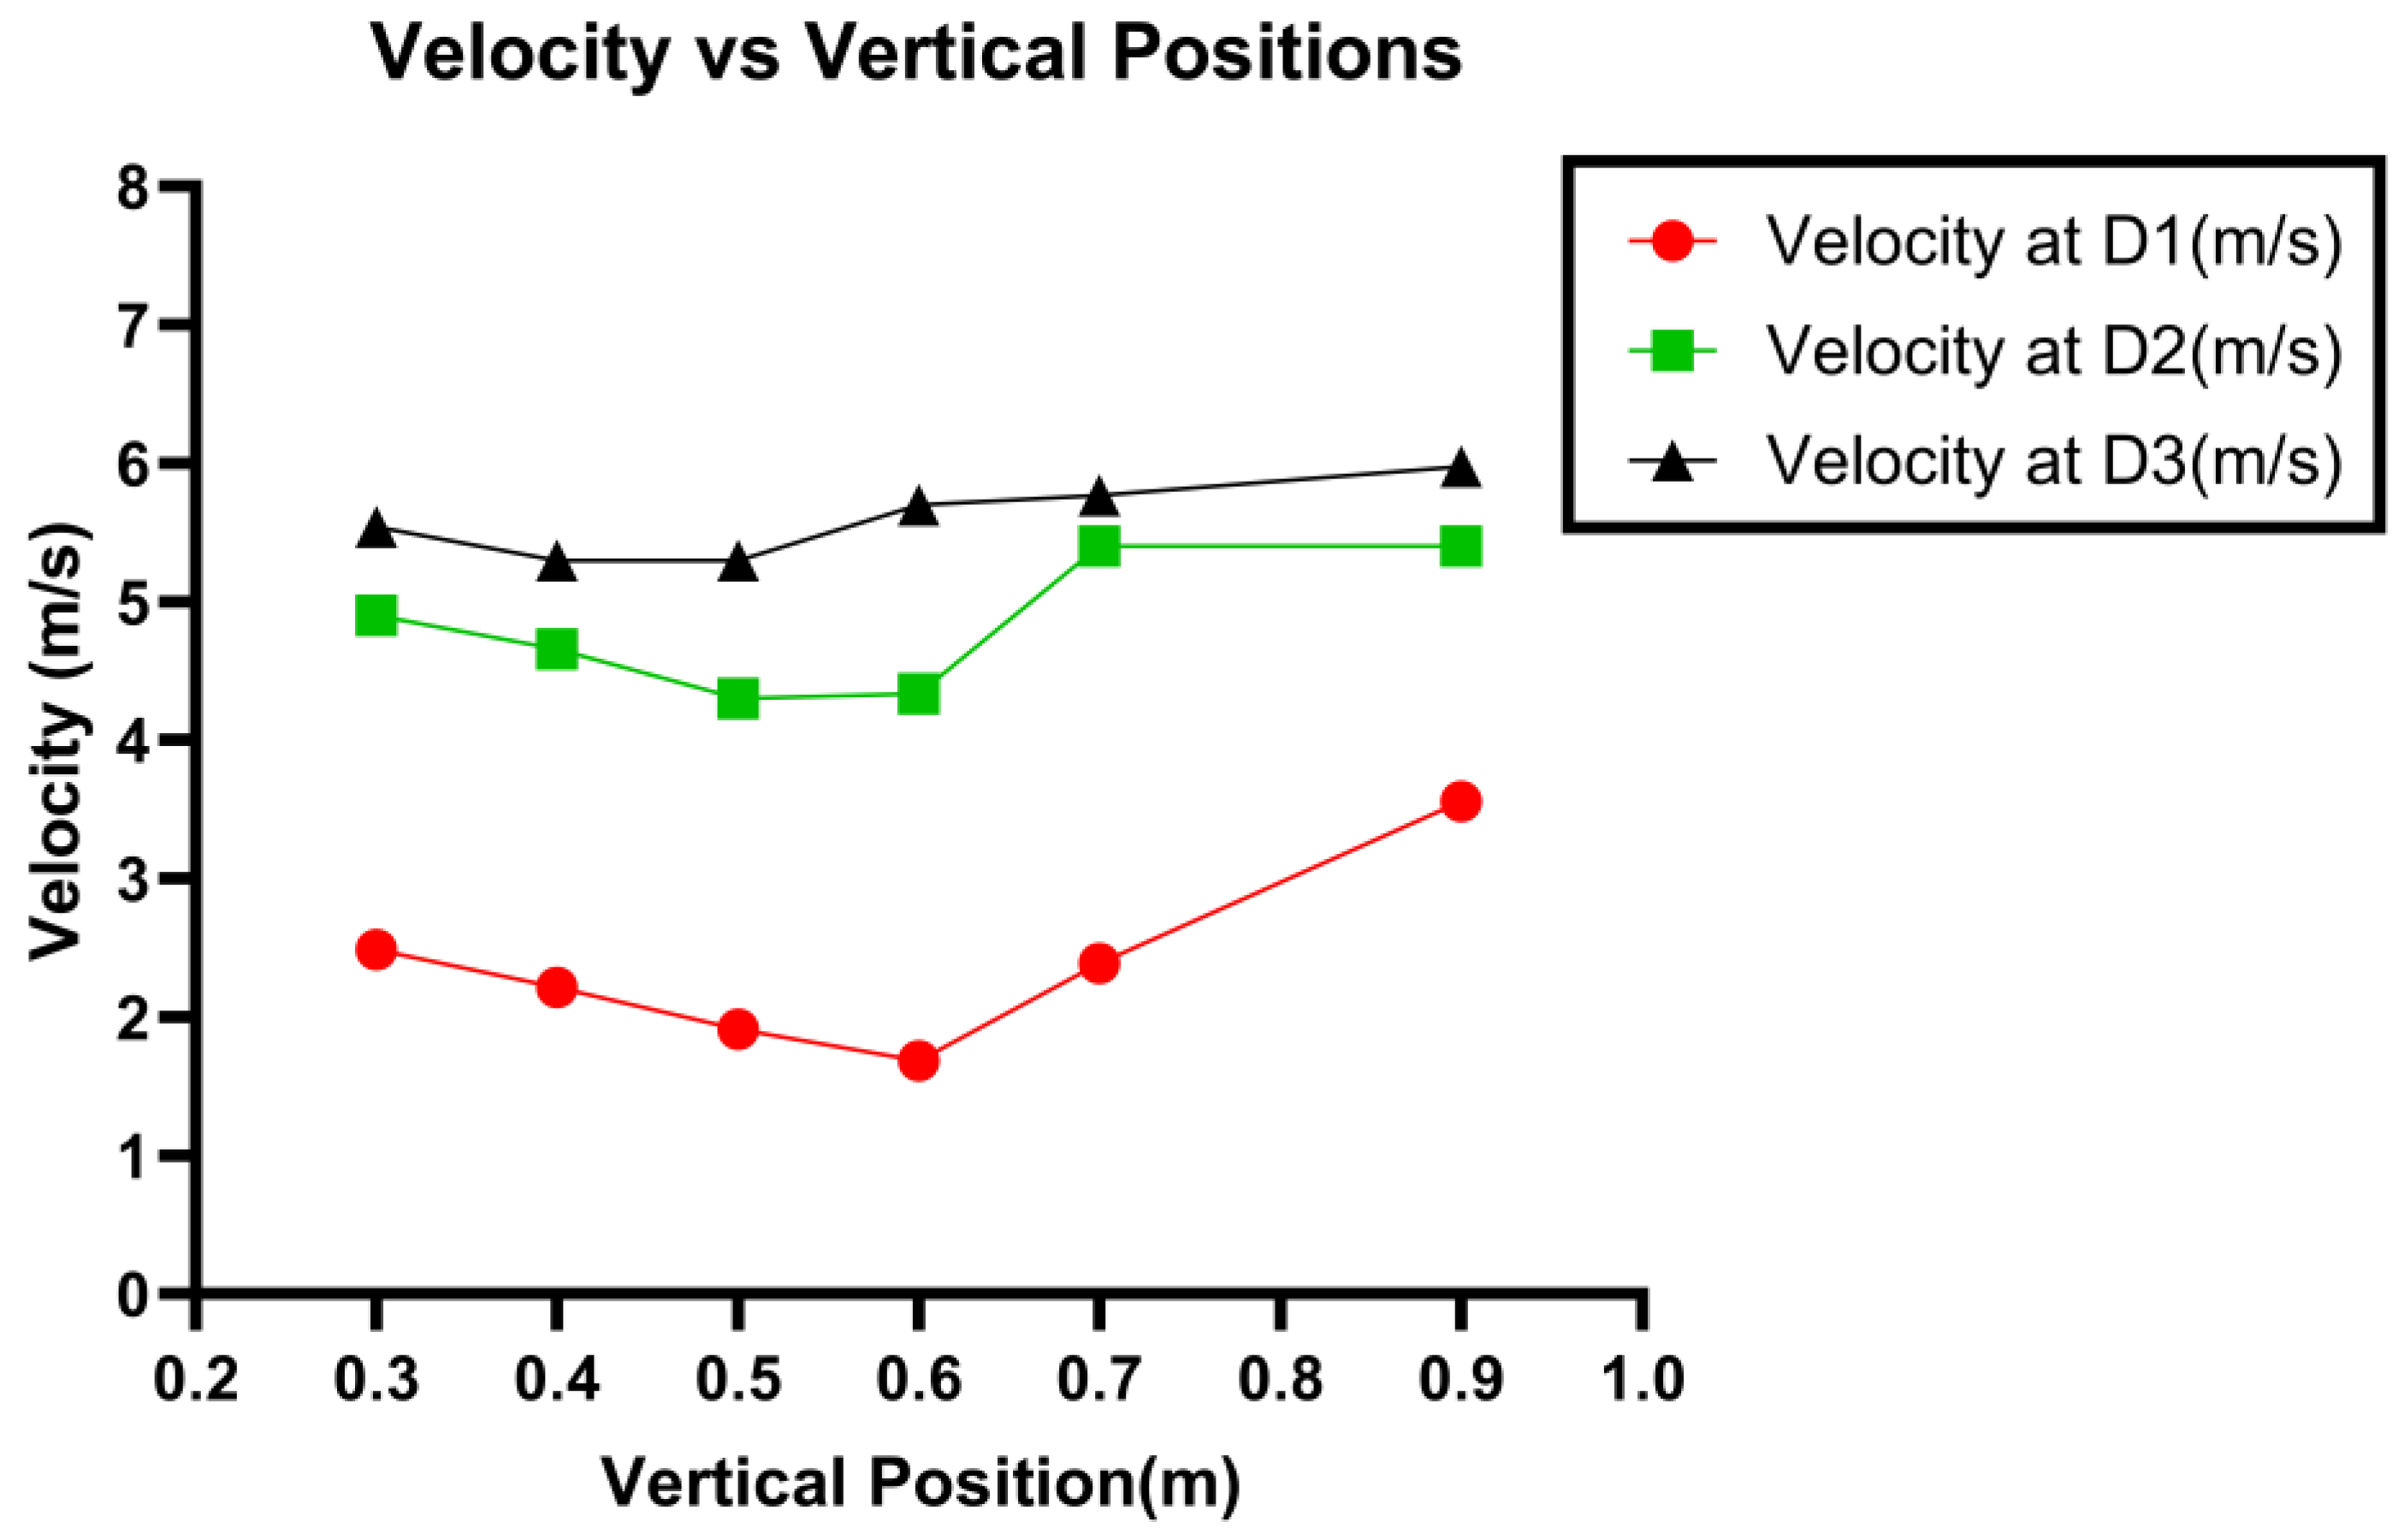
- At points closer to the ground, higher amplitudes are observed in the velocity profile. This can be attributed to the higher vortex shedding, due to proximity to the ground. Thus, the behavior of the flow can be more chaotic and turbulent.
- Furthermore, we can relate the above behavior to the wind profile. Going back to classical fluid mechanics, at higher elevations, the wind is generally faster and more consistent. Therefore, less turbulence is observed in the velocity profile for the first three points.
- As described by the structure of the mast, there are more vibrations at the base, which decrease the waves propagated towards the top of the mast. Hence, there is lower vortex shedding at the top.
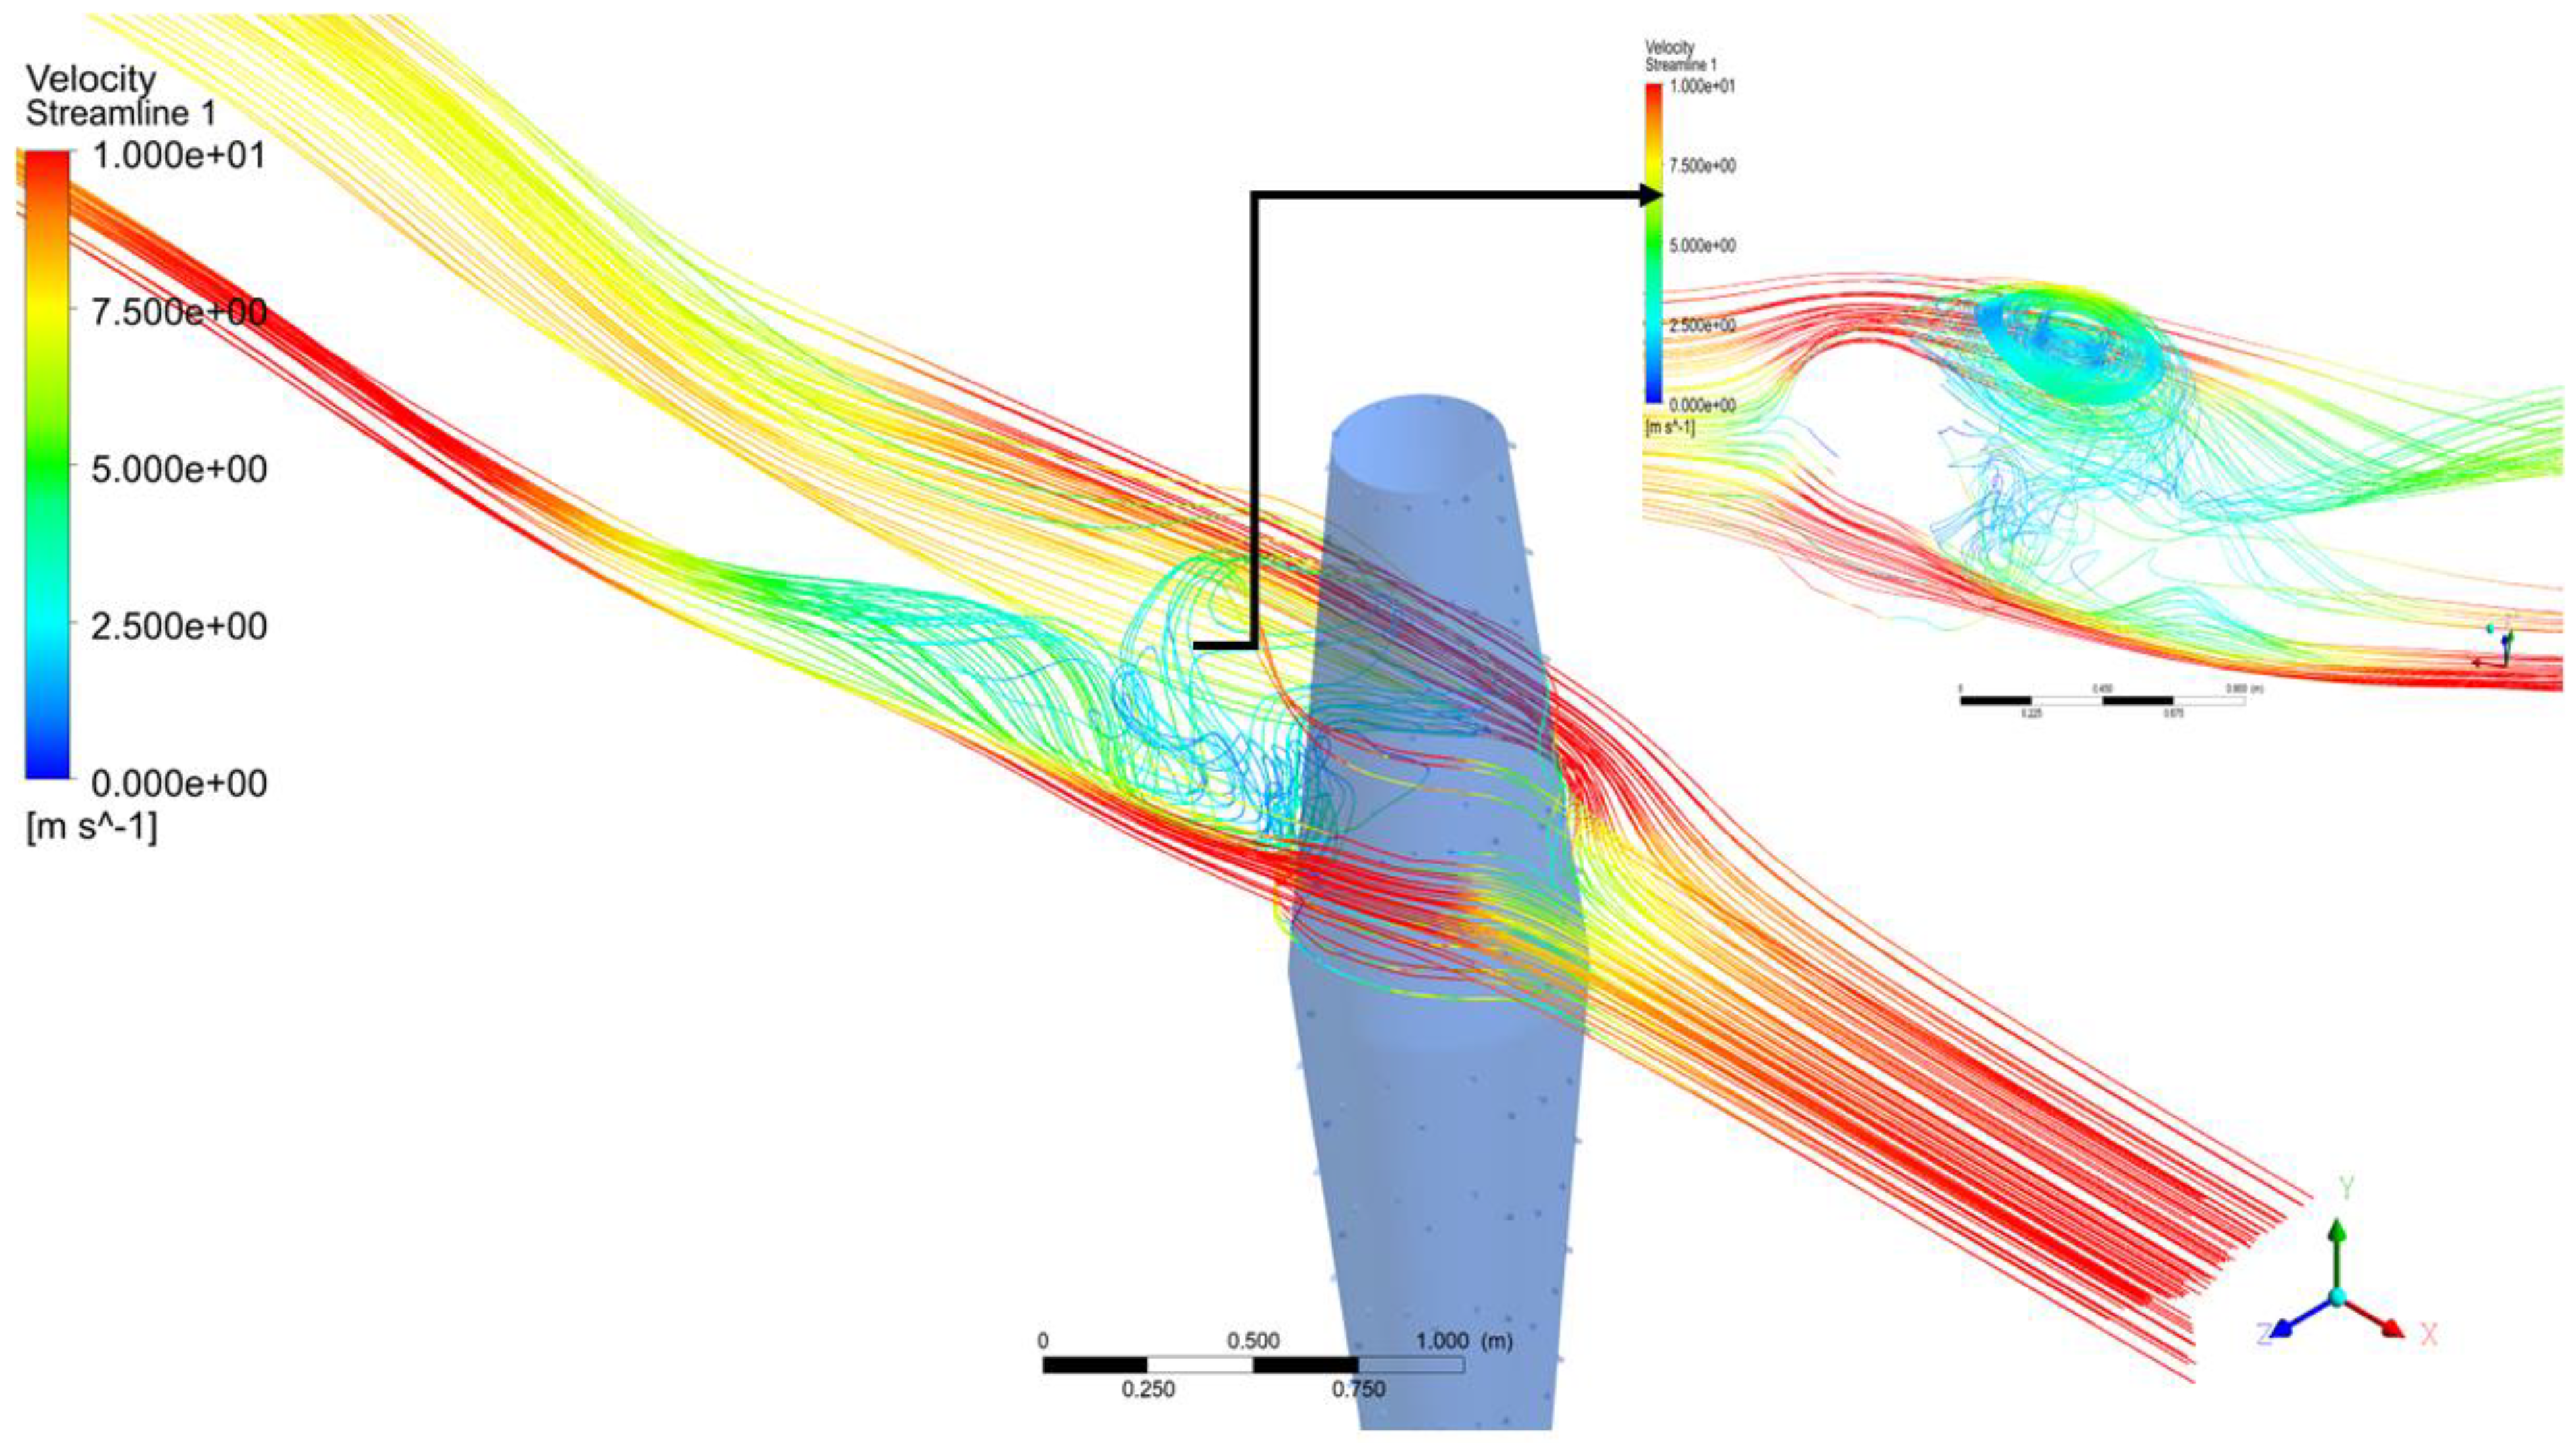
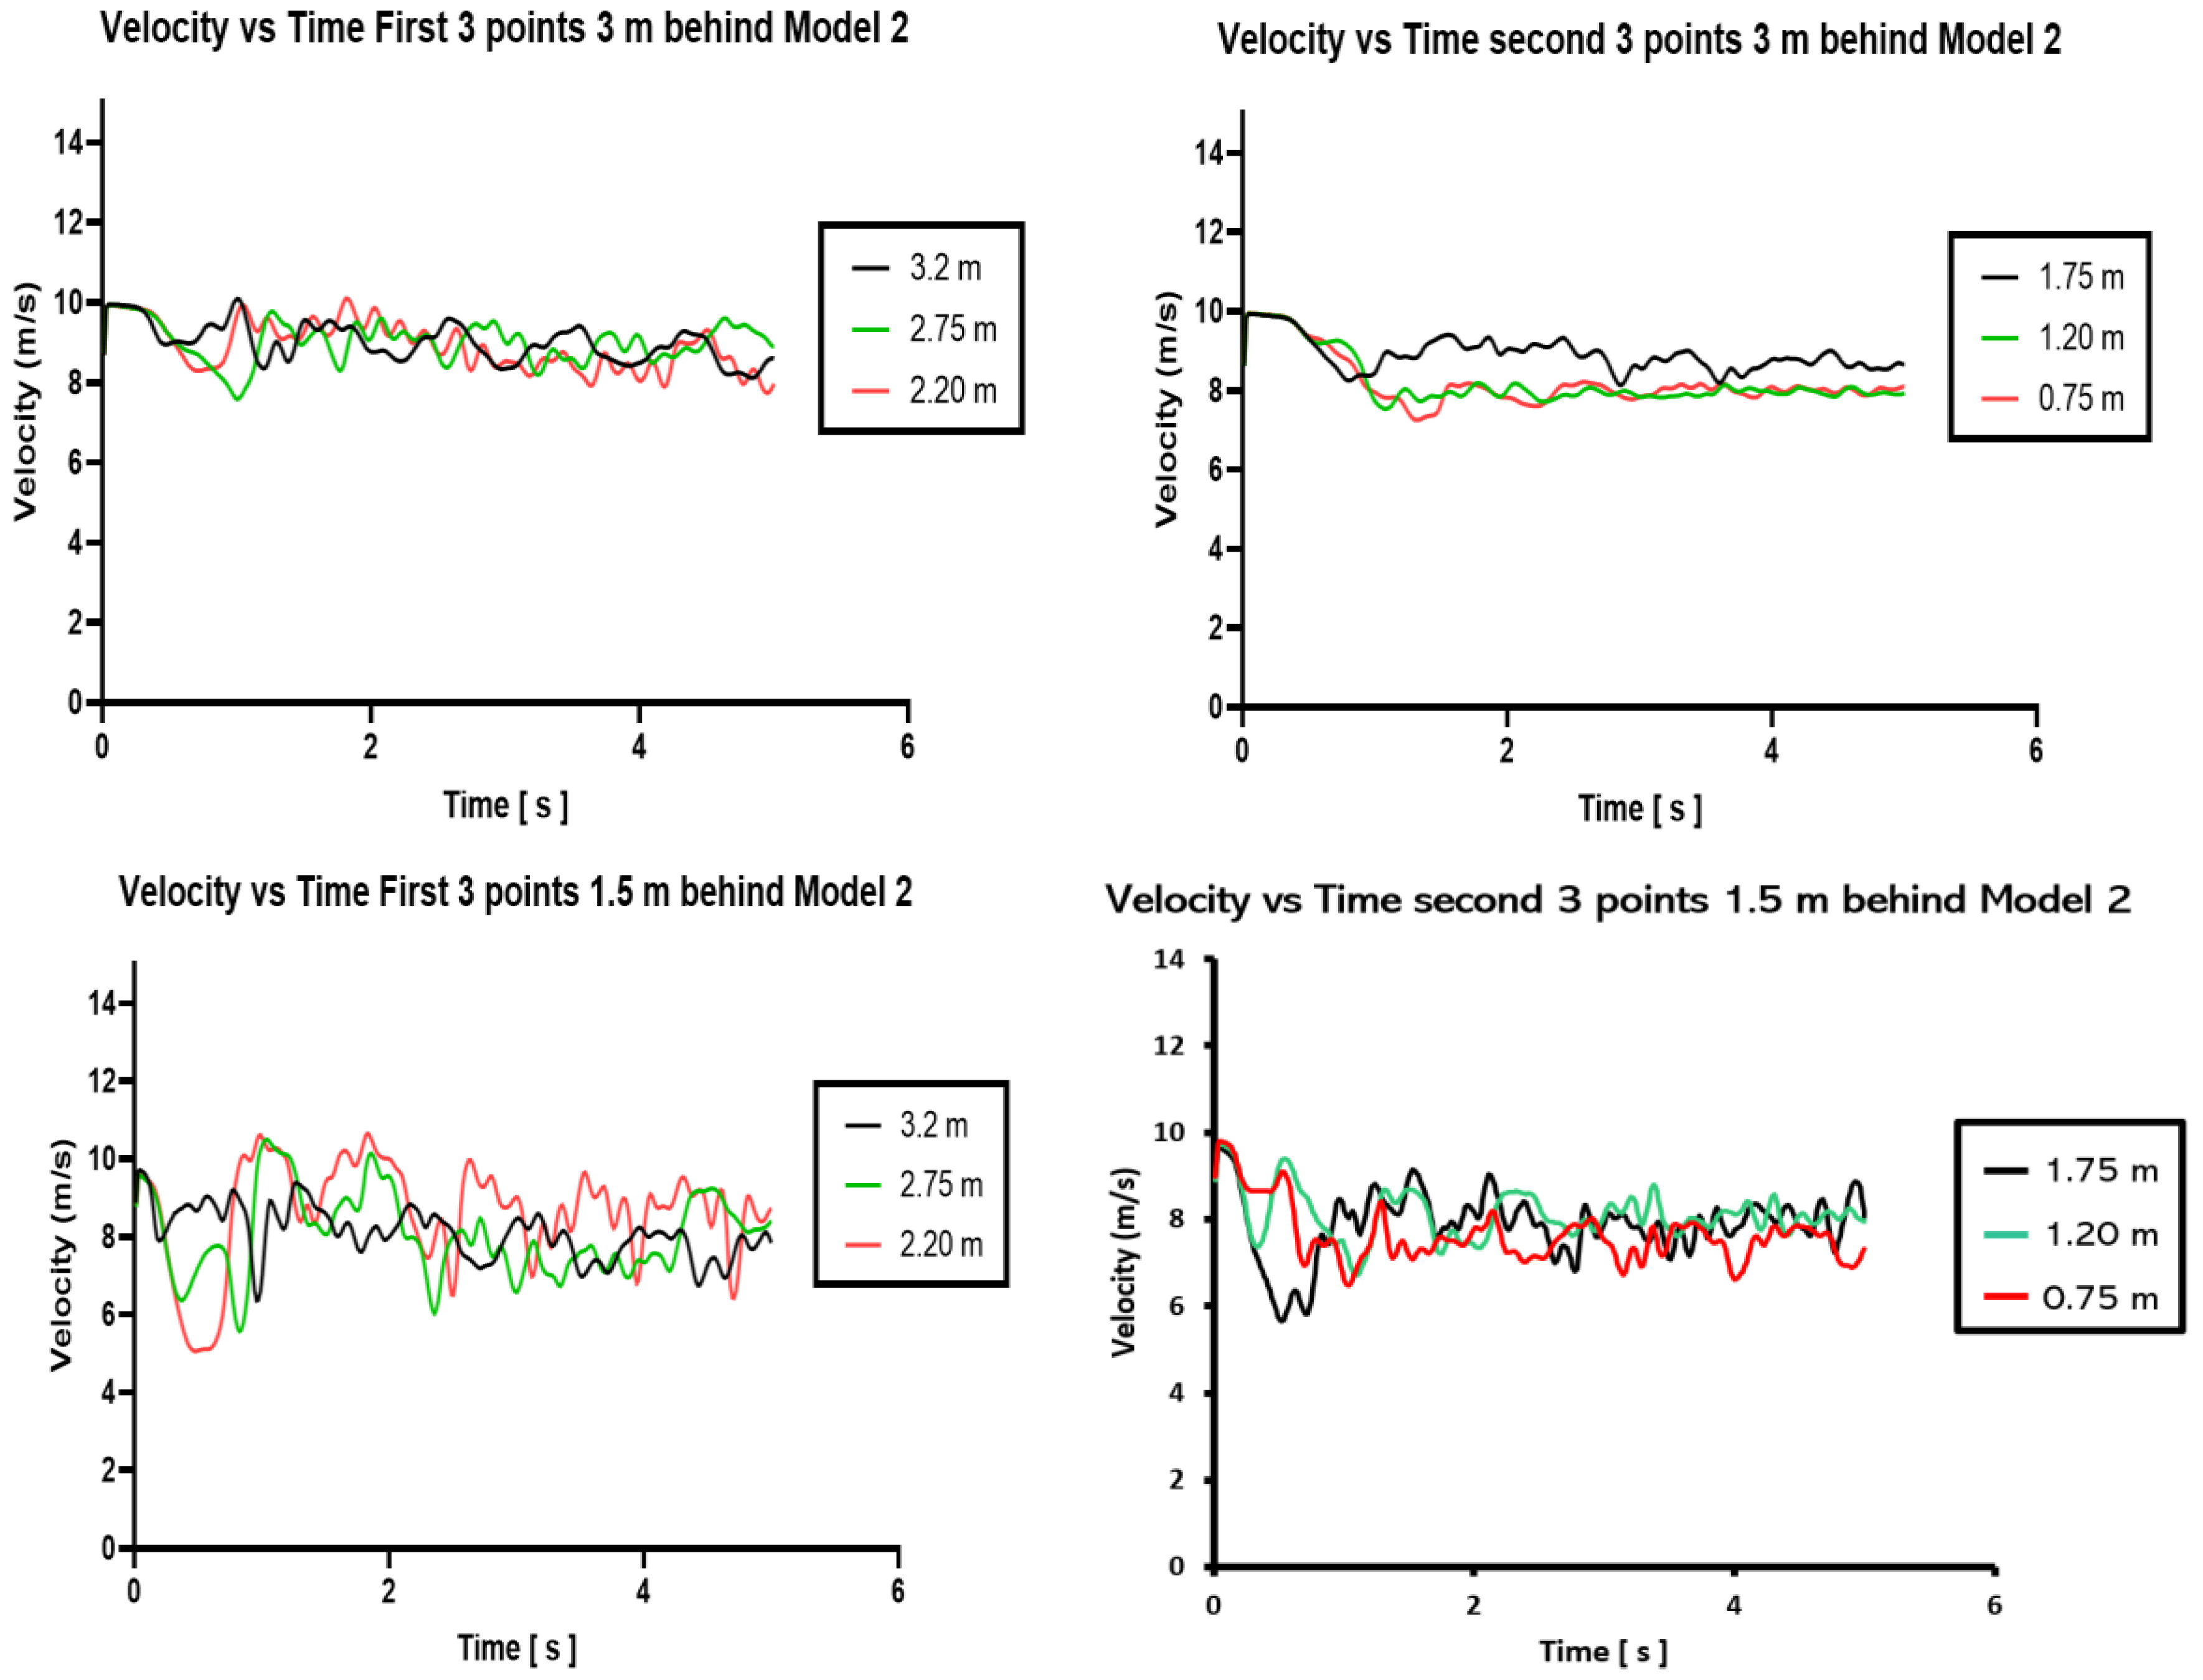
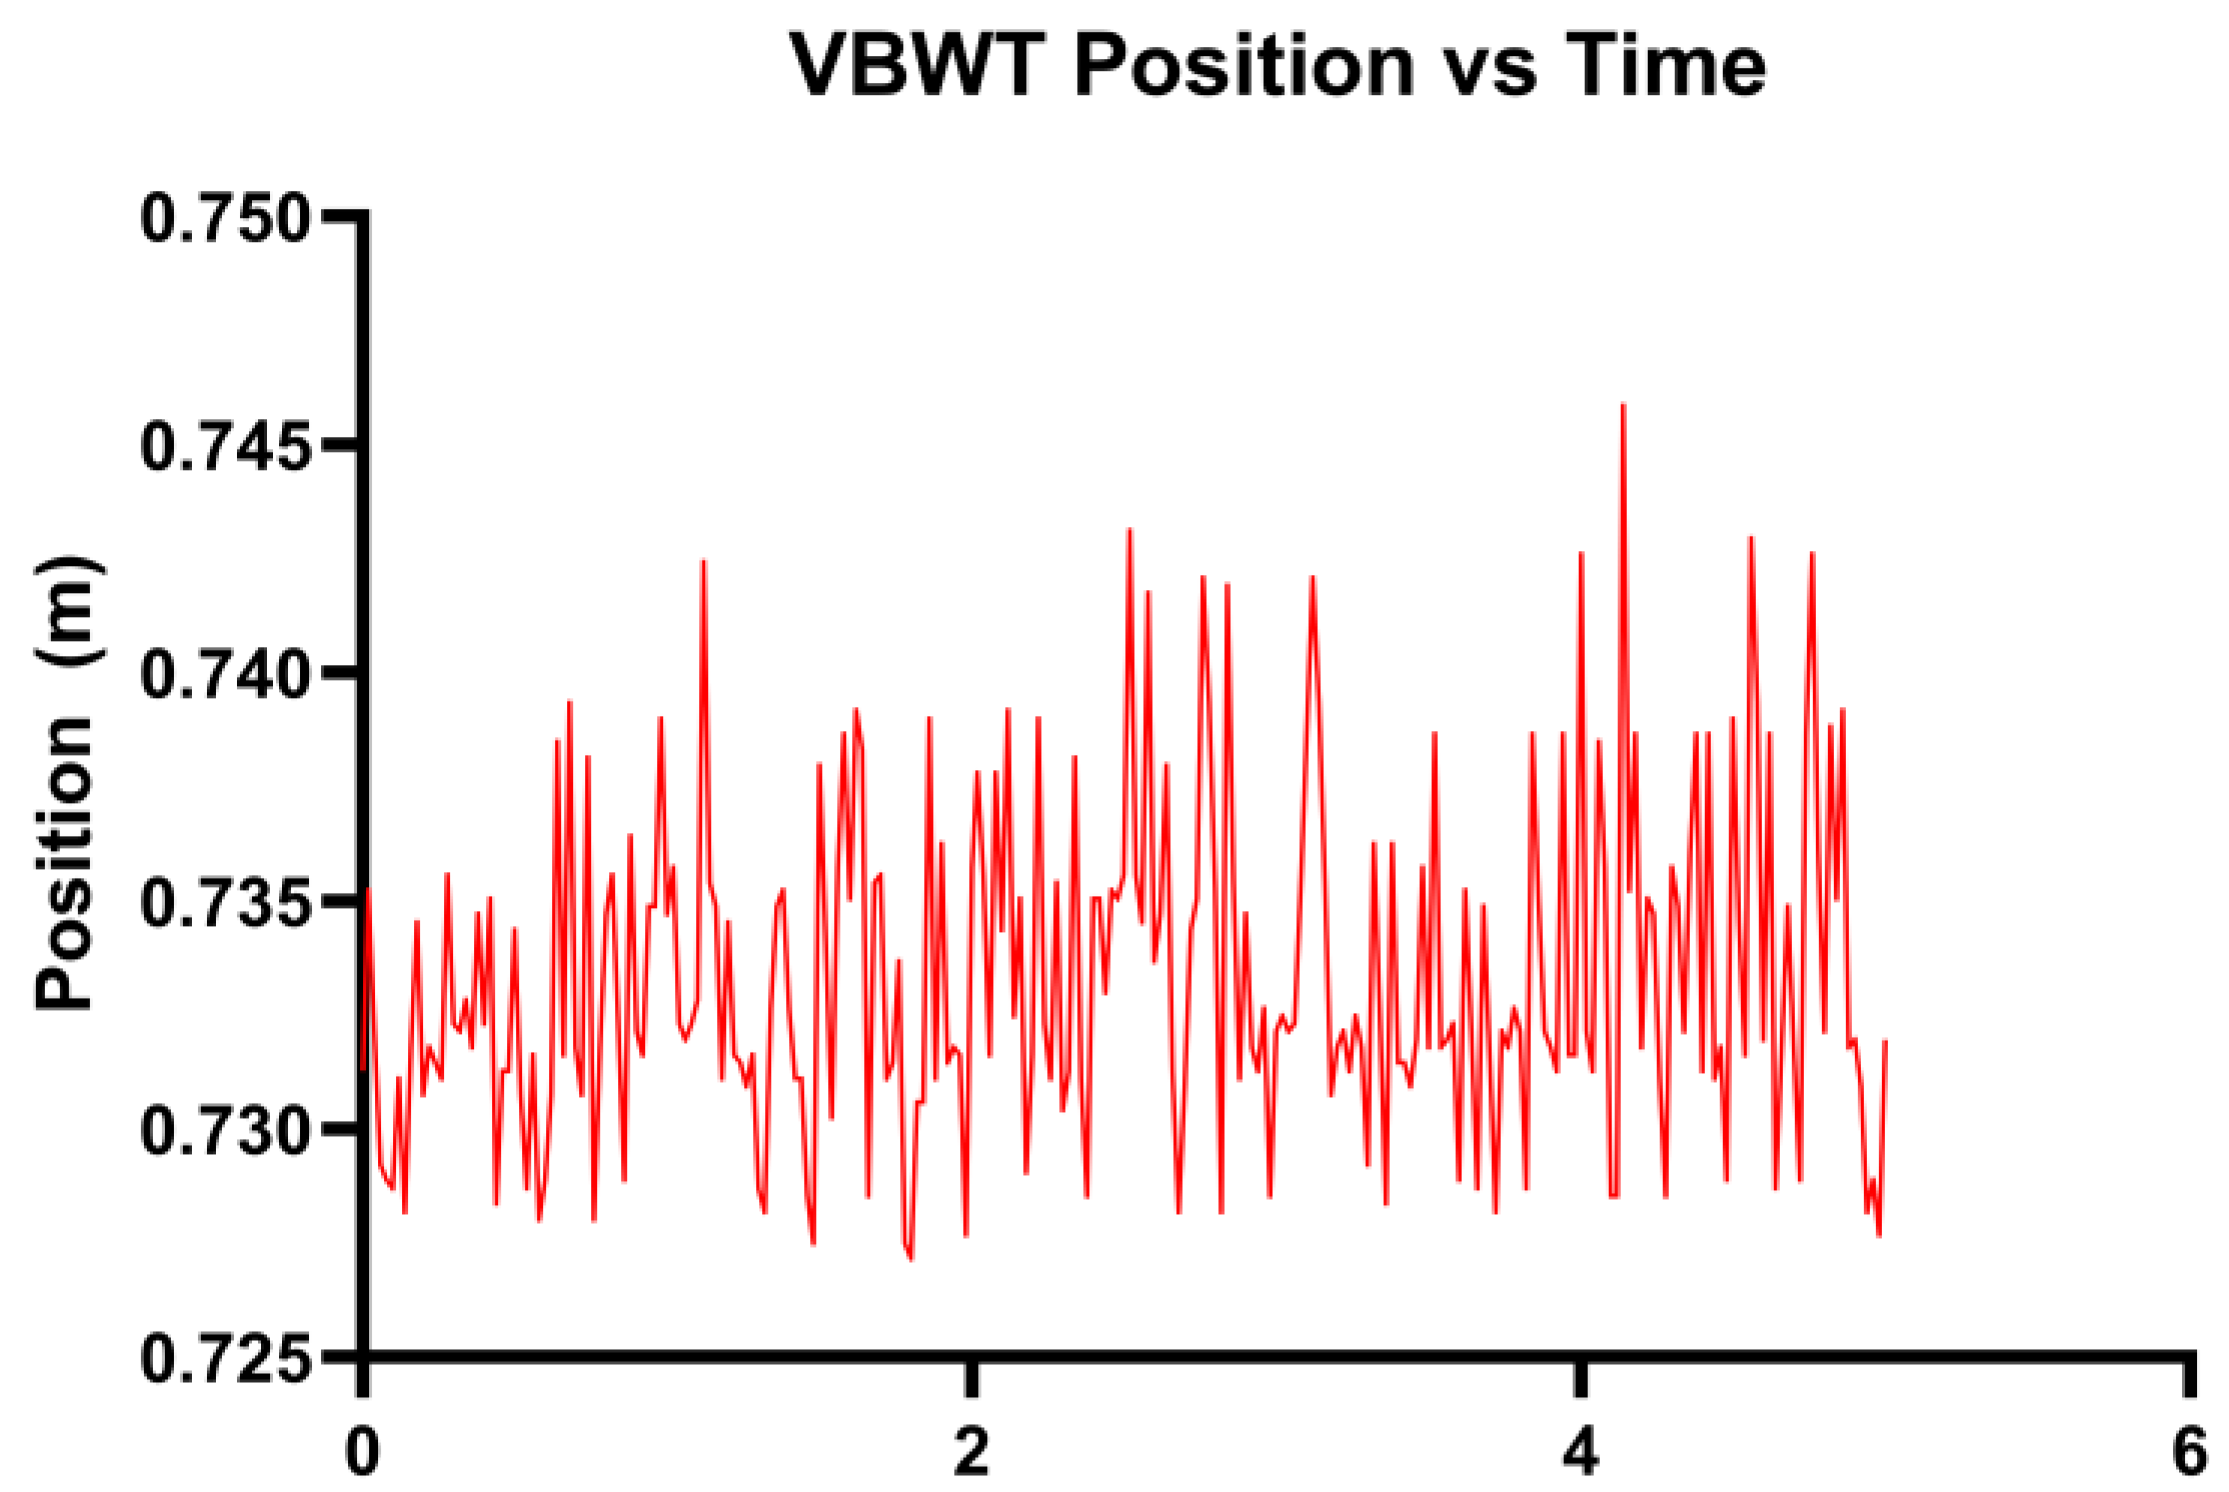
3.2. Two-Way FSI Results for Model 2
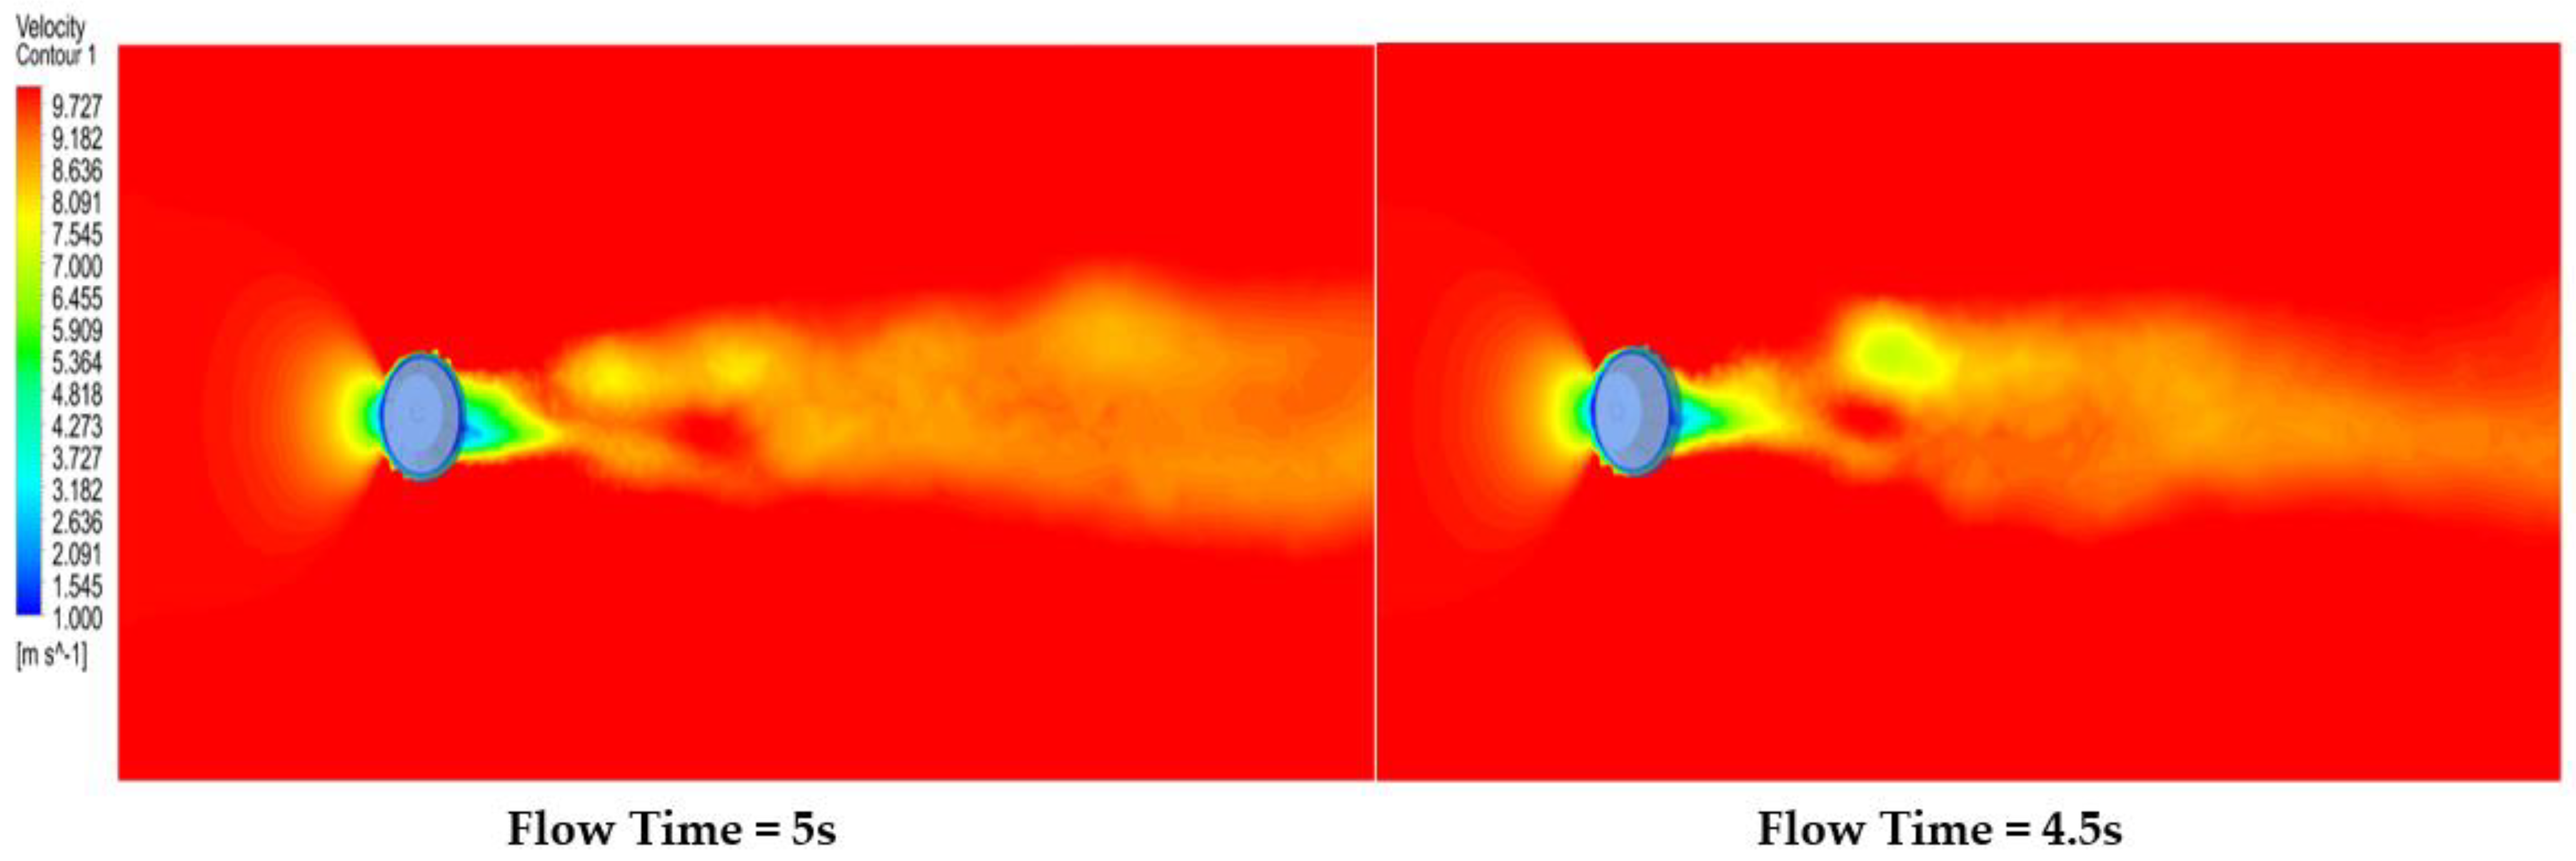
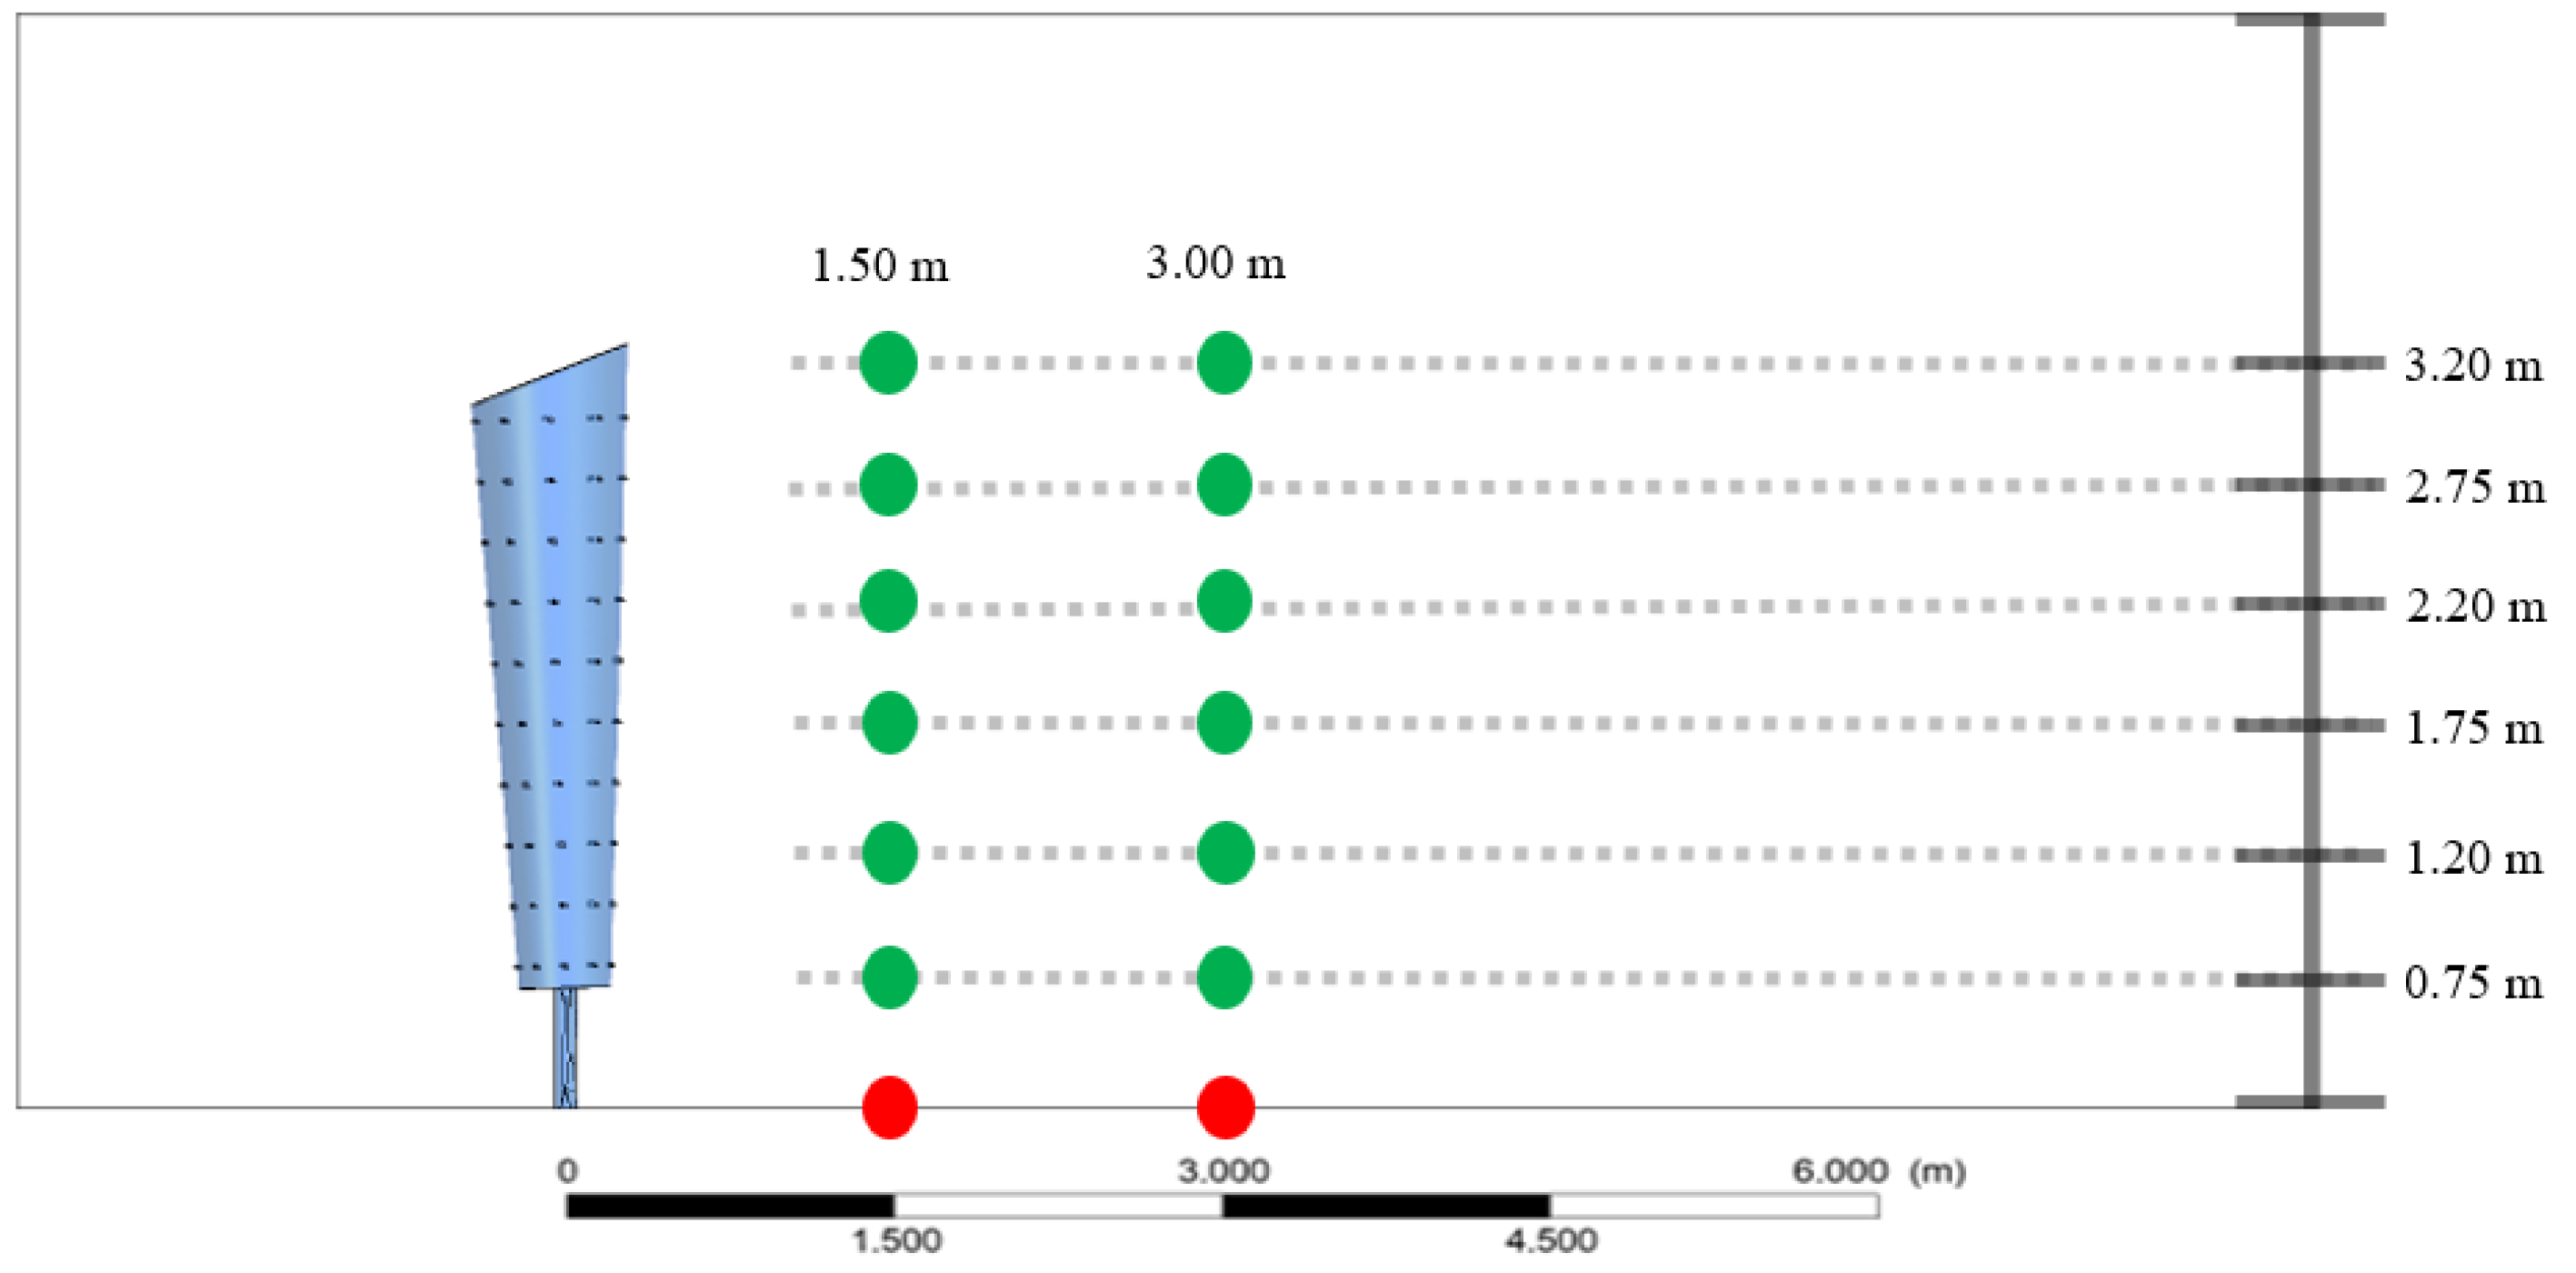
- At a closer distance, i.e., 1.5 m, the flow is strongly influenced by the vortex shedding occurring downstream of the VBWT, thus causing a larger fluctuation in the velocity, which translates to the higher amplitudes observed in the above plots.
- At a further distance, i.e., 3 m, the fluctuations begin to dampen, because the energy from the shedding begins to dissipate as it mixes with the surrounding airflow and environmental conditions, such as the pressure.
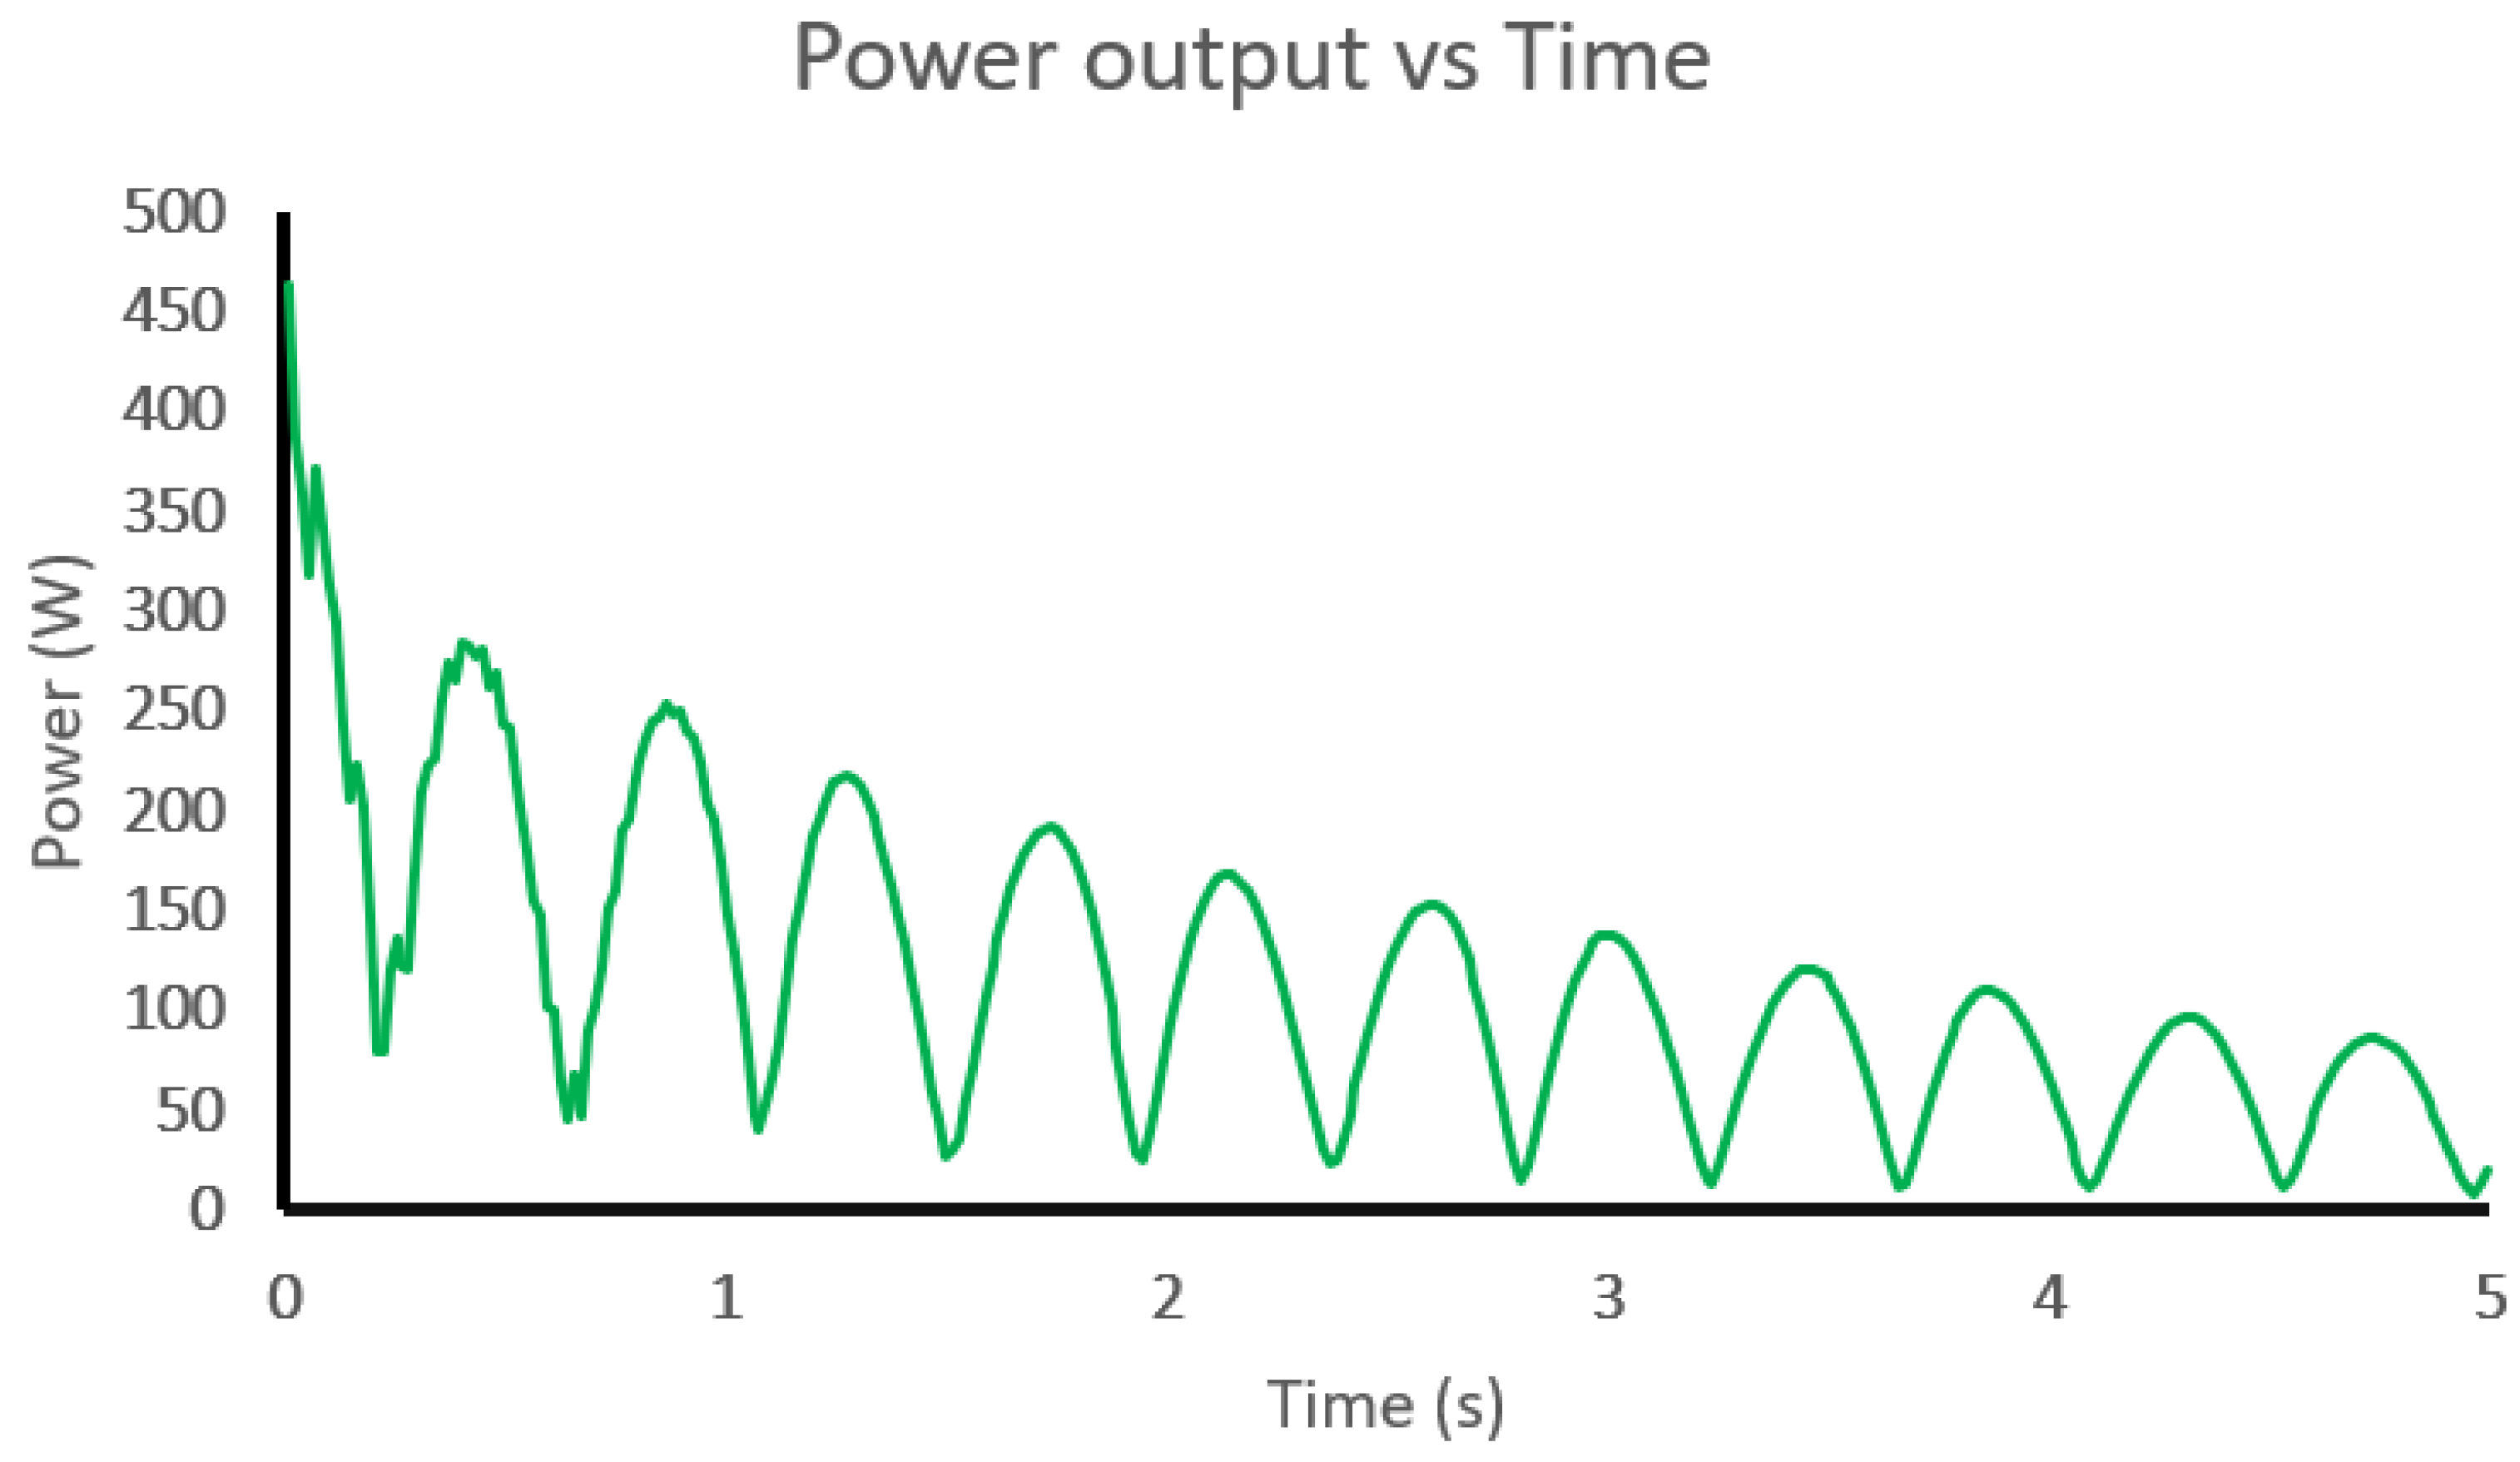
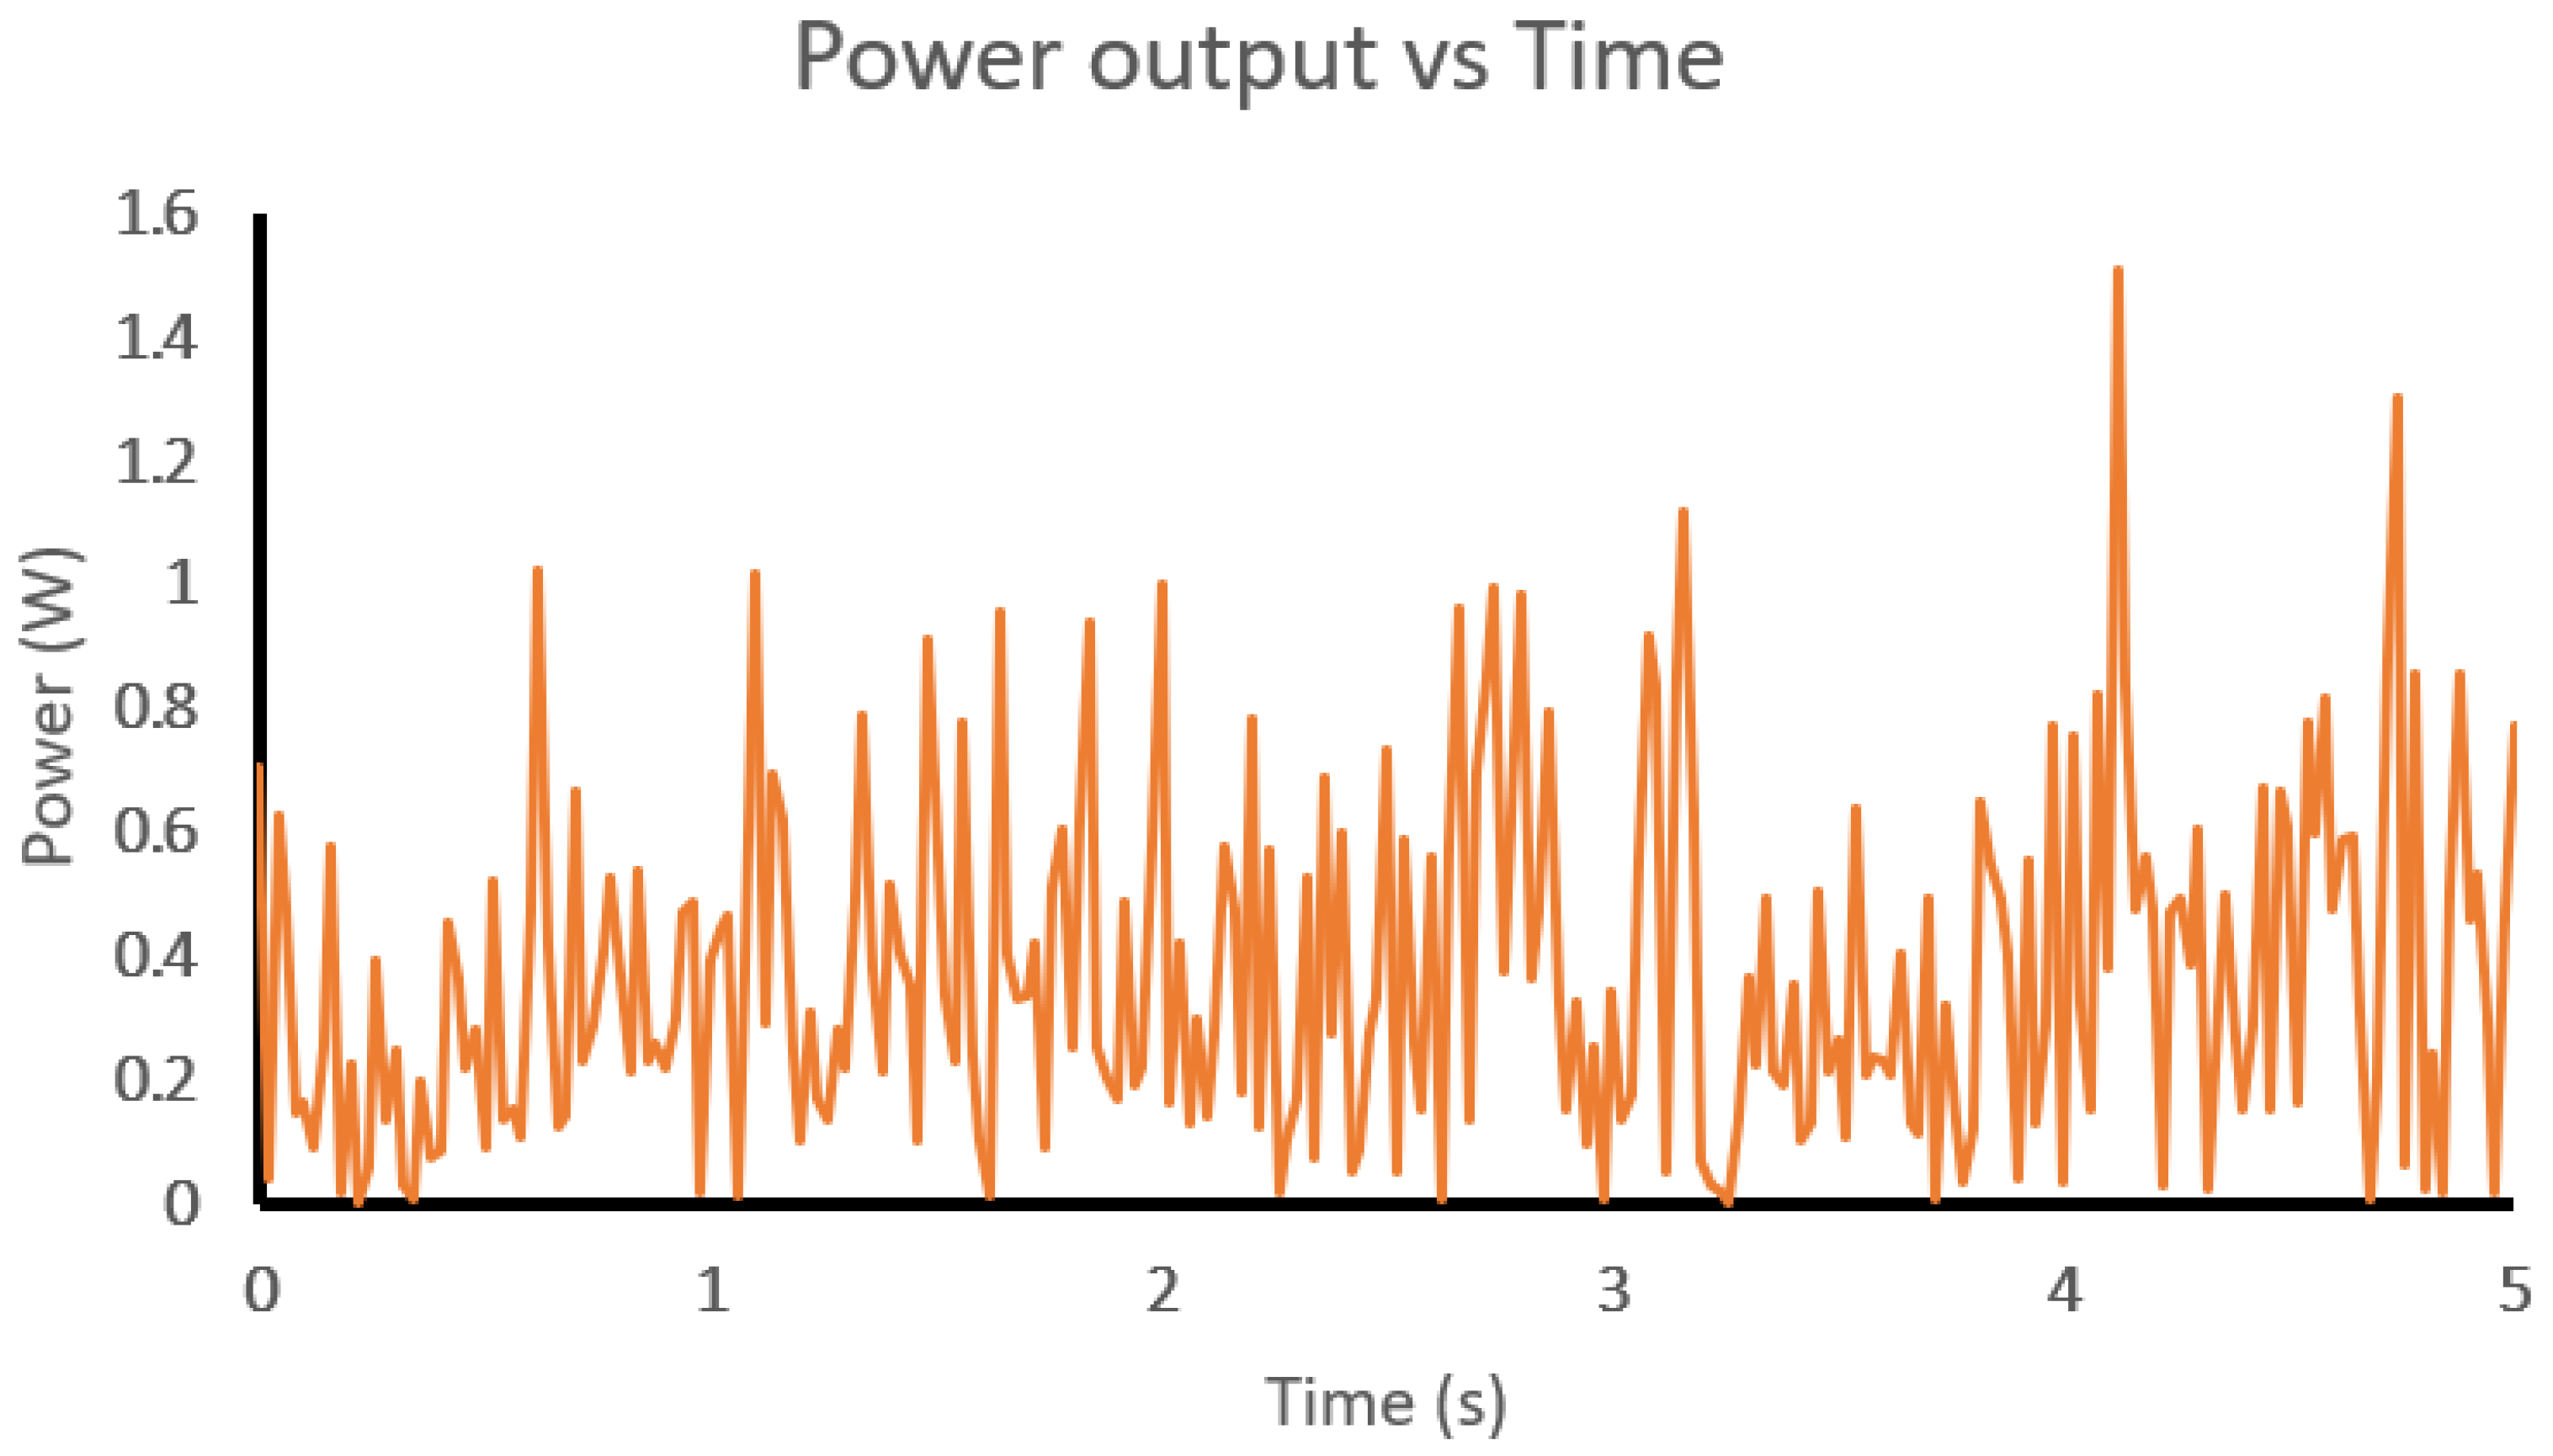
3.3. Power Calculation
3.4. Experimental Results
3.5. Energy Storage Systems
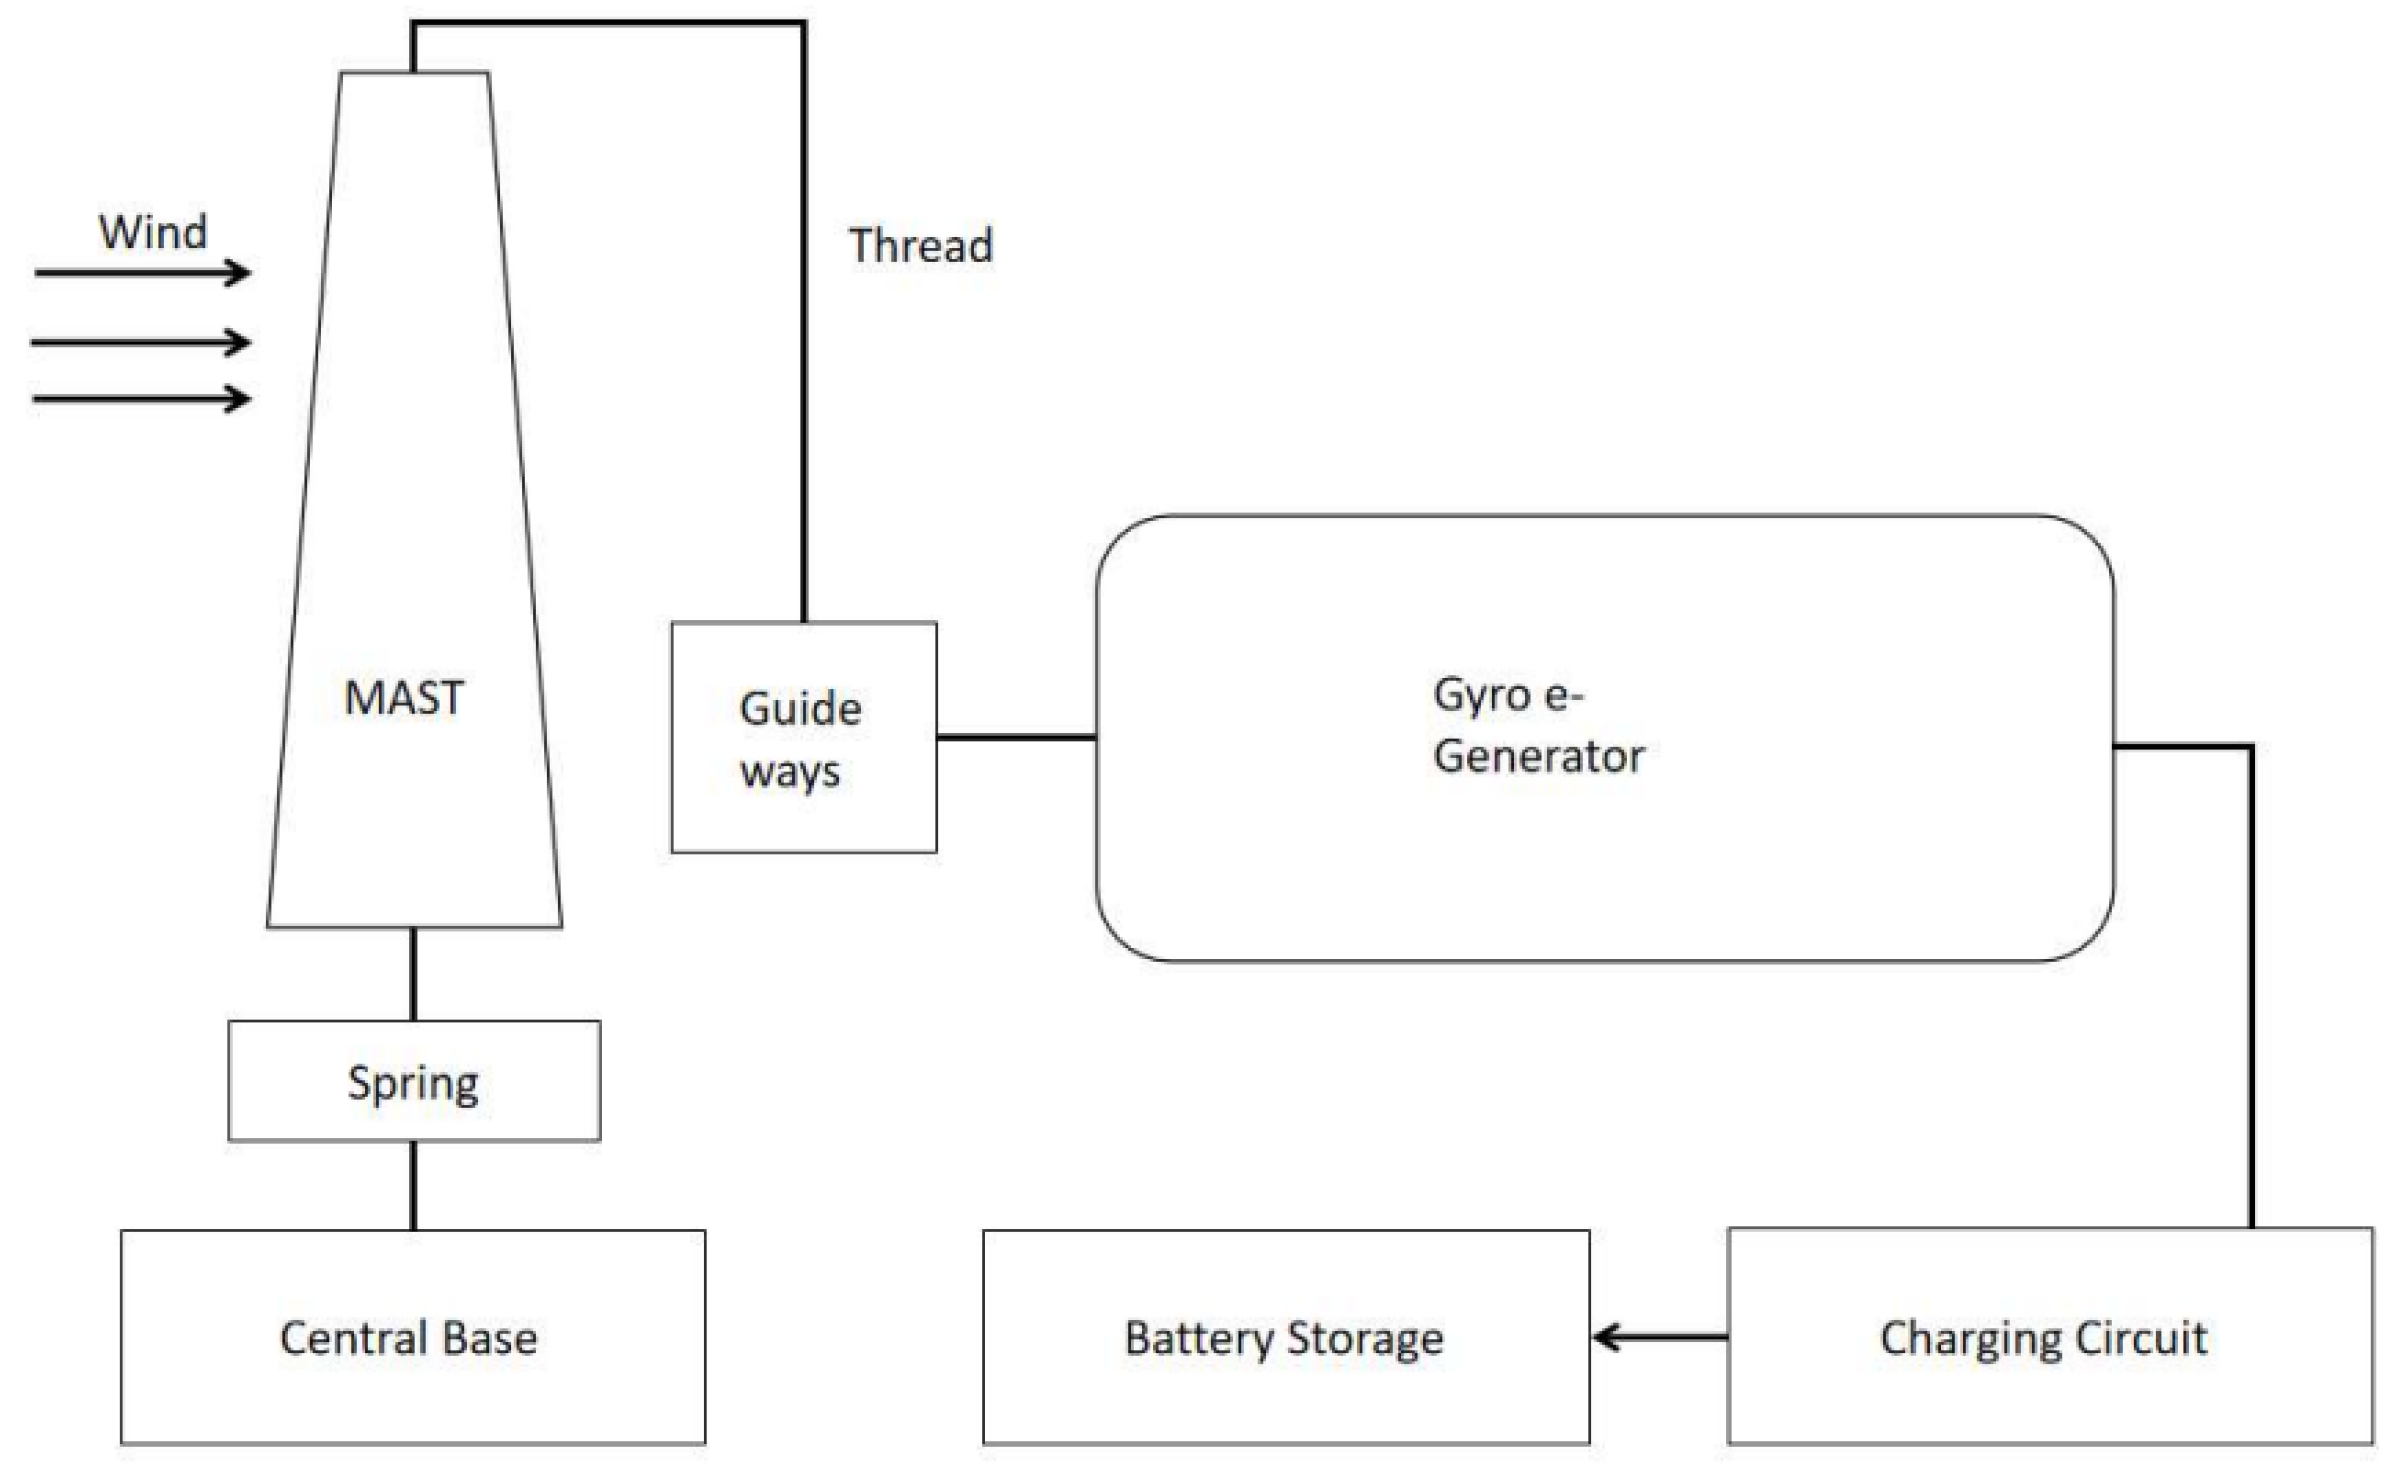
3.6. Power-Generator Conceptual Design
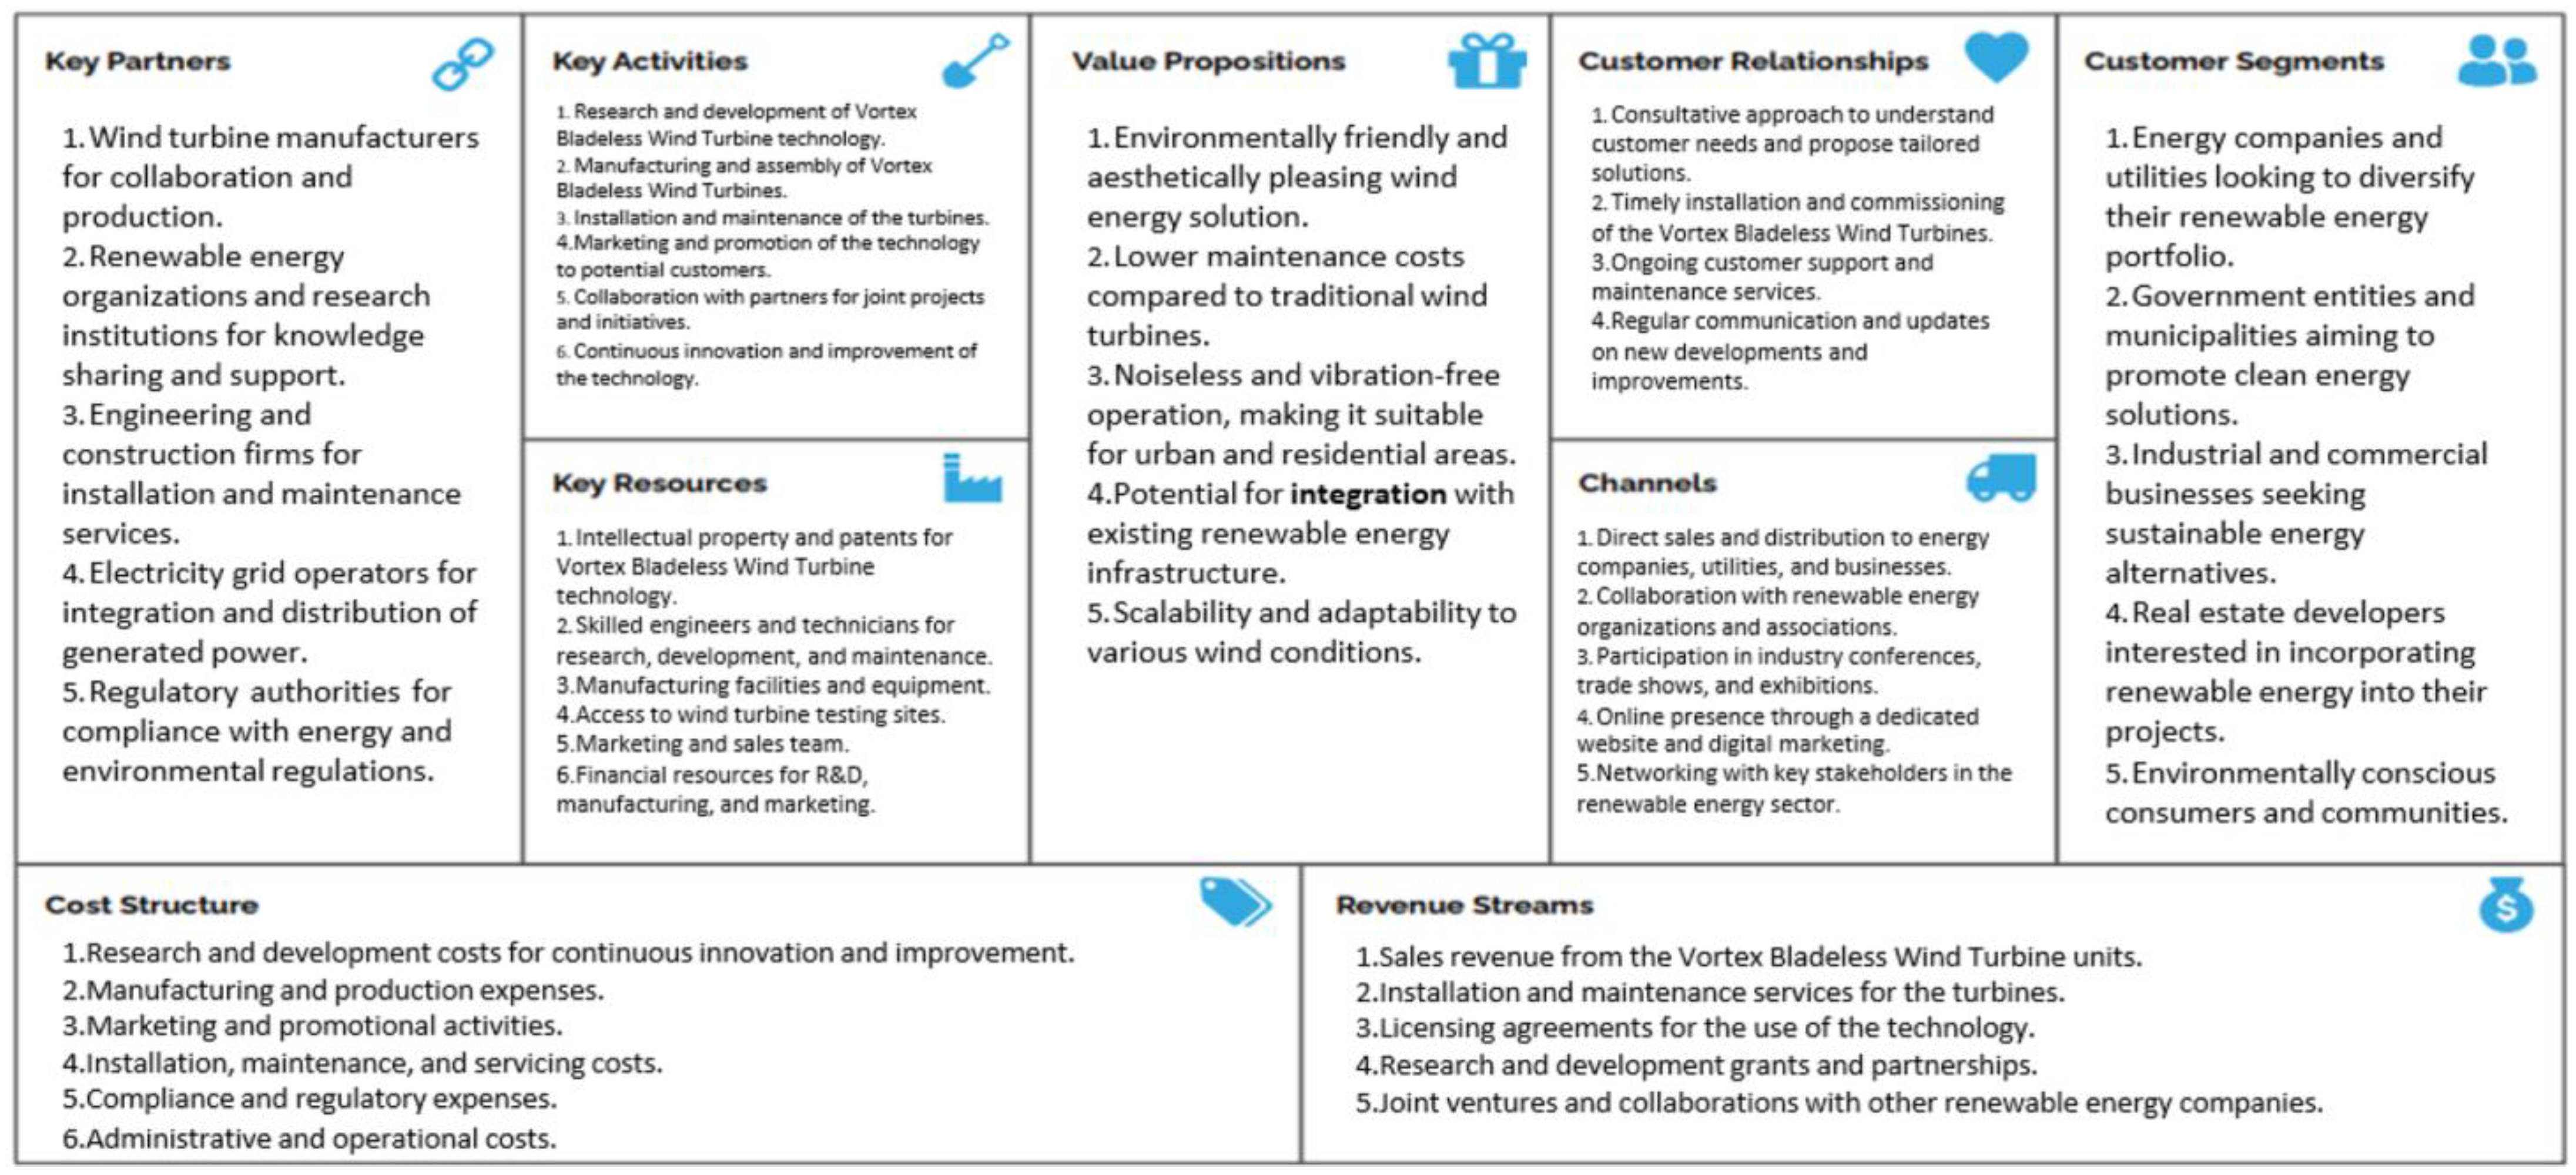
3.7. Business Model and Commercialization
4. Conclusions
Author Contributions
Funding
Data Availability Statement
Conflicts of Interest
References
- Momete, D.C. Analysis of the Potential of Clean Energy Deployment in the European Union. IEEE Access 2018, 6, 54811–54822. [Google Scholar] [CrossRef]
- Borovik, M.R.; Albers, J.D. Participation in the Illinois Solar Renewable Energy Market. Electr. J. 2018, 31, 33–39. [Google Scholar] [CrossRef]
- Jaszczur, M.; Hassan, Q.; Palej, P.; Abdulateef, J. Multi-Objective Optimisation of a Micro-Grid Hybrid Power System for Household Application. Energy 2020, 202, 117738. [Google Scholar] [CrossRef]
- Hassan, Q.; Al-Hitmi, M.; Tabar, V.S.; Sameen, A.Z.; Salman, H.M.; Jaszczur, M. Middle East Energy Consumption and Potential Renewable Sources: An Overview. Clean. Eng. Technol. 2023, 12, 100599. [Google Scholar] [CrossRef]
- Sayed, E.T.; Olabi, A.G.; Elsaid, K.; Al Radi, M.; Alqadi, R.; Ali Abdelkareem, M. Recent Progress in Renewable Energy Based-Desalination in the Middle East and North Africa MENA Region. J. Adv. Res. 2023, 48, 125–156. [Google Scholar] [CrossRef]
- Ashfaq, A.; Ianakiev, A. Features of Fully Integrated Renewable Energy Atlas for Pakistan; Wind, Solar and Cooling. Renew. Sustain. Energy Rev. 2018, 97, 14–27. [Google Scholar] [CrossRef]
- Qazi, A.; Hussain, F.; Rahim, N.A.B.D.; Hardaker, G.; Alghazzawi, D.; Shaban, K.; Haruna, K. Towards Sustainable Energy: A Systematic Review of Renewable Energy Sources, Technologies, and Public Opinions. IEEE Access 2019, 7, 63837–63851. [Google Scholar] [CrossRef]
- Jaszczur, M.; Hassan, Q.; Al-Anbagi, H.N.; Palej, P. A Numerical Analysis of a HYBRID PV+WT Power System. In Proceedings of the E3S Web of Conferences, Rome, Italy, 3–6 September 2019; Volume 128. [Google Scholar]
- Abbas, M.K.; Hassan, Q.; Jaszczur, M.; Al-Sagar, Z.S.; Hussain, A.N.; Hasan, A.; Mohamad, A. Energy Visibility of a Modeled Photovoltaic/Diesel Generator Set Connected to the Grid. Energy Harvest. Syst. 2022, 9, 27–38. [Google Scholar] [CrossRef]
- Hassan, Q. Optimisation of Solar-Hydrogen Power System for Household Applications. Int. J. Hydrog. Energy 2020, 45, 33111–33127. [Google Scholar] [CrossRef]
- Dall-Orsoletta, A.; Ferreira, P.; Gilson Dranka, G. Low-Carbon Technologies and Just Energy Transition: Prospects for Electric Vehicles. Energy Convers. Manag. X 2022, 16, 100271. [Google Scholar] [CrossRef]
- Al-falahi, M.D.A.; Jayasinghe, S.D.G.; Enshaei, H. A Review on Recent Size Optimization Methodologies for Standalone Solar and Wind Hybrid Renewable Energy System. Energy Convers. Manag. 2017, 143, 252–274. [Google Scholar] [CrossRef]
- Pervaiz, S.S.; Dol, S.S.; Alhassani, A.K.; Abdallftah, M.T.; Fares, M. Numerical Modelling and Performance Optimization of a Vertical Axis Wind Turbine. In Energy and Environment in the Tropics; Sulaiman, S.A., Ed.; Springer Nature: Singapore, 2023; pp. 359–374. [Google Scholar] [CrossRef]
- Younis, A.; Dong, Z.; El Badawy, M.; Al Khatib, F.; Al Anazi, A. Development of Low-Speed Wind Energy Harvesting Device. Energy Rep. 2022, 8, 22–27. [Google Scholar] [CrossRef]
- Chizfahm, A.; Yazdi, E.A.; Eghtesad, M. Dynamic Modeling of Vortex Induced Vibration Wind Turbines. Renew. Energy 2018, 121, 632–643. [Google Scholar] [CrossRef]
- Bardakjian, A.T.; Mandadakis, P.P.; Tingle, A. Efficiency Comparison of Horizontal Axis Wind Turbines and Bladeless Turbines. PAM Rev. Energy Sci. Technol. 2017, 4, 59–75. [Google Scholar] [CrossRef]
- Wang, J.; Geng, L.; Ding, L.; Zhu, H.; Yurchenko, D. The State-of-the-Art Review on Energy Harvesting from Flow-Induced Vibrations. Appl. Energy 2020, 267, 114902. [Google Scholar] [CrossRef]
- Kawai, H. Vortex Induced Vibration of Circular Cylinder. In Proceedings of the 1st International Symposium on Computational Wind Engineering (CWE 92), Tokyo, Japan, 21–23 August 1992; pp. 605–610. [Google Scholar] [CrossRef]
- Jiménez-González, J.I.; Huera-Huarte, F.J. Vortex-Induced Vibrations of a Circular Cylinder with a Pair of Control Rods of Varying Size. J. Sound Vib. 2018, 431, 163–176. [Google Scholar] [CrossRef]
- Dol, S.S.; Chan, H.B.; Wee, S.K.; Perumal, K. The effects of flexible vortex generator on the wake structures for improving turbulence. In IOP conference series: Materials science and engineering; IOP Publishing: Bristol, UK, 2020; Volume 715, p. 012070. [Google Scholar]
- von Kármán, T. Ueber Den Mechanismus Des Widerstandes, Den Ein Bewegter Körper in Einer Flüssigkeit Erfährt. Nachr. Ges. Wiss. Göttingen Math.-Phys. Kl. 1911, 1911, 509–517. [Google Scholar]
- Bearman, P.W. Vortex Shedding from Oscillating Bluff Bodies. Annu. Rev. Fluid Mech. 2003, 16, 195–222. [Google Scholar] [CrossRef]
- Gerrard, J.H. The Mechanics of the Formation Region of Vortices behind Bluff Bodies. J. Fluid Mech. 1966, 25, 401–413. [Google Scholar] [CrossRef]
- Su, Z.; Liu, Y.; Zhang, H.; Zhang, D. Numerical Simulation of Vortex-Induced Vibration of a Square Cylinder. J. Mech. Sci. Technol. 2007, 21, 1415. [Google Scholar] [CrossRef]
- Massai, T.; Zhao, J.; Jacono, D.L.; Bartoli, G.; Sheridan, J. The Effect of Angle of Attack on Flow-Induced Vibration of Low-Side-Ratio Rectangular Cylinders. J. Fluids Struct. 2018, 82, 375–393. [Google Scholar] [CrossRef]
- Gao, D.; Deng, Z.; Yang, W.; Chen, W. Review of the Excitation Mechanism and Aerodynamic Flow Control of Vortex-Induced Vibration of the Main Girder for Long-Span Bridges: A Vortex-Dynamics Approach. J. Fluids Struct. 2021, 105, 103348. [Google Scholar] [CrossRef]
- Dol, S.S.; Yong, T.H.; Bin Chan, H.; Wee, S.K.; Sulaiman, S.A. Turbulence Characteristics of the Flexible Circular Cylinder Agitator. Fluids 2021, 6, 238. [Google Scholar] [CrossRef]
- Khalak, A.; Williamson, C.H.K. Fluid Forces and Dynamics of a Hydroelastic Structure with Very Low Mass and Damping. J. Fluids Struct. 1997, 11, 973–982. [Google Scholar] [CrossRef]
- Badri, N.; Peddolla, V.; Gottumukkala, H. Design and Analysis of Bladeless Wind Turbine. In Proceedings of the 4th International Conference on Design and Manufacturing Aspects for Sustainable Energy (ICMED-ICMPC 2023), Hyderabad, India, 19–20 May 2023. [Google Scholar] [CrossRef]
- Kim, S.; Alam, M.M.; Sakamoto, H.; Zhou, Y. Flow-Induced Vibrations of Two Circular Cylinders in Tandem Arrangement. Part 1: Characteristics of Vibration. J. Wind. Eng. Ind. Aerodyn. 2009, 97, 304–311. [Google Scholar] [CrossRef]
- King, R.; Johns, D.J. Wake Interaction Experiments with Two Flexible Circular Cylinders in Flowing Water. J. Sound Vib. 1976, 45, 259–283. [Google Scholar] [CrossRef]
- Gohate, G.; Bobde, S.; Khairkar, A.; Jadhav, S. Study of Vortex Induced Vibrations for Harvesting Energy. IJIRST-Int. J. Innov. Res. Sci. Technol. 2016, 2, 374–378. [Google Scholar]
- Rishabh, O.; Shubhankar, B.; Vishal, S.K. Bladeless Wind Power Generation. Int. J. Sci. Eng. Dev. Res. 2017, 163–167. [Google Scholar]
- Seyed-Aghazadeh, B.; Carlson, D.W.; Modarres-Sadeghi, Y. The Influence of Taper Ratio on Vortex-Induced Vibration of Tapered Cylinders in the Crossflow Direction. J. Fluids Struct. 2015, 53, 84–95. [Google Scholar] [CrossRef]
- Samy, C.K.; Ahmadi, H.B.; Atfah, Y.A.; Dol, S.S.; Alavi, M. Design of Portable Vortex Bladeless Wind Turbine: The Preliminary Study. J. Adv. Res. Appl. Mech. 2023, 102, 32–43. [Google Scholar]
- Elsayed, A.M.; Farghaly, M.B. Theoretical and Numerical Analysis of Vortex Bladeless Wind Turbines. Wind Eng. 2022, 46, 1408–1426. [Google Scholar] [CrossRef]
- Akaydin, H.D.; Elvin, N.; Andreopoulos, Y. The Performance of a Self-Excited Fluidic Energy Harvester. Smart Mater. Struct. 2012, 21, 025007. [Google Scholar] [CrossRef]
- Salvador, C.S.; Teresa, J.A.; Martinez, J.M.; Bacasnot, M.C.; Orilla, K.V.; Cabana, R.J.; Ladaran, W.I. Design and Construction of Arc Shaped and Disc Shaped Pendulum for Vortex Bladeless Wind Generator. In Proceedings of the 25th International Conference on Systems Engineering, ICSEng, Las Vegas, NV, USA, 22–23 August 2017; pp. 363–369. [Google Scholar] [CrossRef]
- Maftouni, N.; Manshadi, M.D.; Mousavi, S.M. The Effect of Drag Force on the Body Frequencies and the Power Spectrum of a Bladeless Wind Turbine. Trans. Can. Soc. Mech. Eng. 2021, 45, 604–611. [Google Scholar] [CrossRef]
- Francis, S.; Umesh, V.; Shivakumar, S. Design and Analysis of Vortex Bladeless Wind Turbine. Mater. Today Proc. 2021, 47, 5584–5588. [Google Scholar] [CrossRef]
- Dol, S.S.; Chan, H.B. Fluid-Structural Interaction Simulation of Vortices behind a Flexible Vortex Generator. In Proceedings of the 2019 8th International Conference on Modeling Simulation and Applied Optimization (ICMSAO), Manama, Bahrain, 15–17 April 2019; pp. 1–5. [Google Scholar] [CrossRef]
- Bani-hani, A. Wind Flow Induced Vibrations of Tapered Masts. Ph.D. Thesis, Cleveland State University, Cleveland, OH, USA, 2009. [Google Scholar]
- Tandel, R.; Shah, S.; Tripathi, S. A State-of-Art Review on Bladeless Wind Turbine. J. Phys. Conf. Ser. 2021, 1950, 012058. [Google Scholar] [CrossRef]
- Bahadur, I. Dynamic Modeling and Investigation of a Tunable Vortex Bladeless Wind Turbine. Energies 2022, 15, 6773. [Google Scholar] [CrossRef]
- Thein, C.K.; Foong, F.M.; Shu, Y.C. Spring Amplification and Dynamic Friction Modelling of a 2DOF/2SDOF System in an Electromagnetic Vibration Energy Harvester–Experiment, Simulation, and Analytical Analysis. Mech. Syst. Signal Process 2019, 132, 232–252. [Google Scholar] [CrossRef]
- Gatski, T.B.; Bonnet, J.P. Compressibility, Turbulence and High Speed Flow, 2nd ed.; Elsevier: Amsterdam, The Netherlands, 2013; pp. 1–328. [Google Scholar]
- Menter, F.R. Two-Equation Eddy-Viscosity Turbulence Models for Engineering Applications. AIAA J. 1994, 32, 1598–1605. [Google Scholar] [CrossRef]
- Yang, Y.; Bremner, S.; Menictas, C.; Kay, M. Battery Energy Storage System Size Determination in Renewable Energy Systems: A Review. Renew. Sustain. Energy Rev. 2018, 91, 109–125. [Google Scholar] [CrossRef]
- Ould Amrouche, S.; Rekioua, D.; Rekioua, T.; Bacha, S. Overview of Energy Storage in Renewable Energy Systems. Int. J. Hydrog. Energy 2016, 41, 20914–20927. [Google Scholar] [CrossRef]
- Sridhar, S.; Salkuti, S.R. Development and Future Scope of Renewable Energy and Energy Storage Systems. Smart Cities 2022, 5, 668–699. [Google Scholar] [CrossRef]
- Sayed, E.T.; Olabi, A.G.; Alami, A.H.; Radwan, A.; Mdallal, A.; Rezk, A.; Abdelkareem, M.A. Renewable Energy and Energy Storage Systems. Energies 2023, 16, 1415. [Google Scholar] [CrossRef]
- Chavan, S.; Rudrapati, R.; Manickam, S. A Comprehensive Review on Current Advances of Thermal Energy Storage and Its Applications. Alex. Eng. J. 2022, 61, 5455–5463. [Google Scholar] [CrossRef]
- Rekioua, D. Energy Storage Systems for Photovoltaic and Wind Systems: A Review. Energies 2023, 16, 3893. [Google Scholar] [CrossRef]
- Rekioua, D.; Rekioua, T.; Elsanabary, A.; Mekhilef, S. Power Management Control of an Autonomous Photovoltaic/Wind Turbine/Battery System. Energies 2023, 16, 2286. [Google Scholar] [CrossRef]
- Liu, H.; Wang, S.; Zhang, Y.; Wang, W. Study on the Giant Magnetostrictive Vibration-Power Generation Method for Battery-Less Tire Pressure Monitoring System. Proc. Inst. Mech. Eng. Part C J. Mech. Eng. Sci. 2014, 229, 1639–1651. [Google Scholar] [CrossRef]
- Ueno, T. Performance of Improved Magnetostrictive Vibrational Power Generator, Simple and High Power Output for Practical Applications. J. Appl. Phys. 2015, 117, 17A740. [Google Scholar] [CrossRef]
- Dey, S.; Roy, D.; Patra, S.; Santra, T. Performance of a Modified Magnetostrictive Energy Harvester in Mechanical Vibration. Heliyon 2019, 5, e01135. [Google Scholar] [CrossRef]


| Part | Model 1 (mm) | Model 2 (mm) |
|---|---|---|
| a | 760 | 420 |
| b | 420 | 420 |
| c | 100 | 100 |
| d | 3000 | 3000 |
| e | 2670 | 720 |
| f | 160 | 135 |
| g | 260 | 290 |
| Parameter | Value |
|---|---|
| Time-Step Size (s) | |
| Number of Steps | 6667 |
| Mesh Elements | 1,500,000 |
| Saving Duration | Every 15 TS |
| Flow Time (s) | 5 |
| Battery Chemistry | Cost | Specific Power (W/kg) | Specific Energy (Wh/kg) | Efficiency (%) |
|---|---|---|---|---|
| Lithium-ion | High | 150–315 | 75–250 | 95–98 |
| Lead–acid | Low | 75–300 | 30–50 | 70–80 |
| Sodium–Sulfur | High | 150–20 | 150–240 | 80–90 |
| Vanadium Redox | High | 100–166 | 10–35 | 65–85 |
| Nickel–Cadmium | Moderate | 150–300 | 70–75 | 70–80 |
| Nickel–Metal Hydride | Moderate | 200–300 | 70–100 | 60–70 |
Disclaimer/Publisher’s Note: The statements, opinions and data contained in all publications are solely those of the individual author(s) and contributor(s) and not of MDPI and/or the editor(s). MDPI and/or the editor(s) disclaim responsibility for any injury to people or property resulting from any ideas, methods, instructions or products referred to in the content. |
© 2023 by the authors. Licensee MDPI, Basel, Switzerland. This article is an open access article distributed under the terms and conditions of the Creative Commons Attribution (CC BY) license (https://creativecommons.org/licenses/by/4.0/).
Share and Cite
Hamdan, H.; Dol, S.S.; Gomaa, A.H.; Tahhan, A.B.A.; Al Ramahi, A.; Turkmani, H.F.; Alkhedher, M.; Ajaj, R. Experimental and Numerical Study of Novel Vortex Bladeless Wind Turbine with an Economic Feasibility Analysis and Investigation of Environmental Benefits. Energies 2024, 17, 214. https://doi.org/10.3390/en17010214
Hamdan H, Dol SS, Gomaa AH, Tahhan ABA, Al Ramahi A, Turkmani HF, Alkhedher M, Ajaj R. Experimental and Numerical Study of Novel Vortex Bladeless Wind Turbine with an Economic Feasibility Analysis and Investigation of Environmental Benefits. Energies. 2024; 17(1):214. https://doi.org/10.3390/en17010214
Chicago/Turabian StyleHamdan, Hasan, Sharul Sham Dol, Abdelrahman Hosny Gomaa, Aghyad Belal Al Tahhan, Ahmad Al Ramahi, Haya Fares Turkmani, Mohammad Alkhedher, and Rahaf Ajaj. 2024. "Experimental and Numerical Study of Novel Vortex Bladeless Wind Turbine with an Economic Feasibility Analysis and Investigation of Environmental Benefits" Energies 17, no. 1: 214. https://doi.org/10.3390/en17010214