Article

Injectivity Assessment of Radial-Lateral Wells for CO2 Storage in Marine Gas Hydrate Reservoirs

Energy Institute of Louisiana, University of Louisiana at Lafayette, Lafayette, LA 70504, USA
*
Author to whom correspondence should be addressed.
Energies 2023, 16(24), 7987; https://doi.org/10.3390/en16247987
Submission received: 10 November 2023 / Revised: 5 December 2023 / Accepted: 7 December 2023 / Published: 9 December 2023
(This article belongs to the Special Issue Advances in Carbon Capture and Utilization)

Abstract

:
The carbon dioxide (CO2) leak from conventional underground carbon storage reservoirs is an increasing concern. It is highly desirable to inject CO2 into low-temperature reservoirs so that CO2 can be locked inside the reservoir in a solid state as CO2 hydrates. Marine gas hydrate reservoirs and surrounding water aquifers are attractive candidates for this purpose. However, the nature of the low permeability of these marine sediments hinders the injection of CO2 on a commercial scale due to the low injectivity of wells with conventional completions. This study investigates the injection of CO2 into low-permeability marine reservoirs through a new type of well, namely a radial-lateral well (RLW). A mathematical model was developed in this study to predict the CO2 injectivity of the RLW. The model comparison shows that the use of RLW to replace vertical wells can improve CO2 injectivity by over 30 times, and the use of RLW to replace frac-packed wells can increase CO2 injectivity by over 10 times. A case study and sensitivity analysis were performed with field data from the South China Sea. The result of the analysis reveals that the injectivity of the RLW is nearly proportional to reservoir permeability, lateral wellbore length, and the number of laterals. The CO2 injection rate is predicted to be 19 tons/day to 250 tons/day, which is 3 to 15 times higher than the injectivity of frac-packed wells. It is feasible to inject CO2 into the low-permeability, low-temperature marine reservoirs at commercial flow rates. This work provides an analytical tool to predict the CO2 injectivity of RLW in low-temperature marine reservoirs for leak-free CO2 storage.

1. Introduction

Global climate change is partially attributed to the increasing level of CO2 emissions into the atmosphere [1]. Several mitigation strategies have been proposed for carbon reduction [2]. Injecting CO2 into underground structures, such as oil reservoirs, is now more than just for improving oil recovery but for sealing CO2 inside the reservoirs [3]. In addition to oil reservoirs and saline aquifers, there are several other sources of CO2 geologic sequestration, such as gas-hydrate-based technologies with CO2-enhanced gas recovery [4], geothermal energy harvest, etc. A comprehensive review is given by NACAP [5].
Previous studies revealed high risks of CO2 leakage from reservoirs through old wells where cracks were found in the cement sheath [6]. These cracks are very likely the channels responsible for the CO2 leak [7]. Once CO2 leakage through the wellbore is found, the flow channels in the wellbore annulus can be plugged using the conventional cement squeezing technique because of the large cross-sectional areas open for cement slurry to flow [8,9]. The size of the flow channels can be roughly estimated based on the testing of well cements [10]. Duguid et al. [11] found radial cracks approximately 1/2 mm wide and 35 mm deep in the sidewall cores of an actual cement sheath. These cracks are too narrow to be sealed by cement squeezing because of the high pressure required to inject a cement slurry of high viscosity. Recently, nanoparticle solutions have been studied by Liu et al. [12] to seal the cracks. Olatunji et al. [13] reported a prior assessment of the CO2 leak rate through fractures/cracks sealed by nanoparticle gels, indicating promising properties for sealing.
Because the deterioration of the wellbore cement sheath that induces cracks is unavoidable, the only option to prevent CO2 leaks is to make CO2 immobile inside the storage reservoirs. This can be achieved by injecting CO2 into low-temperature reservoirs such as gas hydrate reservoirs and/or nearby water zones where CO2 will turn into its hydrates (solid-state).
Phase equilibrium curves for CO2 and CH4 show conditions for forming CO2 hydrates and methane hydrates [14]. Because the pressure required for forming CO2 hydrates is lower than that required for forming methane hydrates, natural gas (mainly methane) hydrate reservoirs are always good candidates for storing CO2 in the form of CO2 hydrates. The water zones near the gas hydrate zones are also good candidates for storing CO2 in the form of CO2 hydrates if the in-situ pressures are higher than the forming pressure of CO2 hydrates. In fact, these water zones are better candidates than gas hydrate reservoirs due to their higher injectivities. However, these water zones do not always exist near gas hydrate reservoirs. If they exist above the gas hydrate reservoirs, they should still not be considered CO2 storage zones unless quality caprocks are found to confine CO2. Therefore, this study focuses on CO2 storage in gas hydrate reservoirs.
Moridis et al. [15] characterized gas hydrate reservoirs in three types, namely Class 1, 2, and 3. Class-1-type gas hydrate reservoirs have three coexisting phases (gas, water, and hydrate). Class-2-type hydrate reservoirs have hydrate-bearing layers with underlying free-water layers or overlaying free-gas layers. The Class-3-type gas hydrate reservoirs consist of hydrate-bearing standalone layers confined by upper and lower boundaries [16]. To the best of our knowledge, the Class 1 types of gas hydrate reservoirs are not in a thermodynamic equilibrium condition, which results in only one excessive phase in nature, either free gas or free water, but not both. This is why Moridis et al. [15] further divided the Class-1-type gas hydrate reservoirs into two categories: Class 1W for the hydrate-bearing layers with free water and Class 1G for the hydrate-bearing layers with free water.
Because of the existence of either free water or free gas in gas hydrate reservoirs, non-zero injectivity of CO2 into gas hydrate reservoirs is possible before the dissociation of gas hydrates. The CO2 injectivity should increase as the gas hydrates decompose. However, CO2 injectivity may drop during CH4-CO2 swapping. However, the efficiency of CH4-CO2 swapping is low due to mass transfer barriers caused by CO2 hydrate formation [17]. Nevertheless, the low injectivity of CO2 into marine gas hydrate reservoirs is a big concern due to the low-permeability nature of the storage reservoirs.
Guo and Zhang [18] proposed injecting CO2 through frac-packed wells into low-temperature water zones for non-leaking storage in hydrate form. Assuming that pre-injection of heated CO2 should prevent CO2 hydrate formation during the injection, they developed an analytical model to predict CO2 injectivity into frac-packed reservoirs. A case study with this model shows achievable commercial injection rates of 6–17 tons/day, depending on fracture conductivity. Although the frac-packed wells are promising but marginal for CO2 injection, their added cost is a big concern.
We investigated this using radial-lateral wells (RLW) shown in Figure 1 for increasing CO2 injectivity into gas hydrate reservoirs or low-temperature aquifers in this study. An RLW involves multiple wellbores drilled out from a main wellbore in radial directions. The productivity and injectivity of the well are improved due to the increased total contact area of the wellbore exposed to the reservoir rock. The first versions of RLW are short-radius open-hole multilateral wells drilled to improve well productivity [19]. Abdel-Ghany [20] reported the application of the technology in offshore field development. Modern RLW are created by radial jet drilling (RJD) starting from a cased hole [21,22,23]. The productivity of RLW has been studied by many investigators, including Liu et al. [24], Lu et al. [25], Jain et al. [26], and Maut et al. [27]. Based on Furui et al.’s [28] model for horizontal wells, Guo et al. [29] developed a mathematical model for predicting the productivity of RLW, considering the interactions between radial laterals. No literature reports any mathematical model for the injectivity of RLW. Such a model is highly desired for predicting CO2 injectivity into marine hydrate reservoirs and low-temperature aquifers for project feasibility analysis.

2. Mathematical Model

A mathematical model for predicting the injectivity of RLW was derived in this study using the following assumptions:
(1)
Reservoir rock is homogeneous and isotropic in horizontal extension;
(2)
The injected fluid is incompressible;
(3)
A pseudo-steady state flow condition prevails in the reservoir;
(4)
Radial laterals are identical in geometry and evenly placed in the reservoir.
The first assumption, homogeneous and isotropic properties in horizontal extension, is valid for most clayey deposits formed in marine environments where gas hydrates are found. The second assumption, incompressible fluid, is valid for water and CO2 in supercritical conditions that exist in CO2 injection wells. The third assumption, pseudo-steady state flow, becomes realistic after a short transient flow period. The fourth assumption, identical and evenly distributed RLW, is realistic with modern RJD technology.
The development of the well injectivity model is given in Appendix A for reference. The resultant model is briefly presented as follows:
Q L m a x = 7.08 × 1 0 3 n k H h s m i n p e π μ L sin π n ln I a n i ln h I a n i r w I a n i + 1 I a n i 1.224 s + π h sin π n L I a n i ln h I a n i r w I a n i + 1 I a n i 1.224 s + π h sin π n R w
where
  • QLmax = the maximum permissible fluid injection rate in bbl/day,
  • n = number of radial laterals,
  • kH = formation horizontal permeability in md,
  • h = thickness of reservoir in ft,
  • smin = the minimum formation of in-situ stress in psi,
  • p e = reservoir pressure in psi,
  • μL = liquid viscosity in cp,
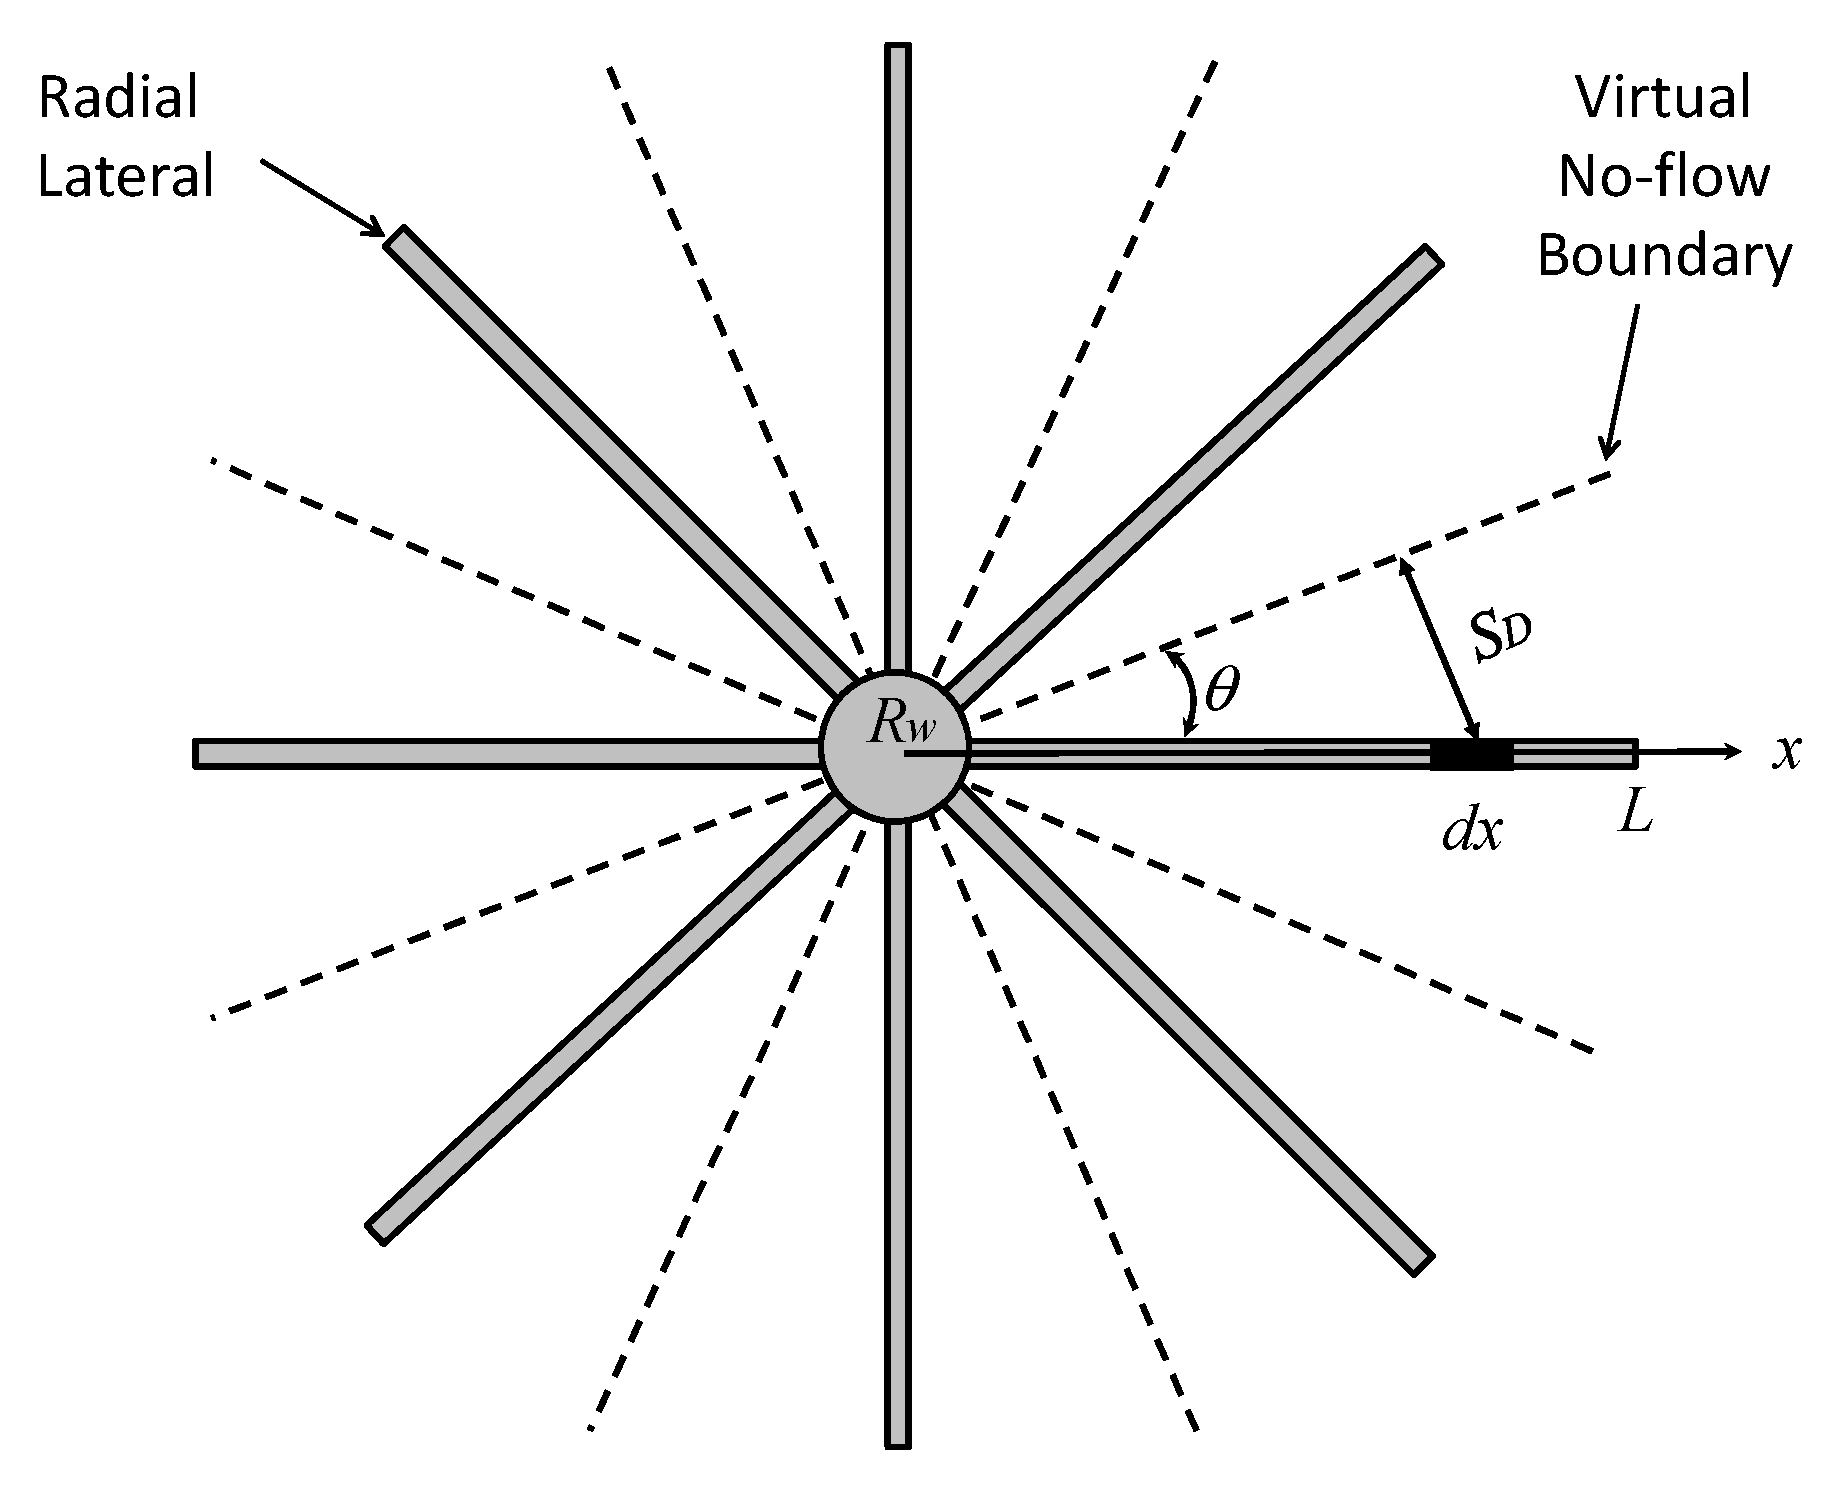
  • rw = lateral wellbore radius in ft,
  • s = skin factor of wellbore,
  • L = length of lateral in ft,
  • Rw = radius of the main wellbore in ft,
and
I a n i = k H k V
where kV is vertical formation permeability in md.
The maximum permissible fluid injection rate corresponds to the maximum permissible bottom fluid injection pressure being equal to the minimum formation in-situ pressure. Because the minimum in-situ stress is normally the vertical stress in shallow marine deposits, using any fluid injection rate that is higher than this maximum fluid injection rate is expected to cause formation breakdown/fracturing and lift the overburden of the reservoir, which can be disastrous for offshore operations involving gas hydrates.

3. Model Verification

The developed well injectivity model has not been validated due to a lack of field data from injection wells. However, the model for oil production RLW has been validated by Guo et al. [29] using data from an RLW with three laterals. They found that the productivity model overestimated production rates for the three wells by 7.7%, 3.25%, and 8.8%, respectively. The error was attributed to a lack of data for the well skin factor, uncertainty of horizontal permeability, uncertainty of permeability anisotropy (Iani), and uncertainty in bottom hole pressure. A COMSOL Multiphysics simulation was also used to validate the model. The values of the mean absolute percentage error (MAPE) were found to be 2.98% and 5.92% for the two analyzed cases.
It is understood that when the well injectivity model is applied to CO2 injection into gas hydrate reservoirs, less accuracy is expected due to the uncertainties in the determination of free gas/water saturation, relative permeability, and the effect of CH4-CO2 swapping. Nevertheless, the effects of some of the uncertainties can be eliminated if well injectivity models are compared using ratios, because these uncertainties can be canceled out. This is illustrated in the next section.

4. Comparison of Well Types

The improvement of RLW over other types of wells in fluid injectivity is worth investigating. This section provides a comparison of well injectivity using the term Fold of Increase (FoI). The FoI of RLW over a vertical well is defined by
F o I R o V = I n j e c t i v i t y   o f   R L W I n j e c t i v i t y   o f   V e r t i c a l   W e l l
and the FoI of RLW over a frac-packed well is defined by
F o I R o F = I n j e c t i v i t y   o f   R L W I n j e c t i v i t y   o f   F r a c     P a c k e d   W e l l
The injectivity of the vertical well is expressed as [10]:
Q V m a x = 7.08 × 1 0 3 k H h s m i n p e μ L ln ( L R w + s )
The injectivity of a frac-packed well is written as [18]:
Q F m a x = 7.08 × 1 0 3 w k f ( s m i n p e ) μ L ln 4 γ r w h k f w 3 k H
where w is fracture width in inches and k f is fracture permeability in md.
Substitution of Equations (1) and (5) into Equation (3) yields:
F o I R o V = n π sin π n ln ( L R w + s ) ln I a n i ln h I a n i r w I a n i + 1 I a n i 1.224 s + π h sin π n L I a n i ln h I a n i r w I a n i + 1 I a n i 1.224 s + π h sin π n R w
Substitution of Equations (1) and (6) into Equation (4) gives:
F o I R o F = n k H h π k f w sin π n   l n 4 γ r w h k f w 3 k H ln I a n i ln h I a n i r w I a n i + 1 I a n i 1.224 s + π h sin π n L I a n i ln h I a n i r w I a n i + 1 I a n i 1.224 s + π h sin π n R w
Due to the complex forms of Equations (7) and (8), it is not clear what trends the FoIRoV and FoIRoF take. A numerical analysis was further carried out using the data in Table 1. First, substituting the data presented in Table 1 into Equation (7), with the number of laterals changing from 3 to 12 and the lateral length changing from 100 ft to 500 ft, generated a set of FoIRoV data in a spreadsheet. The data set is plotted in Figure 2. It shows the effects of the number of laterals and lateral length on FoIRoV in one graph. It indicates that the FoIRoV is nearly proportional to the number of laterals and lateral length. Using RLW to replace vertical wells can improve fluid injectivity by over 30 times. Second, substituting the data presented in Table 1 into Equation (8), with the number of laterals changing from 3 to 12 and the lateral length changing from 100 ft to 500 ft, generated a set of FoIRoF data in a spreadsheet. The data set is plotted in Figure 3. It illustrates the effects of the number of laterals and lateral length on FoIRoF. It is shown that the FoIRoF is also nearly proportional to the number of laterals and lateral length. Using RLW to replace frac-packed wells can increase fluid injectivity by over 10 times.

5. Field Case Study

A case study was performed using data from the gas hydrate reservoir in the Shenhu area of the Northern South China Sea. The water depth is about 1,180 m in the area. The gas hydrate reservoir is 155 m to 177 m from the mudline [30]. The average reservoir pressure and temperature are approximately 14 MPa and 6 °C, respectively [31]. The major component of the natural gas in the Shenhu area is methane. The dissociation temperature of the gas hydrate at 14 MPa is about 15 °C [32]. The reservoir is composed of clayey silt in three intervals, namely “a,” “b,” and “c”. Interval “a” has an effective porosity of about 0.35, a hydrate saturation of about 34%, and a permeability of about 2.9 md. Interval “b” has an effective porosity of about 0.33, a hydrate saturation of about 31%, and a permeability of about 1.5 md. Interval “c” has an effective porosity of about 0.32, a gas hydrate saturation of about 7.8%, and a permeability of about 7.4 md [32]. Recently, Lu et al. [33] presented a review of research progress and scientific challenges in the depressurization exploitation mechanism of clayey-silt natural gas hydrates in the area. They reported that 85% of the produced natural gas is from the dissociation of gas hydrates. This means that 15% of the produced natural gas is from the free gas in the reservoir, indicating that the reservoir is a Class-1G-type gas hydrate reservoir. They also reported that the maximum gas relative permeability is 0.1.
Table 2 presents a summary of the estimated reservoir properties and wellbore geometry of RLW for CO2 injection. A conservative value of the effective horizontal permeability to CO2 was estimated to be about 1 md, considering free-gas saturation and relative permeability to the CO2 phase. Equation 1 indicates that the injectivity of the RLW depends on several factors, including the controllable parameters (lateral length, lateral radius, and the number of laterals) and parameters (reservoir permeability and permeability anisotropy). A sensitivity analysis was performed using the data set in Table 1 by varying one parameter at a time.
Figure 4 shows the model-calculated effects of the number of laterals on well injectivity for nine lateral lengths. It indicates that CO2 injectivity increases with the number of laterals and lateral length. This is because these parameters control the flow cross-section area at the sand face. The injectivity is proportional to the number of laterals when the laterals are short, but the linearity drops for long laterals. In the practical ranges of the number of lateral and lateral lengths, between 100 ft and 500 ft, the CO2 injectivity of the RLW can be 19 tons/day to 250 tons/day.
Figure 5 presents the model-calculated effect of lateral radius on well injectivity for four values of lateral radii. It shows that well injectivity increases non-linearly with lateral length. This is because the wellbore radius affects the flow cross-section area at the sand face. The narrow band covered by the four curves implies that the injectivity is not sensitive to the lateral radius in the range investigated.
Equation (1) shows explicitly that well injectivity is directly proportional to the horizontal reservoir permeability. However, the effect of reservoir permeability anisotropy is not obvious. Figure 6 illustrates the model-calculated effect of reservoir permeability anisotropy on well injectivity. It shows that well injectivity decreases non-linearly with reservoir permeability anisotropy. This is because reservoir permeability reduces fluid seepage flow in the vertical direction.

6. Discussion

The Effect of Reservoir Type. Equation (1) was obtained based on the assumption of CO2 penetration into the gas hydrate reservoir prior to the decomposition of natural gas hydrates. This can happen only in Class-1-type gas hydrate reservoirs where at least one free phase exists, such as gas hydrates and free gas (1G type) or gas hydrates and free water (1W). If the free phase does not exist in the gas hydrate reservoir, it is expected that well injectivity would be extremely low because the molecular-diffusion-induced CH4-CO2 swapping process for mass transfer is very slow. It is also understood that Equation (1) is expected to be more conservative in 1G than in 1W gas hydrate reservoirs because the gas in the front of the CO2 phase has higher mobility than water.
The Effect of Hydrate Formation. Equation (1) was derived based on the assumption of no formation of CO2 hydrates during CO2 injection. This assumption may be valid in the near-wellbore region, where the high velocity of CO2 flow should not give sufficient retention time for forming CO2 hydrates. This condition may not exist in the region away from the wellbore, where the CO2 velocity can drop below a critical value that will cause CO2 hydrate to form, reducing well injectivity. The concept of critical velocity is hypothetical without support from the literature. The authors are currently conducting experimental studies to investigate the existence of the critical velocity. Nevertheless, even though CO2 does not form hydrate during injection, it will still form hydrate after injection in a low-temperature environment. It is expected that CO2 will eventually be permanently locked inside the reservoirs in hydrate form. The same process is expected to happen in water zones near gas hydrate reservoirs, i.e., CO2 will form hydrate after injection inside the reservoirs and stay there permanently.
The Effect of Geological Settings. It is understood that there are some potential challenges and limitations in the applications of the well injectivity model. First, the model was derived assuming conditions where reservoirs are homorgeneous (non-fractured) and horizontal-isotropic in permeability so that each lateral will contribute the same amount in injectivity. Secondly, the horizontal in-situ stress should be isotropic so that wellbore enlargement should be uniform, if it occurs. These conditions are required not to violate the assumption that all laterals are identical in the same horizontal plane. If these non-ideal conditions prevail, errors are expected from model predictions.

7. Conclusions

It is desirable to inject CO2 into marine gas hydrate reservoirs for non-leak storage. Low injectivity in conventional wells is a major concern in the process. Radial-lateral wells (RLW) are proposed to improve well injectivity. A mathematical model was derived in this work to predict the injectivity of RLW for CO2 injection. The following conclusions are drawn based on case studies and sensitivity analysis.
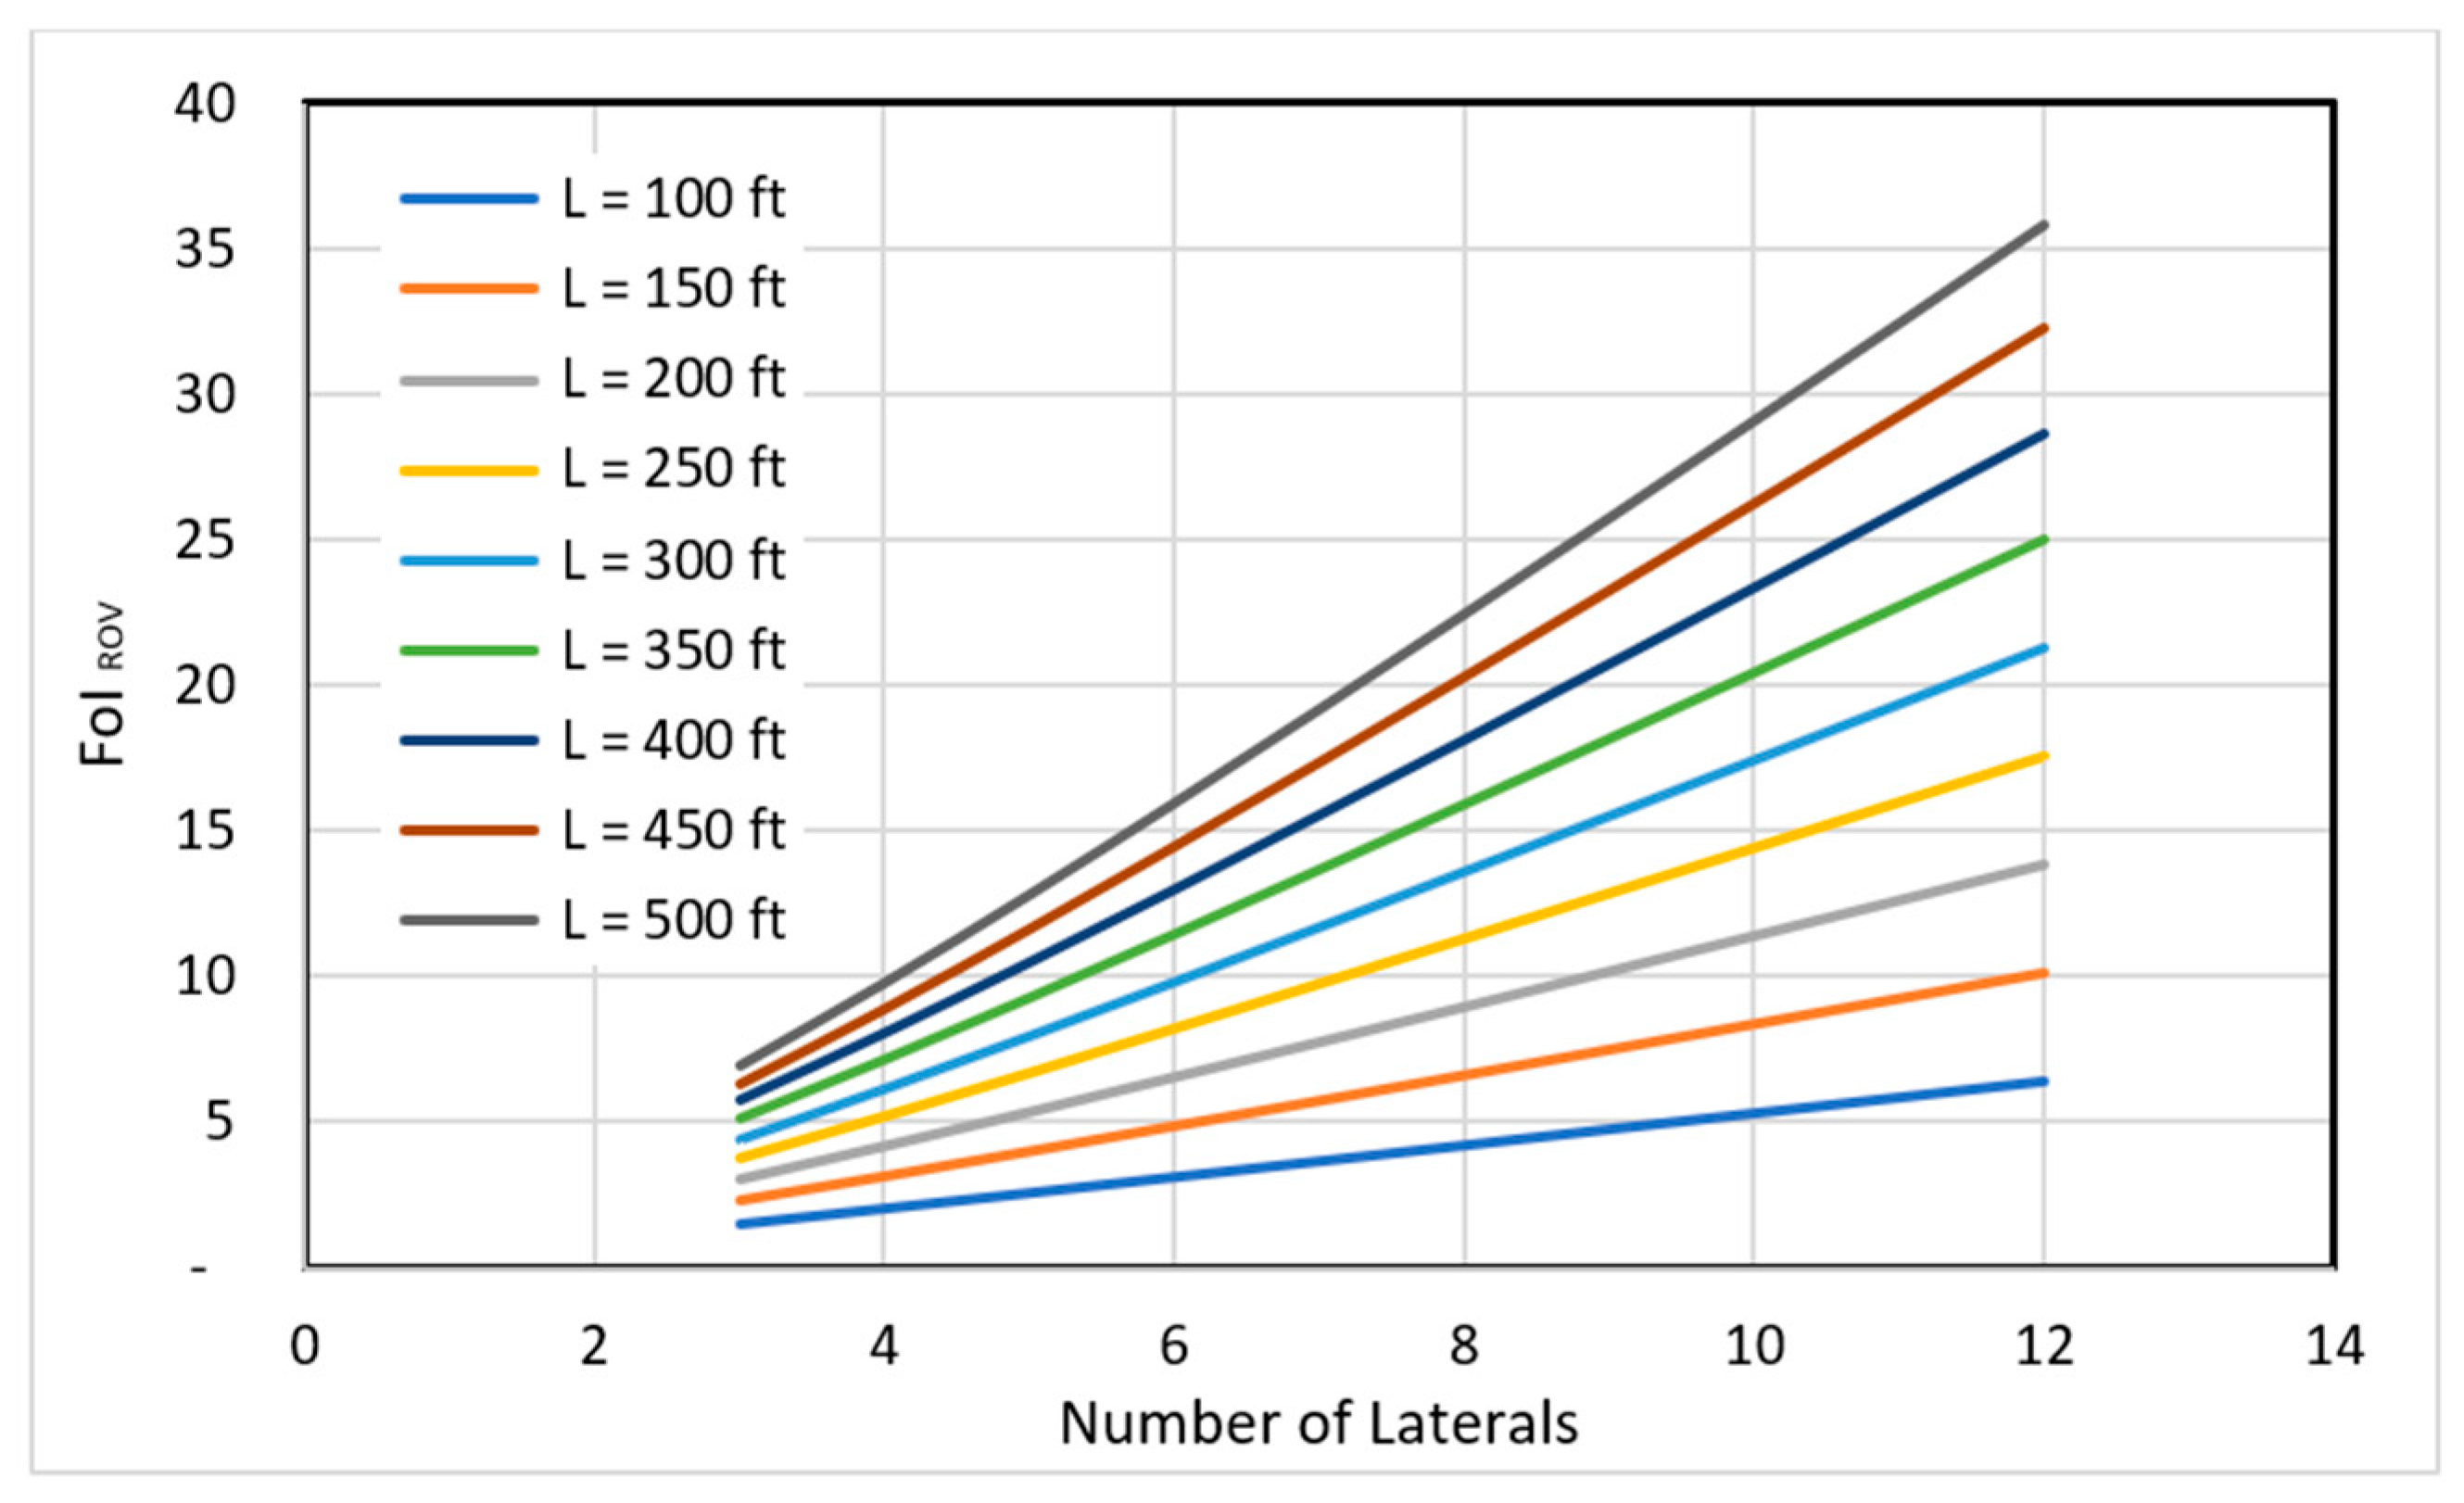
  • Comparing RLW wells to vertical wells, the fold of increase in well injectivity (FoIRoV) is nearly proportional to the number of laterals and lateral length. Using RLW to replace vertical wells can improve CO2 injectivity by over 30 times.
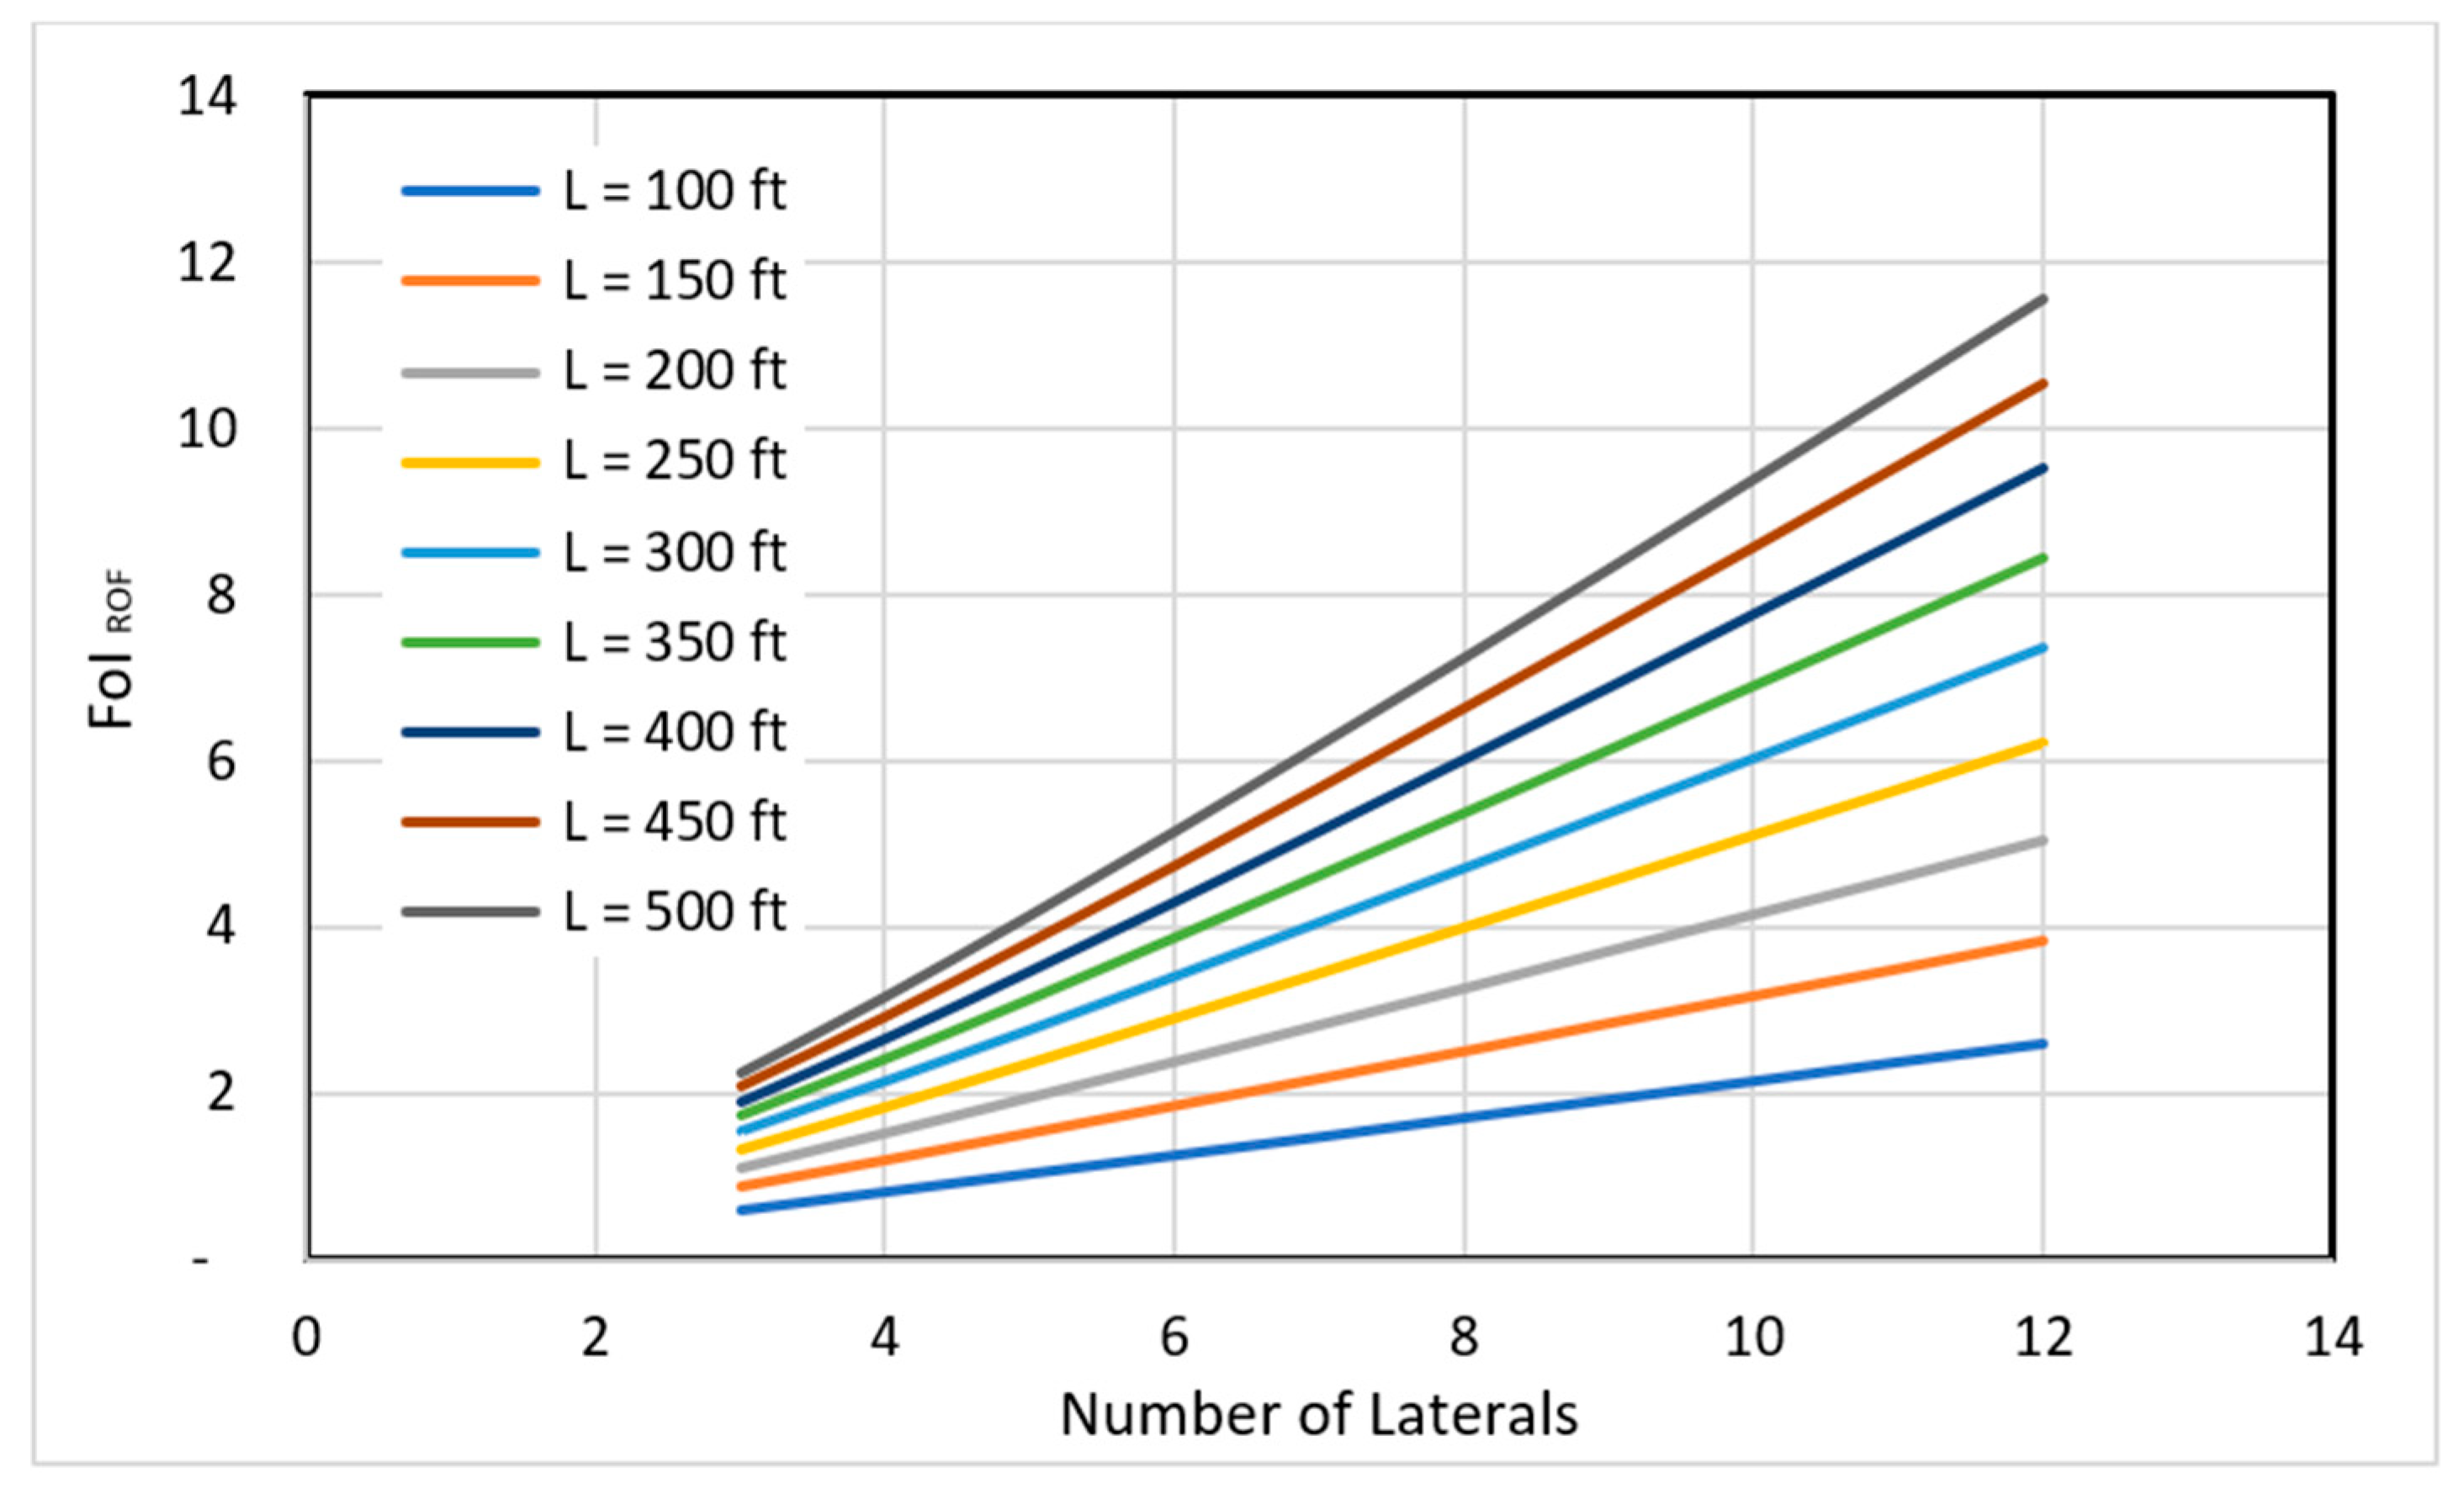
  • Comparing RLW wells to frac-packed wells, the fold of increase in well injectivity (FoIRoF) is also nearly proportional to the number of laterals and lateral lengths. Using RLW to replace frac-packed wells can increase CO2 injectivity by over 10 times.
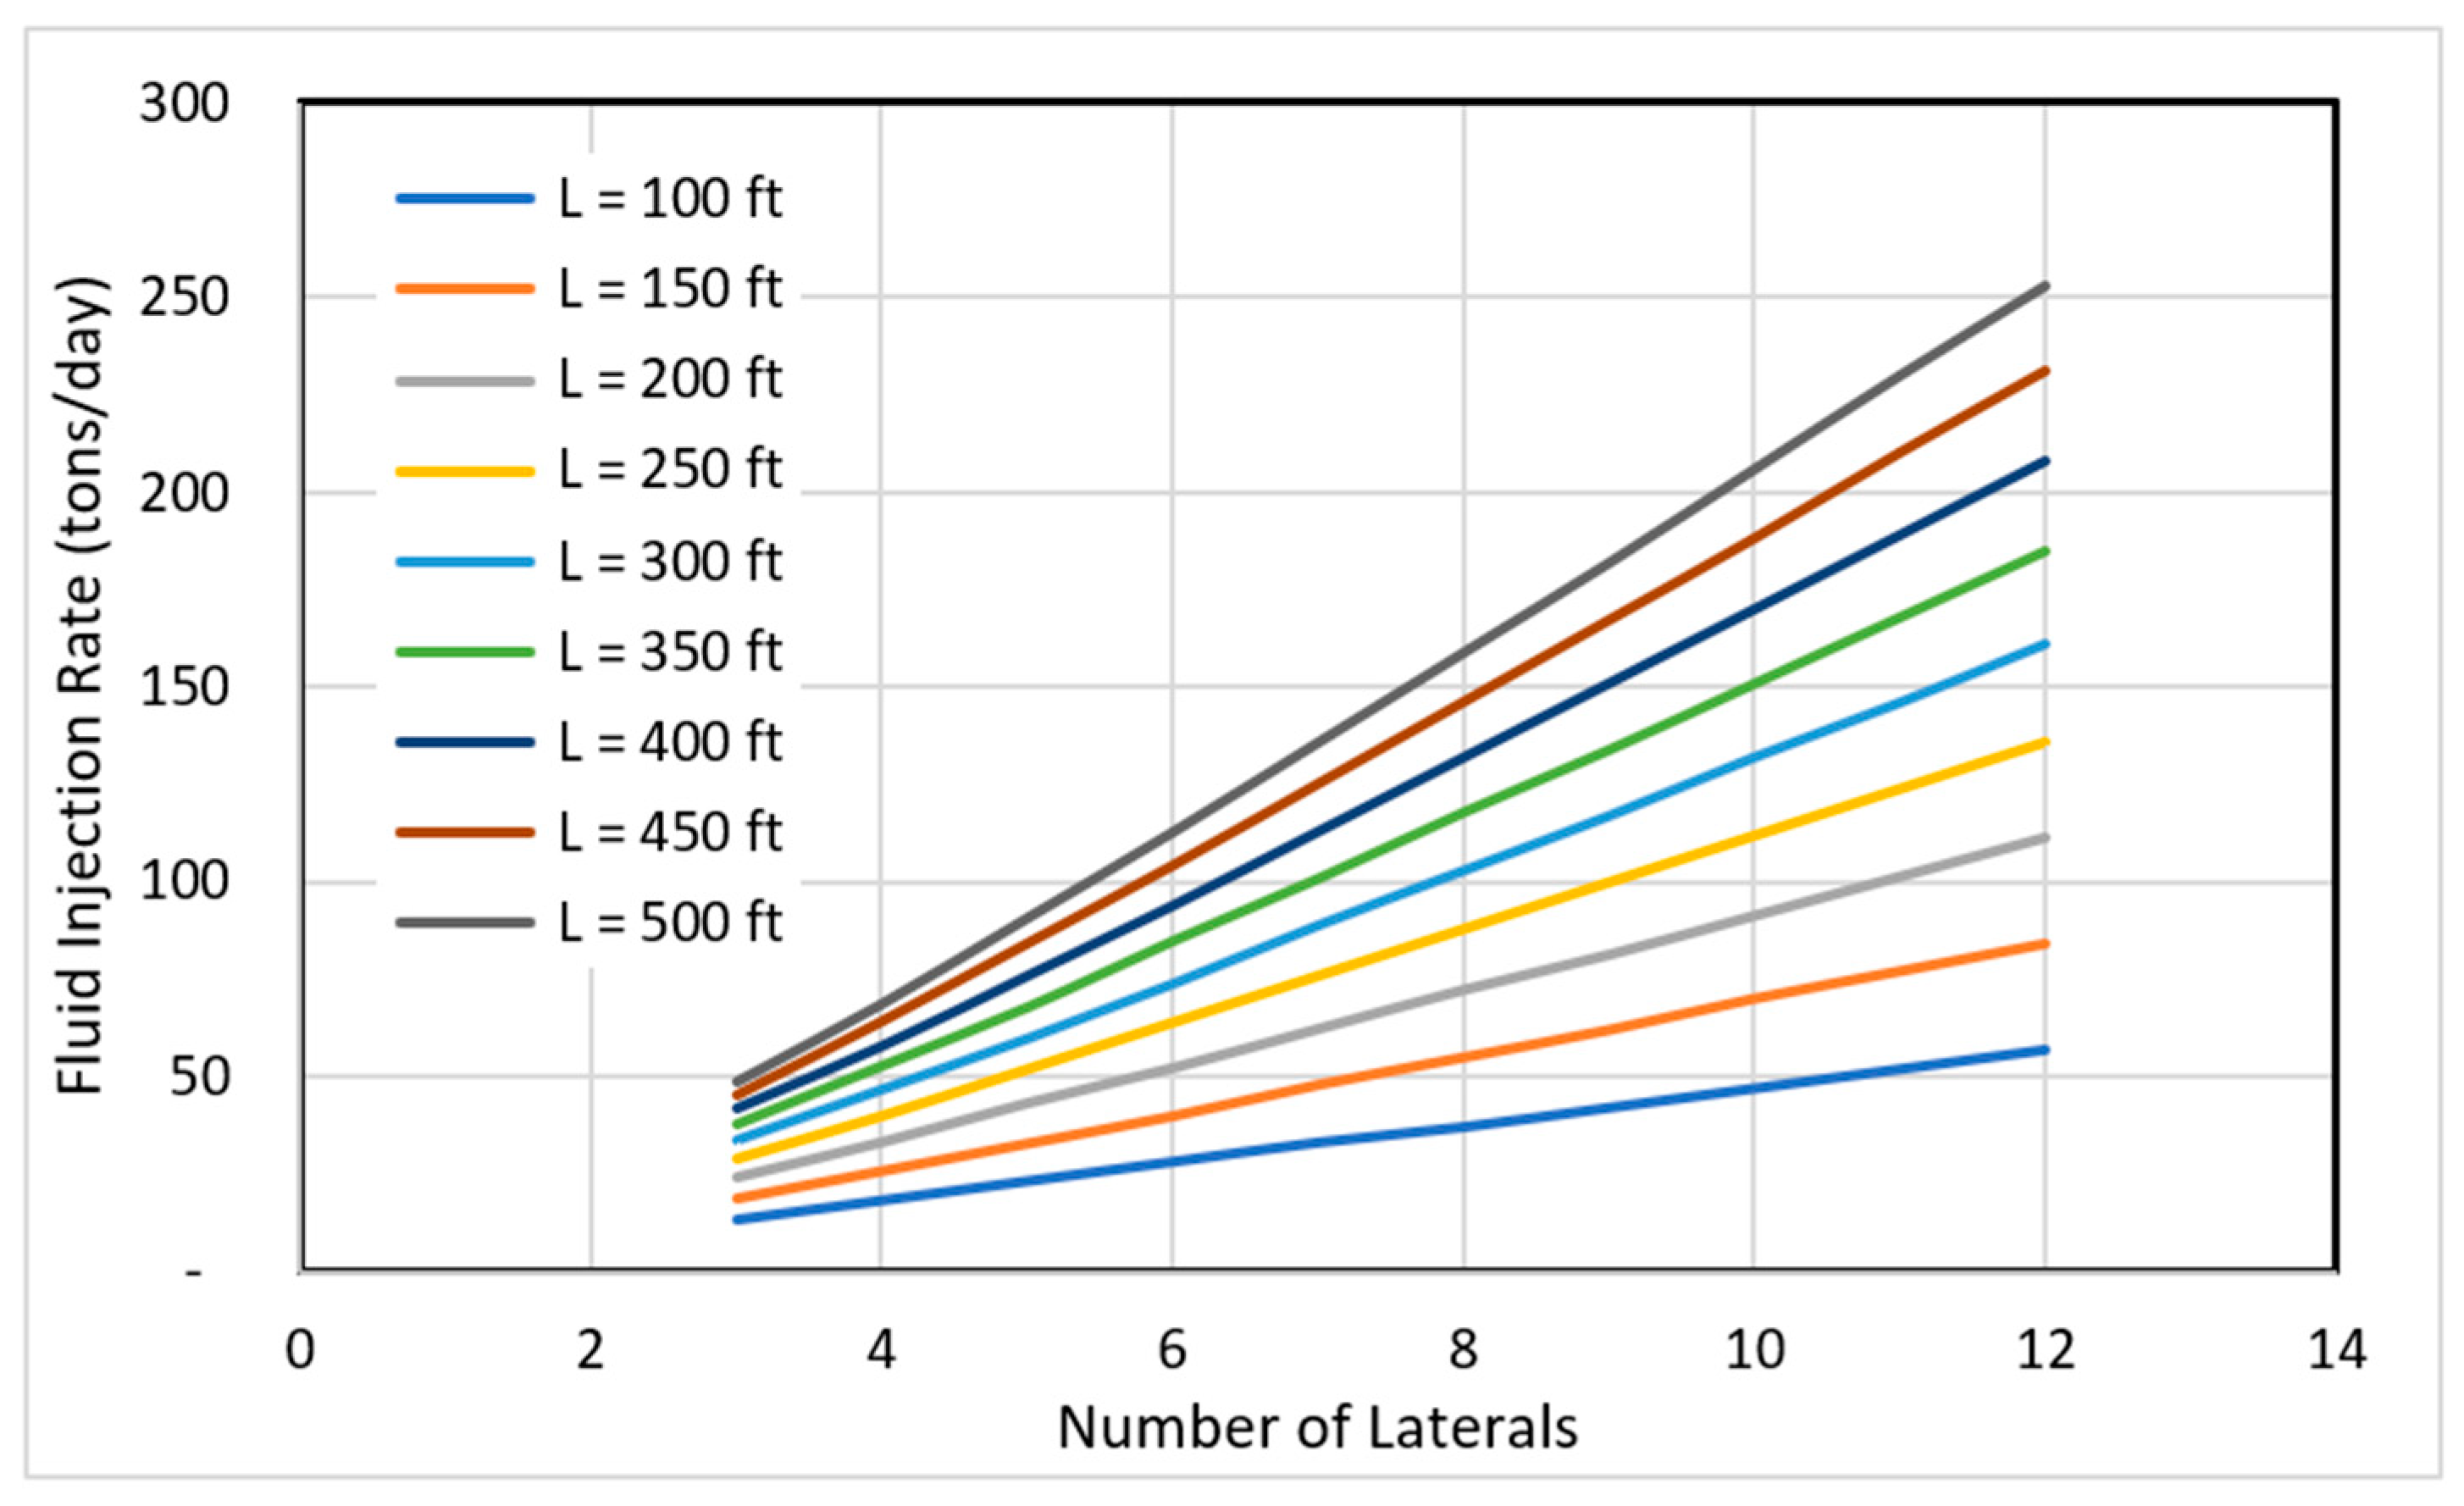
  • CO2 can be injected into marine gas hydrate reservoirs through an RLW at a rate of 19 tons/day to 250 tons/day, which theoretically proves the feasibility of the RLW technology.
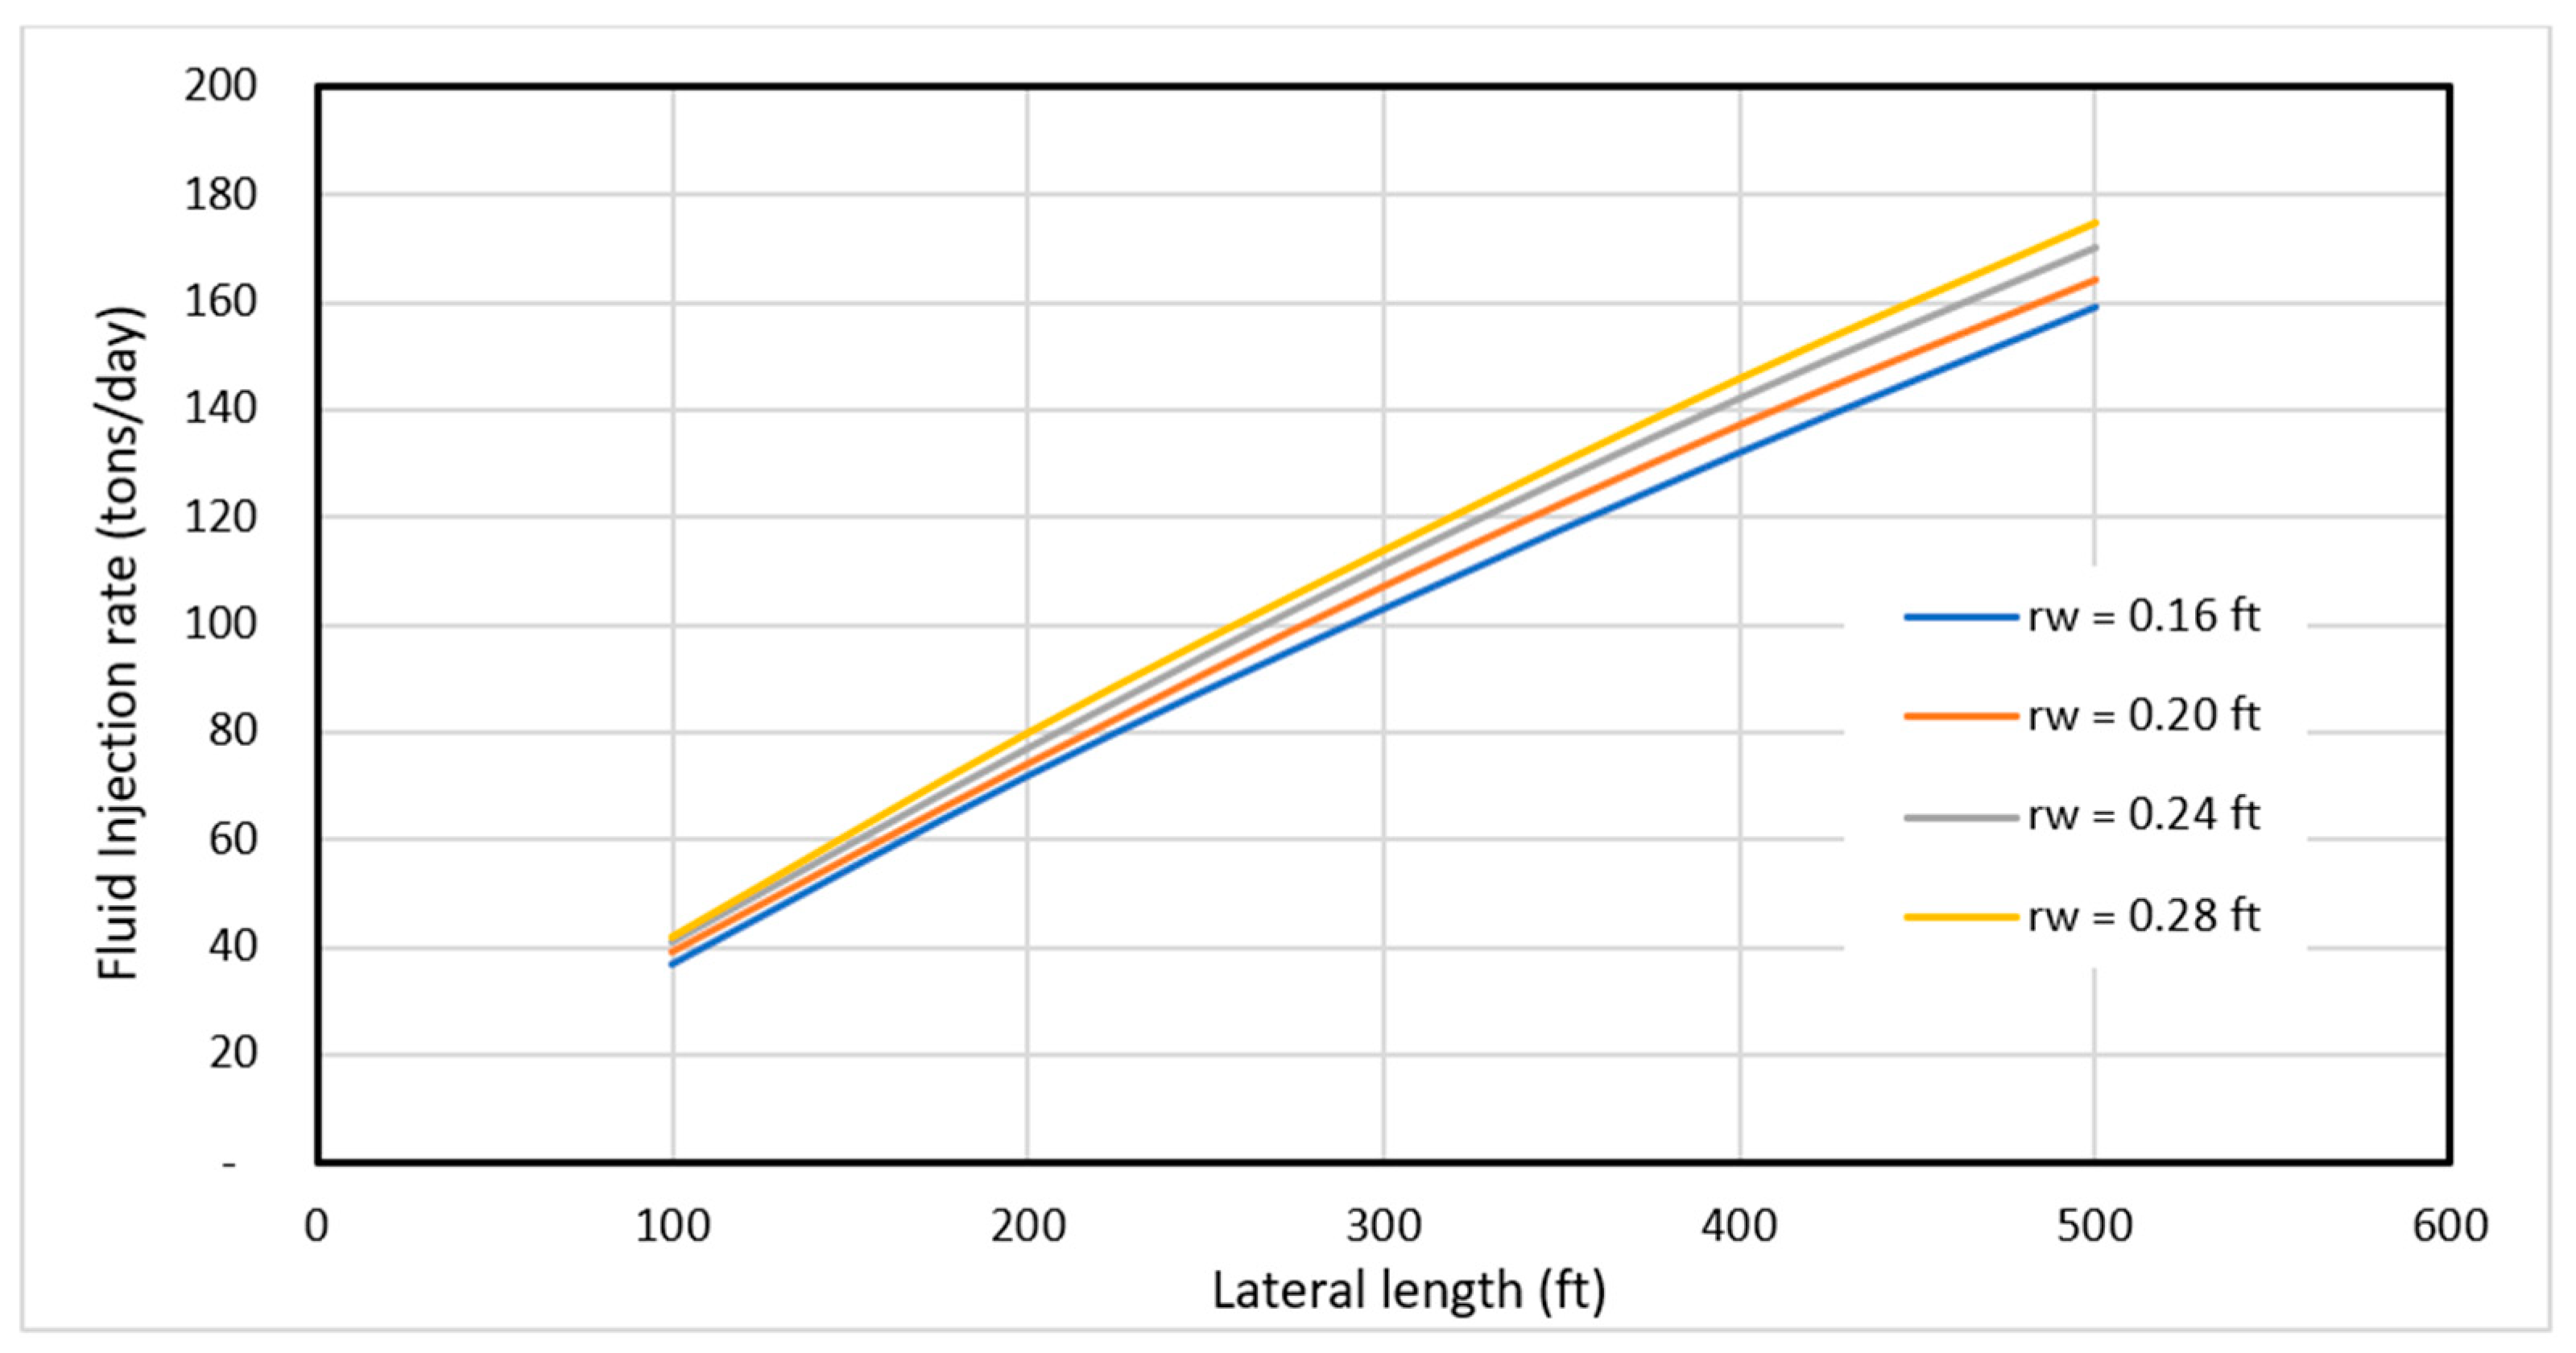
  • RLW injectivity increases with lateral length, lateral radius, and the number of laterals. It is nearly proportional to the lateral length and the number of laterals, but not sensitive to the lateral radius.
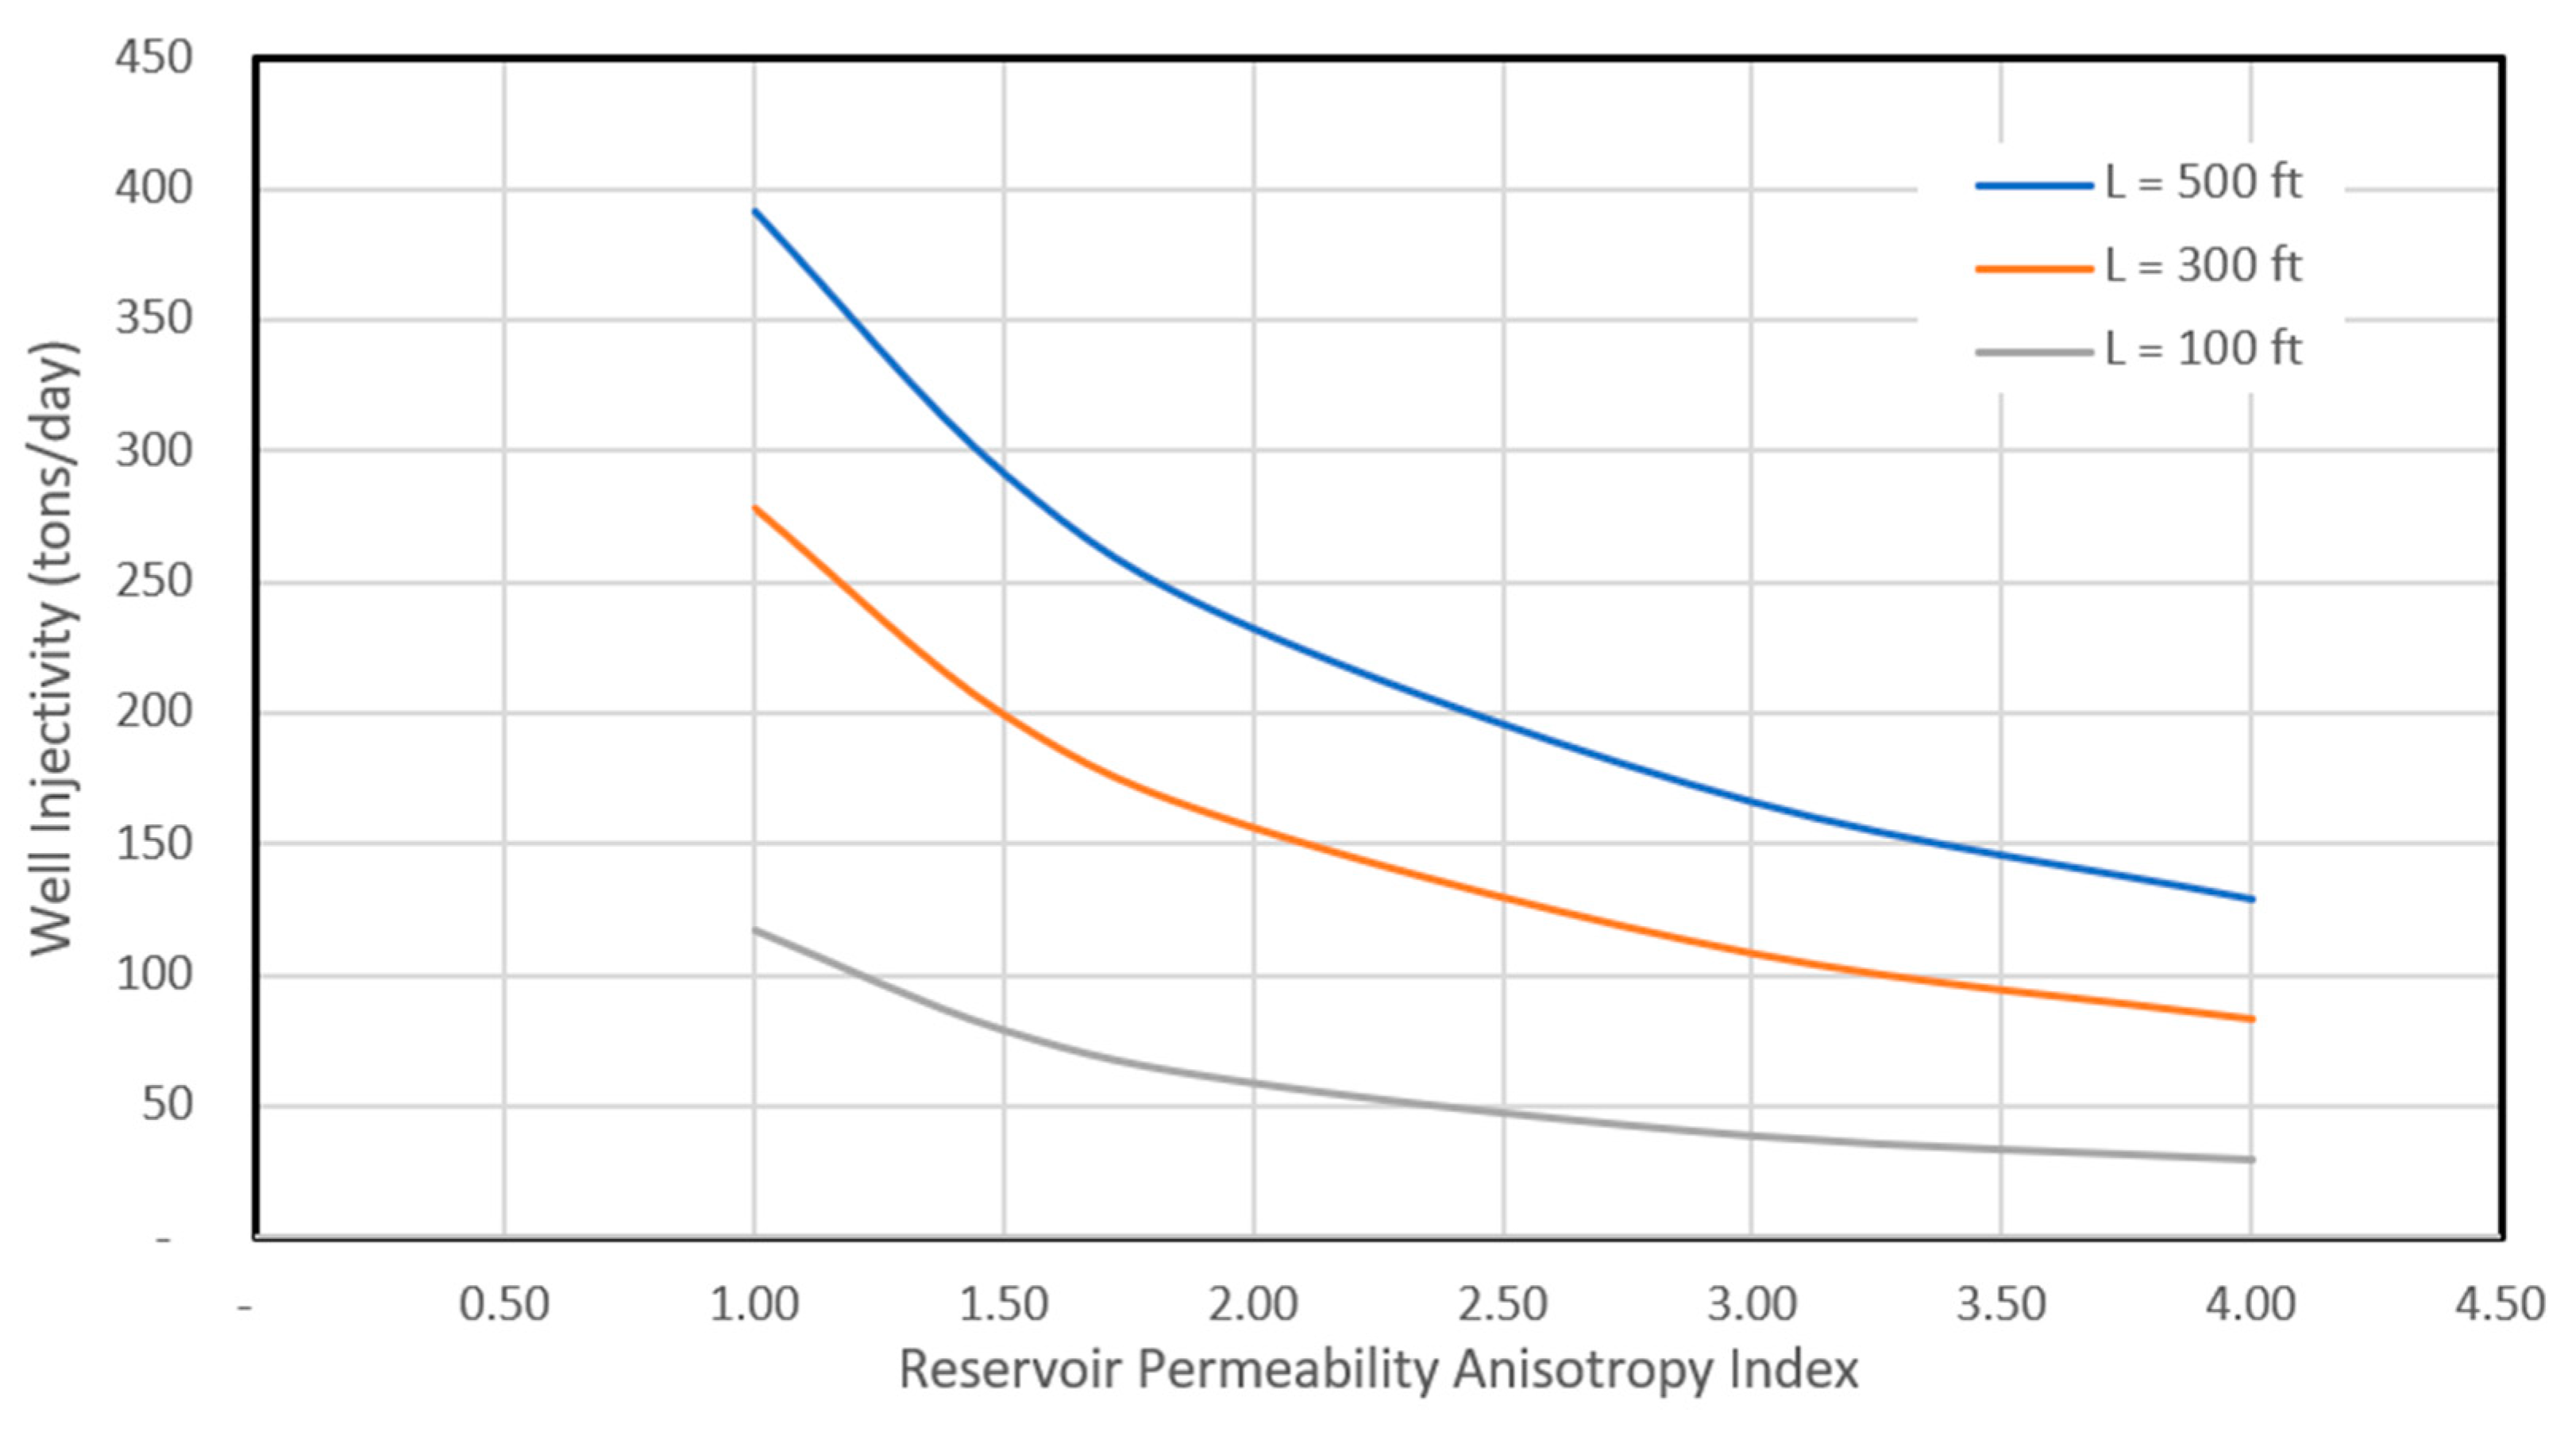
  • RLW injectivity is directly proportional to reservoir permeability and inversely proportional to reservoir permeability anisotropy.
The mathematical model has some limitations in real-world applications. It may apply to Class-1-type gas hydrate reservoirs with free gas (1G type) or free water (1W). The model may be valid in the near-wellbore region, where the high velocity of CO2 flow should not give sufficient retention time for forming CO2 hydrates during injection. This condition may not exist in the region away from the wellbore, where the CO2 velocity can drop below a critical value that will cause CO2 hydrate to form. Future studies should investigate the concept of the critical velocity through lab testing and/or computer simulation with compositional multi-phase flow models.

Author Contributions

Conceptualization, B.G.; methodology, B.G.; software, P.Z.; validation, P.Z. and B.G.; formal analysis, P.Z.; investigation, P.Z.; resources, B.G.; data curation, P.Z.; writing—original draft preparation, B.G.; writing—review and editing, P.Z.; visualization, P.Z.; supervision, B.G.; project administration, B.G.; funding acquisition, B.G. All authors have read and agreed to the published version of the manuscript.

Funding

This research received no external funding. The APC was funded by the Energy Institute of Louisiana, University of Louisiana at Lafayette.

Data Availability Statement

Data are contained within the article.

Conflicts of Interest

The authors declare no conflict of interest.

Appendix A. Derivation of an Analytical Model for Injectivity of Radial-Lateral Wells

The following assumptions are made in deriving an injectivity model of radial-lateral wells: (1) reservoir rock is homogeneous and isotropic in horizontal extension; (2) reservoir fluids and injected fluids are incompressible liquids; (3) pseudo-steady state flow conditions prevail; and (4) radial laterals are identical in geometry and evenly placed in the reservoir.
The plan view of a radial-lateral well model is sketched in Figure A1. For an infinitesimal segment of a lateral dx at a distance x from the center of the main wellbore, the following relation is considered [28]:
Figure A1. The planar configuration of a radial-lateral well.
Energies 16 07987 g0a1
d q L = 7.08 × 1 0 3 k H p w p ¯ μ L I a n i ln h I a n i r w I a n i + 1 + π S D h I a n i 1.224 s d x
where qL is the liquid flow rate in bbl/day, kH is the horizontal permeability in md, pw is the lateral wellbore pressure in psi, p   ¯ is the average reservoir pressure in psi, μL is the liquid viscosity in cp, h is the thickness of the reservoir in ft, rw is the lateral wellbore radius in ft, s is the lateral wellbore skin factor, and SD is the drainage distance of the wellbore segment dx in ft. The reservoir anisotropy factor is defined as:
I a n i = k H k V
where kV is the vertical permeability of the formation rock in md. The drainage distance of the wellbore segment relates to its location x and the angle q between laterals:
S D = x sin θ = x sin π n
where n is the number of laterals. Substituting this relation into Equation (A1) gives:
d q L = 7.08 × 1 0 3 k H p w p ¯ μ L I a n i ln h I a n i r w I a n i + 1 + π h sin π n x I a n i 1.224 s d x
which can be integrated as
0 q L d q L = R w L 7.08 × 1 0 3 k H p w p ¯   μ L I a n i ln h I a n i r w I a n i + 1 + π h sin π n x I a n i 1.224 s d x
where Rw is the radius of the main wellbore. This equation is integrated to give the following:
q L = 7.08 × 1 0 3 k H h p w p ¯   π μ L sin π n ln I a n i ln h I a n i r w I a n i + 1 I a n i 1.224 s + π h sin π n L I a n i ln h I a n i r w I a n i + 1 I a n i 1.224 s + π h sin π n R w
If a well has n evenly placed radial laterals, the fluid injection rate of the well can be expressed as:
Q L = 7.08 × 1 0 3 n k H h p w p ¯ π μ L sin π n ln I a n i ln h I a n i r w I a n i + 1 I a n i 1.224 s + π h sin π n L I a n i ln h I a n i r w I a n i + 1 I a n i 1.224 s + π h sin π n R w
where QL is the well liquid injection rate in bbl/day.
The maximum permissible fluid injection rate is defined as the flow rate at which the formation is broken down (fractured) by the injection pressure near the wellbore, i.e., pw = pf, where pf is the formation fracturing pressure. For highly permeable formations, such as gas hydrate reservoirs with free gas or free water, the formation fracturing pressure is approximately equal to the minimum formation stress. Therefore, the maximum permissible fluid injection rate is expressed as follows:
Q L m a x = 7.08 × 1 0 3 n k H h s m i n p ¯ π μ L sin π n ln I a n i ln h I a n i r w I a n i + 1 I a n i 1.224 s + π h sin π n L I a n i ln h I a n i r w I a n i + 1 I a n i 1.224 s + π h sin π n R w
where smin is the minimum formation stress, which is normally the vertical in-situ stress in subsea sediments.

References

  1. Frölicher, T.L.; Winton, M.; Sarmiento, J.L. Continued Global Warming after CO2 Emissions Stoppage. Nat. Clim. Chang. 2014, 4, 40–44. [Google Scholar] [CrossRef]
  2. Soeder, D.J. Greenhouse Gas Sources and Mitigation Strategies from a Geosciences Perspective. Adv. Geo-Energy Res. 2021, 5, 274–285. [Google Scholar] [CrossRef]
  3. Gaurina-Međimurec, N.; Mavar, K.N. Carbon Capture and Storage (CCS): Geological Sequestration of CO2. In CO2 Sequestration; IntechOpen: London, UK, 2019; pp. 1–21. [Google Scholar]
  4. Sun, J.; Chen, Z.; Wang, X.; Zhang, Y.; Qin, Y.; Chen, C.; Li, W.; Zhou, W. Displacement Characteristics of CO2 to CH4 in Heterogeneous Surface Slit Pores. Energy Fuels 2023, 37, 2926–2944. [Google Scholar] [CrossRef]
  5. NACAP. The North American Carbon Storage Atlas; EXIT The U.S. Department of Energy (DOE): Washington, DC, USA; Natural Resources Canada (NRCan): Ottawa, ON, Canada; the Mexican Ministry of Energy (SENER): Mexico City, Mexico, 2012.
  6. Duguid, A.; Glier, J.; Heinrichs, M.; Hawkins, J.; Peterson, R.; Mishra, S. Practical leakage risk assessment for CO2 assisted enhanced oil recovery and geologic storage in Ohio’s depleted oil fields. Int. J. Greenh. Gas. Control 2021, 109, 103338. [Google Scholar] [CrossRef]
  7. Pan, L.; Oldenburg, C.M.; Pruess, K.; Wu, Y. Transient CO2 leakage and injection in wellbore-reservoir systems for geological carbon sequestration. Greemhouse Gases Sci. Technol. 2011, 1, 335–350. [Google Scholar] [CrossRef]
  8. Benge, G. Improving Wellbore Seal Integrity in CO2 Injection Wells. Energy Procedia 2009, 1, 3523–3529. [Google Scholar] [CrossRef]
  9. Hossain, M.M.; Amro, M.M. Drilling and Completion Challenges and Remedies of CO2 Injected Wells with Emphasis to Mitigate Well Integrity Issues. In Proceedings of the SPE Asia Pacific Oil and Gas Conference and Exhibition, Brisbane, Australia, 18–20 October 2010; SPE: Richardson, TX, USA, 2010; p. SPE-133830. [Google Scholar]
  10. API RP 10B-2; API Recommended Practice 10B-2, Recommended Practice for Testing Well Cements. API: Washington, DC, USA, 2013.
  11. Duguid, A.; Guo, B.; Nygaard, R. Well Integrity Assessment of Monitoring Wells at an Active CO2-EOR Flood. Energy Procedia 2017, 114, 5118–5138. [Google Scholar] [CrossRef]
  12. Liu, Y.; Dai, C.; Wang, K.; Zou, C.; Gao, M.; Fang, Y.; You, Q. Study on a novel cross-linked polymer gel strengthened with silica nanoparticles. Energy Fuels 2017, 31, 9152–9161. [Google Scholar] [CrossRef]
  13. Olayiwola, O.; Nguyen, V.; Andres, R.; Liu, N. The Application of Nano-Silica Gel in Sealing Well Micro-Annuli and Cement Channeling. arXiv 2023, arXiv:2301.08288. [Google Scholar] [CrossRef]
  14. Bhawangirkar, D.R.; Nair, V.C.; Sangwai, J.S. Phase Equilibria and Kinetics of Methane Hydrate Formation and Dissociation in Krishna–Godavari Basin Marine Sediments. In Proceedings of the Fifth International Conference in Ocean Engineering (ICOE2019), Xiamen, China, 7–9 June 2019; Springer: Berlin/Heidelberg, Germany, 2021; pp. 405–411. [Google Scholar]
  15. Moridis, G.J.; Collett, T.S.; Boswell, R.; Kurihara, M.; Reagan, M.T.; Koh, C.; Sloan, E.D. Toward Production from Gas Hydrates: Current Status, Assessment of Resources, and Simulation-Based Evaluation of Technology and Potential. SPE Reserv. Eval. Eng. 2009, 12, 745–771. [Google Scholar] [CrossRef]
  16. Moridis, G.J.; Kowalsky, M.B.; Pruess, K. Depressurization-Induced Gas Production from Class 1 Hydrate Deposits. SPE Reserv. Eval. Eng. 2007, 10, 458–481. [Google Scholar] [CrossRef]
  17. Davies, S.R.; Sloan, E.D.; Sum, A.K.; Koh, C.A. In Situ Studies of the Mass Transfer Mechanism across a Methane Hydrate Film Using High-Resolution Confocal Raman Spectroscopy. J. Phys. Chem. C 2010, 114, 1173–1180. [Google Scholar] [CrossRef]
  18. Guo, B.; Zhang, P. Theoretical Assessment of CO2 Injection into Low-Temperature Water Zones for Non-Leaking Storage in Hydrate Form. Adv. Geo-Energy Res. 2023, 10, 1–6. [Google Scholar] [CrossRef]
  19. Putra, S.K.; Sinaga, S.Z.; Marbun, B.T.H. Review of Ultrashort-Radius Radial System (URRS). In Proceedings of the IPTC 2012: International Petroleum Technology Conference, Bangkok, Thailand, 7–9 February 2012; European Association of Geoscientists & Engineers: Utrecht, The Netherlands, 2012; p. cp-280. [Google Scholar]
  20. Abdel-Ghany, M.A.; Siso, S.; Hassan, A.M.; Pierpaolo, P.; Roberto, C. New Technology Application, Radial Drilling Petrobel, First Well in Egypt. In Proceedings of the Offshore Mediterranean Conference and Exhibition, OMC, Ravenna, Italy, 23–25 March 2011; p. OMC-2011. [Google Scholar]
  21. Bin, W.; Gensheng, L.; Zhongwei, H.; Jingbin, L.; Dongbo, Z.; Hao, L. Hydraulics Calculations and Field Application of Radial Jet Drilling. SPE Drill. Complet. 2016, 31, 71–81. [Google Scholar] [CrossRef]
  22. Kamel, A.H. A Technical Review of Radial Jet Drilling. J. Pet. Gas Eng. 2017, 8, 79–89. [Google Scholar]
  23. Qin, X.; Mao, J.; Liu, J.; Zhao, Y.; Long, W. Extended Reach Analysis of Coiled Tubing Assisted Radial Jet Drilling. In Proceedings of the SPE/ICoTA Well Intervention Conference and Exhibition, The Woodlands, TX, USA, 25–26 March 2014; SPE: Richardson, TX, USA, 2020; p. D012S009R001. [Google Scholar]
  24. Liu, C.; Ye, Y.; Meng, Q.; He, X.; Lu, H.; Zhang, J.; Liu, J.; Yang, S. The Characteristics of Gas Hydrates Recovered from Shenhu Area in the South China Sea. Mar. Geol. 2012, 307, 22–27. [Google Scholar] [CrossRef]
  25. Teng, X.; Yang, P.; Li, N.; Yang, C.; Jin, Y.; Lu, Y.; Zhou, B.; Wang, X.; Zhang, F.; Li, J. Radial Drilling Revitalizes Aging Field in Tarim: A Case Study. In Proceedings of the SPE/ICoTA Coiled Tubing and Well Intervention Conference and Exhibition, The Woodlands, TX, USA, 25–26 March 2014; OnePetro: Richardson, TX, USA, 2014. [Google Scholar]
  26. Jain, D.; Maut, P.P.; Saharia, P.; Dutta, R.; Yomdo, S.; Hatchell, I.; Mukherjee, A. Radial Jet Drilling in Mature Fields of Oil India Limited-an Experimental Approach. In Proceedings of the SPE Oil and Gas India Conference and Exhibition, Mumbai, India, 4–6 April 2017; SPE: Richardson, TX, USA, 2017; p. D031S016R001. [Google Scholar]
  27. Maut, P.P.; Jain, D.; Mohan, R.; Talukdar, D.; Baruah, T.; Sharma, P.; Verma, S. Production Enhancement in Mature Fields of Assam Arakan Basin by Radial Jet Drilling-a Case Study. In Proceedings of the SPE Symposium: Production Enhancement and Cost Optimisation, Kuala Lumpur, Malaysia, 7–8 November 2017; SPE: Richardson, TX, USA, 2017; p. D011S003R005. [Google Scholar]
  28. Furui, K.; Zhu, D.; Hill, A.D. A Rigorous Formation Damage Skin Factor and Reservoir Inflow Model for a Horizontal Well. SPE Prod. Facil. 2003, 18, 151–157. [Google Scholar] [CrossRef]
  29. Guo, B.; Shaibu, R.; Yang, X. Analytical Model for Predicting Productivity of Radial-Lateral Wells. Energies 2020, 13, 6386. [Google Scholar] [CrossRef]
  30. Wang, Y.; Li, X.-S.; Li, G.; Huang, N.-S.; Feng, J.-C. Experimental Study on the Hydrate Dissociation in Porous Media by Five-Spot Thermal Huff and Puff Method. Fuel 2014, 117, 688–696. [Google Scholar] [CrossRef]
  31. Li, J.; Ye, J.; Qin, X.; Qiu, H.; Wu, N.; Lu, H.; Xie, W.; Lu, J.; Peng, F.; Xu, Z. The First Offshore Natural Gas Hydrate Production Test in South China Sea. China Geol. 2018, 1, 5–16. [Google Scholar] [CrossRef]
  32. Chen, L.; Feng, Y.; Okajima, J.; Komiya, A.; Maruyama, S. Production Behavior and Numerical Analysis for 2017 Methane Hydrate Extraction Test of Shenhu, South China Sea. J. Nat. Gas Sci. Eng. 2018, 53, 55–66. [Google Scholar] [CrossRef]
  33. Lu, C.; Qin, X.; Sun, J.; Wang, R.; Cai, J. Research Progress and Scientific Challenges in the Depressurization Exploitation Mechanism of Clayey-Silt Natural Gas Hydrates in the Northern South China Sea. Adv. Geo-Energy Res. 2023, 10, 14–20. [Google Scholar] [CrossRef]
Figure 1. A sketch of a radial-lateral well with four identical laterals.
Energies 16 07987 g001
Figure 2. The effects of number of laterals and lateral length on FoIRoV.
Energies 16 07987 g002
Figure 3. The effects of the number of laterals and lateral length on FoIRoF.
Energies 16 07987 g003
Figure 4. The effect of the number of laterals and lateral length on well injectivity.
Energies 16 07987 g004
Figure 5. The effect of lateral length on well injectivity for four lateral radii.
Energies 16 07987 g005
Figure 6. The effect of reservoir permeability anisotropy on well injectivity.
Energies 16 07987 g006
Table 1. The reservoir properties and wellbore geometry for well-type comparison (parameter values estimated based on [18]).
ParameterValueUnitValueUnit
Reservoir thickness24m78 ft
Reservoir horizontal permeability1md1 md
Reservoir vertical permeability0.1md0.1 md
Radial wellbore radius0.05m0.16 ft
Main wellbore radius0.10m0.33 ft
Wellbore skin factor0 0
Fracture width0.0127m0.5 in
Fracture permeability5000md5000 md
Table 2. The reservoir properties and wellbore geometry for the case study (parameter values were estimated based on [32]).
ParameterValueUnitValueUnit
Water depth1180m3870 ft
Reservoir mid-depth1346m4415 ft
Reservoir pressure14MPa2058 psi
Reservoir temperature6°C43F
The minimum formation stress18MPa2,646 psi
Reservoir thickness22m78 ft
Reservoir horizontal permeability1md1 md
Reservoir vertical permeability0.1md0.1 md
Fluid density1100kg/m3386lb/bbl
Fluid viscosity1cp1 cp
Radial wellbore radius0.05m0.16 ft
Main wellbore radius0.10m0.33 ft
Wellbore skin factor0
Disclaimer/Publisher’s Note: The statements, opinions and data contained in all publications are solely those of the individual author(s) and contributor(s) and not of MDPI and/or the editor(s). MDPI and/or the editor(s) disclaim responsibility for any injury to people or property resulting from any ideas, methods, instructions or products referred to in the content.

