
Shear Wave Velocity Applications in Geomechanics with Focus on Risk Assessment in Carbon Capture and Storage Projects

Abstract
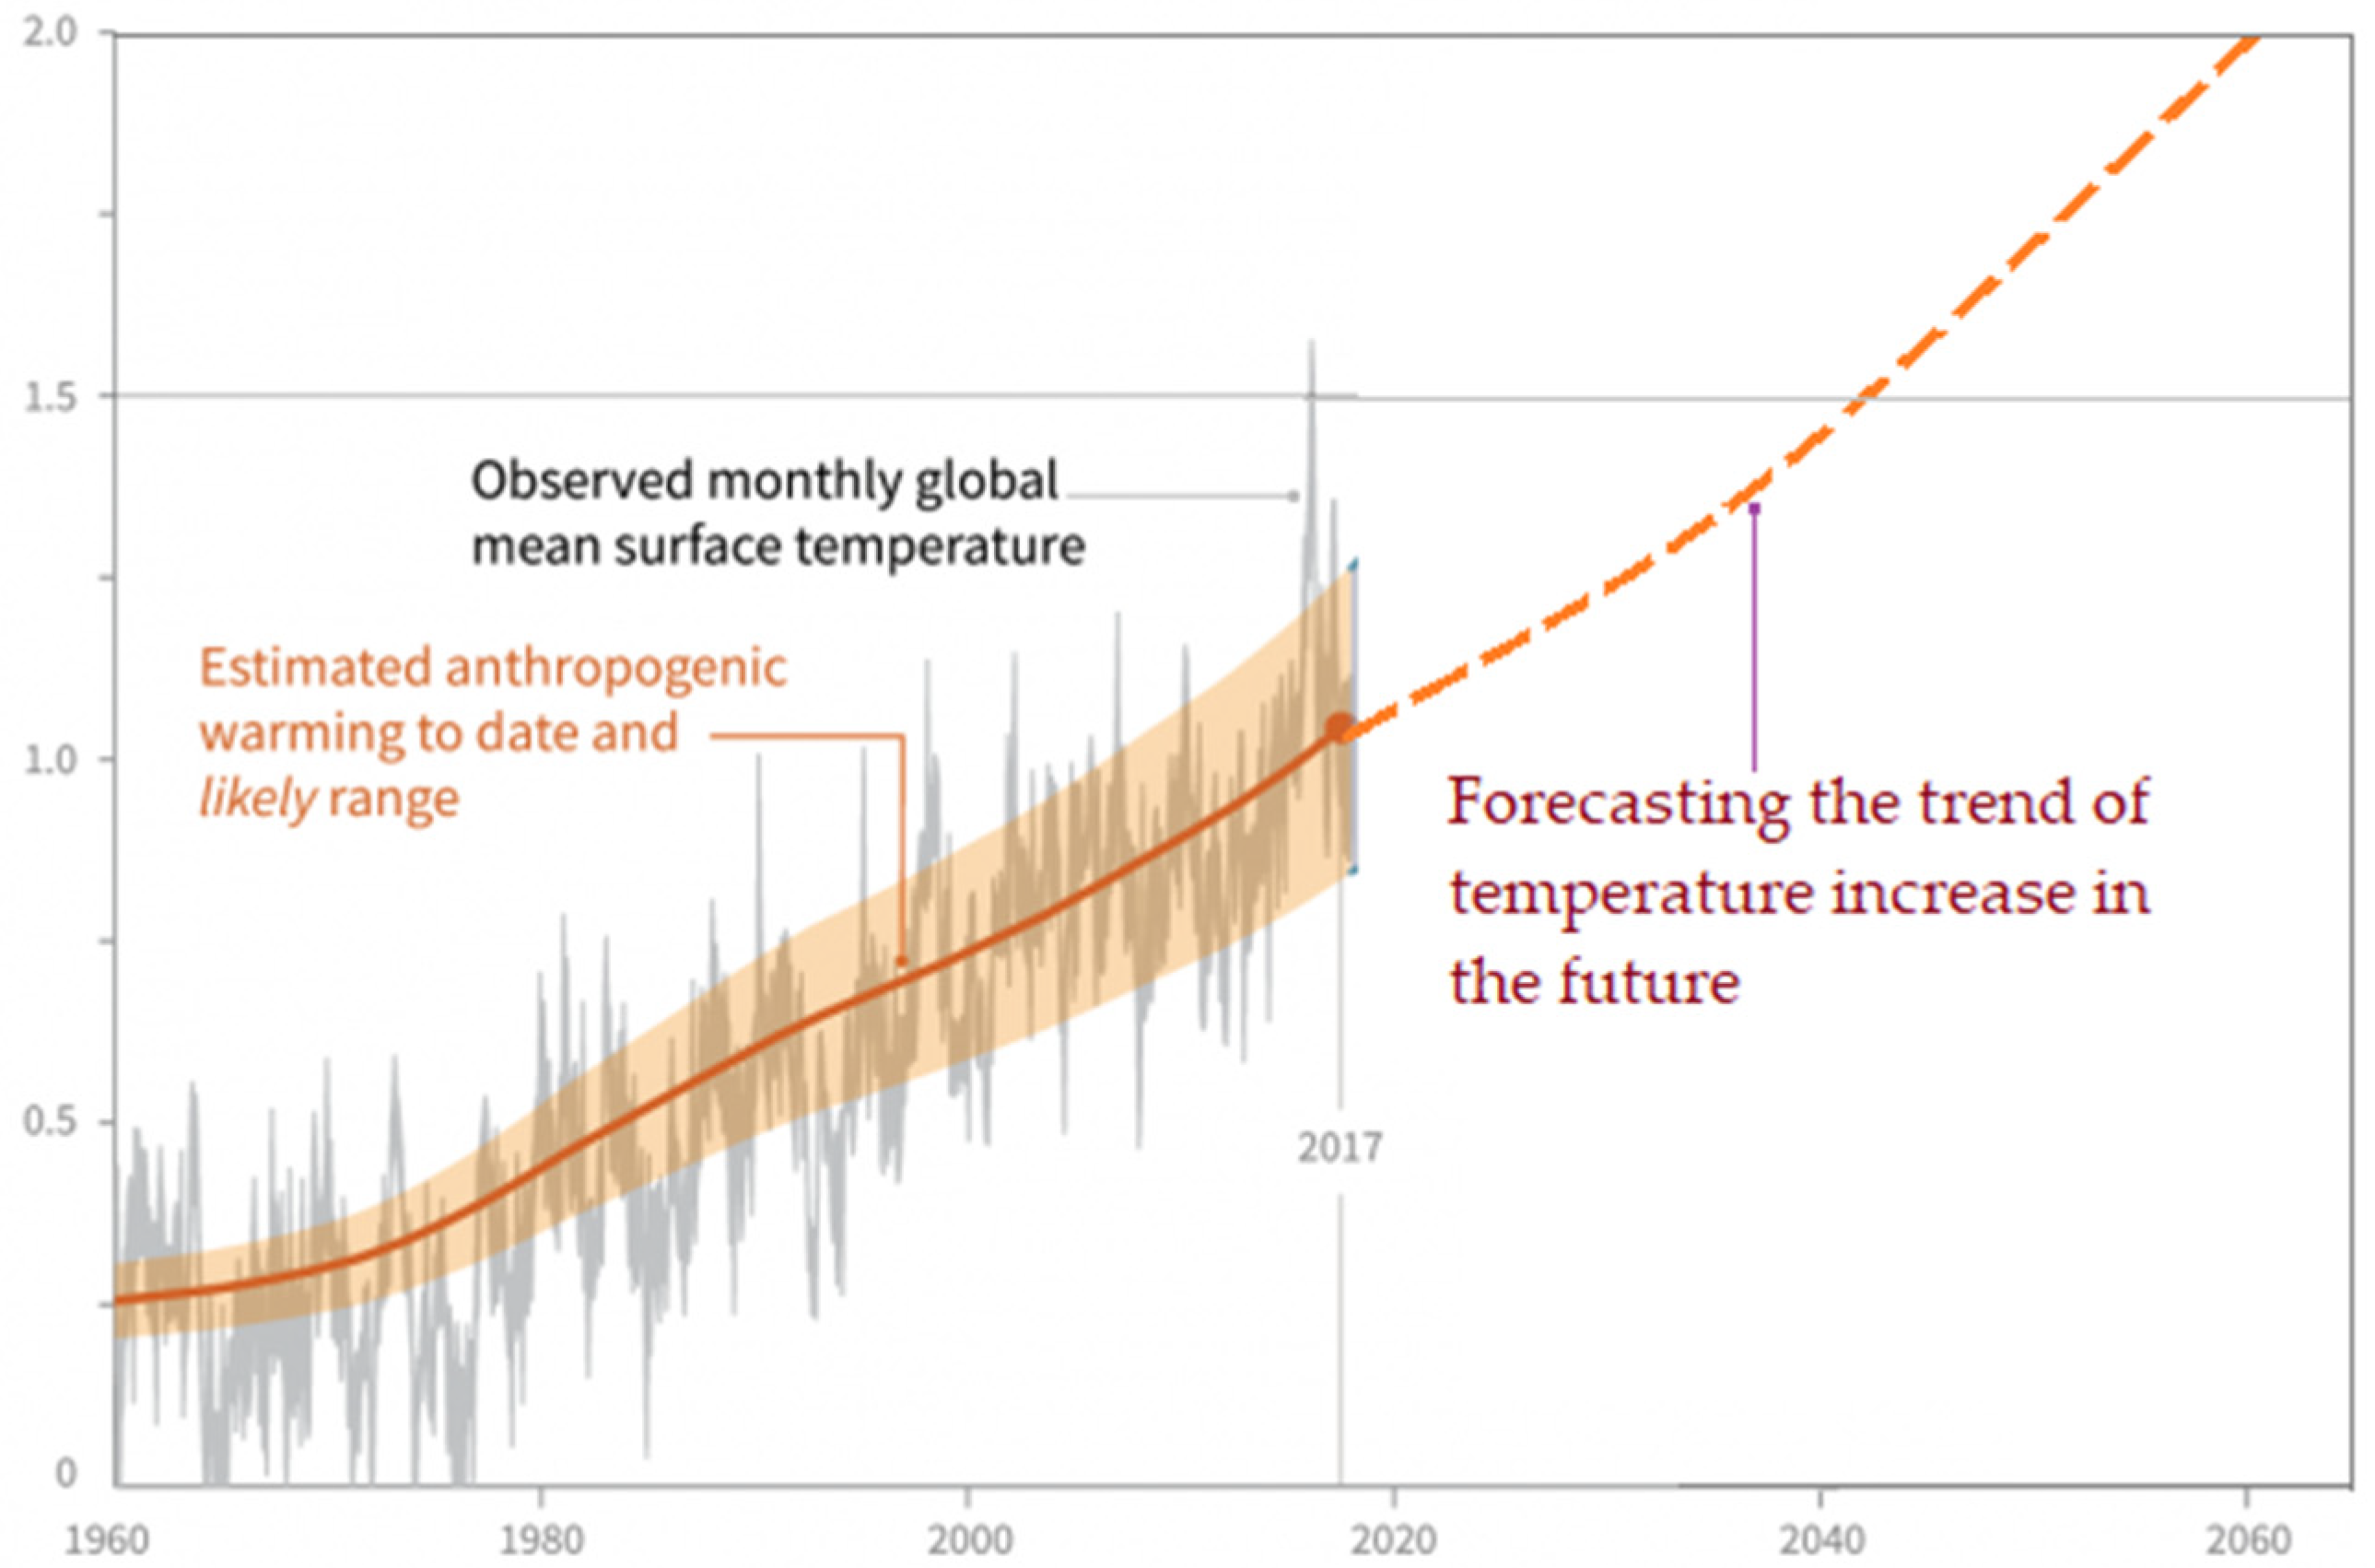
:1. Introduction
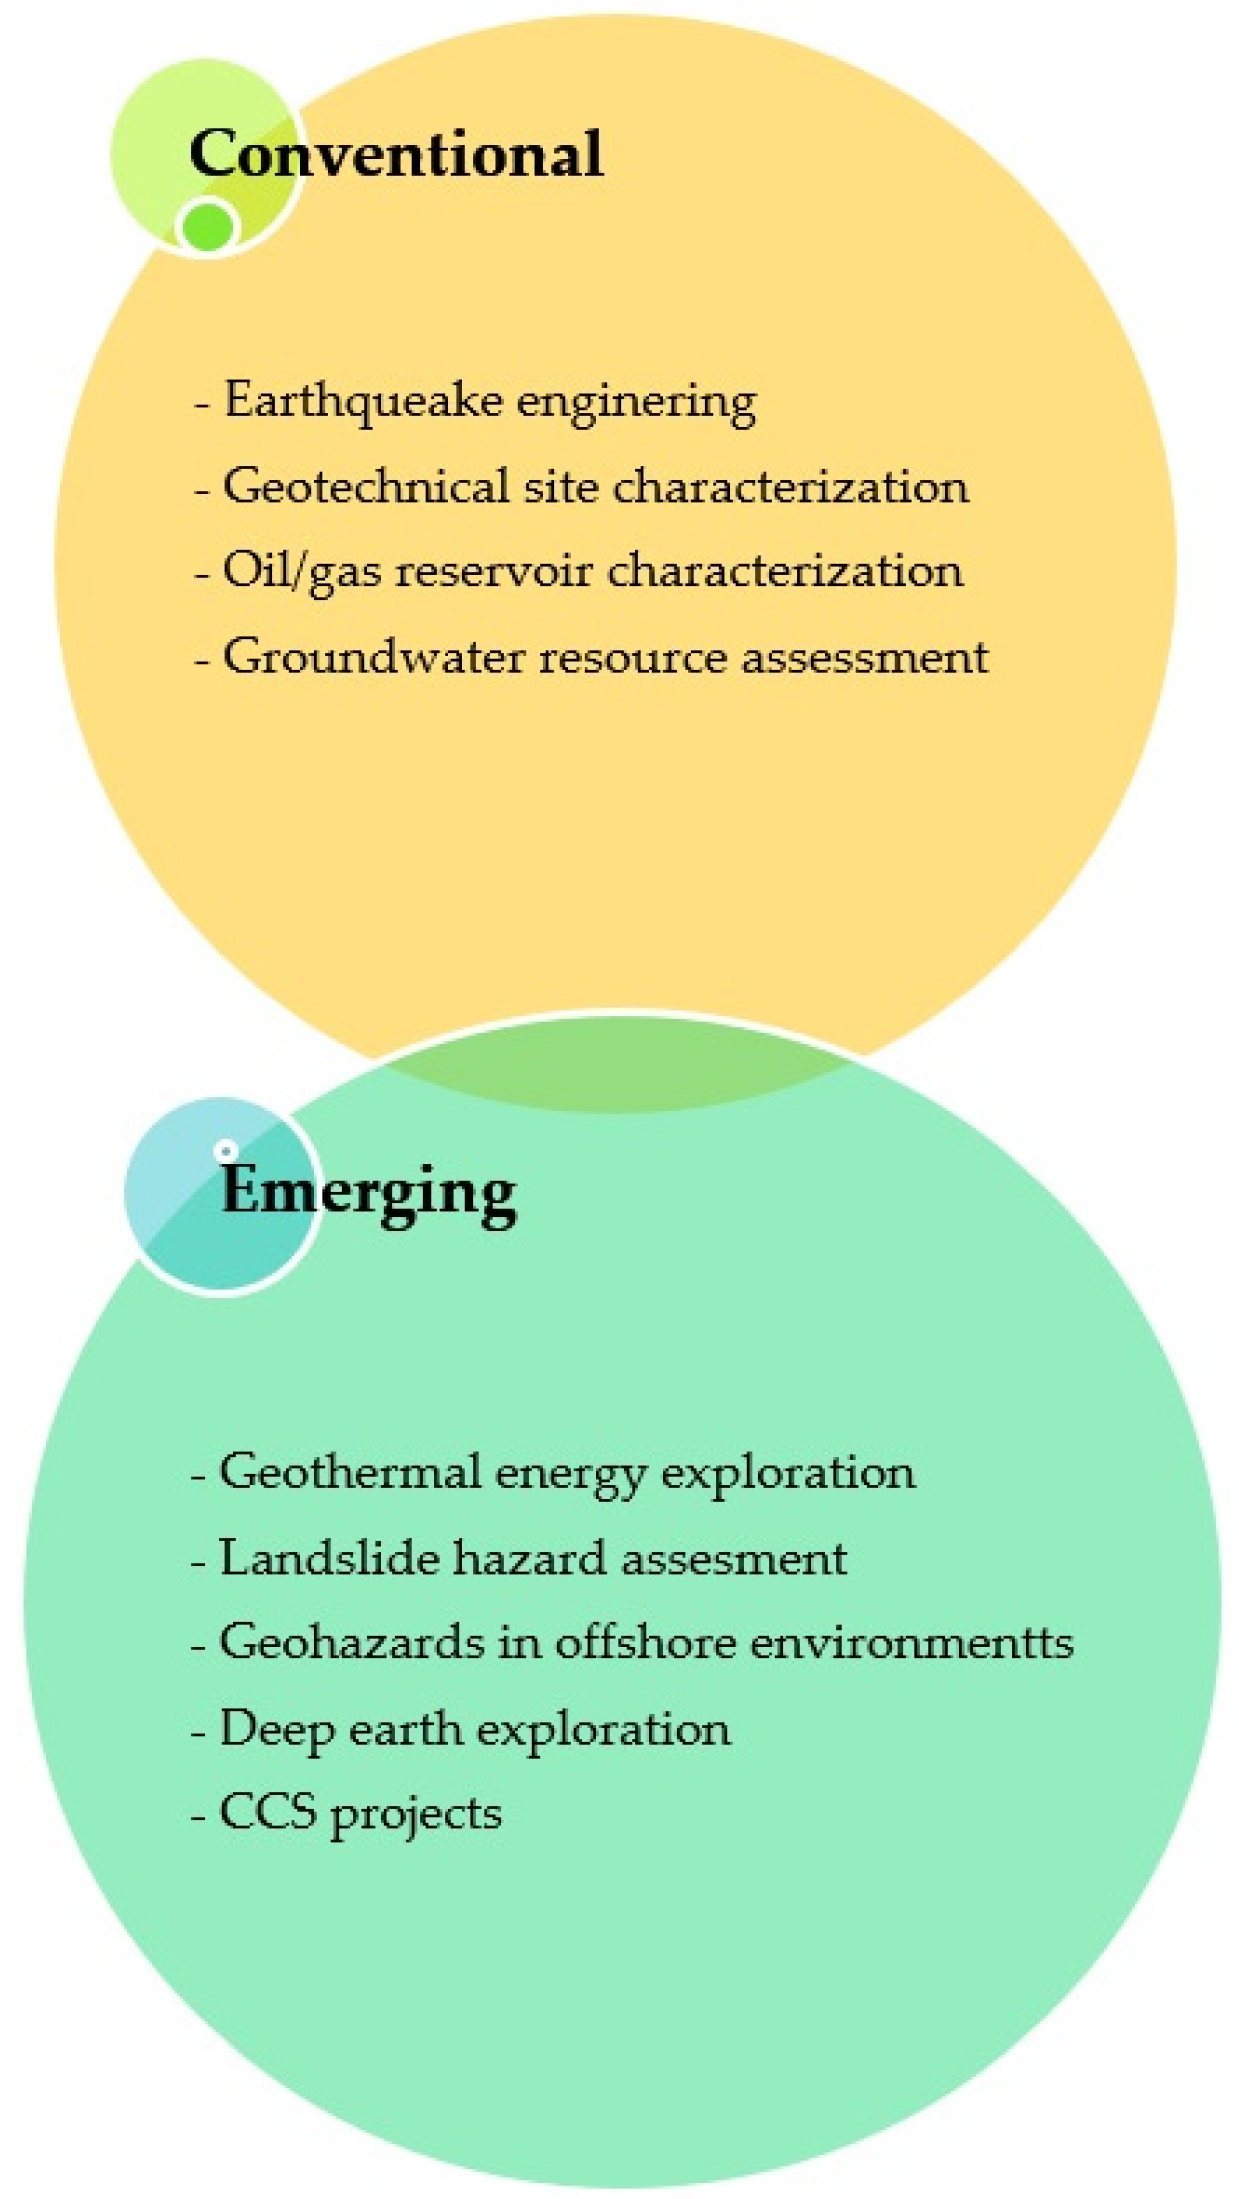
2. Applications of the Vs Parameter in Geomechanics
2.1. Conventional Applications
2.1.1. Earthquake Engineering
2.1.2. Geotechnical Site Characterization
2.1.3. Reservoir Characterization
2.1.4. Groundwater Resource Assessment
2.2. Emerging Applications
2.2.1. Geothermal Energy Exploration
2.2.2. Landslide Hazard Assessment
2.2.3. Geohazard Assessment in Offshore Environments
2.2.4. Deep Earth Exploration
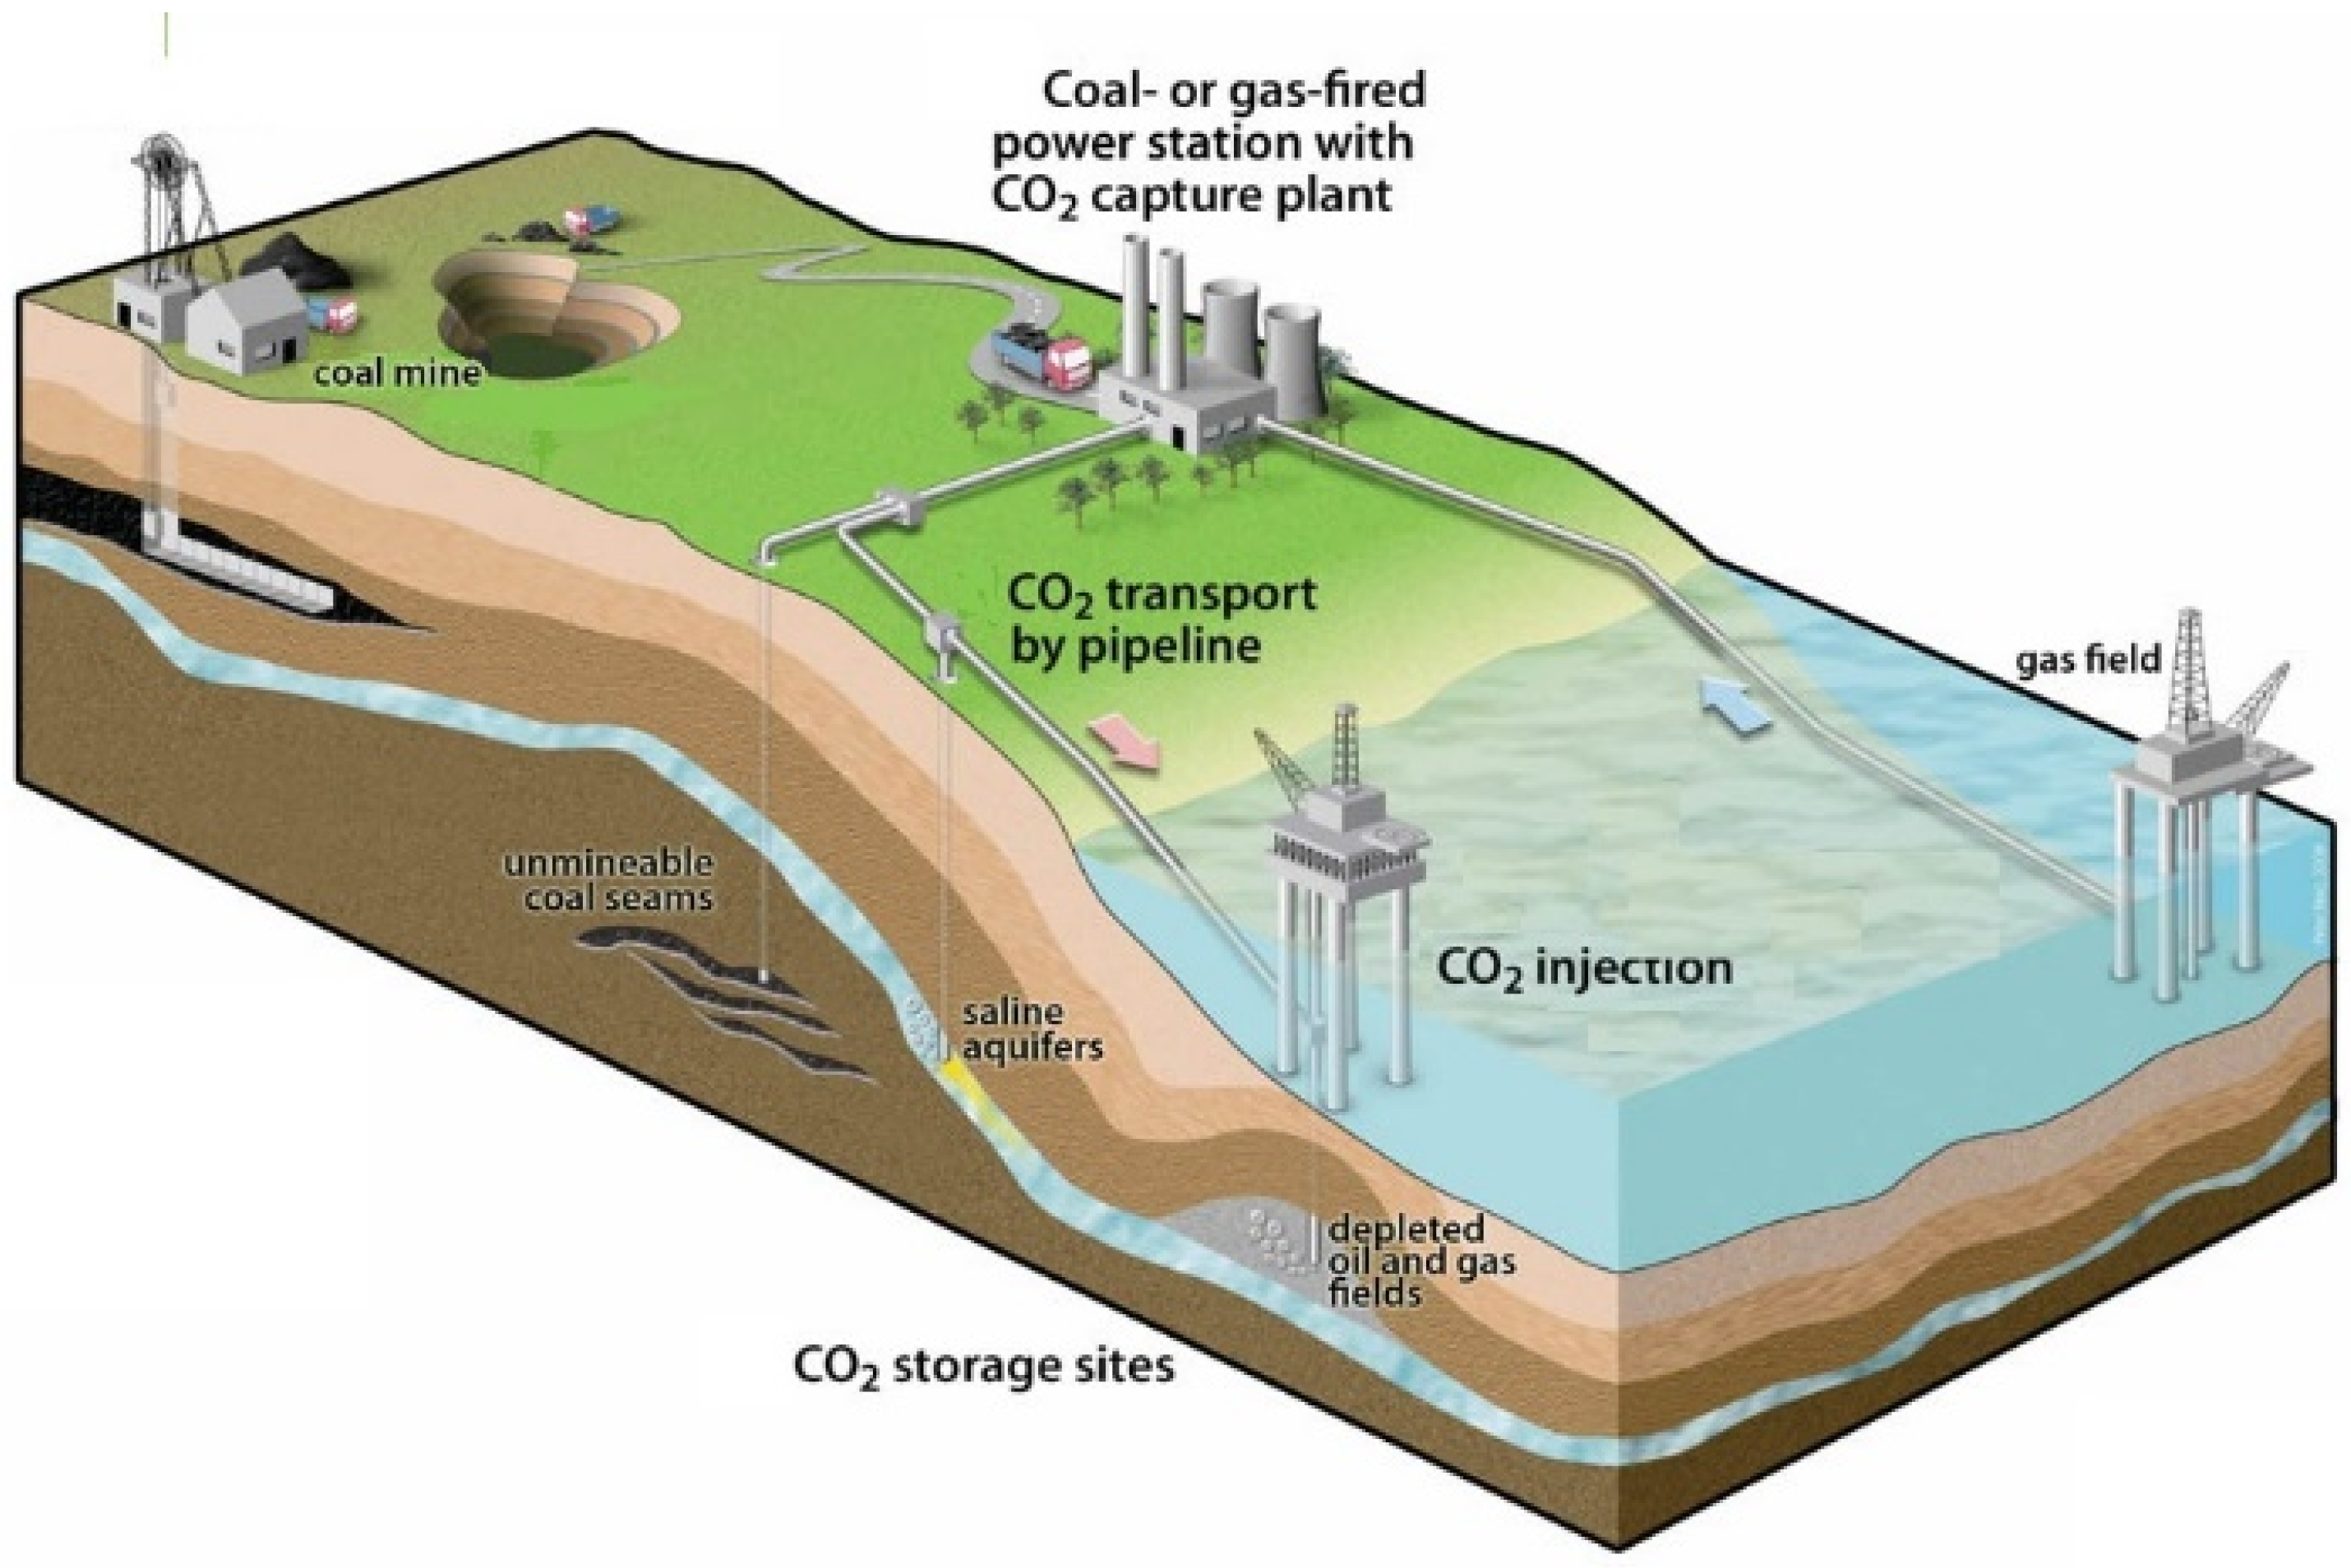
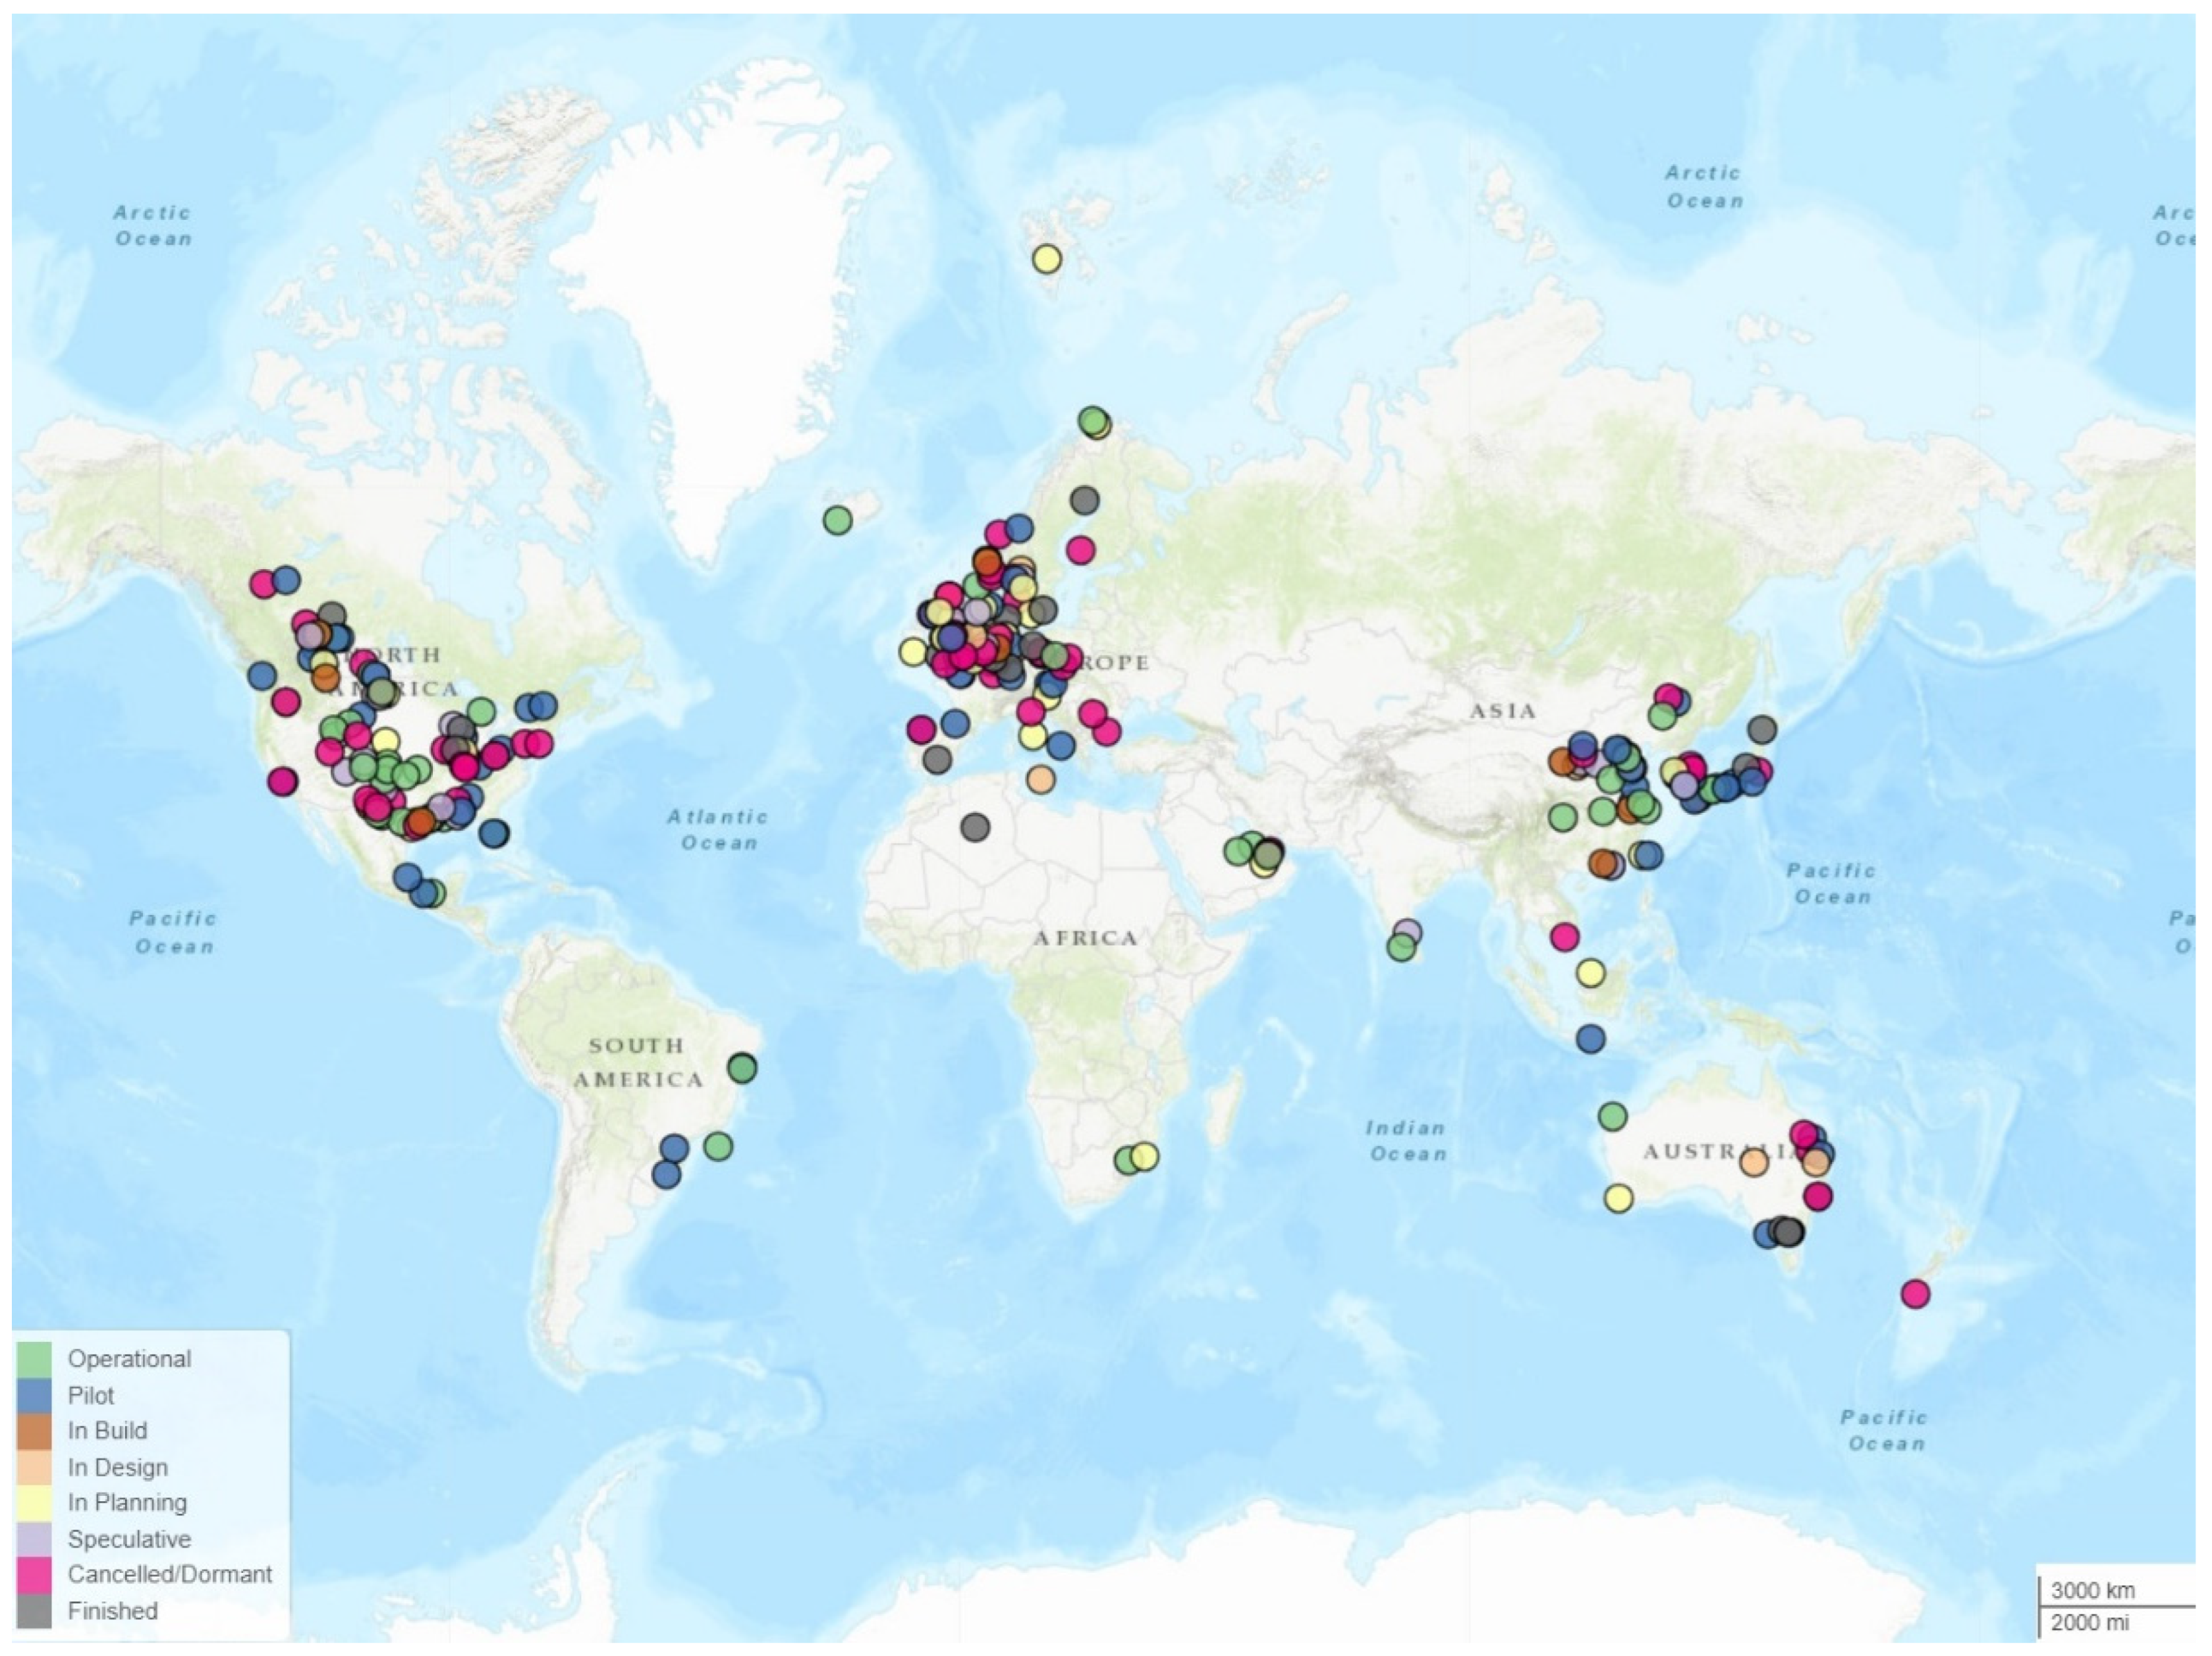
3. Vs Applications in Risk Assessment of CCS Projects
3.1. Supercritical CO2 and CCS Projects
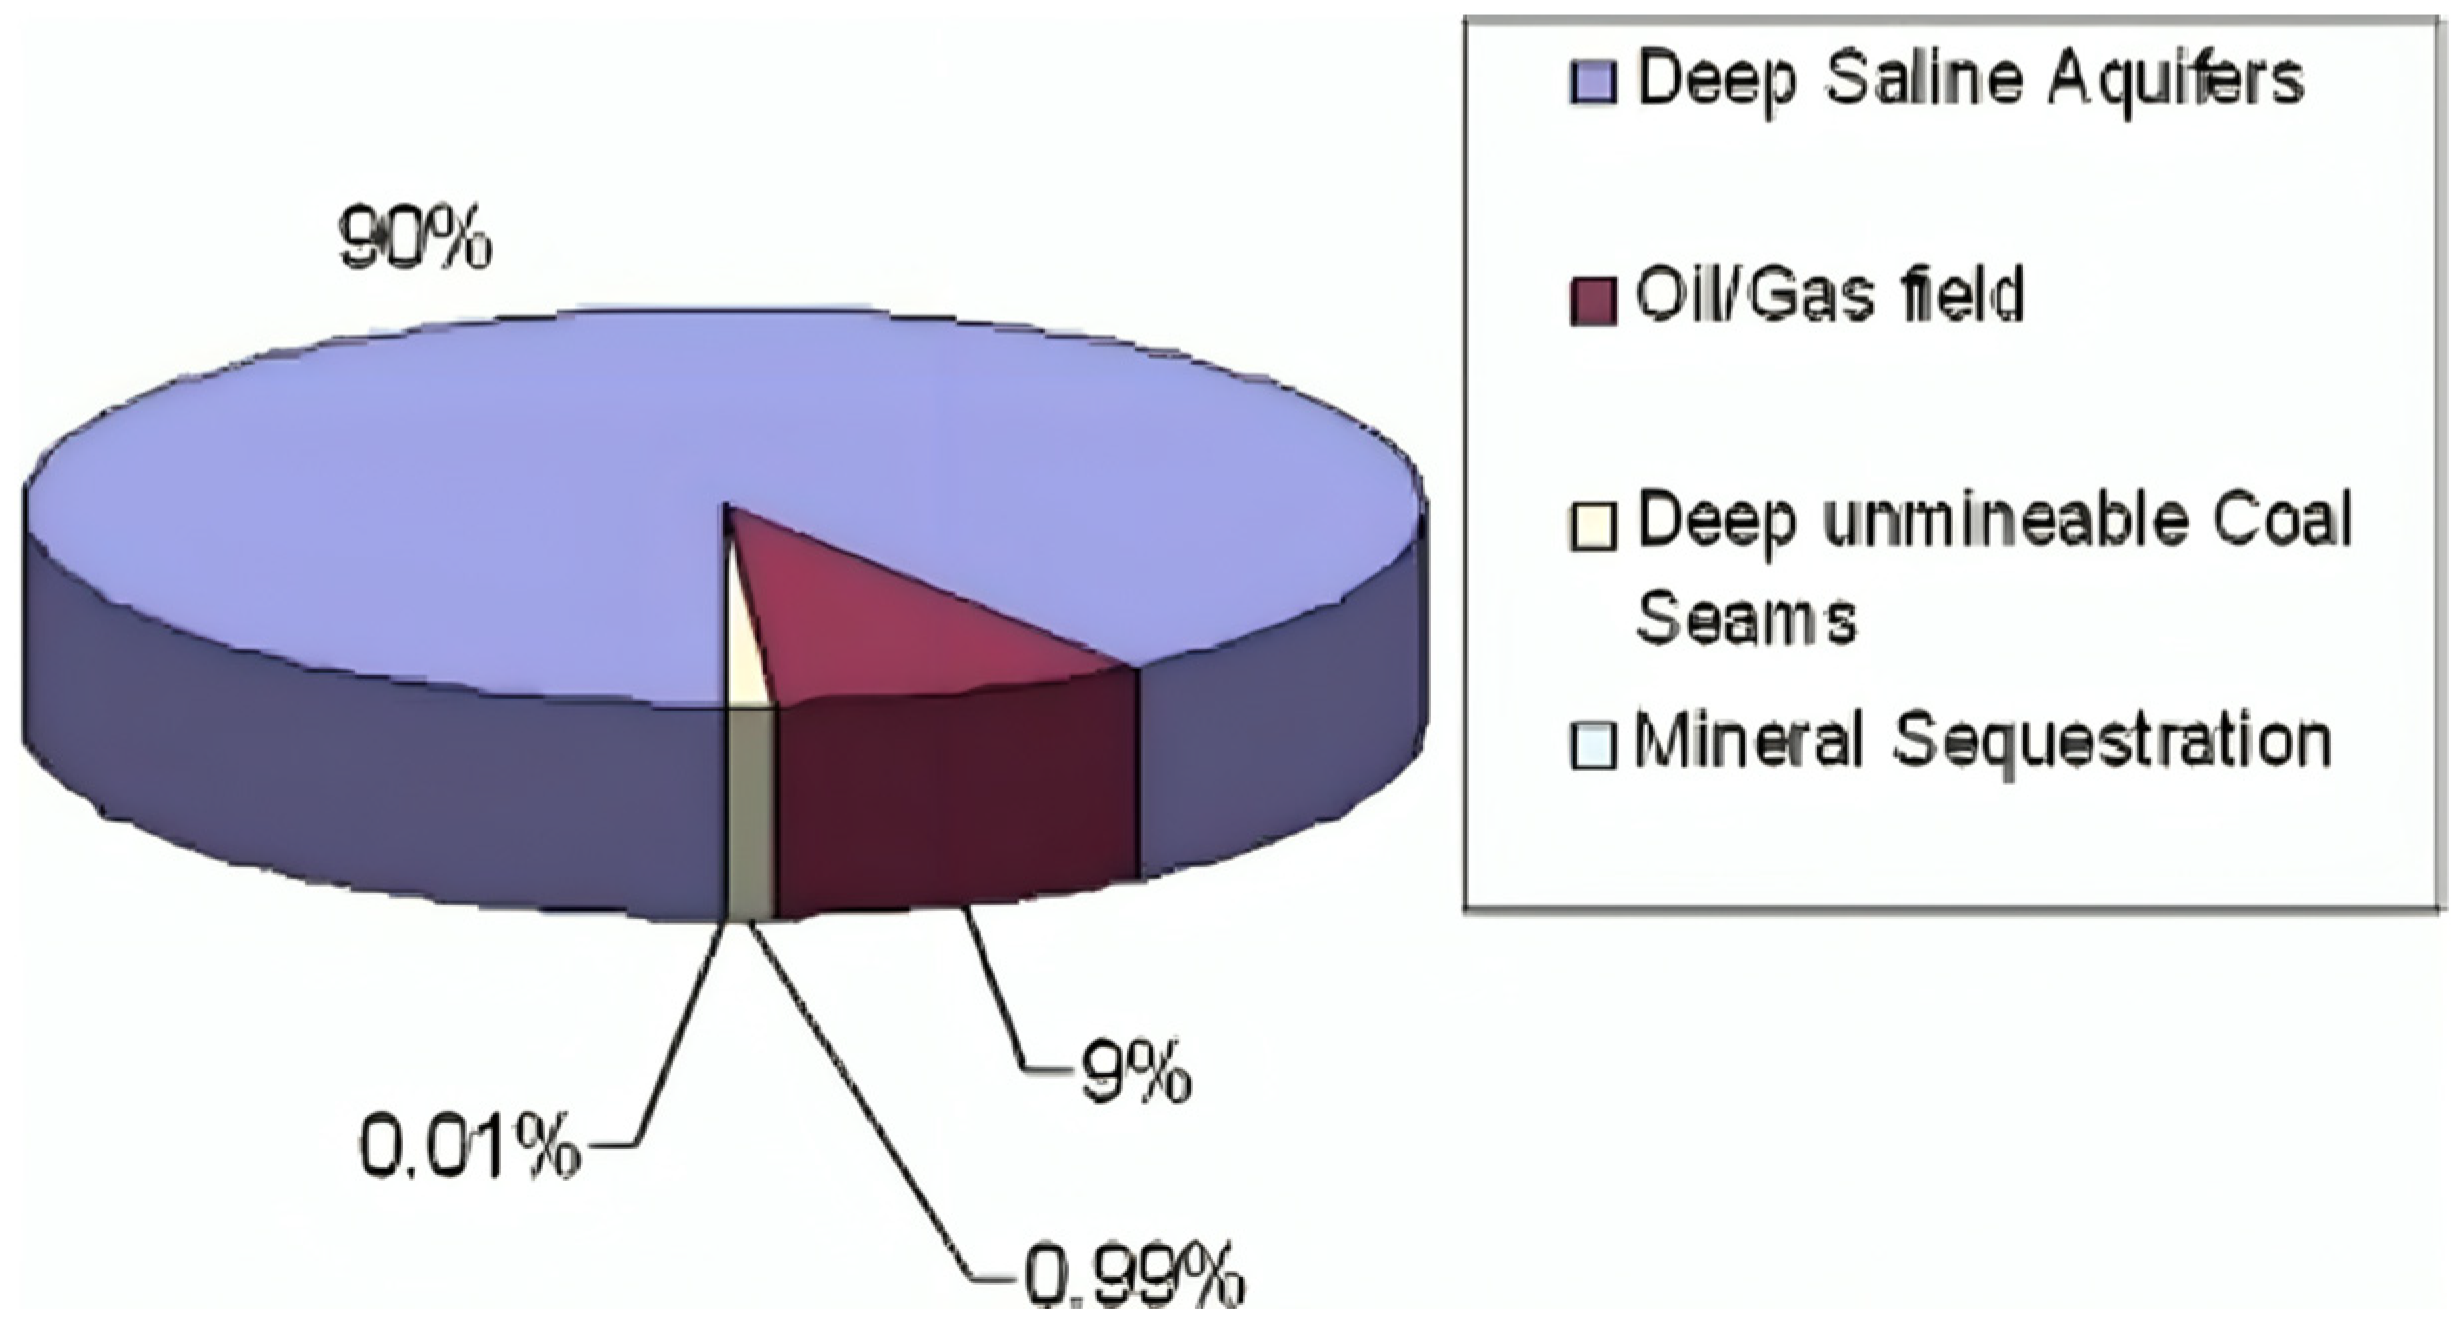
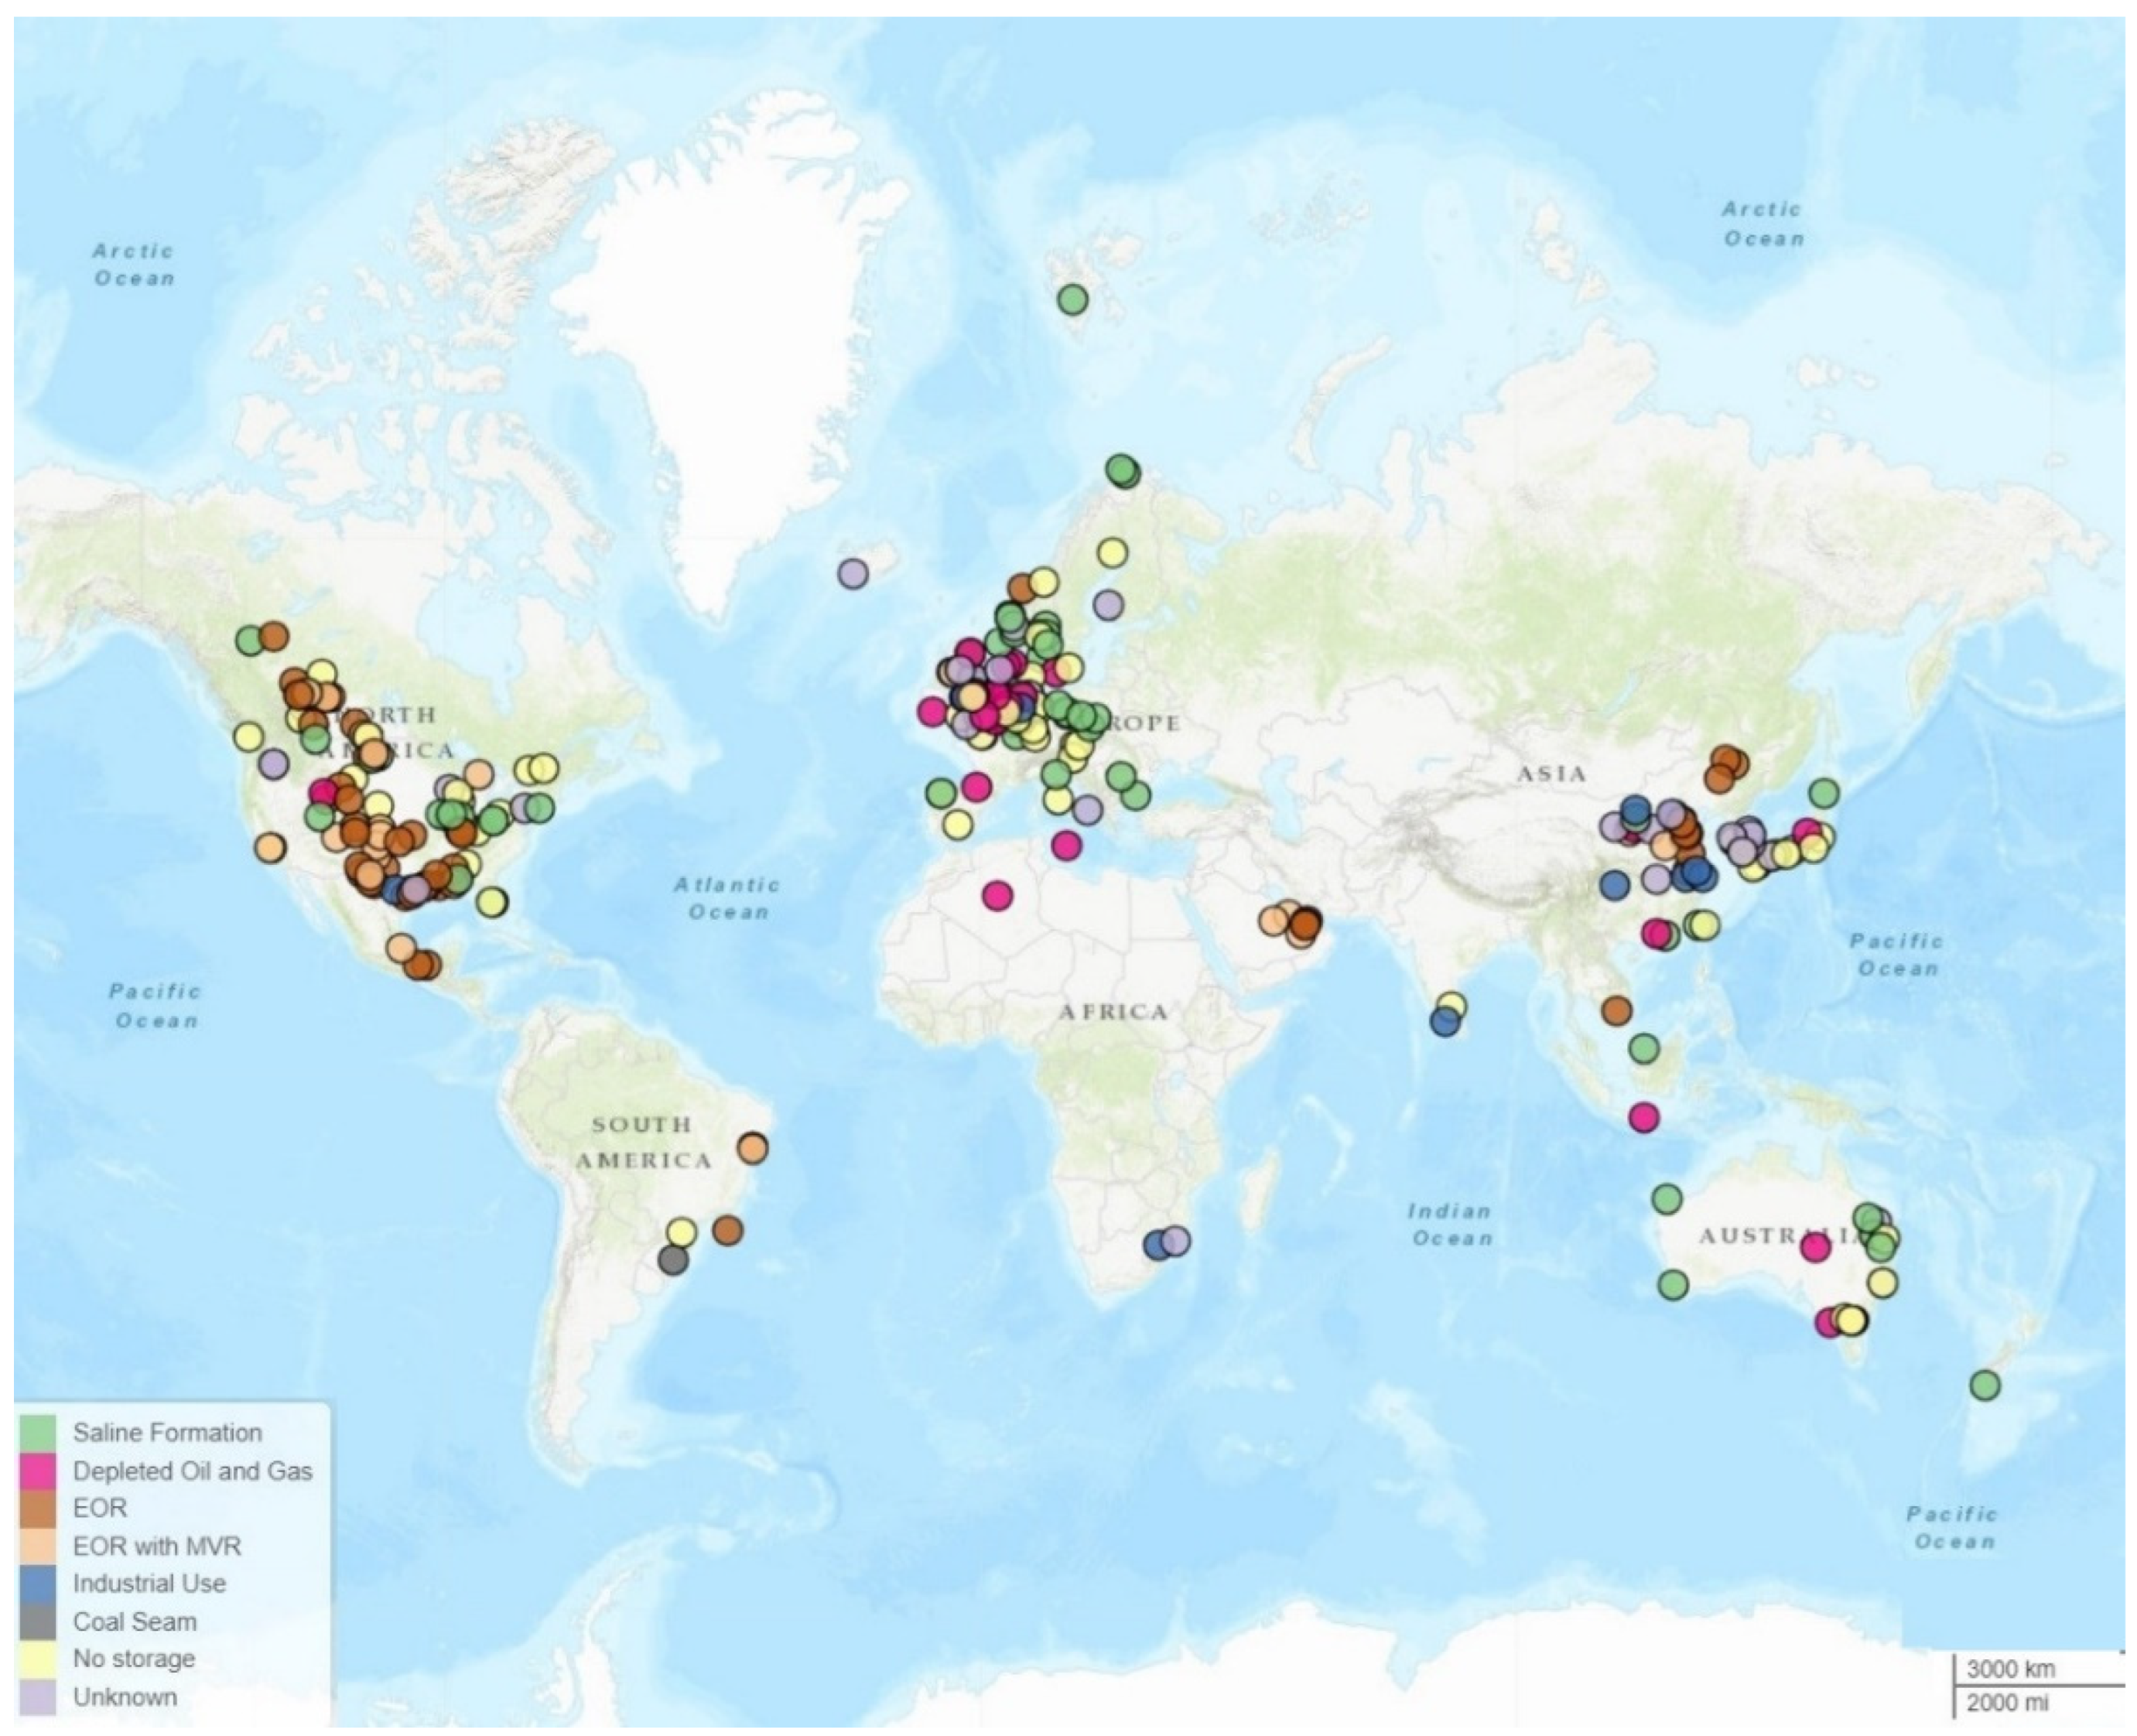
3.2. Types of Underground Storage Sites
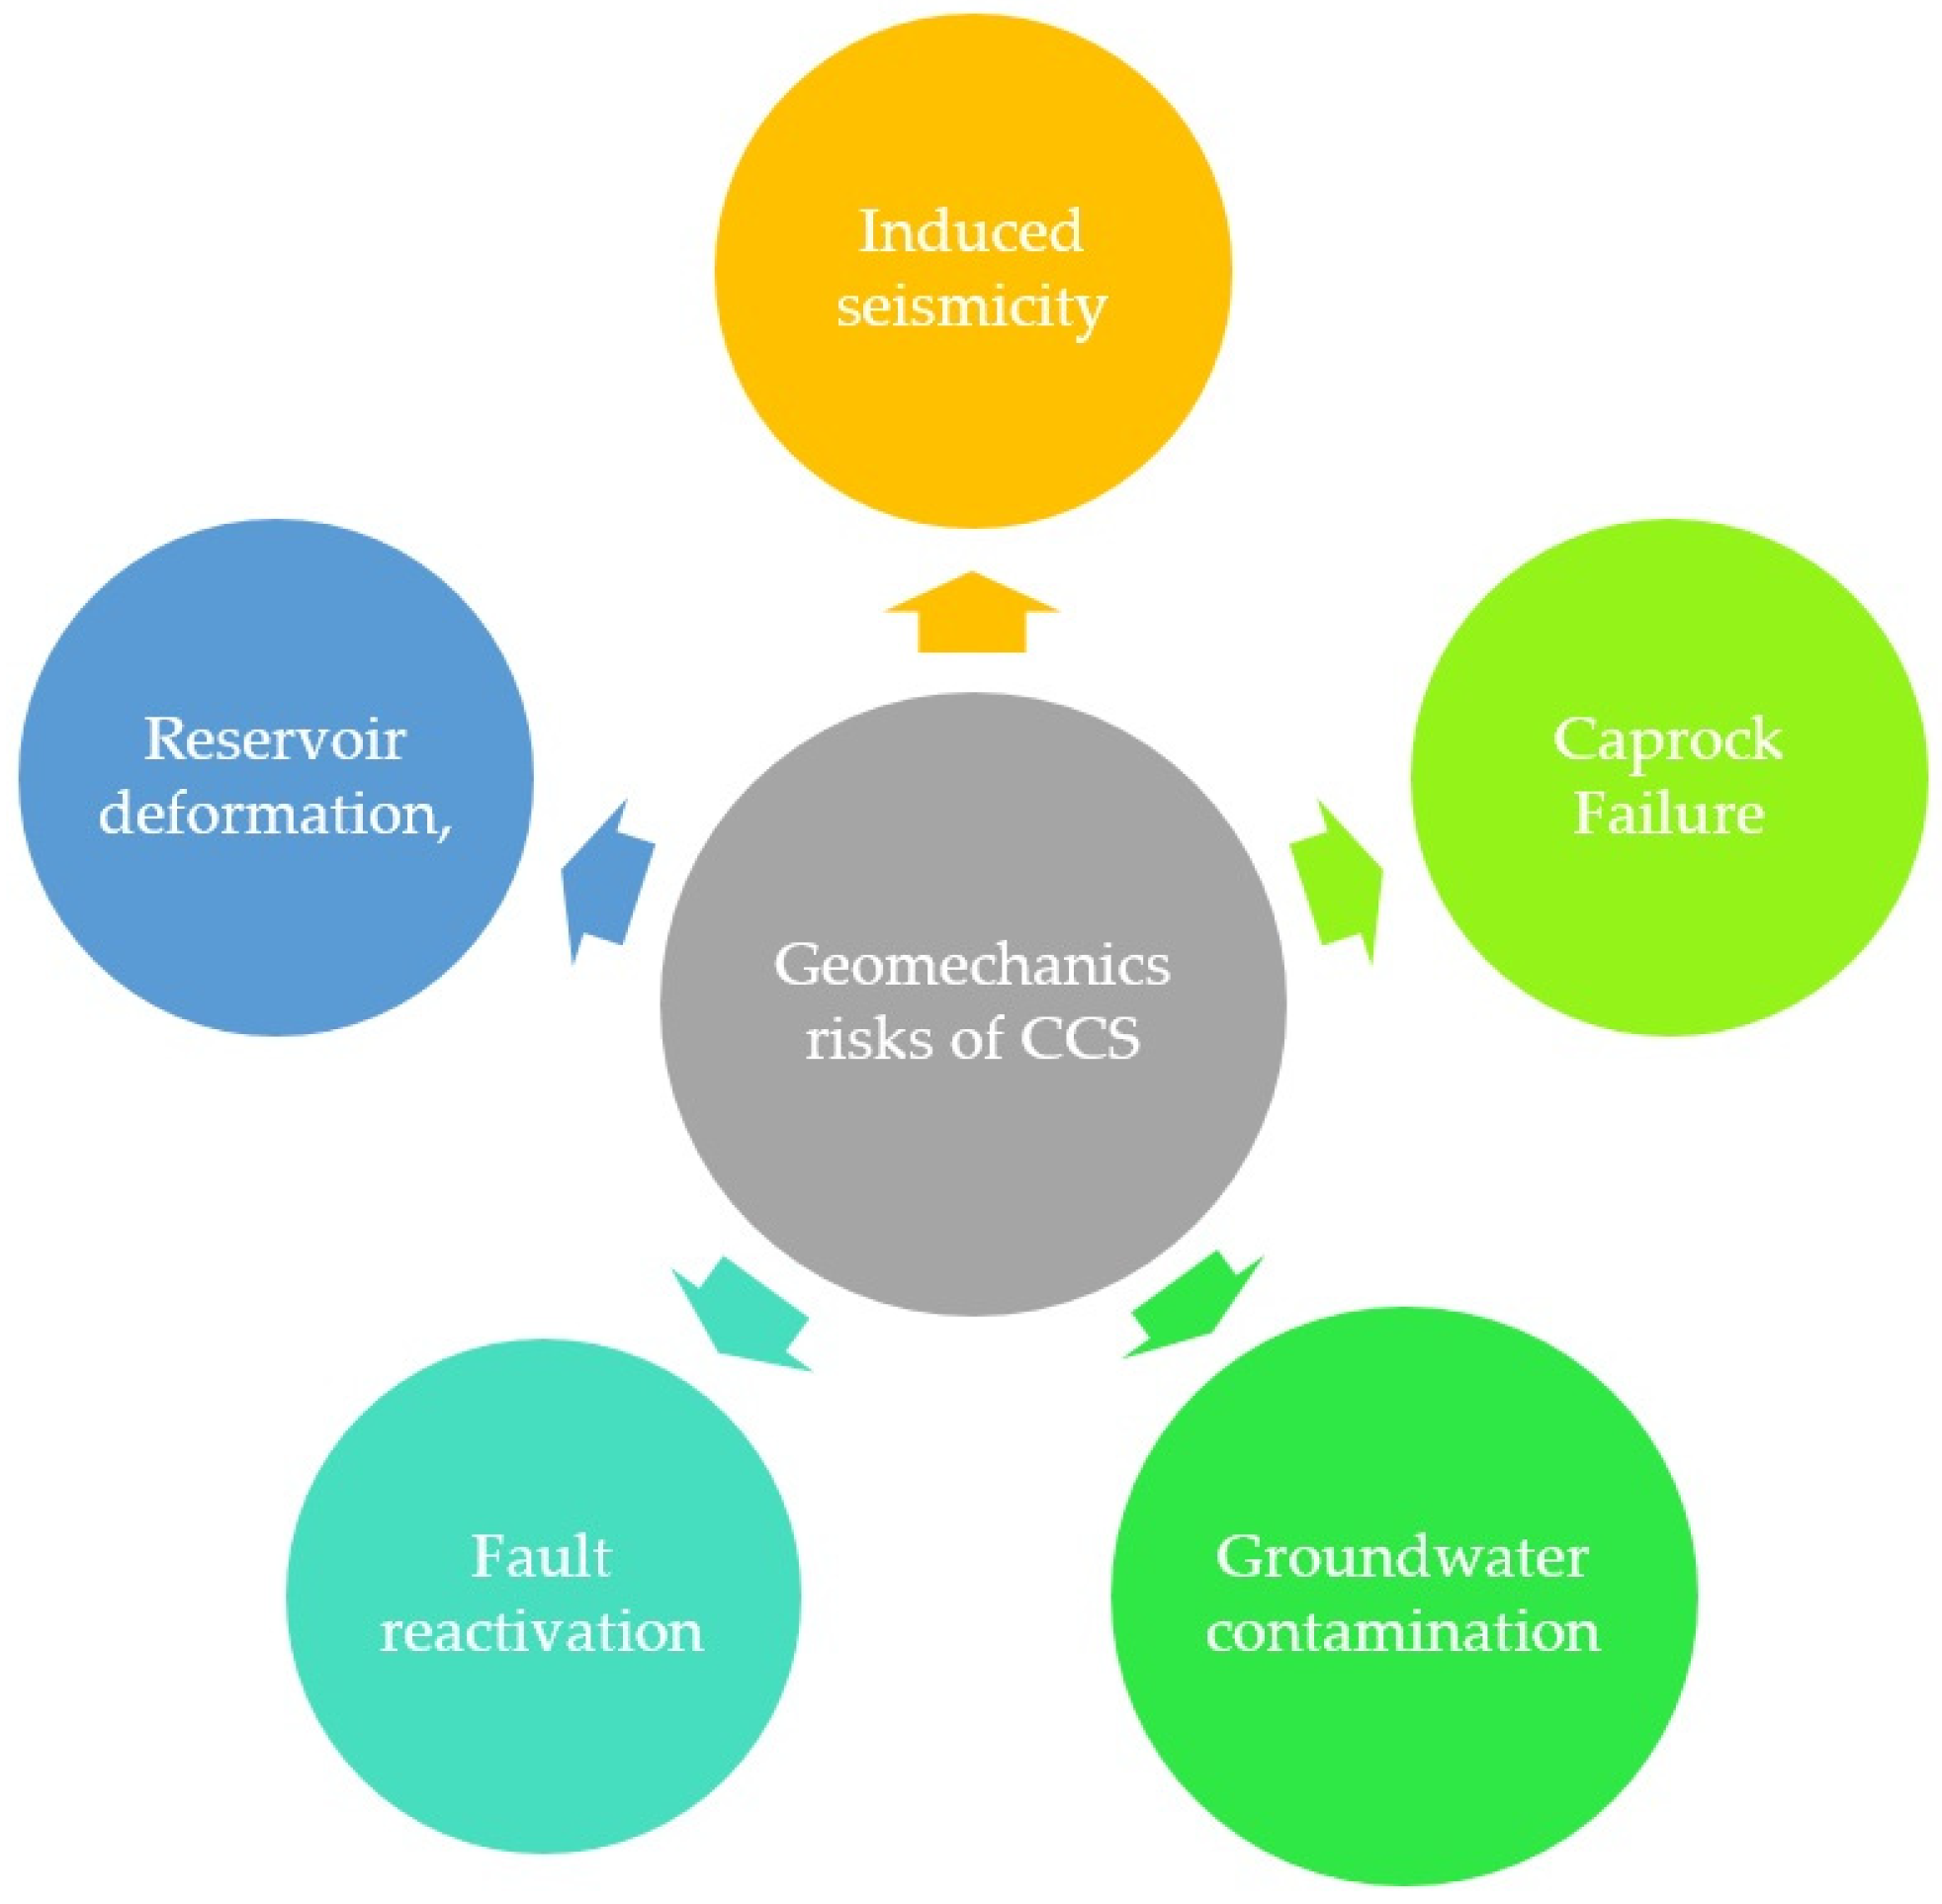
3.3. Vs Applications in CCS-Induced Risk Assessment
3.3.1. Induced Seismicity Risk
Description

| Project Name | Country | Storage Type | CO2 Injected Volume/Tonnage | Number of Seismic Events | Seismic Magnitude | Detail of Seismic Events | Reference |
|---|---|---|---|---|---|---|---|
| Cogdell | United States | Oil reservoir (EOR) | 85 million m3 (per month) | 18 | M ≥ 3 | The maximum seismic magnitude has been recorded in this project. | [95] |
| 1 | 4.4 | ||||||
| In Salah | Algeria | Oil reservoir (EOR) | 4 million tons | >6000 | −1 ≤ M ≤ 1.7 | The seismic events were recorded by installments of monitoring sensors in three injection wells. | [20,97] |
| Decatur | United States | Deep saline reservoir | 1 million tons | >10000 | −2 ≤ M ≤ 1 | As the injection duration increased, the spatial extent of the induced seismic activity also grew. | [23] |
| Aneth | United States | Oil reservoir (EOR) | 694,449 tons | 3800 | −1.2 ≤ M ≤ 0.8 | The seismic events were distributed around two faults 4.8 km far from the injection wells. | [23] |
| Lacq-Rousse | France | Depleted gas reservoir | >50,000 tons | 600 | −2.3 ≤ M ≤ −0.5 | Near-surface and down-hole monitoring systems were used to record the seismic events. | [98] |
| Weyburn | Canada | Oil reservoir (EOR) | 5.3 million tons (per year) | 200 | −3 ≤ M ≤ −1 | The installation of a seismic monitoring system took place in an abandoned production oil well. | [20,23,89] |
| Otwey Basin | Australia | Oil reservoir (EOR) | 65,445 tons | <5 events per day | 0 > M | Injection of a supercritical fluid containing CO2 and CH4 into an underground reservoir at a depth reaching 2000 m. | [84,99] |
| Cranfield | United States | Deep saline aquifer | 5 million tons | 0 | - | No induced seismicity was reported. | [96] |
| Aquistore | Canada | Deep saline aquifer | 140,000 tons | 0 | - | No induced seismic event was recorded. | [86] |
Formulations
3.3.2. Caprock Failure
Description
Formulations
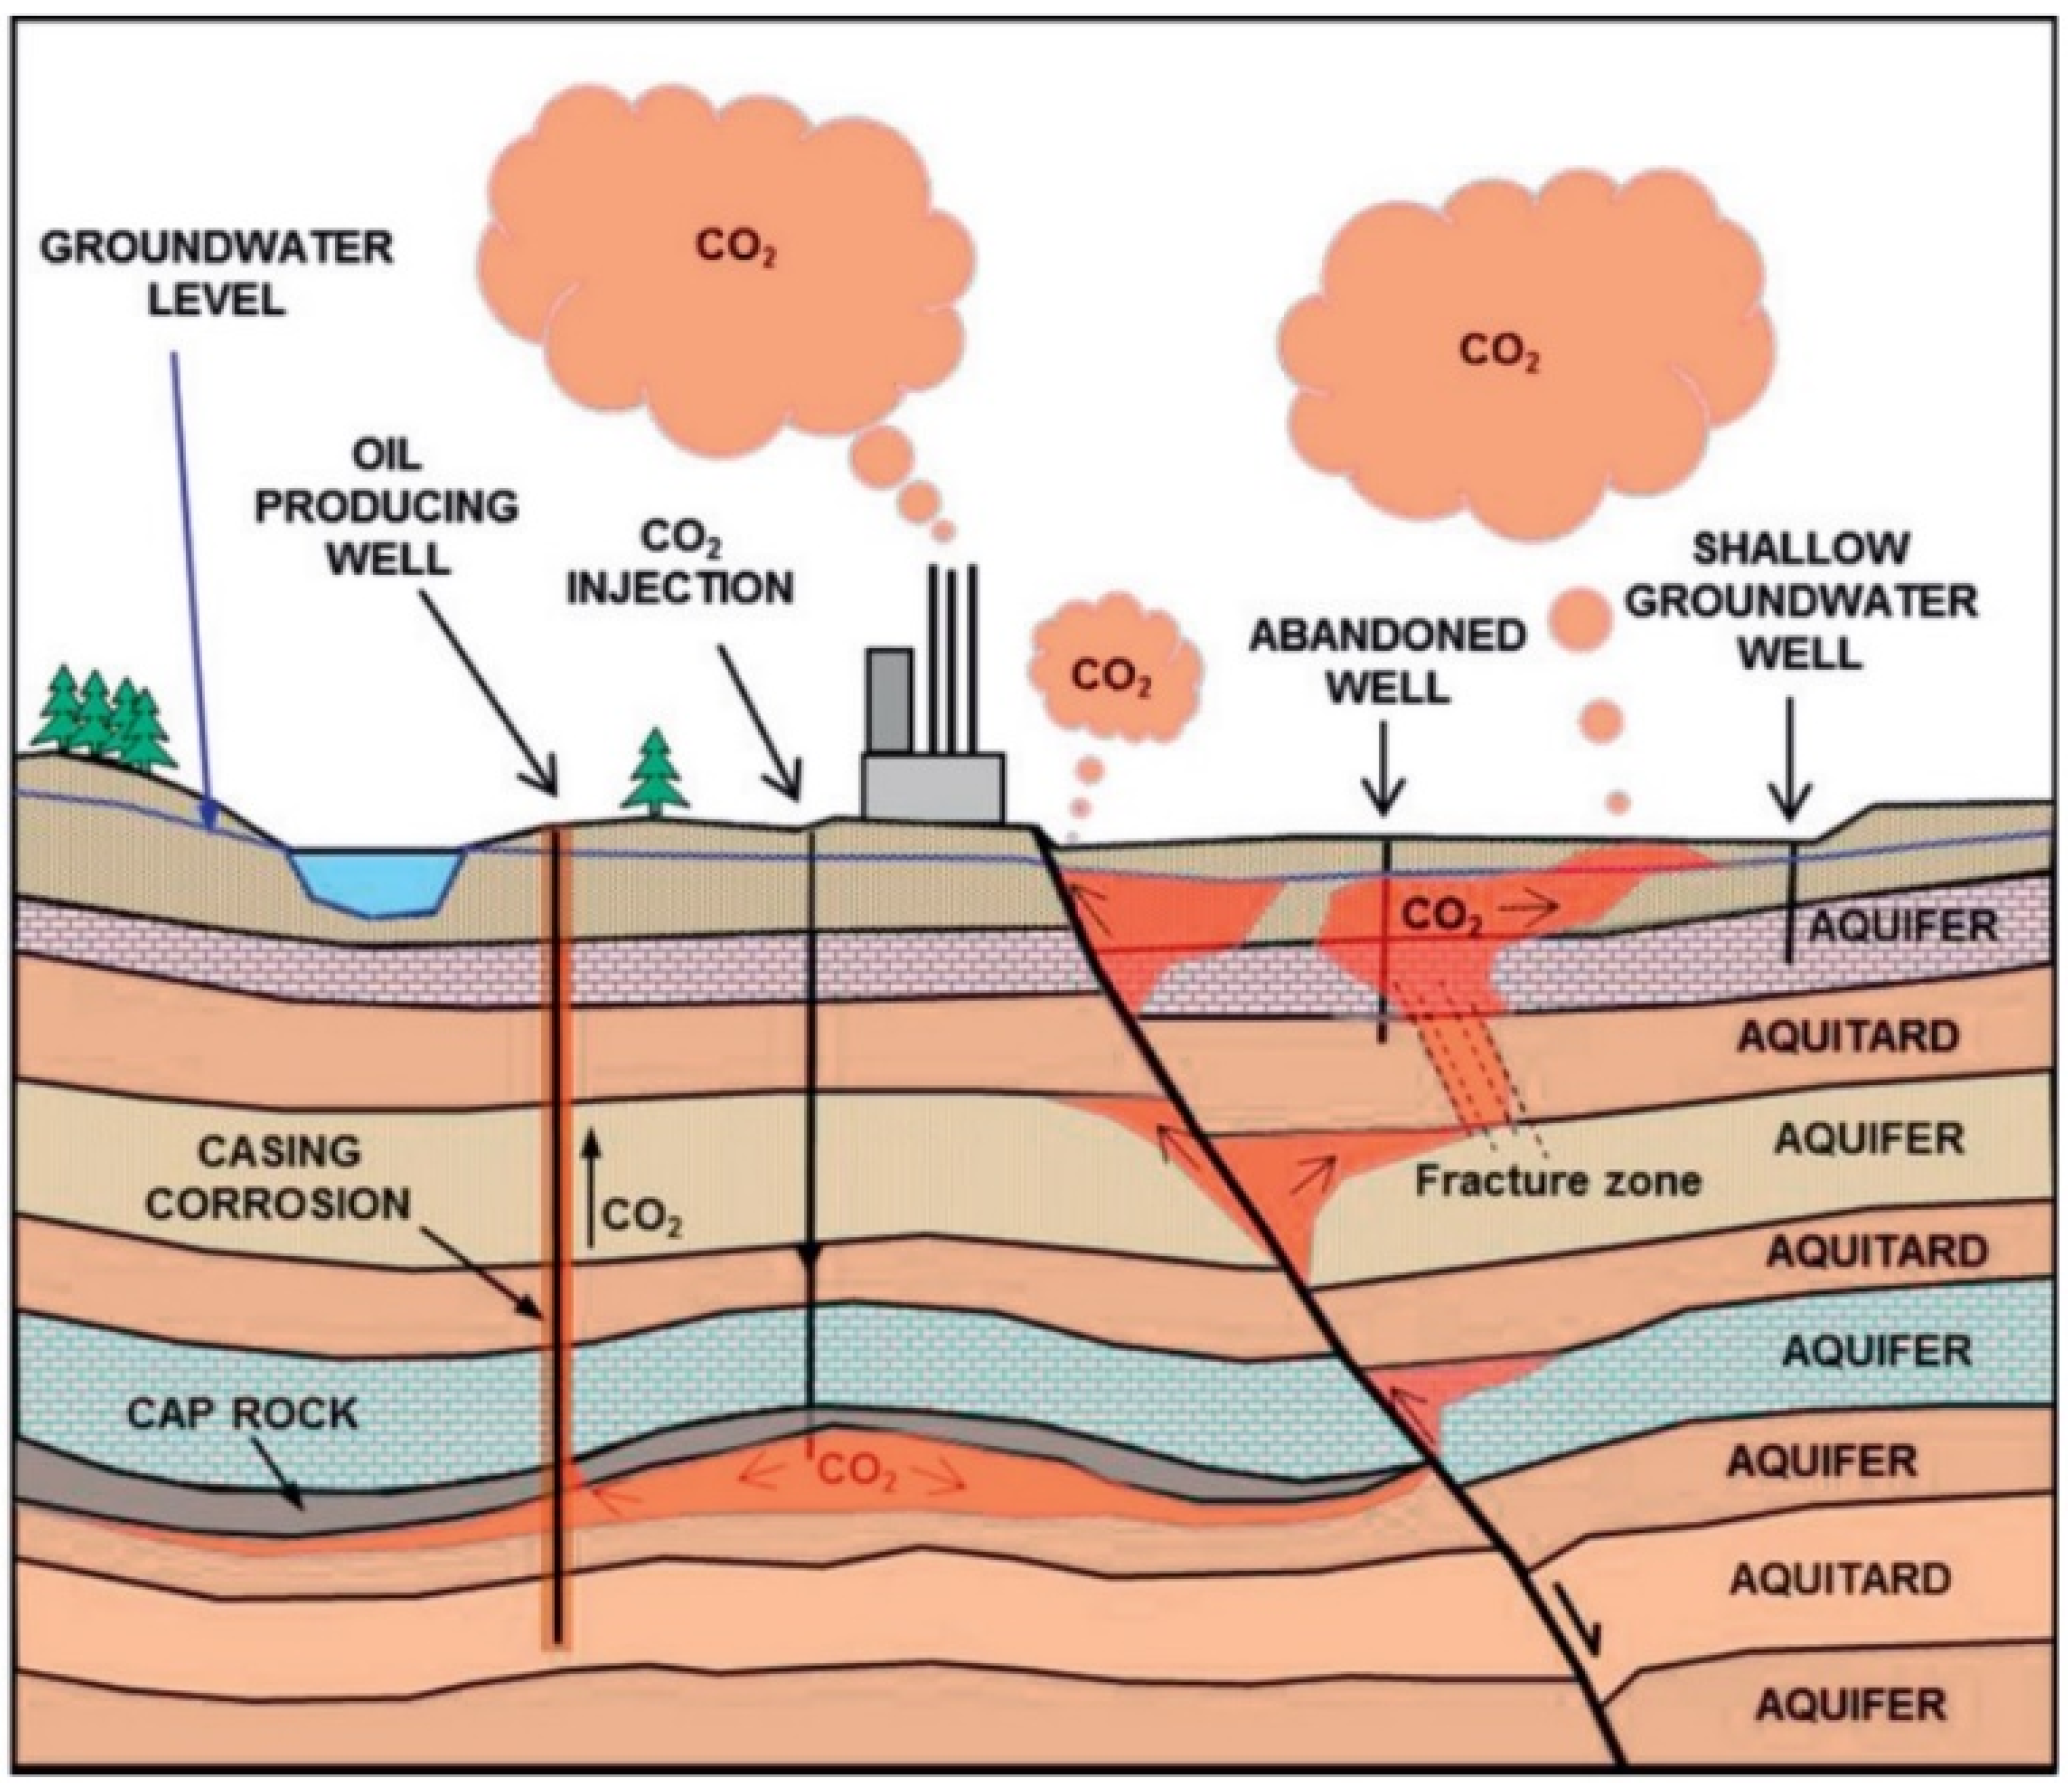
3.3.3. Groundwater Contamination
Description
Formulations
3.3.4. Fault Reactivation
Description
Formulations
3.3.5. Reservoir Deformation
Description
Formulations
4. Discussion
5. Conclusions
Author Contributions
Funding
Data Availability Statement
Acknowledgments
Conflicts of Interest
References
- Shafiee, A.; Azadi, A. Shear-wave velocity characteristics of geological units throughout Tehran City, Iran. J. Asian Earth Sci. 2007, 29, 105–115. [Google Scholar] [CrossRef]
- S-Wave Motion. Available online: https://www.iris.edu/hq/inclass/animation/swave_motion (accessed on 22 January 2024).
- L’Heureux, J.S.; Long, M. Relationship between shear-wave velocity and geotechnical parameters for Norwegian clays. J. Geotech. Geoenviron. Eng. 2017, 143, 04017013. [Google Scholar] [CrossRef]
- Knez, D.; Rajaoalison, H. Discrepancy between Measured Dynamic Poroelastic Parameters and Predicted Values from Wyllie’s Equation for Water-Saturated Istebna Sandstone. Acta Geophys. 2021, 69, 673–680. [Google Scholar] [CrossRef]
- Sundararajan, N.; Seshunarayana, T. Shear wave velocities in the estimation of earthquake hazard over alluvium in a seismically active region. J. Geol. Soc. India 2018, 92, 259–264. [Google Scholar] [CrossRef]
- Jamiolkowski, M. Role of geophysical testing in geotechnical site characterization. Soils Rocks 2012, 35, 117–137. [Google Scholar] [CrossRef]
- Anbazhagan, P.; Sitharam, T.G. Site characterization and site response studies using shear wave velocity. J. Seismol. Earthq. Eng. 2008, 10, 53–67. [Google Scholar]
- Li, X.Y.; Zhang, Y.G. Seismic reservoir characterization: How can multicomponent data help? J. Geophys. Eng. 2011, 8, 123. [Google Scholar] [CrossRef]
- Crampin, S.; McGonigle, R.; Bamford, D. Estimating crack parameters from observations of P-wave velocity anisotropy. Geophysics 1980, 45, 345–360. [Google Scholar] [CrossRef]
- Hedtmann, N.; Alber, M. Investigation of water-permeability and ultrasonic wave velocities of German Malm aquifer rocks for hydro-geothermal energy. In Proceedings of the ISRM European Rock Mechanics Symposium—EUROCK 2017, Ostrava, Czech Republic, 20–22 June 2017. [Google Scholar]
- Sharifi-Mood, M.; Olsen, M.J.; Gillins, D.T.; Mahalingam, R. Performance-based, seismically-induced landslide hazard mapping of Western Oregon. Soil Dyn. Earthq. Eng. 2017, 103, 38–54. [Google Scholar] [CrossRef]
- Peuchen, J.; De Ruijter, M.R.; Hospers, B.; Assen, R.L. Shear wave velocity integrated in offshore geotechnical practice. In Proceedings of the SUT Offshore Site Investigation and Geotechnics, London, UK, 26–28 November 2002. [Google Scholar]
- Hosseini, K.; Matthews, K.J.; Sigloch, K.; Shephard, G.E.; Domeier, M.; Tsekhmistrenko, M. SubMachine: Web-based tools for exploring seismic tomography and other models of Earth’s deep interior. Geochem. Geophys. Geosyst. 2018, 19, 1464–1483. [Google Scholar] [CrossRef]
- Ikeda, T.; Tsuji, T. Robust subsurface monitoring using a continuous and controlled seismic source. Energy Procedia 2017, 114, 3956–3960. [Google Scholar] [CrossRef]
- Roy, P.; Mohanty, A.K.; Misra, M. Prospects of Carbon Capture, Utilization and Storage for Mitigating Climate Change. Environ. Sci. Adv. 2023, 2, 409–423. [Google Scholar] [CrossRef]
- Global Climate Highlights 2023. Available online: https://climate.copernicus.eu/global-climate-highlights-2023#:~:text=2023%20marks%20the%20first%20time,than%202%C2%B0C%20warmer (accessed on 20 January 2024).
- Eggleston, H.S.; Buendia, L.; Miwa, K.; Ngara, T.; Tanabe, K. Guidelines for National Greenhouse Gas Inventories; IGES: Kanagawa, Japan, 2006. [Google Scholar]
- Nordhaus, W.D. An Optimal Transition Path for Controlling Greenhouse Gases. Science 1992, 258, 1315–1319. [Google Scholar] [CrossRef] [PubMed]
- Graphics. Available online: https://www.ipcc.ch/sr15/graphics/ (accessed on 10 May 2023).
- Aminu, M.D.; Nabavi, S.A.; Rochelle, C.A.; Manovic, V. A Review of Developments in Carbon Dioxide Storage. Appl. Energy 2017, 208, 1389–1419. [Google Scholar] [CrossRef]
- Streit, J.E.; Hillis, R.R. Estimating fault stability and sustainable fluid pressures for underground storage of CO2 in porous rock. Energy 2004, 29, 1445–1456. [Google Scholar] [CrossRef]
- Nicol, A.; Carne, R.; Gerstenberger, M.; Christophersen, A. Induced Seismicity and Its Implications for CO2 Storage Risk. Energy Procedia 2011, 4, 3699–3706. [Google Scholar] [CrossRef]
- White, J.A.; Foxall, W. Assessing Induced Seismicity Risk at CO2 Storage Projects: Recent Progress and Remaining Challenges. Int. J. Greenh. Gas Control 2016, 49, 413–424. [Google Scholar] [CrossRef]
- Rathnaweera, T.D.; Wu, W.; Ji, Y.; Gamage, R.P. Understanding Injection-Induced Seismicity in Enhanced Geothermal Systems: From the Coupled Thermo-Hydro-Mechanical-Chemical Process to Anthropogenic Earthquake Prediction. Earth-Sci. Rev. 2020, 205, 103182. [Google Scholar] [CrossRef]
- Blake, O.O.; Faulkner, D.R.; Worden, R.H.; Armitage, P.J.; Espie, A.A. Effect of thermal shock on the permeability and seismic wave velocity of the caprock and reservoir during CO2 injection. Int. J. Greenh. Gas Control. 2022, 118, 103691. [Google Scholar] [CrossRef]
- Rutqvist, J.; Tsang, C.F. A Study of Caprock Hydromechanical Changes Associated with CO2-Injection into a Brine Formation. Environ. Geol. 2002, 42, 296–305. [Google Scholar] [CrossRef]
- Zheng, L.; Apps, J.A.; Zhang, Y.; Xu, T.; Birkholzer, J.T. On Mobilization of Lead and Arsenic in Groundwater in Response to CO2 Leakage from Deep Geological Storage. Chem. Geol. 2009, 268, 281–297. [Google Scholar] [CrossRef]
- Apps, J.A.; Zheng, L.; Zhang, Y.; Xu, T.; Birkholzer, J.T. Evaluation of potential changes in groundwater quality in response to CO2 leakage from deep geologic storage. Transp. Porous Media 2010, 82, 215–246. [Google Scholar] [CrossRef]
- Rutqvist, J.; Rinaldi, A.P.; Cappa, F.; Moridis, G.J. Modeling of fault reactivation and induced seismicity during hydraulic fracturing of shale-gas reservoirs. J. Pet. Sci. Eng. 2013, 107, 31–44. [Google Scholar] [CrossRef]
- Badree, A.; Alexander, D. Fault Reactivation and CO2 Migration in Carbon Storage in a Saline Aquifer. Int. J. Clim. Change Impacts Responses 2021, 14, 129. [Google Scholar] [CrossRef]
- Fjaer, E.; Holt, R.M.; Horsrud, P.; Raaen, A.M. Petroleum Related Rock Mechanics; Elsevier: Amsterdam, The Netherlands, 2008. [Google Scholar]
- Kim, J.; Matsuoka, T.; Xue, Z. Monitoring and detecting CO2 injected into water-saturated sandstone with joint seismic and resistivity measurements. Explor. Geophys. 2011, 42, 58. [Google Scholar] [CrossRef]
- Saito, H.; Nobuoka, D.; Azuma, H.; Tanase, D.; Xue, Z. Time-lapse crosswell seismic tomography for monitoring the CO2 injected into an onshore aquifer, Nagaoka, Japan. In Proceedings of the 8th SEGJ International Symposium, Society of Exploration Geophysicists of Japan, Tokyo, Japan, 26–28 November 2006; pp. 1–4. [Google Scholar] [CrossRef]
- Ivanova, A.; Kashubin, A.; Juhojuntti, N.; Kummerow, J.; Henninges, J.; Juhlin, C.; Lüth, S.; Ivandic, M. Monitoring and volumetric estimation of injected CO2 using 4D seismic, petrophysical data, core measurements, and well logging: A case study at Ketzin, Germany. Geophys. Prospect. 2012, 60, 957–973. [Google Scholar] [CrossRef]
- Chadwick, R.A.; Noy, D.; Arts, R.; Eiken, O. Latest time-lapse seismic data from Sleipner yield new insights into CO2 plume development. Energy Procedia 2009, 1, 2103–2110. [Google Scholar] [CrossRef]
- Ajo-Franklin, J.B.; Peterson, J.; Doetsch, J.; Daley, T.M. High-resolution characterization of a CO2 plume using crosswell seismic tomography: Cranfield, MS, USA. Int. J. Greenh. Gas Control 2013, 18, 497–509. [Google Scholar] [CrossRef]
- Yang, D.; Zhao, Y.; Hu, Y. The Constitutive Law of Gas Seepage in Rock Fractures Undergoing Three-Dimensional Stress. Transp. Porous Media 2006, 63, 463–472. [Google Scholar] [CrossRef]
- Wildenborg, T.; Leijnse, T.; Kreft, E.; Nepveu, M.; Obdam, A. Long-term Safety Assessment of CO2 Storage: The Scenario Approach. In Proceedings of the 7th International Conference on Greenhouse Gas Control Technologies, Vancouver, Canada, 5–September 2004; Elsevier: Amsterdam, The Netherlands, 2005. [Google Scholar] [CrossRef]
- Shukla, R.; Ranjith, P.; Haque, A.; Choi, X. A Review of Studies on CO2 Sequestration and Caprock Integrity. Fuel 2010, 89, 2651–2664. [Google Scholar] [CrossRef]
- Xue, Z.; Tanase, D.; Watanabe, J. Estimation of CO2 saturation from time-lapse CO2 well logging in an onshore aquifer, Nagaoka, Japan. Explor. Geophys. 2006, 37, 19. [Google Scholar] [CrossRef]
- Boore, D.M.; Joyner, W.B.; Fumal, T.E. Equations for estimating horizontal response spectra and peak acceleration from western North American earthquakes: A summary of recent work. Seismol. Res. Lett. 1997, 68, 128–153. [Google Scholar] [CrossRef]
- Dong, Y.; Lu, N. Dependencies of shear wave velocity and shear modulus of soil on saturation. J. Eng. Mech. 2016, 142, 04016083. [Google Scholar] [CrossRef]
- Thitimakorn, T.; Channoo, S. Shear wave velocity of soils and NEHRP site classification map of Chiang Rai City, Northern Thailand. Electron. J. Geotech. Eng. 2012, 17, 2891–2904. [Google Scholar]
- Pitilakis, K.; Riga, E.; Anastasiadis, A. Design spectra and amplification factors for Eurocode 8. Bull. Earthq. Eng. 2012, 10, 1377–1400. [Google Scholar] [CrossRef]
- Idriss, I.M.; Boulanger, R.W. Soil Liquefaction during Earthquakes; Earthquake Engineering Research Institute: Oakland, CA, USA, 2008. [Google Scholar]
- Rodriguez-Marek, A.; Bray, J.D.; Abrahamson, N.A. A geotechnical seismic site response evaluation procedure. In Proceedings of (Vol. 12). 2000. Available online: https://www.iitk.ac.in/nicee/wcee/article/1590.pdf (accessed on 26 February 2024).
- Uma Maheswari, R.; Boominathan, A.; Dodagoudar, G.R. Use of surface waves in statistical correlations of shear wave velocity and penetration resistance of Chennai soils. Geotech. Geol. Eng. 2010, 28, 119–137. [Google Scholar] [CrossRef]
- Oh, T.M.; Bang, E.S.; Cho, G.C.; Park, E.S. Estimation of undrained shear strength for saturated clay using shear wave velocity. Mar. Georesour. Geotechnol. 2017, 35, 236–244. [Google Scholar] [CrossRef]
- Baxter, C.D.; Bradshaw, A.S.; Green, R.A.; Wang, J.H. Correlation between cyclic resistance and shear-wave velocity for providence silts. J. Geotech. Geoenviron. Eng. 2008, 134, 37–46. [Google Scholar] [CrossRef]
- Yunmin, C.; Han, K.; Ren-peng, C. Correlation of shear wave velocity with liquefaction resistance based on laboratory tests. Soil Dyn. Earthq. Eng. 2005, 25, 461–469. [Google Scholar] [CrossRef]
- Josh, M.; Esteban, L.; Delle Piane, C.; Sarout, J.; Dewhurst, D.N.; Clennell, M.B. Laboratory characterisation of shale properties. J. Pet. Sci. Eng. 2012, 88, 107–124. [Google Scholar] [CrossRef]
- Wang, Y.; Mooney, W.D.; Yuan, X.; Okaya, N. Crustal structure of the northeastern Tibetan Plateau from the southern Tarim Basin to the Sichuan Basin, China. Tectonophysics 2013, 584, 191–208. [Google Scholar] [CrossRef]
- Kováčik, J.; Emmer, Š. Correlation between shear wave velocity and porosity in porous solids and rocks. J. Powder Technol. 2013, 2013, 643167. [Google Scholar] [CrossRef]
- Korneev, V. Slow waves in fractures filled with viscous fluid. Geophysics 2008, 73, N1–N7. [Google Scholar] [CrossRef]
- Azhar, A.S.B.; Latiff, A.H.A.; Lim, L.H.; Gӧdeke, S.H. Groundwater investigation of a coastal aquifer in Brunei Darussalam using seismic refraction. Environ. Earth Sci. 2019, 78, 1–17. [Google Scholar] [CrossRef]
- Jarvis, K.D.; Knight, R.J. Aquifer heterogeneity from SH-wave seismic impedance inversion. Geophysics 2002, 67, 1548–1557. [Google Scholar] [CrossRef]
- Alhumimidi, M.S. An integrated approach for identification of seawater intrusion in coastal region: A case study of northwestern Saudi Arabia. J. King Saud Univ.-Sci. 2020, 32, 3187–3194. [Google Scholar] [CrossRef]
- Mourad, M.; Tsuji, T.; Ikeda, T.; Ishitsuka, K.; Senna, S.; Ide, K. Mapping aquifer storage properties using s-wave velocity and insar-derived surface displacement in the Kumamoto area, Southwest Japan. Remote Sens. 2021, 13, 4391. [Google Scholar] [CrossRef]
- Sayers, C.M. Elastic wave velocities in a granitic geothermal reservoir. Geophys. Prospect. 2022, 71, 114–124. [Google Scholar] [CrossRef]
- Lou, M.; Rial, J.A. Characterization of geothermal reservoir crack patterns using shear-wave splitting. Geophysics 1997, 62, 487–494. [Google Scholar] [CrossRef]
- Wawerzinek, B.; Buness, H.; von Hartmann, H.; Tanner, D.C. S-wave experiments for the exploration of a deep geothermal carbonate reservoir in the German Molasse Basin. Geotherm. Energy 2021, 9, 1–21. [Google Scholar] [CrossRef]
- Mendrinos, D.; Karytsas, C.; Karytsas, S.; Poletto, F.; Farina, B.; Barison, E. Correlations of Seismic Velocities and Elastic Moduli with Temperature in Superhot and Enhanced Geothermal Systems. Clean Technol. 2022, 4, 440–457. [Google Scholar] [CrossRef]
- Del Gaudio, V.; Muscillo, S.; Wasowski, J. What we can learn about slope response to earthquakes from ambient noise analysis: An overview. Eng. Geol. 2014, 182, 182–200. [Google Scholar] [CrossRef]
- Qureshi, M.U.; Yamada, S.; Towhata, I. A simplified technique for slope stability assessment based on in-situ S-wave velocity measurement. In Earthquake-Induced Landslides: Proceedings of the International Symposium on Earthquake-Induced Landslides, Kiryu, Japan, 2012; Springer: Berlin/Heidelberg, Germany, 2013; pp. 871–881. [Google Scholar] [CrossRef]
- Chen, Y.; Irfan, M.; Uchimura, T.; Wu, Y.; Yu, F. Development of elastic wave velocity threshold for rainfall-induced landslide prediction and early warning. Landslides 2019, 16, 955–968. [Google Scholar] [CrossRef]
- Feng, Z.Y.; Lu, Y.R.; Shen, Z.R. A numerical simulation of seismic signals of coseismic landslides. Eng. Geol. 2021, 289, 106191. [Google Scholar] [CrossRef]
- Nadim, F.; Kvalstad, T.J. Risk assessment and management for offshore geohazards. In Proceedings of the ISGSR2007 First International Symposium on Geotechnical Safety & Risk, Shanghai, China, 18–19 November 2007; pp. 18–19. [Google Scholar]
- Ten Brink, U.S.; Lee, H.J.; Geist, E.L.; Twichell, D. Assessment of tsunami hazard to the US East Coast using relationships between submarine landslides and earthquakes. Mar. Geol. 2009, 264, 65–73. [Google Scholar] [CrossRef]
- Zhao, M.; Gao, Z.; Wang, P.; Du, X. Response spectrum method for seismic analysis of monopile offshore wind turbine. Soil Dyn. Earthq. Eng. 2020, 136, 106212. [Google Scholar] [CrossRef]
- Huijer, C.; Harajli, M.; Sadek, S. Upgrading the seismic hazard of Lebanon in light of the recent discovery of the offshore thrust fault system. Leban. Sci. J. 2011, 12, 67. [Google Scholar]
- Mainprice, D.; Tommasi, A.; Couvy, H.; Cordier, P.; Frost, D.J. Pressure sensitivity of olivine slip systems and seismic anisotropy of Earth’s upper mantle. Nature 2005, 433, 731–733. [Google Scholar] [CrossRef]
- Gao, W.; Grand, S.P.; Baldridge, W.S.; Wilson, D.; West, M.; Ni, J.F.; Aster, R. Upper mantle convection beneath the central Rio Grande rift imaged by P and S wave tomography. J. Geophys. Res. Solid Earth 2004, 109. [Google Scholar] [CrossRef]
- Zhang, Z.; Yao, H.; Yang, Y. Shear wave velocity structure of the crust and upper mantle in Southeastern Tibet and its geodynamic implications. Sci. China Earth Sci. 2020, 63, 1278–1293. [Google Scholar] [CrossRef]
- Butler, R.; Tsuboi, S. Antipodal seismic reflections upon shear wave velocity structures within Earth’s inner core. Phys. Earth Planet. Inter. 2021, 321, 106802. [Google Scholar] [CrossRef]
- Bachu, S. Sequestration of CO2 in Geological Media: Criteria and Approach for Site Selection in Response to Climate Change. Energy Convers. Manag. 2000, 41, 953–970. [Google Scholar] [CrossRef]
- SCCS. Available online: https://www.sccs.org.uk/resources/downloads (accessed on 11 February 2021).
- SCCS. Available online: https://www.sccs.org.uk/resources/global-ccs-map (accessed on 11 February 2021).
- Mahajan, O.P. CO2 surface area of coals: The Z-year paradox. Carbon 1991, 29, 735–742. [Google Scholar] [CrossRef]
- Krooss, B.V.; Van Bergen, F.; Gensterblum, Y.; Siemons, N.; Pagnier, H.J.M.; David, P. High-Pressure Methane and Carbon Dioxide Adsorption on Dry and Moisture-Equilibrated Pennsylvanian Coals. Int. J. Coal Geol. 2002, 51, 69–92. [Google Scholar] [CrossRef]
- Zevenhoven, R.; Fagerlund, J.; Songok, J.K. CO2 Mineral Sequestration: Developments Toward Large-Scale Application. Greenh. Gases Sci. Technol. 2011, 1, 48–57. [Google Scholar] [CrossRef]
- Rohmer, J.; Pluymakers, A.; Renard, F. Mechano-Chemical Interactions in Sedimentary Rocks in the Context of CO2 Storage: Weak Acid, Weak Effects? Earth Sci. Rev. 2016, 157, 86–110. [Google Scholar] [CrossRef]
- Lemieux, J.M. The Potential Impact of Underground Geological Storage of Carbon Dioxide in Deep Saline Aquifers on Shallow Groundwater Resources. Hydrogeol. J. 2011, 19, 757–778. [Google Scholar] [CrossRef]
- Alnes, H.; Eiken, O.; Nooner, S.; Sasagawa, G.; Stenvold, T.; Zumberge, M. Results from Sleipner gravity monitoring: Updated density and temperature distribution of the CO2 plume. Energy Procedia 2011, 4, 5504–5511. [Google Scholar] [CrossRef]
- Daley, T.M.; Sharma, S.; Dzunic, A.; Urosevic, M.; Kepic, A.; Sherlock, D. Borehole Seismic Monitoring at Otway Using the Naylor-1 Instrument String; Lawrence Berkeley National Lab. (LBNL): Berkeley, CA, USA, 2009. [CrossRef]
- Vidal-Gilbert, S.; Tenthorey, E.; Dewhurst, D.; Ennis-King, J.; Van Ruth, P.; Hillis, R. Geomechanical analysis of the Naylor Field, Otway Basin, Australia: Implications for CO2 injection and storage. Int. J. Greenh. Gas Control 2010, 4, 827–839. [Google Scholar] [CrossRef]
- Stork, A.L.; Nixon, C.G.; Hawkes, C.D.; Birnie, C.; White, D.J.; Schmitt, D.R.; Roberts, B. Is CO2 Injection at Aquistore Aseismic? A Combined Seismological and Geomechanical Study of Early Injection Operations. Int. J. Greenh. Gas Control 2018, 75, 107–124. [Google Scholar] [CrossRef]
- Chiaramonte, L.; Zoback, M.D.; Friedmann, J.; Stamp, V. Seal integrity and feasibility of CO2 sequestration in the Teapot Dome EOR pilot: Geomechanical site characterization. Environ. Geol. 2008, 54, 1667–1675. [Google Scholar] [CrossRef]
- Watson, M.N.; Gibson-Poole, C.M. Reservoir Selection for Optimised Geological Injection and Storage of Carbon Dioxide: A Combined Geochemical and Stratigraphic Perspective. In The Fourth Annual Conference on Carbon Capture and Storage; National Energy Technology Laboratory, US Department of Energy: Alexandria, VA, USA, 2005; pp. 2–5. [Google Scholar]
- Verdon, J.P.; Kendall, J.M.; White, D.J.; Angus, D.A.; Fisher, Q.J.; Urbancic, T. Passive Seismic Monitoring of Carbon Dioxide Storage at Weyburn. Lead. Edge 2010, 29, 200–206. [Google Scholar] [CrossRef]
- Goertz-Allmann, B.P.; Kühn, D.; Oye, V.; Bohloli, B.; Aker, E. Combining microseismic and geomechanical observations to interpret storage integrity at the In Salah CCS site. Geophys. J. Int. 2014, 198, 447–461. [Google Scholar] [CrossRef]
- Chiaramonte, L.; Johnson, S.; White, J.A. Preliminary geomechanical analysis of CO2 injection at Snøhvit, Norway. In Proceedings of the 45th U.S. Rock Mechanics/Geomechanics Symposium, San Francisco, CA, USA, 26–29 June 2011. [Google Scholar]
- CSIRO. Available online: https://www.csiro.au/en/research/natural-environment/natural-resources/otway-project (accessed on 18 October 2019).
- CSIRO. Available online: https://www.geos.ed.ac.uk/sccs/project-info/1901 (accessed on 11 October 2016).
- Global CCS Institute. Available online: https://www.globalccsinstitute.com/news-media/insights/china-continues-to-advance-ccus-in-2023-learning-by-doing-after-launch-of-first-integrated-megaton-project-underscore-momentum/ (accessed on 20 July 2023).
- Gan, W.; Frohlich, C. Gas Injection May Have Triggered Earthquakes in the Cogdell Oil Field, Texas. Proc. Natl. Acad. Sci. USA 2013, 110, 18786–18791. [Google Scholar] [CrossRef] [PubMed]
- Hovorka, S.D.; Meckel, T.A.; Trevino, R.H. Monitoring a Large-Volume Injection at Cranfield, Mississippi—Project Design and Recommendations. Int. J. Greenh. Gas Control 2013, 18, 345–360. [Google Scholar] [CrossRef]
- Verdon, J.P.; Stork, A.L. Carbon Capture and Storage, Geomechanics and Induced Seismic Activity. J. Rock Mech. Geotech. Eng. 2016, 8, 928–935. [Google Scholar] [CrossRef]
- Payre, X.; Maisons, C.; Marblé, A.; Thibeau, S. Analysis of the Passive Seismic Monitoring Performance at the Rousse CO2 Storage Demonstration Pilot. Energy Procedia 2014, 63, 4339–4357. [Google Scholar] [CrossRef]
- Myer, L.R.; Daley, T.M. Elements of a Best Practices Approach to Induced Seismicity in Geologic Storage. Energy Procedia 2011, 4, 3707–3713. [Google Scholar] [CrossRef]
- Kissling, C.; Cherry, J.T. Excitation of Earthquakes by Underground Explosions. Trans. Am. Geophys. Union 1970, 51, 353. [Google Scholar]
- Kisslinger, C. A Review of Theories of Mechanisms of Induced Seismicity. Eng. Geol. 1976, 10, 85–98. [Google Scholar] [CrossRef]
- Gholami, R.; Raza, A.; Iglauer, S. Leakage risk assessment of a CO2 storage site: A review. Earth-Sci. Rev. 2021, 223, 103849. [Google Scholar] [CrossRef]
- Biot, M.A. General Theory of three-dimensional consolidation. J. Appl. Phys. 1941, 12, 155–164. [Google Scholar] [CrossRef]
- Khalilidermani, M.; Knez, D. A Survey on the Shortcomings of the Current Rate of Penetration Predictive Models in Petroleum Engineering. Energies 2023, 16, 4289. [Google Scholar] [CrossRef]
- Zamani, M.A.M.; Knez, D. Experimental Investigation on the Relationship between Biot’s Coefficient and Hydrostatic Stress for Enhanced Oil Recovery Projects. Energies 2023, 16, 4999. [Google Scholar] [CrossRef]
- Knez, D.; Khalilidermani, M.; Zamani, M.A.M. Water Influence on the Determination of the Rock Matrix Bulk Modulus in Reservoir Engineering and Rock-Fluid Coupling Projects. Energies 2023, 16, 1769. [Google Scholar] [CrossRef]
- Knez, D.; Zamani, M.A.M. Empirical Formula for Dynamic Biot Coefficient of Sandstone Samples from South-West of Poland. Energies 2021, 14, 5514. [Google Scholar] [CrossRef]
- Saripalli, P.; McGrail, P. Semi-Analytical Approaches to Modeling Deep Well Injection of CO2 for Geological Sequestration. Energy Convers. Manag. 2002, 43, 185–198. [Google Scholar] [CrossRef]
- Hildenbrand, A.; Schlömer, S.; Krooss, B.M.; Littke, R. Gas Breakthrough Experiments on Pelitic Rocks: Comparative Study with N2, CO2, and CH4. Geofluids 2004, 4, 61–80. [Google Scholar] [CrossRef]
- Liu, L.; Suto, Y.; Bignall, G.; Yamasaki, N.; Hashida, T. CO2 Injection to Granite and Sandstone in Experimental Rock/Hot Water Systems. Energy Convers. Manag. 2003, 44, 1399–1410. [Google Scholar] [CrossRef]
- Lions, J.; Devau, N.; de Lary, L.; Dupraz, S.; Parmentier, M.; Gombert, P.; Dictor, M.C. Potential Impacts of Leakage from CO2 Geological Storage on Geochemical Processes Controlling Fresh Groundwater Quality: A Review. Int. J. Greenh. Gas Control 2014, 22, 165–175. [Google Scholar] [CrossRef]
- Brydie, J.R.; Perkins, E.H.; Fisher, D.; Girard, M.; Valencia, M.; Olson, M.; Rattray, T. The Development of a Leak Remediation Technology for Potential Non-Wellbore Related Leaks from CO2 Storage Sites. Energy Procedia 2014, 63, 4601–4611. [Google Scholar] [CrossRef]
- Varadharajan, C.; Tinnacher, R.M.; Trautz, R.C.; Zheng, L.; Dafflon, B.; Wu, Y.; Reagan, M.T.; Birkholzer, J.T.; Carey, J.W. A Review of Studies Examining the Potential for Groundwater Contamination from CO2 Sequestration. In Geological Carbon Storage: Subsurface Seals and Caprock Integrity; Wiley: Hoboken, NJ, USA, 2018; pp. 305–326. [Google Scholar] [CrossRef]
- Little, M.G.; Jackson, R.B. Potential impacts of leakage from deep CO2 geosequestration on overlying freshwater aquifers. Environ. Sci. Technol. 2010, 44, 9225–9232. [Google Scholar] [CrossRef] [PubMed]
- Khalilidermani, M.; Knez, D.; Zamani, M.A.M. Empirical Correlations between the Hydraulic Properties Obtained from the Geoelectrical Methods and Water Well Data of Arak Aquifer. Energies. 2021, 14, 5415. [Google Scholar] [CrossRef]
- Daley, T.M.; Myer, L.R.; Peterson, J.E.; Majer, E.L.; Hoversten, G.M. Time-lapse crosswell seismic and VSP monitoring of injected CO2 in a brine aquifer. Environ. Geol. 2007, 54, 1657–1665. [Google Scholar] [CrossRef]
- Gassmann, F. Über die Elastizität poröser Medien. Vierteljahrsschr. Naturforschenden Ges. Zur. 1951, 96, 1–23. [Google Scholar]
- Zoback, M.D. Reservoir Geomechanics; Cambridge University Press: Cambridge, UK, 2010. [Google Scholar]
- Oldenburg, C.M.; Bryant, S.L.; Nicot, J.-P. Certification framework based on effective trapping for geologic carbon sequestration. Int. J. Greenh. Gas Control 2009, 3, 444–457. [Google Scholar] [CrossRef]
- Song, J.; Zhang, D. Comprehensive review of caprock-sealing mechanisms for geologic carbon sequestration. Environ. Sci. Technol. 2013, 47, 9–22. [Google Scholar] [CrossRef] [PubMed]
- Rutqvist, J. Fractured rock stress–permeability relationships from in situ data and effects of temperature and chemical–mechanical couplings. In Crustal Permeability; Wiley: Hoboken, NJ, USA, 2012; pp. 65–82. [Google Scholar] [CrossRef]
- Ferronato, M.; Gambolati, G.; Janna, C.; Teatini, P. Geomechanical issues of anthropogenic CO2 sequestration in exploited gas fields. Energy Convers. Manag. 2010, 51, 1918–1928. [Google Scholar] [CrossRef]
- Vidal-Gilbert, S.; Nauroy, J.F.; Brosse, E. 3D geomechanical modelling for CO2 geologic storage in the Dogger carbonates of the Paris Basin. Int. J. Greenh. Gas Control 2009, 3, 288–299. [Google Scholar] [CrossRef]
- Rutqvist, J.; Vasco, D.W.; Myer, L. Coupled reservoir-geomechanical analysis of CO2 injection and ground deformations at In Salah, Algeria. Int. J. Greenh. Gas Control 2010, 4, 225–230. [Google Scholar] [CrossRef]
- Mavko, G.; Mukerji, T.; Dvorkin, J. The Rock Physics Handbook; Cambridge University Press: Cambridge, UK, 2020. [Google Scholar]
- Goertz-Allmann, B.; Gibbons, S.; Oye, V.; Bauer, R.; Will, R. Characterization of induced seismicity patterns derived from internal structure in event clusters. J. Geophys. Res. Solid Earth 2017, 122, 3875–3894. [Google Scholar] [CrossRef]
- Herwanger, J.V.; Mohamed, F.R.; Newman, R.; Vejbæk, O. Time-lapse seismic data-calibrated geomechanical model reveals hydraulic fracture re-orientation. In Proceedings of the 2013 SEG Annual Meeting, Houston, TX, USA, 22–27 September 2013. [Google Scholar]
- Blazevic, L.A.; Bodet, L.; Pasquet, S.; Linde, N.; Jougnot, D.; Longuevergne, L. Time-lapse seismic and electrical monitoring of the vadose zone during a controlled infiltration experiment at the ploemeur hydrological observatory, France. Water 2020, 12, 1230. [Google Scholar] [CrossRef]
- Rivet, D.; De Barros, L.; Guglielmi, Y.; Cappa, F.; Castilla, R.; Henry, P. Seismic Velocity Changes Associated with Aseismic Deformations of a Fault Stimulated by Fluid Injection. Geophys. Res. Lett. 2016, 43, 9563–9572. [Google Scholar] [CrossRef]
- Shadoan, T.A.; Ajo-Franklin, J.B.; Guglielmi, Y.; Wood, T.; Robertson, M.; Cook, P.; Soom, F.; Daley, T.M.; Hopp, C.; Tribaldos, V.R.; et al. Active-Source Seismic Imaging of Fault Re-activation and Leakage: An Injection Experiment at the Mt Terri Rock Laboratory, Switzerland. Geophys. Res. Lett. 2023, 50, e2023GL104080. [Google Scholar] [CrossRef]
- Ajo-Franklin, J.; Daley, T.; Butler-Veytia, B.; Peterson, J.; Wu, Y.; Kelly, B.; Hubbard, S. Multi-level Continuous Active Source Seismic Monitoring (ML-CASSM): Mapping Shallow Hydrofracture Evolution at a TCE Contaminated Site. In Proceedings of the 2011 SEG Annual Meeting, San Antonio, TX, USA, 18–23 September 2011. [Google Scholar]
- Blanpied, M.L.; Lockner, D.A.; Byerlee, J.D. An Earthquake Mechanism Based on Rapid Sealing of Faults. Nature 1992, 358, 574–576. [Google Scholar] [CrossRef]
- Handin, J.; Hager Jr, R.V.; Friedman, M.; Feather, J.N. Experimental Deformation of Sedimentary Rocks under Confining Pressure: Pore Pressure Tests. Bull. Am. Assoc. Petrol. Geol. 1963, 47, 717–755. [Google Scholar]
- Zamani, M.A.M.; Knez, D. A new mechanical-hydrodynamic safety factor index for sand production prediction. Energies 2021, 14, 3130. [Google Scholar] [CrossRef]
- Jaeger, J.C.; Cook, N.G.W. Fundamentals of Rock Mechanics; Methuen & Co. Ltd.: London, UK, 1969. [Google Scholar]
- Byerlee, J. Friction of Rocks; Birkhäuser: Basel, Switzerland, 1987; pp. 615–626. [Google Scholar] [CrossRef]
- Khalilidermani, M.; Knez, D. A Survey of Application of Mechanical Specific Energy in Petroleum and Space Drilling. Energies 2022, 15, 3162. [Google Scholar] [CrossRef]
- Chang, K.W.; Segall, P. Injection-Induced Seismicity on Basement Faults Including Poroelastic Stressing. J. Geophys. Res. Solid Earth 2016, 121, 2708–2726. [Google Scholar] [CrossRef]
- Cao, W.; Shi, J.-Q.; Durucan, S.; Korre, A. Evaluation of Shear Slip Stress Transfer Mechanism for Induced Micro-seismicity at In Salah CO2 Storage Site. Int. J. Greenh. Gas Control 2021, 107, 103302. [Google Scholar] [CrossRef]
- Kroll, K.A.; Buscheck, T.A.; White, J.A.; Richards-Dinger, K.B. Testing the Efficacy of Active Pressure Management as a Tool to Mitigate Induced Seismicity. Int. J. Greenh. Gas Control 2020, 94, 102894. [Google Scholar] [CrossRef]
- Knez, D.; Zamani, O.A.M. Up-to-Date Status of Geoscience in the Field of Natural Hydrogen with Consideration of Petroleum Issues. Energies 2023, 16, 6580. [Google Scholar] [CrossRef]
- Knez, D.; Rajaoalison, H. Land Subsidence Assessment for Wind Turbine Location in the South-Western Part of Madagascar. Energies 2022, 15, 4878. [Google Scholar] [CrossRef]
- Rajaoalison, H.; Knez, D.; Zamani, M.A.M. A Multidisciplinary Approach to Evaluate the Environmental Impacts of Hydrocarbon Production in Khuzestan Province, Iran. Energies 2022, 15, 8656. [Google Scholar] [CrossRef]
- Arts, R.; Eiken, O.; Chadwick, A.; Zweigel, P.; van der Meer, L.; Zinszner, B. Monitoring of CO2 Injected at Sleipner Using Time-Lapse Seismic Data. Energy 2004, 29, 1383–1392. [Google Scholar] [CrossRef]
- Kazemeini, S.H.; Juhlin, C.; Fomel, S. Monitoring CO2 Response on Surface Seismic Data: A Rock Physics and Seismic Modeling Feasibility Study at the CO2 Sequestration Site, Ketzin, Germany. J. Appl. Geophys. 2010, 71, 109–124. [Google Scholar] [CrossRef]
- Kazemeini, H.; Juhlin, C.; Zinck-Jørgensen, K.; Norden, B. Application of the Continuous Wavelet Transform on Seismic Data for Mapping of Channel Deposits and Gas Detection at the CO2SINK Site, Ketzin, Germany. Geophys. Prospect. 2009, 57, 111–123. [Google Scholar] [CrossRef]
- Knez, D.; Zamani, M.A.M. A Review of the Geomechanics Aspects in Space Exploration. Energies 2021, 14, 7522. [Google Scholar] [CrossRef]
- Knez, D.; Khalilidermani, M. A Review of Different Aspects of Off-Earth Drilling. Energies 2021, 14, 7351. [Google Scholar] [CrossRef]
- Khalilidermani, M.; Knez, D. A Survey on Extraterrestrial Habitation Structures with a Focus on Energy-Saving 3D Printing Techniques. Appl. Sci. 2023, 13, 12913. [Google Scholar] [CrossRef]
- Wurdemann, H.; Moeller, F.; Kuhn, M.; Heidug, W.; Christensen, N.P.; Borm, G.; Schilling, F.R.; CO2SINK Group. CO2SINK—From Site Characterisation and Risk Assessment to Monitoring and Verification: One Year of Operational Experience with the Field Laboratory for CO2 Storage at Ketzin, Germany. Int. J. Greenh. Gas Control 2010, 4, 938–951. [Google Scholar] [CrossRef]
- Mostafaei, K.; Mahmoudi, M.Z.A.; Knez, D. Risk Management Prediction of Mining and Industrial Projects by Support Vector Machine. Resour. Policy 2022, 78, 102819. [Google Scholar] [CrossRef]
- Sakurai, S.; Ramakrishnan, T.S.; Boyd, A.; Mueller, N.; Hovorka, S. Monitoring Saturation Changes for CO2 Sequestration: Petrophysical Support of the Frio Brine Pilot Experiment. In Proceedings of the 46th Annual Logging Symposium Transactions, Society of Petrophysicists and Well Log Analysts, New Orleans, LA, USA, 1 December 2006. [Google Scholar]
- Meadows, M. Time-Lapse Seismic Modeling and Inversion of CO2 Saturation for Storage and Enhanced Oil Recovery. Lead. Edge 2008, 27, 506–516. [Google Scholar] [CrossRef]
- Scherbaum, F.; Hinzen, K.G.; Ohrnberger, M. Determination of shallow shear wave velocity profiles in the Cologne, Germany area using ambient vibrations. Geophys. J. Int. 2003, 152, 597–612. [Google Scholar] [CrossRef]
- Valcke, S.L.A.; Casey, M.; Lloyd, G.E.; Kendall, J.M.; Fisher, Q.J. Lattice preferred orientation and seismic anisotropy in sedimentary rocks. Geophys. J. Int. 2006, 166, 652–666. [Google Scholar] [CrossRef]
- Durante, M.G.; Karamitros, D.; Di Sarno, L.; Sica, S.; Taylor, C.A.; Mylonakis, G.; Simonelli, A.L. Characterisation of shear wave velocity profiles of non-uniform bi-layer soil deposits: Analytical evaluation and experimental validation. Soil Dyn. Earthq. Eng. 2015, 75, 44–54. [Google Scholar] [CrossRef]
- Miah, M.I. Improved prediction of shear wave velocity for clastic sedimentary rocks using hybrid model with core data. J. Rock Mech. Geotech. Eng. 2021, 13, 1466–1477. [Google Scholar] [CrossRef]
- Toro, G.R. Uncertainty in shear-wave velocity profiles. J. Seismol. 2022, 26, 713–730. [Google Scholar] [CrossRef]
- Khalilidermani, M.; Knez, D. Comparing Artificial Intelligence Algorithms with Empirical Correlations in Shear Wave Velocity Prediction. Appl. Sci. 2023, 13, 13126. [Google Scholar] [CrossRef]
- Sarkar, R.; Kolathayar, S.; Drukpa, D.; Choki, K.; Rai, S.; Tshering, S.T.; Yuden, K. Near-surface seismic refraction tomography and MASW for site characterization in Phuentsholing, Bhutan Himalaya. SN Appl. Sci. 2021, 3, 394. [Google Scholar] [CrossRef]
- Nazarian, S. In Situ Determination of Elastic Moduli of Soil Deposits and Pavement Systems by Spectral-Analysis-of-Surface-Waves Method (Shear Velocity, Propagation, Liquefaction, Non-Destructive, Earthquake). Ph.D. Thesis, The University of Texas at Austin, Austin, TX, USA, 1984. [Google Scholar]
- Boore, D.M. Determining subsurface shear-wave velocities: A review. In Proceedings of the Third International Symposium on the Effects of Surface Geology on Seismic Motion, Grenoble, France, 30 August–1 September 2006; pp. 67–85. [Google Scholar]
- Li, Y.; Wu, Q.; Pan, J.; Sun, L. S-wave velocity structure of northeastern China from joint inversion of Rayleigh wave phase and group velocities. Geophys. J. Int. 2012, 190, 105–115. [Google Scholar] [CrossRef]
- Pugin, A.J.M.; Pullan, S.E.; Hunter, J.A.; Oldenborger, G.A. Hydrogeological prospecting using P-and S-wave landstreamer seismic reflection methods. Near Surf. Geophys. 2009, 7, 315–328. [Google Scholar] [CrossRef]


| CCS Option | Storage Capacity (Gt-CO2) | Storage Integrity | Environmental Risk |
|---|---|---|---|
| Depleted oil and gas fields | 25–30 | High | Low |
| Active oil wells (EOR) | Low | High | Low |
| Enhanced coal bed methane | 5–10 | Medium | Medium |
| Deep aquifers | 1–150 | Medium | Medium |
| Ocean (global) | 1000–10,000 | Medium | High |
| Carbonate storage (no transport) | Very high | Highest | High |
| Risk | Vs Application | Description |
|---|---|---|
| Induced seismicity | Seismic hazard assessment | Vs contributes to seismic hazard analysis, helping to model seismic wave propagation and scrutinize the possible impact of seismic events on the CCS projects and their adjacent structures. |
| Site-specific seismic design | Shear wave velocity data inform site-specific seismic design considerations, allowing for the development of adjacent structures that can withstand the dynamic forces associated with seismic events. | |
| Caprock failure | Assessment of sealing capacity and stability of caprock | Evaluation of Vs profiles helps in assessing the mechanical stability and integrity of caprocks; this is crucial for preventing CO2 leakage and shallow groundwater containment. |
| Groundwater contamination | Mapping subsurface heterogeneity | Vs profiles provide insights into subsurface heterogeneity, allowing for the identification of anomalous zones and areas of structural weaknesses that may pose risks to groundwater containment (CO2 intrusion). |
| Fault reactivation | Identification of faults and fractures | Vs data are used to detect and characterize faults and fractures within the subsurface, aiding in the assessment of potential pathways for CO2 leakage. |
| Reservoir deformation | Monitoring changes over time | Continuous monitoring of shear wave velocity helps in tracking changes in subsurface conditions, enabling the early detection of potential risks such as caprock degradation, reservoir deformation, or CO2 migration. |
| Pore pressure assessment | Changes in shear wave velocity are indicative of variations in fluid content, aiding in the assessment of pore pressure changes that could influence the mechanical behavior of the storage reservoir. |
Disclaimer/Publisher’s Note: The statements, opinions and data contained in all publications are solely those of the individual author(s) and contributor(s) and not of MDPI and/or the editor(s). MDPI and/or the editor(s) disclaim responsibility for any injury to people or property resulting from any ideas, methods, instructions or products referred to in the content. |
© 2024 by the authors. Licensee MDPI, Basel, Switzerland. This article is an open access article distributed under the terms and conditions of the Creative Commons Attribution (CC BY) license (https://creativecommons.org/licenses/by/4.0/).
Share and Cite
Khalilidermani, M.; Knez, D. Shear Wave Velocity Applications in Geomechanics with Focus on Risk Assessment in Carbon Capture and Storage Projects. Energies 2024, 17, 1578. https://doi.org/10.3390/en17071578
Khalilidermani M, Knez D. Shear Wave Velocity Applications in Geomechanics with Focus on Risk Assessment in Carbon Capture and Storage Projects. Energies. 2024; 17(7):1578. https://doi.org/10.3390/en17071578
Chicago/Turabian StyleKhalilidermani, Mitra, and Dariusz Knez. 2024. "Shear Wave Velocity Applications in Geomechanics with Focus on Risk Assessment in Carbon Capture and Storage Projects" Energies 17, no. 7: 1578. https://doi.org/10.3390/en17071578