Article

Physicochemical Improvements in Sandy Soils through the Valorization of Biomass into Biochar

by
Ana Carolina Morim
*,
Márcia Cristina dos Santos
,
Luís A. C. Tarelho
* and
Flávio C. Silva
Department of Environment and Planning, Centre for Environmental and Marine Studies—CESAM, University of Aveiro, 3810-193 Aveiro, Portugal
*
Authors to whom correspondence should be addressed.
Energies 2023, 16(22), 7645; https://doi.org/10.3390/en16227645
Submission received: 22 August 2023 / Revised: 23 October 2023 / Accepted: 25 October 2023 / Published: 18 November 2023
(This article belongs to the Special Issue Advances in Carbon Capture and Utilization)

Abstract

:
Forestry management operations that are designed to prevent wildfires while also protecting the environmental compartments that are directly affected by them, such as soil, are of major relevance. The valorization of residual forestry biomass into biochar that is then used to be turned back into forest soils is an approach that meets Circular Economy principles. However, the effects on soil of the application of biochar that is produced from low-grade forestry biomass are unknown. In this work, a soil incubation assay was performed with a sandy soil that was amended with biochar produced from residual forestry biomass (Acacia) to assess its effectiveness in terms of boosting soil quality. The factorial study comprised the effects of biochar at two pyrolysis temperatures (450 °C and 550 °C), four application rates (0%, 3%, 6%, and 10% (w/w)), and three particle size classes (S < 0.5 mm, M = [0.5; 3.15], and L > 3.15 mm). The soil pH increased for all treatments to suitable agronomic values (5–7), and the water-holding capacity increased by 69% to 325% when compared to the control soil. The bioavailability of the plant nutrient elements also increased with the application rate, especially for treatments with small particles of biochar. Biochar that is made of low-grade biomass from forestry maintenance operations can be efficiently recycled back into forest soils to improve the physicochemical properties of agronomic relevance, thus allowing for a reduced water demand and better soil quality. However, studies on biochar applications in different soils are needed in order to assess the effectiveness of this approach.

1. Introduction

Population growth has been accelerating resource consumption and overexploitation due to increases in the industrial, forestry, and agricultural activities that are conducted to satisfy the need for food and goods; these practices pose environmental threats such as the contamination and degradation of soils [1,2]. Soil resources are essential to life, since they provide a wide range of ecosystem goods and services; they also support provisioning, regulation, and cultural services, such as carbon storage, water regulation, food supply, soil fertility, and shelter provision [3,4]. The importance of protecting this multi-functional resource has been endorsed since the launch of the Thematic Strategy for Soil Protection [5]. The strategy highlighted that reclaiming degraded soils has become essential for applying approaches that convey Circular Economy concepts, such as the sustainable recycling of carbon and nutrients back into soils [6]. Another important threat to the quality of soil resources are forest wildfires that degrade several environmental compartments, including desertification, the loss of biodiversity and vegetation, increased soil erosion, and the loss of soil quality [7].
In Mediterranean ecosystems, forest wildfires are systemic, and their frequency tends to increase in accordance with climate change projections. Forest-cleaning activities that are adequately integrated into the forestry value chain are regarded as the first line of defense for wildfire prevention. However, these operations generate huge amounts of residual forest biomass (RFB) that cannot be legally disposed of in the land and require further suitable management. Moreover, RFB includes highly flammable plants such as gorse, broom, and invasive species (e.g., acacia). Quite often, wildfires are strongly linked with the spreading of these types of biomass that promote fuel accumulation. These species have been recently identified as drivers for wildfire propagation and thus require urgent management [8]. On the other hand, these types of biomass do not have the capacity to be valorized into energy because of their inorganic content (e.g., K, Cl, and Na), and this poses operating problems related to the ash that is generated during combustion or gasification processes [9]. However, most of these inorganic materials are valuable plant macronutrients that could be recycled back into soils. One of the possibilities consists of the valorization of RFB into biochar through the process of pyrolysis, as well as its further application in soil that has poor agronomic properties. This approach is expected to have a positive impact because the biomass inorganic materials are entrapped in the biochar matrix, thus providing the soil with greater stocks of plant nutrient elements such as P, K, Ca, Mg, and Na [10,11,12,13,14,15].
Besides the content of plant nutrient elements, biochar presents other environmental advantages. Biochar production concerns the thermochemical conversion of biomass at relatively low temperatures (300–700 °C) and under an anoxic environment [15,16,17,18,19,20,21,22,23,24,25,26]. The resulting solid product is a carbon-rich material (65 to 90%) that can sequester carbon and enhance the soil’s agronomic properties by increasing the soil organic matter’s water-holding capacity (WHC), pH, electrical conductivity (EC), cation exchange capacity, and nutrient availability [6,12,17,27,28,29,30,31,32,33,34]. The improvements in the soil quality depend greatly on the properties of the biochar, such as the superficial surface area (SSA), bulk density (BD), and porosity, as well as on its application rate and particle size (which affect soil porosity [35,36]). Although the range of pyrolysis temperatures for biochar production is wide, with optimal ranges between 400 °C and 600 °C, the process yield decreases with the pyrolysis temperature [37,38]. High-temperature chars are more stable and have a higher ash content than lower-temperature chars, which are less stable and present more volatile matter that can have adverse effects on soil quality [39,40,41]. On the other hand, higher temperatures require more energy, and trade-offs must be considered between the energetic burden of higher pyrolysis temperatures and the economic sustainability of biochar production when the principles of a Circular Economy are applied to forestry, as has been analyzed in the literature [39,40].
The water retention in forest soils is of great importance in current climate change scenarios, and biochar application may play a major role, although gaps exist with respect to its effectiveness regarding the wide particle size distribution of biochar. Alghamdi, Alkhasha, and Ibrahim (2020) reported an increase in soil water availability with smaller particle sizes (<0.1 mm), which was due to an increase in microporosity [36]. A higher SSA (as great as 230 m2∙g−1) promotes a better pore structure, an increase in adsorption ability, and a greater capacity to retain water [42]. As the BD of biochar is significantly lower (<0.6 g∙cm−3) than the BD of most soils (>1.25 g∙cm−3), its application leads to a decrease in the BD of the amended soil, thus allowing for the movement of air and water through a soil solution [26,30,42,43,44]. For example, Alghamdi, Alkhasha, and Ibrahim (2020) reported an increase in the BD of soil mixtures with biochar at an application rate of 4%; moreover, this was noted without there being significant differences between the applications of biochar with distinct particle sizes (2–1 mm, 1–0.5 mm, 0.5–0.1 mm, and <0.1 mm) [36]. This was also reported by Verheijen et al. (2019), who observed that the application of biochar led to a decrease of 1–5% in the BD and an increase in the WHC, except with the application rate of 20% (w/w) (in which no difference was observed [30]). Therefore, it is suggested that high application rates are to be avoided under the principle of “less is more”.
Most of the physicochemical properties of soil with agronomic relevance are related to pH. The typical pH values of biochar vary from 6.4 to 9.3, and they tend to rise with an increase in pyrolysis temperature due to a higher ash content. The ash contains alkaline inorganic compounds that are able to correct acidic soils; as such, biochar may also act as a liming agent [4,45], although the magnitude of the effect does vary. While Zhao, Wang, and Wang (2014) showed that the application of biochar from rice straw increased the pH by 0.6–0.8 (to values of 6.25–6.75), a distinct observation was reported by de la Rosa et al. (2014), who did not achieve a substantial increase in the pH after biochar application at rates of 5% and 10% (w/w) [46,47]. Additionally, biochar can increase the electrical conductivity (EC) of the soil due not only to its ash content but also to a larger surface:volume ratio that allows for a better ion retention capacity, thus increasing the soil quality [45]. Farhain et al., 2022, studied the effects of biochar produced from wood ashes and pulp and paper sludge in acidic soils and observed an increase in the pH and EC in the range of 7.3–11 and to a maximum of 2.5 dS∙m−1, respectively [44]. Burrel et al., 2016, also observed an increase in the EC and soil aggregation (23% to 92%) after the application of biochar produced from wood shreds, wheat straws, and wine pruning in three different soils (planosol, chernozem, and cambisol), although the effect size varied among the soils [48].
Despite the agronomic benefits brought by the application of biochar to soils, quite distinct effects have been reported elsewhere depending on the type of soil in which it is applied, the feedstock biomass used, the particle size, the potential release of harmful compounds, and the possible off-site effects on biota [12,31,49,50]. Moreover, to the best of our knowledge, no previous study has addressed the possibility of combining the valorization of low-grade biomass from forestry cleaning for wildfire prevention with the recycling back of carbon and nutrients into forest soils to increase the sustainability of the forestry sector. Therefore, the objectives of this study are (i) to assess the influence of pyrolysis temperature combined with the biochar particle size in soil properties to establish suitable biochar application rates; (ii) to obtain comprehensive information allowing for the disentanglement of correlations between these factors; and (iii) to quantify the agronomic gains in the amended soils in order to provide information for the upscaling of biochar production from residual forestry biomass. The approach aims at promoting wildfire prevention by adding value to residual biomass from forestry maintenance operations and returning the product biochar back to forest soils, for the development of rural economies. This work was developed in the scope of project BioValChar (reference: PCIF/GVB/0034/2019) which addresses the valorization of residual biomass from forestry operations into biochar and further application as a soil amendment.

2. Materials and Methods

2.1. Soil Sampling and Characterization

The soil samples were collected in the Estarreja municipality in north-central Portugal and consisted of Humic Cambisol from a forest area located in the vicinity of industrial activity sites. The soil was sieved to a particle size of <2 mm to remove coarse materials and then air-dried (≈20 °C) for 5 days. The pH, electrical conductivity, soil density, and water-holding capacity were determined. The organic matter content was determined by loss on ignition (LOI), in which the sample was ignited to 550 °C for 4 h in a muffle furnace [29].

2.2. Biochar Preparation and Characterization

Acacia (Acacia longifolia) resulting from forestry management operations for wildfire prevention was used as feedstock to produce biochar via pyrolysis in a lab-scale auger-type reactor with continuous operation (biomass processing capacity up to 1 kg∙h−1). It was located at the Department of Environment and Planning of the University of Aveiro, Portugal. The pyrolysis was conducted at two temperatures, 450 °C and 550 °C, to evaluate the influence of pyrolysis temperature on the properties of biochar as a soil amendment. The pyrolysis temperature in the auger reactor was controlled using an automatic control and monitoring system. This range of temperature was chosen based on the literature as the most appropriate for producing biochar to be used as a soil amendment. Despite this, the increase in pyrolysis temperature from 450 °C to 550 °C is recognized as resulting in a less reactive biochar [39,41], e.g., with lower volatile matter content and more stable fixed carbon, and thus, it was chosen to evaluate how this increase in the temperature of biochar production influences the soil properties upon its application. The biochar was collected unsorted and then sieved to obtain three particle size classes, classified as S < 0.5 mm, M = [0.5; 3.15], and L > 3.15 mm. The proximate analysis was performed following the CEN/TS 14774-3:2004 (E), CEN/TS 14775:2004 (E), and CEN/TS 15148:2005 (E) to determine the moisture, ash, and volatile matter contents, respectively. The content of fixed carbon was calculated through the difference between the volatile matter and the ash content. The contents of carbon, hydrogen, nitrogen, and sulfur were determined through an Elemental Analyzer Model EA1108, Fisons Instruments. The content of oxygen was determined using Equation (1):
WO = 1 − (WC + WH + WN + WS + Wash)
where WC is the mass fraction of carbon (kg∙kgbiochar−1dry basis(db)), WH is the mass fraction of hydrogen (kg∙kgbiochar−1db), WN is the mass fraction of nitrogen (kg∙kgbiochar−1db), WS is the mass fraction of sulfur (kg∙kgbiochar−1db), and Wash is the mass fraction of ash (kg∙kgbiochar−1db).

2.3. Pot Incubation Assay

The pot incubation assay was designed on a factorial basis with three independent variables (factors): three particle sizes, S < 0.5 mm, M = [0.5; 3.15], and L > 3.15 mm; two pyrolysis temperatures, 450 °C and 550 °C; and four application rates of 0% (control), 3%, 6%, and 10% (w/w). To each pot, 200 g of the mixture of soil and biochar was added, and 3 replicates were performed (n = 57). The incubation of the biochar in the soil lasted for 50 days, and the water-holding capacity (WHC) of the treatments was maintained at a range of 20 to 85% through regular weighing of the pots and replenishment with distilled water.

2.4. Analytical Methods

2.4.1. Water-Holding Capacity (WHC)

The WHC was determined according to Annex A of the ISO 14240-2 international standard with necessary adaptations. We added 50 g of the treatment mixture into a cup with holes in the bottom and wet filter paper to account for its absorption. The mixtures were weighed and then saturated for a period of 8 h. Immediately after the saturation, they were placed into a deep platter to allow the water to drain for a period of 24 h; the tops of the cups were covered to prevent losses by evaporation. The cups were weighed after the drainage period and placed in a furnace at 105 °C for 24 h. The WHC was calculated as the ratio between the difference of the weight before and after saturation and the dry weight after 24 h in the furnace at 105 °C [51].

2.4.2. Extractable Elements

The extractable phosphorus, magnesium, calcium, sodium, and potassium were extracted using Mehlich III extraction. The extraction was performed by adding 20 mL of Mehlich III extraction solution to 2 g of the sample, shaking for 5 min at 200 rpm, and filtrating (Whatman no. 42). For the determination of P, the 4500P-E-Ascorbic acid method was followed, and the extract was analyzed through spectrophotometry using a PG Instruments T80+ UV/Visible Spectrophotometer. For the determination of K, Na, Mg, and Ca, the extracts were diluted 1:10 with distilled water in a volumetric flask of 50 mL, and 1 mL of a solution of cesium chloride and lanthanum chloride (0.06% CsCl + 0.2% LaCl3) was added [52]. The K and Na were determined via flame emission, while Mg and Ca were determined via atomic absorption using an Atomic Absorption Spectrophotometer GBC 904AA.

2.4.3. pH and Electrical Conductivity (EC)

The pH was analyzed following the ISO 10390 international standard with extraction 1:5 (v/v) with CaCl2, shaken for 1 h, and analyzed using a Multi-parameter Analyzer Consort™ C861 (SPW Industrial, Laguna Hills, CA, USA) [53]. The electric conductivity was analyzed following the ISO 11265 international standard with extraction 1:5 (w/v) with distilled water. Afterwards, the solution was shaken for 30 min at 300 rpm and then filtrated through a 45 μm nitrocellulose filter [54]. The extract was then measured using a Multi-parameter Analyzer Consort™ C861.

2.4.4. Statistical Analysis

The three factors (pyrolysis temperature, application rate, and particle size) of this study were analyzed through a factorial multivariate variance analysis (MANOVA) at a confidence level of 95%. The significance levels of the pyrolysis temperature, biochar particle size, and application rate, as well as their interactions, were tested on the dependent variables: pH, electrical conductivity, and plant nutrient elements (P, Na, Mg, Ca, and K). The values of skewness and kurtosis between −2 and 2 were verified to support the assumption of normality when the Shapiro–Wilk test was significant. The homogeneity of the variances was tested through Levene’s test and verified for all cases. The significance between factors was statistically significant (p-value < 0.05) according to Pillay’s Trace test, which was applied when the normality assumption was violated. The correlation between the dependent variables (pH, EC, and bioavailable plant nutrient elements) was analyzed through a Pearson correlation matrix. Due to the unequal sample sizes, the significance of the pyrolysis temperature, the biochar particle size, and the application rate in the WHC were analyzed via the Kruskal–Wallis test. Statistical analysis was performed using the software IBM SPSS v.28.0.1.0.

3. Results

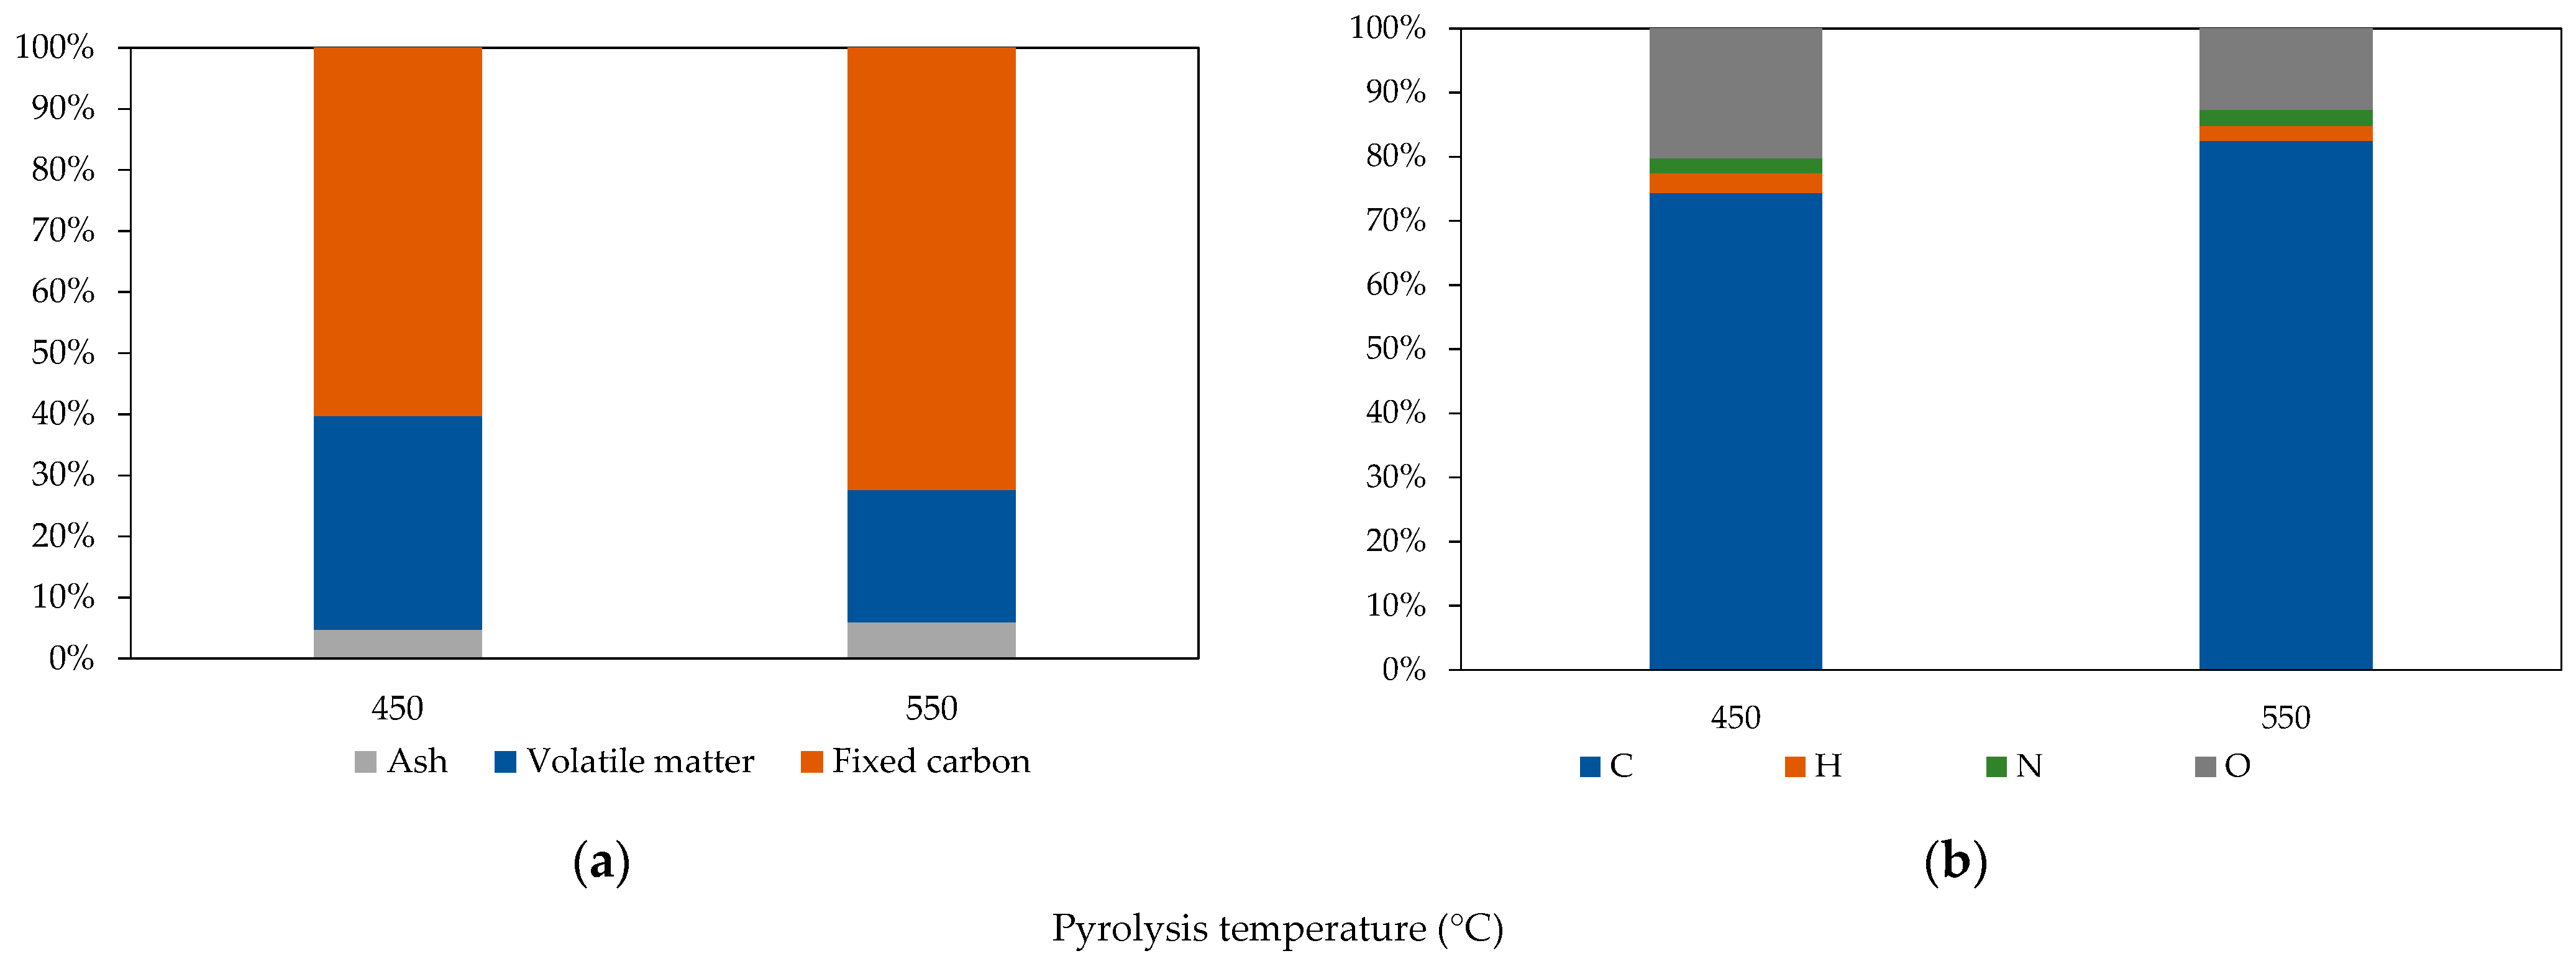
3.1. Soil and Biochar Characterization

The sandy soil was collected from a forestry area in north-central Portugal and subjected to pre-treatment prior to its characterization. Its physicochemical characterization is shown in Table 1. The soil was acidic, with a very low organic matter content (1%) combined with a limited water-holding capacity (16%). Although these values are typical of sandy soils, these properties are unfavorable for plant establishment and development [55].
The biochar was produced from chopped acacia biomass at two pyrolysis temperatures of 450 °C and 550 °C and thereafter was sieved into three particle size classes which had been selected as variables for the incubation assay. The biochar produced at 450 °C had a greater amount of particles L (>3.15 mm) when compared to the biochar produced at 550 °C (29% and 13%, respectively), while medium particle sizes (0.5–3.15 mm) were predominant for the biochar produced at both 450 °C and 550 °C, with 48% and 52.4%, respectively.
Figure 1 presents the proximate and elemental analysis of both biochars, regardless of the particle size classes. The biochar produced at 450 °C showed lower ash and fixed carbon content (5% and 60%, respectively) when compared to the biochar produced at 550 °C (6% and 71%, respectively), which is in agreement with a higher content of volatile matter (35%) than in the 550 °C biochar (21%). As expected, the biochar produced at 550 °C had a higher content of C (78%) and lower content of O (12%) when compared to the biochar produced at 450 °C (70% and 19%, respectively); the values of H, N, and S did not vary substantially (3%, 2%, and 0.1%). This observation was expected, since higher pyrolysis temperatures promote the removal of volatile matter and, therefore, greater stability in the chars. These ranges of values are in agreement with most values found in the literature.
The pH of the biochar was in the range of 6.2–7.0, and the EC was in the range of 379–515 μS∙cm−1; the highest values were found for the biochar produced at 550 °C. In fact, higher temperature chars are expected to contain large pools of polycondensed aromatic structures that promote electrical conductivity [56]. Regarding the BD of the particle size classes S, M, and L, there were no substantial differences among biochars produced at either temperature. The BD values were 0.13 g∙cm−3 for the larger particles (M and L) and 0.33 g∙cm−3 for the smaller particles (S) due to the smaller bulk volume of this particle size class.

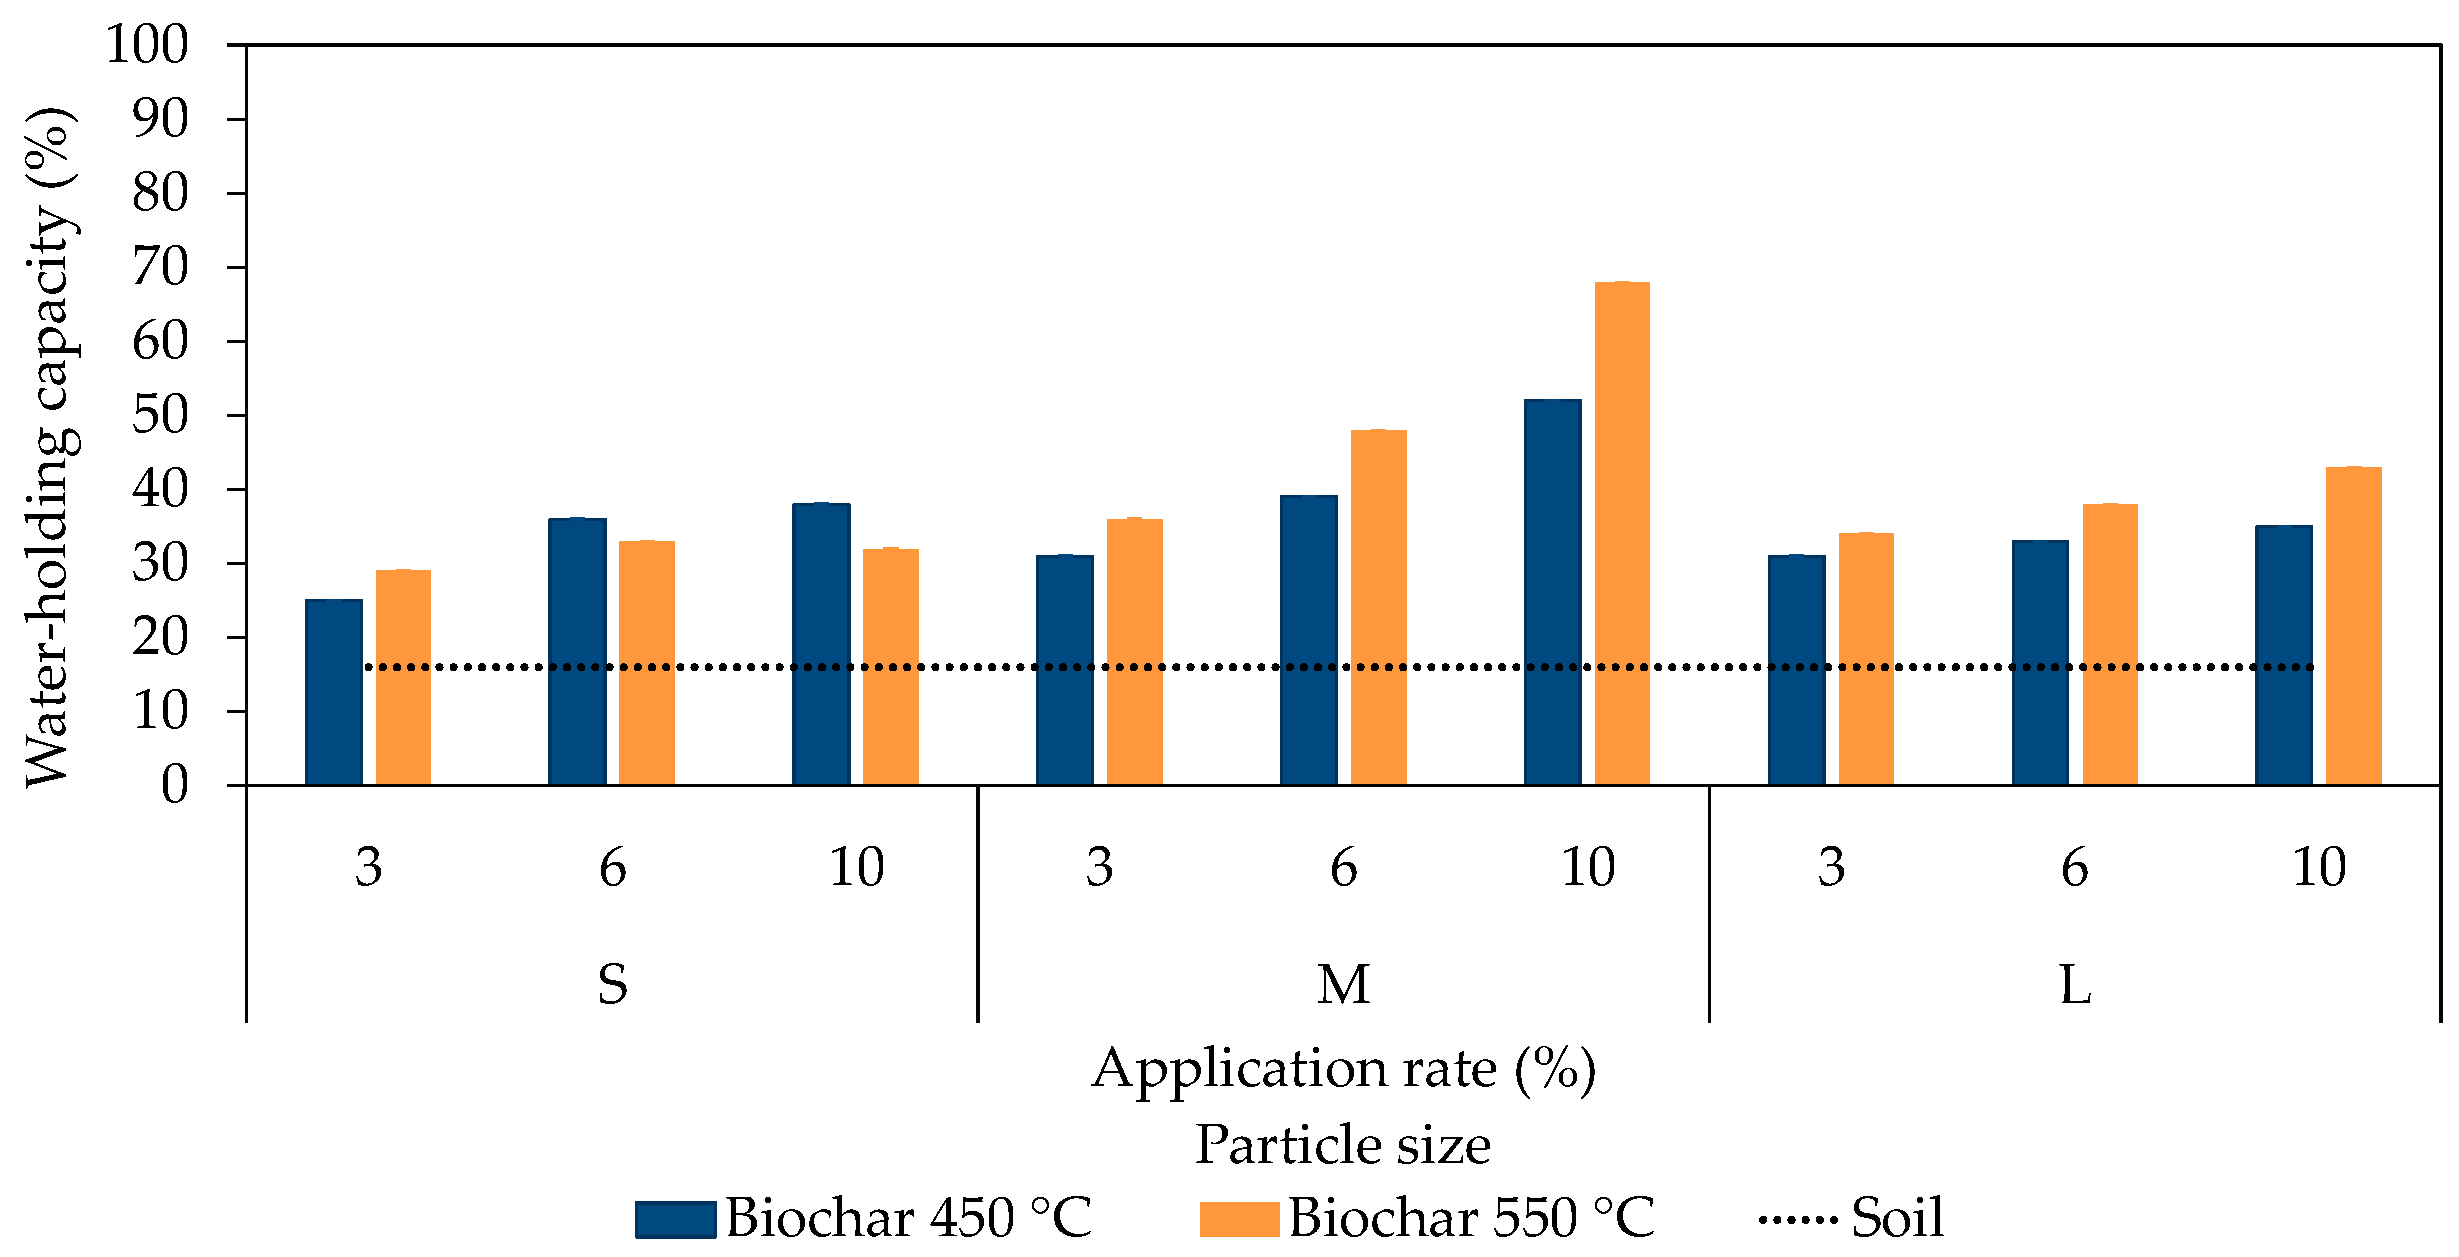
3.2. Water-Holding Capacity
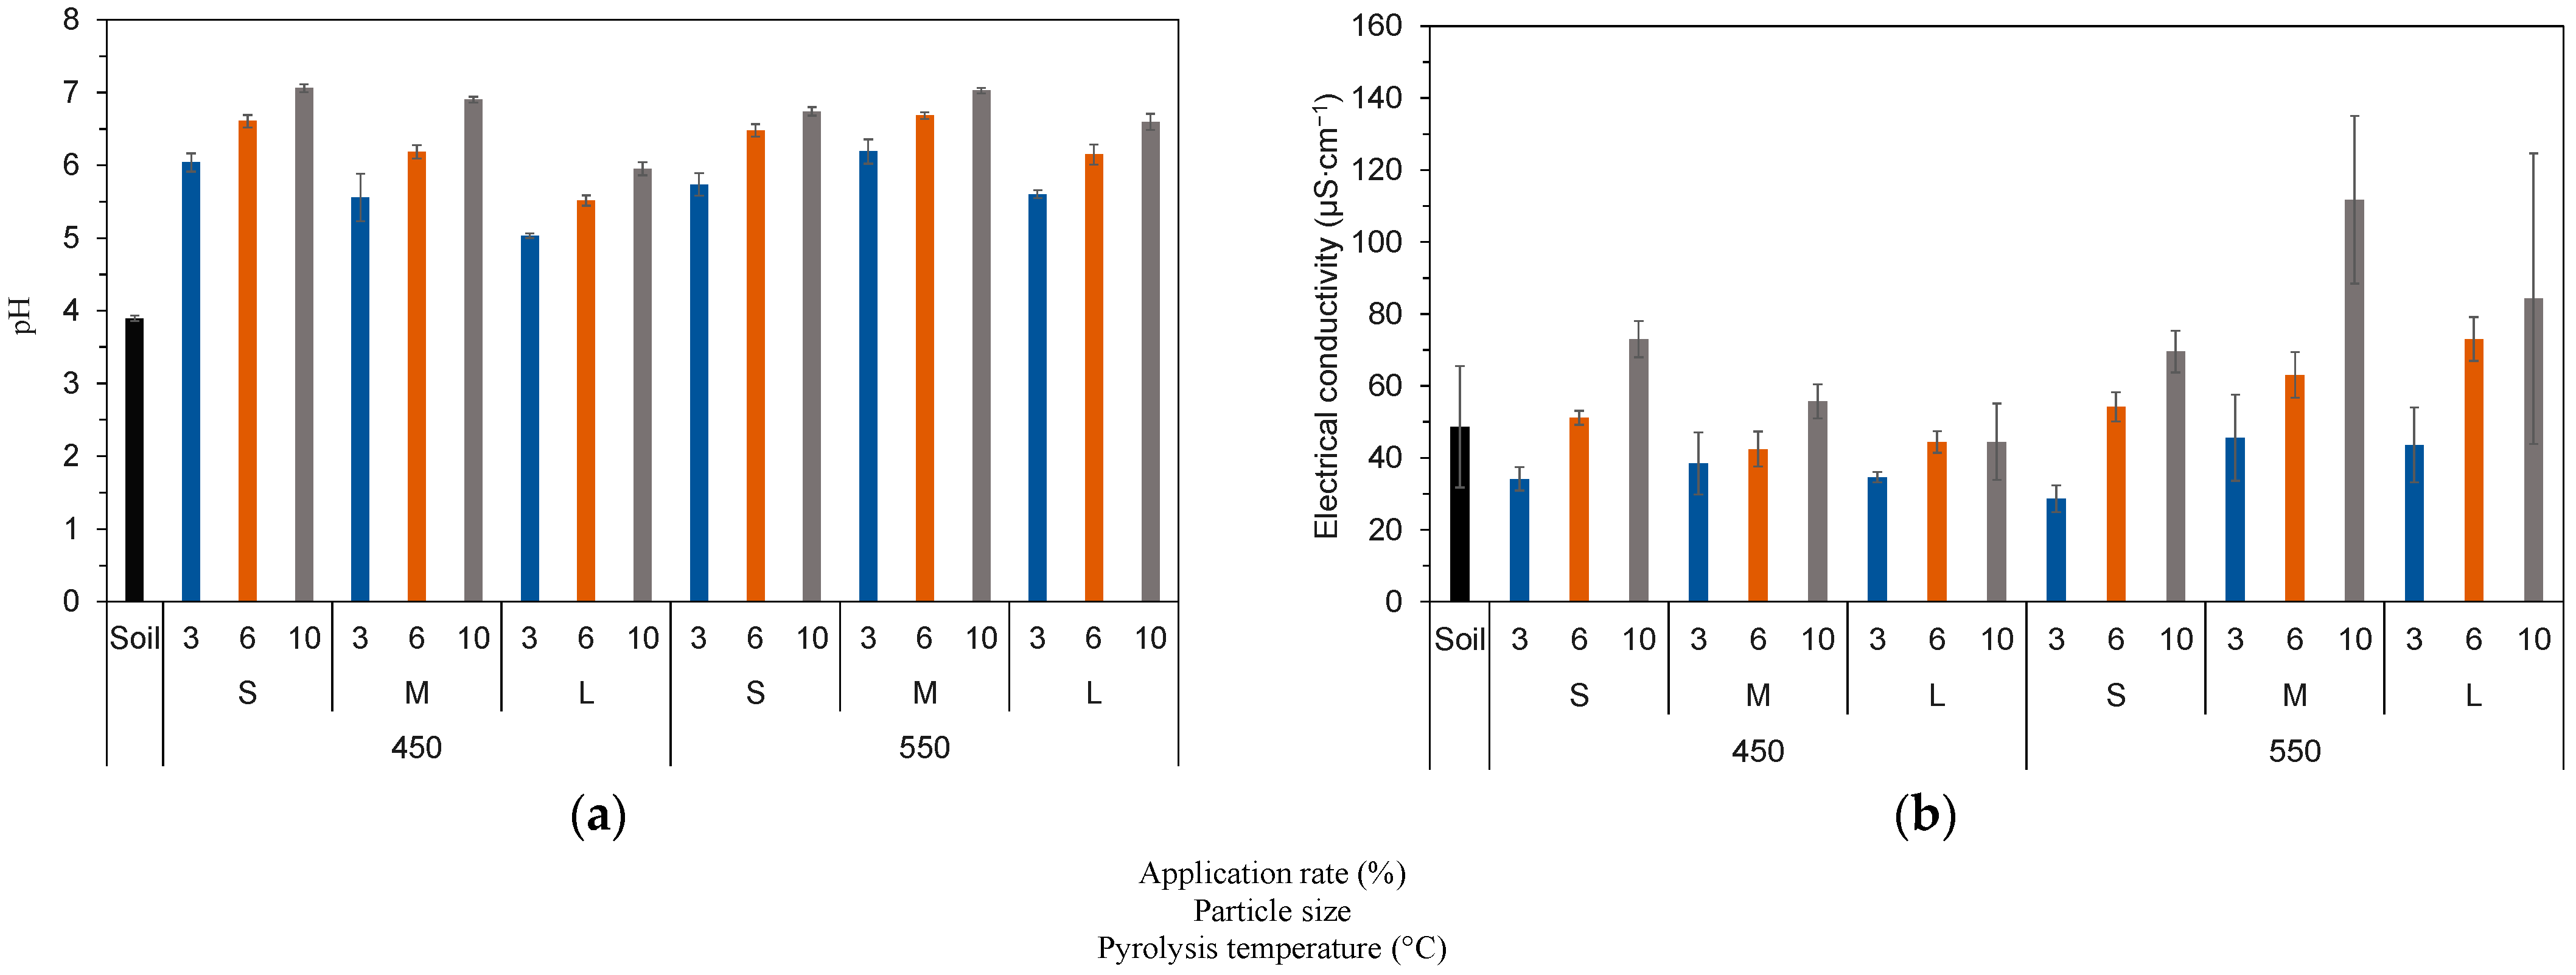
The water-holding capacity (WHC) values for the small-, medium-, and large-sized biochar particles incubated in the soil at application rates of 3%, 6%, and 10% (w/w) are shown in Figure 2.
A maximum WHC of 68% was recorded at a 10% (w/w) application rate of the particle size class M of biochar produced at 550 °C, while a minimum value of 25% was obtained at a 3% (w/w) application rate of the particle size class S of biochar produced at 450 °C. A remarkable increase of 56% to 325% was observed in all the treatments when compared to the control soil (Figure 2), and the increase was positively related to the application rate regardless of the particle size or pyrolysis temperature. The biochar produced at 550 °C generally produced higher values of WHC when compared to the biochar produced at the lowest temperature, except at the 6% and 10% (w/w) application rates of the particle size class S. When comparing the particle size, the medium particles produced higher WHC values, with increases in the range of 194% to 225% and 125% to 325% for the biochars produced at 450 °C and 550 °C, respectively. The reason for this may be attributed to a dual factor. First, a high quantity of small particles within the M particle size class might have induced better filling in the soil pores, therefore maximizing the biochar’s potential to retain water. While this fact could also be true for the S particle size class, the M particle size class showed lower bulk density than the S-class, which induced higher porosity in the soil. Both the particle size and application rate had statistically significant effects on the WHC (p-value < 0.001). Within the application size, the M particles were statistically different from the larger and smaller particle sizes, whereas the 3% (w/w) application rate was statistically different from the remaining application rates.

3.3. pH and EC

The pH increased for all the treatments (Figure 3a), from 3.9 for the control to values of 5 to 7 (biochar 450 °C, particle size L > 3.15 mm, and application rate 10% (w/w); particle size S < 0.5 mm and application rate 3% (w/w), respectively). The EC (Figure 3b) varied between 28.6 μS∙cm−1 and 111.73 μS∙cm−1 for the biochar produced at 550 °C, with a particle size S < 0.5 mm and application rate of 3% (w/w) and a particle size M = [0.5, 3.15] and application rate of 10% (w/w), respectively.
The increase in pH was directly proportional to the application rate for all the particle sizes and pyrolysis temperatures. All of the factors were statistically significant (p-value < 0.05), although the application rate and particle size had greater influences on its variance (partial eta squared of 0.946 and 0.906, respectively). As shown in Figure 3a, the pH of the biochar produced at 450 °C decreased with the increase in the application rate. The increase in EC was directly proportional to the application rate and particle size, and both the pyrolysis temperature and application rate were statistically significant (p-value of 0.00). In this case, the application rate had the highest influence on its variance (partial eta squared of 0.66).

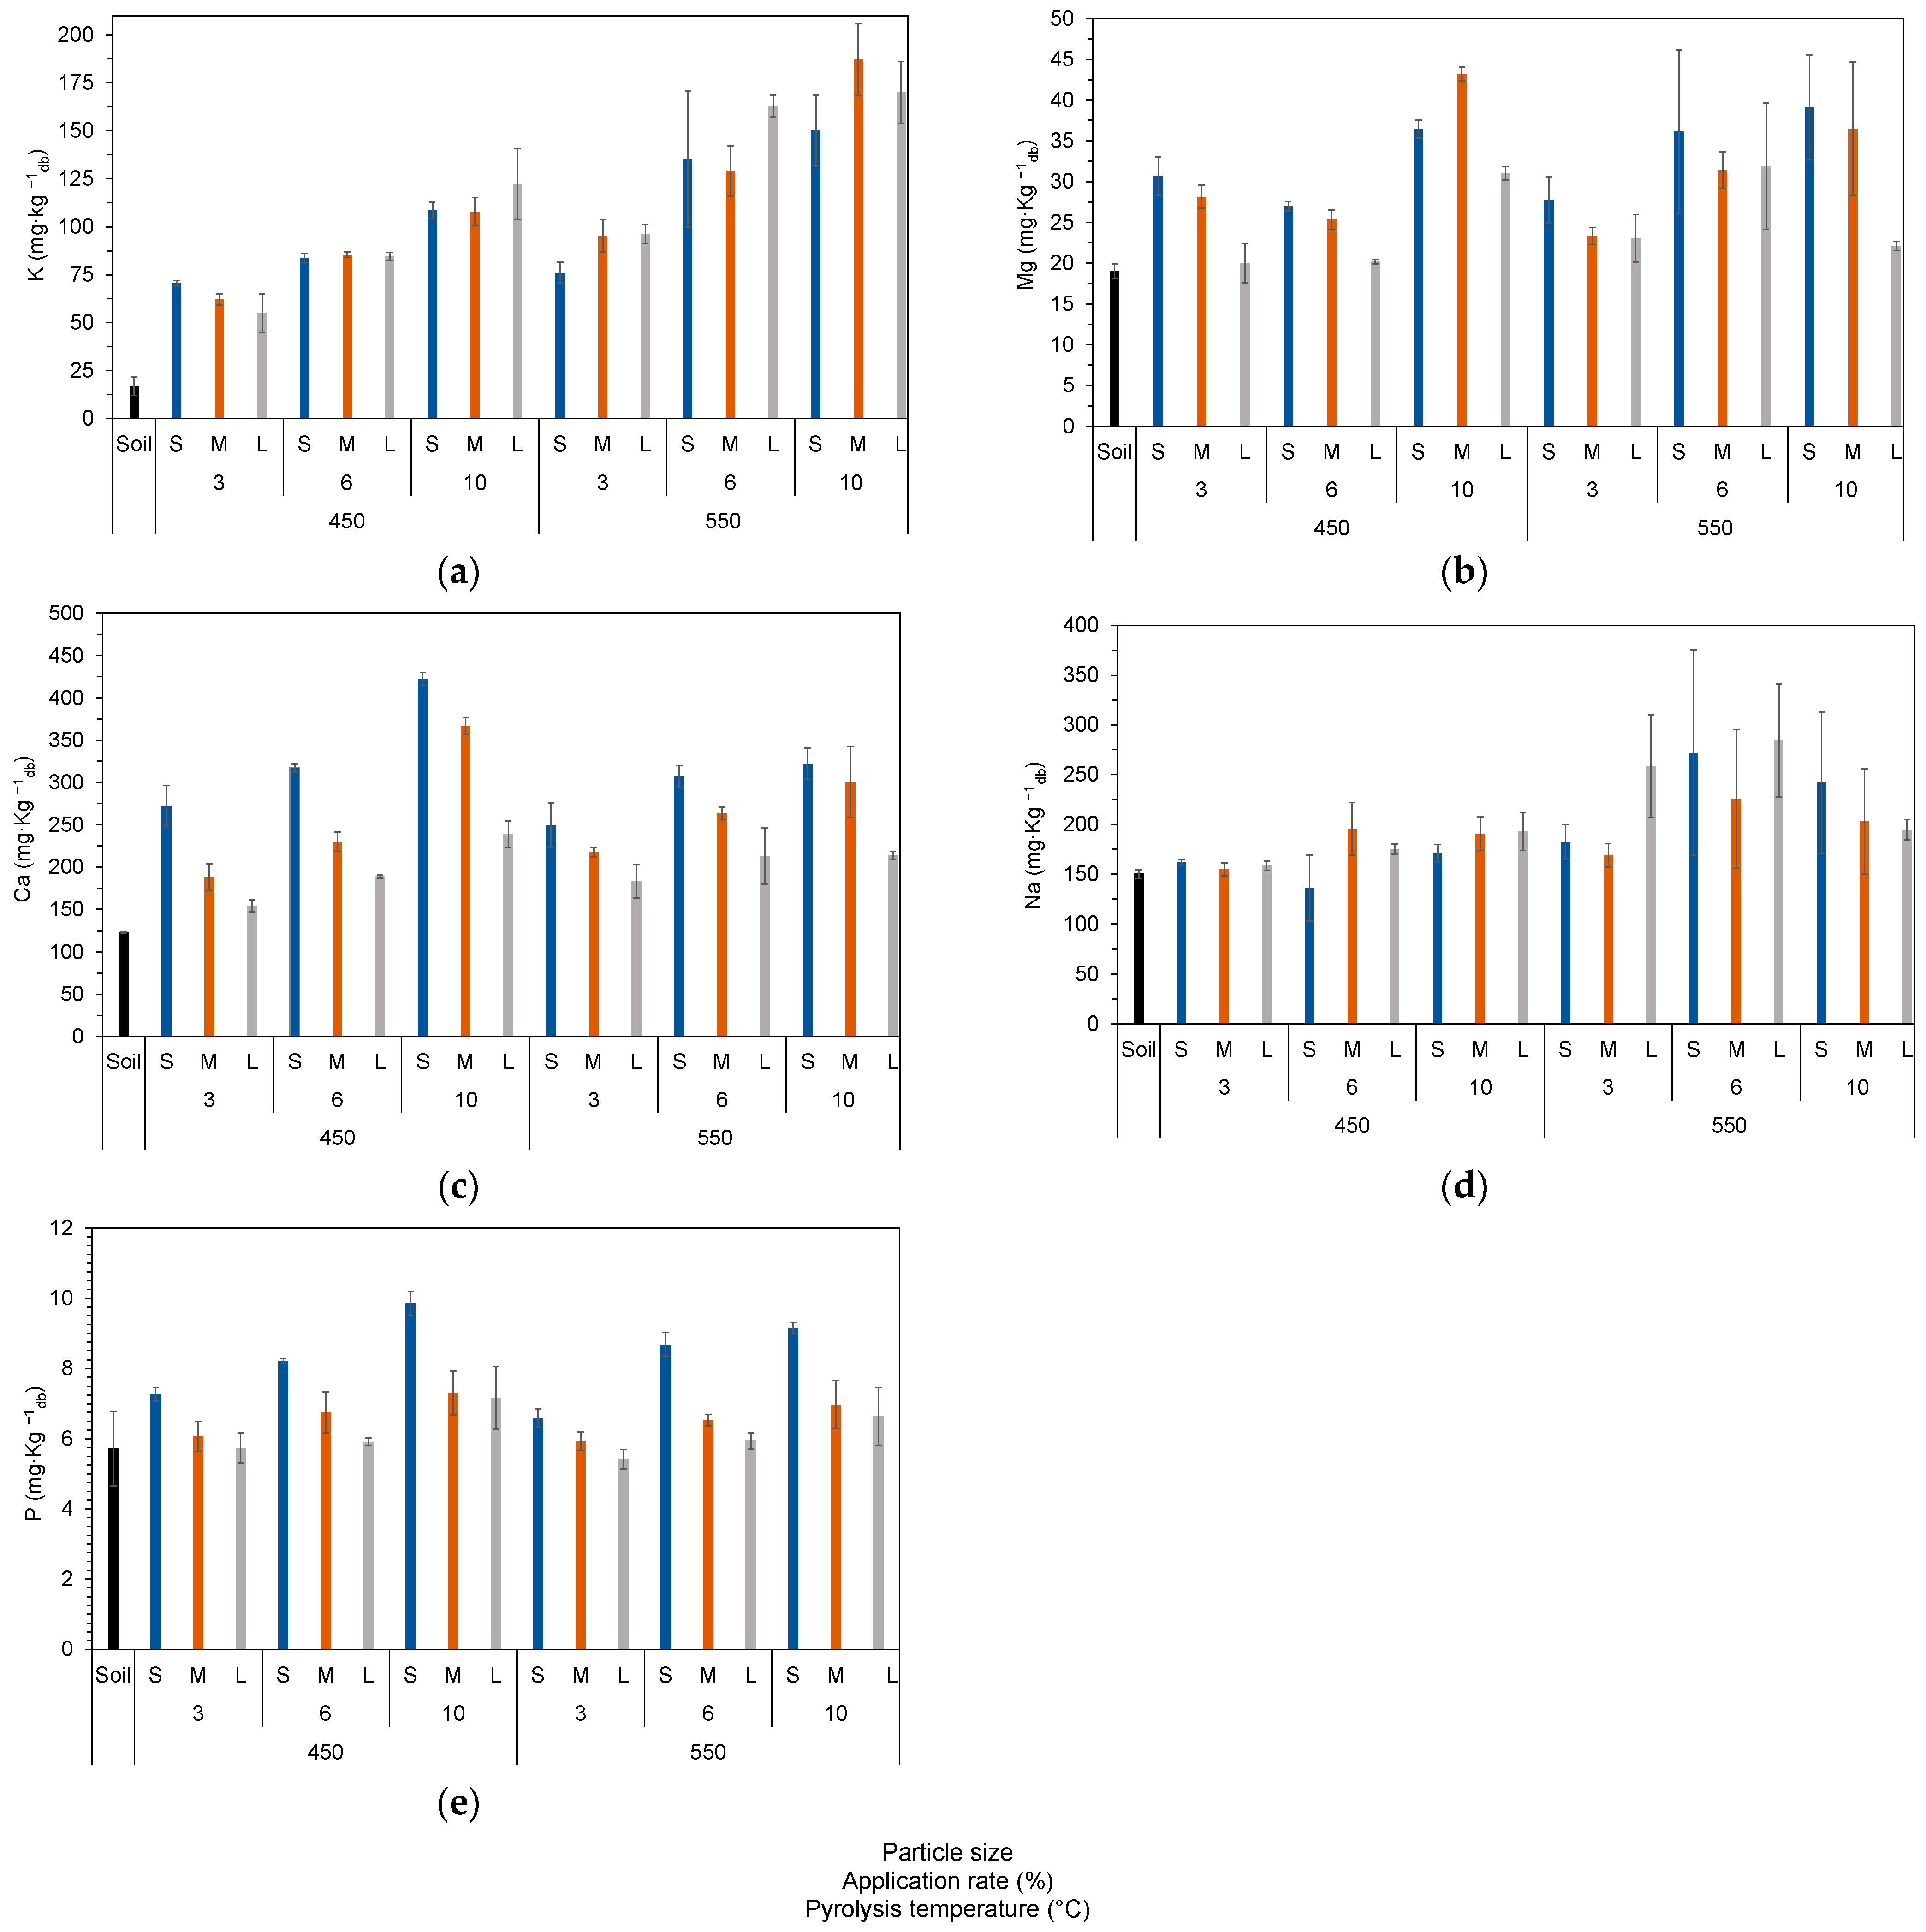
3.4. Extractable Elements

The values of the bioavailable plant nutrient elements P, Ca, Mg, Na, and K for all treatments are presented in Figure 4. The P concentration, Figure 4e, increased for all the treatments except for the 3% (w/w) application rate with particle size L at both biochar temperatures. In turn, the P concentrations in the remaining treatments increased by between 4 and 72%, with the greatest increase corresponding to a 10% (w/w) application rate of particle size L of the 450 °C biochar with a value of 9.85 mg∙kg−1db. The P concentration was directly proportional to the application rate and biochar particle size. The single effects of application rate, particle size, and the interaction between the particle size and application rate were statistically significant, with the particle size and application rate having the highest effect on its variance (partial eta squared of 0.822 and 0.883, respectively).
The same patterns were observed for the concentrations of Ca and K (Figure 4a,c), in which the increase was directly proportional to the biochar particle size and application rate. The Ca concentration of the treatments reached values of 154–422 mg∙kg−1db, corresponding to an increase of 25 to 243% when compared to the control soil, for a 3% (w/w) application rate of particle size L and for a 10% (w/w) application rate of particle size L of the biochar produced at 450 °C, respectively. All the factors and their interactions had statistically significant effects on the Ca concentration, but the particle size and application rate had greater effects on its variance, with partial eta squared values of 0.911 and 0.884, respectively. In turn, K reached concentrations of 55–187 mg kg−1db, which corresponded to an increase of 226% to 1008% for the 3% and 10% (w/w) application rates of particle size L of the 450 °C biochar, respectively. The application rate and pyrolysis temperature had statistically significant effects on the K concentration and its variance, with partial eta squared values of 0.857 and 0.824, respectively.
The Mg concentration of the treatments (Figure 4b) was indirectly proportional to the biochar particle size, with maximum values of 20–43 mg∙kg−1db, which corresponded to an increase of 5% to 127% for the 3% (w/w) application rate of particle size L and the 10% (w/w) application rate of particle size M of the 450 °C biochar, respectively. The concentration was significantly affected by all the factors, with little influence of the pyrolysis temperature (partial eta squared of 0.022). Conversely, the Na concentrations (Figure 4d) did not present a clear pattern and were only significantly affected by the pyrolysis temperature, with a relatively low effect on its variance (partial eta squared of 0.379). The maximum Na concentrations were in the range of 154–284 mg∙kg−1db, corresponding to increases of 3% to 89% for the 3% (w/w) application rate of particle size M of the 450 °C biochar and the 6% (w/w) application rate of particle size L of the 550 °C biochar, respectively. However, the 6% (w/w) application rate of particle size S of the 450 °C biochar led to a decrease of 9% with a value of 136 mg∙kg−1db.

3.5. Correlation between Dependent Variables

Table 2 depicts the Pearson correlations between the pH, EC, and bioavailable concentrations of plant nutrient elements. The EC was positively correlated with the concentration of P (27%), Mg (34%), Ca (33%), and K (69%). The pH was strongly correlated with the EC and with the plant nutrient element concentration, except for Na, with correlations ranging from 50 to 82%. The Na concentration showed the lowest number of correlations, being only weakly correlated with the Mg and K (<57%). Regarding the remaining plant nutrient elements, the P concentrations were significantly correlated with the concentrations of Ca, K, and Mg, while the Ca concentrations were significantly correlated with all the dependent variables except for the Na concentrations. The Mg and K concentrations were correlated with all the variables. All correlations were positive, thus showing that an increase in one variable could lead to a significant increase in another.

4. Discussion

The biochar produced at 450 °C had a higher amount of L particles (>3.15 mm) when compared to the biochar produced at 550 °C (29% and 13%, respectively). This can be explained by a decrease in the feedstock biomass resistance and an increase in friction that led to a reduction in the particle size as a result of the higher temperature [57]. Regarding the BD (0.13–0.33 g cm−3), the values were similar to those reported by Burrell et al., 2016, in which values of 0.22 g∙cm−3, 0.47 g∙cm−3, 0.44 g∙cm−3, and 0.36 g∙cm−3 were achieved in biochar produced from straw, woodchip, and vineyards at 525 °C, as well as from vineyards at 400 °C, respectively [48]. A decrease in the BD along with the increase in biochar particle size was also observed by Verheijen et al., 2019, in which the BD was in the range of 0.33 g∙cm−3, 0.24 g∙cm−3, and 0.22 g∙cm−3 for the small (0.05 to 1 mm), unsorted, and large (2 to 4 mm) biochar particle sizes, respectively [30]. According to Dhar, Sakib, and Hilary, 2022, an increase in the pyrolysis temperature from 350 to 600 °C led to a decrease in the bulk density of the biochar from 0.55 g∙cm−3 to 0.39 g∙cm−3. This could be due to an increase in the formation of porous structures in biochar occurring along with the increase in temperature [58].
The water-holding capacity of the treatments was substantially higher than that observed in the control soil (16%), with an increase of 69% to 325%. The presence of macropores in the biochar, due to the friction and cracking during the pyrolysis process, led to a retention of water due to capillarity [23,59]. The observed increase could be explained by a decrease in the BD of the soil leading to an increase in its porosity but also by an increase in the soil storage pores and pore rearrangement between grains provided by the biochar amendment [18,30,60]. The M-sized particles induced a greater WHC than the L-sized particles, which can be attributed to the filling of the pores of the soil by the smaller biochar particles, leading to a decrease in its permeability [61]. However, this was not observed for the S-sized particles, which could be due to slight shifts in the BD, since these particles had a higher BD (0.33 g∙cm−3) than the M and L particles (0.13 g∙cm−3). Głąb et al., 2016, observed a less significant decrease in the bulk density of the soils with the application of the smaller particle sizes of biochar (0–0.5 and 0.5–1 mm) [22]. Similar results were obtained by Fu et al., 2021, who assessed the hydraulic properties of desert soils amended with biochar at variable application rates (0 to 4% (w/w)) and particle sizes (0–0.25, 0.25–1, and 1–2 mm). These authors reported that the available water content increased with an increasing application rate up to 115% when compared to the control soil [18]. Laghari et al., 2015, also demonstrated that soils amended with biochar retained more water against evaporation and gravity and obtained an increase of 6.9% in WHC after 0.6% (w/w) biochar application [61]. An increase of 48% in the WHC upon a 20 % (v/v) application of biochar was also reported by Verheijen et al., 2019. These authors also observed an increase in the WHC after the application of smaller particle sizes (0.05 to 1 mm) when compared to the application of unsorted and larger particle sizes (2 to 4 mm) in sandy soils [30]. Agegnehu et al., 2016, observed an increase in the water content upon a 5% to 10% (w/w) application of wood and maize stalk biochar, which was pyrolyzed at 550 °C [62].
The pH increased substantially in all treatments when compared to the control soil (3.9), reaching a maximum value of 7 (10% (w/w) application rate of particles S < 0.15 mm in size of the biochar produced at 450 °C), which can be explained by the biochar’s capacity to act as a liming agent combined with the soil’s poor buffering capacity [4]. These results differ from those observed by de La Rosa et al., 2014, in which the application of biochar at rates of 10% to 20% (w/w) did not substantially change the soil pH, since it already presented an alkaline nature [46]. Watzinger et al., 2014, also observed an increase in the soil pH after biochar application that was related to the initially acidic pH of the soil, as shown in the present study [42]. Moreover, Zheng et al., 2018, attributed no significant changes in the soil pH after the application of biochar (application rates of 0.5%, 5%, and 10% (w/w)) to the high buffer capacity of the saline–sodic soils [12]. Chan et al., 2007, observed an increase in the WHC and pH of the soil with increasing application rates (0% to 2.8% (w/w)) of biochar produced from green waste [63].
Biochar amendment did not produce marked changes in the EC as compared to the control soil (48.63 μS∙cm−1). There was a slight increase after the 10% (w/w) application of biochar from particle size classes M and L. Moreover, the values obtained with the treatments using biochar produced at 550 °C tended to be higher than those obtained with biochar produced at 450 °C, which may be explained by the higher content of ashes in the biochar produced at higher temperatures. This is due to volatilization and consequent concentration of inorganic compounds in the carbonaceous matrix [60]. These results were similar to what Farhain et al., 2022, observed, i.e., increases in EC up to 2.5 dS∙m−1 in biochar-amended soils [44]. Burrel et al., 2016, also observed an increase in the EC in three different soils after the application of biochar produced at 525 °C [48].
The bioavailable concentrations of P, Ca, and K were directly proportional to the biochar application rate (increase of 4% to 72%, 25% to 243%, and 226% to 1008%, respectively), although they were indirectly proportional to the particle size, which could be due to the higher difficulty of incorporating the coarse particles of biochar into the soil, and this should be considered for field-scale applications of biochar. The increase in bioavailable plant nutrient elements in soil could be related not only to the chemical properties of the utilized biomass but also to the improvements in the WHC that lead to a reduced runoff of water and, consequently, to a decrease in nutrient leaching [3,21,27,46]. According to Shaaban et al., 2018, biochar application can reduce the formation of phosphate precipitates and consequently increase the P availability, and this was also observed by Xu et al., 2013, who observed an increase in soluble P that was significantly related to a decrease in soil acidity due to biochar application [29,34]. Farhangi-Abriz and Torabian, 2018, observed similar results, with an increase in K, Mg, and Ca concentrations and a decrease in Na concentrations due to biochar adsorption and assimilation. This occurred after the use of 5% and 10% (w/w) application rates of biochar produced at 560 °C in saline soils [64]. Zheng et al., 2018, observed an increase in P concentrations of 7.6–16.8% in application rates of 1.5% to 10% (w/w) of biochar produced at 350 °C [12]. In the present study, the nutrient concentration was positively correlated with the pH. This is the opposite of what was observed by Xu et al., 2013, who showed a decrease in the water-soluble concentrations of K, Ca, Na, and Mg with the increase in soil pH [34]. Additionally, an increase in the nutrient supply (K and P) from biochar could also lead to an increase in the dry matter of the plants, as reported by Chan et al., 2007 [63].
The extent of the improvements in the pH, EC, WHC, and nutrient concentration provided by biochar amendment is ultimately related to the type of soil that is treated and the characteristics of the biomass that is used [3,5,27]. Nevertheless, biochar application has been seen as a Circular Economy pathway, and the quantification of physicochemical gains in soils is the first step towards developing management strategies for improved soil quality and fertility.

5. Conclusions

Biochar application significantly improved the physicochemical properties of sandy soil. The water-holding capacity increased to values between 25% and 68%. As more water is retained by the soil, a greater amount of water available for plants is provided, and consequently, there is less of a need for irrigation. This enhanced water retention also mitigates nutrient leaching, as observed by the increase in the bioavailable concentration of P, Ca, Mg, K, and Na.
The analysis conducted to assess the improvements in plant nutrient element concentration and water-holding capacity in the amended soil was indicative that the process is mainly governed by the biochar application rate and particle size, while the effect of the pyrolysis temperature used to produce biochar presented the lowest significance in terms of the variance in the parameters. The observed results may be explained as a consequence of alterations in soil pores and structure by biochar application, as evidenced by the effects of the medium-sized particles, which improved the water retention of the soil, and the smaller particles, which increased the nutrient concentration. However, larger biochar particles did not show additional advantages within the variables under study, which is of major importance, since M particles are the predominant particle size classes in most biochars produced from residual forest biomass. The predominance of this particle size in biochar results from the friction process during pyrolysis, which reduces the need to sieve the biochar, thus facilitating its application after production.
The biochar used as a soil amendment was produced by pyrolysis of residual forestry biomass collected during forestry maintenance operations for wildfire prevention, thus following the principles of residue valorization in a Circular Economy context. This biochar from low-grade biomass was shown to promote agronomic improvements when applied in acidic, sandy soil with a high permeability. However, it is recommended that further studies be conducted regarding the application of this type of biochar in different soils to assess the effectiveness of this approach of using residual biomass as biochar for soil amendment.

Author Contributions

A.C.M.: investigation, writing—original draft preparation; M.C.d.S.: resources; L.A.C.T.: writing—review and editing, supervision, project administration; F.C.S.: writing—review and editing, supervision. All authors have read and agreed to the published version of the manuscript.

Funding

This research was conducted in the scope of the project BioValChar—Sustainable valorization of residual biomass for biochar (PCIF/GVB/0034/2019), in the scope of the Contest for Scientific Research and Technological Development Projects—Fire Prevention and Combat—2019, by the Foundation for Science and Technology (FCT), exclusively financed through national funds, and project MOSAIC—“Application of microbial-laden biochar as a proxy for long-term sustainability of contaminated soils”, co-financed by the Labex DRIIHM, French programme "Investissements d’Avenir" (ANR-11-LABX-0010), which is managed by the ANR. F.C. Silva acknowledges the funding through national funds (OE) under the contractual framework forecasted in art. 23° DL57/2016 (n° 4, 5, 6) 29 August, rectified by DL57/19 July 2017. Thanks are due to the Portuguese Foundation for Science and Technology (FCT)/Ministry of Science, Technology and Higher Education (MCTES), Portugal, for the financial support to CESAM (UIDP/50017/2020+UIDB/50017/2020+LA/P/0094/2020), through national funds.

Data Availability Statement

Data are contained within the article.

Conflicts of Interest

The authors declare no conflict of interest.

References

  1. Wallace, J. Increasing agricultural water use efficiency to meet future food production. Agric. Ecosyst. Environ. 2000, 82, 105–119. [Google Scholar] [CrossRef]
  2. Beesley, L.; Moreno-Jiménez, E.; Gomez-Eyles, J.L. Effects of biochar and greenwaste compost amendments on mobility, bioavailability and toxicity of inorganic and organic contaminants in a multi-element polluted soil. Environ. Pollut. 2010, 158, 2282–2287. [Google Scholar] [CrossRef] [PubMed]
  3. Khorram, M.S.; Zhang, Q.; Lin, D.; Zheng, Y.; Fang, H.; Yu, Y. Biochar: A review of its impact on pesticide behavior in soil environments and its potential applications. J. Environ. Sci. 2016, 44, 269–279. [Google Scholar] [CrossRef] [PubMed]
  4. Neina, D. The Role of Soil pH in Plant Nutrition and Soil Remediation. Appl. Environ. Soil Sci. 2019, 2019, 5794869. [Google Scholar] [CrossRef]
  5. EUR-Lex. Thematic Strategy for Soil Protection. 2011. Available online: https://eur-lex.europa.eu/EN/legal-content/summary/thematic-strategy-for-soil-protection.html (accessed on 14 July 2023).
  6. El-Naggar, A.; El-Naggar, A.H.; Shaheen, S.M.; Sarkar, B.; Chang, S.X.; Tsang, D.C.; Rinklebe, J.; Ok, Y.S. Biochar composition-dependent impacts on soil nutrient release, carbon mineralization, and potential environmental risk: A review. J. Environ. Manag. 2019, 241, 458–467. [Google Scholar] [CrossRef] [PubMed]
  7. Lourenço, L.; Fernandes, S.; Castro, A. Causas de incêndios florestais em Portugal continental. Análise estatística da investigação efetuada no último quindénio (1996 a 2010). Cad. De Geogr. 2011, 30–31, 61–80. [Google Scholar] [CrossRef]
  8. Comissão Técnica Independente. Relatório Comunidade Independente. 2017. Available online: https://www.parlamento.pt/Documents/2017/Outubro/RelatórioCTI_VF.pdf (accessed on 25 July 2023).
  9. Vassilev, S.V.; Baxter, D.; Andersen, L.K.; Vassileva, C.G. An overview of the chemical composition of biomass. Fuel 2010, 89, 913–933. [Google Scholar] [CrossRef]
  10. Kołtowski, M.; Oleszczuk, P. Toxicity of biochars after polycyclic aromatic hydrocarbons removal by thermal treatment. Ecol. Eng. 2015, 75, 79–85. [Google Scholar] [CrossRef]
  11. Luo, S.; Wang, S.; Tian, L.; Li, S.; Li, X.; Shen, Y.; Tian, C. Long-term biochar application influences soil microbial community and its potential roles in semiarid farmland. Appl. Soil Ecol. 2017, 117–118, 10–15. [Google Scholar] [CrossRef]
  12. Zheng, H.; Wang, X.; Chen, L.; Wang, Z.; Xia, Y.; Zhang, Y.; Wang, H.; Luo, X.; Xing, B. Enhanced growth of halophyte plants in biochar-amended coastal soil: Roles of nutrient availability and rhizosphere microbial modulation. Plant Cell Environ. 2018, 41, 517–532. [Google Scholar] [CrossRef]
  13. Enaime, G.; Baçaoui, A.; Yaacoubi, A.; Lübken, M. Biochar for Wastewater Treatment—Conversion Technologies and Applications. Appl. Sci. 2020, 10, 3492. [Google Scholar] [CrossRef]
  14. Yuan, J.; Wen, Y.; Dionysiou, D.D.; Sharma, V.K.; Ma, X. Biochar as a novel carbon-negative electron source and mediator: Electron exchange capacity (EEC) and environmentally persistent free radicals (EPFRs): A review. Chem. Eng. J. 2022, 429, 132313. [Google Scholar] [CrossRef]
  15. Pituya, P.; Sriburi, T.; Wijitkosum, S. Optimization of Biochar Preparation from Acacia Wood for Soil Amendment. Eng. J. 2017, 21, 99–105. [Google Scholar] [CrossRef]
  16. Chan, K.Y.; Van Zwieten, L.; Meszaros, I.; Downie, A.; Joseph, S. Using poultry litter biochars as soil amendments. Aust. J. Soil Res. 2008, 46, 437–444. [Google Scholar] [CrossRef]
  17. Pituya, P.; Sriburi, T.; Wijitkosum, S. Properties of Biochar Prepared from Acacia Wood and Coconut Shell for Soil Amendment. Eng. J. 2017, 21, 63–75. [Google Scholar] [CrossRef]
  18. Fu, G.; Qiu, X.; Xu, X.; Zhang, W.; Zang, F.; Zhao, C. The role of biochar particle size and application rate in promoting the hydraulic and physical properties of sandy desert soil. Catena 2021, 207, 105607. [Google Scholar] [CrossRef]
  19. Solaiman, Z.M.; Murphy, D.V.; Abbott, L.K. Biochars influence seed germination and early growth of seedlings. Plant Soil 2012, 353, 273–287. [Google Scholar] [CrossRef]
  20. Mukherjee, A.; Lal, R. Biochar Impacts on Soil Physical Properties and Greenhouse Gas Emissions. Agronomy 2013, 3, 313–339. [Google Scholar] [CrossRef]
  21. Agegnehu, G.; Bird, M.I.; Nelson, P.N.; Bass, A.M. The ameliorating effects of biochar and compost on soil quality and plant growth on a Ferralsol. Soil Res. 2015, 53, 1–12. [Google Scholar] [CrossRef]
  22. Głąb, T.; Palmowska, J.; Zaleski, T.; Gondek, K. Effect of biochar application on soil hydrological properties and physical quality of sandy soil. Geoderma 2016, 281, 11–20. [Google Scholar] [CrossRef]
  23. Kuppusamy, S.; Thavamani, P.; Megharaj, M.; Venkateswarlu, K.; Naidu, R. Agronomic and remedial benefits and risks of applying biochar to soil: Current knowledge and future research directions. Environ. Int. 2016, 87, 1–12. [Google Scholar] [CrossRef]
  24. Qambrani, N.A.; Rahman, M.M.; Won, S.; Shim, S.; Ra, C. Biochar properties and eco-friendly applications for climate change mitigation, waste management, and wastewater treatment: A review. Renew. Sustain. Energy Rev. 2017, 79, 255–273. [Google Scholar] [CrossRef]
  25. Zhang, B.; Zhang, L.; Zhang, X. Bioremediation of petroleum hydrocarbon-contaminated soil by petroleum-degrading bacteria immobilized on biochar. RSC Adv. 2019, 9, 35304–35311. [Google Scholar] [CrossRef]
  26. Razzaghi, F.; Obour, P.B.; Arthur, E. Does biochar improve soil water retention? A systematic review and meta-analysis. Geoderma 2019, 361, 114055. [Google Scholar] [CrossRef]
  27. Hossain, M.Z.; Bahar, M.M.; Sarkar, B.; Donne, S.W.; Ok, Y.S.; Palansooriya, K.N.; Kirkham, M.B.; Chowdhury, S.; Bolan, N. Biochar and Its Importance on Nutrient Dynamics in Soil and Plant; Springer: Singapore, 2020; Volume 2. [Google Scholar]
  28. Bayabil, H.K.; Stoof, C.R.; Lehmann, J.C.; Yitaferu, B.; Steenhuis, T.S. Assessing the potential of biochar and charcoal to improve soil hydraulic properties in the humid Ethiopian Highlands: The Anjeni watershed. Geoderma 2015, 243–244, 115–123. [Google Scholar] [CrossRef]
  29. Shaaban, M.; Van Zwieten, L.; Bashir, S.; Younas, A.; Núñez-Delgado, A.; Chhajro, M.A.; Kubar, K.A.; Ali, U.; Rana, M.S.; Mehmood, M.A.; et al. A concise review of biochar application to agricultural soils to improve soil conditions and fight pollution. J. Environ. Manag. 2018, 228, 429–440. [Google Scholar] [CrossRef]
  30. Verheijen, F.G.; Zhuravel, A.; Silva, F.C.; Amaro, A.; Ben-Hur, M.; Keizer, J.J. The influence of biochar particle size and concentration on bulk density and maximum water holding capacity of sandy vs sandy loam soil in a column experiment. Geoderma 2019, 347, 194–202. [Google Scholar] [CrossRef]
  31. Godlewska, P.; Ok, Y.S.; Oleszczuk, P. The dark side of black gold: Ecotoxicological aspects of biochar and biochar-amended soils. J. Hazard. Mater. 2021, 403, 123833. [Google Scholar] [CrossRef]
  32. Koide, R.T.; Petprakob, K.; Peoples, M. Quantitative analysis of biochar in field soil. Soil Biol. Biochem. 2011, 43, 1563–1568. [Google Scholar] [CrossRef]
  33. Anawar, H.M.; Akter, F.; Solaiman, Z.M.; Strezov, V. Biochar: An Emerging Panacea for Remediation of Soil Contaminants from Mining, Industry and Sewage Wastes. Pedosphere 2015, 25, 654–665. [Google Scholar] [CrossRef]
  34. Xu, G.; Wei, L.L.; Sun, J.N.; Shao, H.B.; Chang, S.X. What is more important for enhancing nutrient bioavailability with biochar application into a sandy soil: Direct or indirect mechanism? Ecol. Eng. 2013, 52, 119–124. [Google Scholar] [CrossRef]
  35. Edeh, I.G.; Mašek, O. The role of biochar particle size and hydrophobicity in improving soil hydraulic properties. Eur. J. Soil Sci. 2022, 73, 1–14. [Google Scholar] [CrossRef]
  36. Alghamdi, A.G.; Alkhasha, A.; Ibrahim, H.M. Effect of biochar particle size on water retention and availability in a sandy loam soil. J. Saudi Chem. Soc. 2020, 24, 1042–1050. [Google Scholar] [CrossRef]
  37. Kinney, T.J.; Masiello, C.A.; Dugan, B.; Hockaday, W.C.; Dean, M.R.; Zygourakis, K.; Barnes, R.T. Hydrologic properties of biochars produced at different temperatures. Biomass- Bioenergy 2012, 41, 34–43. [Google Scholar] [CrossRef]
  38. Wang, J.; Wang, S. Preparation, modification and environmental application of biochar: A review. J. Clean. Prod. 2019, 227, 1002–1022. [Google Scholar] [CrossRef]
  39. Salgado, M.A.H.; Coba, S.J.A.; Tarelho, L.A.C. Simultaneous production of biochar and thermal energy using palm oil residual biomass as feedstock in an auto-thermal prototype reactor. J. Clean. Prod. 2020, 266, 121804. [Google Scholar] [CrossRef]
  40. Salgado, M.A.H.; Tarelho, L.A.; Matos, A.; Robaina, M.; Narváez, R.; Peralta, M.E. Thermoeconomic analysis of integrated production of biochar and process heat from quinoa and lupin residual biomass. Energy Policy 2017, 114, 332–341. [Google Scholar] [CrossRef]
  41. Vilas-Boas, A.C.M.; Tarelho, L.A.C.; Kamali, M.; Hauschild, T.; Pio, D.T.; Jahanianfard, D.; Gomes, A.P.D.; Matos, M.A. Biochar from slow pyrolysis of biological sludge from wastewater treatment: Characteristics and effect as soil amendment. Biofuels Bioprod. Biorefining 2021, 15, 1054–1072. [Google Scholar] [CrossRef]
  42. Watzinger, A.; Feichtmair, S.; Kitzler, B.; Zehetner, F.; Kloss, S.; Wimmer, B.; Zechmeister-Boltenstern, S.; Soja, G. Soil microbial communities responded to biochar application in temperate soils and slowly metabolized 13C-labelled biochar as revealed by 13C PLFA analyses: Results from a short-term incubation and pot experiment. Eur. J. Soil Sci. 2013, 65, 40–51. [Google Scholar] [CrossRef]
  43. Ali, S.; Rizwan, M.; Qayyum, M.F.; Ok, Y.S.; Ibrahim, M.; Riaz, M.; Arif, M.S.; Hafeez, F.; Al-Wabel, M.I.; Shahzad, A.N. Biochar soil amendment on alleviation of drought and salt stress in plants: A critical review. Environ. Sci. Pollut. Res. 2017, 24, 12700–12712. [Google Scholar] [CrossRef]
  44. Farhain, M.M.; Cheema, M.; Katanda, Y.; Nadeem, M.; Javed, B.; Thomas, R.; Saha, R.; Galagedara, L. Potential of developing podzolic soil-based potting media from wood ash, paper sludge and biochar. J. Environ. Manag. 2022, 301, 113811. [Google Scholar] [CrossRef] [PubMed]
  45. Ali, I.; Ullah, S.; He, L.; Zhao, Q.; Iqbal, A.; Wei, S.; Shah, T.; Ali, N.; Bo, Y.; Adnan, M.; et al. Combined application of biochar and nitrogen fertilizer improves rice yield, microbial activity and N-metabolism in a pot experiment. PeerJ 2020, 8, e10311. [Google Scholar] [CrossRef] [PubMed]
  46. de la Rosa, J.M.; Paneque, M.; Miller, A.Z.; Knicker, H. Relating physical and chemical properties of four different biochars and their application rate to biomass production of Lolium perenne on a Calcic Cambisol during a pot experiment of 79days. Sci. Total. Environ. 2014, 499, 175–184. [Google Scholar] [CrossRef] [PubMed]
  47. Zhao, X.; Wang, J.; Wang, S.; Xing, G. Successive straw biochar application as a strategy to sequester carbon and improve fertility: A pot experiment with two rice/wheat rotations in paddy soil. Plant Soil 2014, 378, 279–294. [Google Scholar] [CrossRef]
  48. Burrell, L.D.; Zehetner, F.; Rampazzo, N.; Wimmer, B.; Soja, G. Long-term effects of biochar on soil physical properties. Geoderma 2016, 282, 96–102. [Google Scholar] [CrossRef]
  49. Baronti, S.; Alberti, G.; Vedove, G.D.; Di Gennaro, F.; Fellet, G.; Genesio, L.; Miglietta, F.; Peressotti, A.; Vaccari, F.P. The Biochar Option to Improve Plant Yields: First Results from Some Field and Pot Experiments in Italy. Ital. J. Agron. 2010, 5, 3–12. [Google Scholar] [CrossRef]
  50. Gascó, G.; Cely, P.; Paz-Ferreiro, J.; Plaza, C.; Méndez, A. Relation between biochar properties and effects on seed germination and plant development. Biol. Agric. Hortic. 2016, 32, 237–247. [Google Scholar] [CrossRef]
  51. ISO 14240-2; Soil Quality-Determination of Soil Microbial Biomass. ISO: Geneva, Switzerland, 1997; Volume 997.
  52. Tran, T.S.; Simard, R.R. Mehlich III- Extractable Elements. In Soil Sampling and Methods of Analysis; Lewis Publishers: Boca Raton, FL, USA, 1993; pp. 43–48. [Google Scholar]
  53. ISO 10390:2005(E); Soil Quality-Determination of pH. ISO: Geneva, Switzerland, 2005; p. 3.
  54. ISO 11265:1994; Soil Quality-Determination of the Specific Electrical Conductivity. ISO: Geneva, Switzerland, 1996.
  55. Zhang, Y.-W.; Wang, K.-B.; Wang, J.; Liu, C.; Shangguan, Z.-P. Changes in soil water holding capacity and water availability following vegetation restoration on the Chinese Loess Plateau. Sci. Rep. 2021, 11, 1–11. [Google Scholar] [CrossRef]
  56. Yuan, Y.; Bolan, N.; Prévoteau, A.; Vithanage, M.; Biswas, J.K.; Ok, Y.S.; Wang, H. Applications of biochar in redox-mediated reactions. Bioresour. Technol. 2017, 246, 271–281. [Google Scholar] [CrossRef]
  57. Verheijen, F.; Jeffery, S.; Bastos, A.C.; Van Der Velde, M.; Diafas, I. Biochar Application to Soils: A Critical Scientific Review of Effects on Soil Properties. Process. Funct. 2010, 8, 4. [Google Scholar]
  58. Dhar, S.A.; Sakib, T.U.; Hilary, L.N. Effects of pyrolysis temperature on production and physicochemical characterization of biochar derived from coconut fiber biomass through slow pyrolysis process. Biomass- Convers. Biorefinery 2022, 12, 2631–2647. [Google Scholar] [CrossRef]
  59. Batista, E.M.C.C.; Shultz, J.; Matos, T.T.S.; Fornari, M.R.; Ferreira, T.M.; Szpoganicz, B.; de Freitas, R.A.; Mangrich, A.S. Effect of surface and porosity of biochar on water holding capacity aiming indirectly at preservation of the Amazon biome. Sci. Rep. 2018, 8, 1–9. [Google Scholar] [CrossRef] [PubMed]
  60. Kloss, S.; Zehetner, F.; Dellantonio, A.; Hamid, R.; Ottner, F.; Liedtke, V.; Schwanninger, M.; Gerzabek, M.H.; Soja, G. Characterization of Slow Pyrolysis Biochars: Effects of Feedstocks and Pyrolysis Temperature on Biochar Properties. J. Environ. Qual. 2012, 41, 990–1000. [Google Scholar] [CrossRef]
  61. Laghari, M.; Mirjat, M.S.; Hu, Z.; Fazal, S.; Xiao, B.; Hu, M.; Chen, Z.; Guo, D. Effects of biochar application rate on sandy desert soil properties and sorghum growth. CATENA 2015, 135, 313–320. [Google Scholar] [CrossRef]
  62. Agegnehu, G.; Bass, A.M.; Nelson, P.N.; Bird, M.I. Benefits of biochar, compost and biochar–compost for soil quality, maize yield and greenhouse gas emissions in a tropical agricultural soil. Sci. Total. Environ. 2016, 543, 295–306. [Google Scholar] [CrossRef] [PubMed]
  63. Chan, K.Y.; Van Zwieten, L.; Meszaros, I.; Downie, A.; Joseph, S. Agronomic values of greenwaste biochar as a soil amendment. Soil Res. 2007, 45, 629–634. [Google Scholar] [CrossRef]
  64. Farhangi-Abriz, S.; Torabian, S. Effect of biochar on growth and ion contents of bean plant under saline condition. Environ. Sci. Pollut. Res. 2018, 25, 11556–11564. [Google Scholar] [CrossRef] [PubMed]
Figure 1. Values of the (a) proximate and (b) elemental analysis of biochar produced at 450 °C and 550 °C.
Energies 16 07645 g001
Figure 2. Water-holding capacity of biochar incubated in soil compared to the negative control (dotted line).
Energies 16 07645 g002
Figure 3. Values of (a) pH and (b) electrical conductivity for the treatment mixtures assorted by application rate (3%, 6%, and 10% (w/w), which correspond to the blue, orange, and grey columns, respectively), particle size (S < 0.5 mm, M = [0.5, 3.15], and L > 3.15 mm), and pyrolysis temperatures, with the control soil as a reference (black column).
Energies 16 07645 g003
Figure 4. Plant nutrient element concentrations in the soil treatments assorted by particle size (S < 0.5 mm, M = [0.5, 3.15], and L > 3.15 mm, corresponding to the blue, orange, and grey columns, respectively); application rate; and pyrolysis temperatures: (a) K, (b) Mg (B), (c) Ca, (d) Na, and (e) P, with the control soil as a reference (black column).
Energies 16 07645 g004
Table 1. Organic matter (OM), pH, electrical conductivity (EC), bulk density (BD), water-holding capacity (WHC), and plant nutrient elements of the studied soil.
ParametersSoil
pH3.86 ± 0.09
EC (μS∙cm−1)6.3 ± 0.3
OM (%)1.0 ± (4.0 × 10⁻²)
WHC (%)16 ± 3
BD (g∙cm−3)1.5 ± (4.5 × 10⁻²)
Plant nutrient elements (mg∙kg−1db *)P4.96 ± 0.08
Ca108 ± 8
Mg20 ± 1
K9.6 ± 0.5
Na11 ± 4
* kg of soil on a dry basis.
Table 2. Pearson correlation coefficients between the dependent variables of pH, EC, and plant nutrient elements.
pHECPCaMgKNa
pH 0.501 **0.595 **0.820 **0.645 **0.724 **0.220
EC0.501 ** 0.2690.335 *0.330 *0.692 **0.224
P0.595 **0.269 0.808 **0.576 **0.2870.028
Ca0.820 **0.335 *0.808 ** 0.787 **0.434 *0.131
Mg0.645 **0.330 *0.576 **0.787 ** 0.550 **0.442 **
K0.724 **0.692 **0.2870.434 *0.550 ** 0.573 **
Na0.2200.2240.0280.1310.442 **0.573 **
* Correlation is significant at the 0.05 level (2-tailed); ** correlation is significant at the 0.01 level (2-tailed).
Disclaimer/Publisher’s Note: The statements, opinions and data contained in all publications are solely those of the individual author(s) and contributor(s) and not of MDPI and/or the editor(s). MDPI and/or the editor(s) disclaim responsibility for any injury to people or property resulting from any ideas, methods, instructions or products referred to in the content.

