Article

Shell Shape Influence on Latent Heat Thermal Energy Storage Performance during Melting and Solidification

AGH University of Krakow, Faculty of Mechanical Engineering and Robotics, Department of Power Systems and Environmental Protection Facilities, al. A. Mickiewicz 30, 30-059 Krakow, Poland
*
Author to whom correspondence should be addressed.
Energies 2023, 16(23), 7822; https://doi.org/10.3390/en16237822
Submission received: 8 November 2023 / Revised: 23 November 2023 / Accepted: 25 November 2023 / Published: 28 November 2023
(This article belongs to the Collection Energy Efficiency and Environmental Issues)

Abstract

:
Phase-change materials have various applications across industries from thermal energy storage through automotive battery temperature management systems to thermal stabilisation. Many of these applications are shell and tube structures with different shell shapes. However, it is not yet known how the shape of the shell affects the melting, solidification times, and heat transport processes in such structures. To fill this research gap, seventeen shell shapes/orientations were compared using a simulation study. The well-known and validated enthalpy porosity algorithm implemented in the Fluent 2021R2 software was used. The numerical calculations were preceded by the measurement of thermal conductivity, phase change enthalpy, and specific heat during melting and solidification of the phase-change material. The shortest melting time was achieved for a semi-circular shell shape in the downward position, which was 44% shorter than the reference circular case. The shortest solidification times were recorded for an isosceles trapezium in an upward orientation relative to the reference circular case. Therefore, it is possible to significantly reduce the melting time in shell-and-tube systems as a result of the appropriate selection of the shell shape.

1. Introduction

The effective management and efficient storage of energy are crucial for maximising the utilisation of renewable energy sources (RESs), which are inherently unpredictable. In recent years, there has been a growing recognition of the importance of thermal energy storage (TES) in both residential and industrial thermal systems. One promising technology that allows for compact yet high-capacity energy storage, with a high energy density, involves the simultaneous utilisation of sensible heat and latent heat through a solid–liquid phase change. Phase-change materials (PCMs) have various applications across industries, including automotive battery temperature management systems [1], spacecraft thermal control [2], temperature stabilisation systems in buildings [3,4], electronic equipment, pharmaceuticals, and food industries [5]. The main advantage of PCMs lies in their ability to store a large amount of energy within a narrow temperature range. However, the low thermal conductivity of these materials significantly hampers the rate of heat transfer during the melting and solidification processes, which is the most significant drawback. This limitation also restricts their potential applications. As a result, ongoing research efforts are focused on developing techniques to enhance heat transfer and effectively overcome this challenge [6].
There are three primary strategies for the passive enhancement of heat transfer rates in PCM-based systems. The first approach involves increasing the surface area available for heat transfer by incorporating fins [6,7,8,9] or encapsulations [10,11]. The second approach focuses on enhancing the effective thermal conductivity of PCMs by introducing nanoparticles [12,13,14] or porous media like metal foams [15]. The third approach aims to improve process uniformity, which can be achieved by using multiple PCMs with different melting temperatures [16], enclosing PCMs in cavities or cells such as honeycomb structures [17], or optimising the process parameters [18]. However, each of these methods for enhancing heat transfer has its own drawbacks. A dense arrangement of fins reduces the energy density of the system and limits the utilisation of convection currents [19]. Similarly, porous structures face similar challenges. The addition of nanoparticles introduces difficulties in achieving uniform dispersion and preventing sedimentation during phase-change cycles. Additionally, this approach can be relatively expensive.
The PCM can mainly be enclosed in cylindrical [20], rectangular [21], spherical [22,23], trapezate [24], shell-and-tube [25,26], triplex-tube [19,27,28], and parallelepiped [29,30] containers [31,32]. In recent years, researchers have focused on comparing various geometric solutions and their impact on the heat transfer rate. Zivkovic and Fujii [21] investigated the use of a rectangular shape for a PCM energy storage container, and they achieved half the melting time compared to a cylindrical container with the same heat transfer surface area and PCM volume. The studies were extended by Vyshak and Jilani [20], who demonstrated the advantage of using a shell-and-tube design in terms of reducing the melting time. This effect is further enhanced as the amount of PCM in the containers increases. Ding et al. [26] developed interesting geometric variants for rectangular, cylindrical, and shell-and-tube containers. The results of the research showed that, despite the fact that natural convection intensity is the highest in cylindrical storage, the shell-and-tube LHTES achieves the highest heat transfer rate due to the lowest thermal resistance. In addition, shell-and-tube construction allows the highest exergy efficiency to be achieved.
The most prevalent shell shape found in shell-and-tube designs is typically circular. The primary reason a circular shape is preferred over other geometric variants is due to its minimal perimeter. Consequently, for the same volume of the PCM, circular cylindrical shells exhibit the smallest surface area, resulting in minimal thermal energy loss to the surroundings during melting [33]. Evaluations of the thermal performance of LHTES units with circular shells were presented in, among others [25,34]. While circular shapes are commonly employed in shell-and-tube constructions, numerous studies have explored the utilisation of alternative shell shapes. Faghani et al. [35] conducted an analysis of the melting process for both circular and elliptical shapes of the shell and central tube in various configurations. The findings indicate that, regardless of the tube shape, the best configuration for the shell is a horizontally oriented ellipse. This particular arrangement enhances heat absorption and reduces the melting time. However, while such a shape may be effective for structures serving as heat exchangers, it would not be practical for large periodic arrangements. Pourakabar and Rabienataj Darzi [36] conducted a comparison study of circularly and elliptically shaped shells in the context of multi-tube thermal energy storage. The study revealed that the highest melting and solidification rates are achieved with the circular shape of the shell. However, it is important to emphasise that the charging and discharging efficiency primarily depends on the number and arrangement of the inner tubes. In [37], it was demonstrated that the use of a vertically oriented elliptical tube instead of a circular one reduces the melting time. Nevertheless, it was found to be ineffective in the solidification process. Khillarkar et al. [38] presented a numerical study on the free-convection-dominated melting of a pure PCM within a horizontal, square, annular container. Thermal stratification was achieved in the upper part of the enclosure as a result of the energy supplied to the system being primarily carried upward by the free convective flow within the liquid fraction of the PCM. Mao et al. [39] examined the influence of the length-to-diameter ratio for a rectangular container in a shell-and-tube construction. They presented design and optimisation guidelines for rectangular LHTES systems. Bouzennada et al. [40] undertook a three-dimensional numerical investigation of a PCM enhanced with nanoparticles. The PCM was enclosed within a cubic container, incorporating an inner tube located in the lower section. The study unveiled a substantial improvement in the melting speed and stored energy, attributed to the heightened thermal conductivity resulting from the presence of nanoparticles. The utilisation of a three-dimensional model facilitated the observation of the impact of irregular thermal conditions on the molten zone surrounding the heat transfer fluid (HTF) tube. Investigations on a rectangular capsule were carried out in the study [41]. The results indicate that incorporating fins in the lower section of the PCM capsule enhances the heat transfer area, particularly in regions where conduction is the predominant mode of heat transfer. In [42], the authors demonstrated that the use of two eccentric tubes with a rectangular shell reduced the melting time compared to concentric tubes with a circular shell. A rectangular shell may lead to faster solidification relative to the circular shape, but this is primarily due to the increased heat loss rate resulting from the larger surface area of the shell. Additional findings regarding the utilisation of multi-tube designs in rectangular containers are described in [43]. Tabassum et al. [44] conducted a numerical study using the boundary-fitted coordinate (BFC) technique to simulate the melting process of PCMs in a horizontal, inverse triangular annulus. Based on the obtained results, it was found that in the bottom apex region, the melting process progresses very slowly after a specific time. The vertically eccentric position of the inner tube provides the maximum storage capacity. Another performance enhancement of a multi-tube LHTES unit with triangular shell was discussed in [45].
A unique semi-circular shell shape in a shell-and-tube construction was presented in [33]. It was found that the melting rate enhancement was greater when the inner tube was positioned closer to the bottom surface of the outer shell. The semi-circular LHTES system melted the PCM completely in nearly half the time compared to the circular design. Additionally, for an equal PCM volume and a melting time duration of 80 min, the thermal energy stored in the PCM was 12% higher in the case of the semi-circular design compared to the circular variant. Li et al. [46] conducted a numerical investigation on the solidification process of a hexagonal shell-and-tube LHTES unit. The research focused on analysing the dynamic response of temperature and heat release, as well as the evolution of the solidification front in construction with Koch-fractal fins. Another triplex-tube design, featuring hexagonal tubes, was presented in [47]. Maneengam et al. [48] analysed the system entropy and the optimisation of irreversibility for an octagonal shell-and-tube thermal energy storage microsystem. Alizadeh et al. [49] developed a triplex-tube design for an octagonal storage unit. None of the aforementioned papers that contain hexagonal or octagonal designs discuss the obtained results in relation to the used shell shape or reference circular unit with an equivalent PCM volume and convective heat transfer area. Shahsavar et al. [50] presented a vertical double-pipe with a sinusoidal wavy wall. They examined various parameters, including wavelength and wave amplitude, to determine the optimal geometry for both the melting and solidification processes. The solidification and melting times decrease with an increase in wave amplitude and Reynolds number, and a decrease in wavelength. The triplex-tube variant with sinusoidal wavy walls was discussed in [51]. Alizadeh et al. [52] conducted an optimisation study of a wavy shell unit with curved fins. The appropriate geometric parameters of the fins enhance the thermal penetration depth towards the outer wavy wall, resulting in an increased rate of heat transfer and reduced the full solidification time. A three-dimensional verging shell shape was analysed in our previous research [53,54]. It was found that helical-coiled shell structures and spiral fins significantly reduce PCM melting and solidification times.
There are only a few studies that compare different shell shapes under the same conditions. Qaiser et al. [55] investigated the enhancement in melting performance in multi-tube thermal energy storage systems using only circular, elliptical, and triangle shells. Both elliptical and triangle designs had the potential to reduce the PCM melting time by up to 50% compared to the base case. Unfortunately, the study did not examine the solidification process. A comparison of different shapes of shells in the LHTES system was also presented by Hekmat et al. [56]. The authors limited their investigation to research on the impact of circular, elliptical, square, triangular, and trapezate shell geometries on the melting and solidification phenomena. The best performance in terms of melting was achieved with a downward trapezate shape, while a horizontal ellipse was the optimal choice for the solidification process.
Based on the state of the art presented here, it is evident that investigating shell shapes in shell-and-tube structures represents an interesting research activity for enhancing the heat transfer process in LHTES units. However, to the best of our knowledge, this particular topic has not received extensive discussion, and a comprehensive comparison of proposed shell shapes is lacking. It remains unclear how different shapes and orientations of the shell impact melting and solidification times, as well as heat transport processes. Therefore, we propose to fill this research gap. In this study, the novelty lies in the extended thermal performance comparative analysis of seventeen shell shape cases. We calculated and compared melting and solidification times, liquid fraction, temperature distributions, average heat flux, and specific enthalpy for various shell shapes, including circular, semi-circular, square, rectangular, ellipse, triangle, hexagonal, octagonal, and trapezium, each in two orientations. It is also necessary to study both the melting and solidification processes because some heat transfer enhancement techniques shorten the melting time but significantly prolong the solidification time. This comparison analysis is also crucial for building compact modular systems with high energy density.

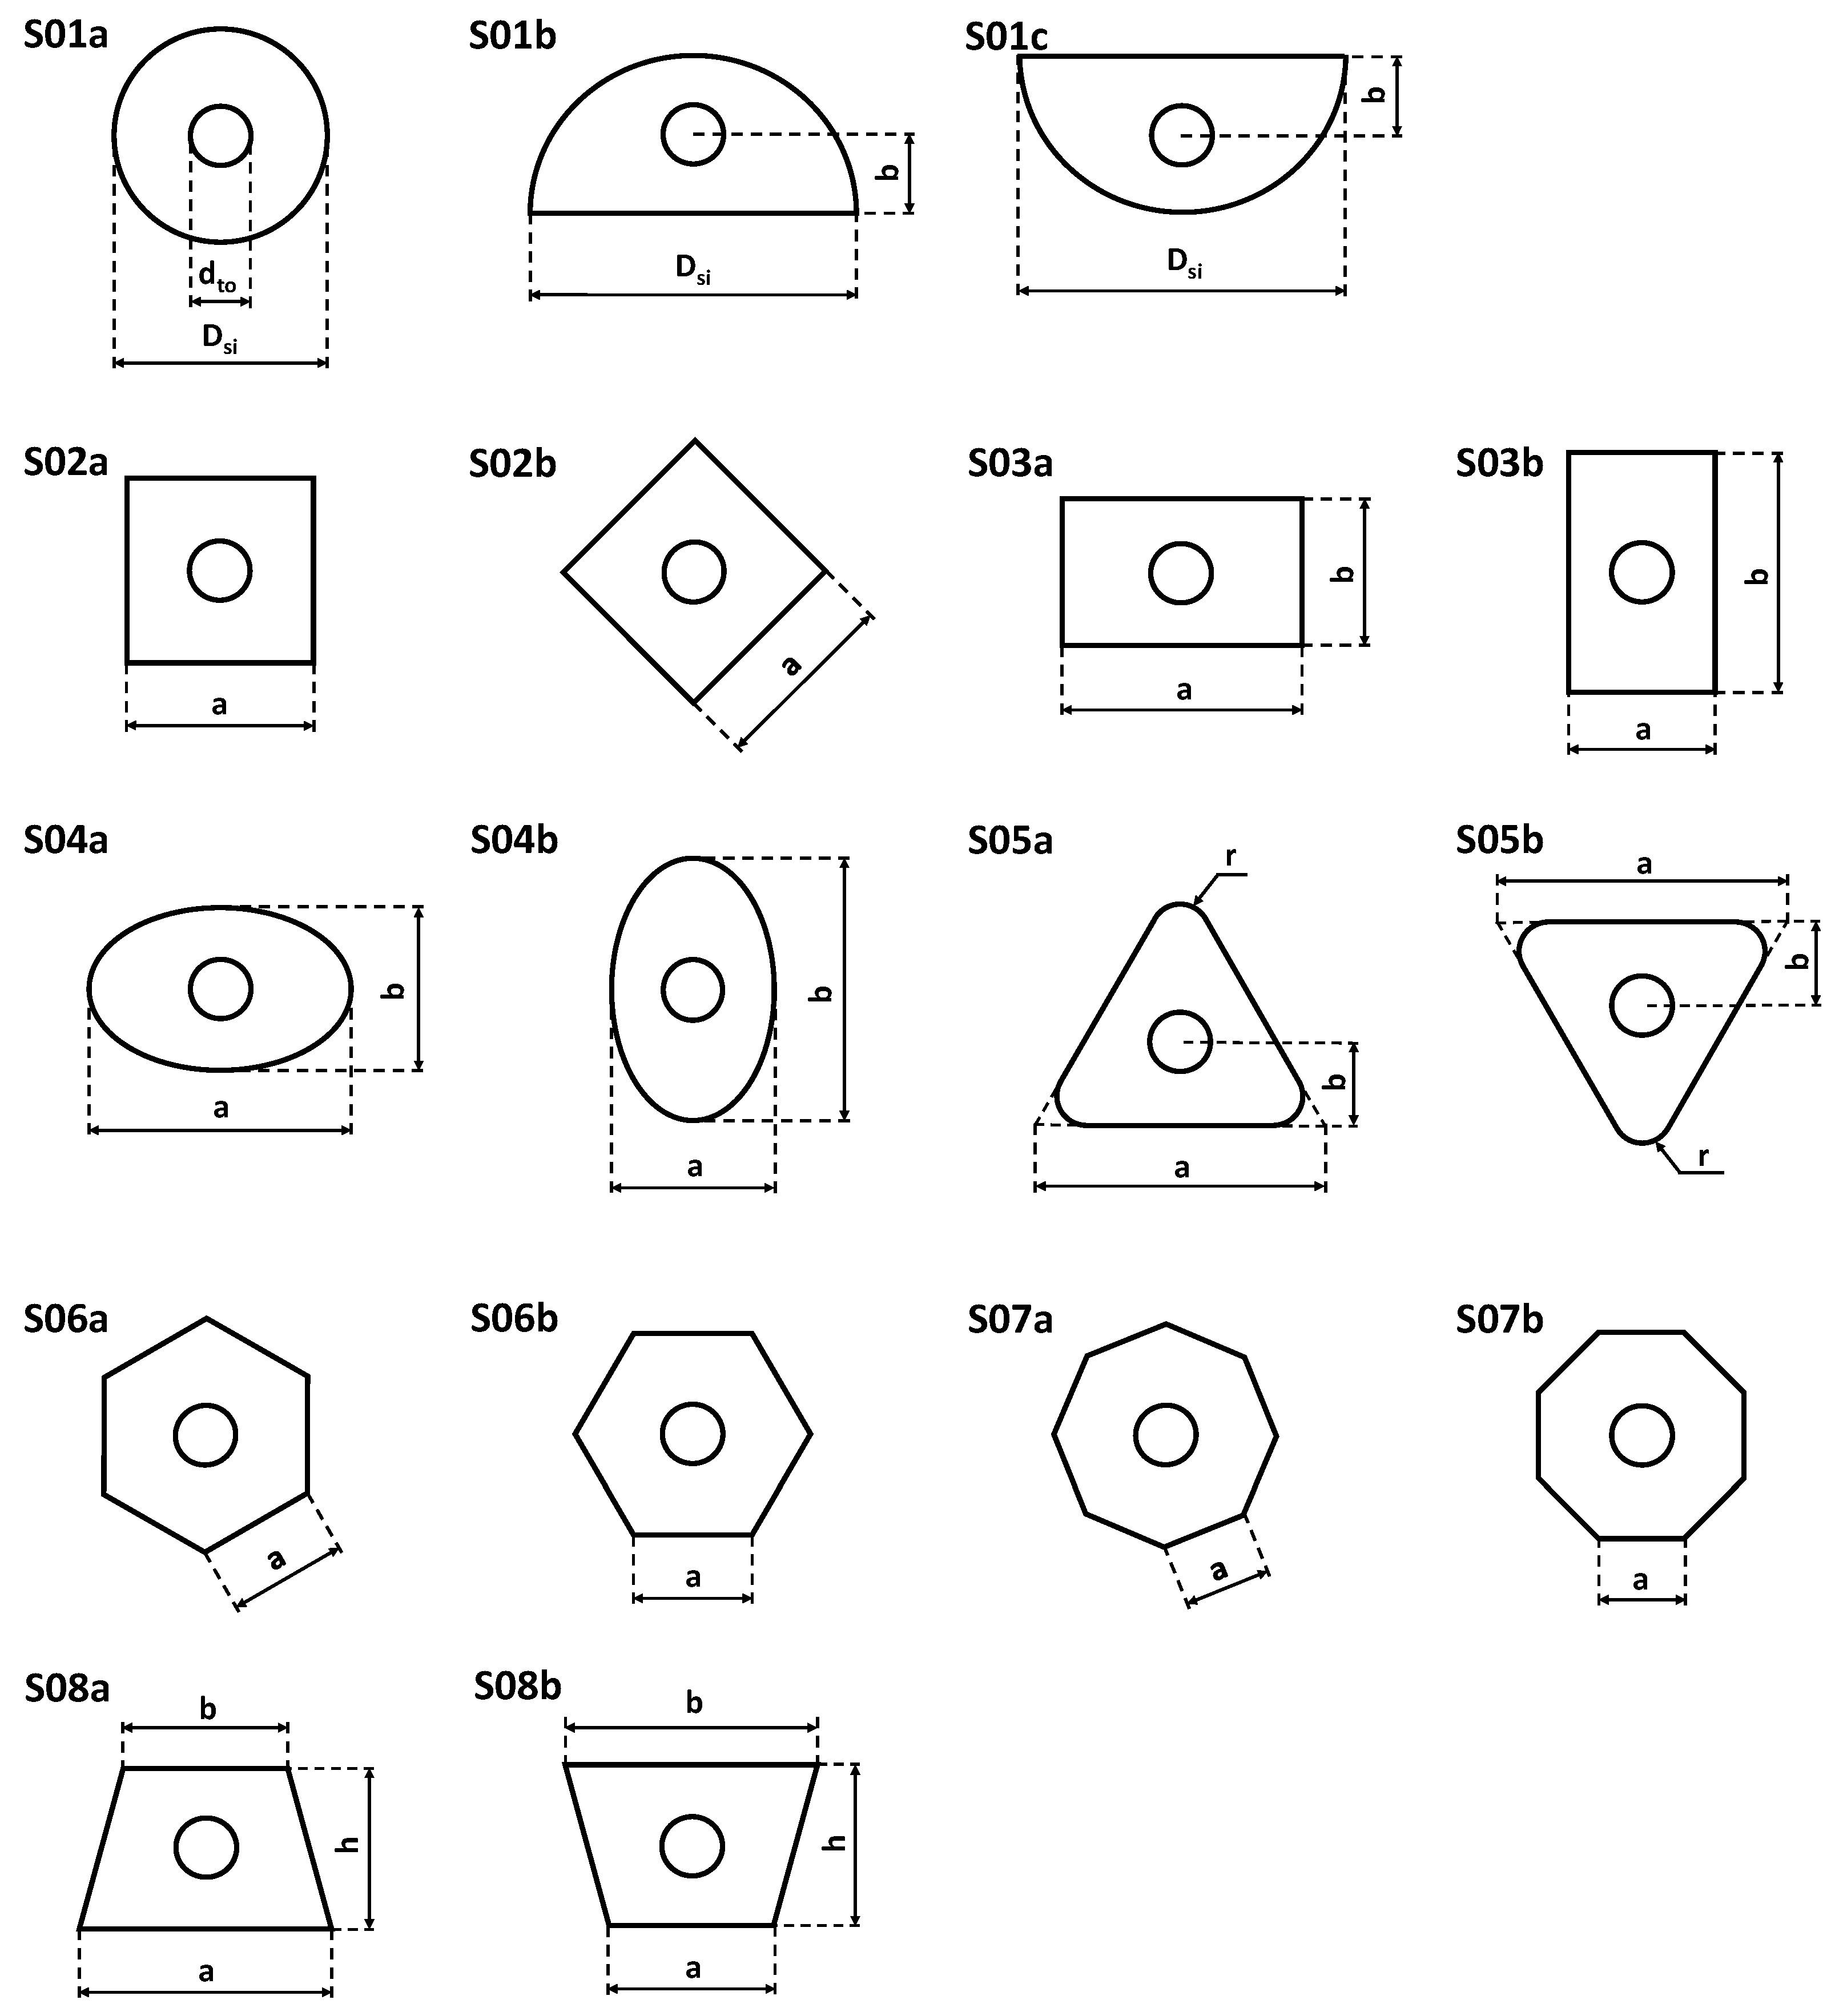
2. Research Objects and Computational Domains

The subject of the research is shell-and-tube LHTES units, with a focus on exploring different shell shapes to address their thermal performance. The shell-and-tube construction comprises an inner tube and an insulated outer shell, with a space between these walls filled with a PCM. The inner tube facilitates the flow of heat transfer fluid (HTF), which, based on its temperature, induces the melting or solidification of the PCM, consequently enabling the charging or discharging of the TES.
The basic design is a horizontal shell-and-tube LHTES unit with a circular shell (S01a Figure 1). It will be used as a reference structure for literature research, model validation, and comparative analysis of results with other shapes that will undergo evaluation. The external diameter of the inner copper tube is 22 mm, and its thickness is 1 mm. To ensure an equal heat transfer surface area, the dimensions of the inner tube remain identical across all the considered models. According to the studies presented in [25], the most suitable shell-to-tube diameter ratio for a horizontal circular LHTES unit, considering both melting and solidification processes, is 4. Therefore, the external diameter of the shell was determined to be 88 mm. Additionally, the 2D domain was assumed as a compromise to reduce computation time.
The other examined shell shapes are depicted in Figure 1. Due to the equal annulus surface area (57.04 ± 0.02 cm2) in the cross-sectional profile, each LHTES unit contains the same mass of PCM. The geometric models S01b and S01c pertain to semi-circular shell shapes in the upward and downward positions, respectively. Model S02a is a square shape that is also considered in a rotated position by an angle of 45 degrees (S02b). The ratio of the lengths of the edges of the rectangular shapes (S03a, S03b), and the semi-axes of the ellipses (S04a, S04b) is 1.64 based on the research presented in [55]. The shapes based on an equilateral triangle with rounded corners are presented in the upward (S05a) and downward (S05b) positions, respectively. The centre of the inner tube is located at the centroid of the triangle. The next shell shapes are hexagonal (S06a, S06b) and octagonal (S07a, S07b), oriented with a corner or an edge facing upward. The last shape to be analysed is an isosceles trapezium in both the upward (S08a) and downward (S08b) orientations. The dimensional proportions for the trapezium shape were sourced from [56]. The geometric parameters for all cases are compiled in Table 1.
We addressed shell shapes that have the potential for constructing compact modular systems with high energy density and we also considered shapes that were previously proposed as thermally efficient but were not compared with others. The shell shapes like a square (S02a,b), rectangle (S03a,b), hexagon (S06a,b), triangle with alternating orientation (S05a,b), and isosceles trapezium with alternating orientation were identified as potentially efficient for constructing compact modular systems.

3. Thermophysical Property Measurements

The material selected for the research was a commercially available organic PCM designated as RT54HC (Rubitherm Technologies GmbH, Berlin, Germany). It is characterised by a narrow phase-change temperature range during heating and cooling, high phase-change enthalpy, limitation of supercooling effects, non-toxicity, low volumetric expansion, and stable performance throughout the phase-change cycles.

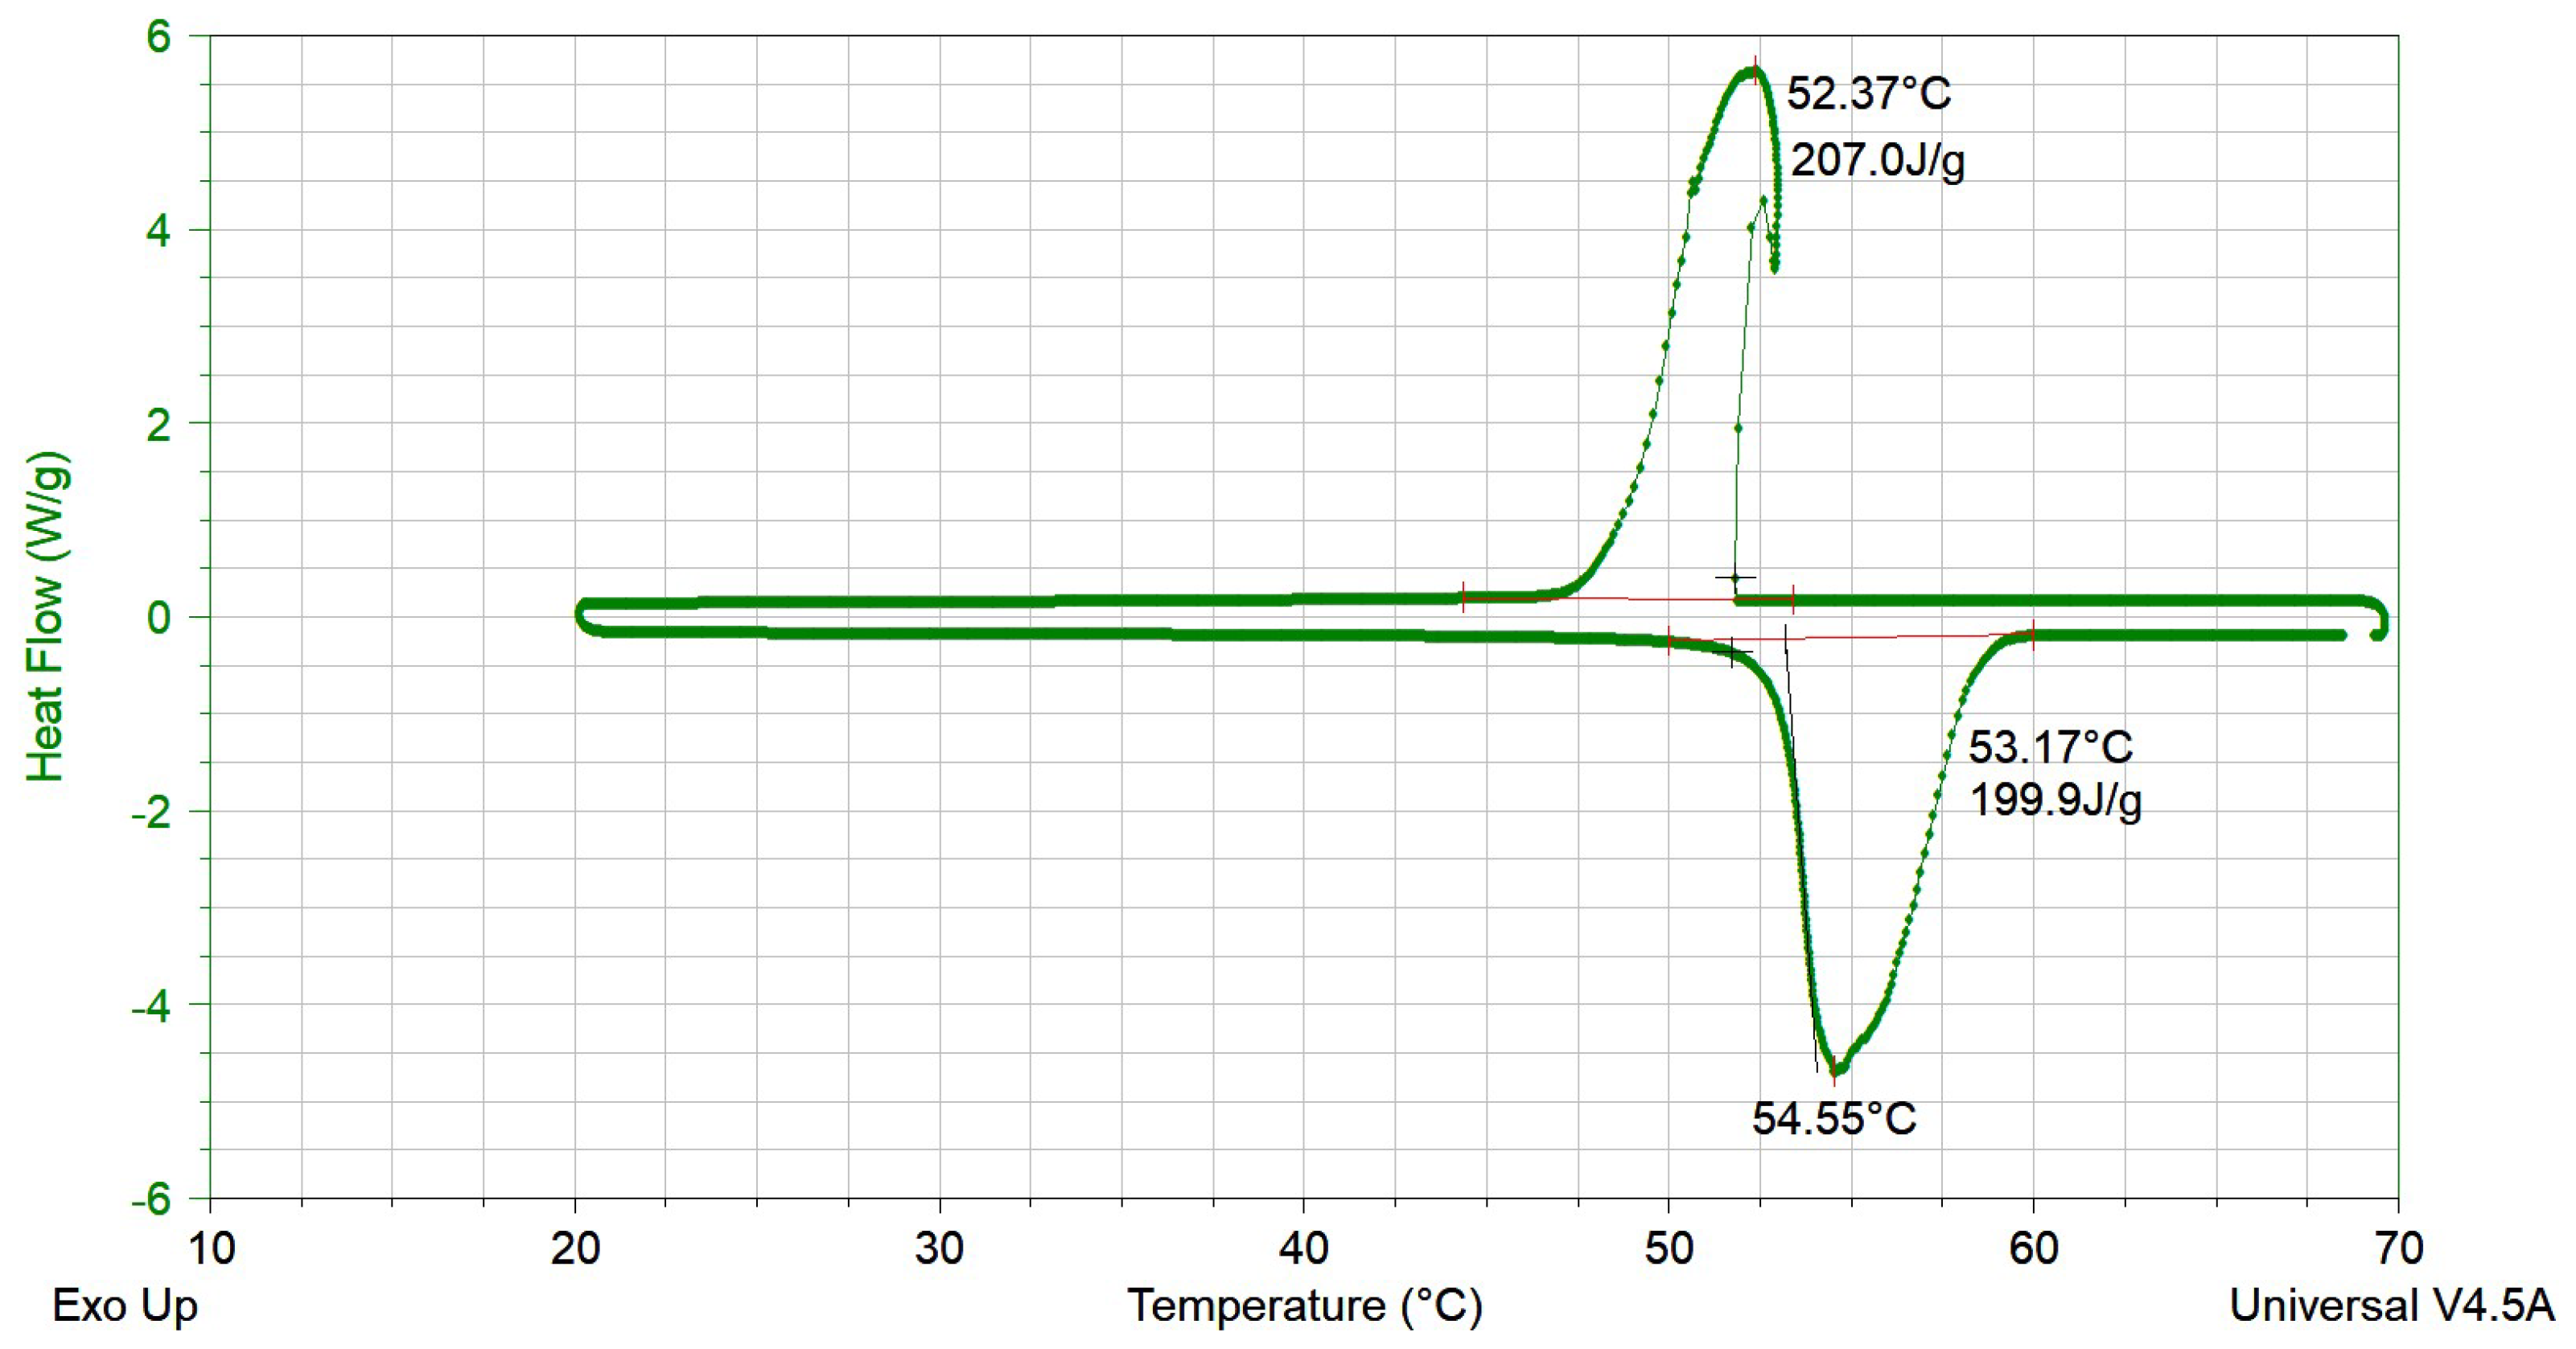
3.1. Differential Scanning Calorimetry Measurements

We conducted measurements using differential scanning calorimetry (DSC) for the melting and solidification processes (Figure 2). The TA Instruments Q2000 V24.11 device was used with a temperature rate of 5 K/min in the range of 20–70 °C, employing two heating and cooling cycles. The protective gas was helium, the calibration was carried out using a metallic standard indium and the reference material was sapphire. According to the manufacturer’s specifications, the temperature measurement uncertainty is ± 1 °C. As a result, the heat flow versus temperature charts, the specific heat, the phase-change temperature, and the phase-change enthalpy were determined. Temperature-modulated DSC was employed to determine the specific heat for the solid and liquid states. The measurements were carried out several times in order to determine the average values of phase-change enthalpy and phase-change temperature.

3.2. Thermal Conductivity Measurements

The transient line heat source method was employed for measuring thermal conductivity. This transient method enables measurement during both the solid and liquid states of a PCM. The measurements were conducted under controlled temperature conditions for both the solid and liquid PCM. We employed a TEMPOS thermal properties analyser (METER Group, Inc., Pullman, WD, USA) equipped with a specialised measurement needle (KS-3) that generates only a small amount of heat. This allows a significant reduction in the influence of free convection (in the liquid state) during measurement, that could alter the reading. The measurement uncertainty was ± 10 % from 0.2–2.0 W/(m·K). The mean value from a series of measurements was assumed (Table 2).
The complete thermophysical properties of the organic PCM (RT54HC—Rubitherm) are presented in Table 2. Quantities such as the dynamic viscosity, density of solid/liquid phase, and thermal expansion coefficient were obtained from [57]. The RT54HC material was characterised by slight supercooling, hence different solidus/liquidus temperatures were used in the numerical calculations for melting and solidification.

4. Methods and Mathematical Description

The solution of the heat and mass transport phenomenon in the considered LHTES systems is a strongly coupled problem. The computation of the conjugate problem of heat transfer is further complicated by the presence of a moving boundary during the melting and solidification processes. In the initial phase of the melting process, conduction is the dominant phenomenon, followed by natural convection in the liquid PCM. However, during the solidification process, convection initially dominates but quickly gives way to conduction. The commonly known and widely used mathematical model describing these fundamental phenomena consists of a set of differential equations known as governing equations.

4.1. The Heat and Mass Transport Equations and Assumptions

The solution of the conjugate heat transfer problem coupled with a moving interface between the liquid and solid phase within a reasonable time but with good accuracy requires the introduction of reasonable simplifications. First of all, the flow is modelled as incompressible Newtonian flow. The PCM’s thermal expansion during melting and contraction during solidification, thermal radiative, and viscous dissipation are neglected. Natural convection is modelled using the Boussinesq approximation, wherein the density is treated as a constant value in all solved equations, except for the buoyancy term in the momentum equation. The buoyancy term is linearised according to Equation (3). The Rayleigh number spans from 0.65 × 10 6 to 11 × 10 6 across all cases, with no occurrences beyond the critical Rayleigh number threshold of R a < 10 8 [58,59]. Consequently, a laminar flow assumption is made for the liquid PCM. The well-known enthalpy–porosity approach [60,61] is used to model the mushy zone as a porous medium that operates as a partially solidified region. The PCM’s thermophysical properties are isotropic and constant vs. time and temperature variations. The governing equations are as follows:
  • The continuity equation:
    · v = 0
  • The momentum equation:
    v t + · ( v v ) = 1 ρ r e f ( p + μ 2 v + ρ g ) + S v
    where
    ρ = ρ r e f ( 1 β ( T T r e f ) )
    and ρ r e f = 825 kg m 3 , T r e f = 54.55 °C for melting, T r e f = 52.37 °C for solidification, and g = 9.81 m/s2.
  • The momentum source term S:
    S = A m u s h ( 1 α ) 2 ( α 3 + ϵ )
    where A m u s h = 10 5 , ϵ = 0.001
  • The thermal energy equation:
    ρ r e f h t + ρ r e f · ( v h ) = · ( k T )
    where
    h = h r e f + T r e f T c p d T + α l
    and the liquid fraction α :
    α = 0 if T < T s 1 if T > T l T T s T l T s if T s < T < T l
The assumed mathematical model allows for the determination of spatial and time distributions of the velocity, temperature, and liquid fraction in the presence of a moving solid–liquid interface.

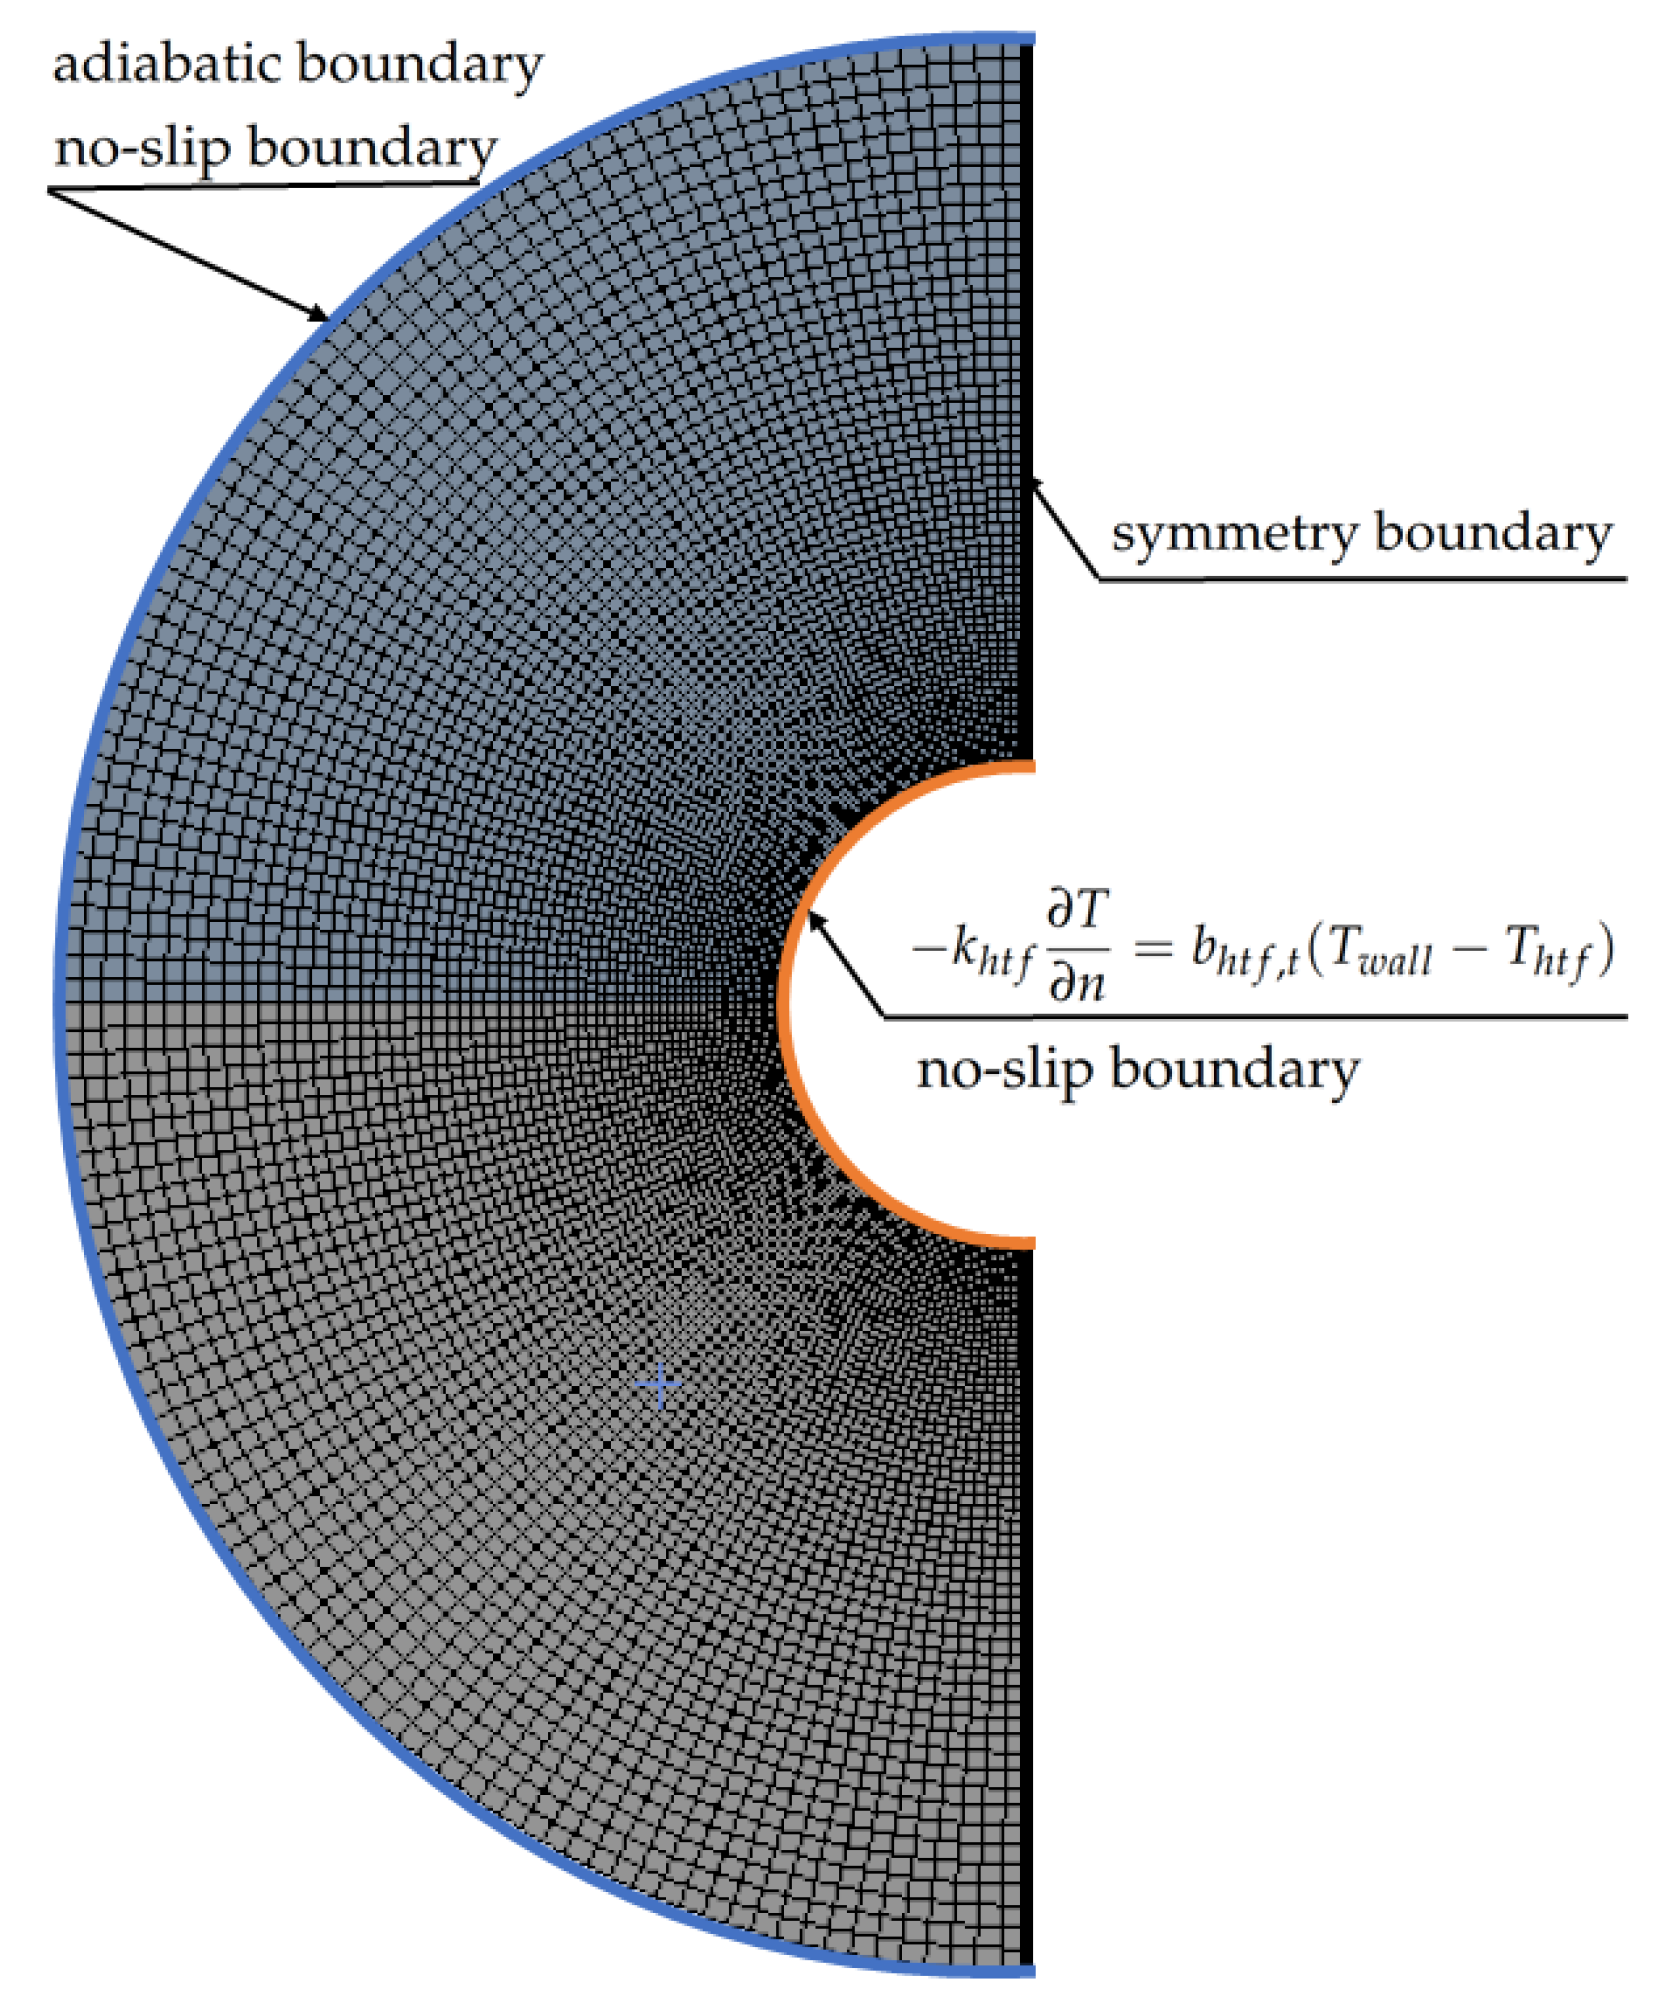
4.2. Initial and Boundary Conditions

In all of the analysed cases, the initial temperature of the entire domain is T m ( t = 0 ) = 30 °C during melting and T s ( t = 0 ) = 75 °C during solidification. The PCM has initial velocities of 0 m/s for both the melting and solidification processes. The boundary conditions were the same for all cases. The heat transfer fluid (HTF) is water, featuring a dynamic viscosity, density, and thermal conductivity that varies based on inlet temperature. The other thermophysical properties of water are maintained at constant values. To simulate heat transfer from HTF to the tube and through the tube, the convective boundary condition was assumed as in Equation (8):
k h t f T n = b h t f , t ( T w a l l T h t f )
where
b h t f , t = 1 R h t f , t 2 π r t o
In order to determine the heat transfer coefficients between the HTF and PCM, the thermal resistance was calculated. The thermal resistance between the HTF and the outer tube wall is defined by the advection of the HTF within the tube element as well as the heat conduction through the tube material (Equation (10)).
R h t f , t = R h t f + R t
Thermal resistance as a result of advection within a tube element is described by the following Equation (11):
R h t f = 1 b h t f 2 π r t i
and
b h t f = N u k h t f d t i
where the Nusselt number changes depending on the type of flow and HTF temperature ( T h t f , m = 75 °C for melting and T h t f , s = 30 °C) for solidification), and was defined in accordance with Petukhov–Gnielinski correlation for turbulent flow ( R e > 2300 ) in tubes [59] in the following way (13):
N u = f / 8 · ( R e 1000 ) · P r 1 + 12.7 · f / 8 · ( P r 2 / 3 1 )
where
f = ( 0.79 · l n ( R e ) 1.64 ) 2
Pr represents the Prandtl number, and the Reynolds number (Re) was determined as follows:
P r = c h t f μ h t f k h t f , R e = ρ h t f u d t i μ h t f
where c h t f = 4180 J/(kg · K), μ h t f = 0.000408 Pa · s, ρ h t f = 975 kg/m3, k h t f = 0.665 for T h t f , m , and μ h t f = 0.000797 Pa · s, ρ h t f = 995 kg/m3, k h t f = 0.619 for T h t f , s . The thermal resistance as a result of conduction within the tube material is determined by the following relation (16):
R t = l n r t o r t i 2 π k t
The HTF mass flow during melting and solidification was assumed to be 3.15 l min . Based on these data and calculations the heat transfer coefficients b h t f , t (9) were determined to be 1511 W m 2 K and 938 W m 2 K for the melting and solidification processes, respectively. The walls restricting the flow were subject to the no-slip boundary condition. The adiabatic boundary condition was assumed at the outer shell edge. The symmetry boundary condition was assumed at the inner vertical edge due to the symmetry of the geometrical model, boundary conditions, and the phenomenon (Figure 3).

4.3. Computational Methods and Algorithms

The set of differential equations with assumed initial and boundary conditions was solved using the finite volume method. The ANSYS Fluent 2021R1 software, utilising the pressure-base solver, was employed for the calculation. To couple the continuity and momentum equations, the well-known semi-implicit method for pressure linked equations (SIMPLE) procedure was utilised. The discretisation scheme employed for pressure was PRESTO!, while for momentum and energy, the third-order MUSCL scheme was employed. Gradients were computed using the least squares cell-based method, as it is less computationally expensive compared to node-based gradient computation. The convergence criteria for the continuity equation and velocity components were set at 10 5 , while for the energy equation the criterion was set to 10 8 . Temporal discretisation was achieved using a second-order implicit time integration algorithm, which offers stability with respect to the time step. The specific time step used varied between 0.05 and 0.1 s, depending on the analysed cases. The simulation covered 30,000 s (18,000 s for S01c, 36,000 s for S02b and 48,000 s for S03b, S04b, S05a,b) of the charging process (PCM melting) and 50,000 s (56,000 s for S03b, S04b, S05a and 62,000 for S01c) of discharging (PCM solidification). The supercomputer ‘‘ARES’’ from ACK Cyfronet Krakow was used. The most computationally expensive task was solved using an Intel Xeon Platinum-8268 with 24 cores and lasted 194 h.

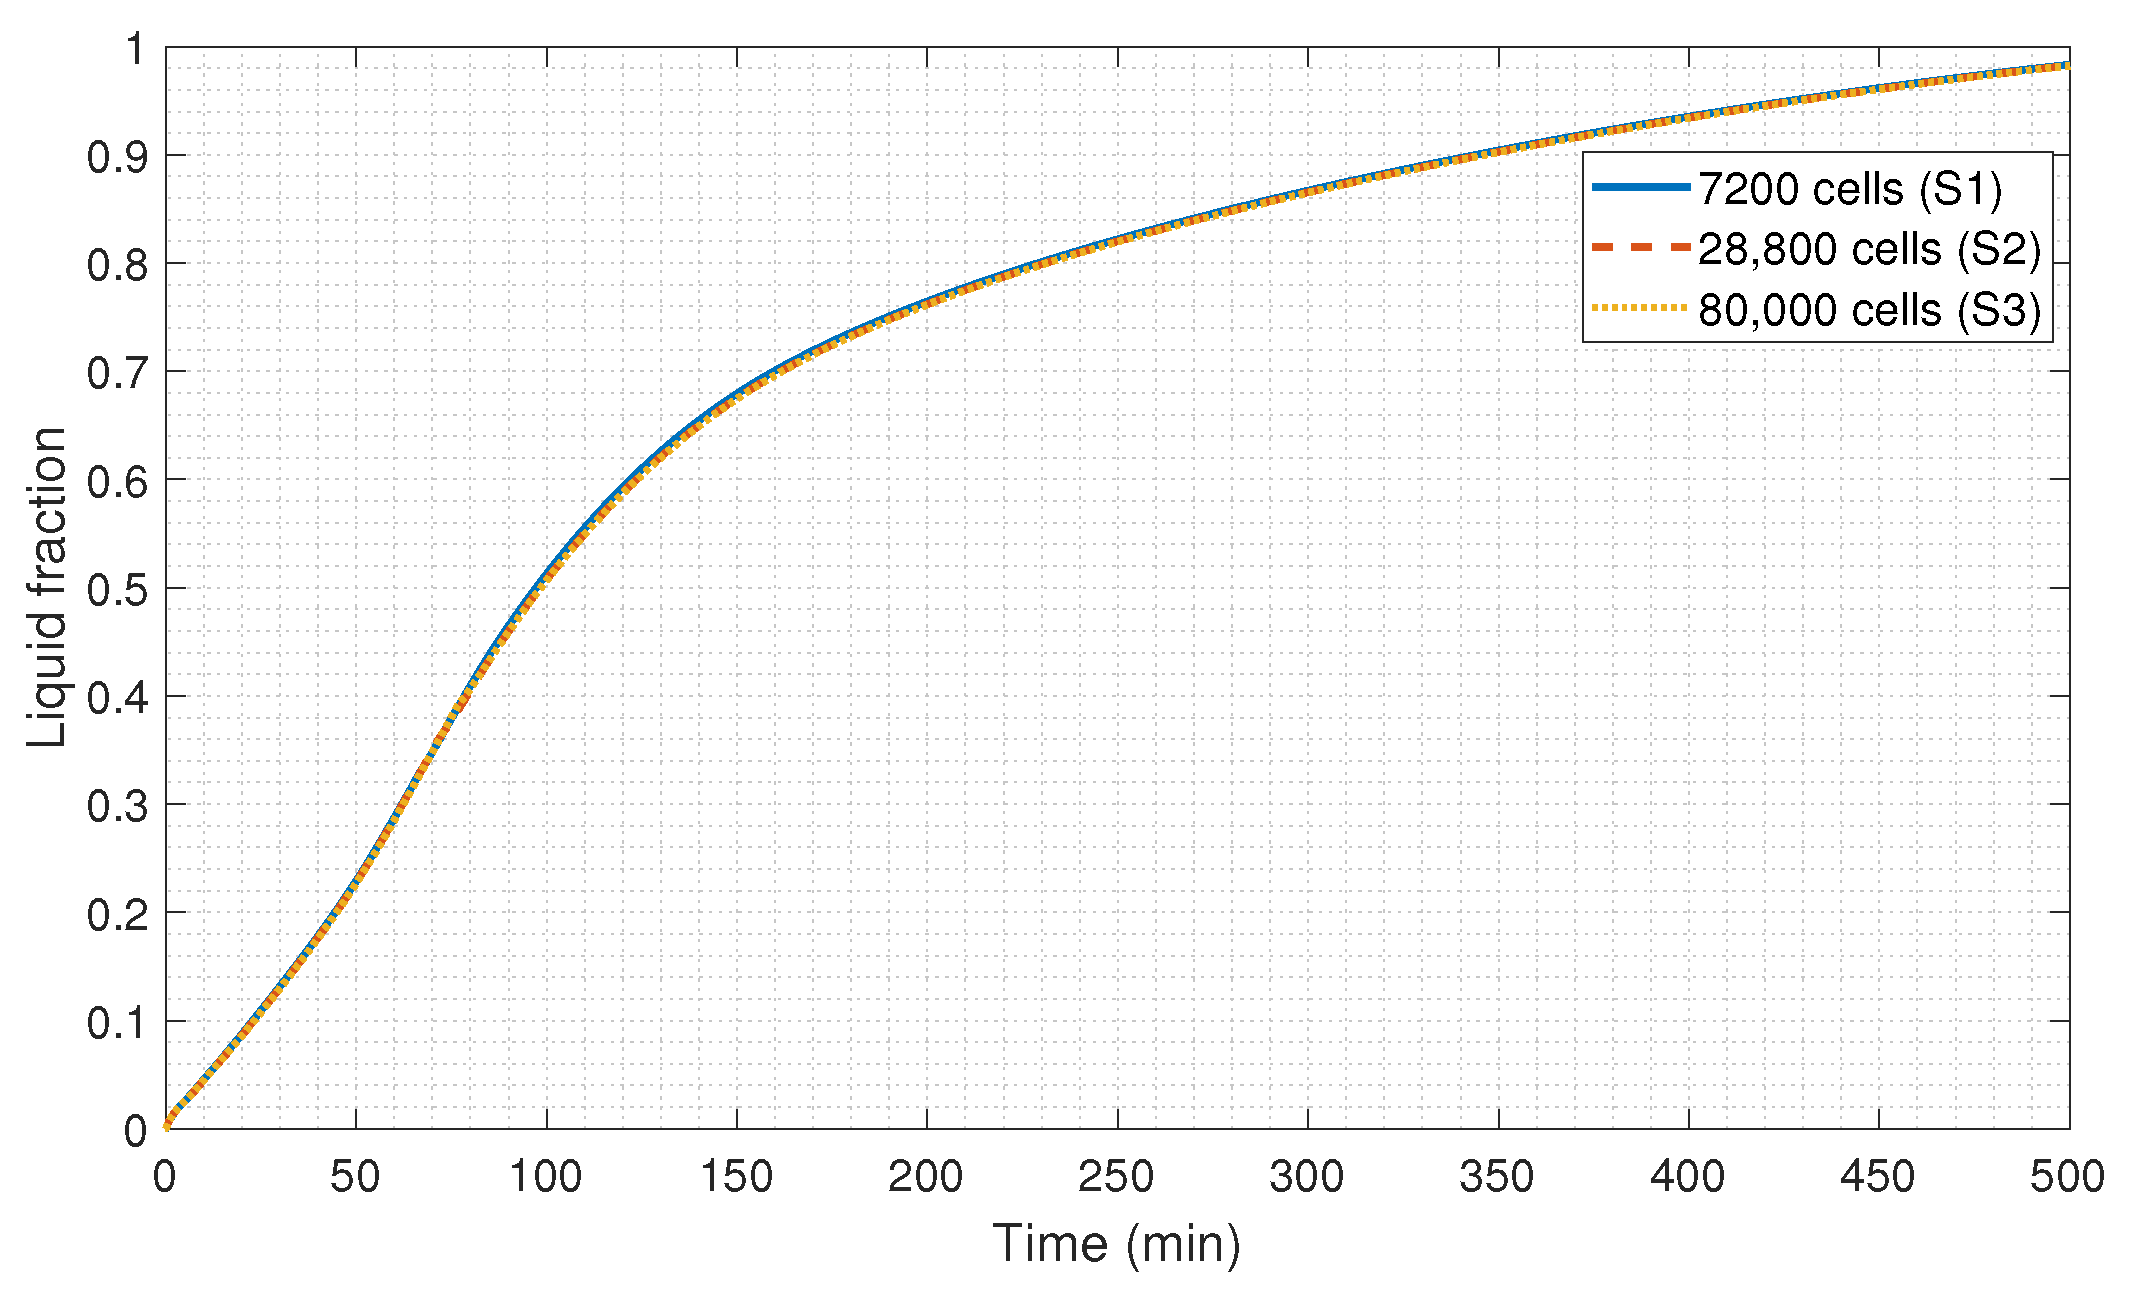
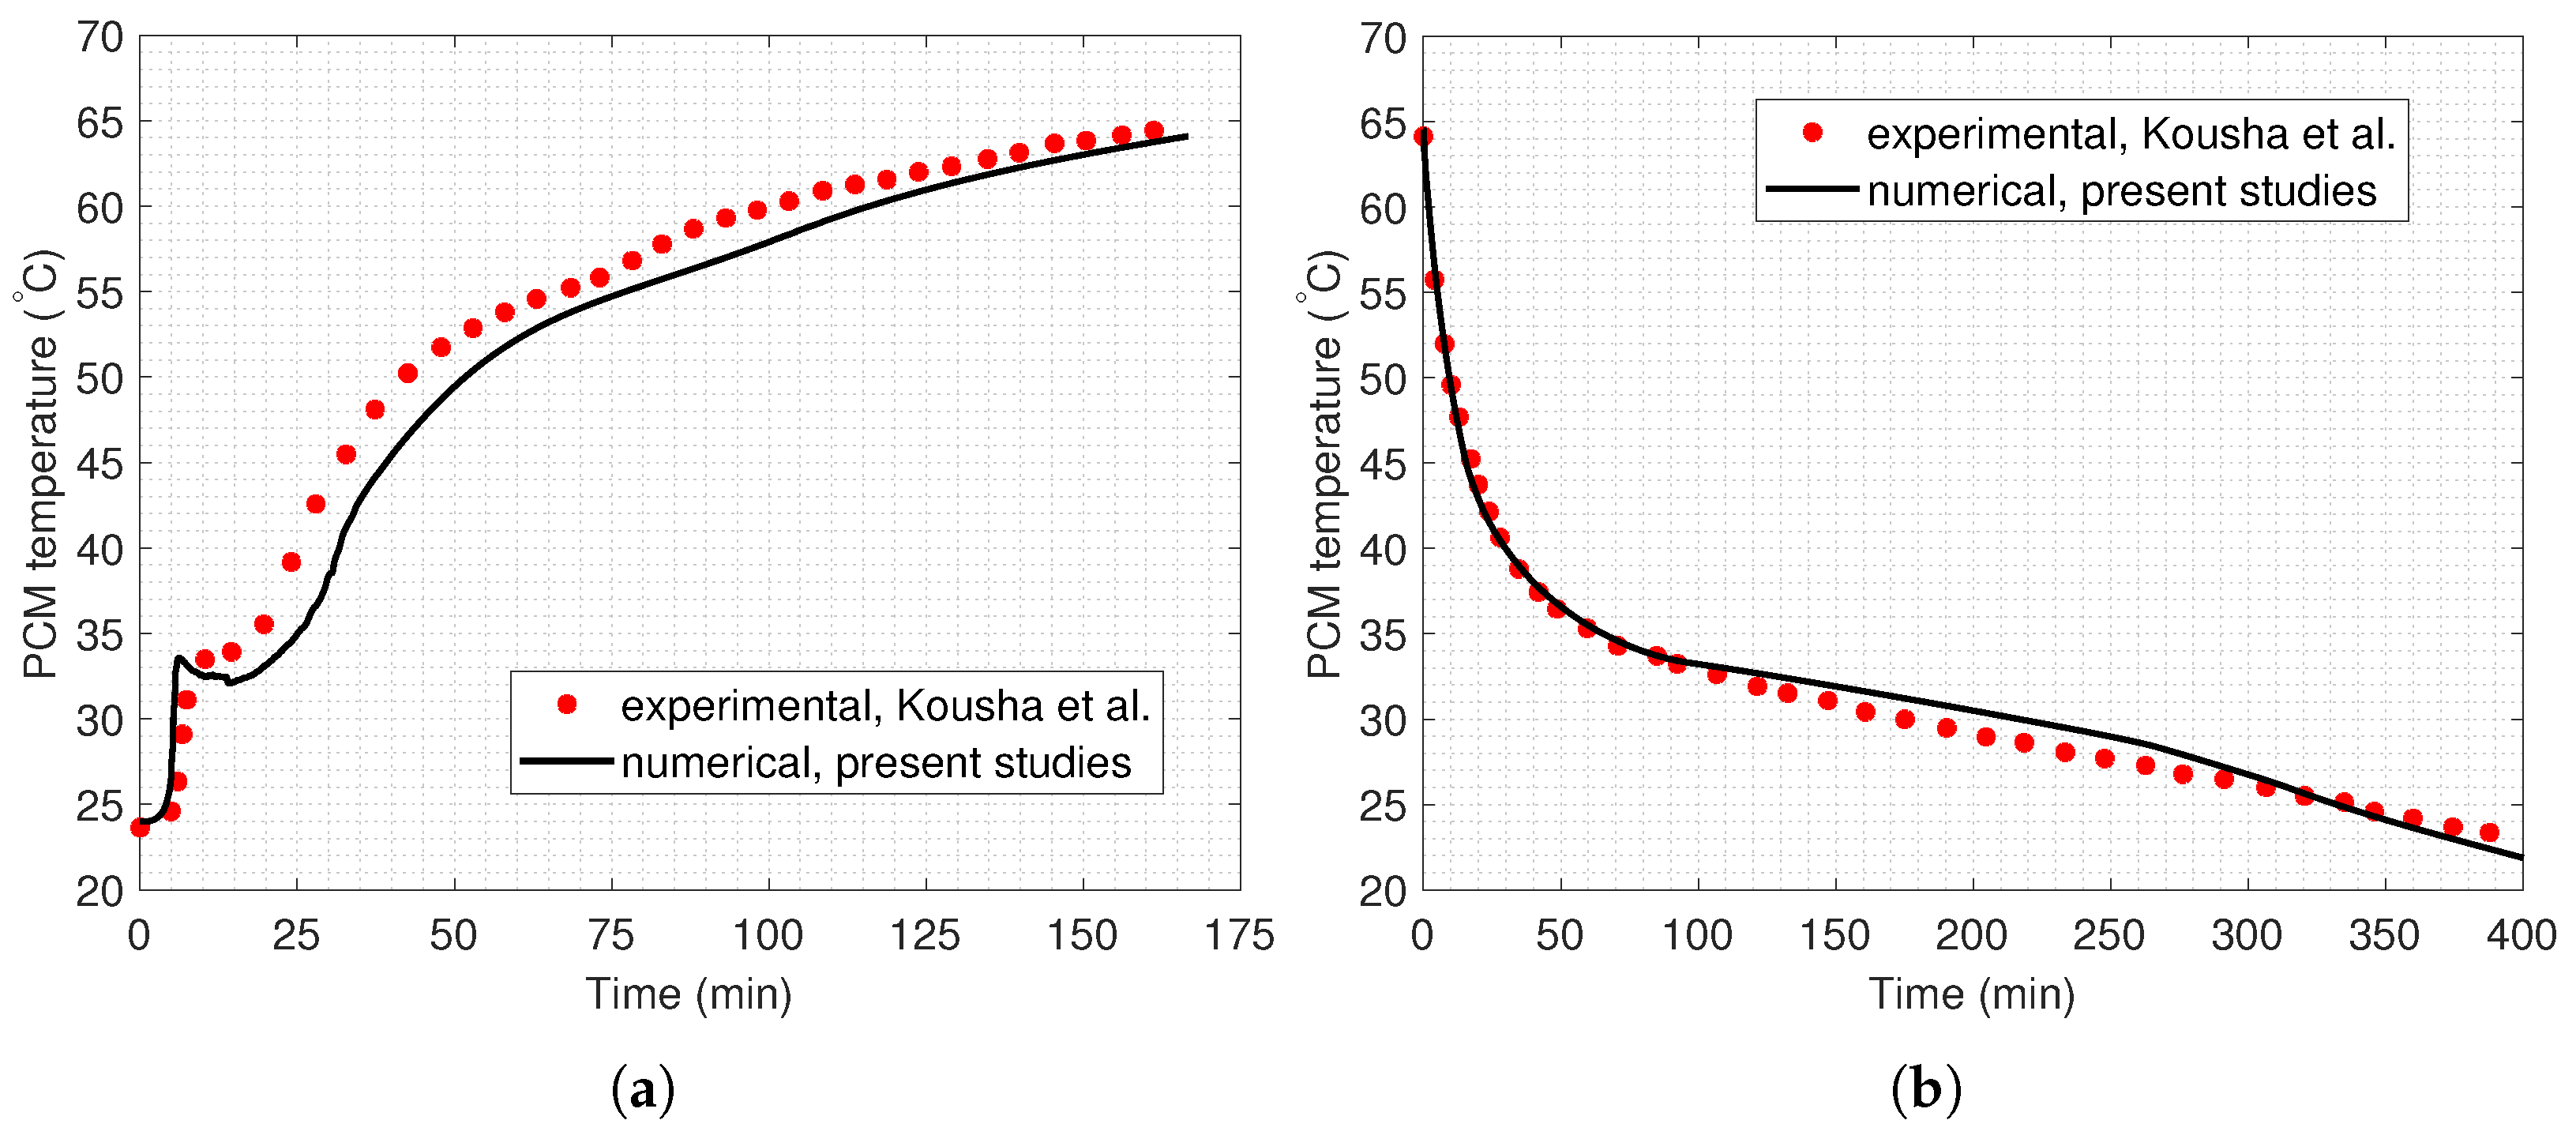
4.4. Verification and Validation

The grid independence study was conducted as a verification procedure. Based on Figure 4 we can observe that there are slight differences in the liquid fraction distribution, and the maximum relative error in the liquid fraction for the compared meshes does not exceed 2%. However, later in the research, we compare the melting and solidification times so the melting time was compared as a parameter in grid independence analysis. The melting time for the mesh with 80,000 cells (S3) was 29,643 s, 28,800 cells (S2) was 29,610 s, and 7200 cells (S1) was 29,485 s. The S1 and S2 domains reached a liquid fraction value of α = 0.98 185 s and 33 s faster than S3, respectively. As such, the S2 mesh is sufficient to perform the calculations. This grid independence test procedure was conducted for each analysed LHTES unit. For all domains, the density of the grid increased towards the tube, and the quality of the cells was also controlled so as to remain within the minimum and maximum values of the quality factors: aspect ratio < 5 and orthogonal quality > 0.5.
To ensure the correctness of the simulation approach, the numerical results were compared with the experimental data presented by Kousha et al. [62]. The model validation was performed for the circular shell-and-tube LHTES unit in the horizontal position. Consistency was maintained across both studies in terms of the geometric and material parameters, as well as the boundary and initial conditions. The fluid dynamics solver settings were adjusted based on the information provided in [62].
As the melting process commences, the HTF exhibits an initial temperature of 80 °C while maintaining a flow rate of 0.4 L/min. A Stefan number of Ste = 0.59 was employed in the simulation. The melting process of PCM RT35 within the shell-and-tube LHTES unit is visualised in Figure 5a, showing the average temperature in section A. The results of both studies exhibit a strong correlation, with the preheating process and melting period aligning closely with the experimental curve. Additionally, the heating stage for the liquid PCM follows a consistent trend with the experimental results. In this study, the numerical data for the melting process reveals an average error of 5.1% when compared to the experimental results of Kousha et al. [62].
Once the PCM is completely melted, the solidification process starts by introducing the HTF with a temperature of 10 °C into the inlet of the inner pipe of the thermal energy storage unit. Figure 5b presents the average PCM temperature in section B during solidification, revealing a strong correlation between numerical and experimental research. Especially during the first 100 min, the simulation results align closely with the measurement data. The solidification process exhibits an average discrepancy of 2.4% between the numerical results in this study and the experimental findings of Kousha et al. [62].
The validation process attests to the reliability of the established numerical model, demonstrating that the results obtained with it for both the melting and solidification processes align well with the findings from experimental studies.

5. Results and Discussion of the Numerical Calculations

The simulation results are presented for the comparison of melting times both overall and for different liquid fraction stages (Figure 6). To gain a better understanding of the ongoing phenomena, the temperature, liquid fraction, and velocity distributions were analysed at three different time points for all the examined shells (Figure 7, Figure 8, Figure 9 and Figure 10). The simulation results are also presented for the comparison of the solidification process (Figure 11, Figure 12, Figure 13, Figure 14 and Figure 15).
The temperature and liquid fraction distributions obtained in this study exhibit similarities when compared to findings from prior published research [33,35,55]. This qualitative comparison could be performed because of the same simplifications, similar shell-to-tube ratio, and shell shape.

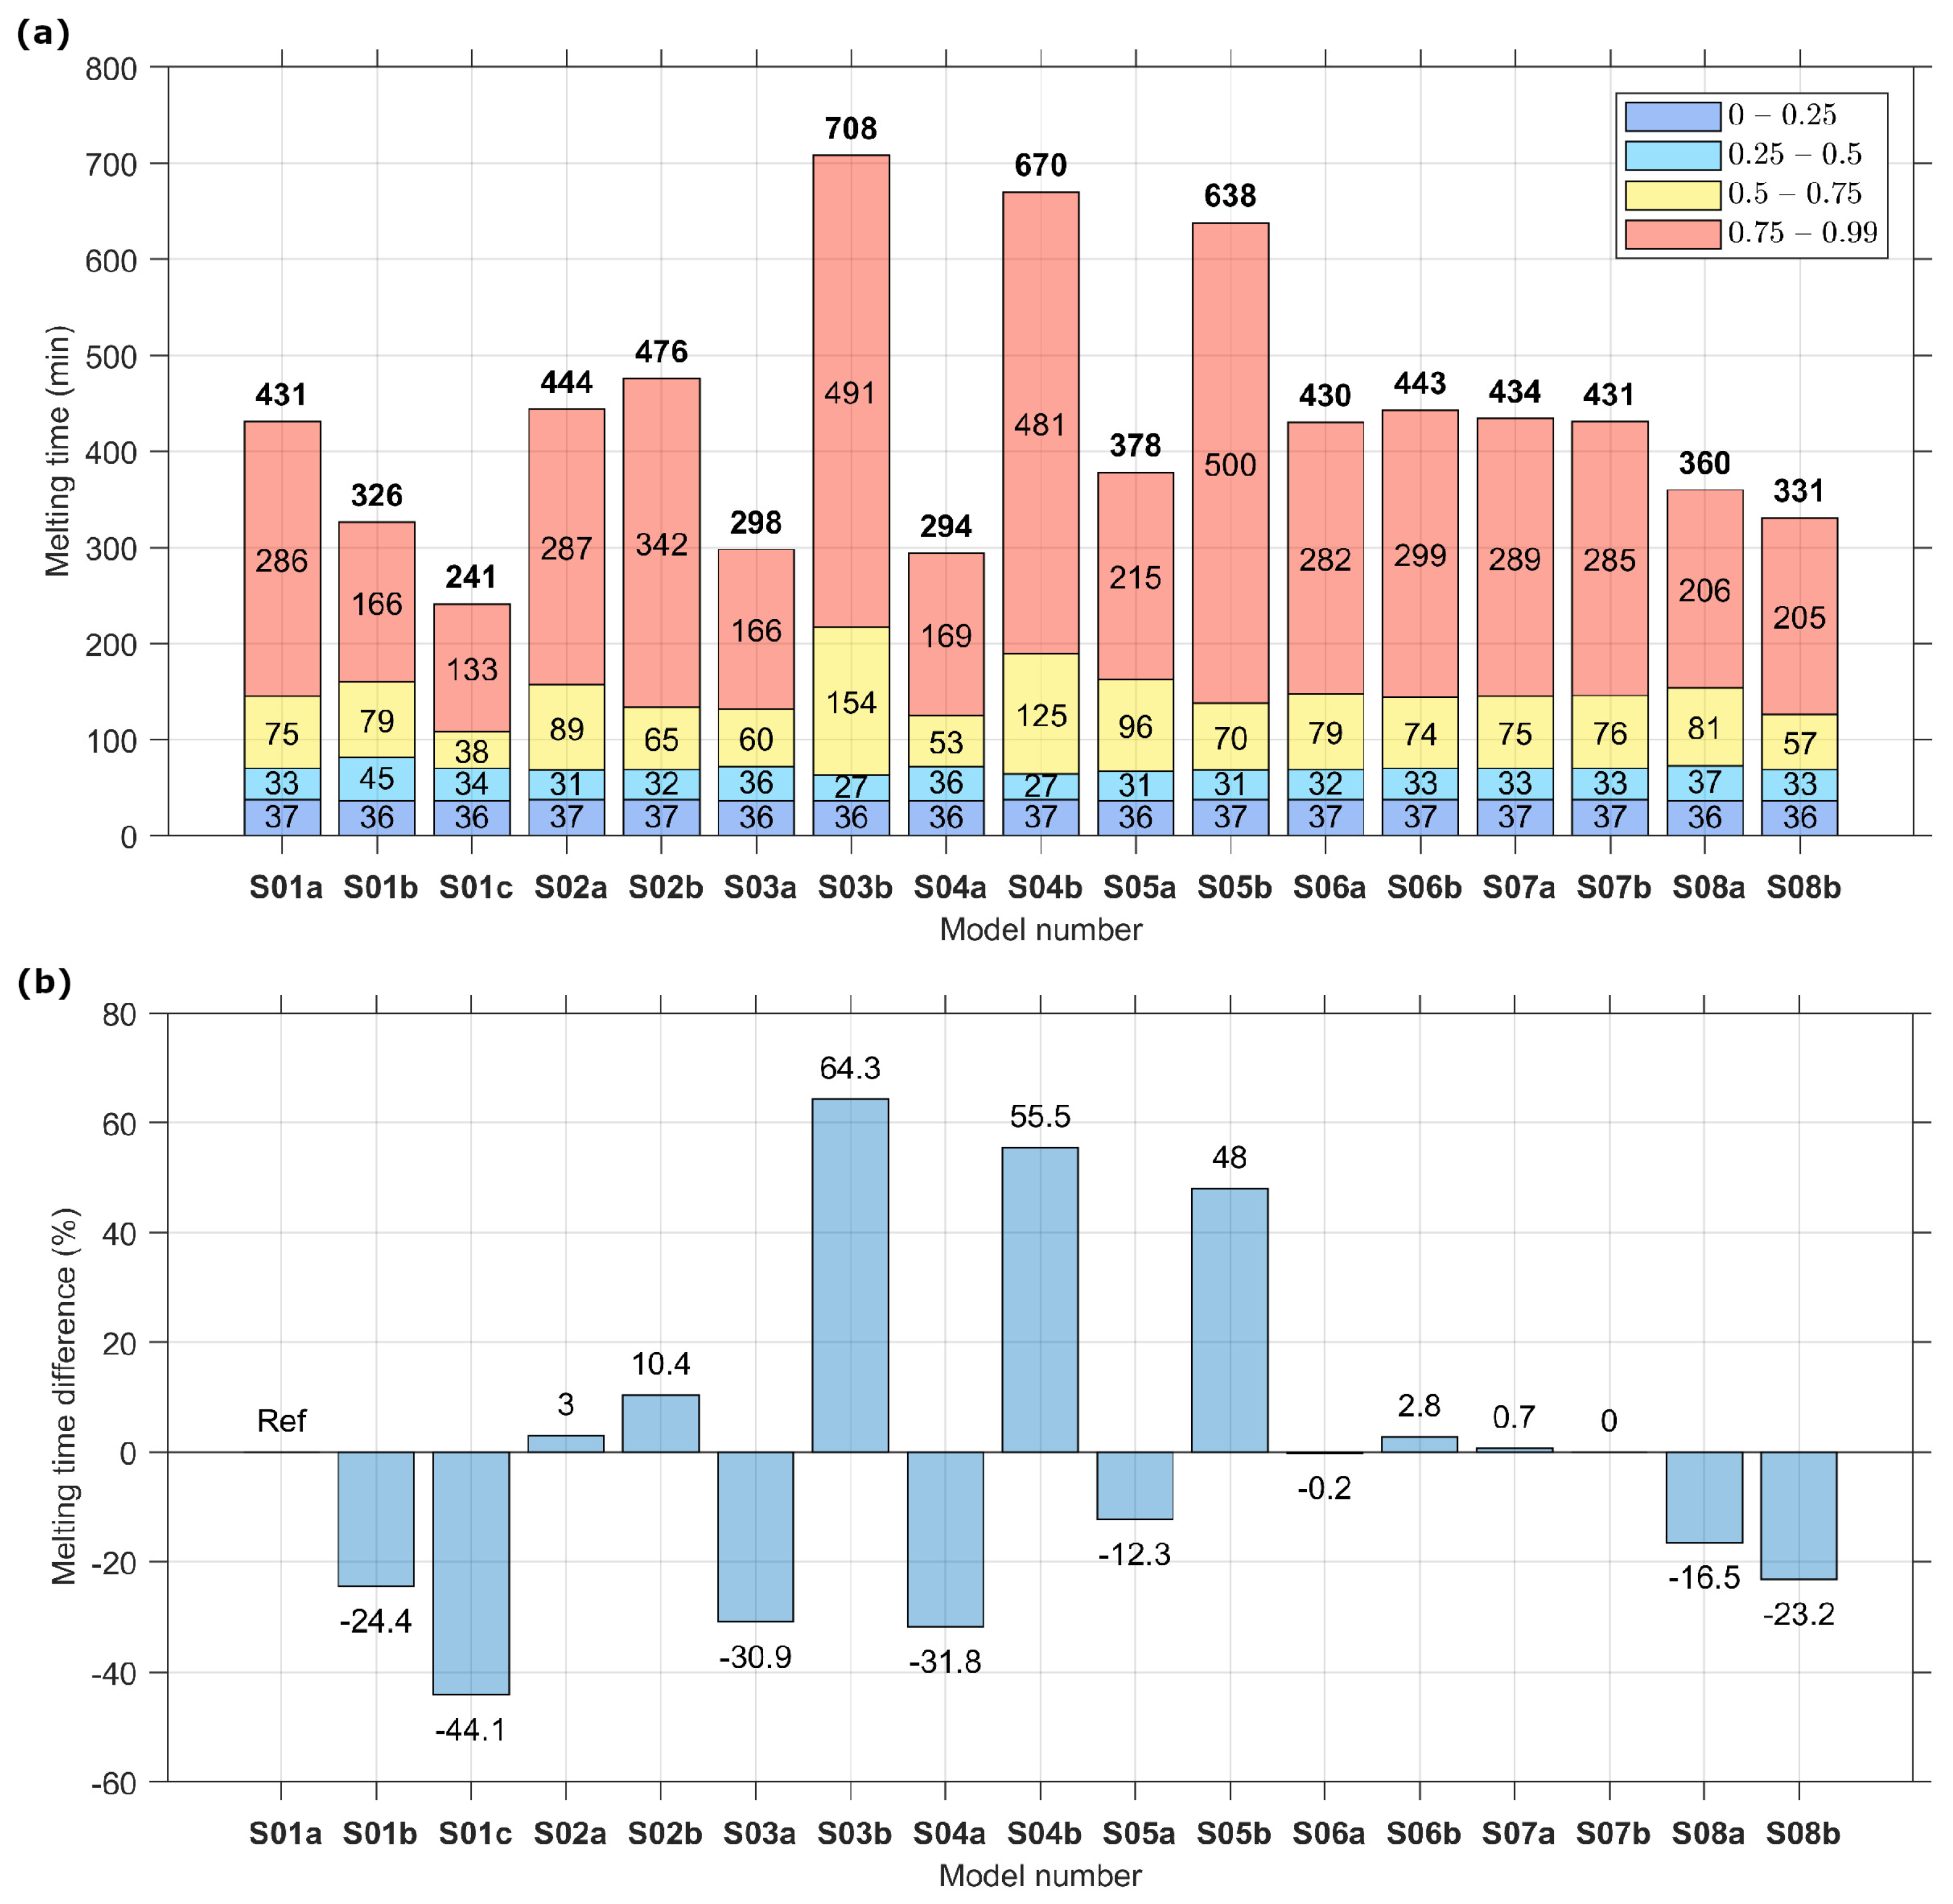
5.1. Melting Time Comparison

In Figure 6, the melting times at four different stages and the melting time differences in relation to the reference S01a circular shell are presented. It is noteworthy that it takes an approximately equal amount of time (36–37 min) to reach 25% liquid PCM regardless of the case. This uniformity arises because the melting phenomena occur at the same surface area and under identical conditions. During the second stage, when the liquid fraction reaches up to 50%, convection continues to dominate, resulting in minimal time differences across various shell structures. In the third and fourth stages, as the liquid fraction approaches 99%, the longest times are observed for vertical rectangular (S03b), vertical ellipse (S04b), and triangle downward (S05b) shell shapes. This extended duration is attributed to conduction prevailing in the bottom part of the shell, where these configurations have a significant distance between the tube and the bottom of the shell. Conversely, in these same stages (third and fourth), the shortest times are recorded for a semi-circular shell shape in the downward position (S01c), horizontal rectangular (S03a), and horizontal ellipse (S04a). This is due to convection dominating in the wide upper section of the shell, and these configurations have short distances from the tube to the bottom of the shell.
Figure 6. Melting process (a) timestamps for liquid fraction values of α = { 0.25 , 0.5 , 0.75 , 0.99 } and (b) percentage difference in melting time compared to reference circular shape S01a.
Energies 16 07822 g006
The shortest overall melting time was achieved for a semi-circular shell shape in the downward position (S01c), which was 44% shorter than the reference circular case. Additionally, noteworthy reductions in melting times were observed for other shell shapes, such as horizontal ellipse (S04a), horizontal rectangle (S03a), semi-circular in the upward position (S01b), and downward-oriented isosceles trapezium (S08b), with melting time reductions of 31.8%, 30.9%, 24.4%, and 23.2%, respectively. The obtained results differ slightly compared to the results presented in [56], where the melting time was shorter for the downward trapezium compared to the shape of a horizontal ellipse. This difference arises because, in Hekmat et al. [56], a shell-to-tube diameter ratio of 3 was assumed for the horizontal circular LHTES unit, while in our study, this ratio is 4. This means that for all shell shapes, the proportion of the total exchanger cross-sectional area to the tube cross-sectional area is greater in our case.
When comparing S01b and S01c (semi-circle) with the same distance from the tube to the bottom of the shell, it becomes evident that the upper flat area of the shell (S01c) is advantageous when melting occurs. This is due to a higher PCM area in the upper than in the lower part of the exchanger. In the upper part, convection dominates and the PCM melts faster than in the lower part where conduction is dominant. This same observation applies when comparing cases S08a and S08b (trapezium).

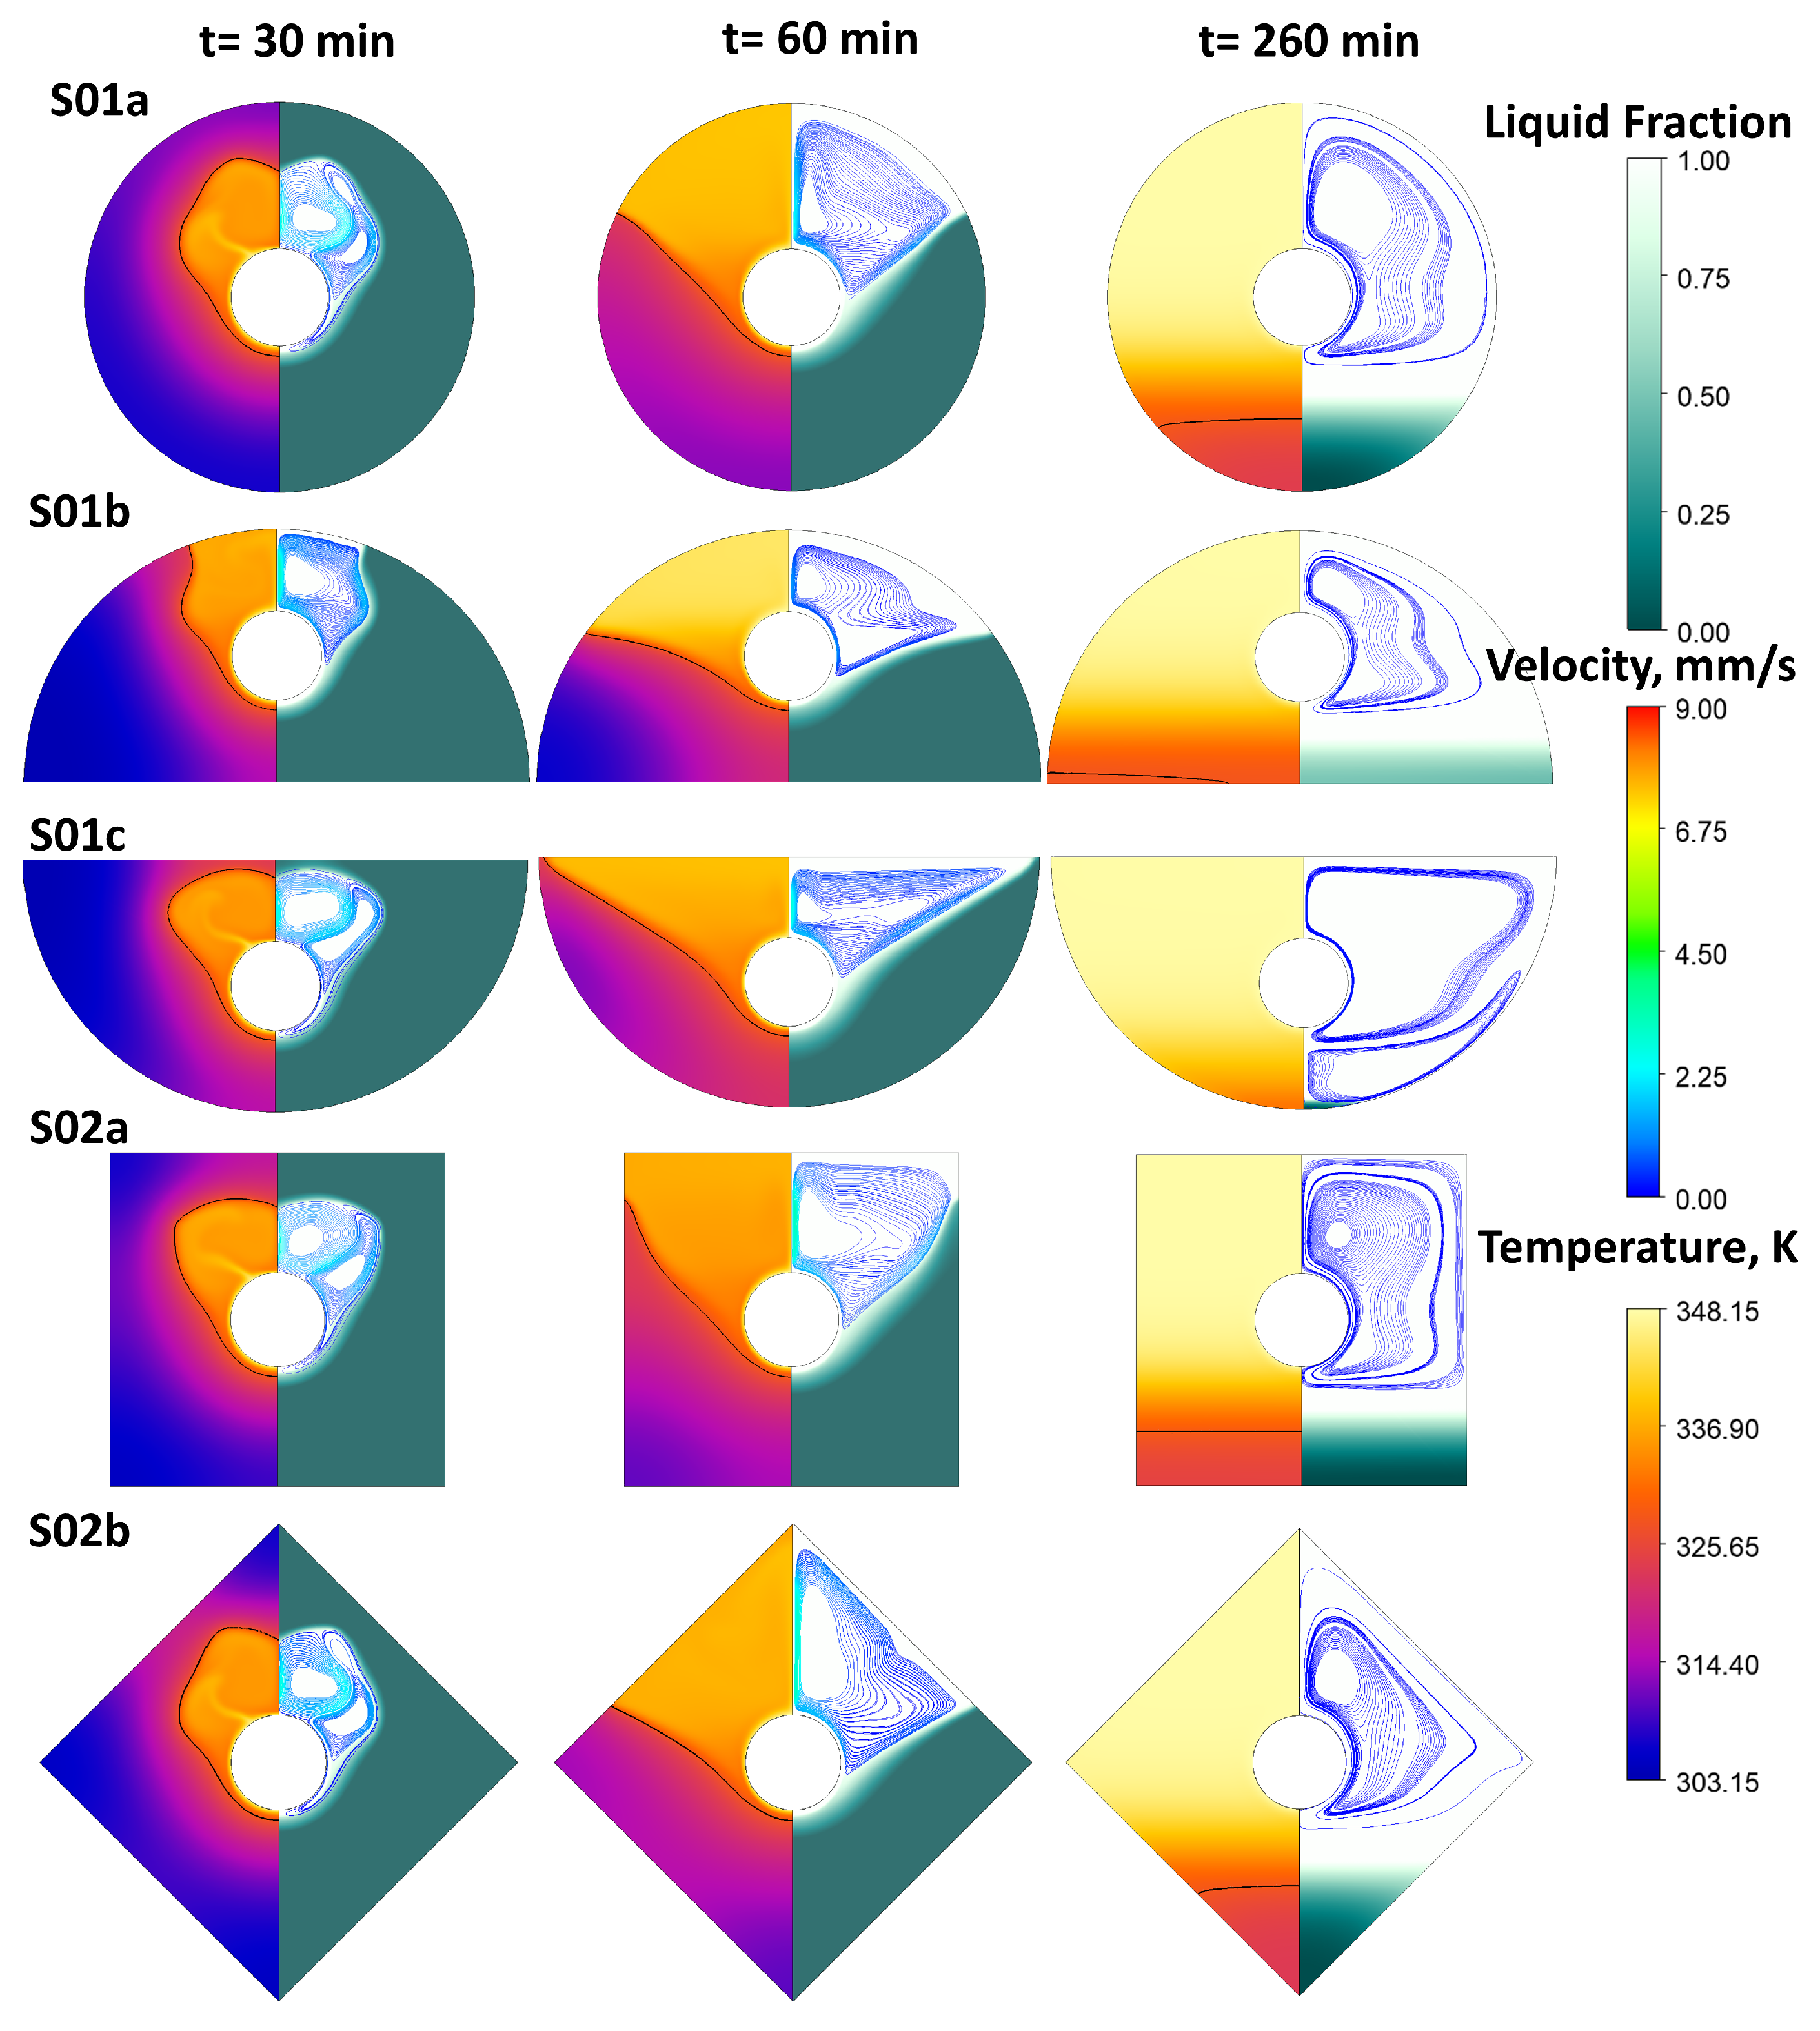
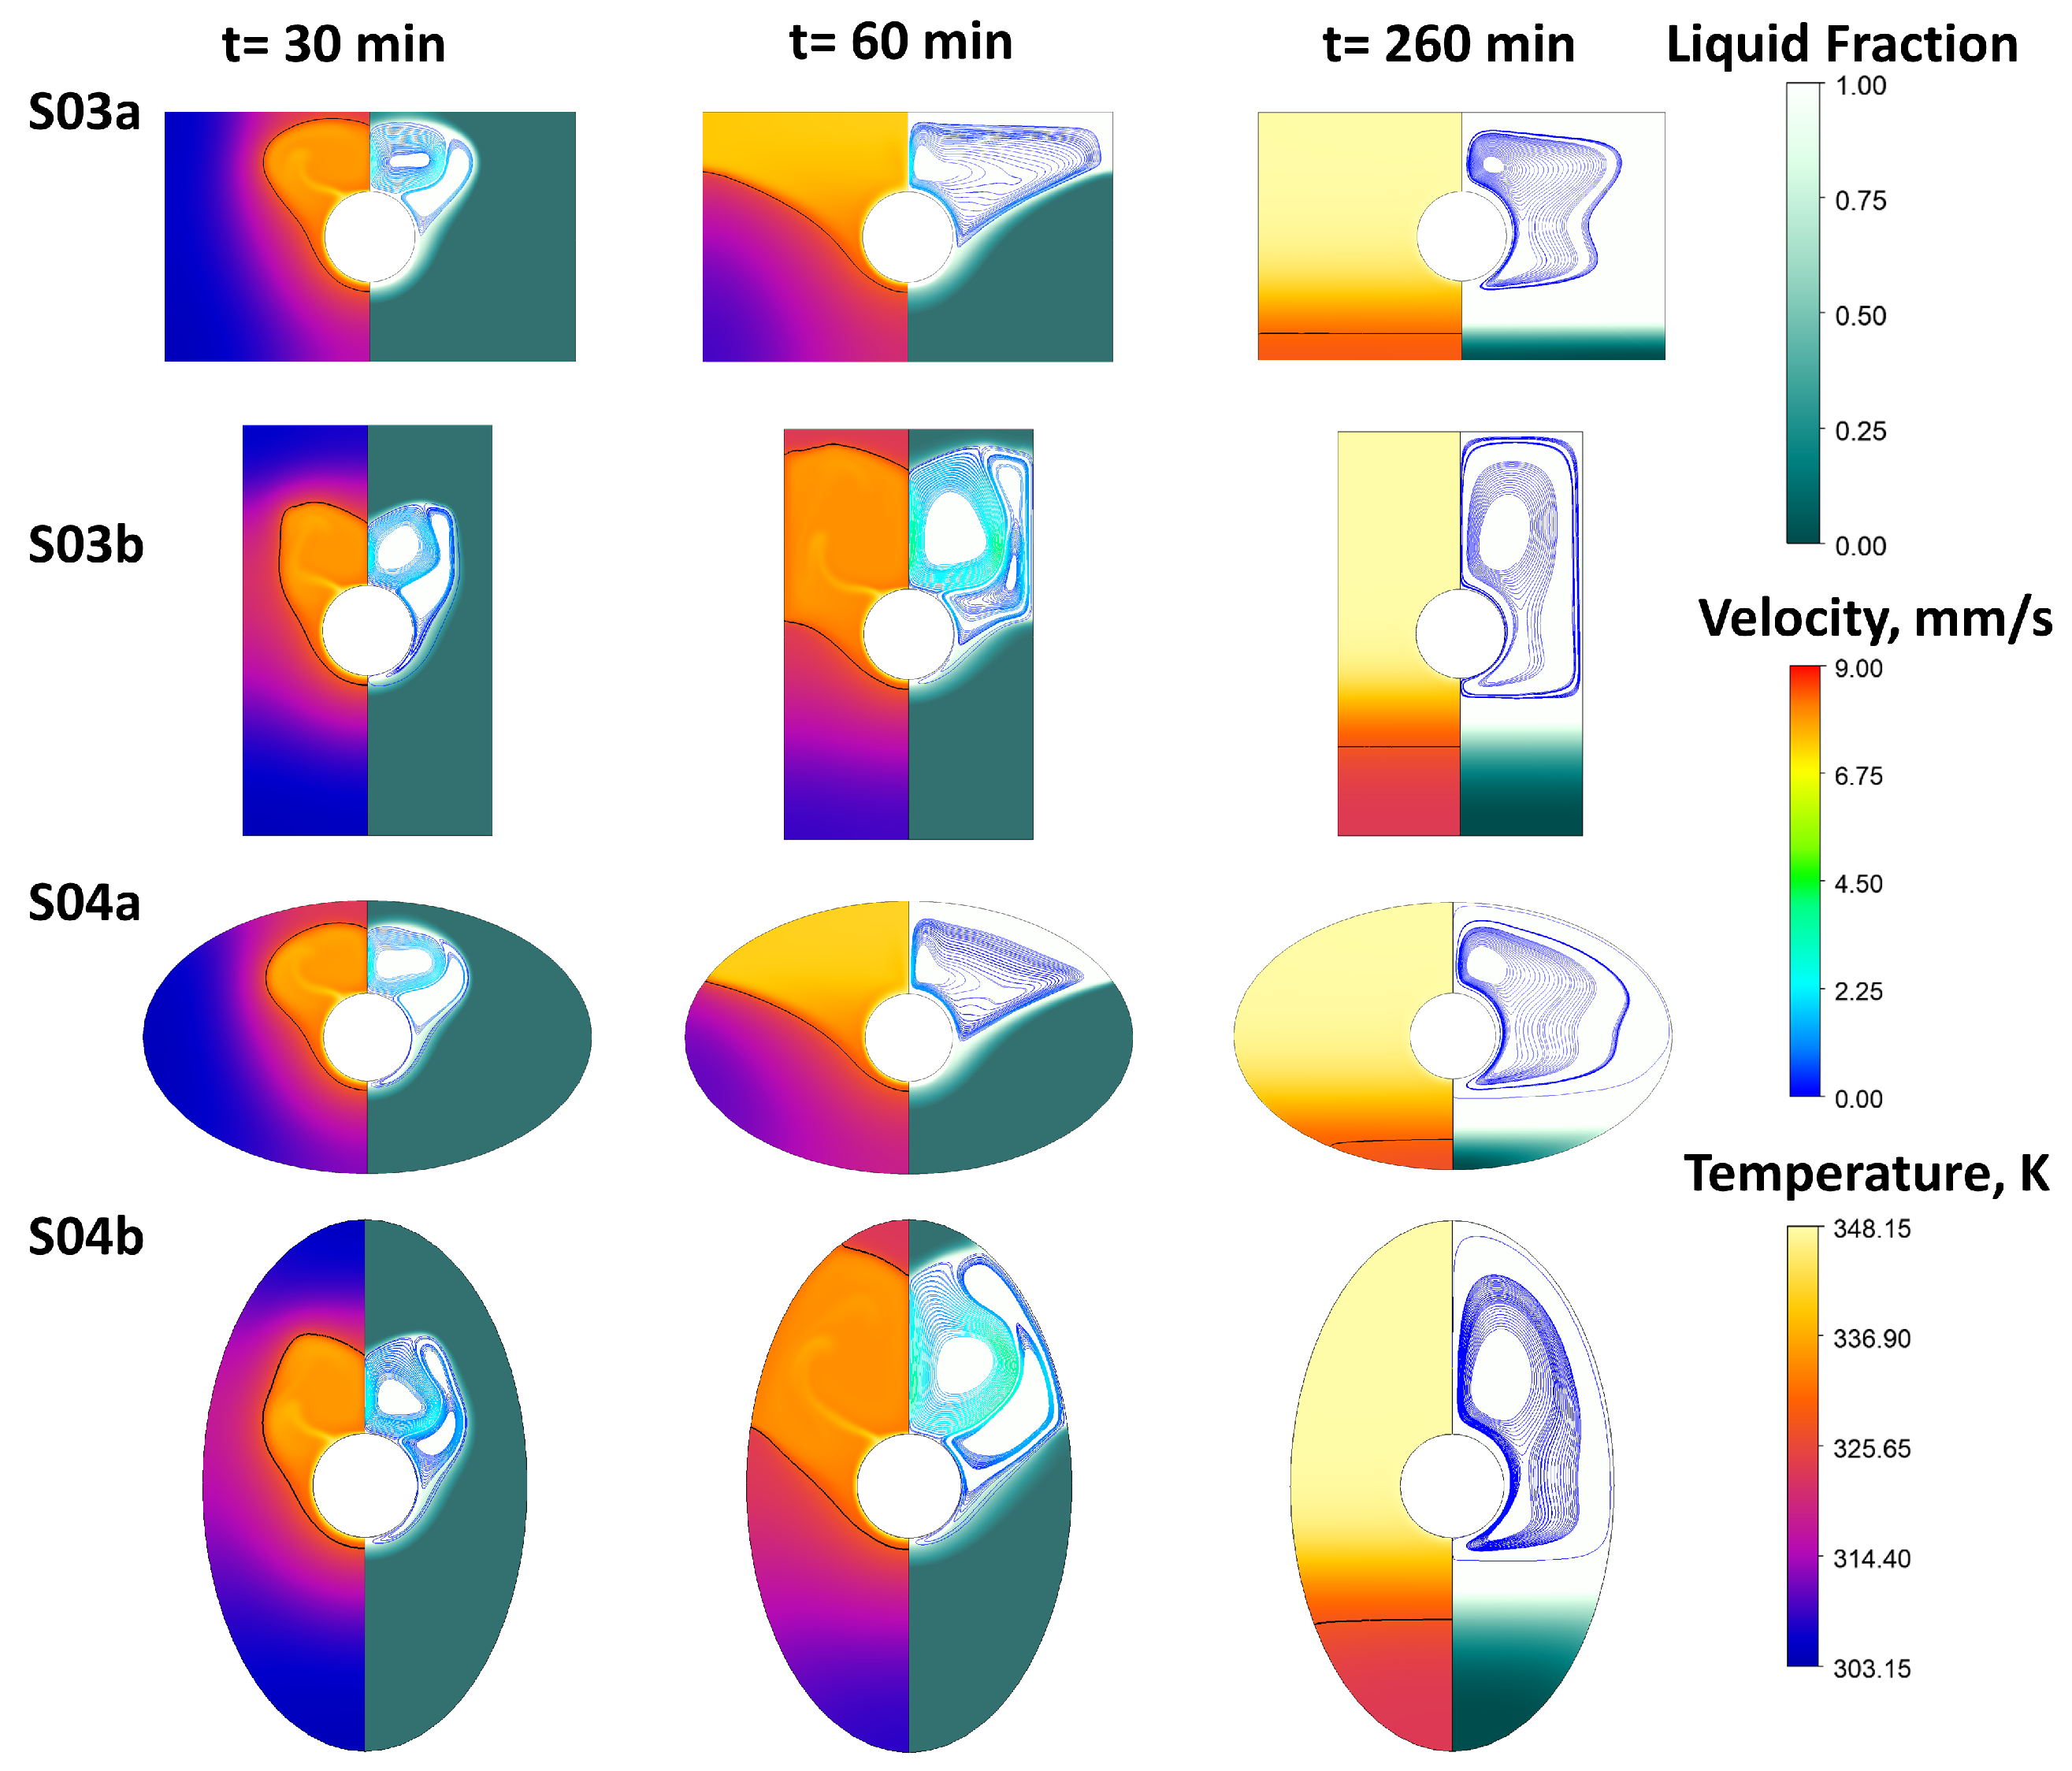
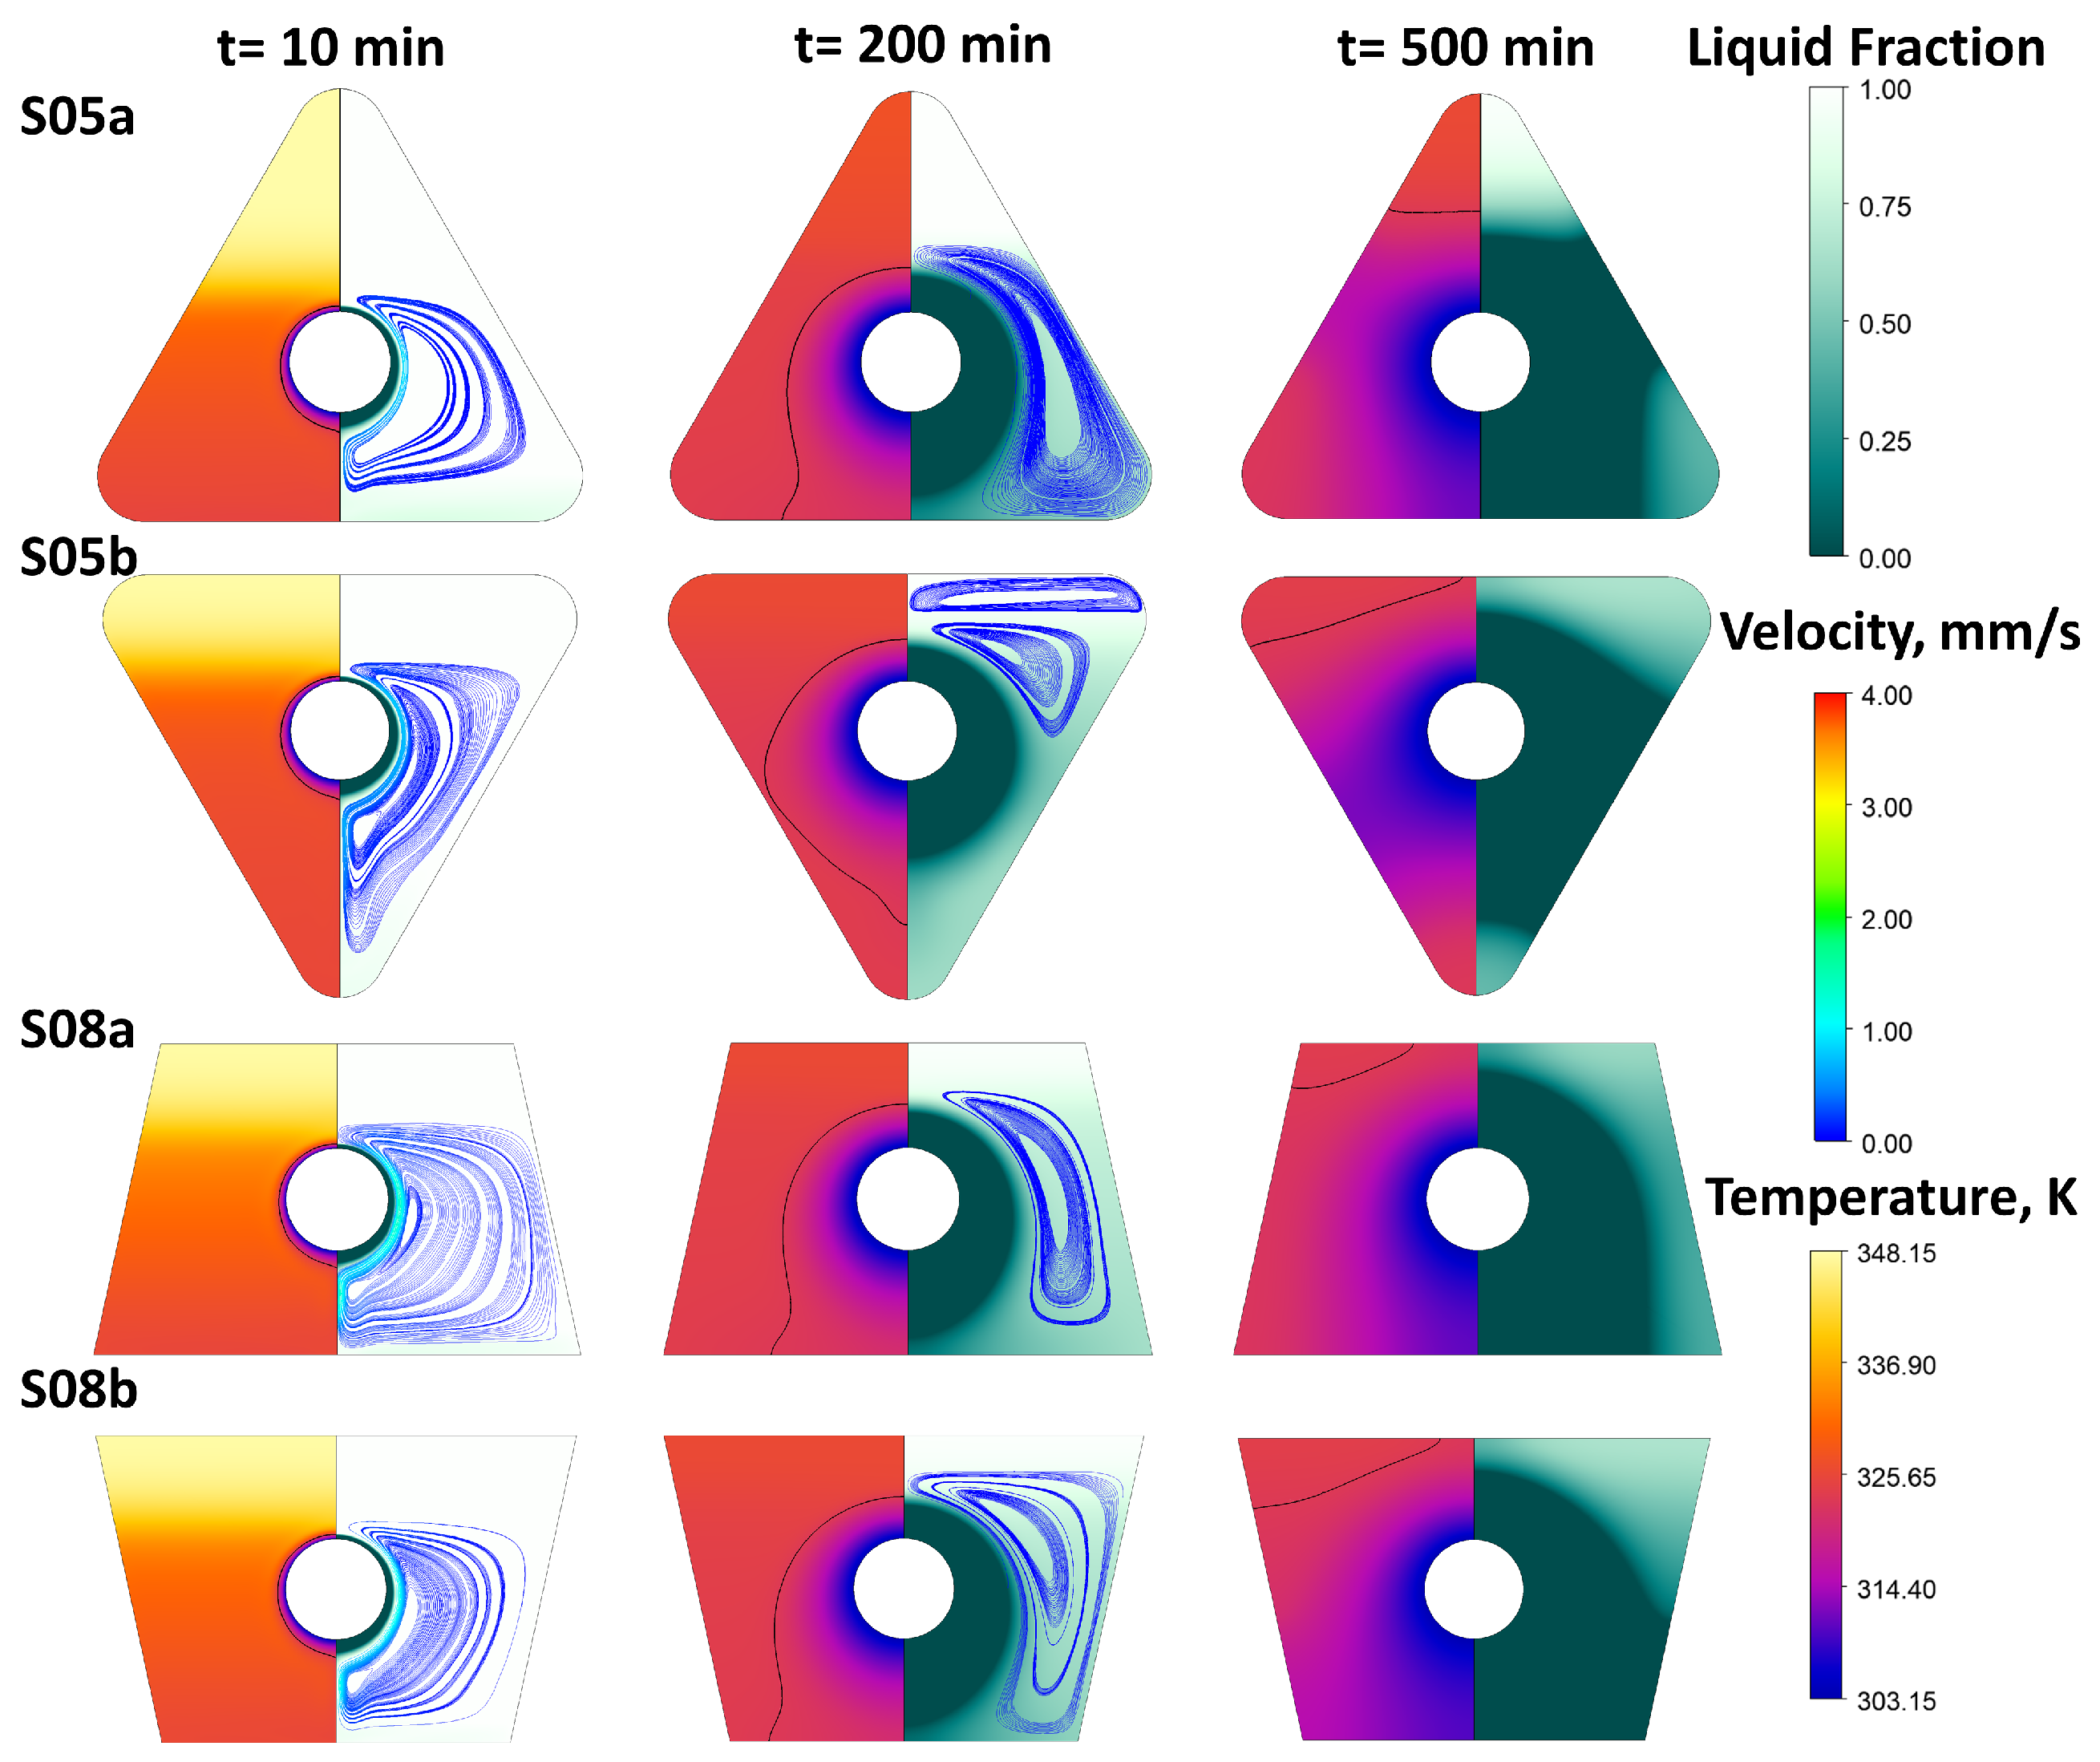
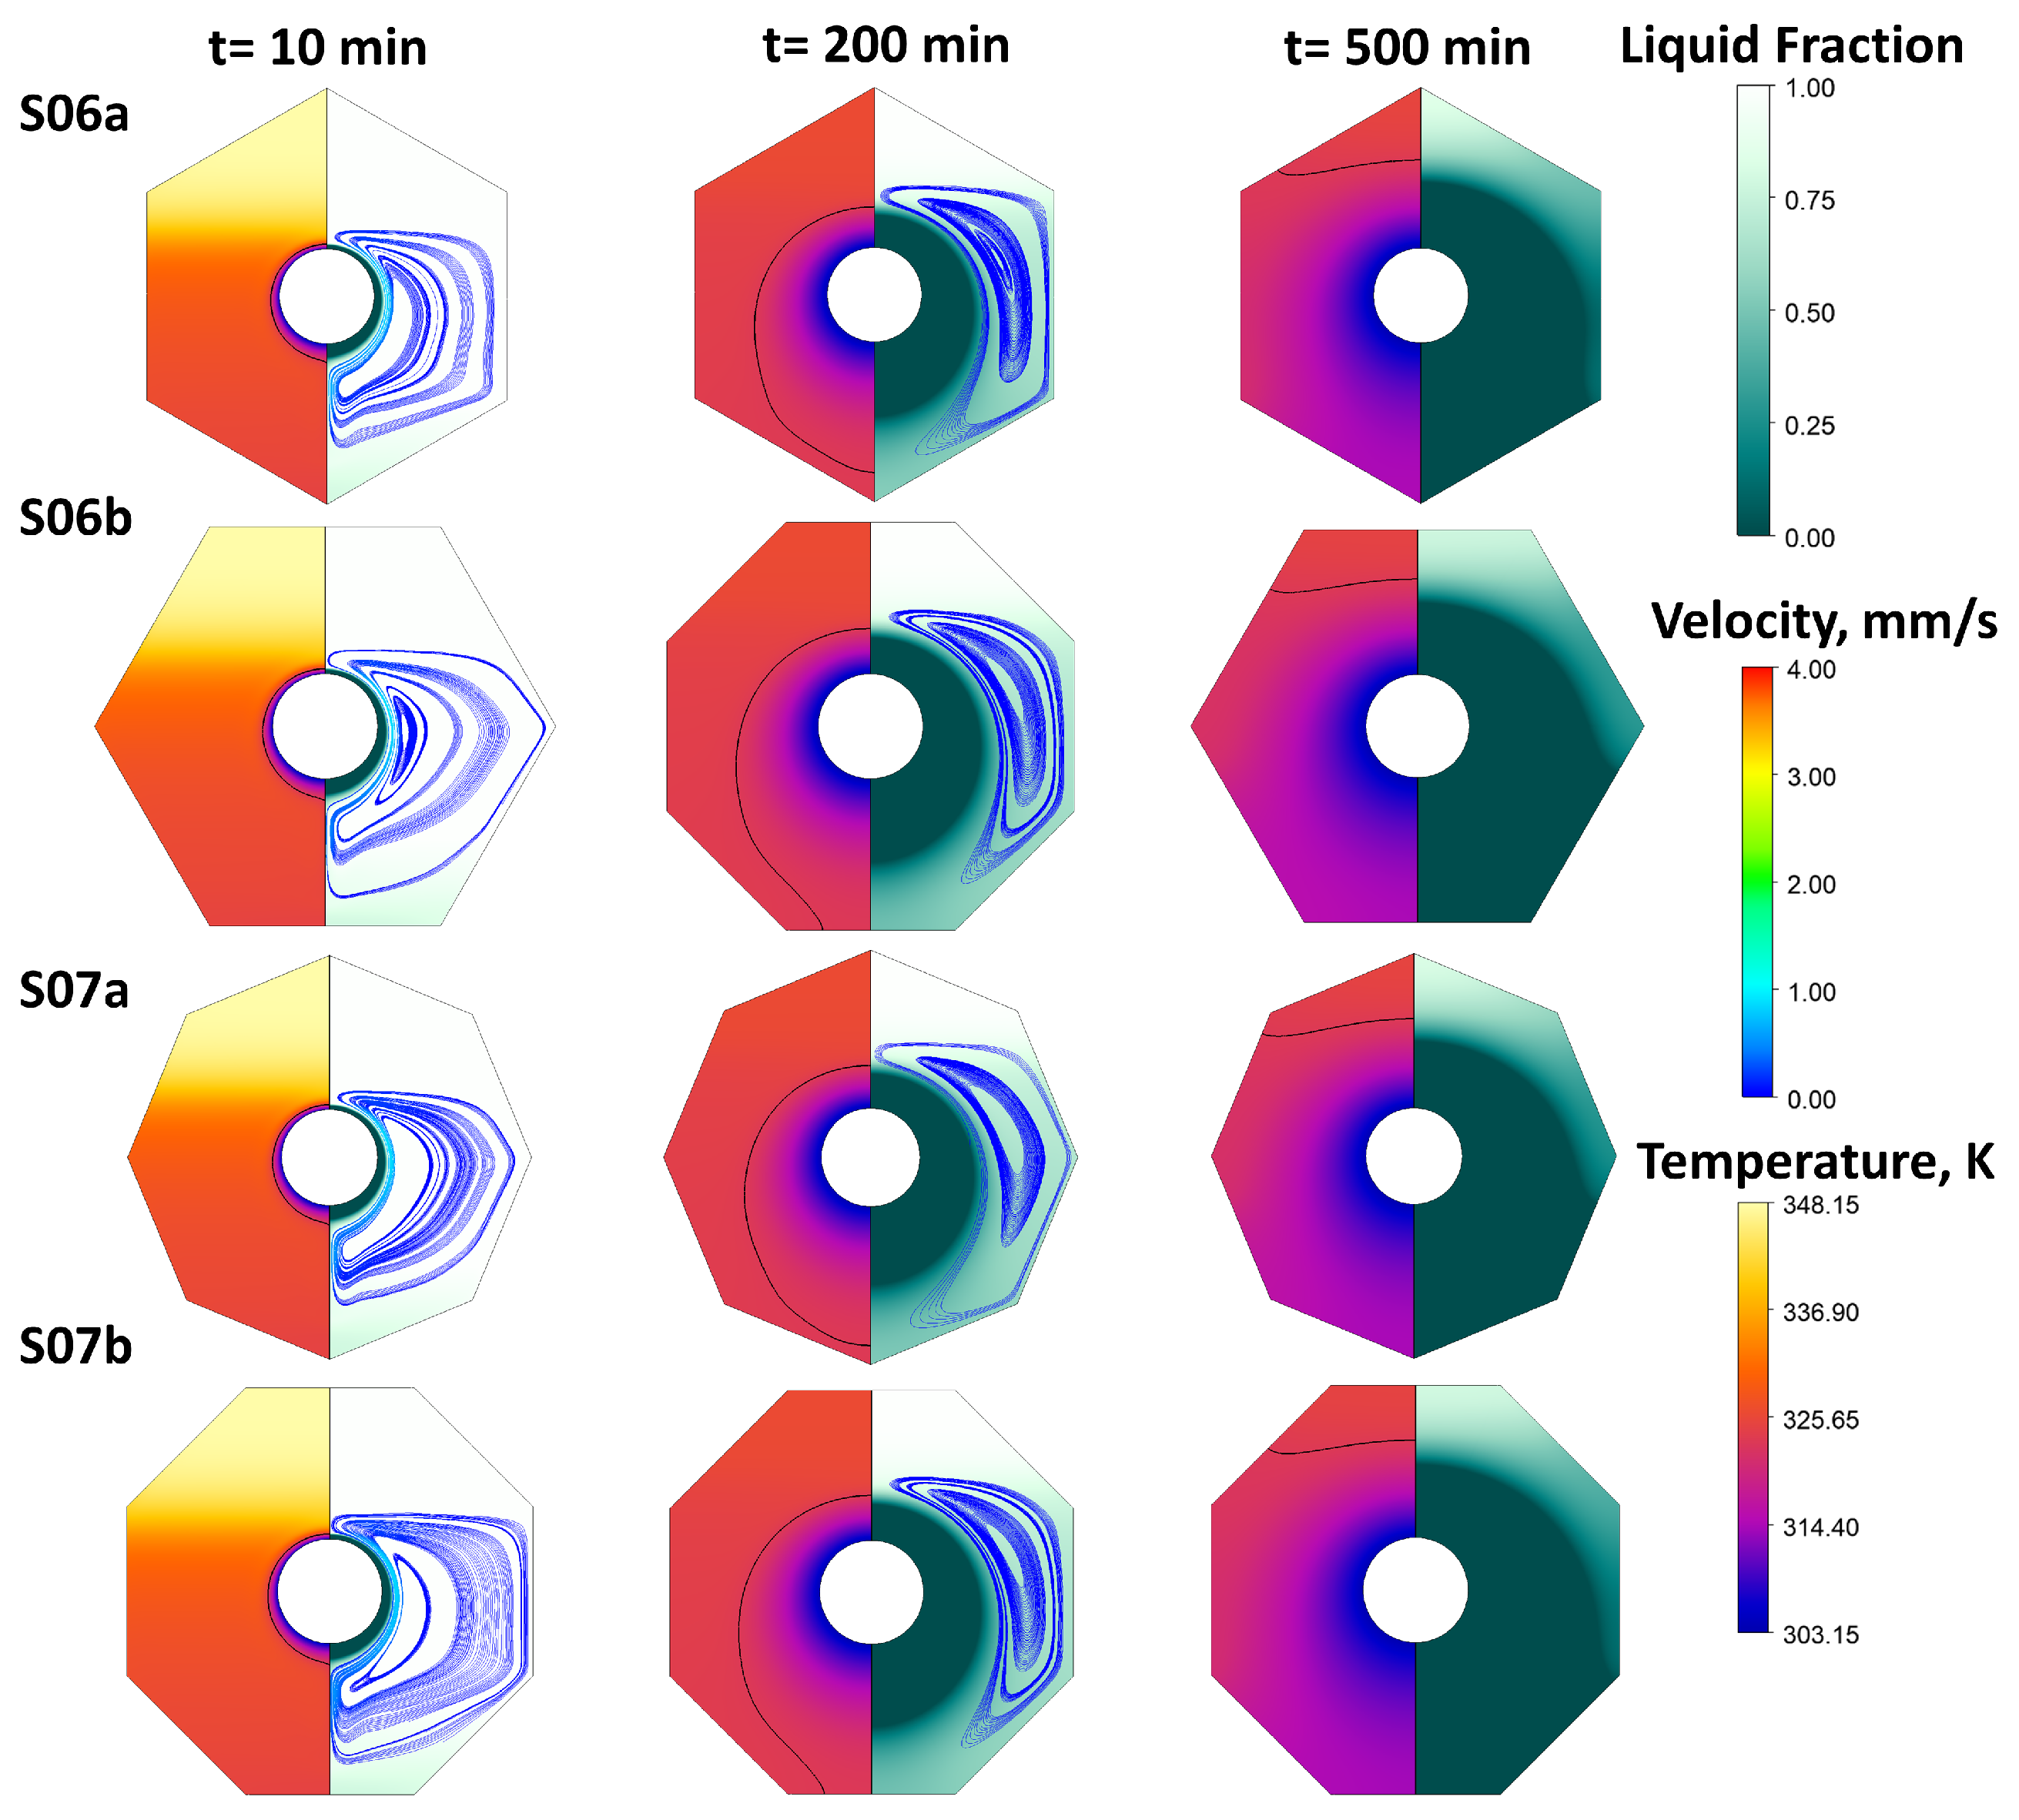
5.2. Temperature and Liquid Fraction Distributions during Melting

In Figure 7, Figure 8, Figure 9 and Figure 10, the temperature and liquid fraction distributions during melting and selected time points are presented. The black line represents the isoline of 50% PCM liquid fraction. We also marked the streamlines coloured by velocity to better visualise the convection currents.
Figure 7. Liquid fraction and temperature spatial distribution, with streamlines coloured by velocity value for S01a,b,c and S02a,b during melting.
Energies 16 07822 g007
From the beginning of the melting process up to 30 min, there are similar shapes of the liquid–solid interface except in the S01b case, where the liquid PCM reaches the top boundary of the shell. There are also similar convection currents, that have a beginning at the top surface of the tube, near 45 from the vertical axis. For the S01c, S03a, and S04a configurations with a wide-top shell in comparison to the rest of the cases, we can see that the liquid PCM moves to the side zones of the container, clearly away from the heat source ( t = 60 min). In addition, due to the fact that there is less PCM under the tube, the melting process is shorter, especially in the fourth stage. The S05b case up to 75% liquid fraction behaves the same; however, due to the greater distance of the heat source from the bottom and the dominance of conduction, the longest time was obtained in the fourth stage of the melting process.
The highest velocity values can be seen in the time range from 40 to 80 min of melting for all cases. Slender configurations, such as S03b, S04b, and S05a, are characterised by the highest velocities. The developed convection currents promote melting but only in a short period of time. While such configurations as S01c, S03a, and S04a have lower velocities in the wide time period, they are therefore ultimately more efficient during melting.
At a time of 260 min, all of the configurations are characterised by a stratified PCM temperature, which could be beneficial in the case of the multi-module arrangement of rectangular (S02a,b, S03a,b, S08a,b), polygonal (S06a,b), or triangular (S05a,b) shell shape units. The highest PCM temperature was achieved for the S01c configuration because all the solid PCM melted in a time below 260 min, leading to sensible heat thermal energy storage up to the HTF temperature. We can also observe small liquid PCM velocities, which are obvious at this stage due to the small temperature difference between the liquid PCM and HTF.
In Figure 8, we can see that the flat shell shape configurations like rectangular S03a or elliptical S04a have higher temperatures of the solid PCM than configurations S03b and S04b. This is especially visible at times of 60 min and 260 min. The enlarged solid–liquid interface surface is responsible for this condition. It is also visible in Figure 9 for the S05a and S05b configurations, but in t = 60 min, S05b has a larger solid–liquid interface surface than S05a, resulting in faster melting (Figure 6a up to 75% LF). At time t = 260 min, we can see that for S05b the solid–liquid interface surface decreased and the melting process was significantly extended.
A slight difference exists in the melting times, temperature distributions, and liquid fraction when we compare the reference configuration (S01a—circular) with the square (S02a), hexagonal (S06a, S06b), and octagonal (S07a, S07b) configurations. This is due to the fact that these configurations are similar in shape to the reference configuration. In Figure 6, we can see only up to a 3% difference in the melting times for these configurations. However, the advantage of the square and hexagonal configurations lies in the potential for denser arrangements in comparison to circular ones. The interesting configurations, with low melting times and possible dense arrangements, are the isosceles trapezium shell shapes (S08a,b).
Figure 8. Liquid fraction and temperature spatial distribution, with streamlines coloured by velocity value for S03a,b and S04a,b during melting.
Energies 16 07822 g008
Figure 9. Liquid fraction and temperature spatial distribution, with streamlines coloured by velocity value for S05a,b and S08a,b during melting.
Energies 16 07822 g009
Figure 10. Liquid fraction and temperature spatial distribution, with streamlines coloured by velocity value for S06a,b and S07a,b during melting.
Energies 16 07822 g010

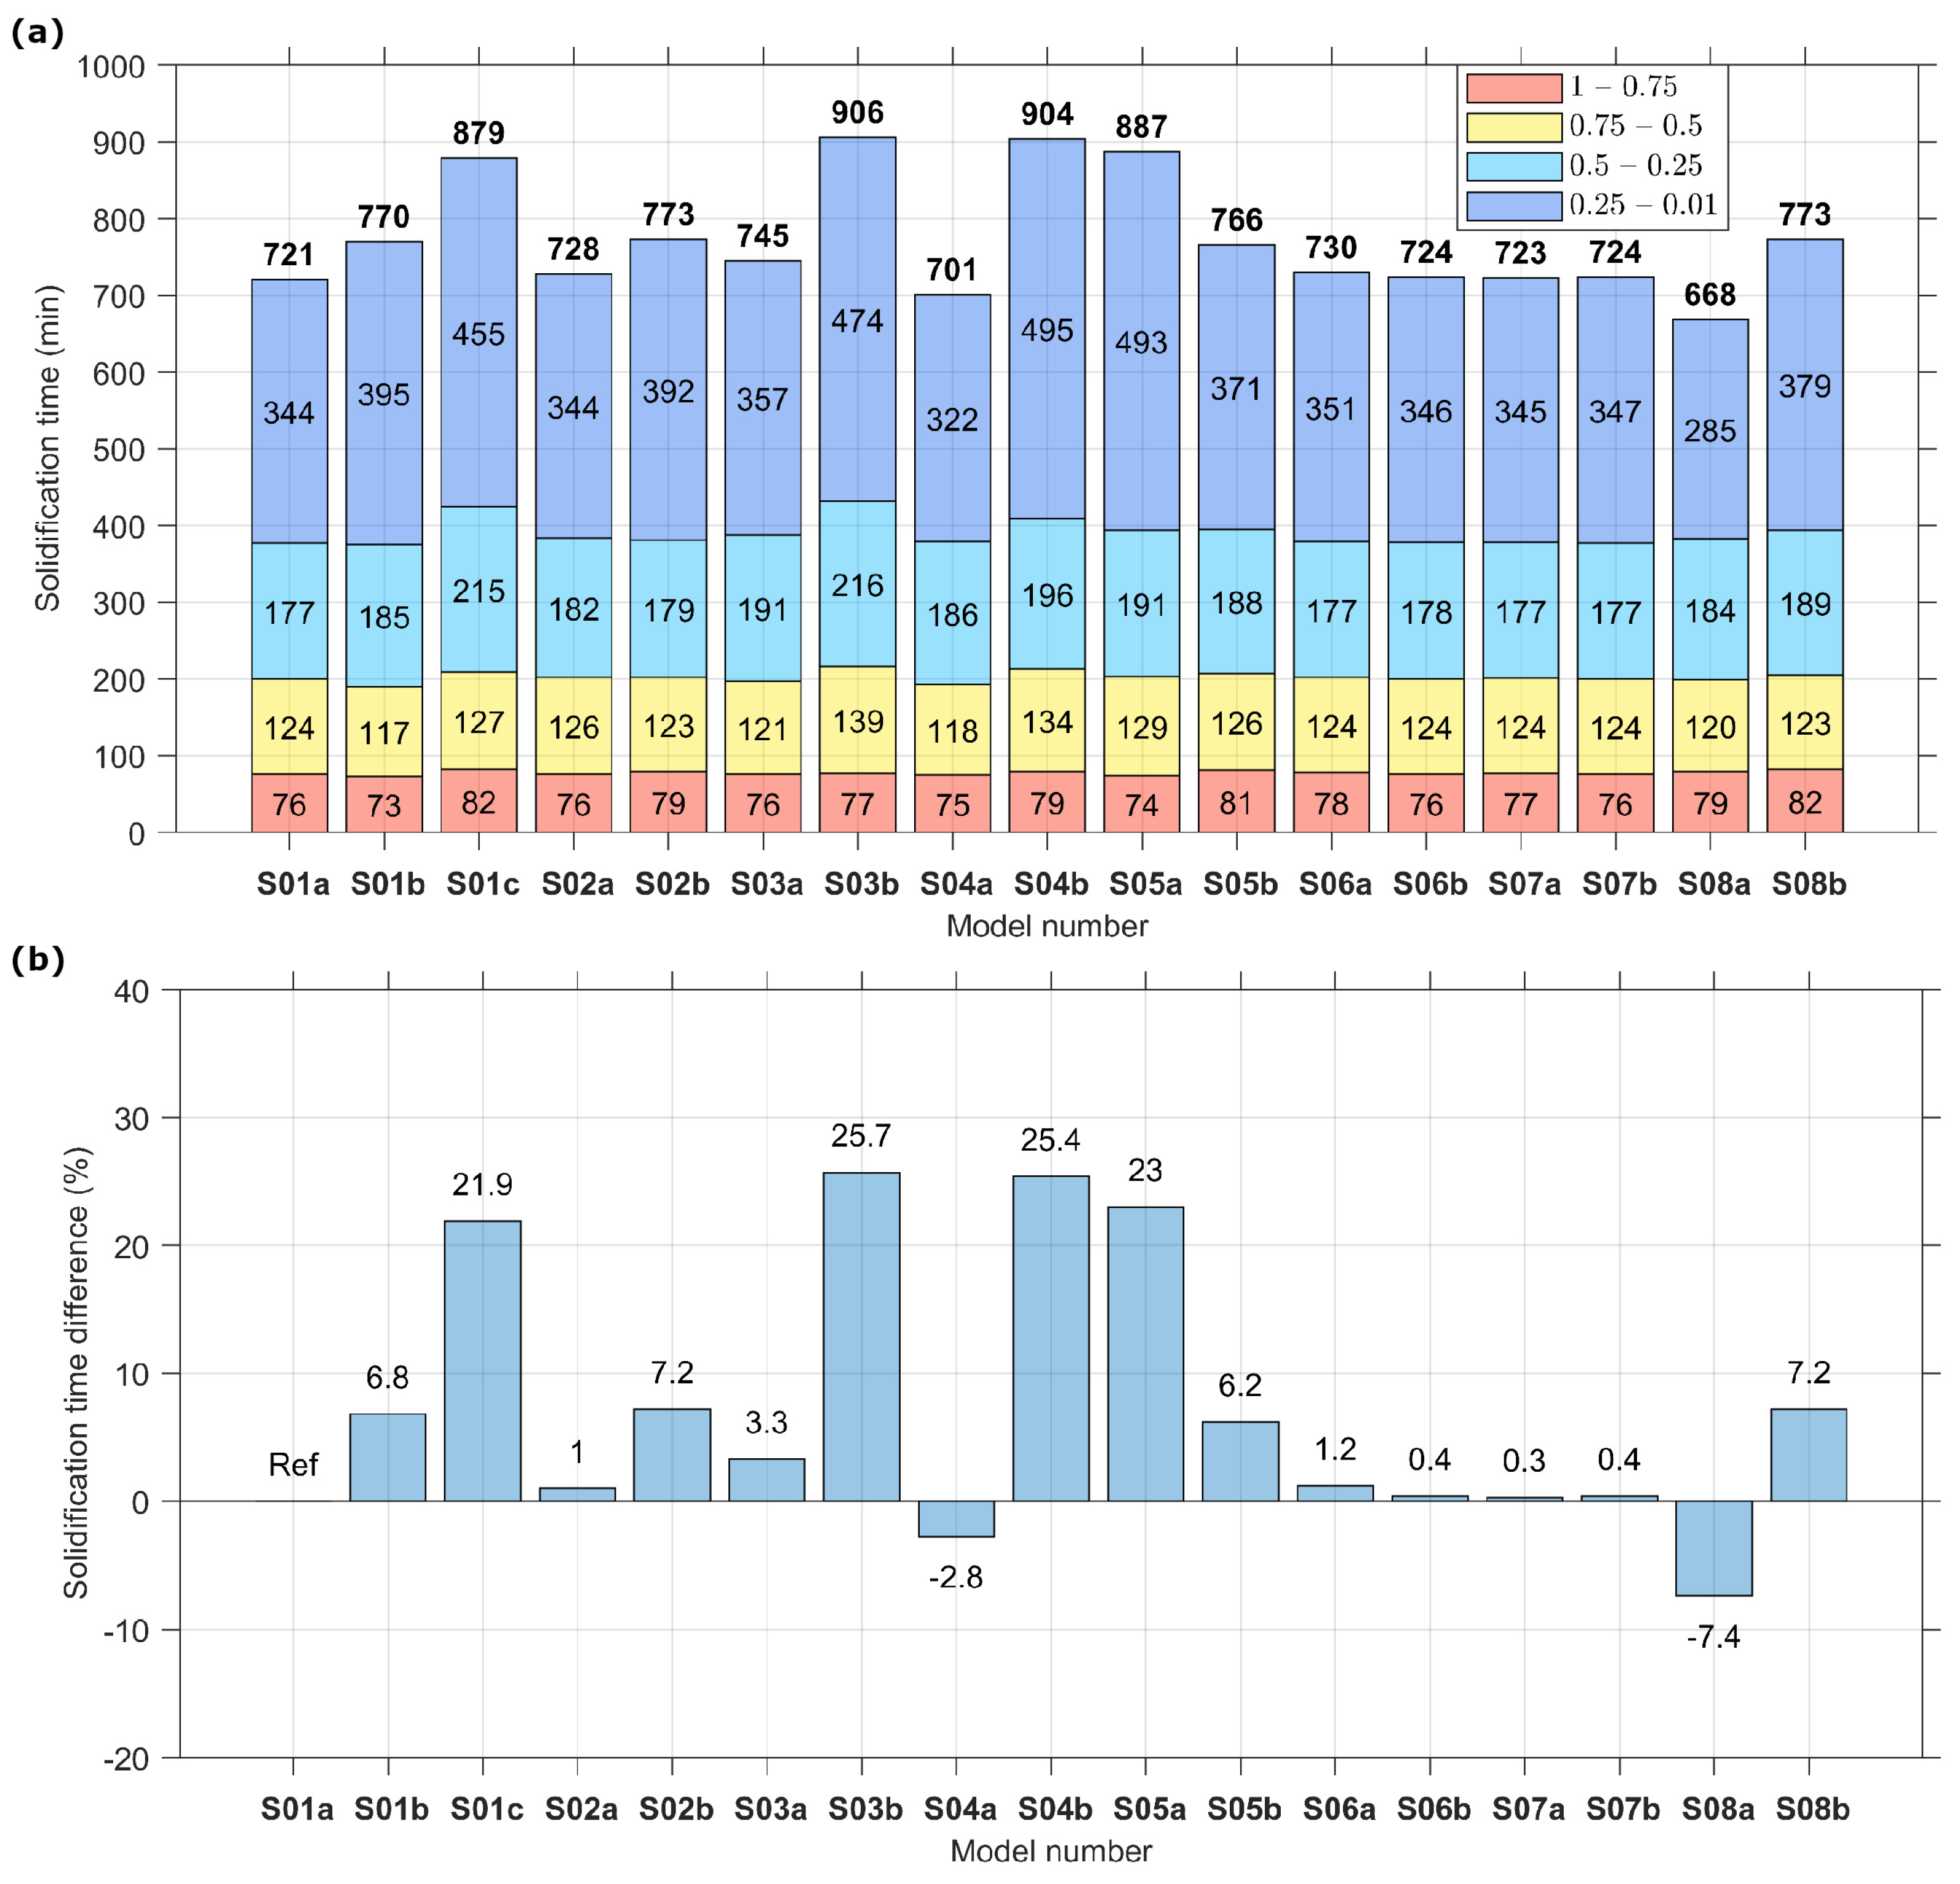
5.3. Solidification Time Comparison

In Figure 11, solidification times at four different stages and the time differences in relation to the reference S01a circular shell are presented. Similar to melting, and for the same reason, it takes an approximately equal amount of time (73–82 min) to reach 75% liquid PCM regardless of the case. During the second stage, when the liquid fraction reaches up to 50%, conduction continues to dominate. The times for this stage are longer in comparison to the first stage due to the expanding phase-change interface area. In the third and fourth stages, as the liquid fraction approaches 0.01%, the longest times are observed for the semi-circular shell shape in the downward position (S01c), vertical rectangle (S03b), vertical ellipse (S04b), and upward triangle (S05a). The solidification time for these shell shapes is over 800 min. This occurs because at the beginning of solidification convection currents transport colder PCM downward, and cases with high upper shell-to-tube distances and wide upper sections have more PCM in the upper part of the unit, where conduction strongly dominates.
Figure 11. Solidification process (a) timestamps for liquid fraction values of α = { 0.75 , 0.5 , 0.25 , 0.01 } and (b) percentage difference in solidification time compared to reference circular shape S01a.
Energies 16 07822 g011
Conversely, in these same stages, the shortest times are recorded for an isosceles trapezium in the upward orientation (S08a), horizontal ellipse (S04a), and circular shell shape (S01a). This is due to low shell-to-tube distances and narrow upper sections meaning there is less PCM to solidify. Similar to the melting process, the results for the trapezoid and horizontal ellipse show slight variations compared to the findings presented in [56]. This demonstrates that not only the shell shape but also the mutual proportions of the LHTES cross-sectional dimensions influence the melting and solidification times.
In comparison to melting, the solidification time reductions are not so spectacular due to conduction domination for a longer period of time.
When comparing S01b and S01c (semi-circle) with the same distance from the tube to the top of the shell, it becomes evident that the upper flat area of the shell (S01c) is disadvantageous when solidification occurs. This same observation applies when comparing cases S08a and S08b (trapezium).

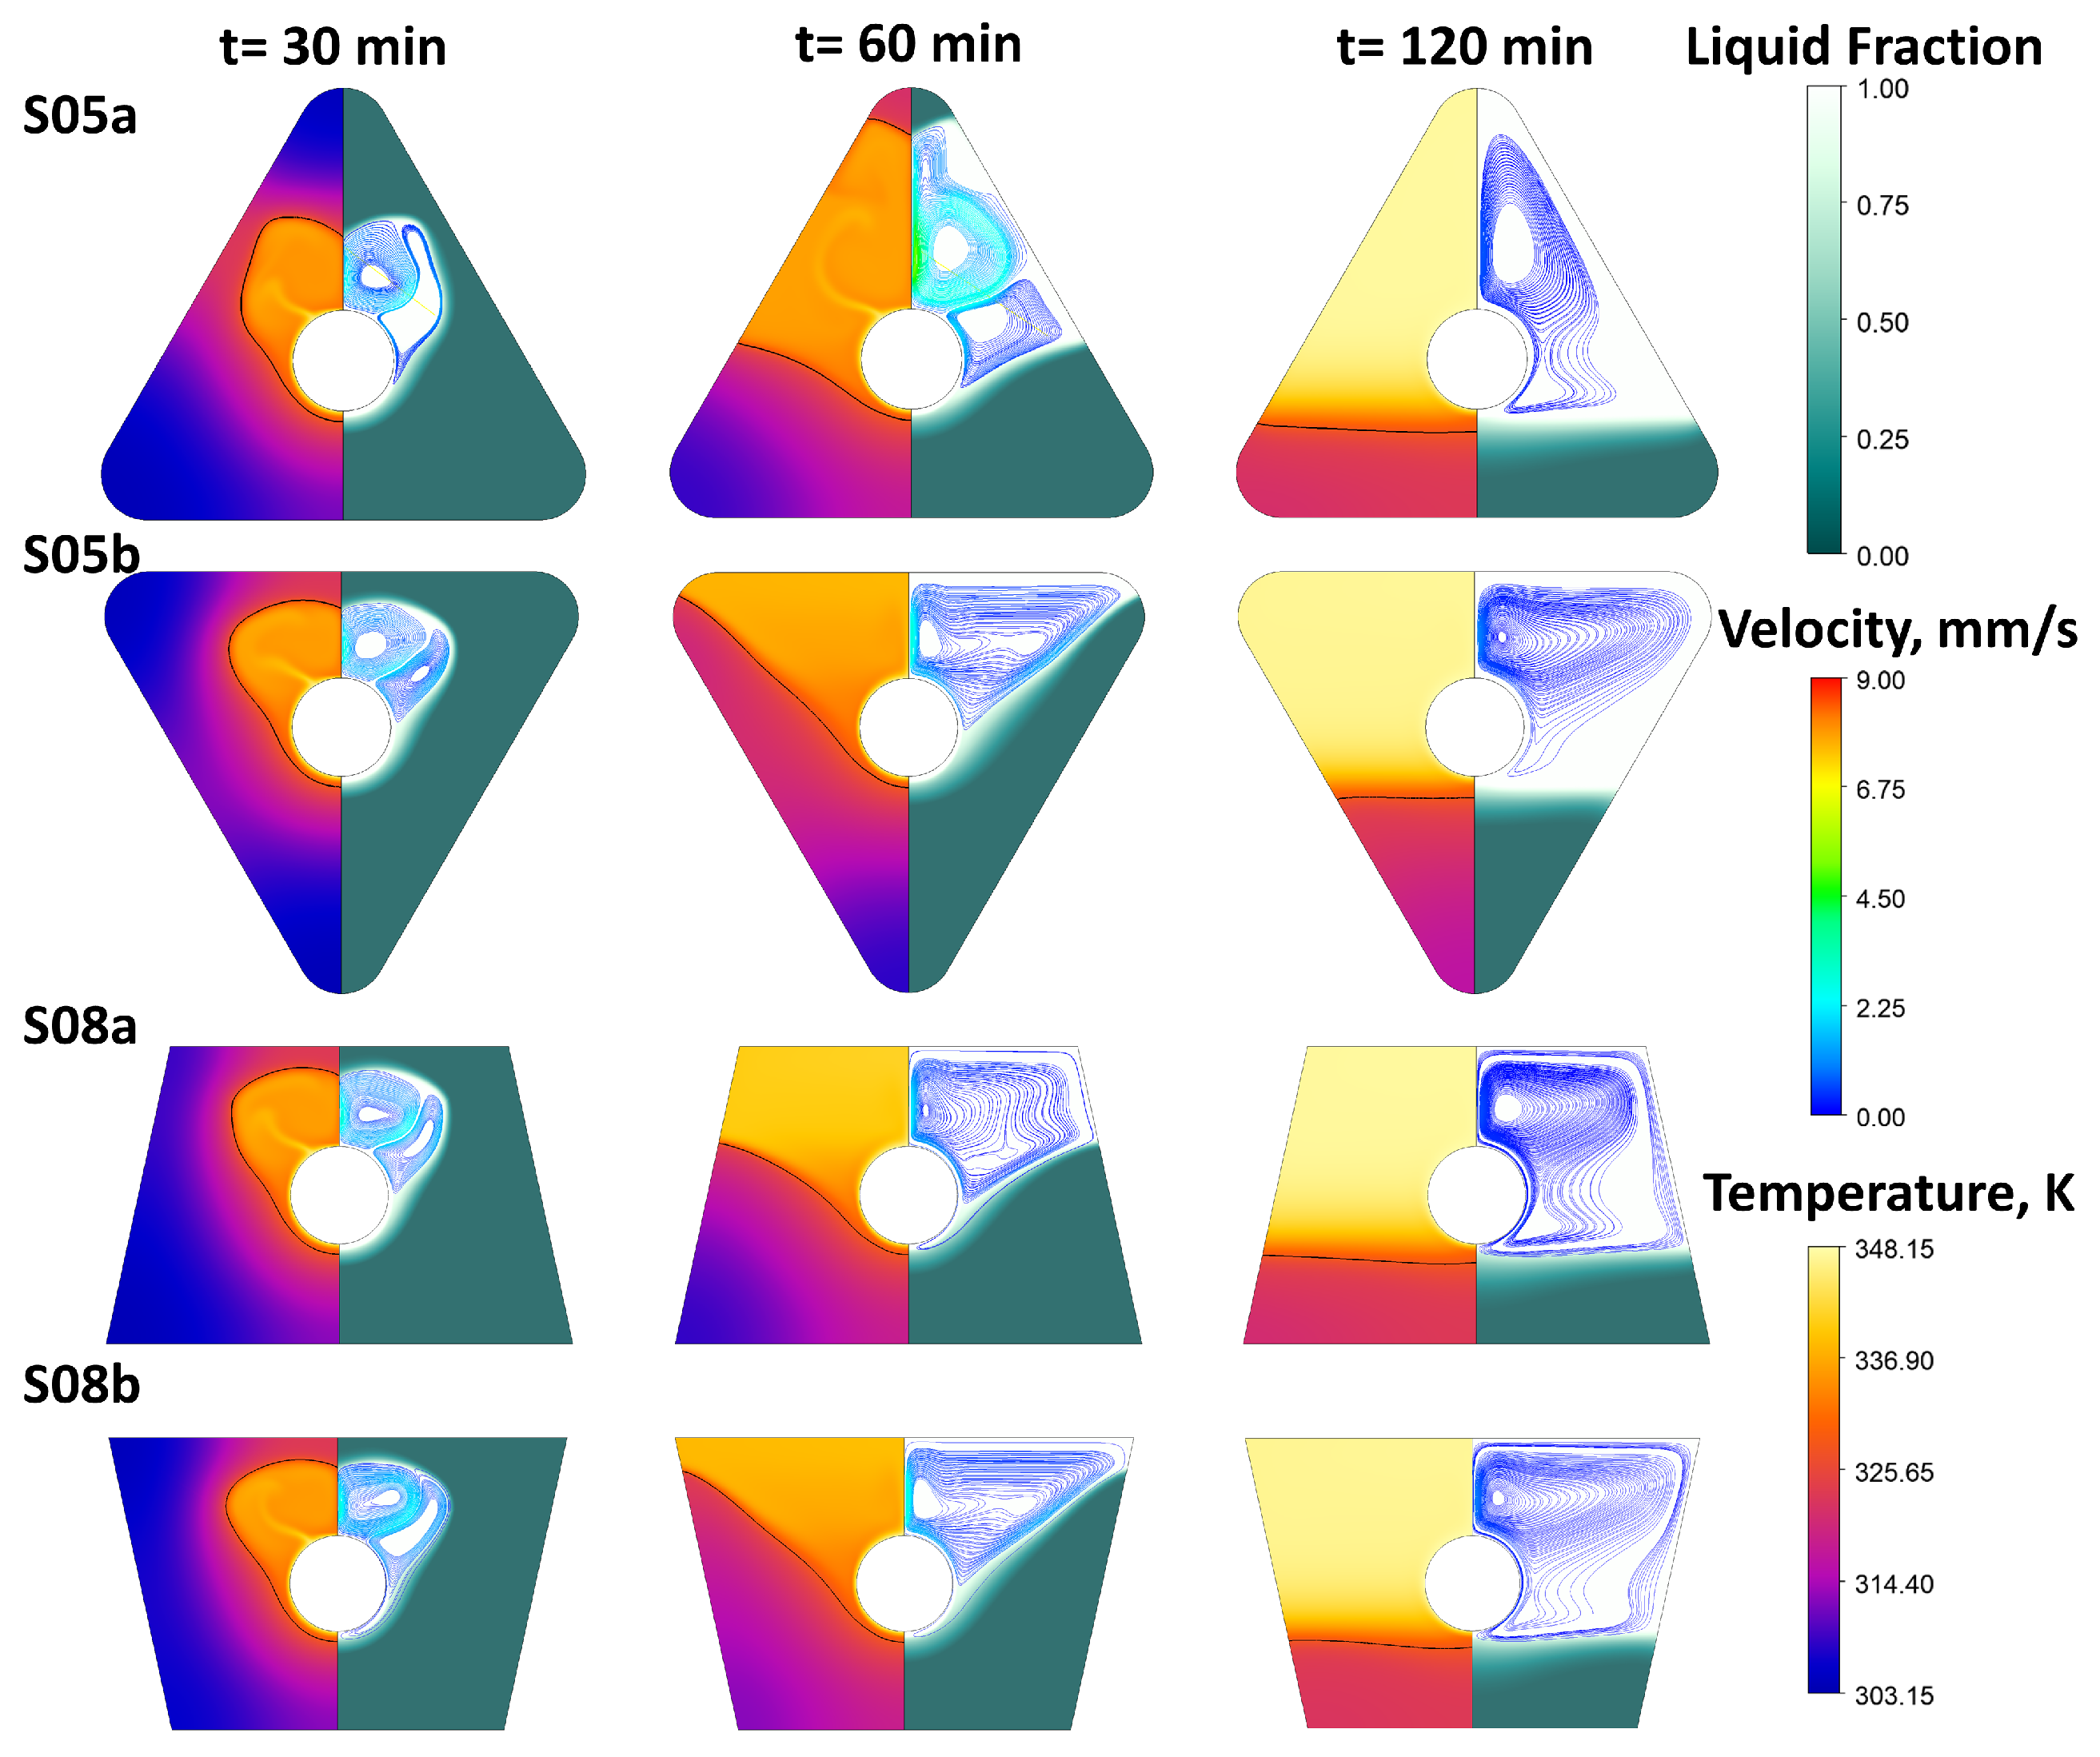
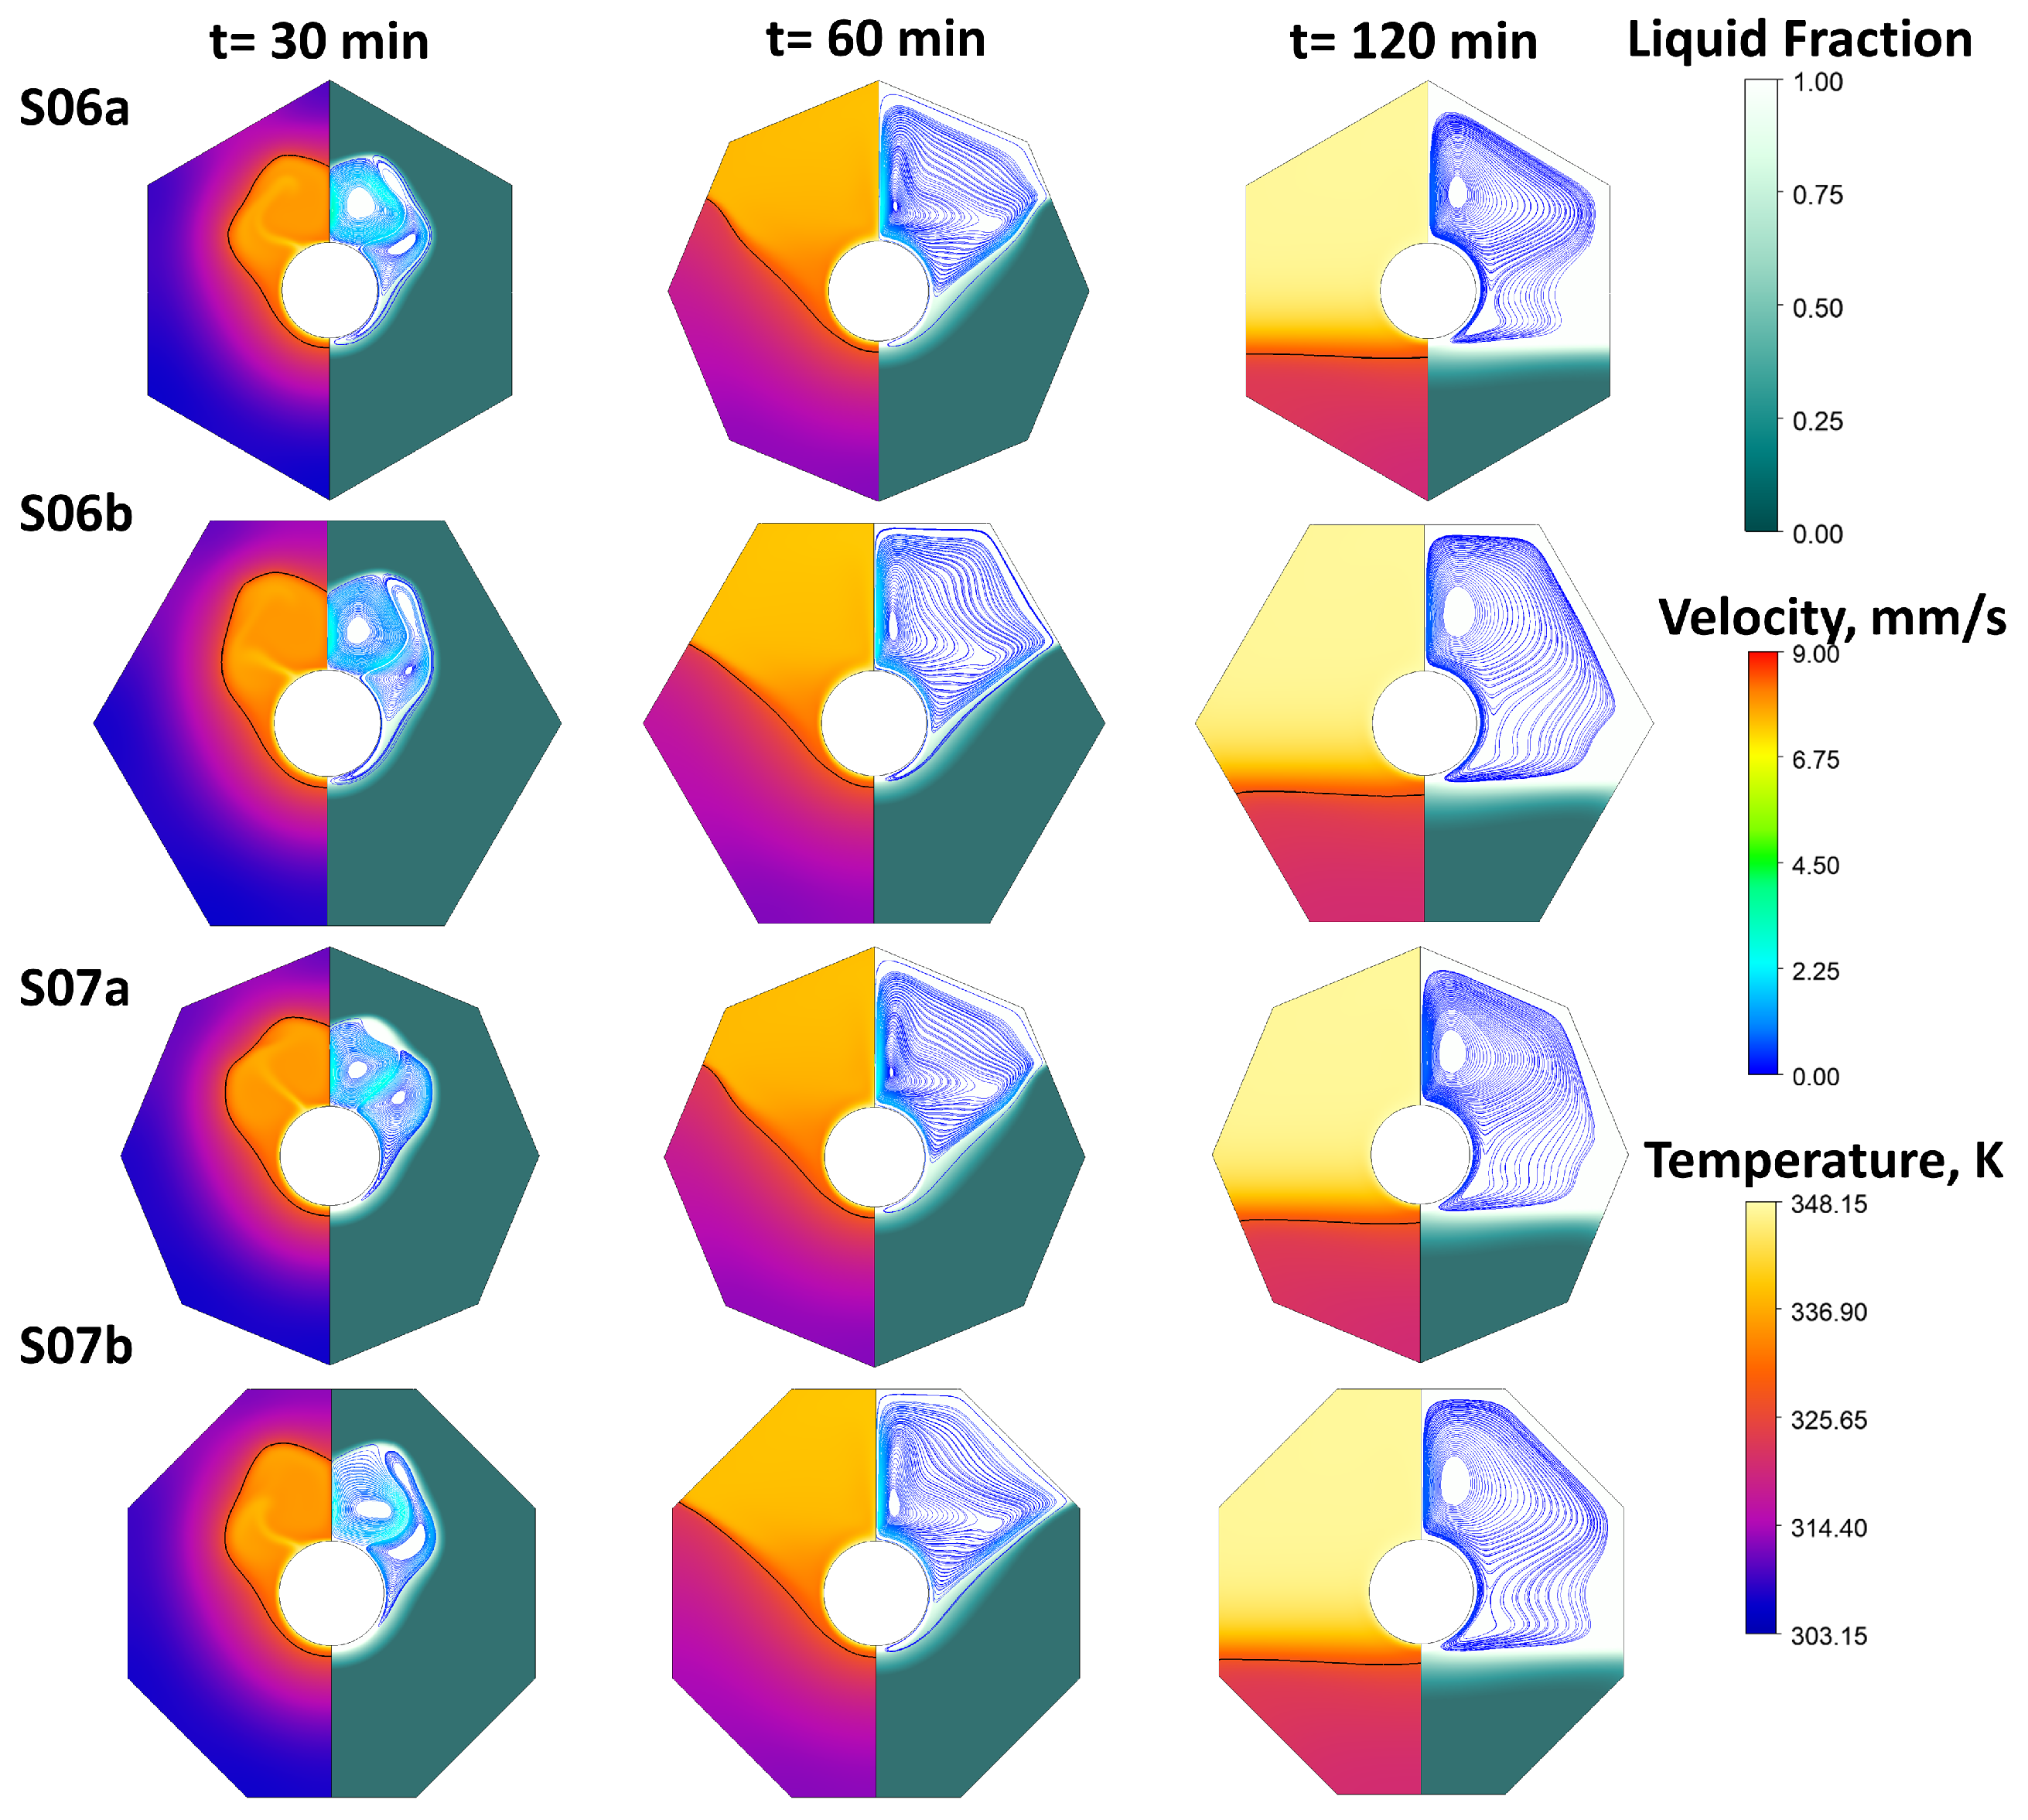
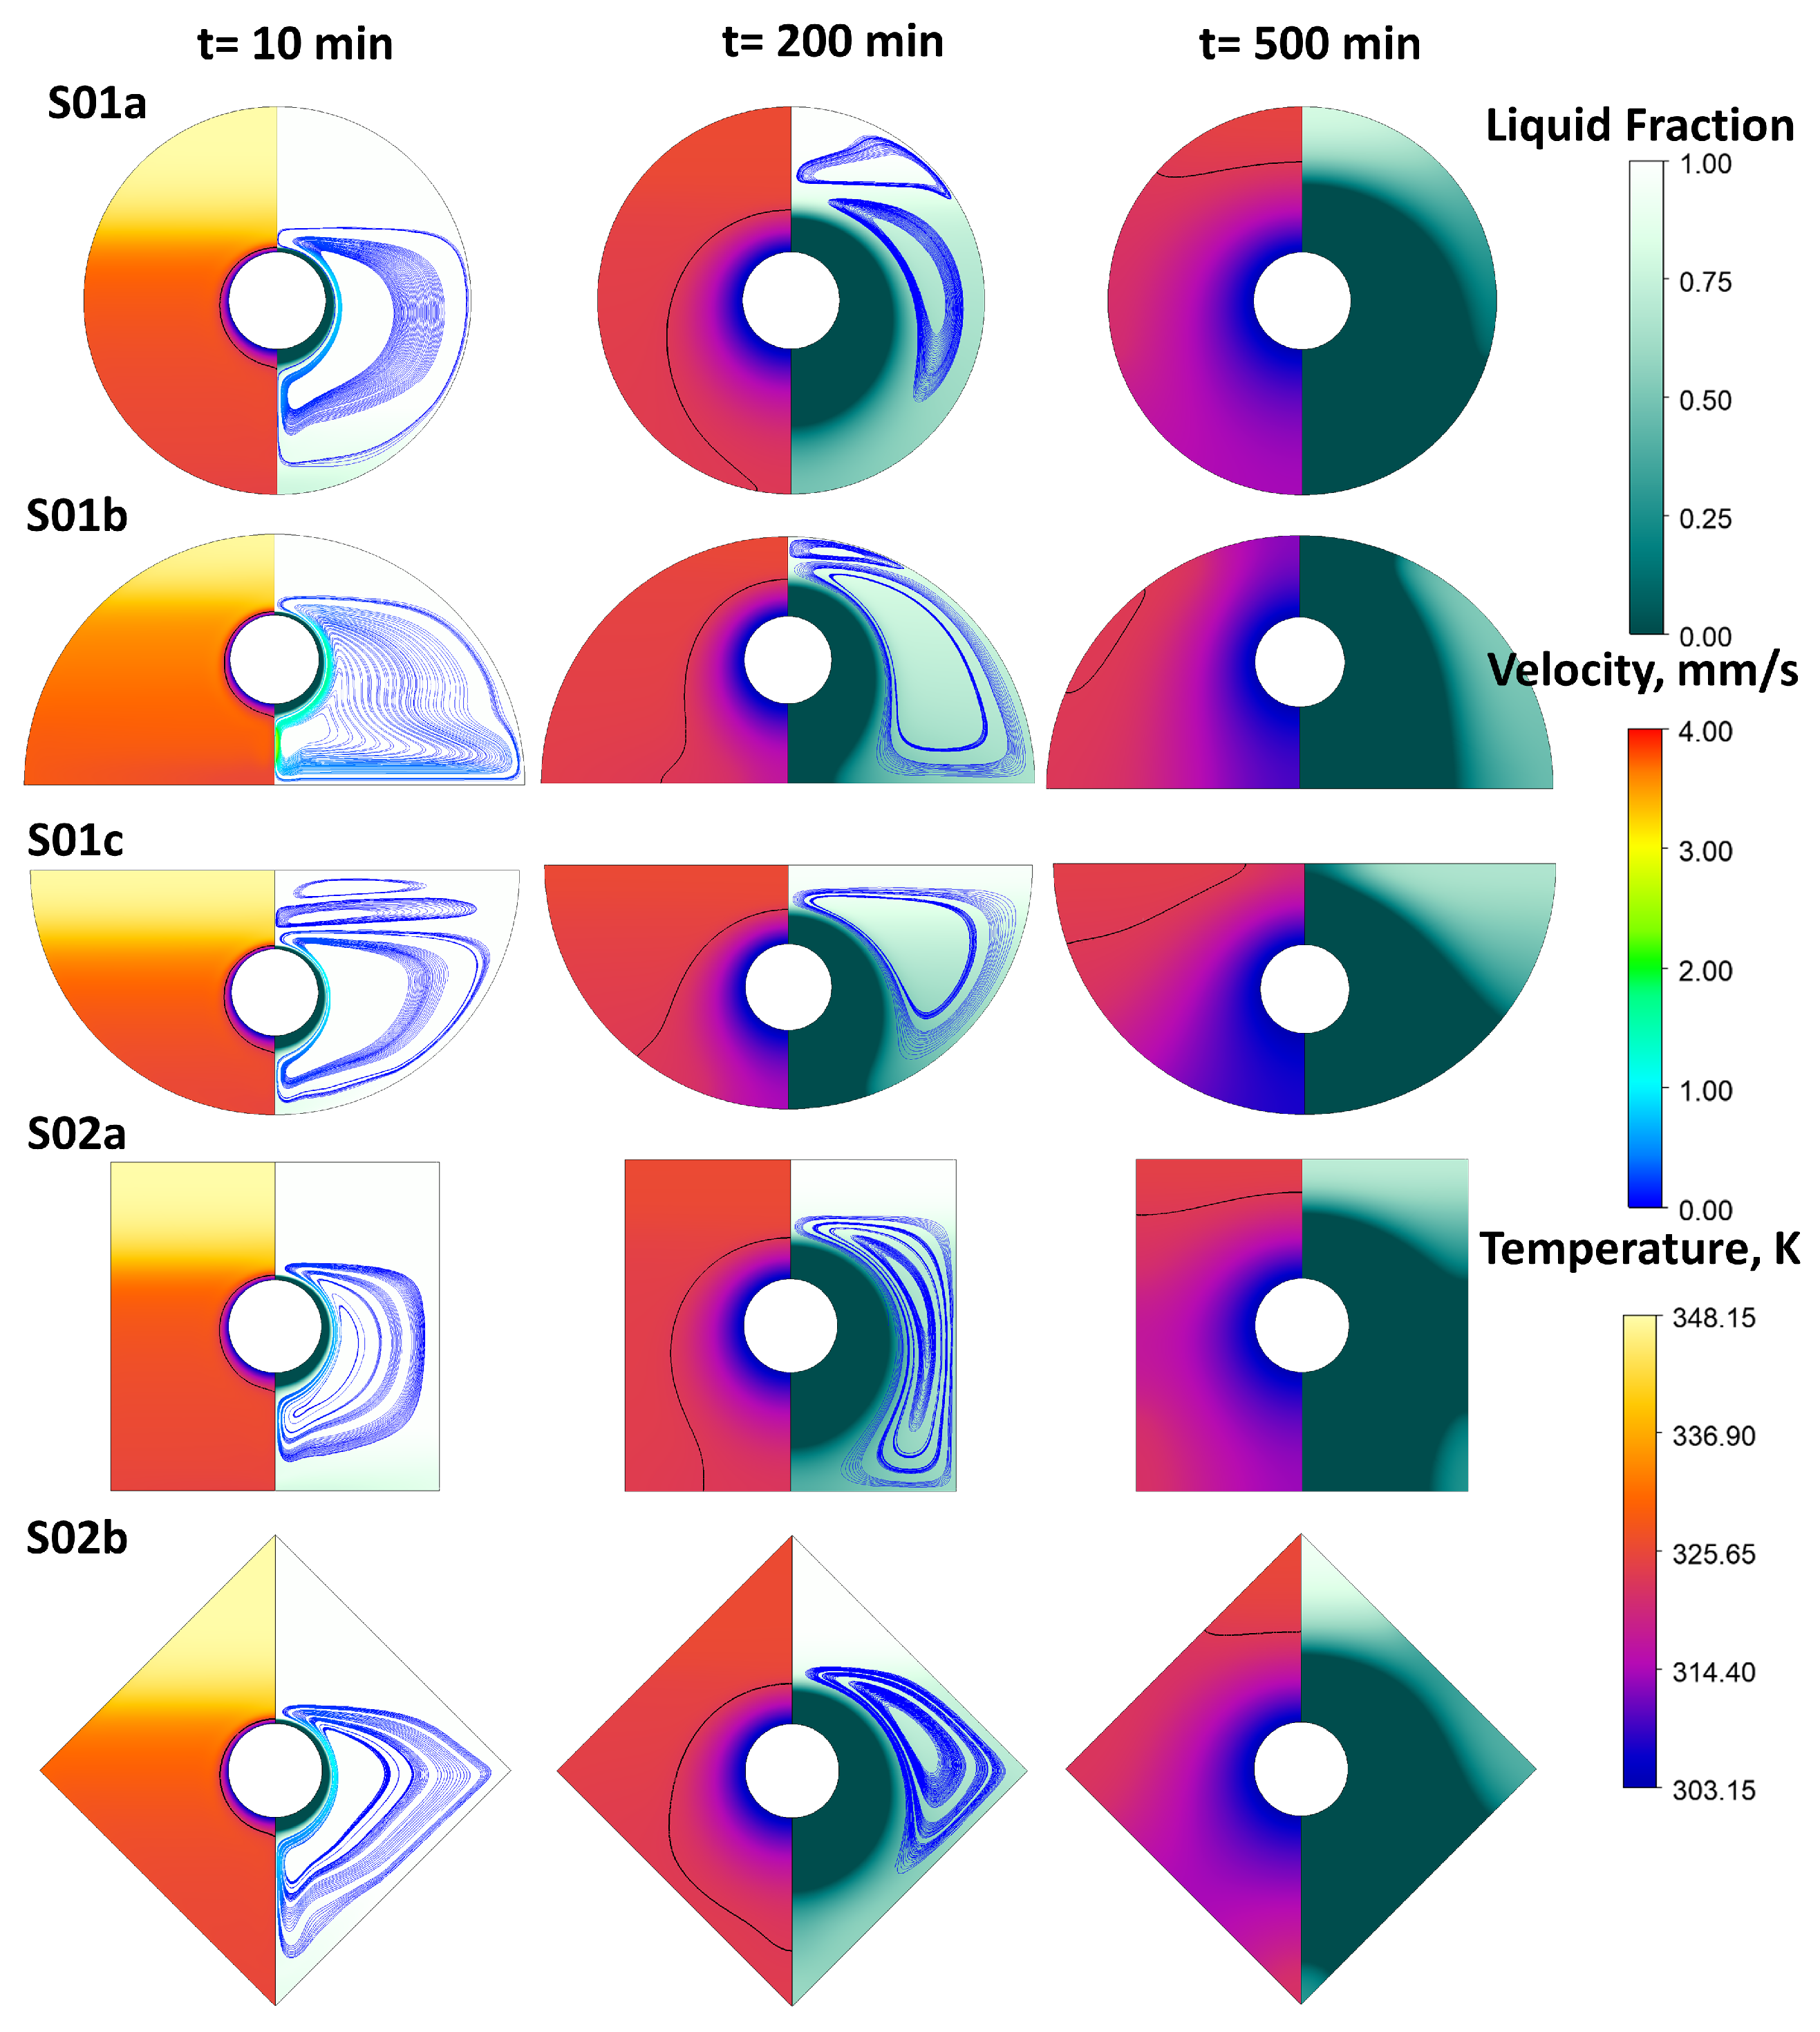
5.4. Temperature and Liquid Fraction Distributions during Solidification

In Figure 12, Figure 13, Figure 14 and Figure 15, the temperature and liquid fraction distributions during solidification and selected time points are presented. The black line represents the isoline of 50% PCM liquid fraction. We have also marked the streamlines coloured by velocity to better visualise the convection currents at the beginning of the process.
For all cases, the liquid–solid interface at the beginning of the solidification process is the same shape. The PCM first solidified in the closest vicinity of the tube, with a narrow solid PCM layer above the pipe and a wider layer below the tube. This is attributed to the cold convection current, which moves liquid PCM from the top of the tube toward the bottom of the shell. Similar convection currents are present for all cases, but their velocity rapidly decreases, and conduction becomes the dominant heat transfer mechanism. The temperature distribution is stratified for all of the analysed cases.
On temperature distribution figures at a time of 200 min, we can observe that the high temperature values are for the S03b, S04b, and S05a configurations (Figure 12, Figure 13, Figure 14 and Figure 15). This is due to higher shell-to-tube distances and accumulation of more liquid PCM in the upper shell part than the rest of the configurations.
When we compare the S01b and S01c configurations, it can be seen that at the time 500 min there is more liquid PCM in the S01c configuration due to the wide-top shell shape. A similar situation appears for the S08a and S08b configurations. A narrow upper shell shape and central tube placement are beneficial for reducing the solidification time. This is due to downward convection currents at the beginning of the solidification process and a lower amount of PCM in the upper part of the exchanger.
Figure 12. Liquid fraction and temperature spatial distribution, with streamlines coloured by velocity value for S01a,b,c and S02a,b during solidification.
Energies 16 07822 g012
Figure 13. Liquid fraction and temperature spatial distribution, with streamlines coloured by velocity value for S03a,b and S04a,b during solidification.
Energies 16 07822 g013
Figure 14. Liquid fraction and temperature spatial distribution, with streamlines coloured by velocity value for S05a,b and S08a,b during solidification.
Energies 16 07822 g014
Figure 15. Liquid fraction and temperature spatial distribution, with streamlines coloured by velocity value for S06a,b and S07a,b during solidification.
Energies 16 07822 g015
When we compare the S05a and S05b configurations, it can be observed that at the time 500 min there is more liquid PCM in the S05b configuration but with a lower temperature than in S05a. The S05b configuration has a tube placed closer to the top, a larger solid–liquid interface, and, despite the much wider upper shell, solidification occurs faster.
A slight difference exists in solidification times, temperature distributions, and liquid fraction when we compare the reference configuration (S01a—circular) with the hexagonal (S06a, S06b), and octagonal (S07a, S07b) configurations. This is due to the fact that these configurations are similar in shape to the reference configuration. In Figure 11, we can see only up to 1% difference in the solidification time for these configurations. Nevertheless, the advantage of rectangular and hexagonal configurations is the possibility of denser arrangements in comparison to circular ones. The interesting configuration with low solidification times and possible dense arrangements are the isosceles trapezium shell shapes (S08a,b).

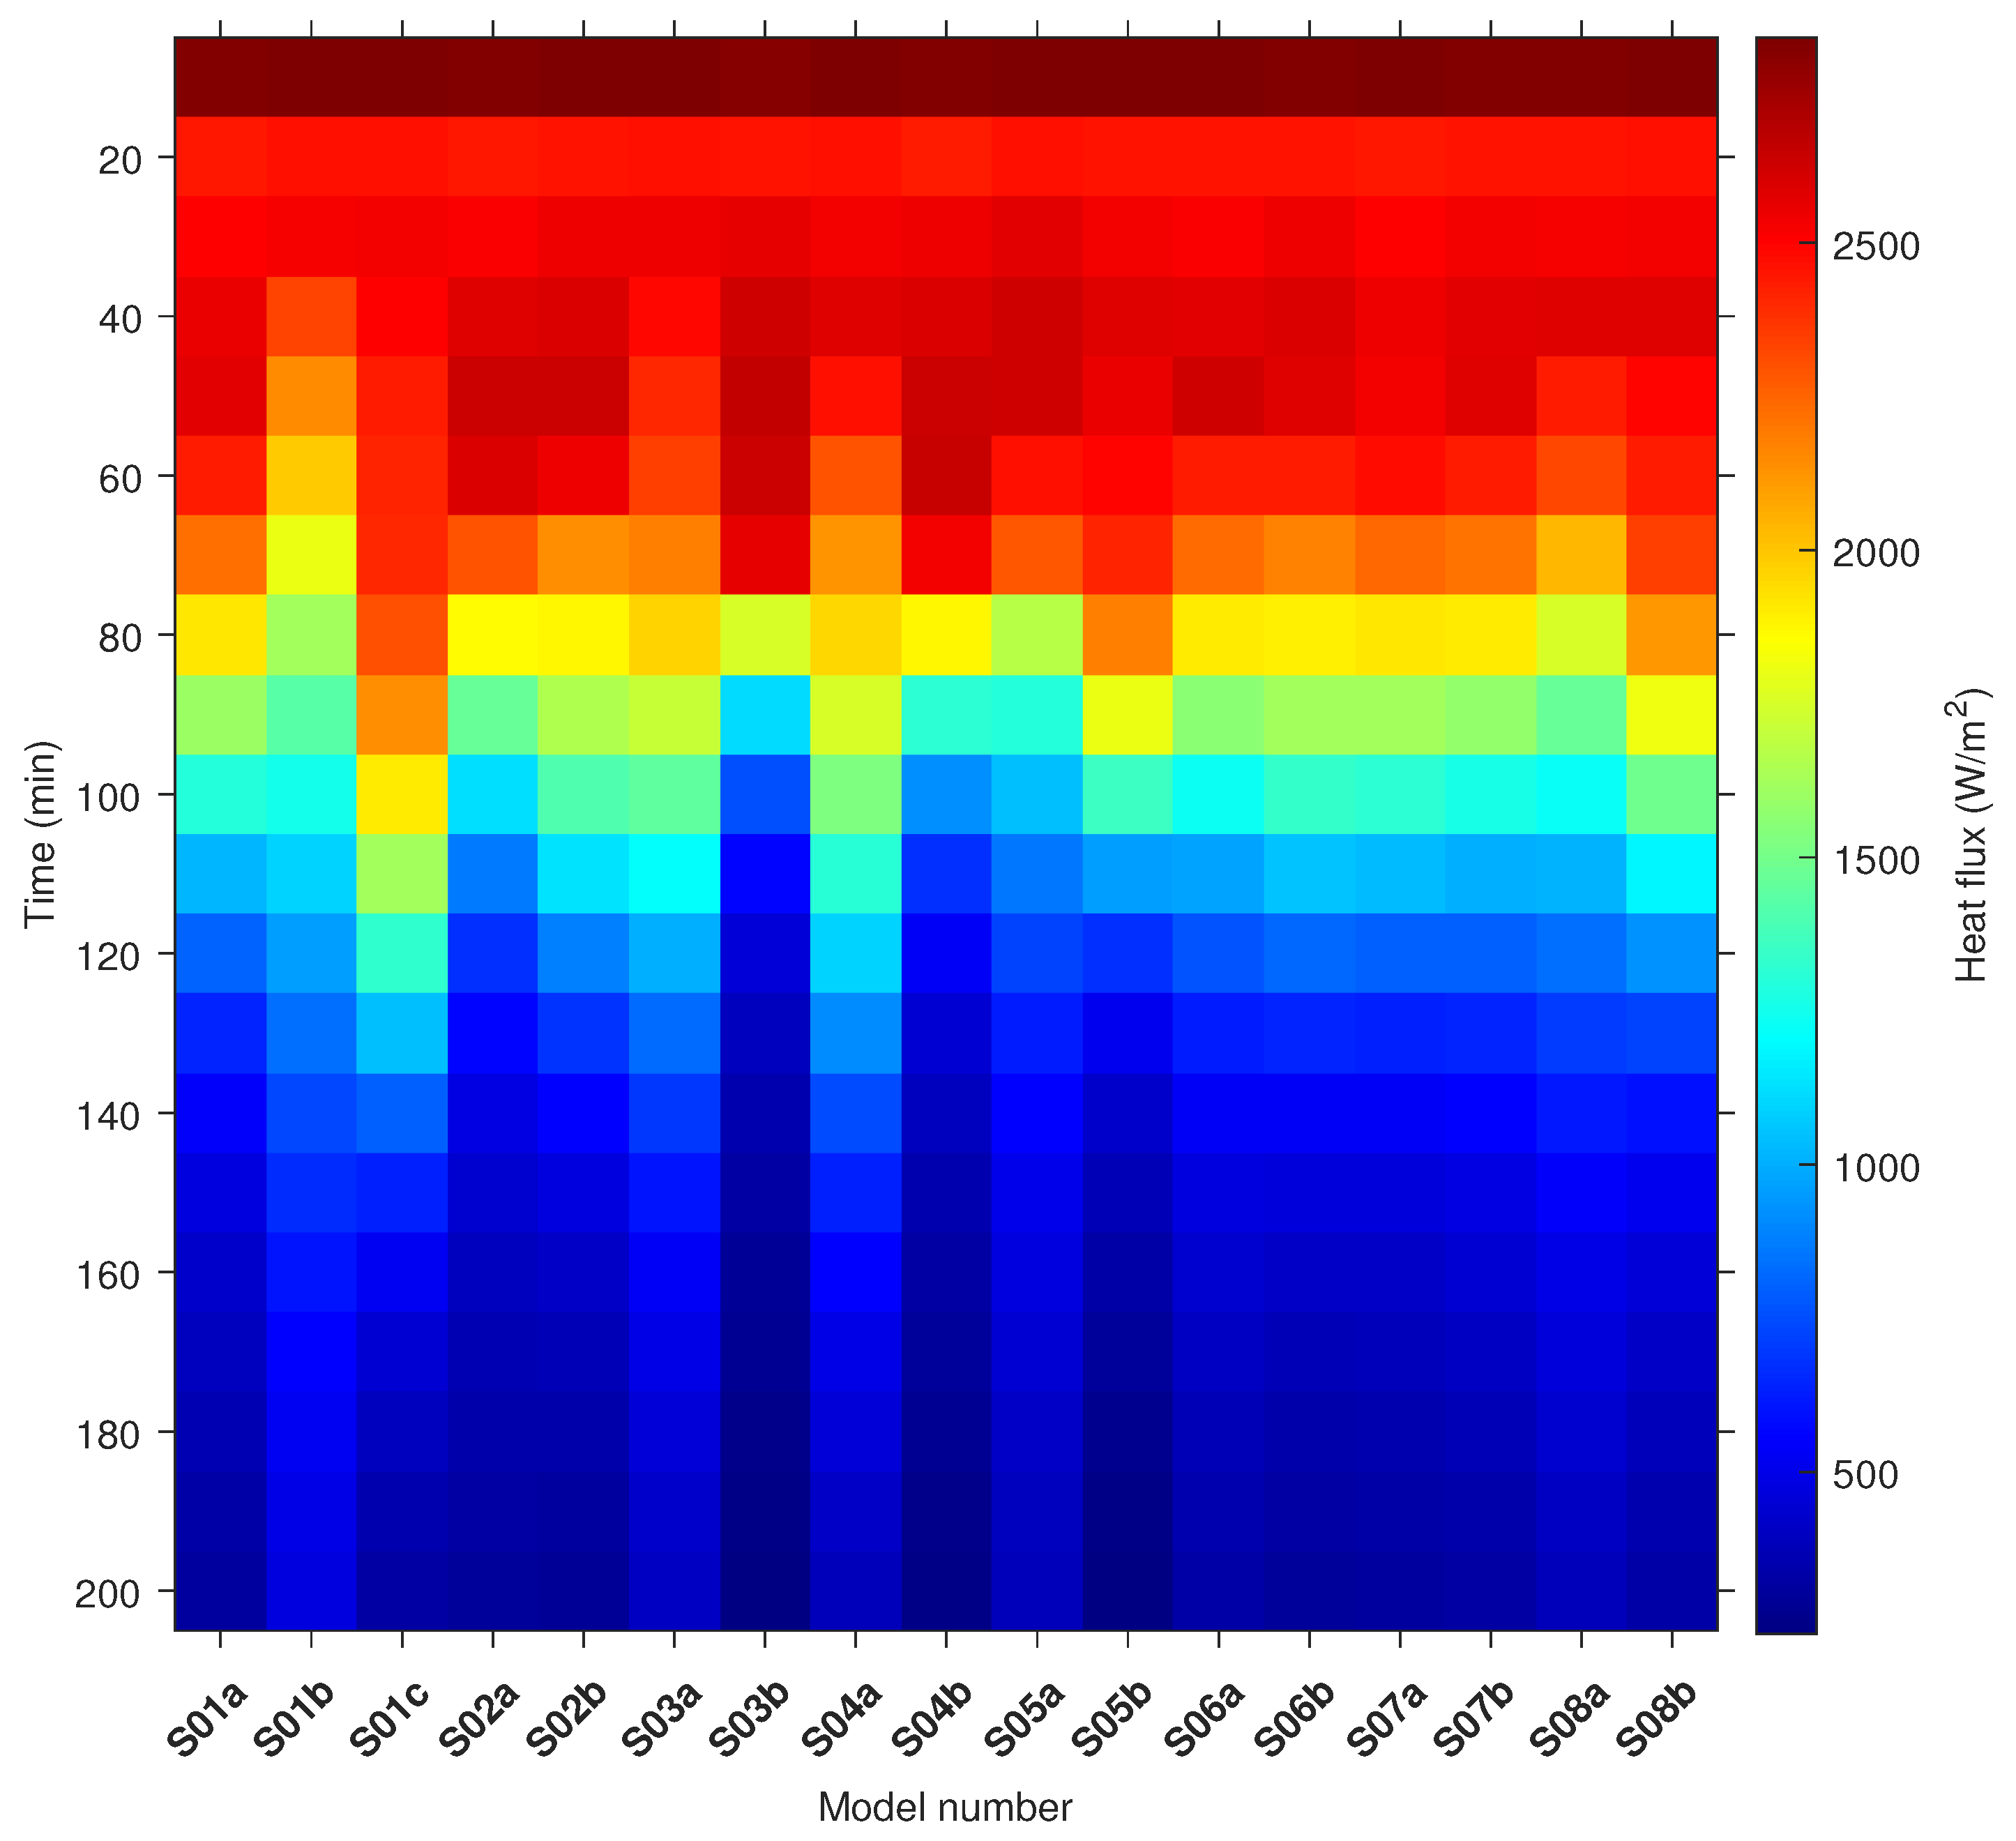
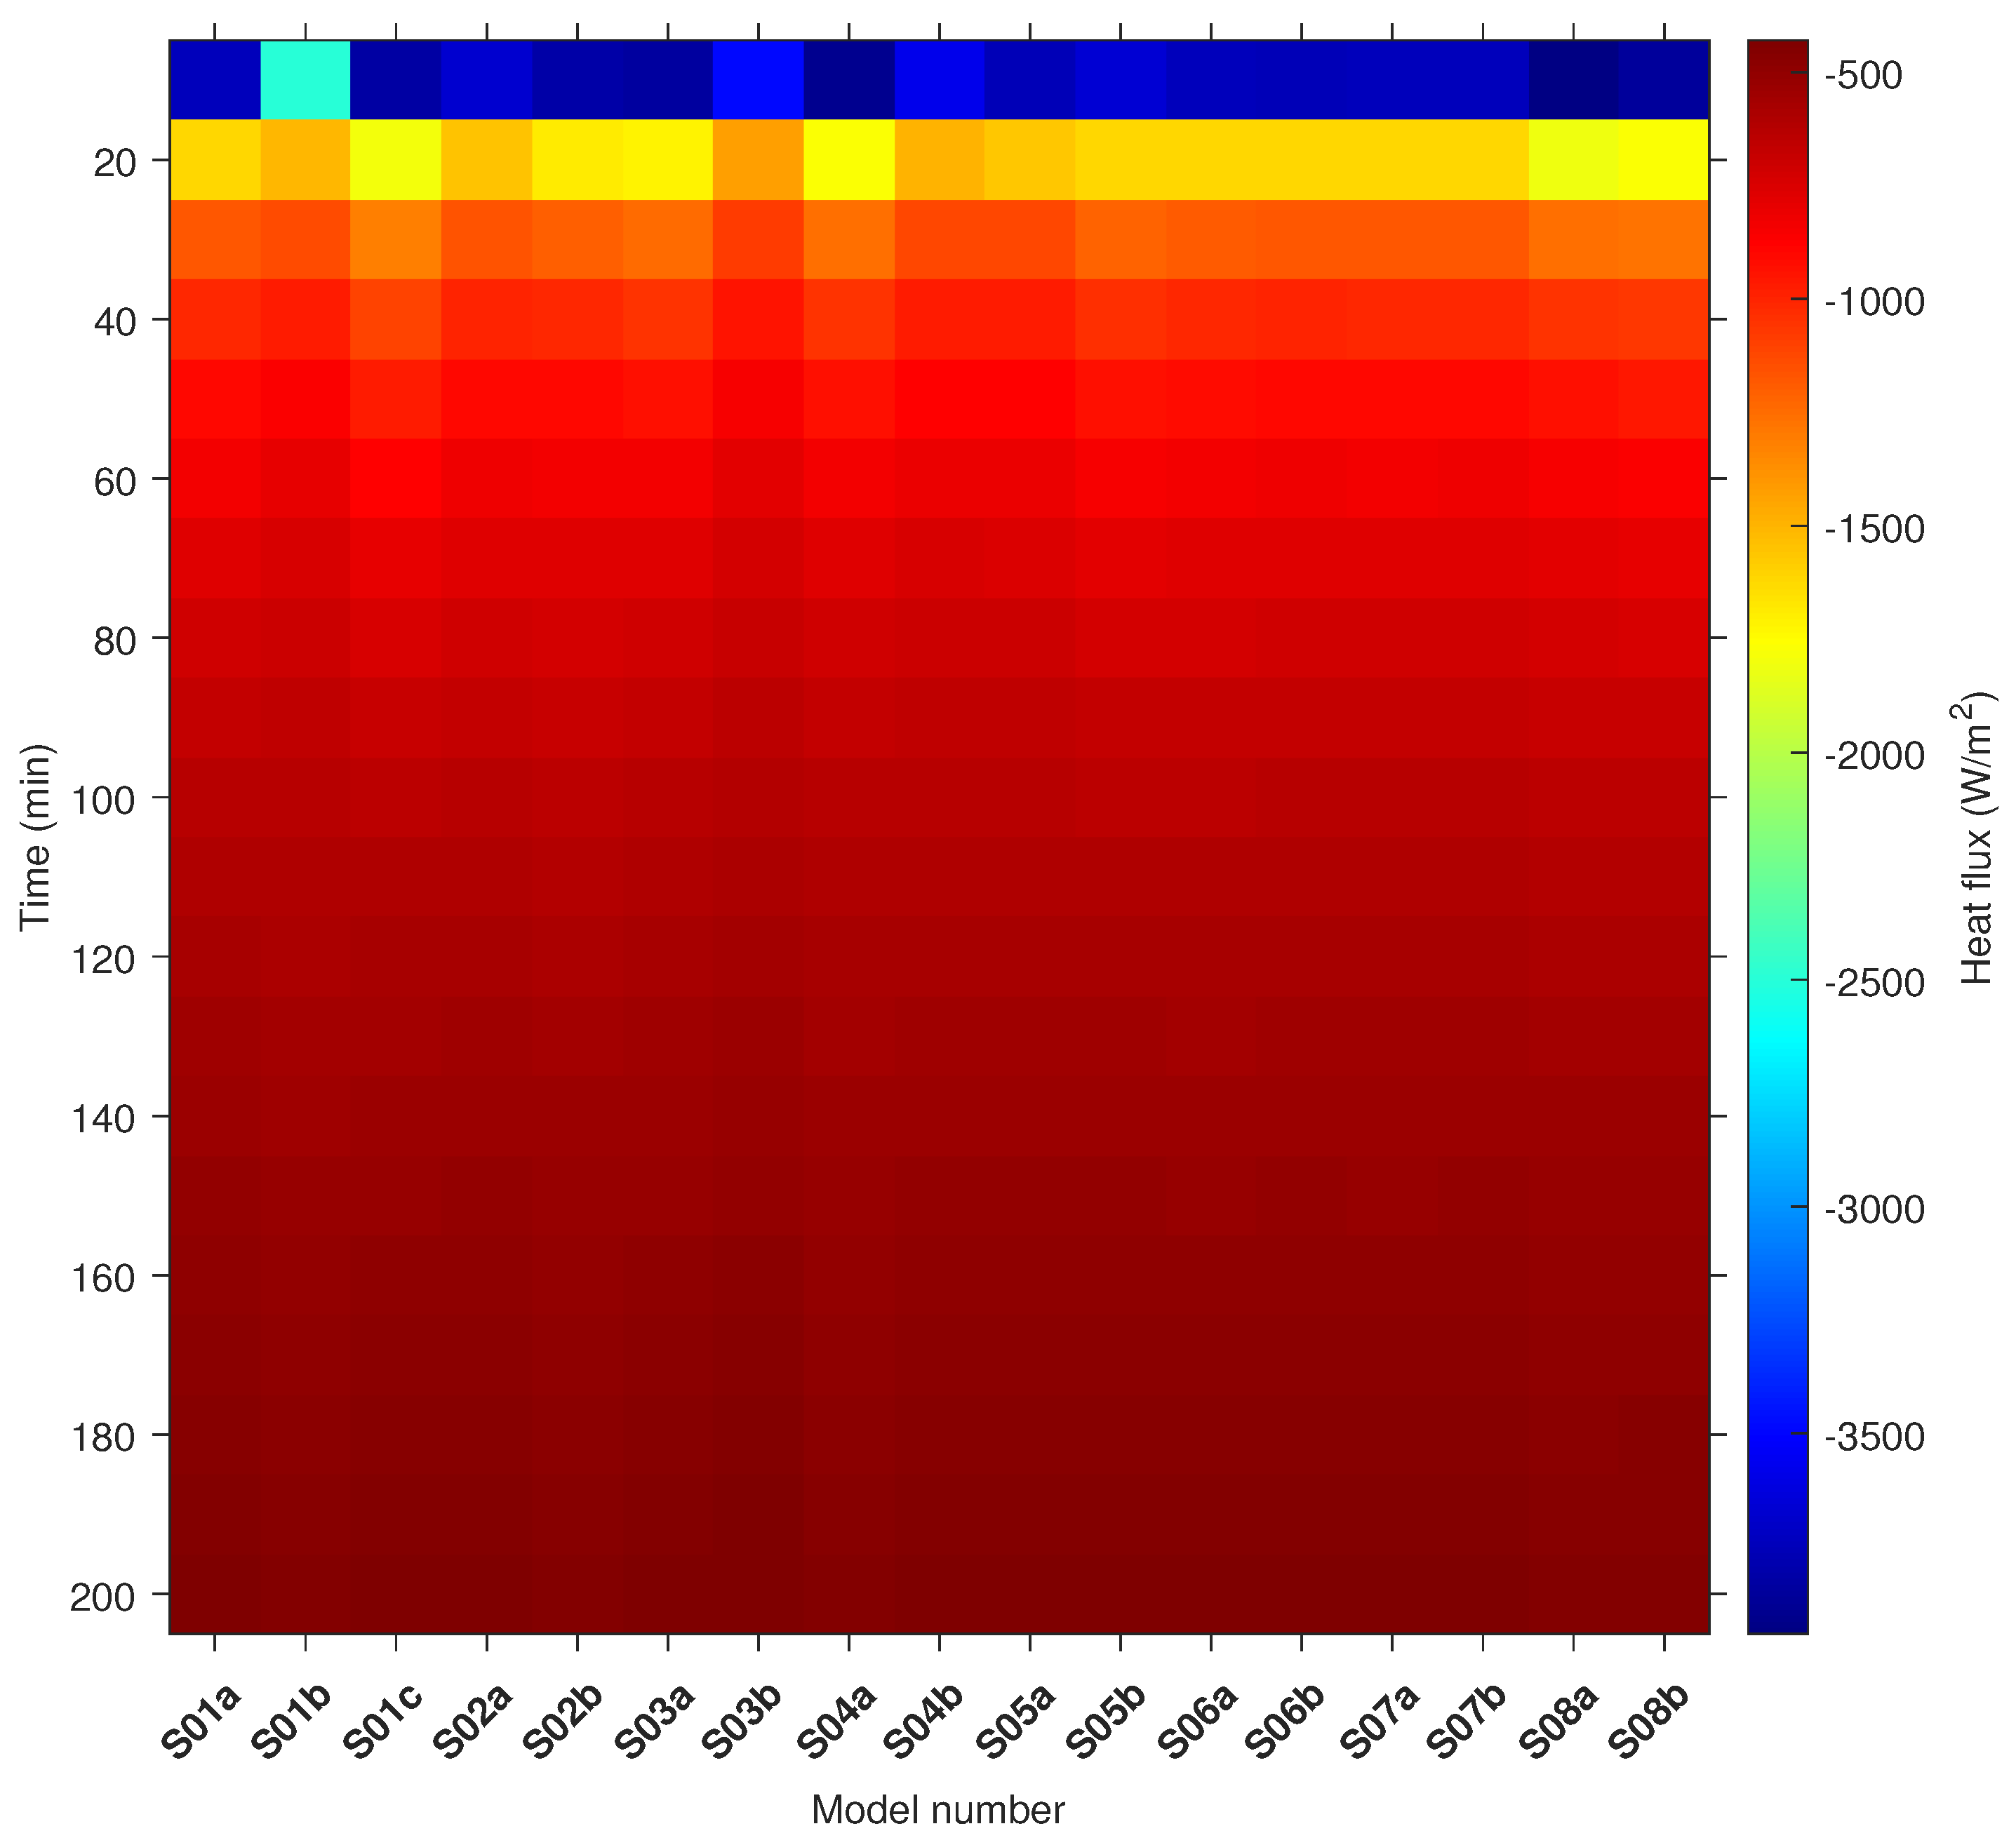
5.5. Heat Flux Comparison

A large number of simulation data need reduction, so the facet average of heat flux on a tube surface was computed (17) and reported every 1 s of the simulation. Next, the averages over 10 min were calculated (18) and are presented in Figure 16 and Figure 17.
q a v g ( t ) | t = i = 1 n u m q i ( t ) n u m
q a v g , t i m e = 10 min = t = 1 600 q a v g n u m
where n u m —number of the cell surface, q i —heat flux at the i-th cell surface, and t—time.
The maximum values of the heat flux in the first 10 min for all structures are the result of the adopted initial conditions and the start of the melting process. These values are also the result of the large temperature difference between the pipe wall and the surrounding PCM. In some cases, and within the time range of 40–60 min, we can clearly notice the second extreme due to the development of convection currents, especially for slender structures.
In Figure 16, we can see that the semi-circular shell shape in the downward position (S01c), and the horizontal rectangular (S03a) and elliptical (S04a) shell shapes are characterised by a long period of high average heat flux at the tube surface (up to time equal 120 min). Therefore, it can be said that for these configurations the heat transport process occurs moderately, and not as in the case of the S03b structure where we can observe local maxima of the heat flux and its rapid decline. A greater distance between the tube wall and the top surface of the shell (like S03b, S04b) promotes the achievement of high heat flux values due to convective heat transfer and the mixing of the liquid PCM. However, in a relatively short time, the liquid PCM reaches the pipe level, the temperature difference between the pipe wall and the PCM is no longer so large, and the entire process quickly slows down.
In Figure 17, we can observe the heat flux average values during solidification. The negative values result from the fact that heat flows from the PCM to the HTF pipe. The maximum heat flux values in the first 10 min for all structures are the result of the adopted initial conditions and the start of the solidification process. At 20 min it can be seen that the S08a configuration is characterised by the highest average heat flux, leading to the greatest reduction in the solidification time. However, in all configurations, the heat flux on the pipe wall tends to zero quickly due to the fact that heat conduction dominates.

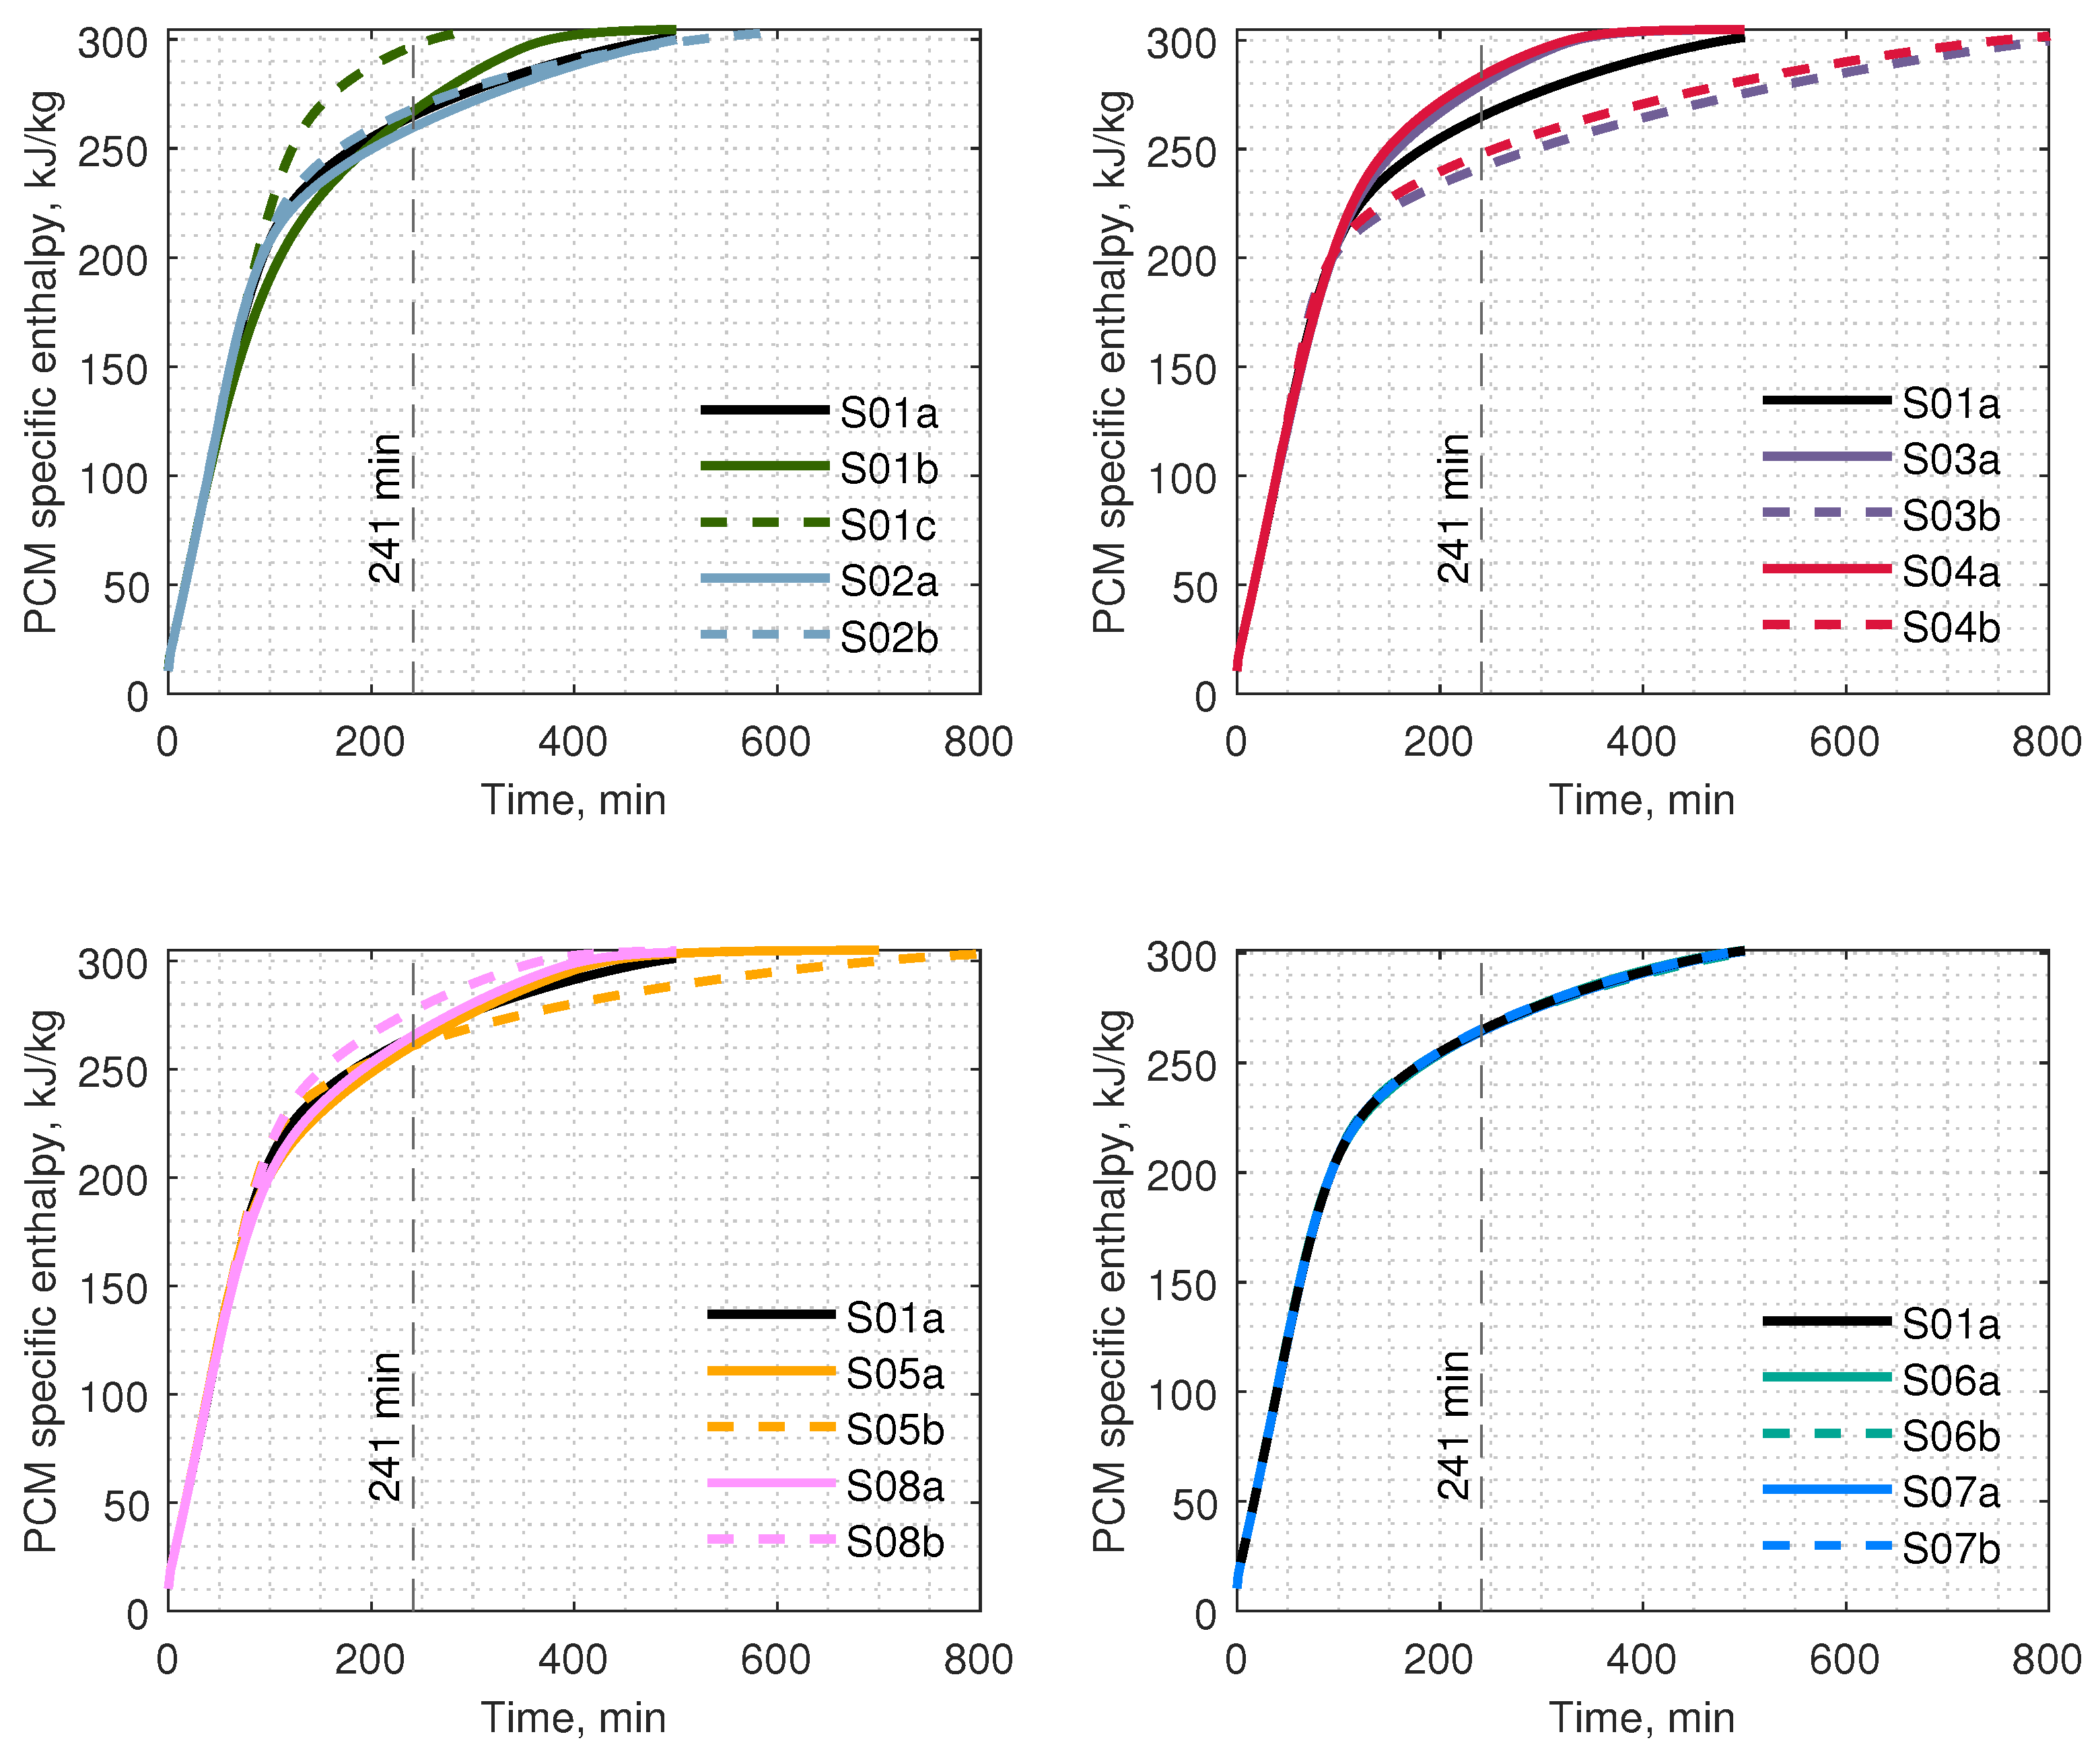
5.6. Specific Enthalpy during Melting and Solidification

Figure 18 and Figure 19 present the specific enthalpy of the PCM during the melting and solidification processes, respectively. For better clarity, the curves were divided into four charts. In every chart, the reference curves for models S01a (melting) and S08a (solidification) are present. The vertical line at 241 min refers to the shortest melting time for a semi-circular shell shape in the downward position (S01c). The vertical line at 668 min refers to the shortest solidification time for an isosceles trapezium in the upward orientation (S08b).
In Figure 18, we can observe that the PCM specific enthalpy increases linearly up to 75 min, with the same slope coefficient for all cases. This confirms previous conclusions about the same heat transport process and mechanism regardless of the shape of the shell. After 75 min, the rate of enthalpy increase slows down, with different rates depending on the case. This is due to conduction being dominant for the rest of the process. A high enthalpy in a relatively short time was achieved for the semi-circular shell shape in the downward position (S01c), horizontal rectangular (S03a), horizontal elliptical (S04a), and isosceles trapezium in the upward orientation (S08b) structures. All this confirms previous conclusions. For the hexagonal (S06a,b) and octagonal (S07a,b) shell shapes, the enthalpy changes over time were almost identical to the reference circular shape. Therefore, the circular shell shape could be successfully replaced by hexagonal for compact modular systems with high energy density.
In Figure 19, we can observe that the PCM specific enthalpy up to 200 min decreases with the same rate in all cases. This confirms previous conclusions about the same heat transport process and mechanism regardless of the shape of the shell. None of the analysed shell shapes allow for significantly faster energy reception compared to the reference shape (S01a). However, it should be noted that shapes such as S01c extend the solidification process, and the amount of received energy up to time 668 min is smaller than the reference case.

6. Conclusions

In this research, we conducted a comprehensive comparison of melting and solidification times, liquid fraction and temperature distributions, and heat flux for various shell shapes, including circular, semi-circular, square, rectangular, ellipse, triangle, hexagonal, octagonal, and trapezium, each with two orientations. We utilised the enthalpy–porosity numerical model and the Boussinesq approximation to solve heat transfer problems during the melting and solidification processes. Prior to numerical calculations, measurements of thermal conductivity, phase-change enthalpy, and specific heat for the phase-change material were presented. Below, we provide a summary of the key findings from the research:
  • The shortest melting time was achieved for a semi-circular shell shape in the downward position (S01c), which is 44% shorter than the reference circular case (S01a).
  • The horizontal rectangle (S03a) shell shape had a 30.9% shorter melting time than the circular (S01a) case. This structure has the highest melting time reduction from the polygonal shapes.
  • In the initial stage of the melting process, up to 25% of the liquid fraction melts; the shape of the shell does not influence melting time.
  • A high enthalpy in a relatively short time during melting was achieved for the semi-circular shell shape in the downward position (S01c), horizontal rectangular (S03a), horizontal elliptical (S04a), and isosceles trapezium in the upward orientation (S08b).
  • The shortest solidification time was recorded for the isosceles trapezium in the upward orientation (S08a).
  • Only the isosceles trapezium (S08a) and horizontal ellipse (S04a) shell shapes reduced the solidification time in comparison to circular (S01a).
  • The semi-circular shell shape in the downward position (S01c), horizontal rectangular (S03a), and horizontal elliptical (S04a) were characterised by a long period of high average heat flux during melting. This is beneficial for fast PCM melting.
The authors of this study propose to extend the research by simulating different tube placements and by an analysis of the thermal interactions in a polygonal multi-module LHTES. All polygonal shell shapes have the potential for further research as multi-module LHTES systems due to their potentially higher energy density. Economic, feasibility, and melting/solidification cycle analyses are also important in the context of TES construction and shape stability.

Author Contributions

Conceptualisation, J.W.; investigation, J.W. and K.S.; methodology, J.W.; supervision, J.W.; validation, K.S.; writing—original draft, J.W. and K.S. All authors have read and agreed to the published version of the manuscript.

Funding

This research was supported in part by Poland national subvention, Poland no. 16.16.130.942 and we gratefully acknowledge Polish high-performance computing infrastructure PLGrid (HPC Centers: ACK Cyfronet AGH) for providing computer facilities and support within computational grant no. PLG/2023/016523.

Data Availability Statement

No new data were created or analyzed in this study. Data sharing is not applicable to this article.

Conflicts of Interest

The authors declare no conflict of interest.

Abbreviations

The following abbreviations are used in this manuscript:
DSCDifferential scanning calorimetry
HTFHeat transfer fluid
LFLiquid fraction
LHTESLatent heat thermal energy storage
PCMPhase-change material
RESRenewable energy source
TESThermal energy storage
Nomenclature
A m u s h Mushy zone
bHeat transfer coefficient, W/(m2·K)
c p Specific heat capacity, J/(kg · K)
gGravitational acceleration, m/s2
hSpecific enthalpy, J/kg
kThermal conductivity, W/(m · K)
lLatent heat, J/kg
nNormal vector
NuNusselt number
pPressure, Pa
PrPrandtl number
rRadius, m
RThermal resistance, (m · K)/W
RaRayleigh number
ReReynolds number
SMomentum source term
SteStefan number
TTemperature, °C
tTime, s
vFluid flow velocity, m/s
Greek symbols
α Liquid fraction
β Expansion coefficient, 1/K
μ Dynamic viscosity, Pa · s
ρ Density, kg/m3
Subscripts
a v g Average
h t f Fluid, heat transfer fluid (HTF)
iParticular control volume
r e f Reference
s i Shell inner
tTube domain
t i Tube inner
t o Tube outer

References

  1. Prabakaran, R.; Dhamodharan, P.; Sathishkumar, A.; Gullo, P.; Vikram, M.P.; Pandiaraj, S.; Alodhayb, A.; Khouqeer, G.A.; Kim, S.C. An Overview of the State of the Art and Challenges in the Use of Gelling and Thickening Agents to Create Stable Thermal Energy Storage Materials. Energies 2023, 16, 3306. [Google Scholar] [CrossRef]
  2. Wang, S.; Hou, X.; Yin, J.; Xing, Y.; Wang, Z. Comparative Study of the Thermal Enhancement for Spacecraft PCM Thermal Energy Storage Units. Aerospace 2022, 9, 705. [Google Scholar] [CrossRef]
  3. Sultan, S.; Hirschey, J.; Kumar, N.; Cui, B.; Liu, X.; LaClair, T.J.; Gluesenkamp, K.R. Techno-Economic Assessment of Residential Heat Pump Integrated with Thermal Energy Storage. Energies 2023, 16, 4087. [Google Scholar] [CrossRef]
  4. Masood, U.; Haggag, M.; Hassan, A.; Laghari, M. A Review of Phase Change Materials as a Heat Storage Medium for Cooling Applications in the Built Environment. Buildings 2023, 13, 1595. [Google Scholar] [CrossRef]
  5. Elarem, R.; Alqahtani, T.; Mellouli, S.; Askri, F.; Edacherian, A.; Vineet, T.; Badruddin, I.A.; Abdelmajid, J. A comprehensive review of heat transfer intensification methods for latent heat storage units. Energy Storage 2021, 3, e127. [Google Scholar] [CrossRef]
  6. Rogowski, M.; Andrzejczyk, R. Recent advances of selected passive heat transfer intensification methods for phase change material-based latent heat energy storage units: A review. Int. Commun. Heat Mass Transf. 2023, 144, 106795. [Google Scholar] [CrossRef]
  7. Masoumpour-Samakoush, M.; Miansari, M.; Ajarostaghi, S.S.M.; Arıcı, M. Impact of innovative fin combination of triangular and rectangular fins on melting process of phase change material in a cavity. J. Energy Storage 2022, 45, 103545. [Google Scholar] [CrossRef]
  8. Zhang, S.; Mancin, S.; Pu, L. A review and prospective of fin design to improve heat transfer performance of latent thermal energy storage. J. Energy Storage 2023, 62, 106825. [Google Scholar] [CrossRef]
  9. Ma, F.; Zhu, T.; Zhang, Y.; Lu, X.; Zhang, W.; Ma, F. A Review on Heat Transfer Enhancement of Phase Change Materials Using Fin Tubes. Energies 2023, 16, 545. [Google Scholar] [CrossRef]
  10. Hassan, F.; Jamil, F.; Hussain, A.; Ali, H.M.; Janjua, M.M.; Khushnood, S.; Farhan, M.; Altaf, K.; Said, Z.; Li, C. Recent advancements in latent heat phase change materials and their applications for thermal energy storage and buildings: A state of the art review. Sustain. Energy Technol. Assess. 2022, 49, 101646. [Google Scholar] [CrossRef]
  11. Cárdenas-Ramírez, C.; Jaramillo, F.; Gómez, M. Systematic review of encapsulation and shape-stabilization of phase change materials. J. Energy Storage 2020, 30, 101495. [Google Scholar] [CrossRef]
  12. Tariq, S.L.; Ali, H.M.; Akram, M.A.; Janjua, M.M.; Ahmadlouydarab, M. Nanoparticles enhanced phase change materials (NePCMs)-A recent review. Appl. Therm. Eng. 2020, 176, 115305. [Google Scholar] [CrossRef]
  13. Jirawattanapanit, A.; Abderrahmane, A.; Mourad, A.; Guedri, K.; Younis, O.; Bouallegue, B.; Subkrajang, K.; Rajchakit, G.; Shah, N.A. A Numerical Investigation of a Melting Rate Enhancement inside a Thermal Energy Storage System of Finned Heat Pipe with Nano-Enhanced Phase Change Material. Nanomaterials 2022, 12, 2519. [Google Scholar] [CrossRef] [PubMed]
  14. Mohammadpour, J.; Lee, A.; Timchenko, V.; Taylor, R. Nano-Enhanced Phase Change Materials for Thermal Energy Storage: A Bibliometric Analysis. Energies 2022, 15, 3426. [Google Scholar] [CrossRef]
  15. Jaisatia Varthani, A.; Shasthri, S.; Baljit, S.; Kausalyah, V. A systematic review of metal foam and heat pipe enhancement in Latent Heat Thermal Energy Storage system. J. Energy Storage 2022, 56, 105888. [Google Scholar] [CrossRef]
  16. Sodhi, G.S.; Muthukumar, P. Compound charging and discharging enhancement in multi-PCM system using non-uniform fin distribution. Renew. Energy 2021, 171, 299–314. [Google Scholar] [CrossRef]
  17. Kant, K.; Biwole, P.; Shukla, A.; Sharma, A.; Gorjian, S. Heat transfer and energy storage performances of phase change materials encapsulated in honeycomb cells. J. Energy Storage 2021, 38, 102507. [Google Scholar] [CrossRef]
  18. Tao, Y.B.; He, Y.L. A review of phase change material and performance enhancement method for latent heat storage system. Renew. Sustain. Energy Rev. 2018, 93, 245–259. [Google Scholar] [CrossRef]
  19. Wołoszyn, J.; Wyciszkiewicz, G. Modelowanie przemiany fazowej w potrójnym systemie rurowym wzmocnionym żebrami. Przemysł Chem. 2021, 1, 101–104. [Google Scholar] [CrossRef]
  20. Vyshak, N.; Jilani, G. Numerical analysis of latent heat thermal energy storage system. Energy Convers. Manag. 2007, 48, 2161–2168. [Google Scholar] [CrossRef]
  21. Zivkovic, B.; Fujii, I. An analysis of isothermal phase change of phase change material within rectangular and cylindrical containers. Solar Energy 2001, 70, 51–61. [Google Scholar] [CrossRef]
  22. Lipnicki, Z.; Małolepszy, T.; Gortych, M.; Grabas, P. Simple analitycal and experimental method of solidification PCM material inside a spherical capsule. Int. Commun. Heat Mass Transf. 2022, 135, 106083. [Google Scholar] [CrossRef]
  23. Sun, B.; Sun, M.; Gao, L.; Che, D.; Deng, Y. Thermal performance analysis and optimization of a double-layer spherical phase-change material capsule with annular fins. J. Energy Storage 2023, 57, 106280. [Google Scholar] [CrossRef]
  24. Ahmad, F.; Hussain, S.; Ahmad, I.; Hassan, T.S.; Almatroud, A.O.; Ali, W.; Farooq, I.E. Successive melting of a phase change material bounded in a finned trapezoidal domain. Case Stud. Therm. Eng. 2021, 28, 101419. [Google Scholar] [CrossRef]
  25. Modi, N.; Wang, X.; Negnevitsky, M. Numerical investigation into selecting the most suitable shell-to-tube diameter ratio for horizontal latent heat thermal energy storage. Energy Sustain. Dev. 2023, 73, 188–204. [Google Scholar] [CrossRef]
  26. Ding, C.; Pei, J.; Wang, S.; Wang, Y. Evaluation and comparison of thermal performance of latent heat storage units with shell-and-tube, rectangular, and cylindrical configurations. Appl. Therm. Eng. 2023, 218, 119364. [Google Scholar] [CrossRef]
  27. Al-Abidi, A.A.; Mat, S.; Sopian, K.; Sulaiman, M.; Mohammad, A.T. Experimental study of PCM melting in triplex tube thermal energy storage for liquid desiccant air conditioning system. Energy Build. 2013, 60, 270–279. [Google Scholar] [CrossRef]
  28. Wu, J.; Zhang, Y.; Sun, K.; Chen, Q. Heat Transfer Enhancement of Phase Change Material in Triple-Tube Latent Heat Thermal Energy Storage Units: Operating Modes and Fin Configurations. Energies 2022, 15, 5653. [Google Scholar] [CrossRef]
  29. Fornarelli, F.; Dambrosio, L.; Camporeale, S.M.; Terlizzi, L. Novel Multi-Objective Optimal Design of a Shell-and-Tube Latent Heat Thermal Energy Storage Device. Energies 2023, 16, 1882. [Google Scholar] [CrossRef]
  30. Younis, O.; Samir, L.; Belazreg, A.; Qasem, N.A.A. Numerical Analysis of the Influence of Inner Tubes Arrangement on the Thermal Performance of Thermal Energy Storage Unit. Energies 2023, 16, 3663. [Google Scholar] [CrossRef]
  31. Punniakodi, B.M.S.; Senthil, R. A review on container geometry and orientations of phase change materials for solar thermal systems. J. Energy Storage 2021, 36, 102452. [Google Scholar] [CrossRef]
  32. Patel, J.R.; Joshi, V.; Rathod, M.K. Thermal performance investigations of the melting and solidification in differently shaped macro-capsules saturated with phase change material. J. Energy Storage 2020, 31, 101635. [Google Scholar] [CrossRef]
  33. Kumar, A.; Verma, P.; Varshney, L. An experimental and numerical study on phase change material melting rate enhancement for a horizontal semi-circular shell and tube thermal energy storage system. J. Energy Storage 2022, 45, 103734. [Google Scholar] [CrossRef]
  34. Hosseini, M.J.; Rahimi, M.; Bahrampoury, R. Experimental and computational evolution of a shell and tube heat exchanger as a PCM thermal storage system. Int. Commun. Heat Mass Transf. 2014, 50, 128–136. [Google Scholar] [CrossRef]
  35. Faghani, M.; Hosseini, M.; Bahrampoury, R. Numerical simulation of melting between two elliptical cylinders. Alex. Eng. J. 2018, 57, 577–586. [Google Scholar] [CrossRef]
  36. Pourakabar, A.; Rabienataj Darzi, A. Enhancement of phase change rate of PCM in cylindrical thermal energy storage. Appl. Therm. Eng. 2019, 150, 132–142. [Google Scholar] [CrossRef]
  37. Rabienataj Darzi, A.A.; Jourabian, M.; Farhadi, M. Melting and solidification of PCM enhanced by radial conductive fins and nanoparticles in cylindrical annulus. Energy Convers. Manag. 2016, 118, 253–263. [Google Scholar] [CrossRef]
  38. Khillarkar, D.; Gong, Z.; Mujumdar, A. Melting of a phase change material in concentric horizontal annuli of arbitrary cross-section. Appl. Therm. Eng. 2000, 20, 893–912. [Google Scholar] [CrossRef]
  39. Mao, Q.; Chen, K.; Li, T. Heat transfer performance of a phase-change material in a rectangular shell-tube energy storage tank. Appl. Therm. Eng. 2022, 215, 118937. [Google Scholar] [CrossRef]
  40. Bouzennada, T.; Ghchem, K.; Zahi, N.; Alhadri, M.; Kolsi, L. Numerical study of heat transfer and melting process in a NEPCM filled 3D cuboid cavity: Application non-uniform temperature. Case Stud. Therm. Eng. 2023, 47, 103080. [Google Scholar] [CrossRef]
  41. Bouzennada, T.; Abderrahmane, A.; Younis, O.; Oreijah, M.; Guedri, K.; Maatki, C.; Kolsi, L. Numerical simulation of heat transfer and melting process in a NEPCM: Using new fin shape. Int. Commun. Heat Mass Transf. 2023, 143, 106711. [Google Scholar] [CrossRef]
  42. Demirkıran, İ.G.; Cetkin, E. Emergence of rectangular shell shape in thermal energy storage applications: Fitting melted phase changing material in a fixed space. J. Energy Storage 2021, 37, 102455. [Google Scholar] [CrossRef]
  43. Rana, S.; Zunaid, M.; Kumar, R. CFD analysis for heat transfer comparison in circular, rectangular and elliptical tube heat exchangers filled with PCM. Mater. Today Proc. 2022, 56, 637–644. [Google Scholar] [CrossRef]
  44. Tabassum, T.; Hasan, M.; Begum, L. 2-D numerical investigation of melting of an impure PCM in the arbitrary-shaped annuli. Int. J. Therm. Sci. 2017, 114, 296–319. [Google Scholar] [CrossRef]
  45. Qaiser, R.; Khan, M.M.; Ahmed, H.F.; Malik, F.K.; Irfan, M.; Ahad, I.U. Performance enhancement of latent energy storage system using effective designs of tubes and shell. Energy Rep. 2022, 8, 3856–3872. [Google Scholar] [CrossRef]
  46. Li, J.; Huang, Y.; Zhang, C.; Liu, X. Numerical study on the solidification performance of a latent heat storage unit with Koch-fractal fin. Fractals 2019, 27, 1950108. [Google Scholar] [CrossRef]
  47. Alizadeh, M.; Haq, R.; Hamid, M.; Nguyen, V.; Truong, T.; Ganji, D.; Tian, Z. An analysis of latent heat thermal energy storage in a hexagonal triplex-tube unit with curve shape fin and CNTs. Case Stud. Therm. Eng. 2022, 36, 102241. [Google Scholar] [CrossRef]
  48. Maneengam, A.; Ahmed, S.E.; Saeed, A.M.; Abderrahmane, A.; Younis, O.; Guedri, K.; Alhazmi, M.; Weera, W. Numerical Study of Heat Transfer Enhancement within Confined Shell and Tube Latent Heat Thermal Storage Microsystem Using Hexagonal PCMs. Micromachines 2022, 13, 1062. [Google Scholar] [CrossRef]
  49. Alizadeh, M.; Shahavi, M.H.; Ganji, D.D. Performance enhancement of nano PCM solidification in a hexagonal storage unit with innovative fin shapes dealing with time-dependent boundary conditions. Energy Rep. 2022, 8, 8200–8214. [Google Scholar] [CrossRef]
  50. Shahsavar, A.; Al-Rashed, A.A.; Entezari, S.; Sardari, P.T. Melting and solidification characteristics of a double-pipe latent heat storage system with sinusoidal wavy channels embedded in a porous medium. Energy 2019, 171, 751–769. [Google Scholar] [CrossRef]
  51. Shahsavar, A.; Shaham, A.; Yıldız, Ç.; Arıcı, M. Entropy generation characteristics of phase change material in a variable wavy walled triplex tube latent heat storage unit for battery thermal management system. J. Energy Storage 2022, 51, 104374. [Google Scholar] [CrossRef]
  52. Alizadeh, M.; Nabizadeh, A.; Fazlollahtabar, A.; Ganji, D. An optimization study of solidification procedure in a wavy- wall storage unit considering the impacts of NEPCM and curved fin. Int. Commun. Heat Mass Transf. 2021, 124, 105249. [Google Scholar] [CrossRef]
  53. Wołoszyn, J.; Szopa, K.; Czerwiński, G. Enhanced heat transfer in a PCM shell-and-tube thermal energy storage system. Appl. Therm. Eng. 2021, 196, 117332. [Google Scholar] [CrossRef]
  54. Wołoszyn, J.; Szopa, K. A combined heat transfer enhancement technique for shell-and-tube latent heat thermal energy storage. Renew. Energy 2023, 202, 1342–1356. [Google Scholar] [CrossRef]
  55. Qaiser, R.; Khan, M.M.; Khan, L.A.; Irfan, M. Melting performance enhancement of PCM based thermal energy storage system using multiple tubes and modified shell designs. J. Energy Storage 2021, 33, 102161. [Google Scholar] [CrossRef]
  56. Hekmat, M.H.; Haghani, M.H.K.; Izadpanah, E.; Sadeghi, H. The influence of energy storage container geometry on the melting and solidification of PCM. Int. Commun. Heat Mass Transf. 2022, 137, 106237. [Google Scholar] [CrossRef]
  57. Sardari, P.T.; Babaei-Mahani, R.; Giddings, D.; Yasseri, S.; Moghimi, M.A.; Bahai, H. Energy recovery from domestic radiators using a compact composite metal Foam/PCM latent heat storage. J. Clean. Prod. 2020, 257, 120504. [Google Scholar] [CrossRef]
  58. ANSYS. ANSYS Fluent Theory Guide 2020; ANSYS, Inc.: Canonsburg, PA, USA, 2020. [Google Scholar]
  59. Bergman, T.L.; Lavine, A.S.; Incropera, F.P.; DeWitt, D.P. Fundamentals of Heat and Mass Transfer, 8th ed.; Wiley: New York, NY, USA, 2017; p. 1046. [Google Scholar]
  60. Voller, V.R.; Prakash, C. A fixed grid numerical modelling methodology for convection-diffusion mushy region phase-change problems. Int. J. Heat Mass Transf. 1987, 30, 1709–1719. [Google Scholar] [CrossRef]
  61. Anderson, D.; Tannehill, J.C.; Pletcher, R.H. Computational Fluid Mechanics and Heat Transfer, 3rd ed.; CRC Press: New York, NY, USA, 2016; pp. 1–740. [Google Scholar]
  62. Kousha, N.; Hosseini, M.J.; Aligoodarz, M.R.; Pakrouh, R.; Bahrampoury, R. Effect of inclination angle on the performance of a shell and tube heat storage unit—An experimental study. Appl. Therm. Eng. 2017, 112, 1497–1509. [Google Scholar] [CrossRef]
Figure 1. Different shell shapes and orientations of the analysed shell-and-tube structures.
Energies 16 07822 g001
Figure 2. Heat flow versus temperature from DSC measurements.
Energies 16 07822 g002
Figure 3. Assumed numerical mesh and boundary conditions for selected case (M01).
Energies 16 07822 g003
Figure 4. Grid independence test for S01 domain.
Energies 16 07822 g004
Figure 5. Numerical model validation by comparing simulation results with experimental data featured by Kousha et al. [62] for (a) average temperature in section A during the melting process and (b) average temperature in section B during the solidification process.
Energies 16 07822 g005
Figure 16. Heat flux average values during melting for all configurations.
Energies 16 07822 g016
Figure 17. Heat flux average values during solidification for all configurations.
Energies 16 07822 g017
Figure 18. Specific enthalpy of the PCM over time during melting process.
Energies 16 07822 g018
Figure 19. Specific enthalpy of the PCM over time during solidification process.
Energies 16 07822 g019
Table 1. Geometric parameters of the analysed shell shapes.
Model   S01aS01bS01cS02aS02bS03aS03bS04aS04b
D s i mm88124.5124.5------
amm---787810060.8112.768.7
bmm-31.131.1--60.810068.7112.7
Model      S05aS05bS06aS06bS07aS07bS08aS08b
amm   120.5120.548.448.435.535.5105.276.2
bmm   34.834.8----76.2105.2
hmm   ------67.167.1
rmm   1010----
The dimensions of the tube are the same for each model: outer diameter d t o = 22 mm, and wall thickness w = 1 mm.
Table 2. Thermophysical properties of organic PCM (RT54HC—Rubitherm).
PropertyDimensionValue
Melting/solidification latent heatkJ/kg200/207
Solidus/liquidus temperature for melting°C50/60
Solidus/liquidus temperature for solidification°C47/53
Specific heatkJ/(kg·K) 2.1
Thermal conductivityW/(m·K) 0.2
Dynamic viscosityPa·s 0.00365 [57]
The density of solid/liquidkg/m3 800 / 850
Thermal expansion coefficient1/K 0.000308 [57]
Disclaimer/Publisher’s Note: The statements, opinions and data contained in all publications are solely those of the individual author(s) and contributor(s) and not of MDPI and/or the editor(s). MDPI and/or the editor(s) disclaim responsibility for any injury to people or property resulting from any ideas, methods, instructions or products referred to in the content.

