Article

Research on the Whole Lifecycle Emission Reduction Effect of Buildings with Different Structures in Severely Cold Regions—A Case Study in China

1
Graduate School of Engineering, Hokkaido University, Sapporo 060-8628, Japan
2
Faculty of Engineering, Hokkaido University, Sapporo 060-8628, Japan
*
Author to whom correspondence should be addressed.
Energies 2023, 16(14), 5285; https://doi.org/10.3390/en16145285
Submission received: 14 June 2023 / Revised: 8 July 2023 / Accepted: 9 July 2023 / Published: 10 July 2023
(This article belongs to the Collection Energy Efficiency and Environmental Issues)

Abstract

:
Since the construction industry is one of China’s high carbon emission industries, to achieve China’s carbon neutrality target by 2060, CO2 emissions in cold regions must be reduced. At the same time, forests have excellent carbon sequestration abilities, so this paper takes residential buildings in severely cold regions as the object of carbon emission reduction research. A model of a two-story building in Changchun was constructed, and the life-cycle carbon emissions of reinforced concrete and wood structures were measured using the life-cycle evaluation method as the basis for calculation and simulation with DesignBuilderVer.7 software. The results show that the life-cycle carbon emission of a wood structure house is 61.46 t less than that of a reinforced concrete house, and the life-cycle carbon emission reduction rate of a wood structure house is 43.39%. Based on the data, it has been proven that wooden structures effectively reduce carbon dioxide emissions during the building life cycle while enhancing building performance, given the same structural conditions.

1. Introduction

According to the Global Carbon Project, China ranked first in the world with 10.1 billion tons of CO2 emissions in 2018, accounting for 27.6 percent of global CO2 emissions [1]. According to the Global Carbon Project, China’s CO2 emissions increased from 8617 mt in 2010 to 11,472 mt in 2020, with an average annual growth rate of 1.7% [2]. China must reduce carbon emissions across all sectors to achieve the proposed goals. In September 2020, China announced it would reach peak CO2 emissions by 2030 and carbon neutrality by 2060 [
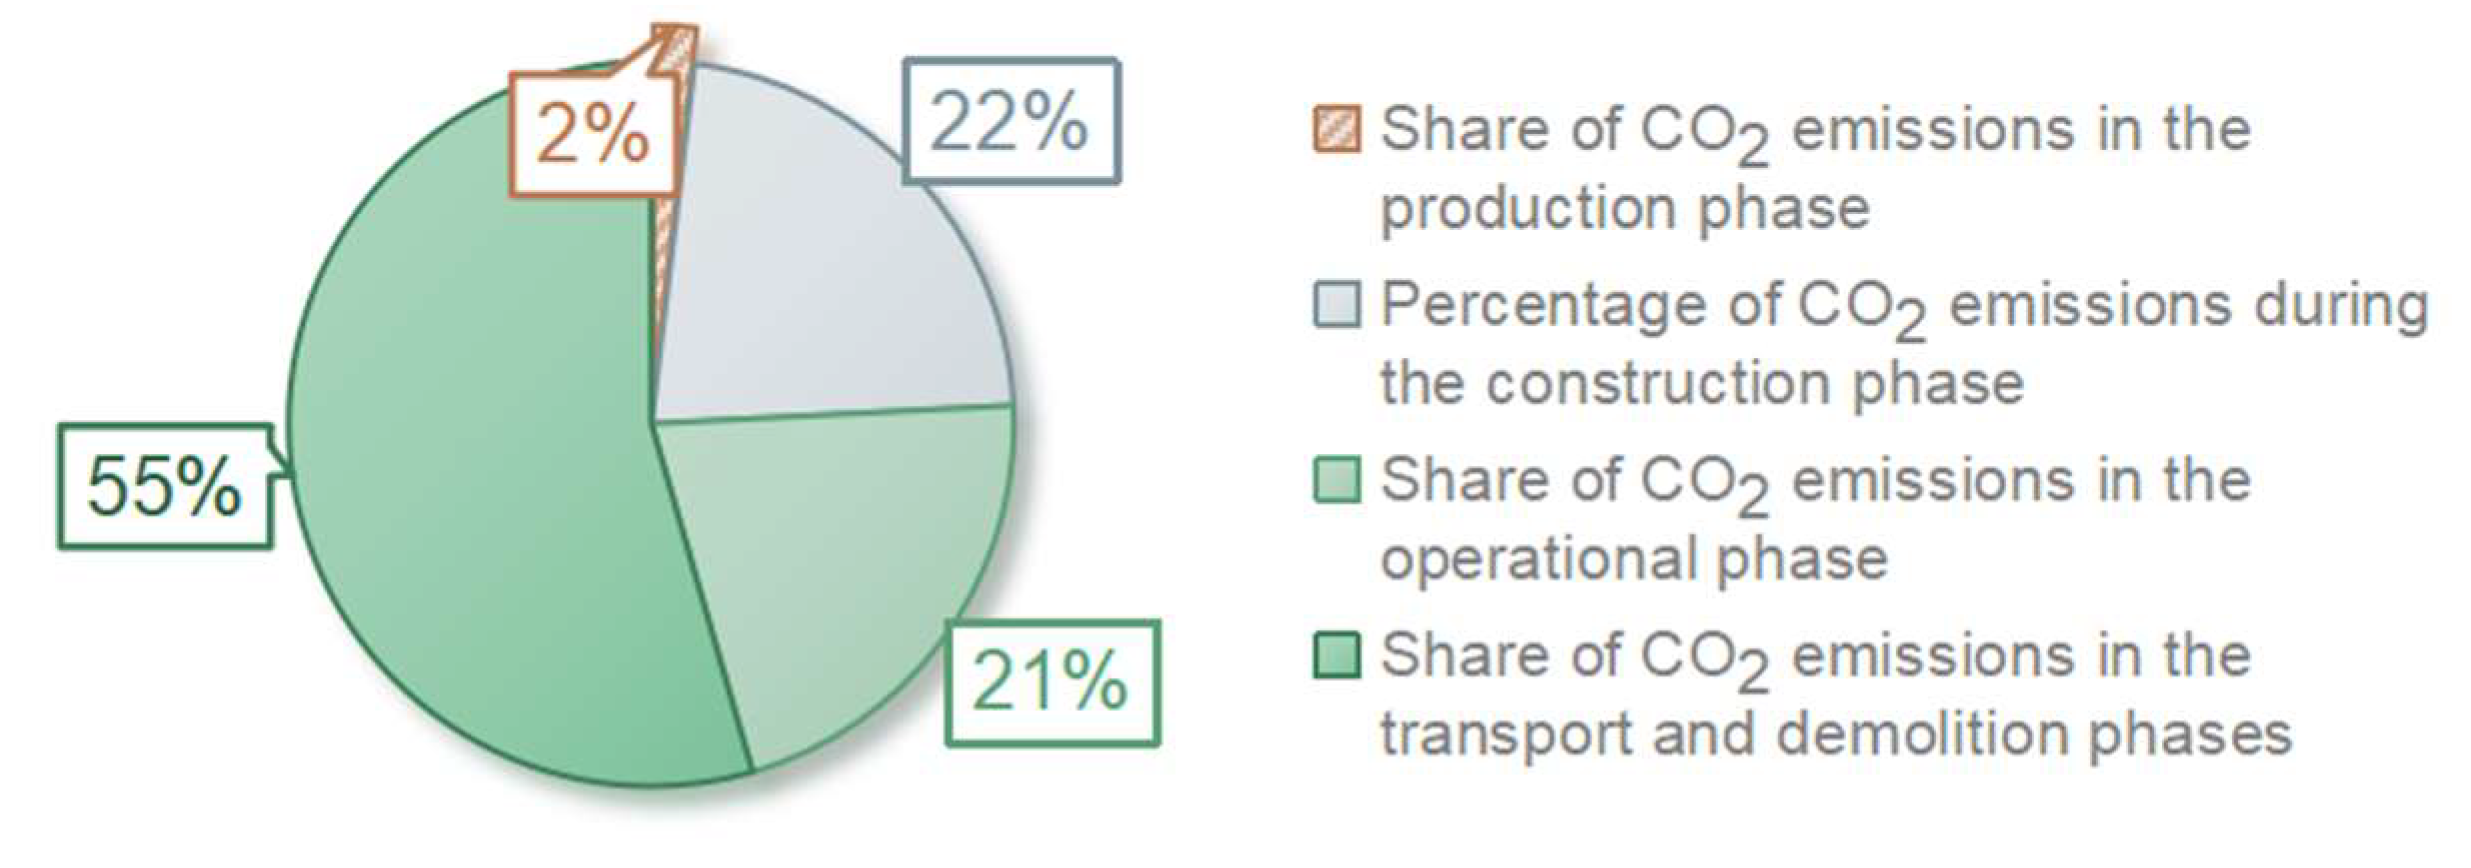
3]. According to the data of the 2022 China Building Energy Consumption and Carbon Emission Research Report, the total carbon emission of the whole process of building in 2020 was 5.08 billion tCO2, which accounts for 50.9% of the national carbon emission, of which 22.3% was the carbon emission of the production process of building materials, 1.9% was the carbon emission of the construction stage, and 21.3% was the carbon emission of the building operation stage [3]. The share of carbon emissions in each phase of building in 2020 is shown in Figure 1. The construction industry will become a key target for emission reduction due to the environmental pressure brought by the carbon emissions of the whole construction process.
According to a study on building energy consumption and carbon emissions in China in 2022, carbon emissions from building material production are generally rising, from 1.09 billion tCO2 in 2005 to 2.82 billion tCO2 in 2020, with an average annual growth rate of 6.5% [3]. Cement carbon emissions in 2022 will be 490 million tCO2, accounting for 44% of the carbon emissions from the production process of building materials and 9.6% of the total carbon emissions from the whole construction process in China. Steel carbon emissions in 2022 will be 580 million tCO2, accounting for 52% of the carbon emissions from the production process of building materials and 11.4% of the total carbon emissions from the whole construction process in China [3]. Therefore, the production of steel and cement accounts for 21% of the total carbon emissions of the entire construction process in China and is the primary influence on the carbon emissions of construction.
How to reduce the high carbon emissions of building materials has become the focus of research. Flower, D.J.M. [4] reduced carbon dioxide emissions by 13–15% by changing the composition of cement and steel. Adesina [5] and Habert [6] reduced CO2 emissions by replacing ordinary silicate cement with a new type of cement. Costa [7] reduced carbon dioxide emissions by 8.1% by substituting construction waste for traditional cement. Purnell [8], Miller [9], and Moon [10] reduced CO2 emissions by replacing traditional cement with the application of inorganic materials. In summary, changes in building materials can effectively reduce CO2 emissions. Building materials also produce significant CO2 emissions during the use phase of a building, and different building materials have other effects on CO2 emissions during the use phase of construction [11,12,13]. Pan and Mei [14], and Wei [15] used a simulation approach to reduce CO2 emissions during the operation phase. These methods have remarkably reduced carbon dioxide emissions at all stages of the building’s life cycle.
According to Lu’s [16] research, forests are the most significant carbon pool in land ecosystems, storing 86% of the world’s vegetation carbon and 73% of the soil carbon. They have a vital and distinct function in managing the global carbon balance and dealing with climate change. Meanwhile, Cai [17] found that wood products’ yearly rise in carbon storage contributed to roughly 4.7% of the growth in forest carbon storage worldwide. Since trees can absorb and fix carbon dioxide during the growth process, we consider replacing the building materials from concrete and steel with wood. Wood structures, therefore, replace reinforced concrete structures in this study.
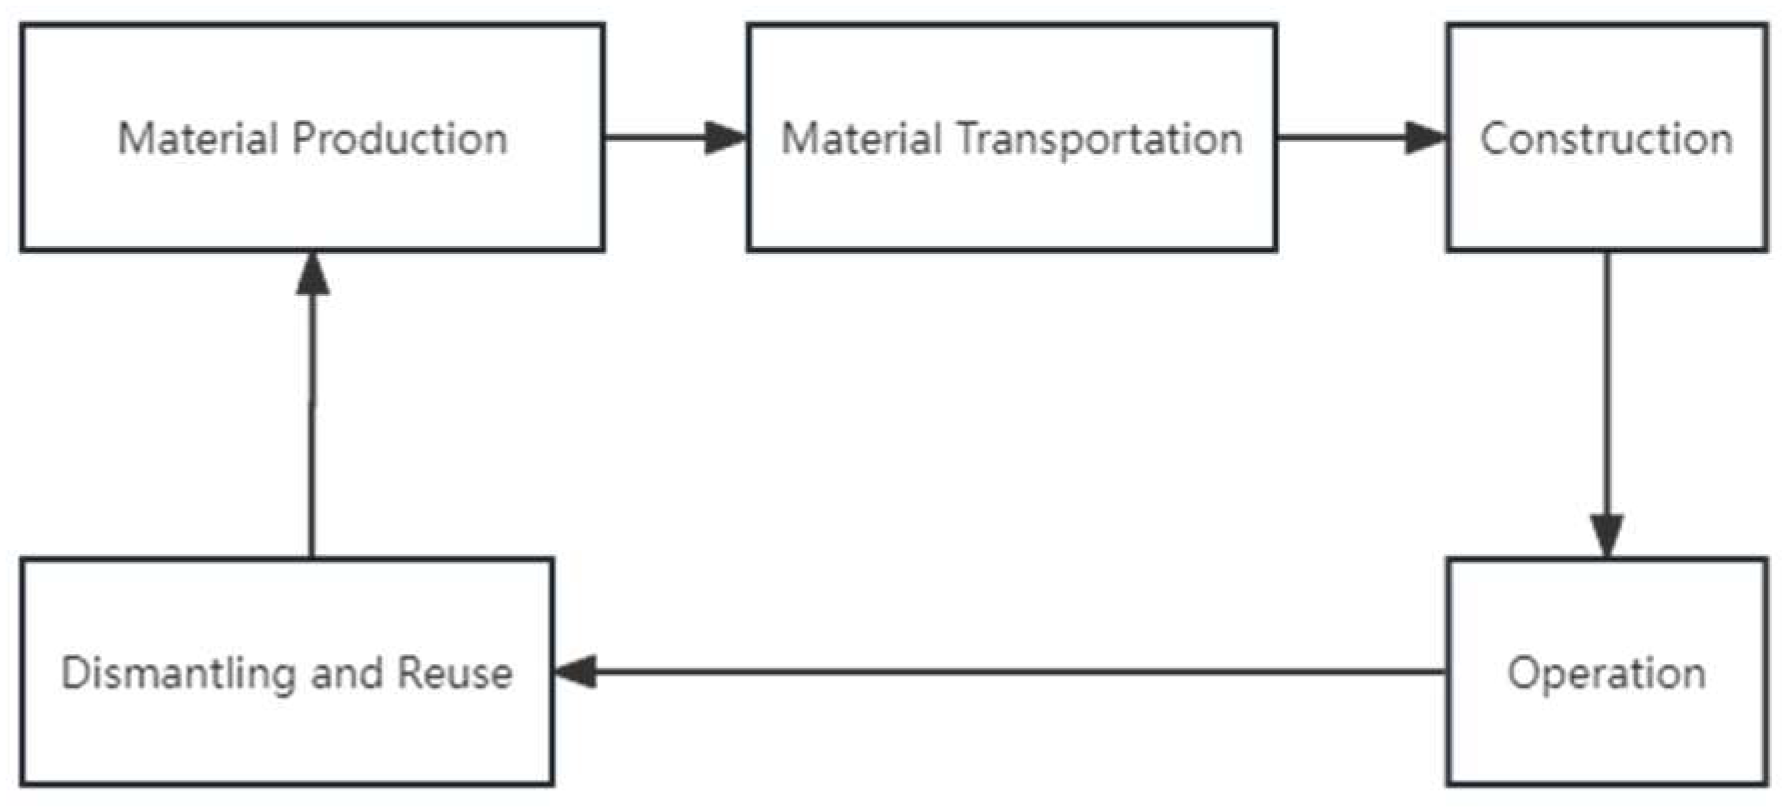
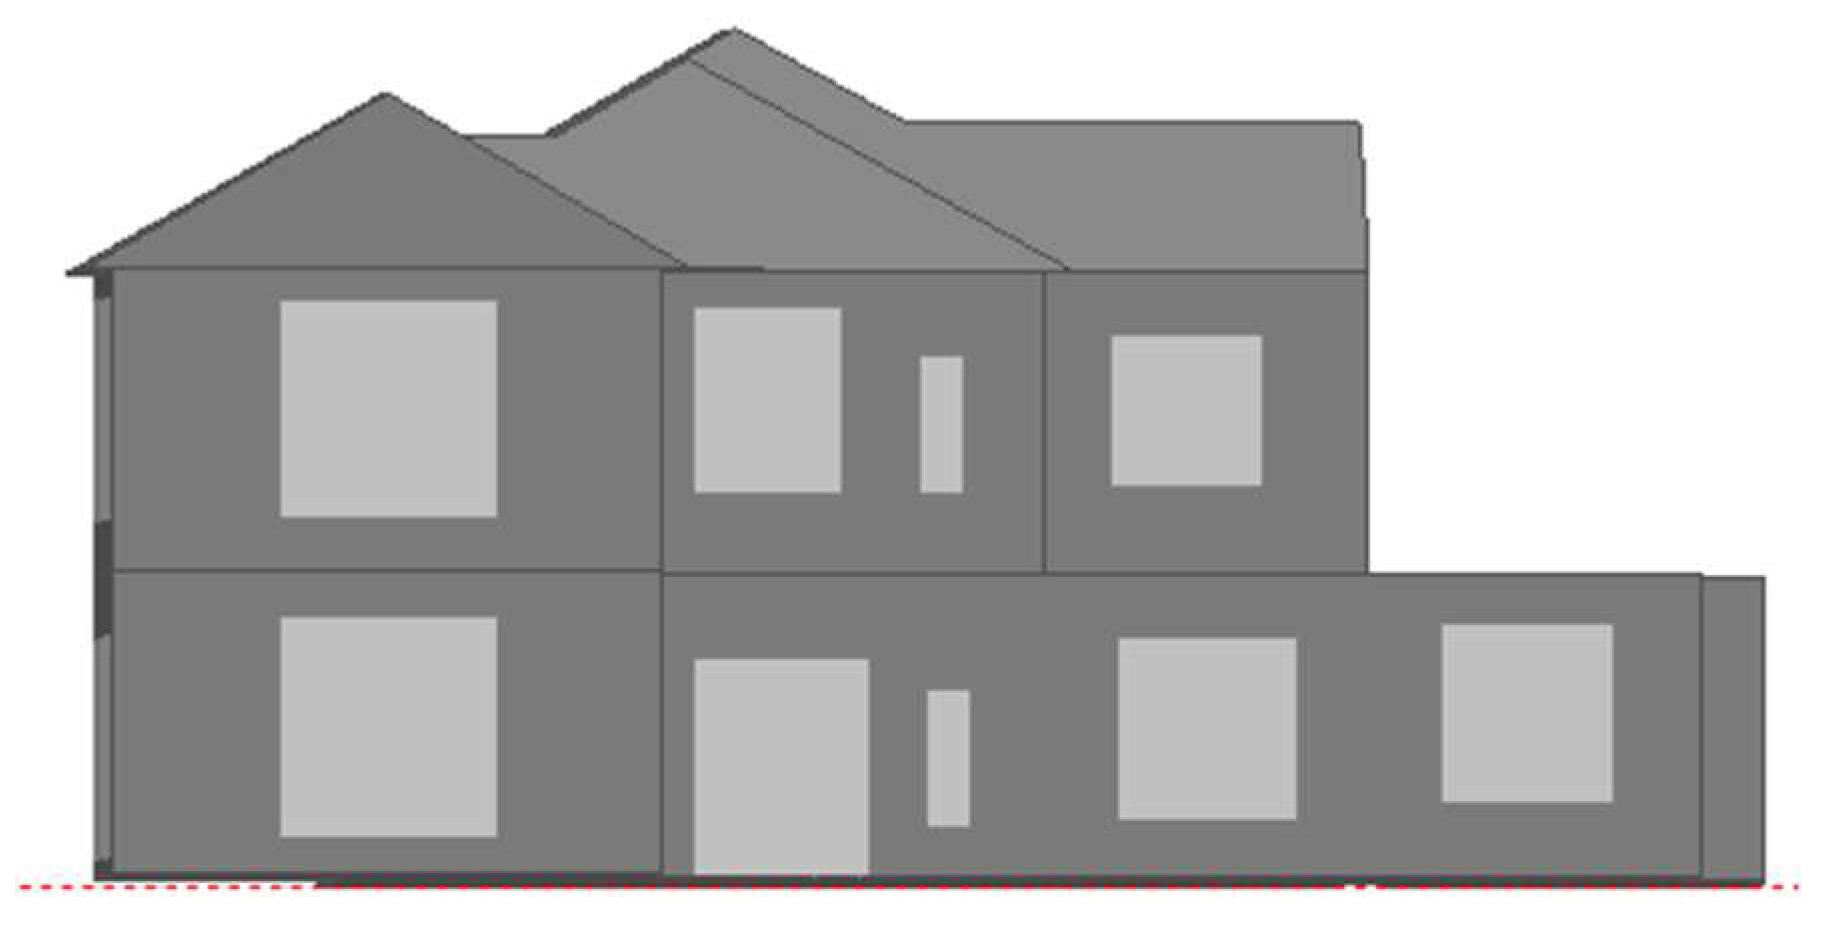
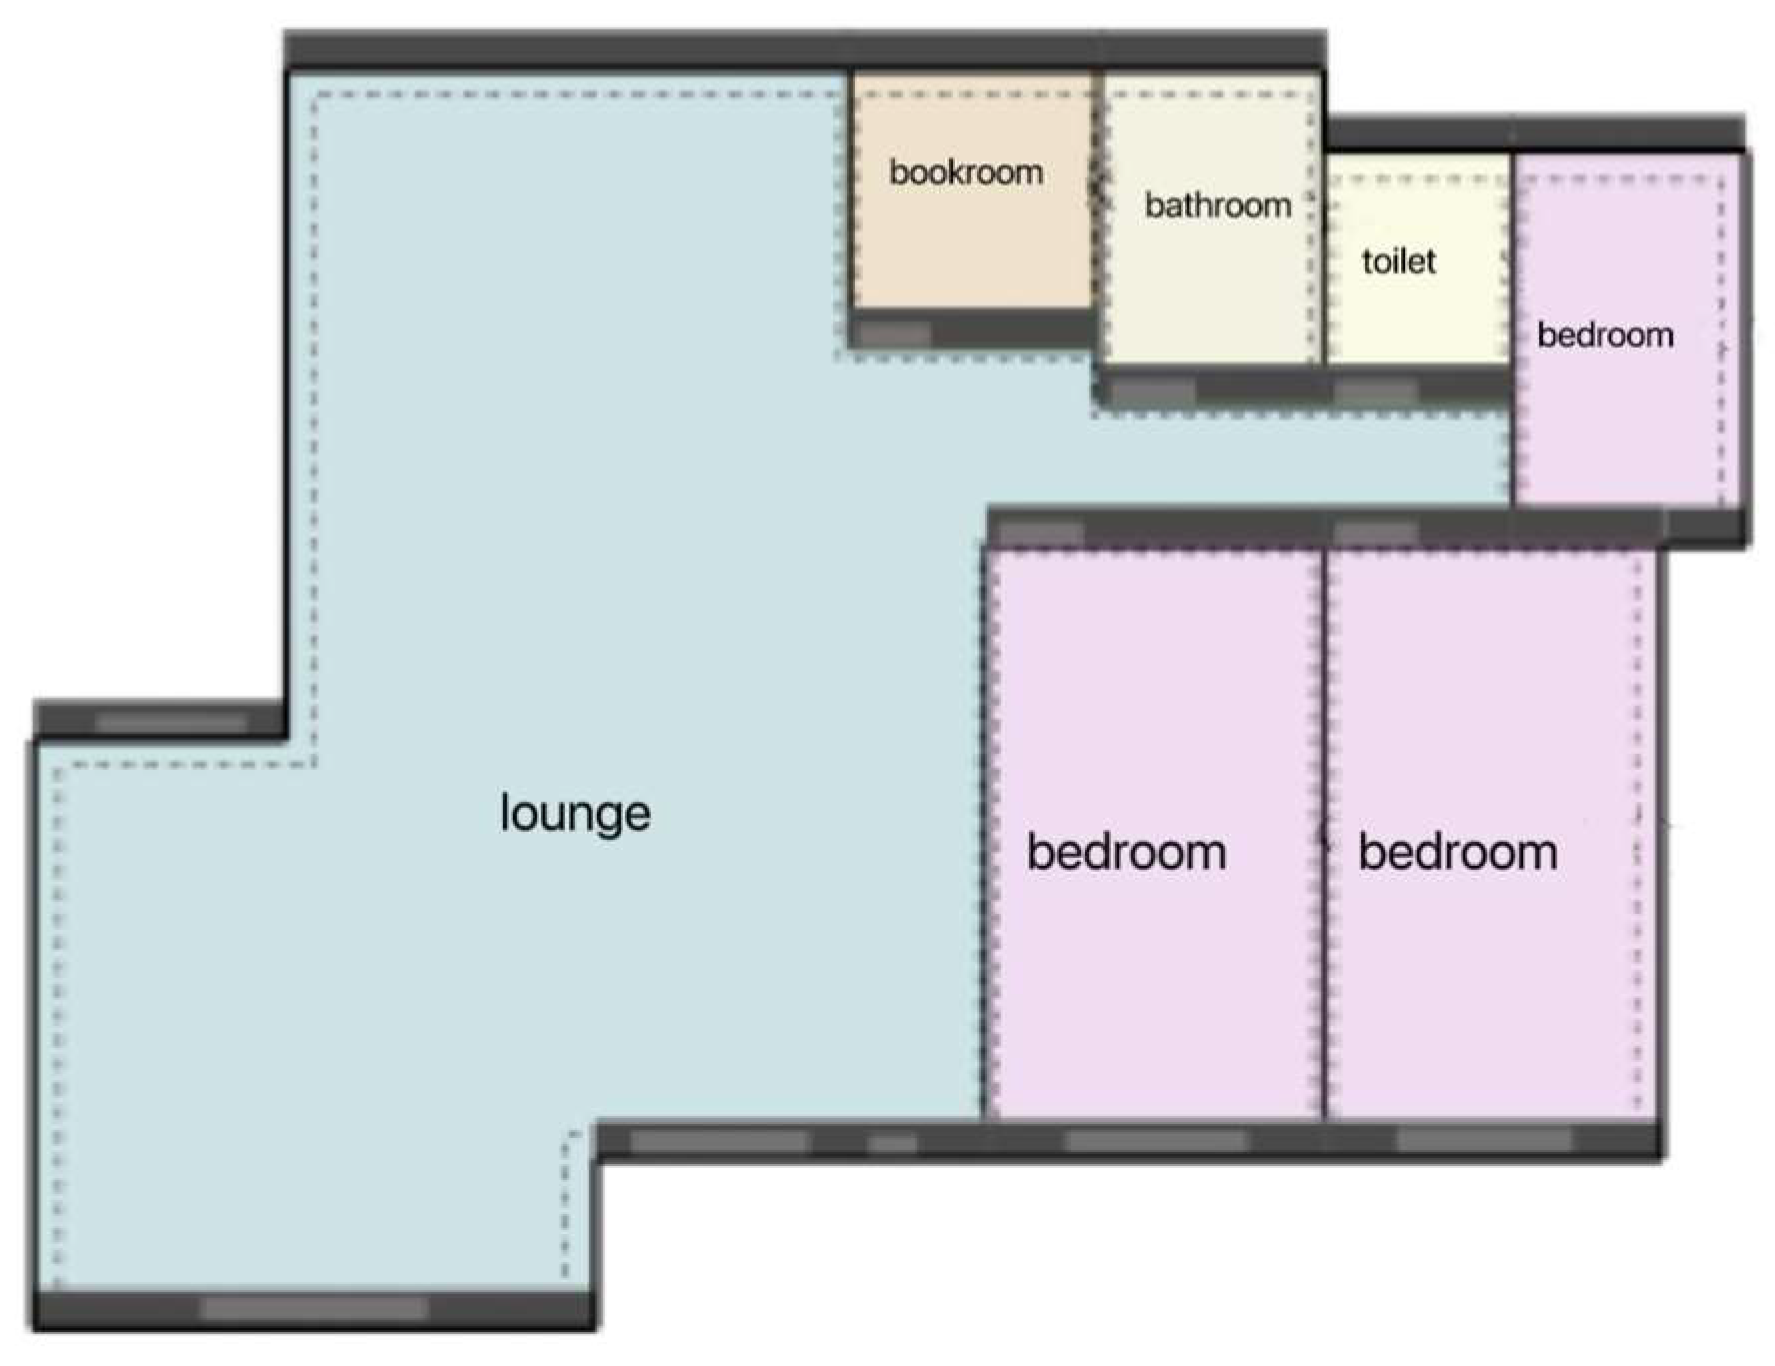
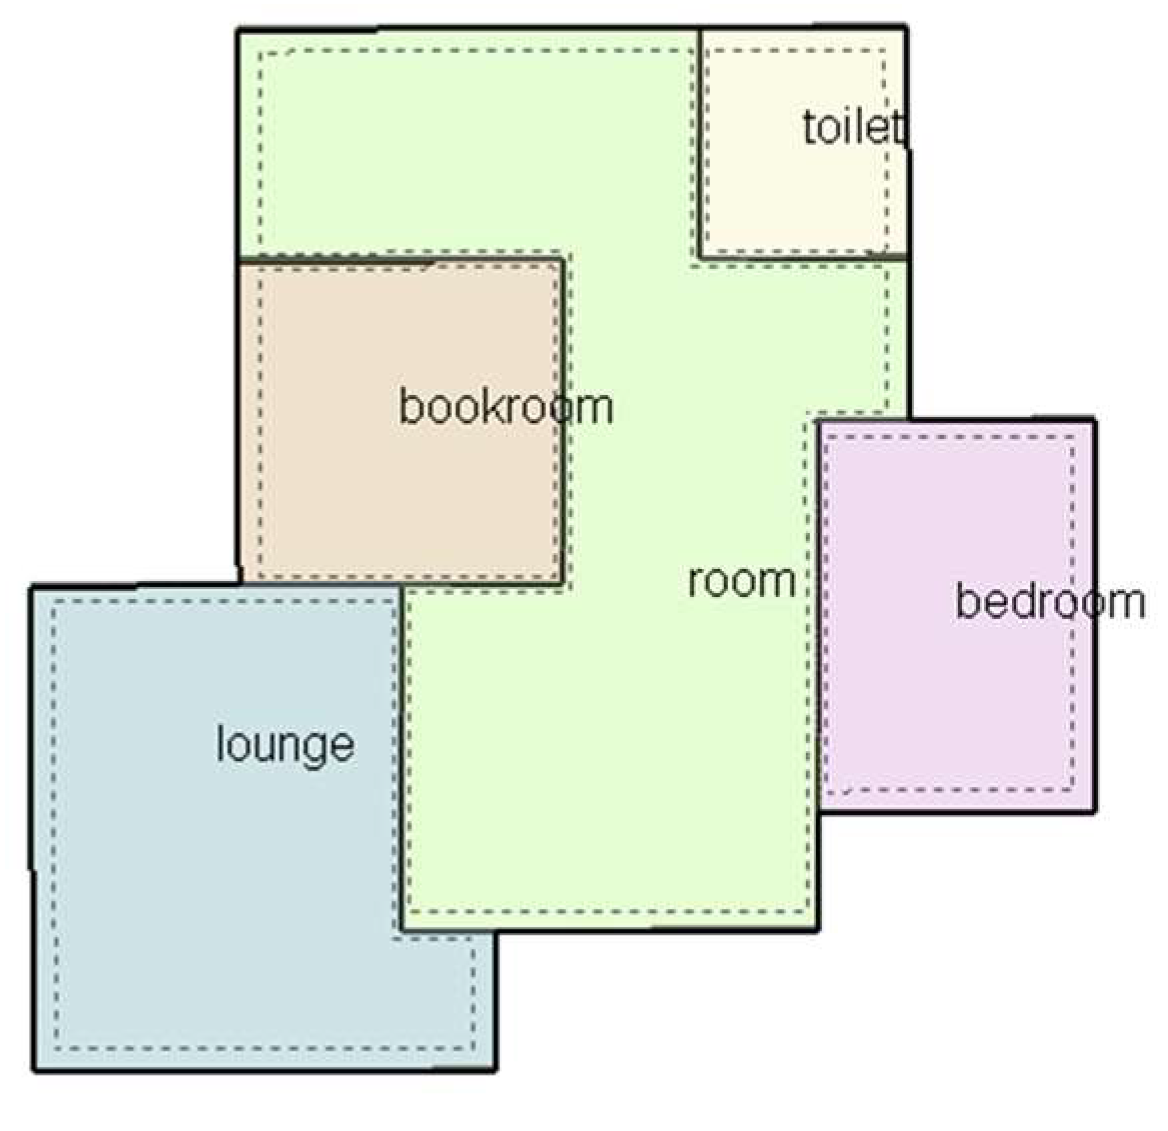
This paper adopts the whole-life-cycle evaluation method as the primary theoretical basis for the calculation of building carbon emissions, selects a two-story building in Changchun, calculates the carbon emissions for each stage of the whole life cycle of a reinforced concrete structure and a wood structure for the villa, and derives the building structure with lower total life cycle carbon emissions by comparing the calculation results.
In this paper, residential buildings in Jilin Province, Changchun, Jilin City, a severely cold region of China, were selected for a simulation study to evaluate the effects of different structures on CO2 emissions from residential buildings. The study identifies the impact of other building materials on the carbon emissions of the building at each stage and derives an optimal building structure. 
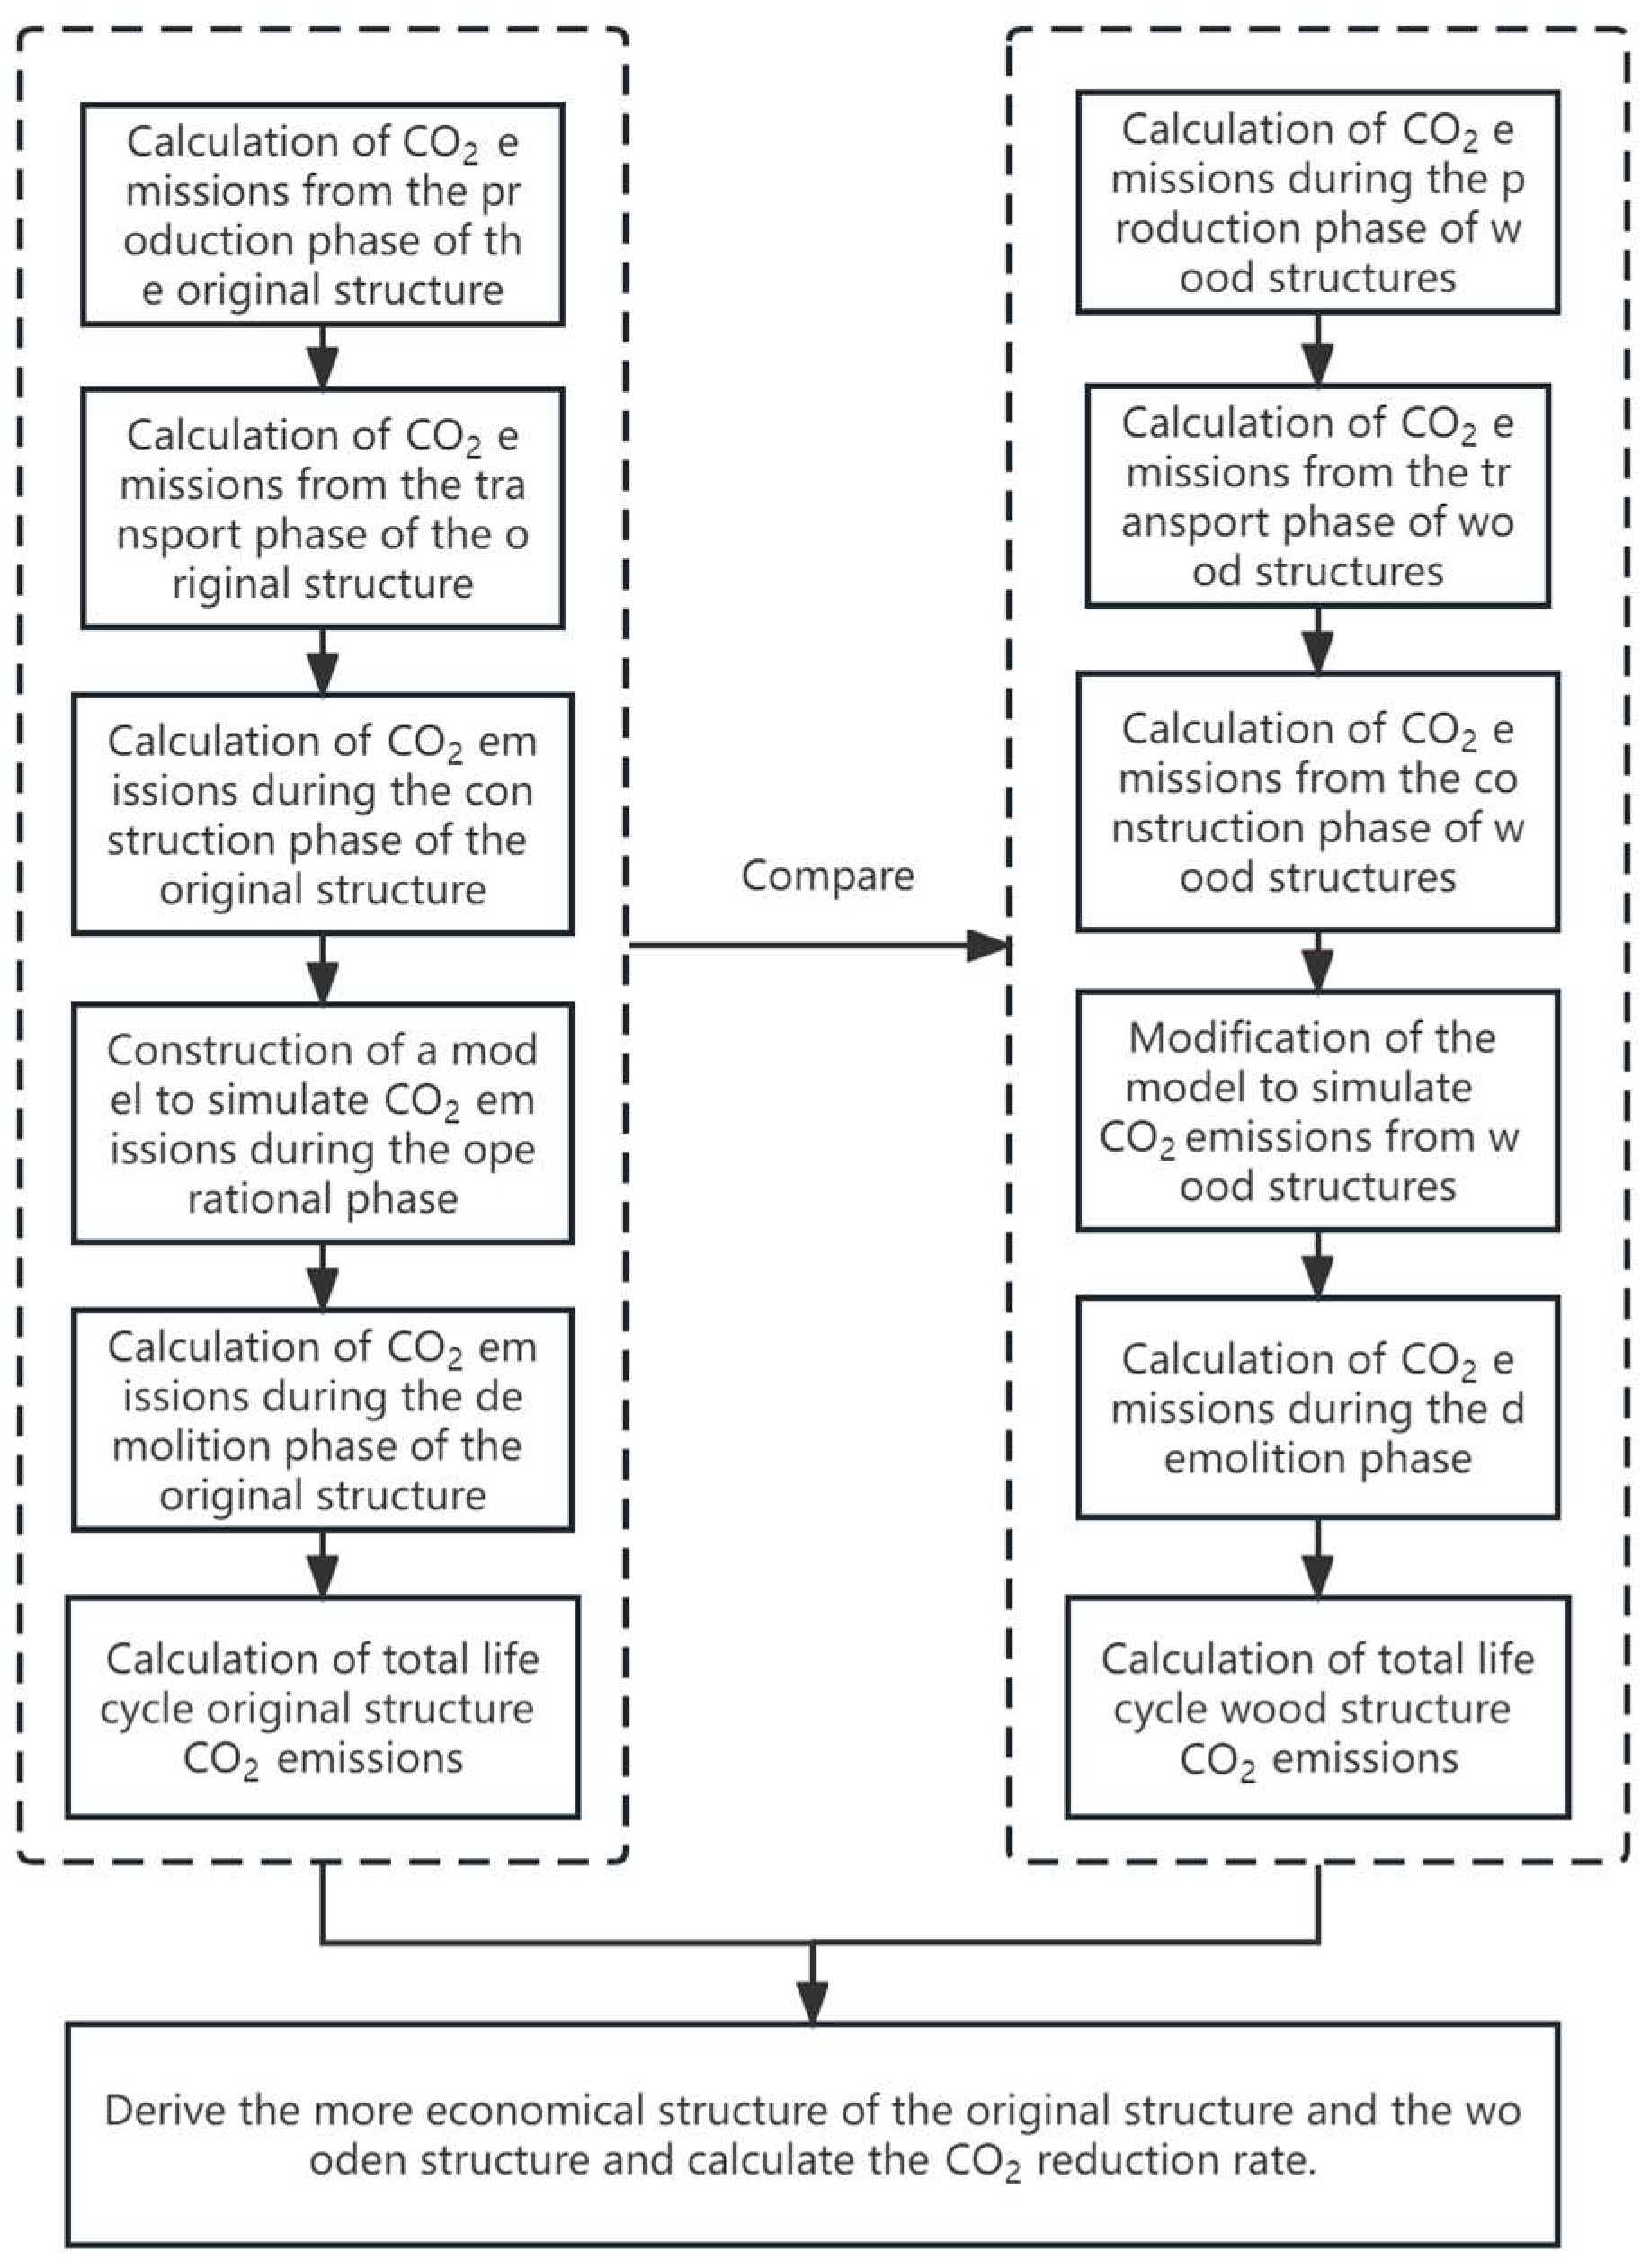
Section 2 introduces the simulation software used in this study, the study methodology, and the study flowchart. In Section 3, the project overview of the case study is clarified, the setting of parameters is elaborated, and the simulation model of the project is built. Section 4 presents each stage’s carbon emission calculation methods, and the results are analyzed and discussed. Conclusions are drawn in Section 5.

2. Research Methods

2.1. Simulation Software

DesignBuilder is a modeling software with a user-friendly graphic interface. It is designed to work with Energy Plus, a building energy simulation engine created by the U.S. Department of Energy and the Lawrence Berkeley National Laboratory. Energy Plus is powerful and can simulate and analyze heating, cooling, ventilation, and energy consumption in buildings [18]. DesignBuilder software is convenient and provides correct information on environmental performance. It can generate high-quality images and animations at any stage of operation. It is easy to use, even for non-expert users who can quickly build complex building models.

2.2. Life Cycle Carbon Emissions Assessment

Life cycle assessment (LCA) is a process that evaluates the environmental impact of a product system throughout its entire life cycle [19], This process involves four steps: determining the purpose and scope, analyzing the inventory, assessing the impact, and interpreting the results. LCA considers inputs, outputs, and potential environmental impacts from the acquisition of raw materials to the production of the product and its disposal after use [20]. The process of LCA in the whole life cycle of a building is shown in Figure 2.
Life cycle carbon emissions assessment (LCCO2A) was derived based on the LCA. LCCO2A focuses on evaluating the CO2 emissions as an output over the whole life cycle of a building.

2.3. System Boundary

Building materials are considered raw construction materials and not final products. Therefore, the system boundary for these materials encompasses the entire life cycle, from raw material collection to recycling. This includes factory production, transportation, construction, use, maintenance, dismantling, and recycling. The carbon emissions accounting boundary for building materials should only include emissions generated during production, transportation, construction, operation, dismantling, and recycling [21].

2.4. Inventory Analysis Method

Inventory analysis is an expression of the basic data of life cycle analysis. It is a quantitative analysis of the carbon emissions of a building throughout its life cycle [22].

2.5. Study Flowchart

The carbon emission simulation of this residential building in the use phase is performed using the LCCO2A and DesignBuilder software. The process is shown in Figure 3. The detailed description of the flowchart is as follows:
Step 1: Calculate the carbon dioxide emissions of the production phase of both structures. The data source is mainly GB51366-2019-T [23].
Step 2: Calculate the carbon dioxide emissions of the transportation phase of the two structures. The data source is mainly GB51366-2019-T, “Carbon Emission Calculation Standard for Buildings”.
Step 3: Calculate the carbon dioxide emissions of the construction phase of the two structures. The data source is mainly GB51366-2019-T, “Carbon Emission Calculation Standard for Buildings”.
Step 4: Calculate the carbon dioxide emissions in the operation phase of the two structures. The data source is mainly the simulation data of DesignBuilder software.
Step 5: Calculate the CO2 emissions during the demolition phase of timber buildings and reinforced concrete structures. The data source is mainly GB51366-2019-T, “Carbon Emission Calculation Standard for Buildings”.
Step 6: Calculate the sum of carbon dioxide emissions of the whole life cycle of the two structures and calculate the carbon dioxide emission reduction rate.

3. Case Selection and Construction Parameters

Project Overview and Original Structural Building Parameters

Changchun is located in the Song Liao Plain region of Northeast China and is categorized as a middle C zone with severely cold temperatures. In January, the average air temperature is −14.6 °C, while, in July, it is 23.3 °C. The region experiences 2688 h of sunshine annually and receives 600–700 mm of precipitation, with over 60% of it occurring during the summer [24]. The study subject’s indoor temperature during winter heating should be 18 °C, and the indoor temperature during summer heating should be 26 °C, with a calculated number of air changes of 0.5 times/h. For areas with lighting, the lighting power is set at 5 W/m2. Figure 4 shows the simulation model created in DesignBuilder.
This is a description of a residential building located in Changchun. It has a total construction area of 294.75 m2 and faces north–south. The first floor is 3.3 m high. The second floor also has a height of 3.3 m. The shape coefficient of the building is 0.32; it is made of a reinforced concrete shear wall structure, and its useful life is 50 years. The first-floor plan can be seen in Figure 5 and the second-floor plan in Figure 6.
The construction era is relatively young in 2012, and the JGJ26-2018, [25] has not been implemented in Jilin Province, so the original structural building parameters—without considering the “Design Standards for Energy Efficiency of Residential Buildings in Severe Cold and Cold Areas”, JGJ26-2018—are shown in Table 1.

4. Carbon Emission Measurement Based on Inventory Analysis Method

4.1. Carbon Emissions during the Material Production Phase

This paper selects reinforced concrete structures and wood structures for a comparative study of whole life cycle carbon emissions. According to GB51366-2019-T, “Carbon Emission Calculation Standard for Buildings”, carbon emissions in the production phase of building materials should be calculated according to Equation (1).
C sc = i = 1 n M i F i
where C sc is the carbon emission of the production stage of building materials (kgCO2e); M i is the consumption of the major building material, F i is the carbon emission factor of the major building material, i (kgCO2e/unit quantity of building materials).
In China, although research has been conducted on carbon emission calculation methods for modern wood-frame buildings, a carbon emission calculation standard has yet to be developed. Therefore, by reading a large amount of the literature on carbon sequestration coefficients for wood structures and the report of the Athena Sustainable Materials Institute in Canada on carbon emissions of wood structural elements in buildings, it can be concluded that the carbon sequestration coefficient for wood growth ( f g ) is f g = 809.6 kg/m3 [26]. Therefore, the carbon emissions from the production phase of wood structures are calculated according to Equations (2) and (3).
C z = C g + i = 1 n m i × f pi
C g = m × f g
where C z is the total carbon emissions from the production of building materials; C g is the amount of carbon sequestered by wood; f pi is the CO2 emission factor; and m is the mass of wood.
According to the carbon emission factors in the China Life Cycle Database (CLCD), Table 2, the CO2 emission factors of the process are shown in Table 3.

4.1.1. Carbon Emissions in the Production Phase of the Original Structural Building Materials

As this paper discusses a cast-in-place concrete frame structure, we have identified the five main components required: raw materials, cement, sand, gravel, steel, and insulation board. The amount of the project’s cement, sand, gravel, steel, and insulation board is calculated according to the drawings: 46.02 tons of cement, 142.06 tons of sand, 62.72 tons of rock, 35.35 tons of steel, and 2.07 tons of polystyrene.
According to Equation (1), C sc = 36.74 tCO2e.

4.1.2. Carbon Emissions in the Production Phase of Wood Construction Materials

According to the structural drawings of the project, the amount of materials after the building was changed to a wood structure was calculated: 106.14 m3 of wood, 1.40 t of cement, 1.56 t of sand, 3.81 t of gravel, 3.88 t of steel, and 1.98 t of rockwool board. Based on the reading of the literature, Canadian specification board and oriented strand board were selected, comprising 11.35 m3 of Canadian specification board and 94.79 m3 of oriented strand board.
According to Equation (2), C z = −13.39 tCO2e.

4.1.3. Comparison of Carbon Emissions in the Production Phase

The carbon emissions in the material production phase for both structures were as follows: the original structure building material production carbon emissions were 36.74 tCO2e, and the wood structure building material production carbon emissions were −13.39 tCO2e. This proves that the carbon sequestration capacity of a wood structure has a significant ability to reduce carbon emissions in the building material production phase.

4.2. Carbon Emissions in Material Transportation Phase

The material transportation phase involves moving raw materials to the production site and transporting finished or semi-finished materials to the construction site. During this process, carbon emissions are produced from the energy used by the transportation methods, leading to greenhouse gas emissions.
According to GB51366-2019-T, “Carbon Emission Calculation Standard for Buildings” [27], the carbon emission in the transportation phase of building materials should be calculated according to Equation (4).
C ys = i = 1 n M i D i T i
where C ys is the carbon emission of the transportation process of the building materials (kgCO2e); M i is the consumption of the main building materials, i (t); D i is the average transportation distance of the building materials (km); and T i is the carbon emission factor per unit weight of transportation distance under the transportation mode of the building materials [kgCO2e/(t·km)]. Carbon emission factors of transportation modes are shown in Table 4.

4.2.1. Carbon Emissions in the Transportation Phase of Prototype Structural Building Materials

The total amounts of building materials are 46.02 tons of cement, 142.06 tons of sand, 62.72 tons of gravel, 35.35 tons of steel, and 2.07 tons of insulation board. According to the actual weight, and to reduce the carbon emissions as much as possible, it was decided the transport vehicles for the 46.02 tons of cement would be 30 t heavy-duty diesel trucks; the 142.06 tons of sand would be transported using 46 t heavy-duty diesel trucks; the 62.72 tons of gravel would use 46 t heavy-duty diesel trucks; the 35.35 tons of steel would use 30 t heavy-duty diesel trucks; and the 2.07 tons of insulation board would use a 2 t light diesel truck. The transport distance is 50 km.
According to Equation (4), C ys = 1.50 tCO2e.

4.2.2. Carbon Emissions in the Transportation Phase of Wood-Frame Buildings

The amount of timber is 106.14 m3 in total, of which the Canadian specification board is 11.35 m3 and the oriented strand board is 94.79 m3. Since the wood is transported from Canada to Changchun City, Jilin Province, i.e., Canadian port–Hunchun port–Changchun–construction site, the transport mode is decided according to the actual weight, transport distance, and the lowest possible carbon emission. The total distance is 9951 km from the Canadian port to Hunchun port by container ship, 471 km from Hunchun to Changchun by railway, and 50 km from Changchun to the construction site by heavy-duty diesel trucks with a capacity of 30 t. Cement, sand, gravel, and steel are transported locally in Changchun, of which 1.40 t of cement is transported by a 2 t light diesel truck, 1.56 t of sand is transported by a 2 t light diesel truck, 3.81 t of gravel is transported by 2 t light diesel trucks, 3.88 t of steel is transported by 2 t light diesel trucks, 1.98 t of rockwool board is transported by a 2 t light diesel truck, and the transport distance is 50 km.
According to Equation (4), C ys = 6.39 tCO2e.

4.2.3. Comparison of Carbon Emissions in Material Transportation Stage

Carbon emissions during the material transportation phase for both structures are as follows: 1.50 tCO2e for transporting the materials for the prototype buildings, and 6.39 tCO2e for the transportation of materials for wood structures. Because of the long stretch of wood transportation during the material transportation phase, the carbon emissions of the wood structure during the transportation phase exceed the carbon emissions of the reinforced concrete structure by 4.89 tCO2e.

4.3. Construction Process Carbon Emissions

The carbon emissions in the construction stage of the building include the carbon emission generated by the completion of each sub-project construction and the carbon emission caused by the implementation process of each measured project.
For the construction project, the scope of construction is relatively straightforward; considering the construction sub-projects, the bill of quantities is used to divide the building construction into the primary parts, such as earthwork, foundation and foundation works, the main structure of the building, scaffolding works, formwork works, etc. On this basis, the carbon emissions of the entire construction process can be defined, and then each process can be defined. Finally, it is divided according to the carbon emissions of each engineering process. Finally, the carbon emission of each engineering process is added up according to the division, and the total carbon emission of the whole construction activity is obtained. According to GB51366-2019-T, “Carbon Emission Calculation Standard for Construction”, the carbon emission in the construction stage of the building should be calculated according to Equation (5).
C jz = i = 1 n E jz , i E F i
where C jz is the carbon emission of the building construction phase (tCO2e); E jz , i is the total energy use of the building construction phase (kWh/kg); and EFi is the carbon emission factor of the energy type (kgCO2/kWh or kgCO2/kg).
The carbon emission factors according to the China Life Cycle Database (CLCD) are shown in Table 5 and Table 6.

4.3.1. Carbon Emission of the Original Structure Building Construction Process

The amount of work and consumption of gasoline, diesel fuel, and electrical consumption of the machinery during the construction phase of the building was calculated from the architectural drawings. The quantities of work and consumption during the construction of the prototype structure are summarized in Table 7.
According to Equation (5), C jz = 26.06 tCO2e.

4.3.2. Carbon Emissions during the Construction of Wood-Frame Buildings

The amount of work during the construction phase of the building and the electricity consumption of gasoline, diesel fuel, and machinery were calculated based on the architectural drawings. The summary of the amount of work and consumption during the construction of the wood structure is shown in Table 8.
According to Equation (5), C jz = 16.05 tCO2e.

4.3.3. Comparison of Carbon Emissions during the Construction Phase

The carbon emissions during the material transportation phase for the two structures were 26.06 tCO2e for the original design and 16.05 tCO2e for the wood structure. All the structural elements and connections for the wood structure, and almost all the prefabricated parts, can be completed away from the building site, so the on-site construction process is greatly simplified, thus reducing the carbon emissions during the construction phase.

4.4. Carbon Emissions in Operation Phase

The operation phase carbon emissions are the carbon emissions generated from the overall operation of the building over its 50-year lifetime. The carbon footprint of the building is obtained by simulating the thermal performance, lighting system, and human activities to the same values and using DesignBuilder.

4.4.1. Carbon Emissions in the Operation Phase of Prototype Structural Buildings

The simulation of the dwelling can yield an annual CO2 emission of 11,582.96 kg, so the total carbon emission during the operation phase of the prototype structure building is C yy = 57.91 tCO2e.

4.4.2. Carbon Emissions in the Operation Phase of Wood-Frame Buildings

The simulation of the building can yield an annual CO2 emission of 11,187.23 kg, so the total carbon emission during the operation phase of the wood frame building is C yy = 55.94 tCO2e.

4.4.3. Comparison of Carbon Emissions in Operation Phase

The carbon emissions in the operation phase of both structures are as follows: 57.91 tCO2e for the operation phase of the original structure, and 55.94 tCO2e for the operation phase of the wood structure.

4.5. Carbon Emissions in the Demolition Phase

The carbon emission of the building demolition stage refers to the carbon emission generated by the construction of the building in the demolition process, which can be calculated according to the volume of the demolition construction process. According to GB51366-2019-T, “Carbon Emission Calculation Standard for Construction”, the carbon emission of the building materials demolition stage should be calculated according to Equation (6).
C cc = i = 1 n E cc , i E F i
where C cc is the carbon emission in the demolition phase (kgCO2e); E cc , i is the total use of the first type of energy in the building demolition phase (kWh/kg); and E F i is the carbon emission factor of the type of energy (kgCO2/kWh or kgCO2/kg).
Due to the lack of data on carbon emissions during the demolition phase in China, according to estimates conducted by relevant scholars, the building demolition process usually accounts for 90% of the energy consumption during the construction phase of building construction [28].

4.5.1. Carbon Emissions during the Demolition Phase of Prototype Structural Building

The carbon emissions from the demolition phase of a steel prototype building are taken as 90% of its construction phase to obtain the carbon emissions from the demolition phase of a reinforced concrete structure: C cc = 23.45 tCO2e.

4.5.2. Carbon Emissions in the Demolition Phase of Wood-Frame Buildings

The carbon emissions from the demolition phase of a wood-frame building are taken as 90% of the emission of the construction phase to obtain the carbon emissions from the demolition phase of the wood-frame building: C cc = 13.32 tCO2e.

4.6. Comparison of CO2 Emissions of Whole-Life Prototype and Wood-Frame Buildings

Since there is no clear regulation of the recycling of construction waste in China, the CO2 generated in the recycling of construction waste is not calculated in the whole life-cycle carbon emission calculation. The total life-cycle carbon emissions are C = C sc + C ys + C jz + C yy + C cc = 141.66 tCO2e. The carbon emission of the wood structure material production phase is −13.39 tCO2e; the transportation phase is 6.39 tCO2e; the construction phase is 16.05 tCO2e; the operation phase is 55.94 tCO2e; the demolition phase is 13.21 tCO2e; and the whole life-cycle carbon emission is C = C sc + C ys + C jz + C yy + C cc = 80.20 tCO2e, as in Figure 7. Therefore, compared with the original structural building life-cycle carbon emissions, the life-cycle carbon emissions of the wood-frame building are reduced by 61.46 tCO2e, and the life-cycle carbon emissions of the wood-frame building are reduced by 43.39%.

5. Conclusions

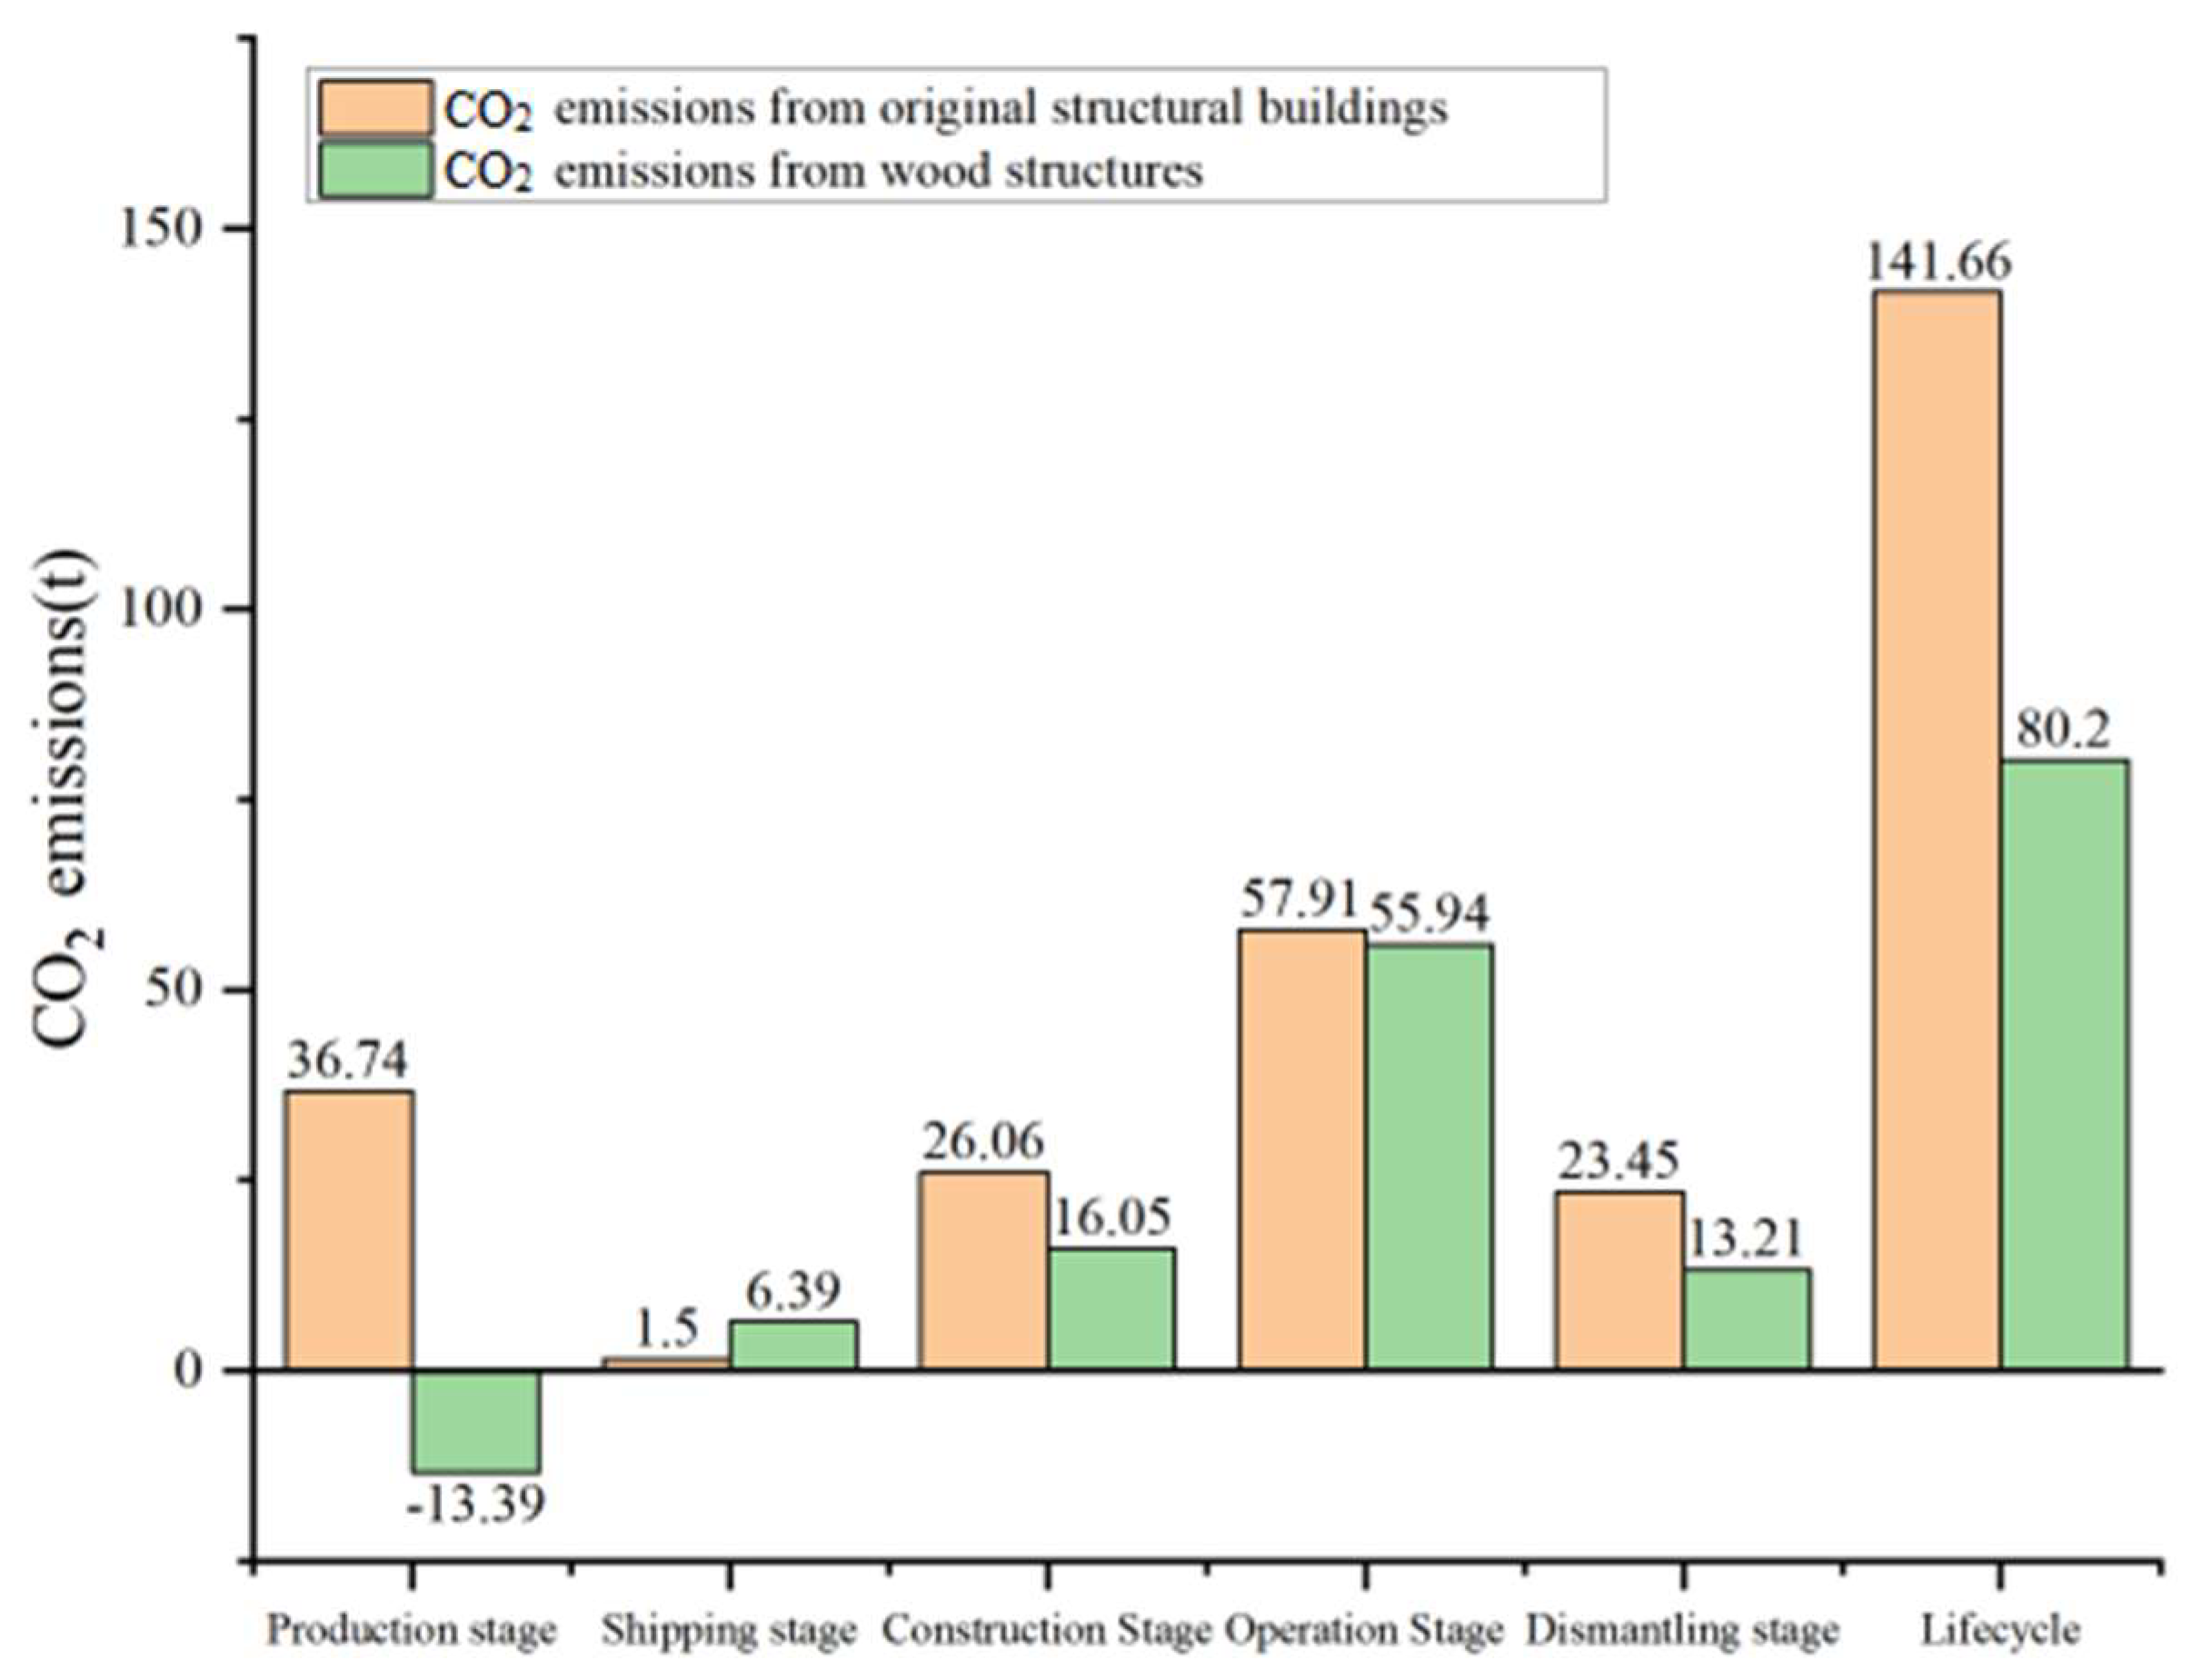
This paper evaluates the carbon emissions of reinforced concrete and wood structures throughout their entire life cycle in a villa building located in Jilin Province, using the life-cycle evaluation method. The results show that the reinforced concrete structure emits 141.66 tCO2e, while the wood structure emits 80.20 tCO2e. Studies have shown that the carbon emission reduction rate of wooden structure houses is 43.39%, which is higher than the above literature, which means that promoting the use of wooden structure buildings is an effective way to reduce carbon emissions and the footprint of the construction industry.
This paper focuses solely on simulating residential buildings in Changchun, Jilin Province and does not include simulations of residential buildings in other severely cold regions. Additionally, the types of wood used in wood-frame buildings are limited in this paper, but various wood types can be chosen for comparative analysis.
Currently, wood structures in China are only approved for buildings of three floors or less. It is important to explore the use of multi-story and high-rise wood structures. Based on these calculations, it is apparent that 97.18% of carbon emissions of wood structure construction occur during the transportation phase. This accounts for 7.74% of the total carbon emissions from the entire life cycle of wood structures. To reduce carbon emissions, developing the timber industry chain and expanding it to domestic provinces is crucial. Due to the lack of clear standards for building demolition, it is necessary to conduct further research on the structural calculation data provided. Additionally, research on building waste recycling in China should be increased to further reduce carbon emissions.
China is making significant efforts to promote sustainable forest carbon sequestration. Each province has issued relevant documents based on its unique situation to achieve this. This approach has been successful in protecting the ecological environment using forest resources. Furthermore, the provinces are currently working to establish carbon-trading markets but are still developing and refining their strategies.

Author Contributions

Conceptualization, H.Y.; methodology, H.Y.; software, H.Y.; formal analysis, H.Y.; data collection, H.Y.; review and editing, K.K. and M.H. All authors have read and agreed to the published version of the manuscript.

Funding

This work was supported by JST SPRING, Grant Number JPMJSP2119.

Informed Consent Statement

This research does not involve humans.

Data Availability Statement

The data are contained within this study.

Conflicts of Interest

The authors declare no conflict of interest.

References

  1. Global Carbon Budget. Available online: https://www.globalcarbonproject.org/carbonbudget/ (accessed on 10 April 2023).
  2. CO2 Emissions, Global Carbon Atla. Available online: www.globalcarbonatlas.org/cn/CO2-emissions (accessed on 10 April 2023).
  3. Cai, W.; Wu, Y.; Zhong, Y.; Ren, H. China building energy consumption: Situation, challenges and corresponding measures. J. Energy Policy 2009, 37, 2054–2059. [Google Scholar] [CrossRef]
  4. Flower, D.J.M.; Sanjayan, J.G. Green house gas emissions due to concrete manufacture. Int. J. Life Cycle Assess. 2007, 12, 282–288. [Google Scholar] [CrossRef]
  5. Adesina, A. Recent advances in the concrete industry to reduce its carbon dioxide emissions. Environ. Chall. 2020, 1, 100004. [Google Scholar] [CrossRef]
  6. Habert, G.; Miller, S.A.; John, V.M.; Provis, J.L.; Favier, A.; Horvath, A.; Scrivener, K.L. Environmental impacts and decarbonization strategies in the cement and concrete industries. Nat. Rev. Earth Environ. 2020, 1, 559–573. [Google Scholar] [CrossRef]
  7. Costa, F.N.; Ribeiro, D.V. Reduction in CO2 emissions during production of cement, with partial replacement of traditional raw materials by civil construction waste (CCW). J. Clean. Prod. 2020, 276, 123302. [Google Scholar] [CrossRef]
  8. Purnell, P. Material nature versus structural nurture: The embodied carbon of fundamental structural elements. Environ. Sci. Technol. 2012, 46, 454–461. [Google Scholar] [CrossRef] [PubMed]
  9. Miller, S.A.; John, V.M.; Pacca, S.A.; Horvath, A. Carbon dioxide reduction potential in the global cement industry by 2050. Cem. Concr. Res. 2018, 114, 115–124. [Google Scholar] [CrossRef]
  10. Moon, E.-J.; Choi, Y.C. Carbon dioxide fixation via accelerated carbonation of cement-based materials: Potential for construction materials applications. Constr. Build. Mater. 2019, 199, 676–687. [Google Scholar] [CrossRef]
  11. Song, C. Intelligence and Digitization Application in Green Building. Munic. Eng. 2022, 7, 56–58. [Google Scholar]
  12. Yi, L.; HE, X. Embodied environmental impact assessments of urban residential buildings in China based on life cycle analyses. J. Tsinghua Univ. Sci. Technol. 2015, 55, 74–79. [Google Scholar]
  13. Pan, W.; Mei, H. A Design Strategy for Energy-Efficient Rural Houses in Severe Cold Regions. Int. J. Environ. Res. Public Health 2020, 17, 6481. [Google Scholar] [CrossRef] [PubMed]
  14. Zeng, G.; Wei, Z.; Yue, B.; Ding, Y.; Zheng, C.; Zhai, X. Energy Consumption Prediction of Office Buildings Based on CNN-RNN Combined Model. J. Shanghai Jiao Tong Univ. 2022, 56, 1256–1261. [Google Scholar]
  15. Feng, G.; Cui, H.; Chang, S.; Huang, K.; Wang, X. Analysis of carbon emissions and influencing factors of near-zero energy buildings. Adv. Clim. Change Res. 2022, 18, 205–214. [Google Scholar]
  16. Lu, H.; Zhang, J.; Yang, Y.; Leng, L.; Guo, F.; Bian, F. Components, fixation mechanisms and research directions of carbon sinks in bamboo forest ecosystems. J. Bamboo Sci. 2021, 90–94. [Google Scholar]
  17. Li, R.; Chen, S. Contrast analysis of energy consumption simulation software and summary of Design Builder application. Eng. Technol. 2017, 296–297. [Google Scholar]
  18. Gao, Y.; Li, Z.; Zhang, H.; Yu, B.; Wang, J. Carbon emission analysis of the whole process of assembled building construction based on LCA. J. Eng. Manag. 2018, 32, 30–34. [Google Scholar]
  19. Cai, S.; Wang, X.; Hong, Z.; Yu, N.; He, J. Current Situation and Suggestions on the Development and Transaction of Forestry Carbon Sequestration Projects in Jiujiang City. Energy Res. Manag. 2022, 5–11. [Google Scholar]
  20. Cao, H.; Li, H.; Zeng, D.; Ge, W. The State-of-art and Future Development Strategies of Green Manufacturing. China Mech. Eng. 2020, 31, 135–144. [Google Scholar]
  21. Zou, Z.; Dong, N.; Peng, Y. Impact Analysis of the Building Structure Types on the Life Cycle Assessment Analysis for the Building Structure Types’ Impact on the Life Cycle Assessment. In Proceedings of the 2010 International Conference on E-Product E-Service and E-Entertainment, Henan, China, 7–9 November 2010; IEEE: Piscataway, NJ, USA, 2010. [Google Scholar]
  22. Life Cycle Evaluation—An Exploration of Inventory Analysis Methodology. Available online: www.cnki.com.cn/Article/CJFDTotal-SHHJ200205021.htm (accessed on 10 April 2023).
  23. GBT51366; Carbon Emission Calculation Standard for Buildings. China National Standardization Management Committee: Beijing, China, 2019.
  24. He, L.; Ren, L. Research on the introduction test technology of Ulmus golden leaf. Inn. Mong. For. Invest Design. 2016, 39, 37–38. [Google Scholar]
  25. JGJ26; Design Standard for Energy Efficiency of Residential Buildings in Severe Cold and Cold Areas. Ministry of Housing and Urban-Rural Development of the People’s Republic of China: Beijing, China, 2018.
  26. Institute of Environmental Materials and Technology, School of Materials, Beijing Institute of Technology. Research Report on the Carbon Footprint Analysis of Wooden Residential Buildings; Institute of Environmental Materials and Technology, School of Materials, Beijing Institute of Technology: Beijing, China, 2010. [Google Scholar]
  27. China’s Carbon Emissions Trading Market: From Principle to Practice. Available online: www.mall.cnki.net/Xinke/web/Info/DZ2208450013 (accessed on 5 March 2023).
  28. Yong, H. Research on Carbon Emission and Emission Reduction of Multi-Storey Residential Buildings in Hot-Summer and Warm-Winter Areas: A Case Study of a Student Apartment in Xiamen; Huaqiao University: Xiamen, China, 2013. [Google Scholar]
Figure 1. Carbon emissions share of each phase of building in 2020.
Energies 16 05285 g001
Figure 2. Flowchart of LCA in the whole building life cycle.
Energies 16 05285 g002
Figure 3. Study flowchart.
Energies 16 05285 g003
Figure 4. Simulation model of a residential building.
Energies 16 05285 g004
Figure 5. First-floor plan.
Energies 16 05285 g005
Figure 6. Second-floor plan.
Energies 16 05285 g006
Figure 7. Comparative graph of CO2 by stage.
Energies 16 05285 g007
Table 1. Reinforced Concrete Structure Architectural Parameters.
Design ParametersDataHeat Transfer Coefficient (W/(m2·k))
Exterior wall25 mm cement mortar + 370 mm hollow clay brick + 40 mm EPS polystyrene foam board + 8 mm cement mortar1.22
Roof40 mm fine stone reinforced concrete + 50 mm XPS polystyrene foam board + 1.2 mm waterproof coiled material + 20 mm cement mortar leveling layer + 30 mm lightweight aggregate concrete slope finding + 120 mm reinforced concrete roof slab1.21
Exterior windowPlastic frame, ordinary insulating glass 5 + 6A + 5, air, rubber strip sealing2.97
Floor height3.3 m
Window-to-wall ratioNorth: 0.20
East: 0.25
South: 0.30
West: 0.25
Heating methodCentral heating–city heating
Heating delivery systemHot water heating system
Table 2. Carbon emission factors of building materials.
Construction Material CategoryCarbon Emission Factors for Building Materials
Sand2.51 kgCO2e/t
Gravel2.18 kgCO2e/t
Polystyrene foam board5020 kgCO2e/t
Ordinary silicate cement (market average)735 kgCO2e/t
Hot-rolled carbon steel bars2340 kgCO2e/t
Rockwool panels1980 kgCO2e/t
Table 3. CO2 emission factor per cubic meter of wood processed.
Material TypeMaterial Specific Gravity kg/m3CO2 Emission Factor kgCO2/m3
Specification plate450151.58
Oriented strand board460271.2
Table 4. Carbon emission factors of transportation modes.
Type of Shipping MethodCarbon Emission Factors
Light diesel truck transport (2 t load)0.286
Heavy-duty diesel truck transportation (30 t load)0.078
Heavy-duty diesel truck transportation (46 t load)0.057
Rail transportation (China market average)0.010
Container ship transportation (200 TEU capacity)0.012
Table 5. Fossil fuel carbon emission factors.
Fuel TypeCO2 Emission Factor per Unit Calorific Value (TCO2/TJ)
Gasoline67.91
Diesel72.59
Table 6. Average CO2 Emission Factors of China’s Regional Power Grids in 2012.
Grid NameEmission Factor (kgCO2/kWh)
Northeast Regional Grid0.7769
Table 7. Summary of construction process works and consumption of the original structure building.
Construction Phase MachineryQuantity of WorkGasoline Consumption (kg)Diesel Consumption (kg)Electrical Consumption (kWh)
Crawler bulldozer function2.64 149.03
Crawler-type single bucket excavator1.38 87.00
Dump truck111.093470.45
Electric tamper100.77 1672.77
Static pile driver6.59 512.44
Truck-mounted cranes9.47 269.23
Crawler-type diesel pile driver23.00 1028.79
AC arc welding machine7.53 601.77
Mortar mixer5.11 44.00
Concrete mixer9.35 514.62
Concrete transfer pumps13.91 3386.53
Electric winch66.57 1914.56
Prestressing steel tensioning machine0.49 8.45
Rebar cutting machine3.94 126.47
Rebar bending machine9.76 124.93
Spot welding machine11.52 1781.34
Butt welding machine2.04 248.88
Flat water grinding machine56.26 787.5
Truck-mounted cranes1.24352.69
Truck7.02 128.87
Total 3823.142175.3611,471.26
Table 8. Summary of construction process works and consumption of wood-frame building.
Construction Phase MachineryQuantity of Work (Shift)Gasoline Consumption (kg)Diesel Consumption (kg)Electrical Consumption (kWh)
Crawler bulldozer function2.64 149.03
Crawler-type single bucket excavator1.38 87.00
Dump truck111.093470.45
Electric tamper100.77 1672.77
Concrete mixer0.83 45.68
Electric winch10.19 293.06
Prestressing steel tensioning machine0.16 2.760
Rebar cutting machine1.16 37.24
Rebar bending machine3.25 41.60
AC arc welding machine1.36 81.97
Spot welding machine3.84 593.78
Electric winch0.68 82.96
Butt welding machine15.21 415.92
Woodworking circular sawing machine10.01 47.05
Woodworking eyelet punching machine17.14 221.11
Woodworking flat blasting machine2.34
Mortar mixer2.04 20.14
Flat water grinding machine56.26 787.5
Truck0.21428.125.35
Fork lift16.17
Total 3877.46236.034343.54
Disclaimer/Publisher’s Note: The statements, opinions and data contained in all publications are solely those of the individual author(s) and contributor(s) and not of MDPI and/or the editor(s). MDPI and/or the editor(s) disclaim responsibility for any injury to people or property resulting from any ideas, methods, instructions or products referred to in the content.

