Article

Gear Wear Detection Based on Statistic Features and Heuristic Scheme by Using Data Fusion of Current and Vibration Signals

by
Arturo Yosimar Jaen-Cuellar
1,
Miguel Trejo-Hernández
1,
Roque Alfredo Osornio-Rios
1 and
Jose Alfonso Antonino-Daviu
2,*
1
HSPdigital–CA Mecatrónica, Facultad de Ingeniería, Campus San Juan del Río, Universidad Autónoma de Querétaro, Río Moctezuma 249, Col. San Cayetano, San Juan del Rio 76807, Mexico
2
Instituto Tecnológico de la Energía, Universitat Politècnica de València (UPV), Camino de Vera s/n, 46022 Valencia, Spain
*
Author to whom correspondence should be addressed.
Energies 2023, 16(2), 948; https://doi.org/10.3390/en16020948
Submission received: 25 November 2022 / Revised: 22 December 2022 / Accepted: 10 January 2023 / Published: 14 January 2023

Abstract

:
Kinematic chains are ensembles of elements that integrate, among other components, with the induction motors, the mechanical couplings, and the loads to provide support to the industrial processes that require motion interchange. In this same line, the induction motor justifies its importance because this machine is the core that provides the power and generates the motion of the industrial process. However, also, it is possible to diagnose other types of faults that occur in other elements in the kinematic chain, which are reflected as problems in the motor operation. With this purpose, the coupling between the motor and the final load in the chain requires, in many situations, the use of a gearbox that balances the torque–velocity relationship. Thus, the gear wear in this component is addressed in many works, but the study of gradual wear has not been completely covered yet at different operating frequencies. Therefore, in this work, a methodology is proposed based on statistical features and genetic algorithms to find out those features that can best be used for detecting the gradual gear wear of a gearbox by using the signals, measured directly in the motor, from current and vibration sensors at different frequencies. The methodology also makes use of linear discriminant analysis to generate a bidimensional representation of the system conditions that are fed to a neural network with a simple structure for performing the classification of the condition. Four uniform gear wear conditions were tested, including the healthy state and three gradual conditions: 25%, 50%, and 75% wear in the gear teeth. Because of the sampling frequency, the number of sensors, the time for data acquisition, the different operation frequencies analyzed, and the computation of the different statistical features, meant that a large amount of data were generated that needed to be fused and reduced. Therefore, the proposed methodology provides an excellent generalized solution for data fusion and for minimizing the computational burden required. The obtained results demonstrate the effectiveness of fault gradualism detection for the proposed approach.

1. Introduction

Into the kinematic chains, there are ensembled elements with very noticeable importance, such as the gearboxes, because they allow the transmission of movement with a defined speed and torque from a rotating mechanical power source through a shaft connected to other loads in the chain, such as in the case of internal combustion motors or the case of electric motors [1]. Another advantage of a gearbox is in the motor shaft coupling through the transmission system because the same crankshaft turning speed can be converted into different turning velocities on the wheels of vehicles [2]. The usage of gearboxes in any mechanism is very advantageous since they require reduced spaces, are fixed, provide a considerable power transmission capacity, and possess a high performance [3]. However, gearboxes can be of high cost, maintenance must be considered, and they are very difficult to manufacture [4]. Different applications of gearboxes can be found, for example, in electric and combustion vehicles [5], in energy generation through on-shore wind turbines [4] and off-shore tidal stream turbines [6], in aero vehicles such as helicopters [7], in conveyors [8], and sucker-rod pumping [9], among others. Due to the wide range of industrial and non-industrial applications on which the gearbox is an essential module, it is necessary to detect the wear of its ensembled elements, as in the specific case of the gears. Although much research has been conducted where the study about gear faults is addressed, most of them have focused on fault detection once the damage is severe, such as in the case of a broken tooth [10,11]. However, in recent works, the evolution of the faults has gained attention through gradual conditions, but despite this, there are still some drawbacks and limitations in the methodologies reported that could be susceptible to improvement.
In relation to the reported methodologies that tackle the topic of fault identification in gearboxes, there exist several investigations focused on gears, making use of electric signals (current typically) for developing approaches to detect problems. For example, in [12], a methodology for detecting faults in a two-stages gearbox of wind turbines (WT) is described. There, the current signal from the WT generator is resampled by an adaptive algorithm, and through the fast Fourier transform (FFT), the fault features are extracted as normalized power differences considering the mean absolute value (MAV) and the standard deviation (SD). The faults considered were one and two teeth breakages, a gear crack, and top land wear. For its part, the methodology described in [13] makes use of the rotor current signal coming from a double-fed induction generator (DFIG) of a WT for gear faults identification. An angular resampling algorithm is applied, and through the Hilbert transform, an enveloped signal is generated from which the fault features are obtained. Then, through a stacked autoencoder (SAE) and a support vector machine (SVM), the classification of the fault is carried out. For this work, the faults considered were one and two teeth breakages and chipped or cracked faults in the test gear. In another case, a fault diagnosis on a planetary gearbox of an induction motor was performed through the stator current in [14]. That work takes advantage of the load torque oscillations generated by the faulty elements bringing, as a consequence, amplitude modulation and frequency modulation (AM-FM). Then, an AM-FM model is derived through Fourier spectrum analysis. The analyzed faults correspond to one tooth breakage on the sun, ring, and planet gears. Nevertheless, the abovementioned methodologies strongly depend on the frequential spectrum analysis for extracting the features, which means that other related fault frequencies might hide the real faults, not to mention that no fault graduality is considered. Several works have been reported regarding the vibration-based approaches for the fault diagnosis of gears; for example, in [15] an indicator is developed that evaluates the effects of wear on the gear performance for induction motors. This indicator is defined through a state vector of the time synchronous averaged signals considering the sideband ratios obtained from teeth meshing harmonics and their sidebands. Two averaged logarithmic ratios, with fixed and moving references, allow gear wear monitoring to be defined for a gear pair with artificial pits on teeth surfaces. Once again, the strong dependency of related frequencies at the sidebands could limit the type of fault to be analyzed. In this same line, the investigation carried out in [16] proposes an approach for monitoring and predicting surface profile changes and pitting the density in spur gears of a gearbox coupled with an induction motor. This approach considers three main stages starting with a 21-degree-of-freedom dynamic model of the gear for simulating the element response, the use of two tribological models that estimate the wear depth and pitting density, and the updating of the models through continuous comparisons between measured versus estimated signals. Likewise, in the work presented by [17], the use of the tribology and the vibration signals for developing a model based on a vector machine for multi-features fusion and an index for online wear debris monitoring are used to evaluate the wear and pitting faults on planetary gears. However, the main drawback for these last two reported works is that in order to obtain higher accuracy in the prediction, the complexity of the models necessarily needs to be increased. Continuing with the condition monitoring of gear wear, in the paper presented in [18], a methodology is proposed based on supervised learning through infrared thermography. Hence, seven statistical features, together with the entropy and energy indicators, are computed from the thermal images. Then, linear discriminant analysis (LDA) and the neural networks classify the fault conditions. However, the main drawback of this approach is the necessary calibration of the thermal camera, not to mention that only one operation frequency is considered. Equally important are the techniques based on data fusion; for instance, gear faults detection is performed through the framework in [19] and is applied to the drivetrain of WT with DFIGs. The time domain and frequency domain features are computed from stator and rotor current signals. Then, an SVM scheme performs fault identification both individually and combined, and a Dempster–Shafer evidential reasoning (DSER) algorithm fuses the probabilistic outputs from the SVMs for comparison purposes. The fault conditions were one and two teeth missing, a chipped gear, and a cracked gear. Meanwhile, the method developed in [20] performs an information fusion of vibration and current signals for diagnosing a WT drivetrain gearbox. The feature extraction for the vibration and current considers some statistical time domain indicators such as Kurtosis, crest factor, and signal-to-noise ratio, and frequency domain indicators such as energy at each gear meshing frequency and its sidebands. Posteriorly, multiclass SVM probabilistic models define two classifiers whose outputs are fused through Dempster–Shafer theory and SoftMax regression. The gear conditions studied were one tooth breakage, chipped gear, and crack fault in the test gear. One disadvantage to these approaches was that they did not consider graduality for the fault conditions. From the previous works, it can be noted that the extraction of features is very common in the development of diagnosis methodologies because they provide useful information related to the fault conditions [21]. Nonetheless, if they are not correctly selected, they can lead to stagnation problems due to information redundancy or because no information contribution exists. It must be highlighted from the previous discussion that most of the investigations work with fixed operating conditions during the fault diagnosis. However, some phenomena inherent to motor operation, introduce effects that could be erroneously interpreted as a failure. For example, fluctuating loads can be present during motor operation and their resulting effects are very similar to those produced by the presence of a broken rotor bar [22]. Thus, when a motor drives a varying load, the identification of faults under this situation can be very difficult, and the common techniques can confuse the effect produced by the operating condition with a fault condition delivering an incorrect diagnostic for a healthy motor [23,24]. There exist classical methodologies that help to identify frequencies related to faults on induction motors, such as eccentricities, broken rotor bars, and bearing defects, among others, through signature analysis, but even they are limited by the load effects that obscure and overwhelm those produced by the fault conditions [25]. On the other side, some investigations have used vibration signals to analyze the frequency spectrum of induction motors to observe those frequency components associated with the faults [26]. Other works introduce the stator current with the Wavelet transform and sliding windows for detecting rotor unbalances [27]. Meanwhile, applying the Hilbert transform for calculating the instantaneous frequency on the stator current signal can be very helpful for the identification of faults in induction motors [28]. Recently, the motor current signature analysis (MCSA) has been enhanced through the use of the magnetic stray flux on the motor surround, which helps to detect fault conditions where current or vibration signals are not capable [29]. Therefore, the interesting aspect of all these works is that they provide reliable results even under load fluctuations. Finally, although the effects of variations in the operating conditions, such as fluctuating loads, have been reported, and there exist methodologies that tackle these situations, the proposed work takes for now as variations of the operation conditions changes in the frequency of the variable frequency drive (VFD) that drives the motor.
Accordingly, it is worth mentioning the studies that address the use of machine learning, heuristic, and statistical techniques on industrial applications to develop solutions to fault detection problems. As an example, the study carried out in [30] proposes a genetic algorithm (GA) method to estimate the characteristic parameters of the operation gear. Here, a resistance antenna is printed in the gear surface to provide the potential cracked locations over the surface, and this loss is sent to the GA approach to perform the estimation of the natural frequency and quality factor of the antenna. On the other hand, a GA and the random forest (RF) classifier are integrated in [31] as a supervised system for multi-class fault diagnosis in spur gears considering statistical features in time, frequency, and time-frequency domains from vibration signals. Seven gear conditions are analyzed: normal, 10%/50%/100% of tooth breakage, pinion pitting, 0.5 mm pinion face wear, and misalignment. It can be noticed that the GA selects the features that best work for the classifier. However, a disadvantage of this approach is that performance evaluation in the GA requires going through the whole process of data matrix construction and classifier application, increasing the computational burden significantly. In the meantime, the work presented in [32] develops a methodology for diagnosing pitting faults on gears for the aerospace industry through vibration signals. This approach combines the data augmentation theory with deep sparse autoencoder (DSAE) and SoftMax regression to evaluate six pitting conditions without gradual evolution and under the same operating conditions. Additionally, this approach was designed considering the management of small sample sets by generating sample augmentation. In another case, the work presented in [33] develops a methodology based on vibration signals and statistical features selection optimization by performing a double selection process by GA and the fisher score for faults in elements of a kinematic chain. The conditions considered were normal, including bearing defects, half and one broken rotor bars, unbalance, and misalignment. This work also demonstrates that by using the GA technique, it is possible to optimize the process of detecting faults. However, here, no gradual evolution of the fault was considered, only one operating frequency was considered, and no data fusion was performed.
This work contributes to the development of a methodology that integrates a heuristic technique, such as the GA, for the enhancement of feature selection into a data-fusion-based scheme for detecting gear wear graduality in the applications of gearbox coupling in induction motors. The methodology implements five main processing stages: data acquisition, features extraction, high-dimensional set of features, optimized selection process, data fusion, and gear wear diagnosis. The data fusion is performed for the features extracted from the motor current signal and from the vibration signals of the gearbox. Four fault conditions are considered in this study: healthy state and three gear wear severity levels, and the experimental test was carried out under five different operating frequencies. Due to the aforementioned, the number of features is too high that need to be arranged in a matrix with high dimensionality ready for being used in the diagnosing stage. Then, the GA technique optimizes the feature selection process, and the optimized features are transformed into a two-dimensional representation/reduction through the LDA, which in turn feeds a simple artificial neural network (ANN), greatly facilitating the identification and classification of the conditions. The obtained results demonstrate that data fusion not only boosts the fault diagnosis but also an optimized feature selection can lead to accurate fault identification even for different operating frequencies.

2. Theoretical Background

In the next sections, the theoretical background addressing topics such as gear faults, statistical indicators, genetic algorithms, and linear discriminant analysis besides the artificial neural network is described.

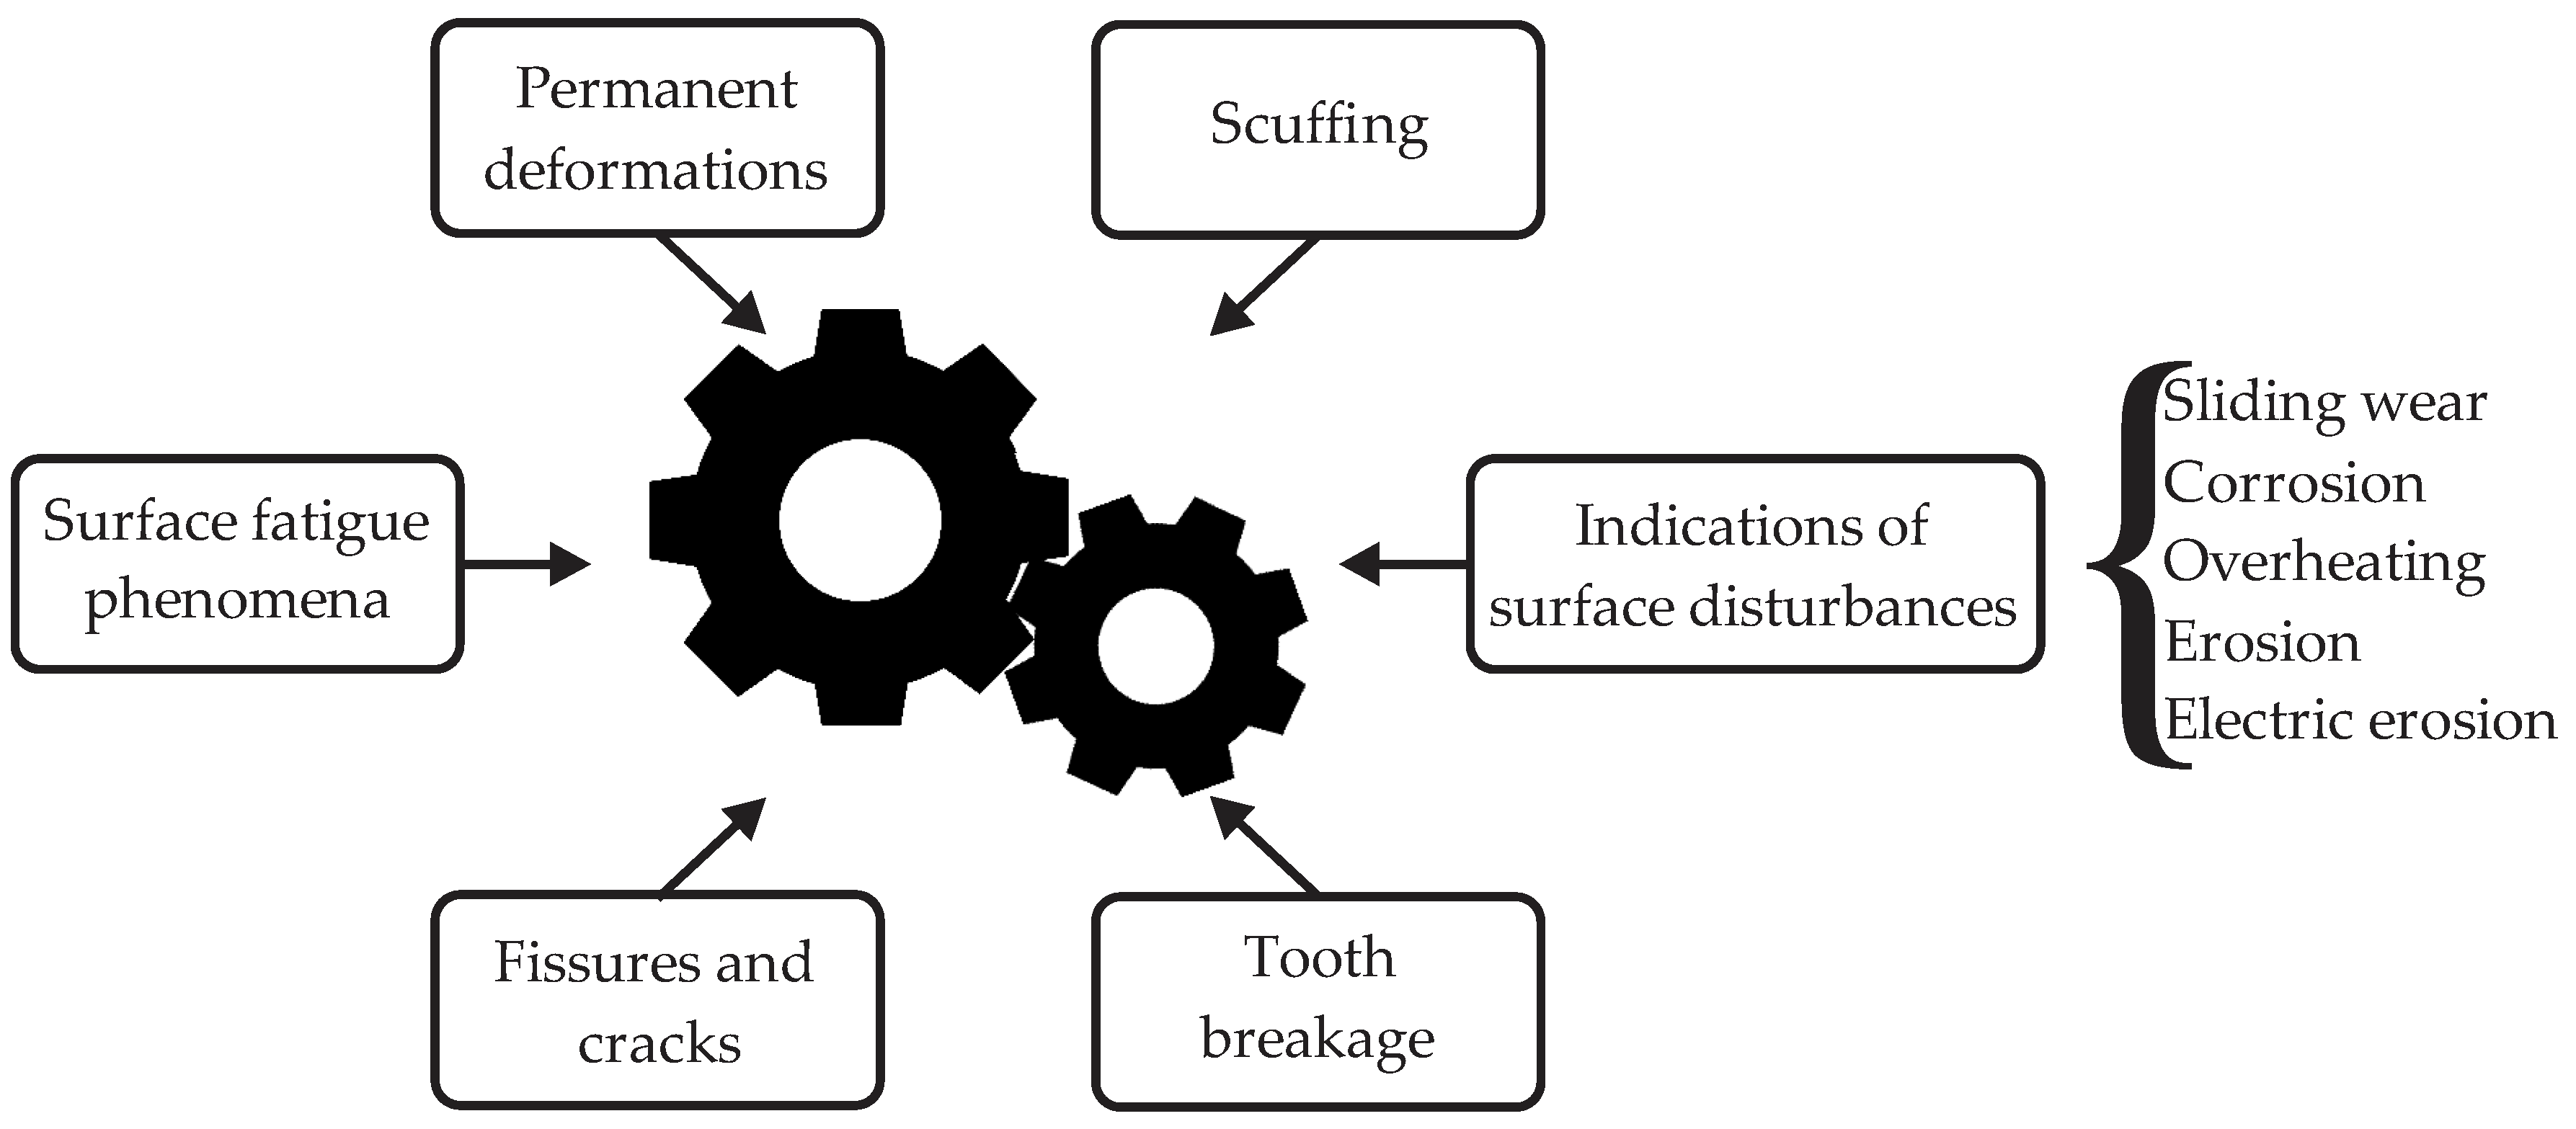
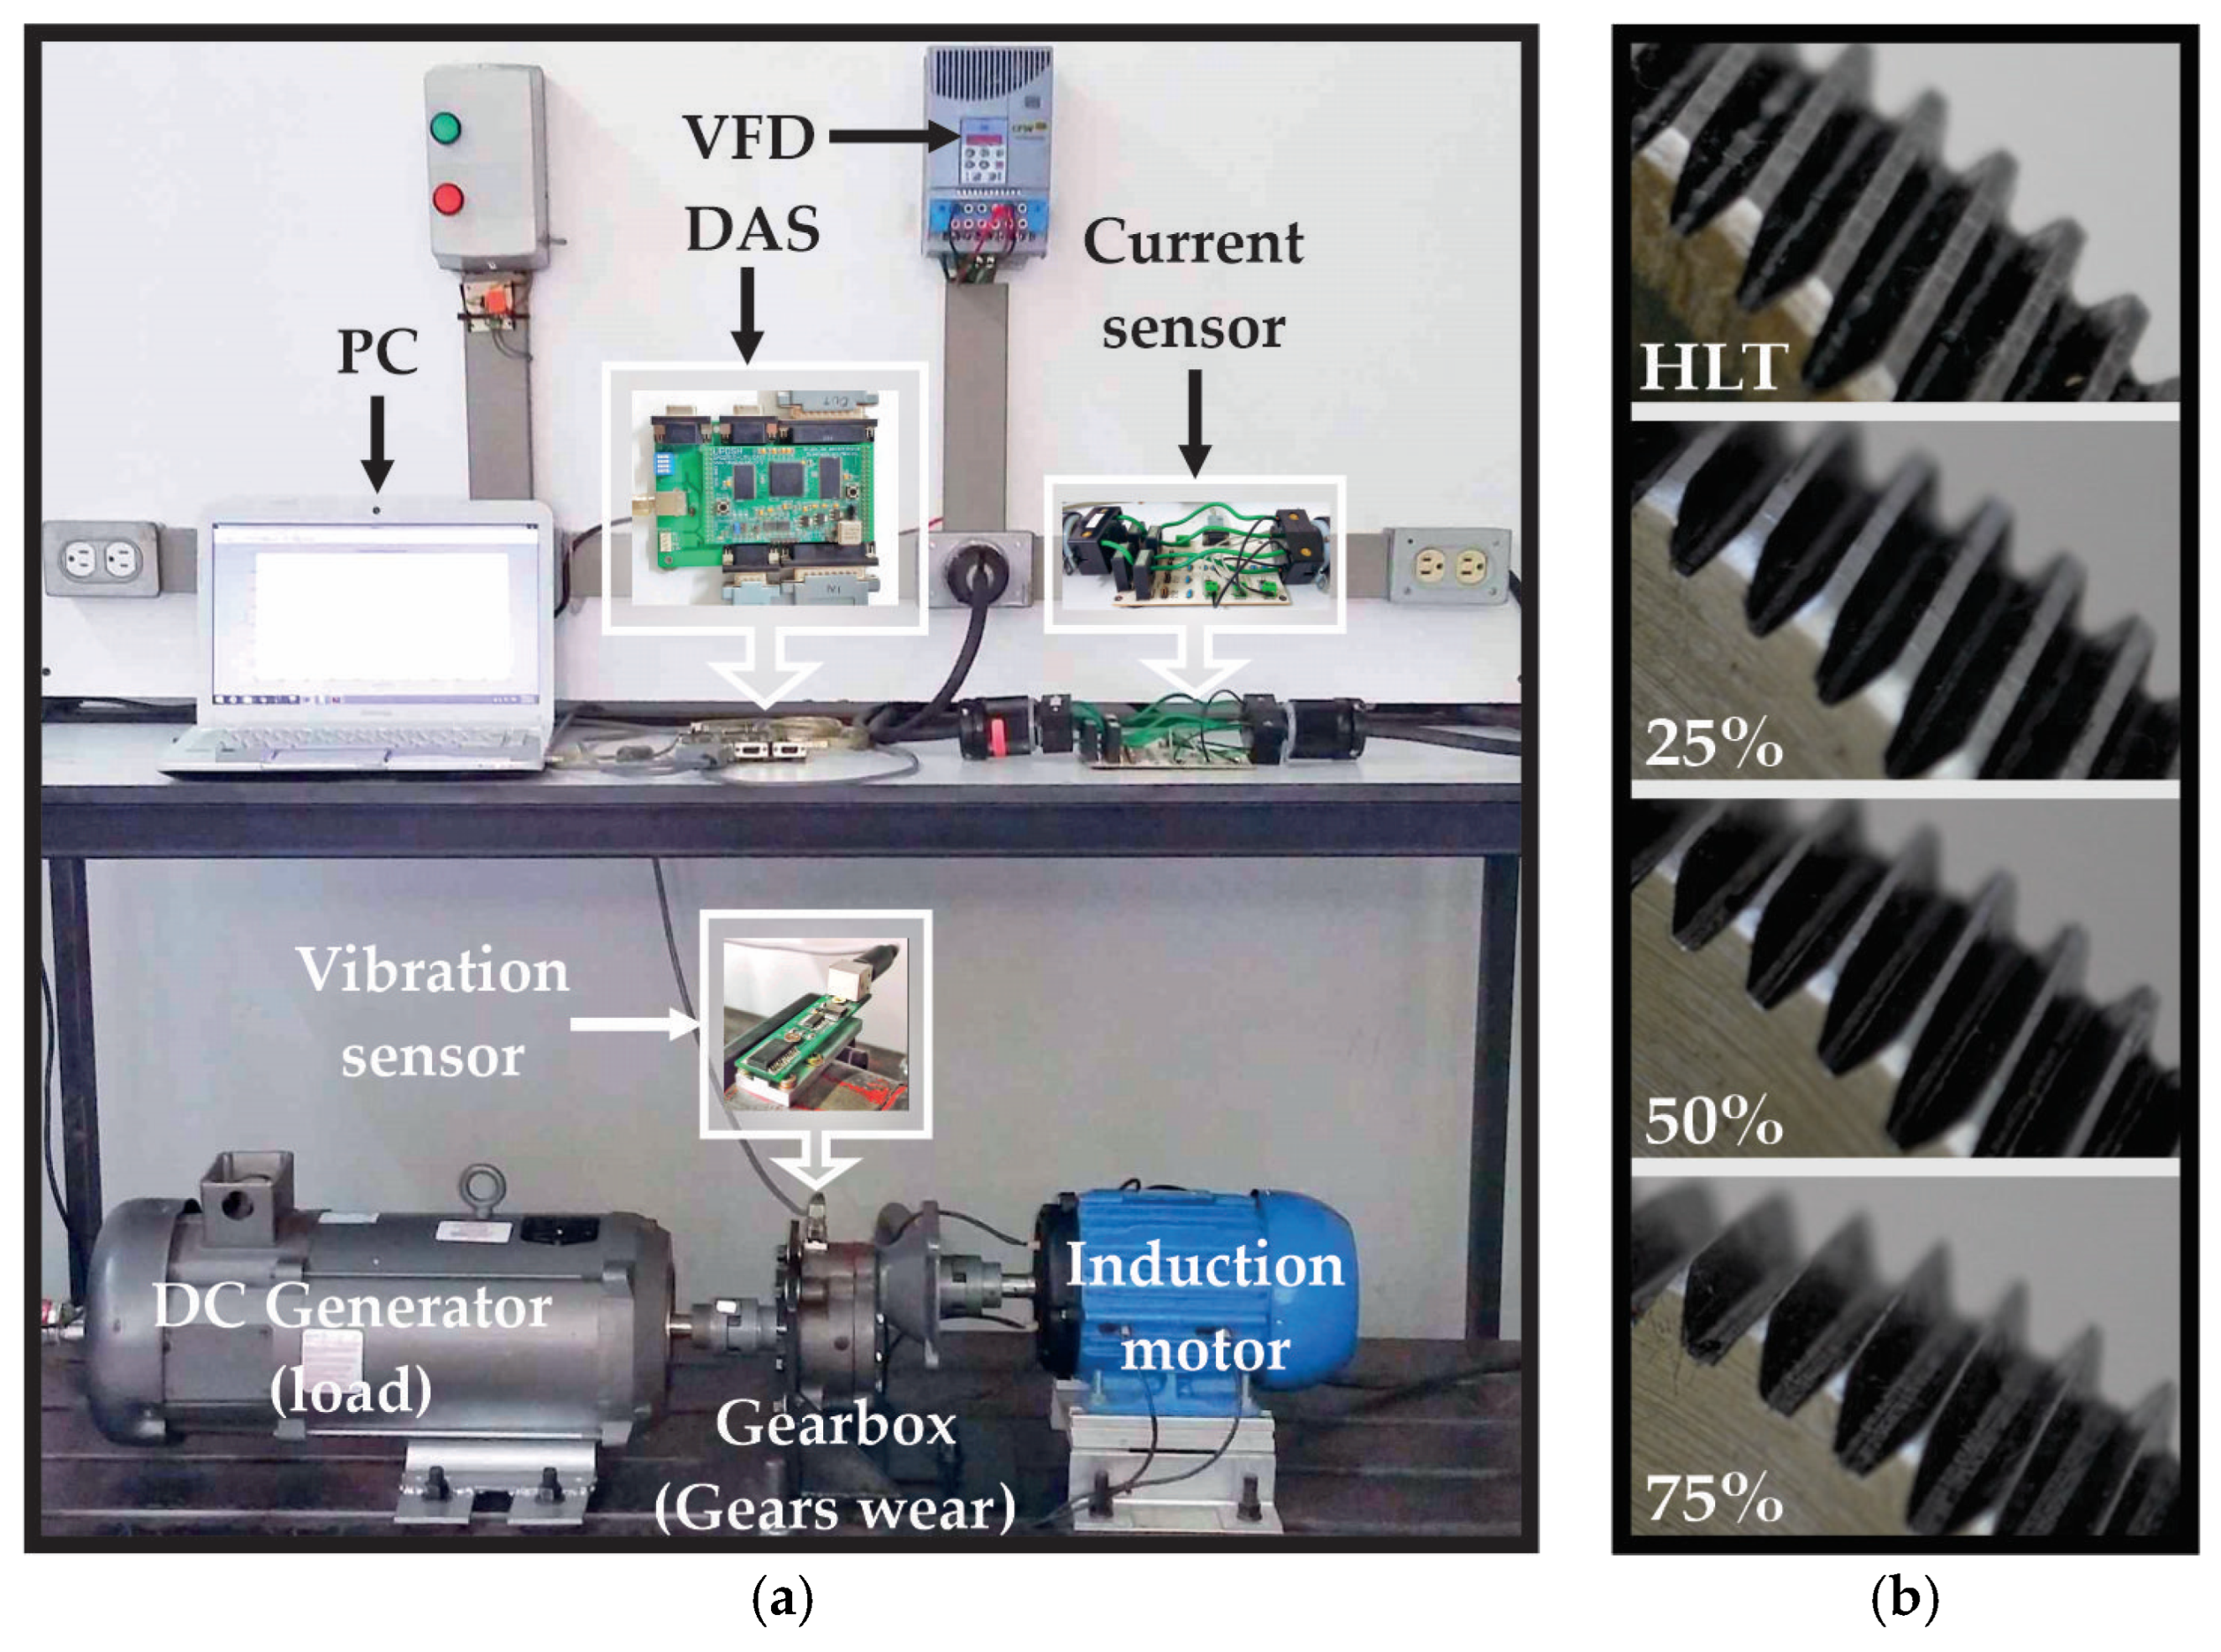
2.1. Gearbox and Gear Wear

According to [34], most industrial applications such as manufacturing, mining, aircraft, navigation, vehicles, wind turbines, oil and gas, and power energy, among others, require power transmission, and to accomplish this goal, the gearbox is the essential module. Basically, the gearboxes, also called gear reducers, are ensembles of open gears, shafts, and bearings mounted into enclosed housings that protect their elements from external pollution and environmental conditions [35]. Here, it is also adequate to define the gears as discs or wheels, in the classical way, with teeth in their perimeter and the purpose of providing a positive drive by meshing the teeth between them [36]. The gears inside the gearbox keep a ratio between their diameters in order to generate a torque–speed relationship between the input and output shafts that allow the mechanical power to be transmitted.
There are several reasons that cause problems in the gearbox, but, specifically speaking, gear faults are, for instance, pitting, spalling, and wear, among others. In this sense, the standard ISO 10825 [29] presents a classification of general failure modes that occur on gears, which are permanent deformations, surface fatigue phenomena, fissures and cracks, tooth breakage, scuffing, and indications of surface disturbances. From these modes, indications of surface disturbances were adopted in this study due to cover faults such as sliding wear, corrosion, overheating, erosion, and electric erosion, Figure 1. However, of particular interest, the sliding wear will be analyzed because it is an unavoidable situation that occurs during the years of service of the gearbox. Additionally, in [34], a detailed explanation about how the gear wear occurs can be found, but in general, when the gears into the gearbox have contact due to the normal operation, surface sliding, and rolling between teeth that generate material removal leading to a mass loss, which is assumed as surface wear.
It is very important to highlight that gear wear has negative effects on the gearbox operation since it produces alterations in the geometry of the tooth, which, in turn, can cause a reduction in the contact area, modifying the force distribution. This means that when the geometry of the gear tooth changes, a transmission error occurs, affecting the meshing stiffness of the mechanical system and causing, as a final effect, an increment in noise and vibration levels [34]. Naturally, these effects can be used for the purposes of monitoring and diagnosing by means of data processing, which is well known as data-driven techniques, into a machine learning framework.

2.2. Statistical Features

The statistical indicators are reliable and essential tools extracted from data sets that highlight, in most cases, relevant and useful information about the data configuration, structure, profiles, and patterns that may not be directly visible by observing the data through tables or plots. Therefore, these indicators can be used as features obtained from acquired signals of the physical variables through sensors and data acquisition systems in the industrial process that help make decisions [38].
There are different types of statistical features that provide information about location and variability, for example, those that indicate central tendency (means, RMS, SRM, etc.), dispersion (standard deviation, variance, etc.), or, for instance, distribution anomalies such as skewness, Kurtosis, and high-order moments. Additionally, there are some statistical features related to the shape of waveforms (crest factor, latitude factor, etc.). In this sense, the statistical features adopted in this proposed work are 15 time-based, similar to those proposed in [33], and Appendix A show the equations for such features.
These features have demonstrated their usefulness in applications that tackle the problems of fault identification, monitoring, and diagnosis [39]. Additionally, these features were chosen because they are easy to implement, and the computational burden required is lower than other more complex features, such as those based on gradients and entropies, or that require space transformation of the data, such as the frequency domain. The features selected pretend to obtain information referring to location, ubication, geometry, form, and variability, which can give significant information about changes (events) with respect to the original conditions (normal).

2.3. Genetic Algorithms

Since the genetic algorithms (GA) were first systematically presented by Holland in [40], they have been used as a very powerful heuristic tool for searching and optimizing purposes. These algorithms are based on natural genetics and natural selection, considering three main stages: reproduction, crossover, and mutation. Additionally, the main characteristics, advantages, and disadvantages of the GA according to [41] are described below:
  • They are based on an iterative converging process (generations), taking initial values that evolve to the desired solution.
  • They are population-based, considering each member of the population (individual) as a potential possible solution that converges to the desired solution.
  • Strongly depends on an objective function that returns a value associated with the individual performance (fitness); in fact, this function is the key to adapting the GA to a specific problem.
  • The variables for searching or optimizing are known as design variables since they integrate an individual, meaning that multiple optimizations can be run.
The different advantages of the GA are the possibility of being applied to problems with discrete or continuous variables, non-linearities, discontinuities, nonconvexity, wide and short searching spaces, multi-objective, and high complexity, among others. Additionally, the GA is a simple concept but with robustness, is easy to understand, and does not require gradient-based computation, which makes them easy to implement in comparison with other heuristic techniques. All these advantages are the reasons they are adopted in this work. However, it is worth mentioning some disadvantages such as stagnation, local optimal instead global optimal solutions, and they can require long periods for the computational process.
Despite this, GA has been adapted to a wide variety of applications in engineering problems demonstrating their effectiveness [42,43]. The next lines and the flow diagram of Figure 2 present the general steps for the implementation of the GA that is considered in this work.
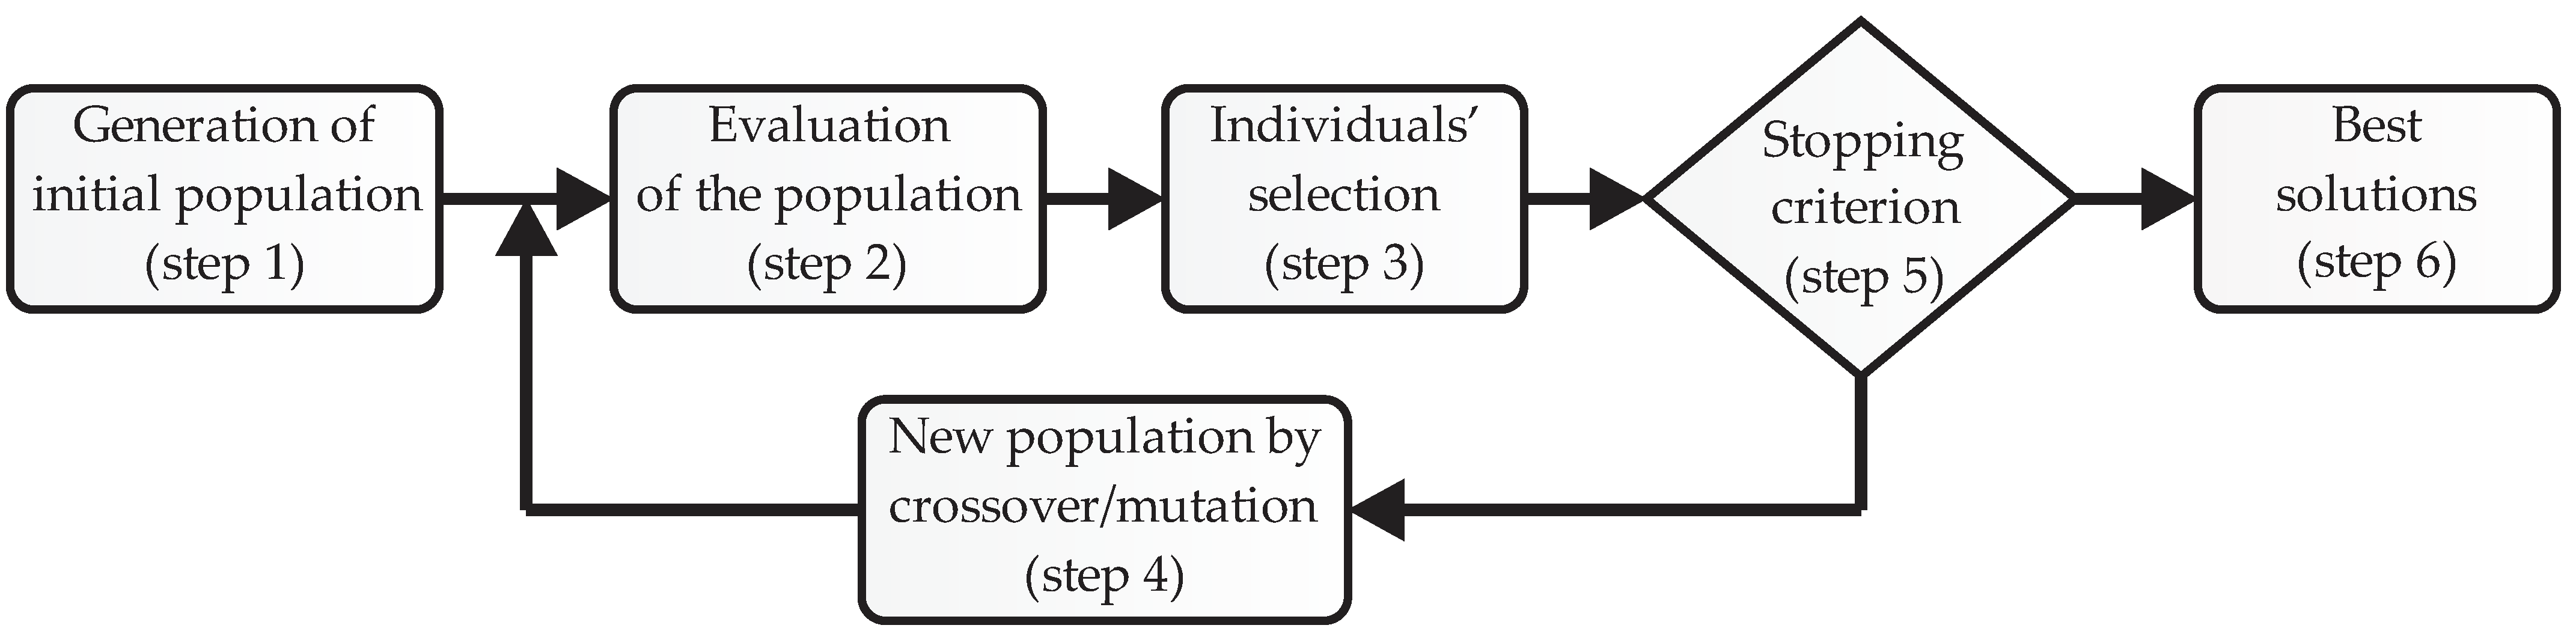
  • Step 1: Generate a random initial population and set the initial algorithm parameters.
  • Step 2: Evaluate the population performance, which means evaluating the fitness of each member by using the objective function.
  • Step 3: Perform individuals’ selection according to their fitness.
  • Step 4: Generate a new population, that will substitute the initial population, by means of the genetic operators: crossover and mutation.
  • Step 5: Evaluate the stopping criterion (maximum number of generations), if satisfied, then go to Step 6, if not, go to Step 2.
  • Step 6: Return the best solutions found.

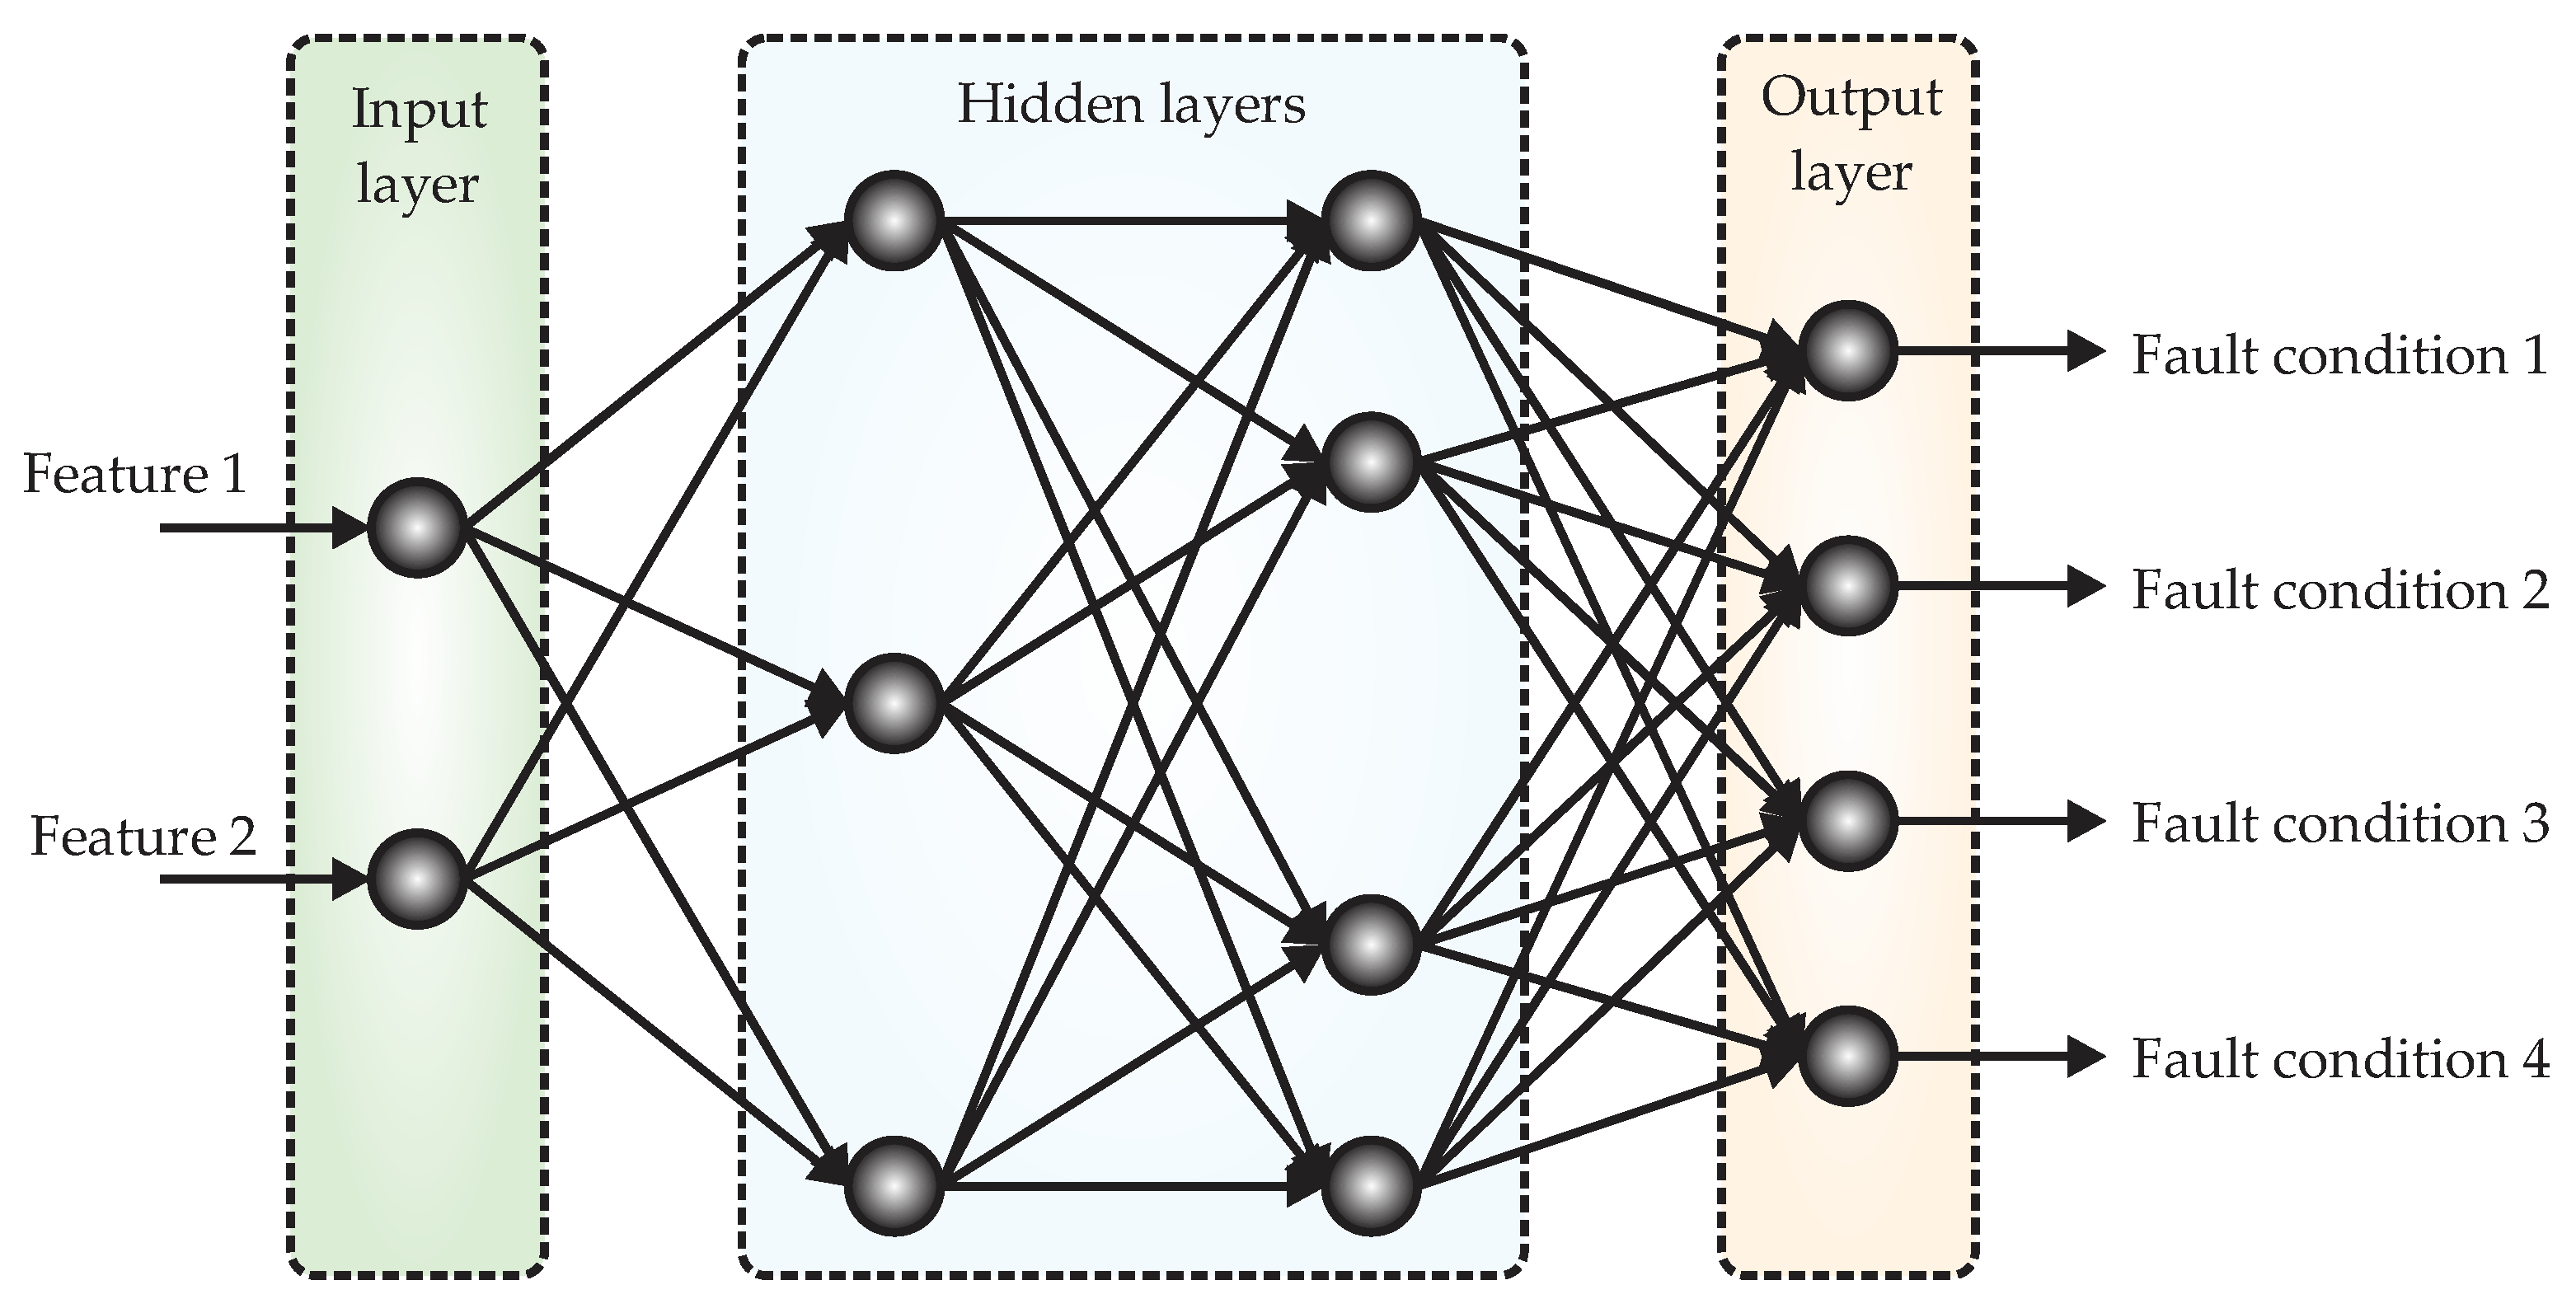
2.4. Linear Discriminant Analysis and Artificial Neural Networks
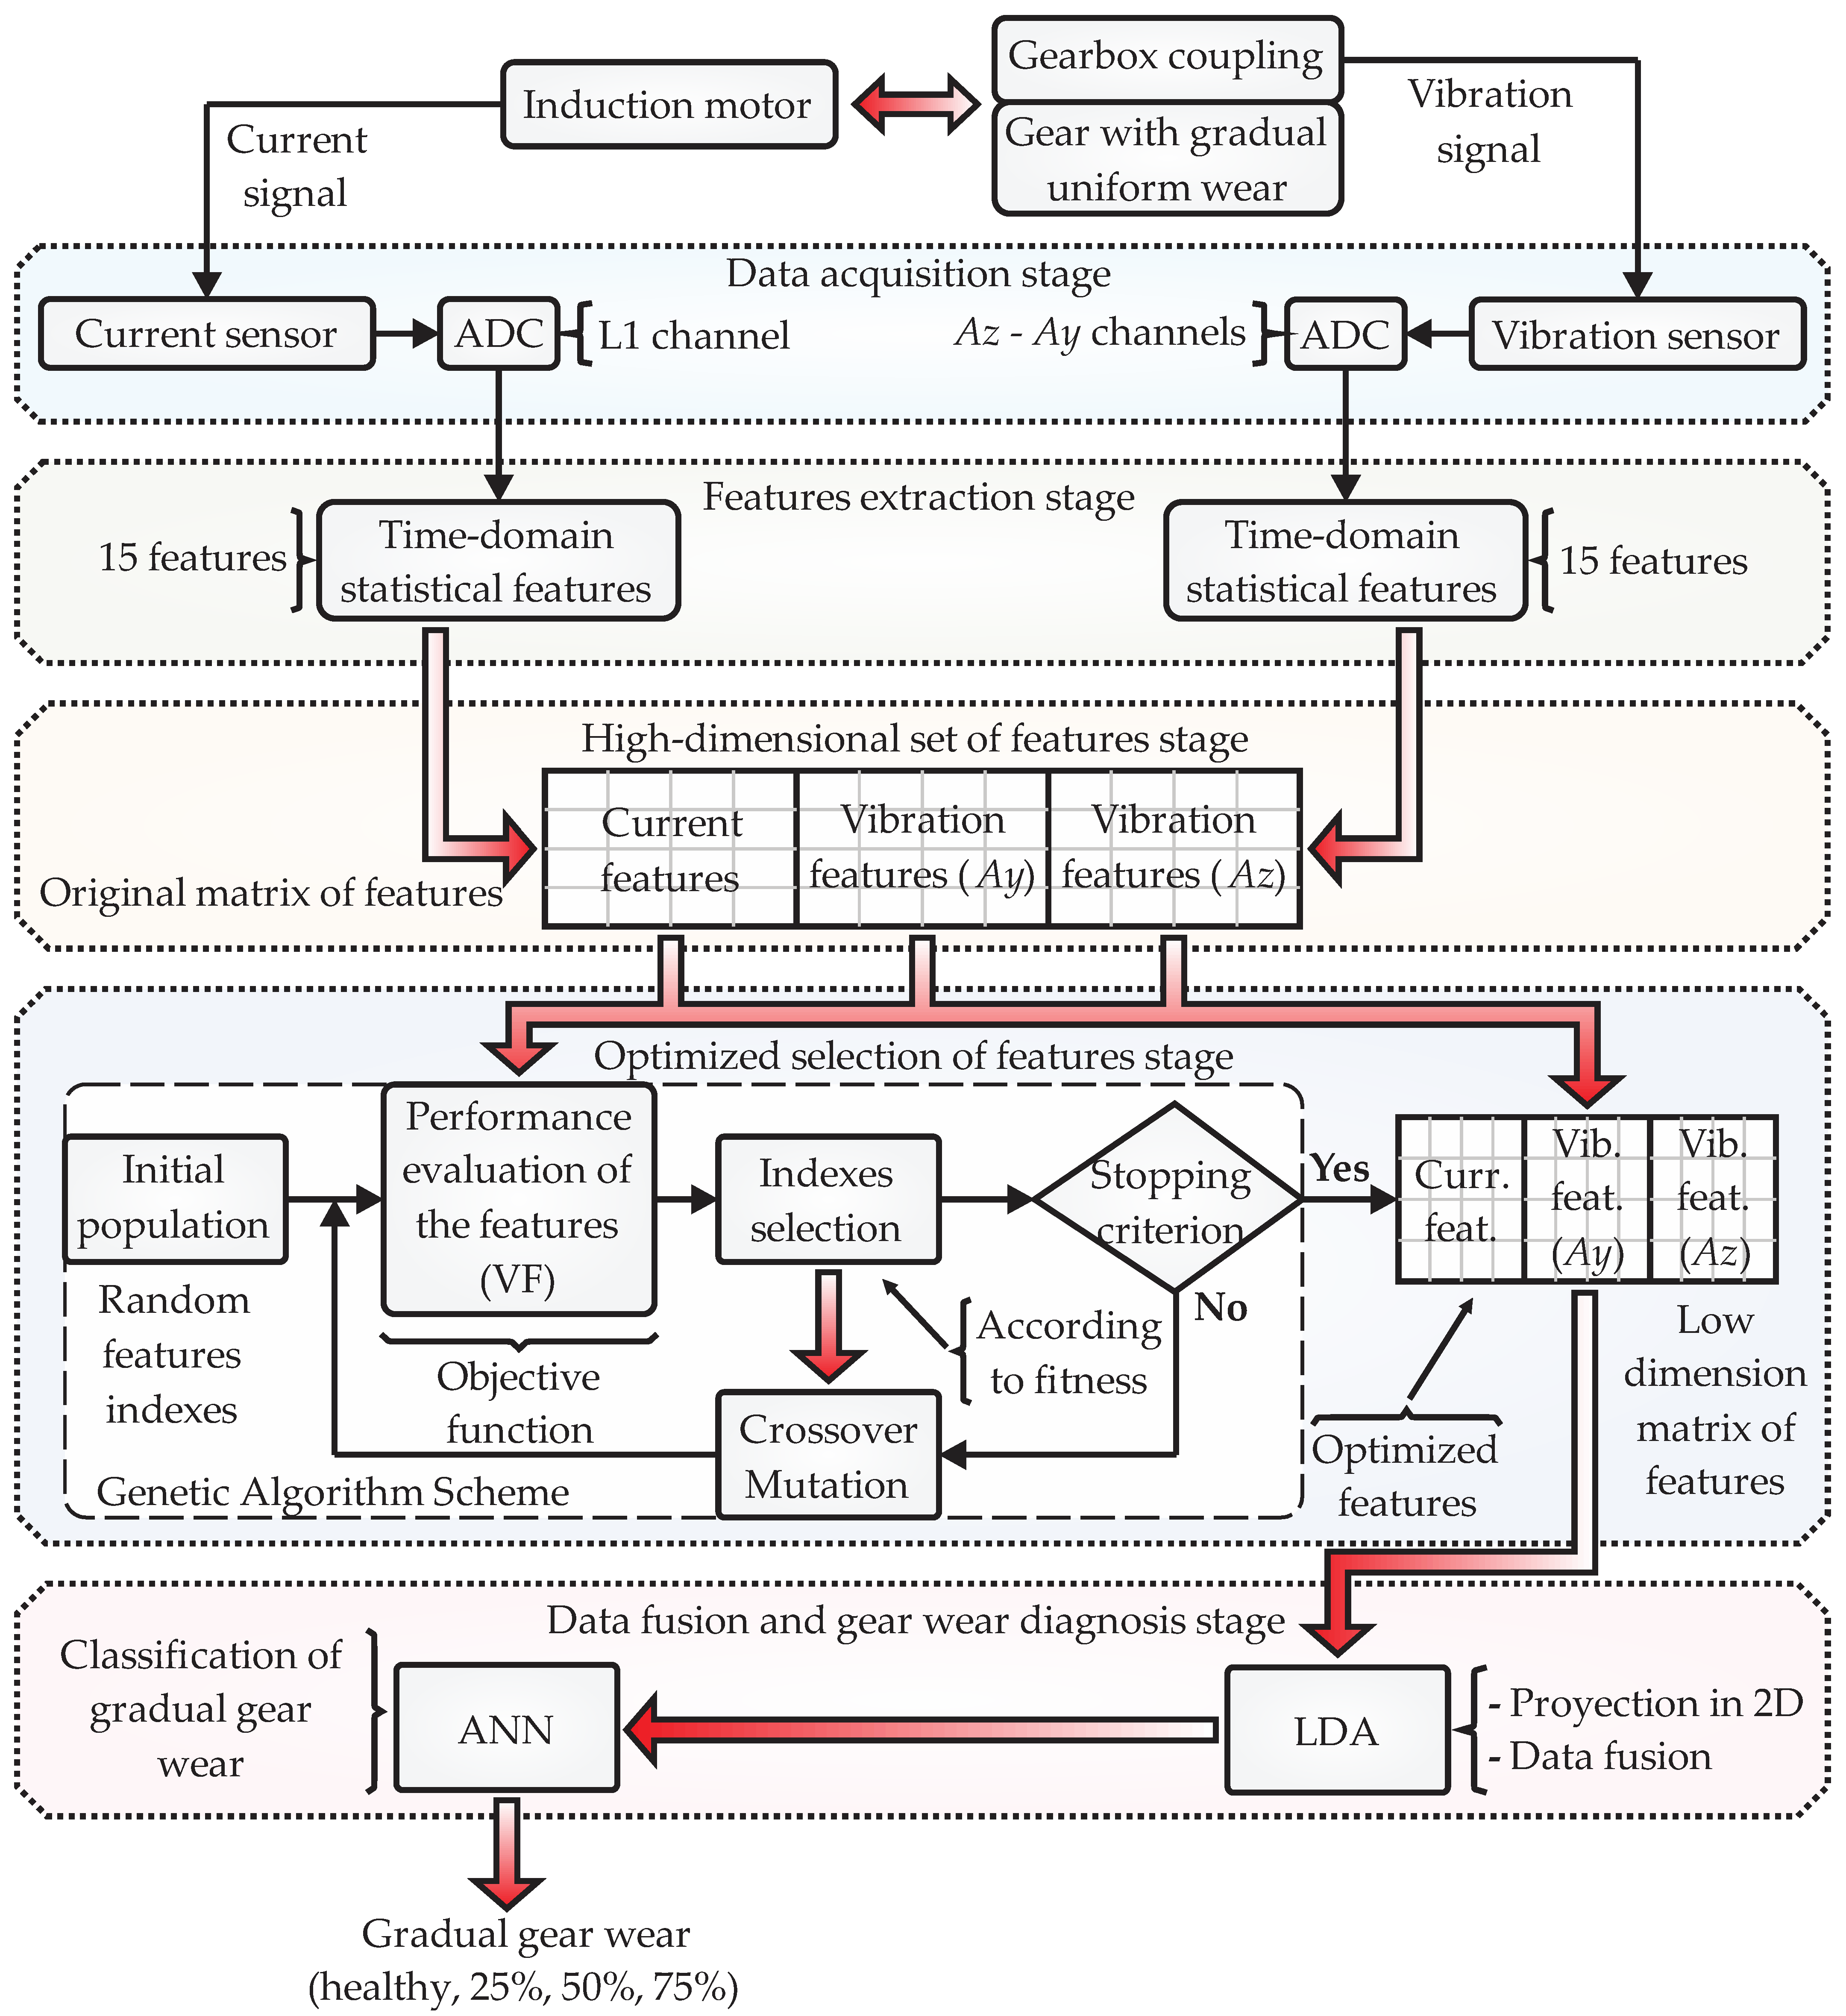
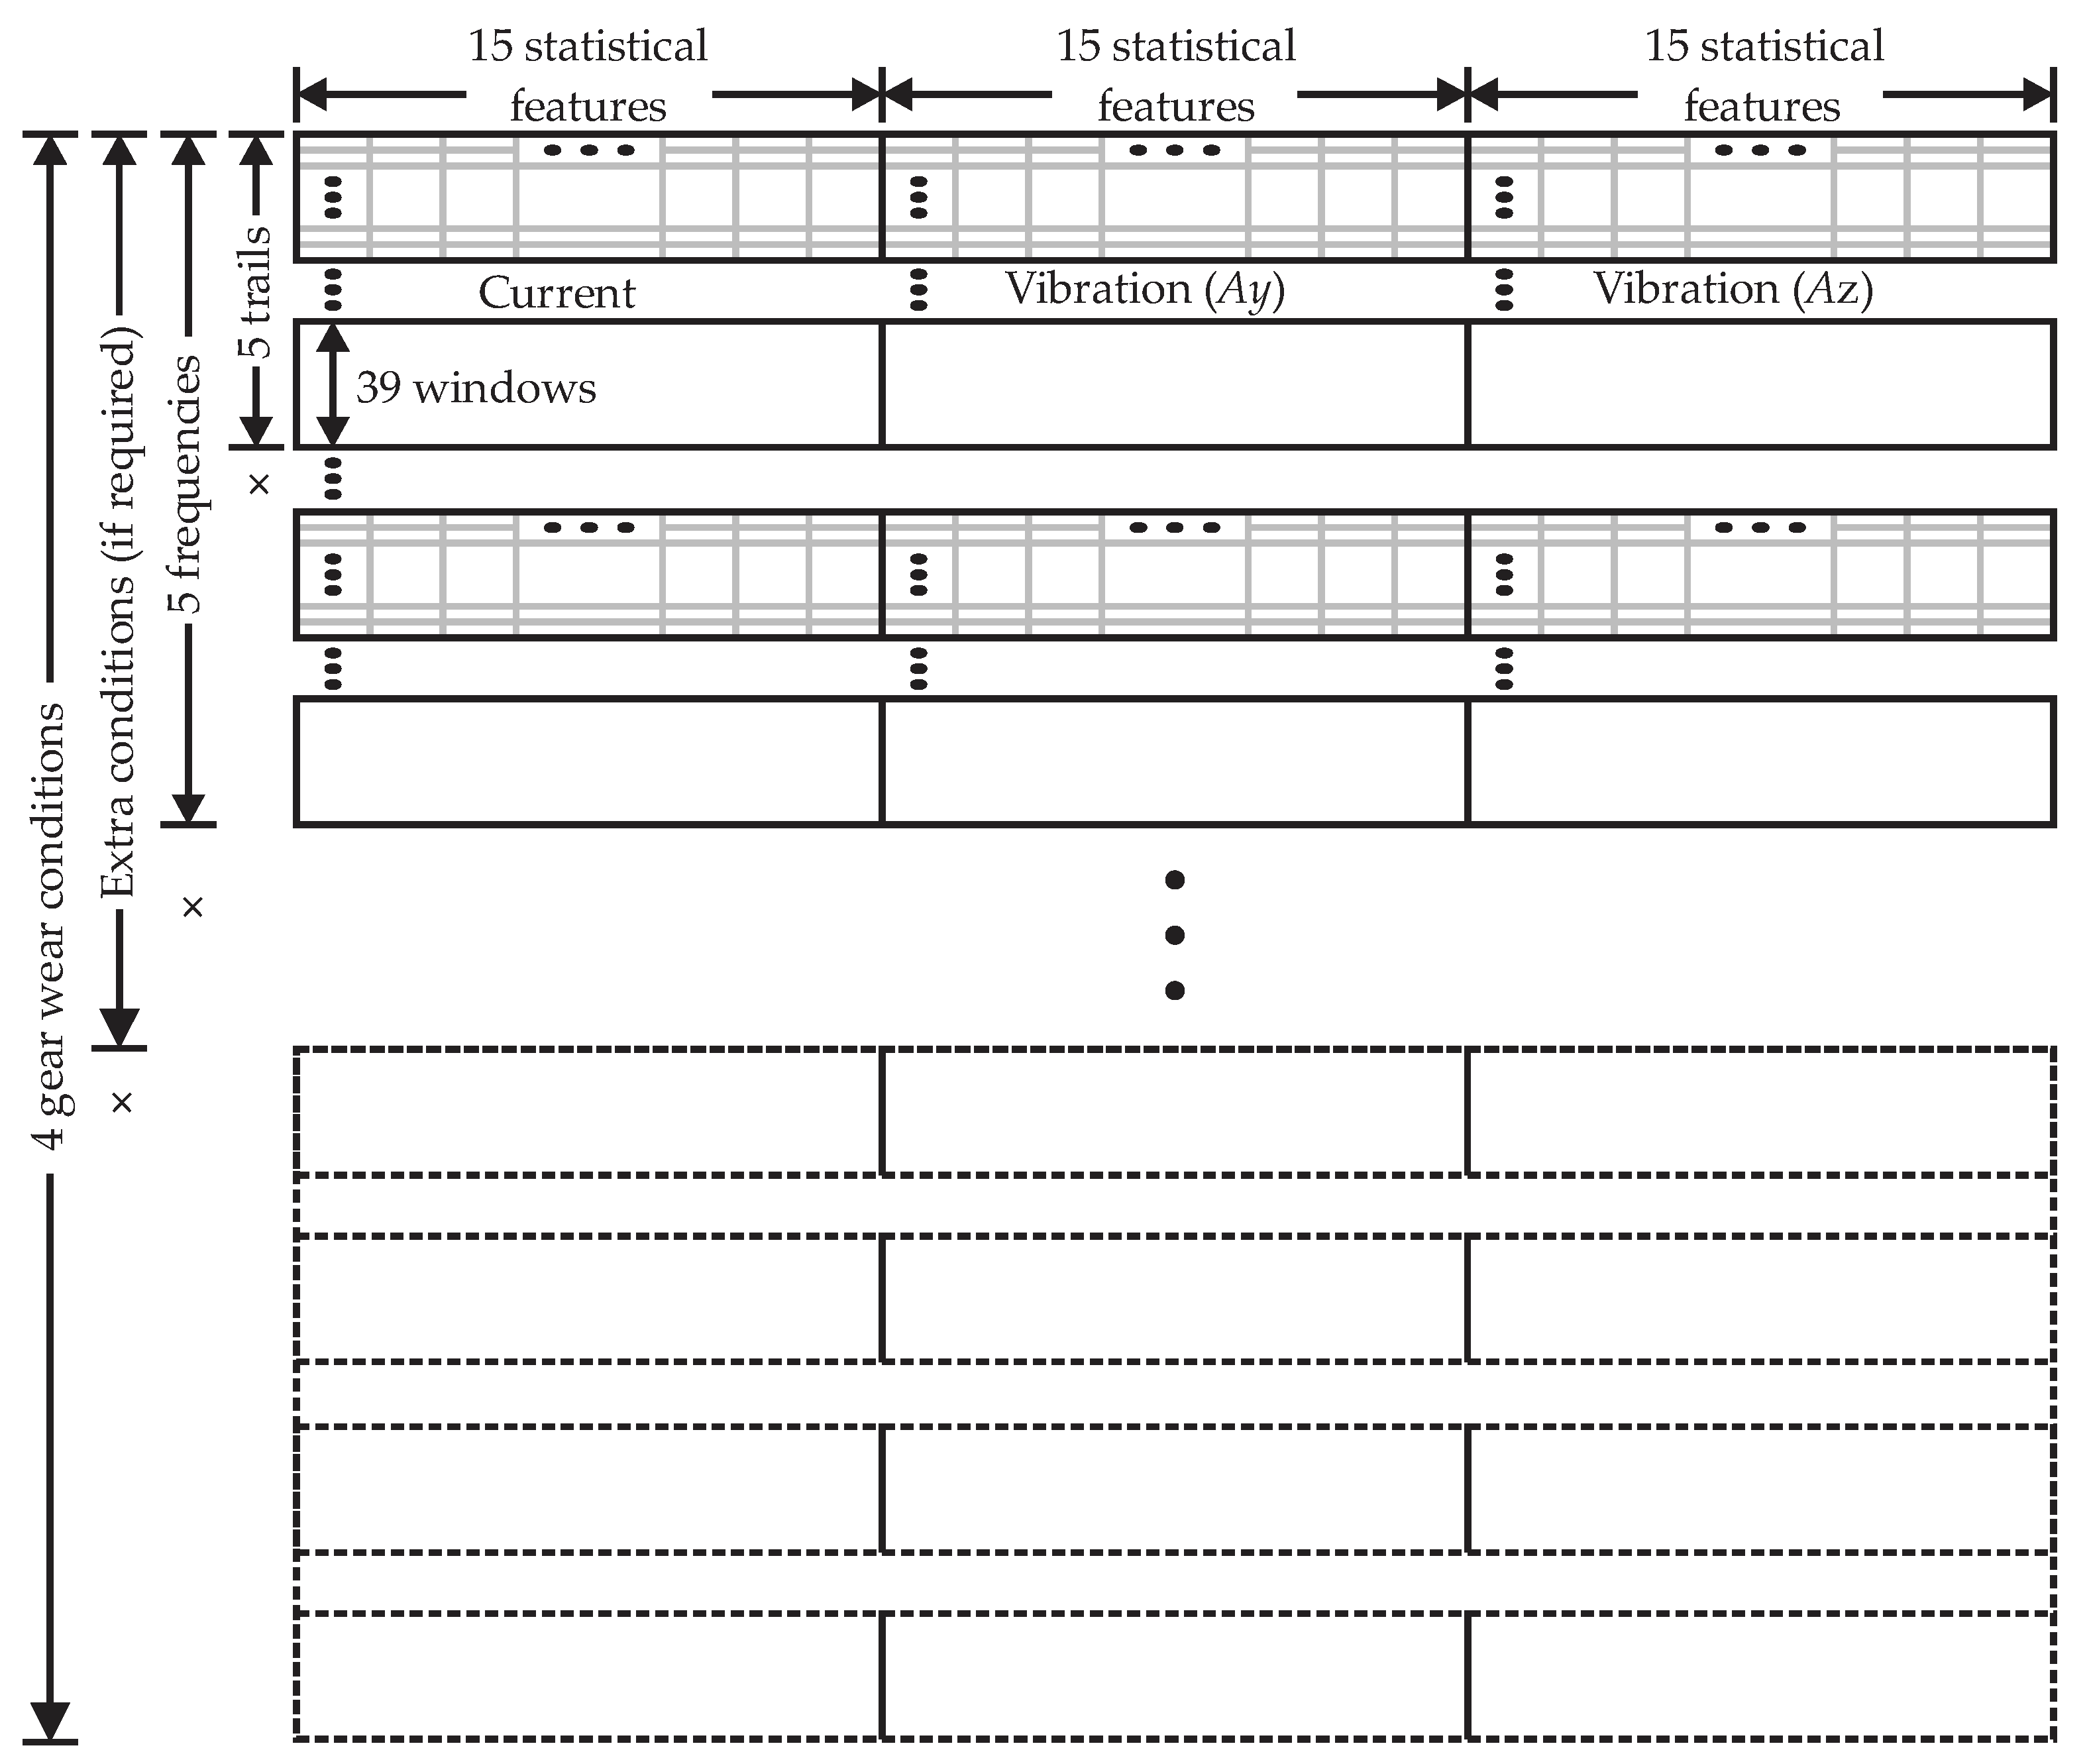
According to [44], linear discriminant analysis (LDA) is a machine learning supervised technique normally used for the extraction of significant features and dimensionality reduction in data-driven multiclass problems. This technique generates a representation or projection in two dimensions, or three dimensions, as grouped data points (clusters) by taking advantage of the most discriminant linear information between a set of features of a high-dimensionality space. The representation is conducted because LDA looks to maximize, as much as possible, the linear separation of the classes that are differentiated. Thus, for the application of the LDA, two measures must be computed: (a) Within-class scatter matrix, observed in (1), and (b) Between-class scatter matrix, observed in (2):
s w = j = 1 c i = 1 N j ( y i j μ j ) ( y i j μ j ) T
s b = j = 1 c ( μ j μ ) ( μ j μ ) T
where y is de data vector of a class; y i j is the i t h sample of the class j ; μ j is the mean of the class j ; N j is the number of samples in the class j ; and μ is the mean of all the classes.
This technique was adopted in this approach because it has demonstrated its full potential in fault diagnosis applications [33] with the advantages of providing a low-dimensionality projection of the classes found. However, also, when two or more physical variables are considered in the analysis, the LDA is a key tool for performing data fusion because the reduced features contain mixed information from such variables. Additionally, the purpose of LDA is to facilitate the task of the fault classifier. Regarding the classification topic, this work proposed a simple structure of an artificial neural network (ANN) whose structure consists of an input layer, a hidden layer, and an output layer, as observed in the diagram of Figure 3.
A simple structure of an ANN was selected in this work which aimed to reduce the computational burden through easy implementation and considering that the input to this ANN is through the features optimized by the GA and reduced by the LDA, ensuring easy learning of the fault conditions evaluated.

3. Methodology

In the next paragraphs, a detailed description of the methodology for detecting graduality in gear wear based on statistical features, GA-based features optimization, and data fusion considering current and vibration signals is presented. Figure 4 shows a general block diagram of this proposed methodology addressing five main stages: (i) data acquisition, (ii) features extraction, (iii) high-dimensional set of features, (iv) optimized selection process, and (v) data fusion and gear wear diagnosis.
The first stage of the methodology starts with the data acquisition of the signals from the physical system, and an induction motor with a load coupling based on a gearbox containing a gear with gradual uniform wear is considered for this study. Then, the stator current of the motor is measured through a current clamp for one line since the three lines of the motor are assumed equal. Additionally, the vibrations are measured by means of an accelerometer placed in the gearbox housing, and only the axes Az and Ay are considered because they show the best behavior during the experimental tests. Both current and vibrations signals are acquired at the same time through an ADC of a proprietary monitoring system, and the data are stored and sent to the PC for further processing. As an additional note, this stage could consider for future analysis the use of additional sensors in other parts of the electromechanical system that would provide useful information related to other problems. For now, the scope of this work focuses on the wear of gear teeth in the gearbox through current and vibration signals.
In the second stage of the proposed approach, feature extraction was carried out, but first, data preparation and conditioning were performed. In this sense, the raw data were processed in the vector format for each channel measured (current channel, Ay, and Az vibration channels) considering only the steady state, whereby the transient state was removed from the input data. Next, with the purpose of having as many features as possible for each signal, the data vectors were divided into overlapped time windows, and for each window, the 15 time-domain statistical features, such as those of Equations (A1) to (A15) from Table A1, were computed. Therefore, the features extraction yields a large set of values that need to be arranged because the signals are considered for each channel (1 of current and 2 of vibration), per fault condition (healthy and 3 gradual conditions), per operating frequency (5 frequencies), per the number of trials (5 tests). Here, it can be clarified that in the case of extra operating conditions during the experimental tests, their acquired data must be considered for computing the corresponding statistical features. Similarly, and in complement with the supposition of using additional sensors, their respective features must be also computed.
In the third stage of the approach, the features extracted are arranged into a matrix of features of high dimensionality. The features of this matrix have information about the original data distribution, including structure, profiles, patterns, tendency, geometry, asymmetry, anomalies, etc. With this information, it is possible, theoretically, to apply data-driven techniques for fault conditions identification and classification. Nevertheless, despite the power of data processing algorithms, if inadequate feature discrimination is made, then it can cause stagnation problems, overfitting, or unreachable convergence. Additionally, the dimensions of the matrix of features are high, but as many operating conditions and different types of sensors are included as the highest, these dimensions will be.
In the fourth stage of the methodology, a GA-based scheme for optimizing the selection of features is integrated into the data-driven process flow as follows. According to the steps of the previous section for applying the GA, the scheme begins by generating a random initial population. It must be remarked that the individuals of the population are binary strings, where each bit, according to its string position, is an index that represents one of the 15 statistical features, and the string length considers the indexes for all the channels (current channel, Ay, and Az vibration channels). Therefore, the individuals that form the initial population represent, in fact, a combination of statistical features, taking, as a minimum, the combination of at least two features. Posteriorly, the individuals’ performance is evaluated by taking from the matrix of high dimensionality combinations of features that are indicated by the indexes and computing their variance, which is to say, the variance of the features (VF). The VF is then considered as the fitness value for each individual and is used for performing an elitist selection by keeping those individuals with the highest value since this indicates that the features have high dispersion and can be separated in fault conditions. The new generation of the population is defined considering the individuals with the best performance (fitness) through the genetic operators that, through crossover and mutations, generate new indexes; this way, the algorithm convergence is guaranteed. Now, for this scheme, the stopping criterion for the iterative process is through a maximum number of iterations (generations). If the maximum number of generations is not reached yet, then the new population generation is evaluated, else the scheme returns the individual (index combination) with the highest fitness found. Last but not least, the best individual found is used for taking the corresponding features from the matrix of high dimensionality to conform a new matrix with low dimensionality, which from now will be known as the matrix of optimized features. In the case of using extra sensors, the string length must consider the number of features per sensor channel, but the structure is kept equal.
Finally, in the last stage of the methodology, the optimized features of the current and vibration are fused and once again reduced through the LDA technique aiming to boost the faults diagnosis as much as possible. The data fusion is achieved because the LDA technique takes from the matrix of optimized features those that better differentiate the classes detected to conform the points of the clusters no matter if the features are from the current or vibration. The LDA projection in 2 dimensions, feature 1 versus feature 2, is very helpful to visualize graphically the fault conditions, and it could be considered as a pre-classification stage. Additionally, the output of the LDA generates adequate inputs for the classifier facilitating its task and reducing its structure complexity since only two inputs (vectors of feature 1 and feature 2) are considered. Considering the aforementioned, the classifier is an ANN with a simple structure: one input layer with 2 neurons, a 2-stage hidden layer with 3 and 10 neurons, respectively, and an output layer with 4 neurons (one per condition). The output of the classifier are the conditions detected: the healthy state and gradual gear wear (25%, 50%, and 75% wear). It is worth mentioning that, in the case, that other types of fault conditions were included in the analysis, then this last stage remains almost equal, and only the ANN structure must add as many output neurons as the fault conditions analyzed.

4. Results and Discussion

4.1. Experimental Setup

The experimental test bench for performing the trials was constituted by a simple electromechanical system of an induction motor with a coupling based on a gearbox to the load, Figure 5a. The induction machine consists of a three-phase electric motor model WEG00236ET3E145T-W22 and consumes a rated power of 1492 W. Meanwhile, the motor coupling to the load is made through a gearbox model Baldor GCF4X01AA with a reduction ratio of 4:1, driving the motor shaft. For the final electromechanical load, a DC generator model Baldor CDP3604 is used, entailing approximately 20% of the motor load. With the aim of testing the system under different operating conditions, the motor was driven through a variable-frequency drive (VFD) model WEGCFW08, feeding the induction motor at the frequencies 5 Hz, 15 Hz, 50 Hz, 60 Hz, and an additional test was carried out at 60 Hz with a soft starter. By its part, the current signal is measured through a hall effect sensor model Taruma Corporation L08P050D15, and the vibration signals are measured by means of a triaxial accelerometer model LIS3L02AS4 mounted in a board that incorporates signal conditioning and antialiasing filtering stages. The data acquisition system (DAS) consists of a low-cost proprietary board based on a field programable gate array (FPGA) integrating an analog to digital converter (ADC) of a 14-bit resolution acquiring the signals from the sensors at sampling frequencies of 4 kHz and 3 kHz, for the current and vibration, respectively. The acquisition time of each trial is 30 s, but only the steady state is considered for the study, whereby the first 10 s of the trials are removed from data, and the final number of samples is 80 kS and 60 kS, for the current and vibration, respectively. A total of five trials were executed per operating frequency, five frequencies were considered (5 Hz, 15 Hz, 50 Hz, 60 Hz, and 60 Hz with soft starter), and these trials were carried out for four fault conditions The fault conditions entail the healthy gear (HLT) and gear wear at 25%, 50%, and 75%, as observed in Figure 5b. For its part, for data processing, the time windows have a 1 s length and consider an overlapping of 50%, which generates 39 exact windows.
The matrix of features of high dimensionality is structured as follows. The statistical features are arranged in column format; first appear the 15 features for the current next to them have placed the 15 features of vibration in the Ay axis, and next to them are placed the 15 features of vibration in the Az axis, yielding a total of 15 × 3 = 45 columns. In the row format, the samples are placed, which means the feature values of the four gear wear conditions, per five operating frequencies, per five trials, per 39-time windows, yielding a total of 4 × 5 × 5 × 39 = 3900 rows. It is worth mentioning that, with the aim of obtaining a generalized methodology, if extra operating conditions need to be considered, then the row dimensions of the matrix of features could be extended. To do this, the statistical features of the extra operating conditions are computed and arranged as extra rows in the matrix, but without forgetting that by every extra condition, the features of previous operating conditions must be computed in a permuted way, such as in Figure 6. Finally, the size of the matrix of high dimensionality for this work is 3900 rows × 45 columns, as observed in the figure, and this arrangement is important because the indexes that the GA proposes as combinations of features will be used for taking the features directly from this matrix, as observed in stages three and four of the methodology diagram of Figure 4.
As previously mentioned, the structure of the ANN considers two neurons for the input layer, three and ten neurons for the hidden layer, and four neurons for the output layer, and the activation functions are “tangent” and “linear” for the hidden and output layers, respectively. The backpropagation algorithm is used for feature learning. Due to the GA scheme for selecting features and the feature reduction through LDA, the complexity in the ANN structure is avoided. Finally, to validate the classifier, 70% of the values from the matrix of features were used for network training, and the remaining 30% was used for validation. In addition, these percentages were extracted by random selection with the aim of obtaining more precise and reliable results.

4.2. Case Study: Fault Diagnosis without Features Optimization

For comparison purposes, the results of applying the fault diagnosis for gears with graduality wear without feature optimization are presented and discussed next. Figure 7 plots what is obtained when all the features extracted from the signals (current, Ay vibration, and Az vibration) are processed directly through the LDA reduction technique.
As can be observed from the figure, the discriminant analysis tries to project in two dimensions the features from the matrix of high dimensionality as data points that form clusters. Nonetheless, the separation of the clusters is not achieved successfully, and in consequence, a hard overlapping is observed. The reason for the algorithm fail is because features exist in the matrix of high dimensionality that do not provide useful information, and even there are features that have similar information between them, which cause singularities for the analysis. Initially, the purpose of extracting too many features is of having as much information as possible about the data distribution in such a way that this information can be useful for fault diagnosis; notwithstanding, this situation demonstrates that adequate data-driven through feature optimization is necessary.

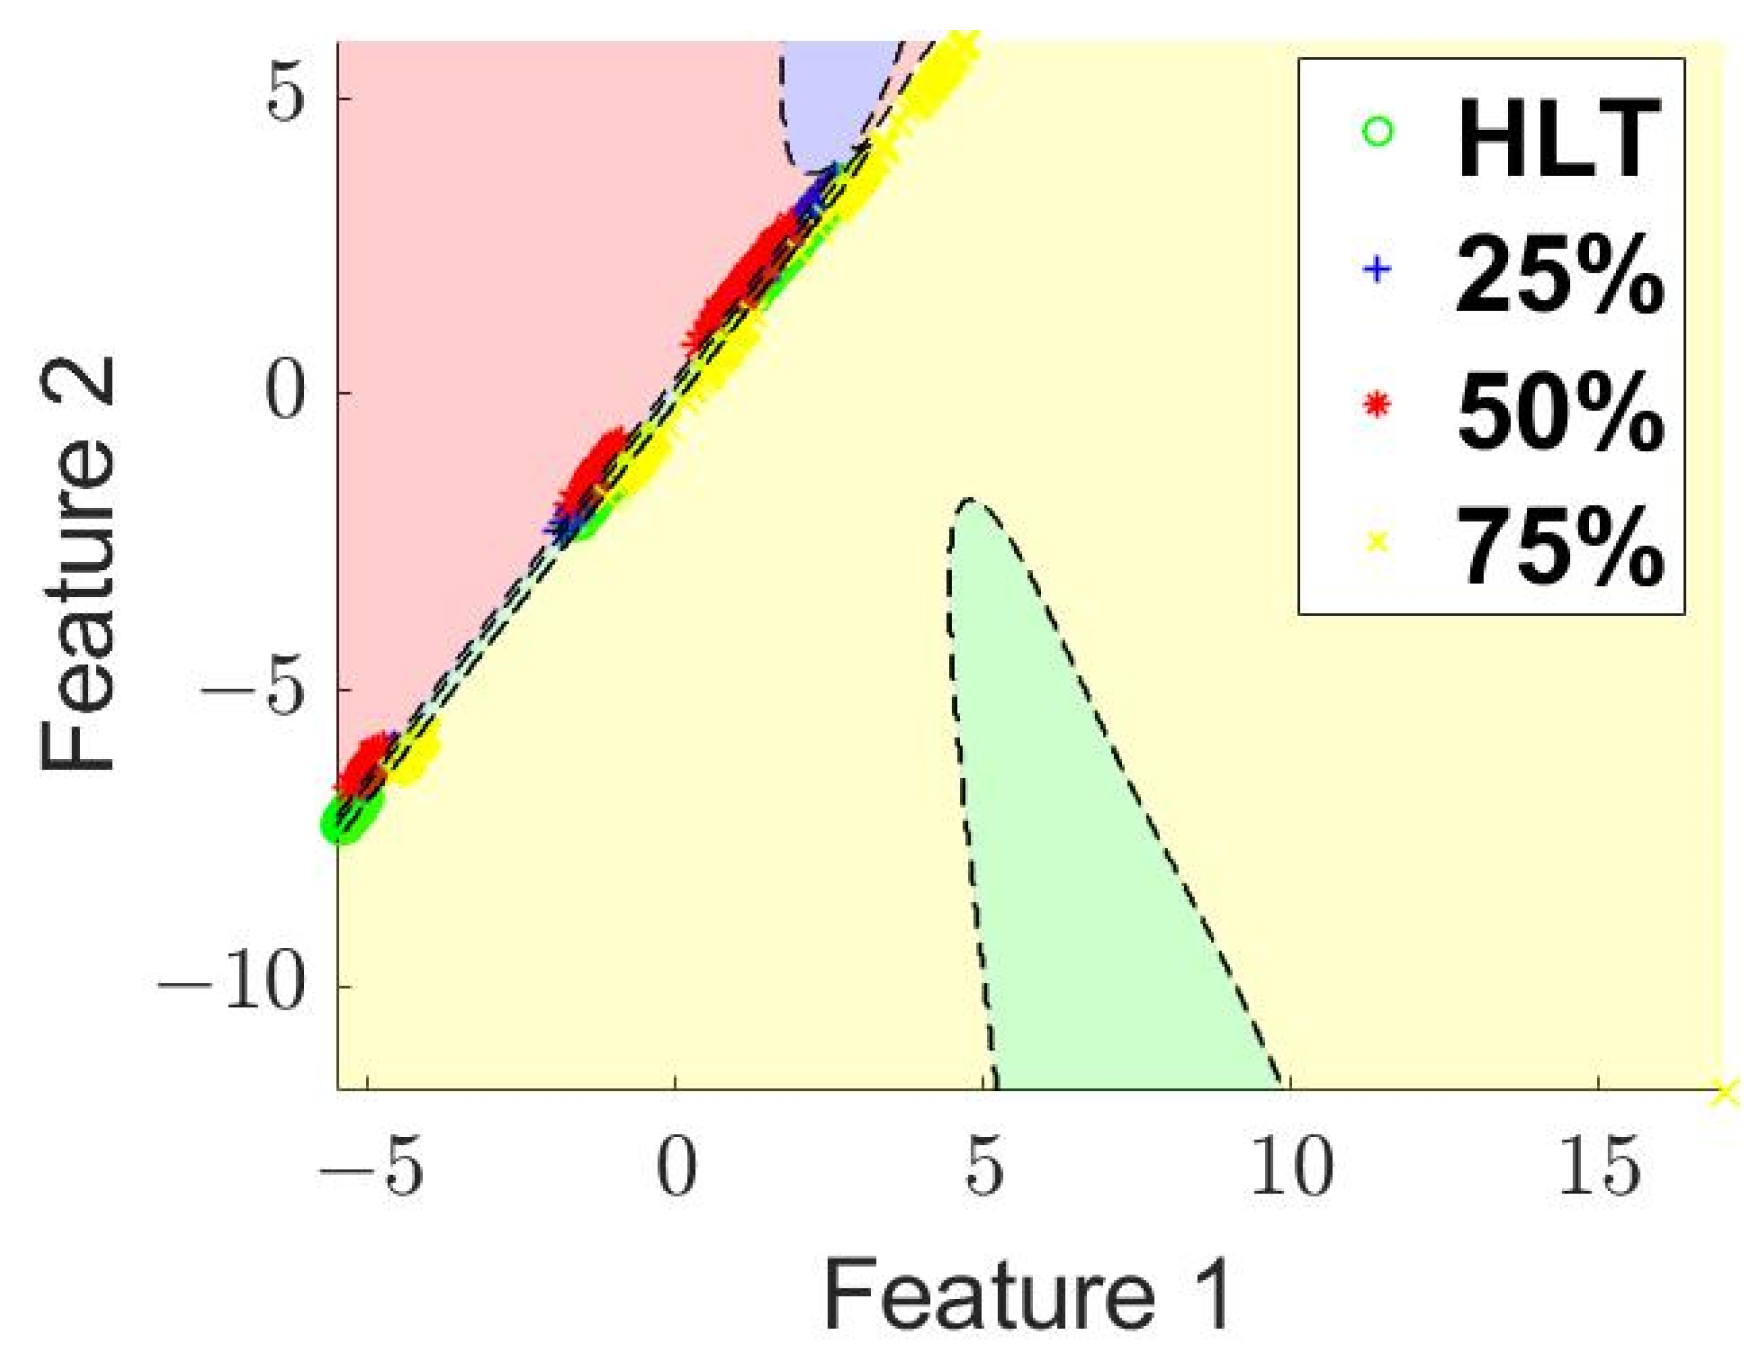
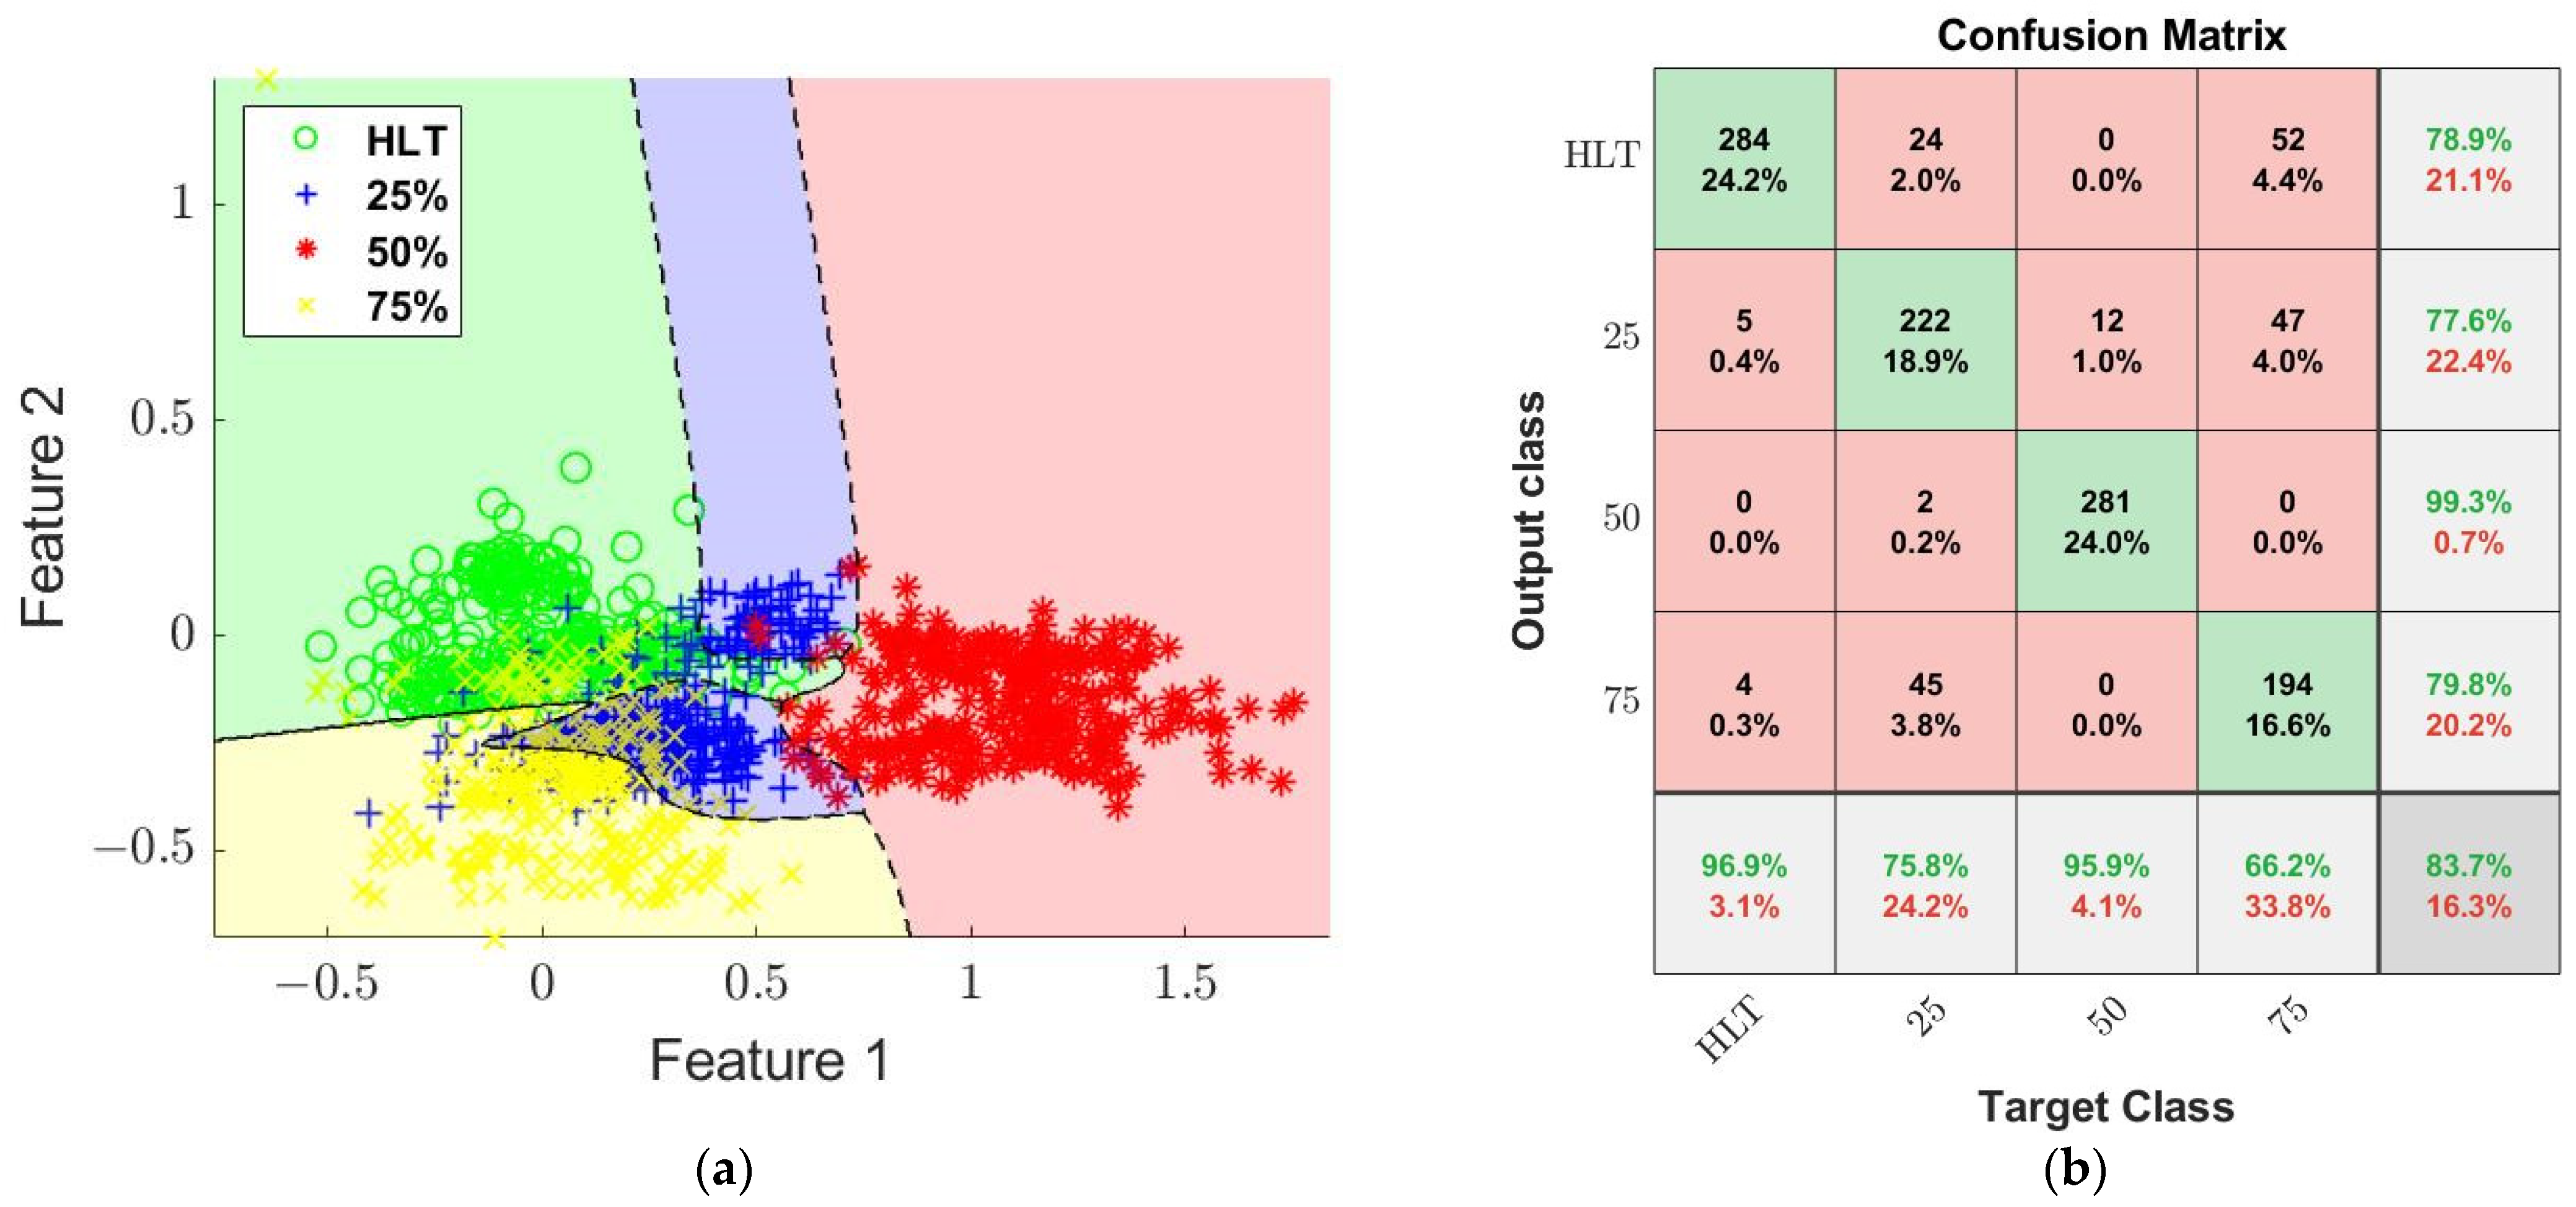
4.3. Case Study: Fault Diagnosis with Features Optimization withouth Data Fusion

Now, with the objective of demonstrating the importance of data fusion, this case study considers feature optimization by taking separately the analysis of current signals and vibration signals. Figure 8 displays the results of applying the feature optimization over current signals with LDA projection and ANN classification but without data fusion.
From the figure, the discussion can be addressed in two aspects. On one hand, the projection of the features into a two-dimensional representation through the LDA is observed in Figure 8a and clearly indicates how significant the improvement in the classes detected and cluster separation with respect to Figure 7 was. That means the four conditions can be appreciated; however, the overlapping between the clusters is still noticeable. The region for each condition is delimited, but the condition of the gear wear at 75% was divided into two regions. On the other hand, the performance of the optimization process of the features selection is validated through the confusion matrix of Figure 8b. This matrix indicates an overall performance achieved by the ANN in the classification of the healthy state and the three gradual gear wear conditions of 72.4%. The worst results happened when the diagnostic indicated that the conditions were healthy; 50% and 75% were considered as a condition of gear wear at 25%.
Respectively, Figure 9 similarly shows the results of applying the optimization process for features selection through GA with an LDA projection and the ANN classification, but in this case, for the vibration signals, specifically from the axes Ay and Az, means without data fusion.
Regarding the observed results from the figure, the following can be discussed. The LDA projection in 2D of the optimized features from vibration signals in Figure 9a shows a clear separation of the regions that delimit the four conditions analyzed and, likewise, the case of the current. However, in this case, the gear wear at 25% is divided into two zones, which is not correct, but also the clusters overlapping are still visible, and this situation is confirmed in the validation through the classification stage. Therefore, the corresponding performance of the optimized selection of features for vibration signals without data fusion is validated through the confusion matrix of Figure 9b. The confusion matrix shows how the ANN for this case achieves an overall performance of 83.7%, which is much better than even that using the current. Now, for this case, the worst results are appreciated from the matrix when the condition of gear wear at 25% is considered as a condition at 75%, but also the condition of gear wear at 75% is considered as conditions 25% and the healthy state.

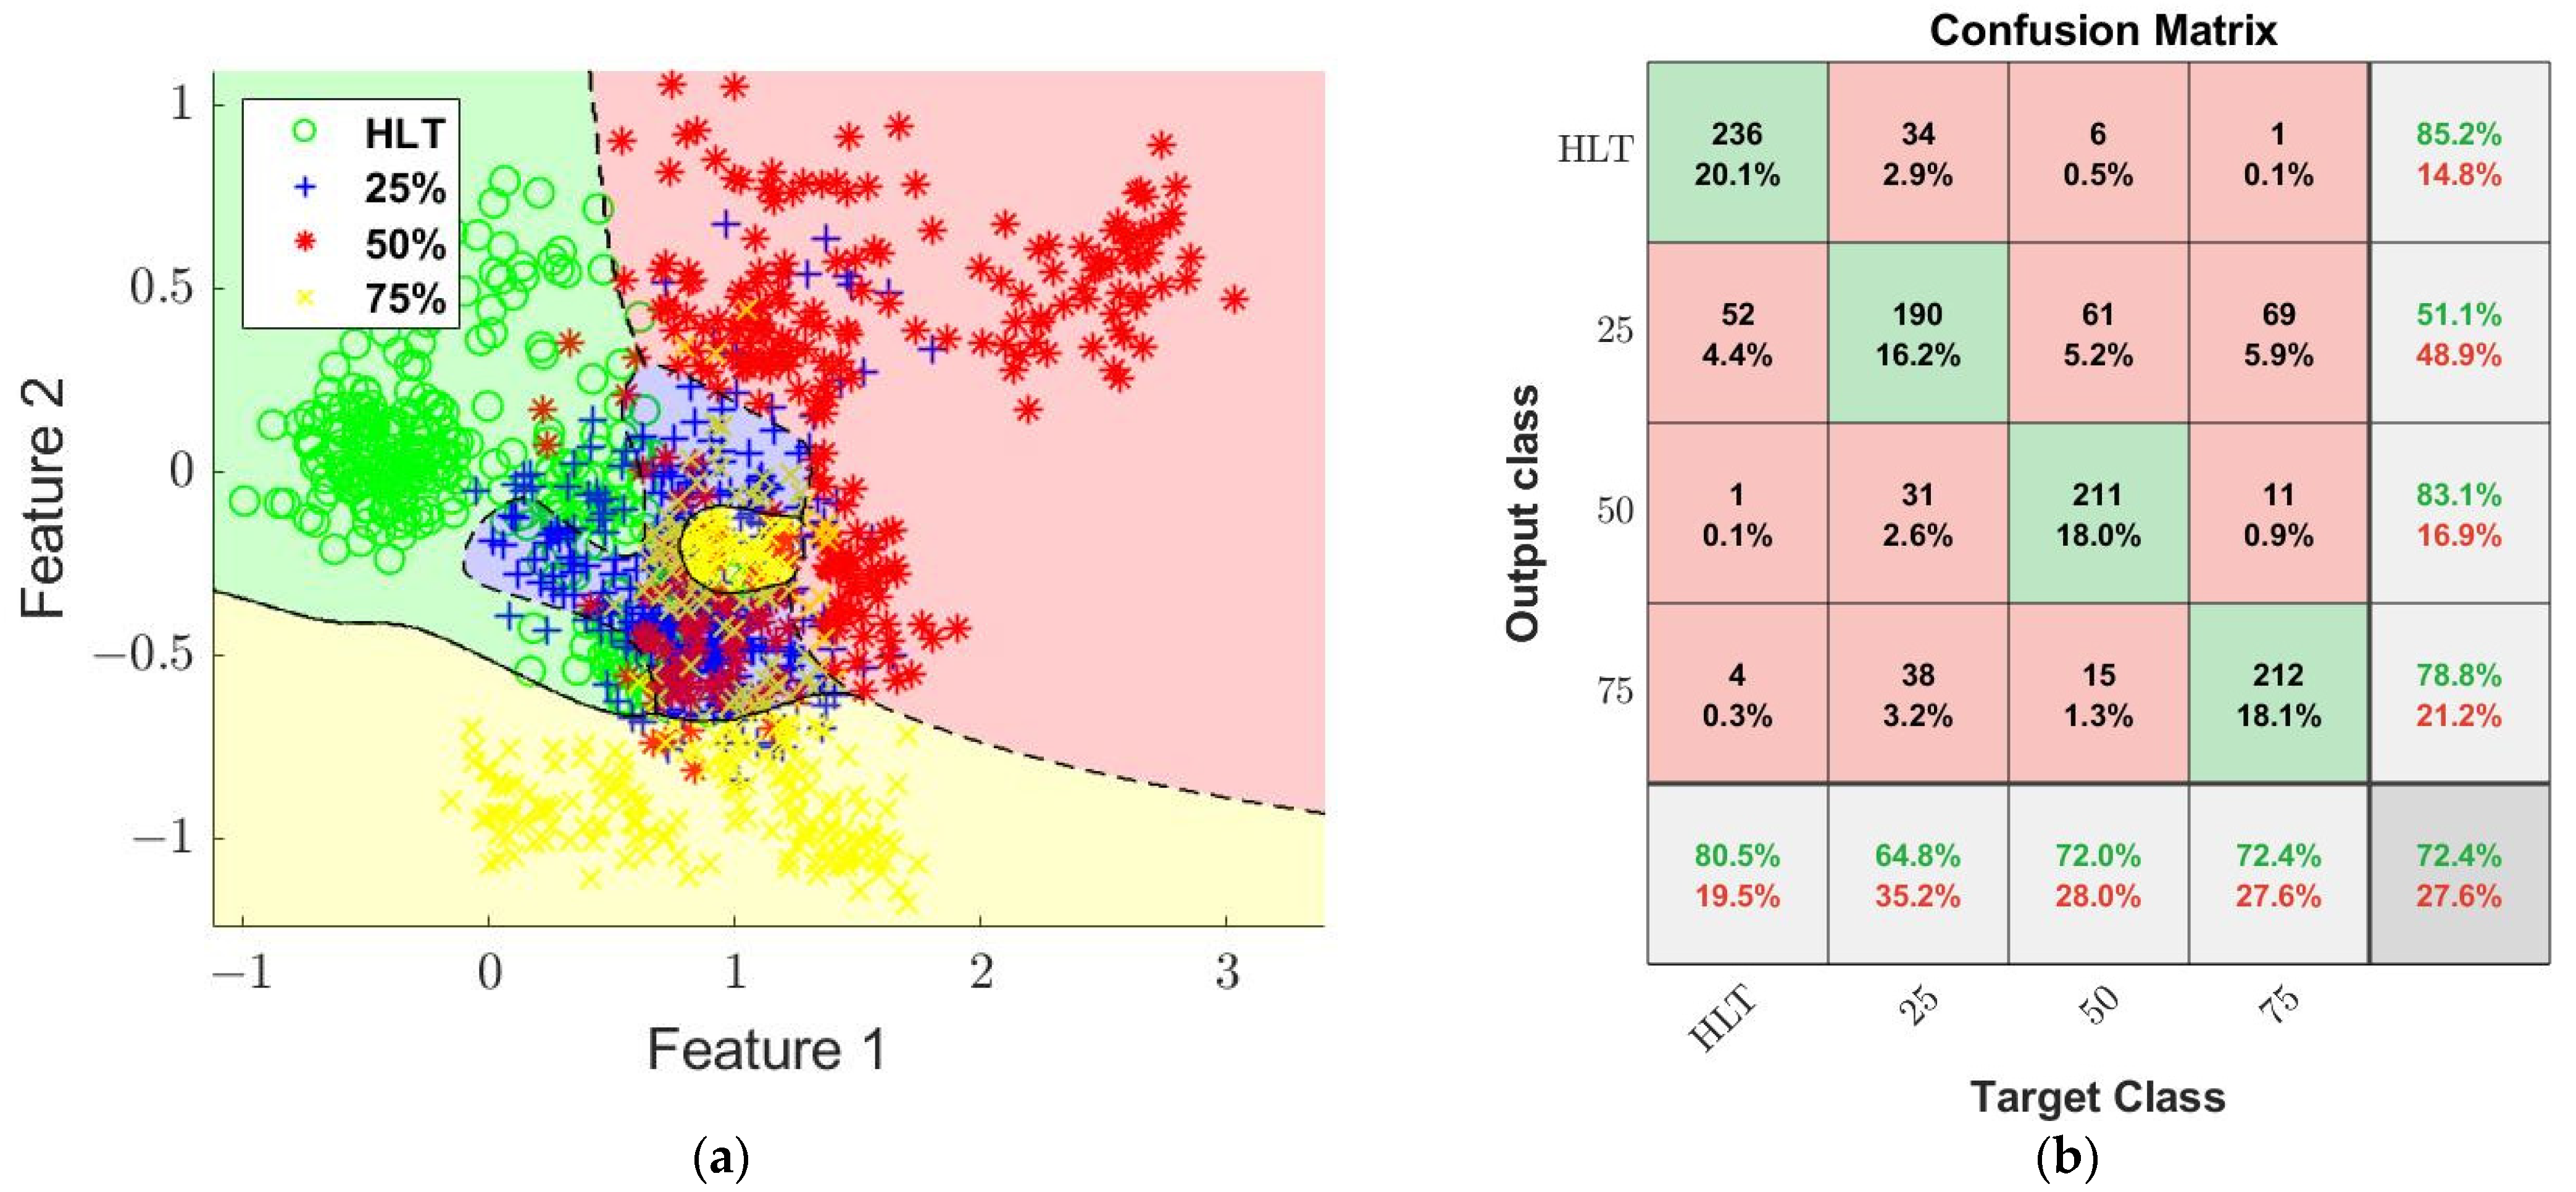
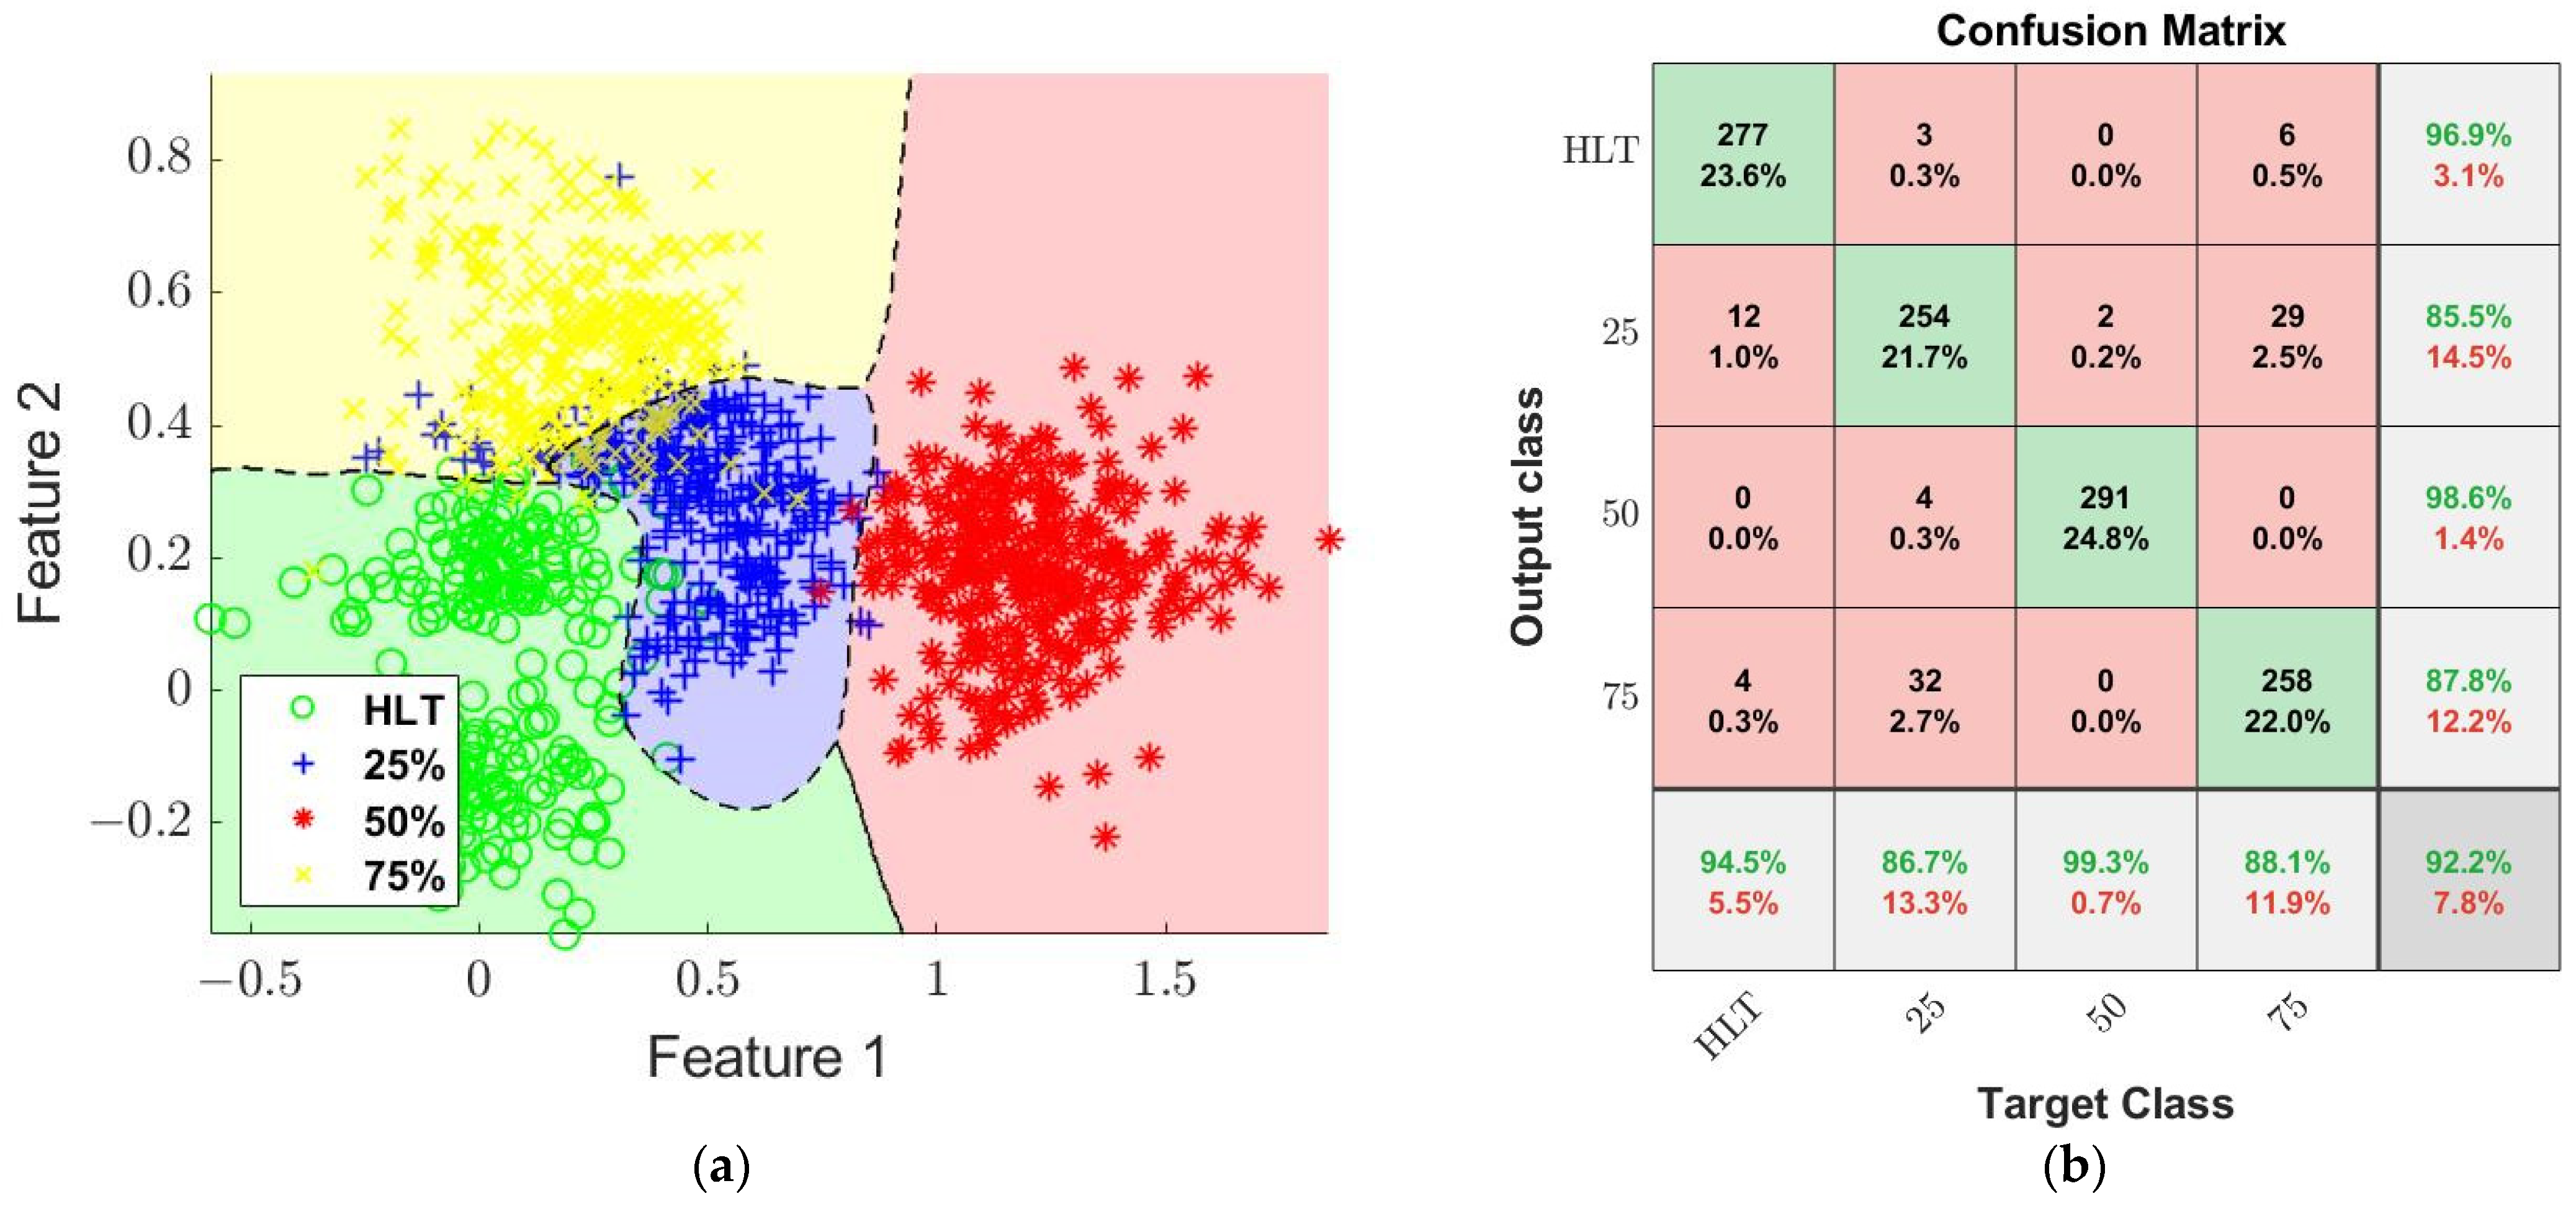
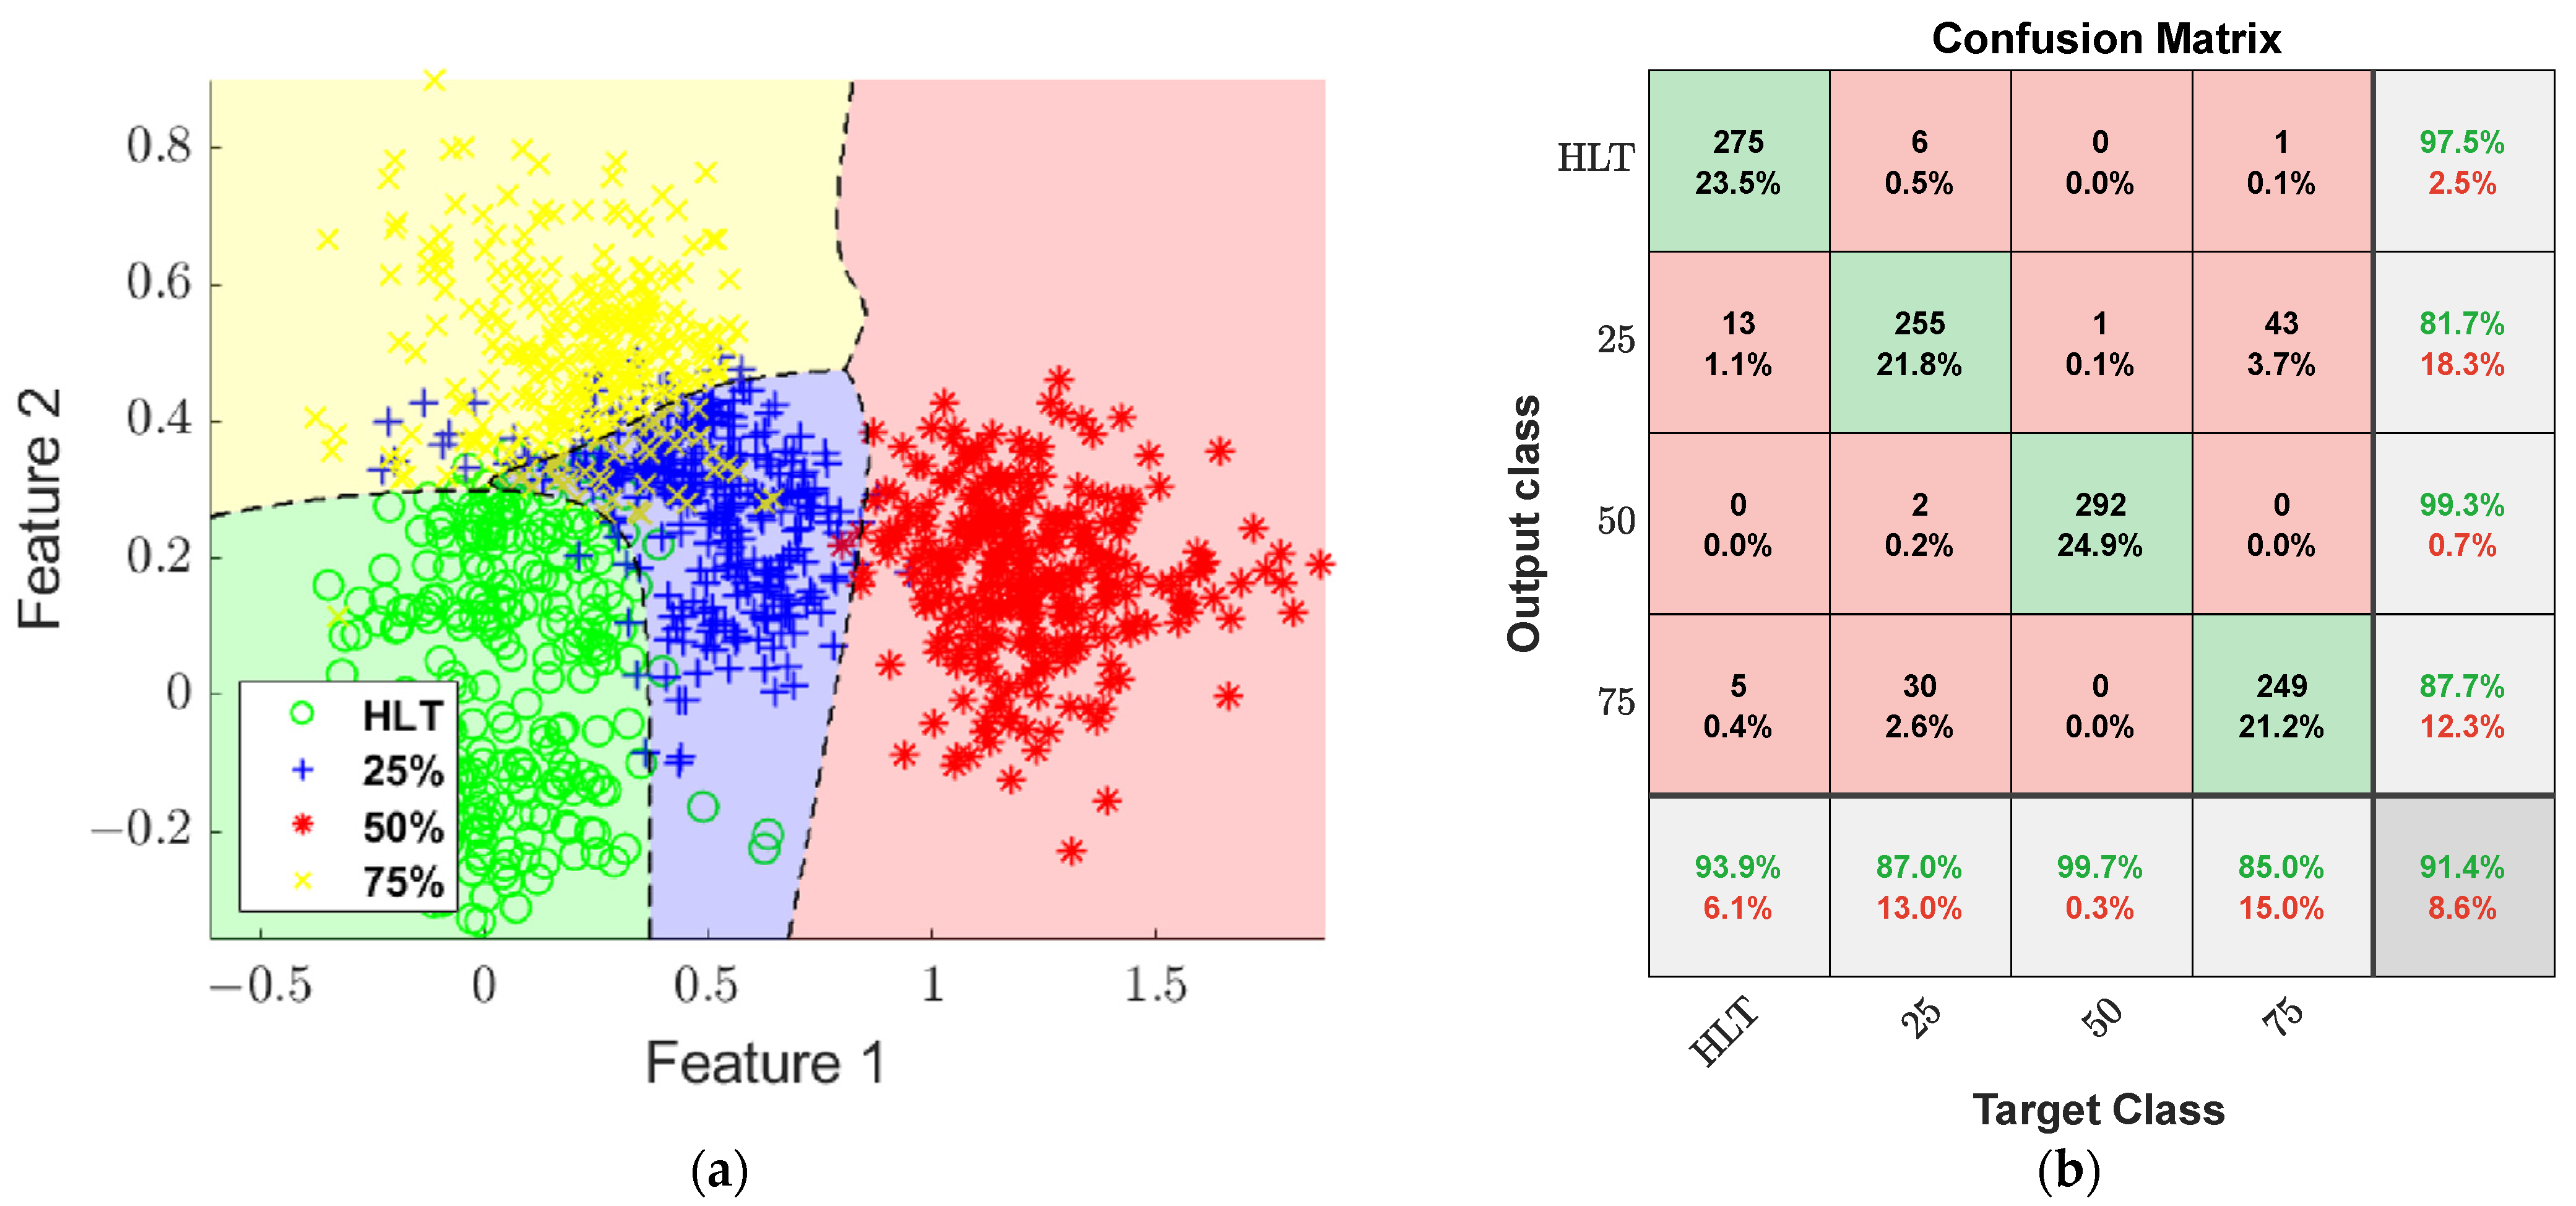
4.4. Case Study: Fault Diagnosis with Features Optimization and with Data Fusion

Now, regarding the afore revised cases, it is the turn to present the results of the proposed methodology, that is to say, gradual gear wear detection through GA-based features selection optimization and data fusion by means of LDA-ANN techniques. Therefore, the results of applying the proposed approach on current signal and vibration signals (Ay and Az axes) are depicted in the plots of Figure 10.
As it can be appreciated, the GA optimizes the selection process by providing a set of features from the matrix of high dimensionality that allows the LDA to reduce and project in two dimensions the classes detected as clusters, with enough separation to differentiate the fault conditions of the gear. For example, in this projection, as in Figure 10a, the regions delimited for each cluster perfectly define the gear wear condition: healthy, gear wear at 25%, gear wear at 50%, and gear wear at 75%. In addition, the clusters overlapping are very slight in comparison with those obtained without data fusion; this way, the use of the GA and the data fusion are justified in this application. Meanwhile, the confusion matrix of Figure 10b) helps to validate the effectiveness of the proposed methodology since the ANN achieves an overall performance of 92.2%. Here, the worst errors in the diagnostic were two, the condition of 25% predicted as 75% and the condition of 75% predicted as 25%; nevertheless, both occurred with a very low percentage.
Finally, several experimental tests were carried out by adding white Gaussian noise to the original measured signals of a 40 dB magnitude with the aim of inducing some aleatory disturbances. Of course, it must be clarified that the original measured signals processed by the proposed methodology had inherent noise due to the electronic and background noise, but the noise added was more evident. Hence, Figure 11 presents the results obtained by the proposed methodology under noise effects. Similarly, just as in the previous results for this case study, Figure 11a shows the LDA projection of the clusters representing the gear conditions with slight overlapping between the wear condition of 25% and 75%. On the other side, Figure 11b shows the confusion matrix that validates the classifier; it is observed that the general performance reached 91.4%, which is very similar to those results without white Gaussian noise.
Some interesting aspects that must be highlighted are that the LDA projection through the two output features (feature 1 and feature 2) with the slight overlapping between the fault conditions of the gear wear of 25% and 75% are fed to the ANN. This slight overlapping is normal, considering that the fault conditions are analyzed under variations of the operating frequency of the motor (5 Hz, 15 Hz, 50 Hz, 60 Hz, and 60 Hz with a soft starter). This brings as a consequence the fact that no matter what structure is adopted for the ANN, its accuracy and precision provide similar results. Thus, if a clearer separation between the classes detected through the LDA can be obtained (without overlapping), then a higher accuracy and precision of the ANN classification can be reached.
In order to present a comparison between the case studies, Table 1 presents a summary in which the configurations of each case can be observed and explicitly the features returned by the GA-based optimized selection of features mechanism implemented in this work. Thus, the table shows, in each case, the physical variables used, the features selected through GA, if data fusion was performed or not, and the overall performance achieved in every case. It is notorious that for the cases where the GA optimization was applied, the selected features in common were the mean, the SRM, and the high-order moments.
It must be mentioned that the conventional reported methodologies, such as the signature analysis, based on frequency analysis, already address the direct detection of specific faults; nevertheless, they have been validated by taking into account fixed or static operating conditions, which means they normally carry out their experimentations under one operating frequency (50 Hz or 60Hz) and without considering graduality in the analyzed faults. On the other hand, a conventional way for diagnosing faults on induction motors requires feature extraction directly from the measured signals and then applying a faults classifier based on ANN. However, this process implies that such ANN could require a very complex structure in order to obtain accurate and reliable results; obviously, the computational burden and the processing time will increase significantly, not to mention that expert knowledge that will be required for its development. Although the proposed methodology implies five stages for its implementation, due to the integration of basic data processing techniques for features calculation, extraction, and reduction, they allow a very simple structure to be defined for the classifier, and in general, the methodology simplicity does not require the expert knowledge of using the techniques adopted.

5. Conclusions

This work presents a methodology for detecting faults of gradual gear wear (healthy gear wear at 25%, 50%, and 75%) in a gearbox integrating a GA for optimizing the selection process of statistical features in the time domain, but also performing data fusion of those features from current and vibration signals through LDA, and performing the classification of conditions through a simple structure of ANN. This methodology enhances the detection and diagnosis of fault conditions even under different frequency operating conditions of the analyzed system; in contrast, this is with conventional approaches that perform their experimentations under fixed operating conditions and without considering the gradual evolution of the faults. The obtained results demonstrate the following. The overall performances that were reached in the diagnostic in the case study concluded that the GA-based optimized selection of features without data fusion for current and separately for vibrations were not as low as expected if omitting the intervention of the GA. Additionally, it must be emphasized that those results were obtained under different operating frequencies (5 Hz, 15 Hz, 50 Hz, and 60 Hz with VFD and 60 Hz with soft starter), which deserves the recognition of its merit. Of course, the overall performance in the diagnostic of the proposed approach, where additionally to the optimized selection of features the data fusion is applied, succeeded the previous results. Therefore, another conclusion is that the use of the GA perse significantly improves the detection of gradual gear wear, no matter the conditions under the experimental tests, but the data fusion also boosts to overcome the limitations due to the use of only one type of variable. For instance, the conventional methodologies perform faults detection through signature analysis; this is well documented, but it is also mentioned that the use of frequency analysis can yield the wrong detection if operating conditions vary. However, the proposed approach is based on the extraction of features from the tests performed under operating conditions variations (different operation frequencies), and they can reflect the fault’s behavior through the data distribution. Another important aspect to be addressed is the features returned by the GA scheme; an initial supposition assumes that the more information is available, the greater possibilities of faults detection exist, but this asseveration is not true because the information used for this task must be useful, with profiles and patterns that allow it. In this sense, the matrix of high dimensionality directly processed by the LDA can project an inadequate two-dimensional representation of the faults, the reasons for which are diverse, considering features without variations, repeated information, and abnormal singularities. It is very notorious that the common features selected in all the case studies coincide with the mean, SRM, and the 6thM, but also some other features, such as the CF, IF, Kur, and 5thM appear. From these features, only the mean is the classical statistical indicator of central tendency, but the others are more related to the geometry of the signal waveform such as CF, IF, or anomalies in the form distribution, such as the high-order moments (Kur, 5thM, and 6thM). Perhaps, the main limitation of the proposed methodology is that it still requires extraction at the beginning; all the features from the input signals have the intention of reducing the computational burden required by applying the GA scheme. This means that, in this work, the GA does not compute the features during execution; instead, the population is the indexes that represent the features (already computed and arranged in the matrix of high dimensionality) that will be combined to evaluate their performance through its variance. In future work, some other applications will be considered, and a broader range of electromechanical elements and their associated fault conditions will be tackled with this approach, such as the broken rotor bars, misalignment, unbalance, and bearing defects, among others. Additionally, there will be explored and studied the effects of considering additional operating conditions such as fluctuating loads; this situation makes hard the proper identification of the faults because the effects of these loads are very similar to other fault conditions, and it will be interesting to explore the potential of our proposed scheme under this context. Additionally, there will be studies on the use of other domain-based features, as well as other physical variables for the data fusion that helps to improve the diagnosis results, such as the case of stray flux for example.

Author Contributions

Conceptualization, R.A.O.-R. and J.A.A.-D.; methodology, A.Y.J.-C.; software, A.Y.J.-C.; validation, A.Y.J.-C. and M.T.-H.; formal analysis, A.Y.J.-C.; investigation, A.Y.J.-C. and M.T.-H.; data curation, A.Y.J.-C. and M.T.-H.; writing—original draft preparation, A.Y.J.-C.; writing—review and editing, A.Y.J.-C.; visualization, R.A.O.-R.; supervision, R.A.O.-R.; project administration, J.A.A.-D.; funding acquisition, J.A.A.-D. All authors have read and agreed to the published version of the manuscript.

Funding

This research was funded by the Spanish ‘Ministerio de Ciencia e Innovación’, Agencia Estatal de Investigación and FEDER program in the framework of the ‘Proyectos de Generación de Conocimiento 2021’ of the “Programa Estatal para Impulsar la Investigación Científico-Técnica y su Transferencia”, belonging to the “Plan Estatal de Investigación Científica, Técnica y de Innovación 2021–2023”. (ref: PID2021-122343OB-I00).

Data Availability Statement

Not applicable.

Acknowledgments

Not applicable.

Conflicts of Interest

The authors declare no conflict of interest.

Appendix A

The statistical features adopted in this work are observed from Expressions (A1) to (A15) in Table A1.
Table A1. Time-domain statistical features defined.
FeatureEquation
Mean x ¯ = 1 n · i = 1 n ( x i ) (A1)
Maximum Value (Max) x ^ = max ( x ) (A2)
Root Mean Square (RMS) R M S = 1 n · i = 1 n ( x i ) 2 (A3)
Square Root Mean (SRM) S R M = ( 1 n · i = 1 n | ( x i | ) 2 (A4)
Standard Deviation (SD) σ = 1 n · i = 1 n ( x i x ¯ ) 2 (A5)
Variance (Var) σ 2 = 1 n · i = 1 n ( x i x ¯ ) 2 (A6)
Form Factor with RMS (FF-RMS) S F R M S = R M S 1 n · i = 1 n | x i | (A7)
Form Factor with SRM (FF-SRM) S F S R M = S R M 1 n · i = 1 n | x i | (A8)
Crest Factor (CF) C F = x ^ R M S (A9)
Latitude Factor (LF) L F = x ^ S R M (A10)
Impulse Factor (IF) I F = x ^ 1 n · i = 1 n | x i | (A11)
Skewness 1 (Sk) S k = E [ ( x i x ¯ ) 3 ] σ 3 (A12)
Kurtosis 1 (Kur) k = E [ ( x i x ¯ ) 4 ] σ 4 (A13)
5th Moment 1 (5thM) 5 t h M = E [ ( x i x ¯ ) 5 ] σ 5 (A14)
6th Moment 1 (6thM) 6 t h M = E [ ( x i x ¯ ) 6 ] σ 6 (A15)
1 High-order moments.
From table, x is the input data vector from which the statistical features are going to be extracted; n is the total number of data in the sample set; i is the corresponding ith sample that takes values from i = 1 , 2 , 3 , , n .

References

  1. Liang, X.; Zuo, M.J.; Feng, Z. Dynamic Modeling of Gearbox Faults: A Review. Mech. Syst. Signal Process. 2018, 98, 852–876. [Google Scholar] [CrossRef]
  2. Zhang, R.; Wang, K.; Shi, Y.; Sun, X.; Gu, F.; Wang, T. The Influences of Gradual Wears and Bearing Clearance of Gear Transmission on Dynamic Responses. Energies 2019, 12, 4731. [Google Scholar] [CrossRef] [Green Version]
  3. Yu, X.; Li, Z.; He, Q.; Yang, Y.; Du, M.; Peng, Z. Gearbox Fault Diagnosis Based on Bearing Dynamic Force Identification. J. Sound Vib. 2021, 511, 116360. [Google Scholar] [CrossRef]
  4. Bejger, A.; Frank, E.; Bartoszko, P. Failure Analysis of Wind Turbine Planetary Gear. Energies 2021, 14, 6768. [Google Scholar] [CrossRef]
  5. Srikar Reddy, B.; Mahato, K.K. Calculation, Design and Analysis of Two Stage Single Speed Gearbox for All Terrain Vehicle for Baja Sae. Mater. Today Proc. 2021, 46, 7187–7203. [Google Scholar] [CrossRef]
  6. Touimi, K.; Benbouzid, M.; Tavner, P. Tidal Stream Turbines: With or without a Gearbox? Ocean Eng. 2018, 170, 74–88. [Google Scholar] [CrossRef]
  7. Elasha, F.; Greaves, M.; Mba, D.; Addali, A. Application of Acoustic Emission in Diagnostic of Bearing Faults within a Helicopter Gearbox. Procedia CIRP 2015, 38, 30–36. [Google Scholar] [CrossRef] [Green Version]
  8. Wodecki, J.; Zdunek, R.; Wyłomańska, A.; Zimroz, R. Nonnegative Factorization of Spectrogram for Local Damage Detection of Belt Conveyor Gearboxes. IFAC-Pap. 2017, 50, 4714–4718. [Google Scholar] [CrossRef]
  9. Takacs, G.; Kis, L. A New Model to Find Optimum Counterbalancing of Sucker-Rod Pumping Units Including a Rigorous Procedure for Gearbox Torque Calculations. J. Pet. Sci. Eng. 2021, 205, 108792. [Google Scholar] [CrossRef]
  10. Tang, X.; Xu, Y.; Sun, X.; Liu, Y.; Jia, Y.; Gu, F.; Ball, A.D. Intelligent Fault Diagnosis of Helical Gearboxes with Compressive Sensing Based Non-Contact Measurements. ISA Trans. 2022. [Google Scholar] [CrossRef]
  11. Yang, X.; Wei, D.; Zuo, M.J.; Tian, Z. Analysis of Vibration Signals and Detection for Multiple Tooth Cracks in Spur Gearboxes. Mech. Syst. Signal Process. 2023, 185, 109780. [Google Scholar] [CrossRef]
  12. Lu, D.; Qiao, W.; Gong, X. Current-Based Gear Fault Detection for Wind Turbine Gearboxes. IEEE Trans. Sustain. Energy 2017, 8, 1453–1462. [Google Scholar] [CrossRef]
  13. Cheng, F.; Wang, J.; Qu, L.; Qiao, W. Rotor-Current-Based Fault Diagnosis for DFIG Wind Turbine Drivetrain Gearboxes Using Frequency Analysis and a Deep Classifier. IEEE Trans. Ind. Appl. 2018, 54, 1062–1071. [Google Scholar] [CrossRef]
  14. Feng, Z.; Chen, X.; Zuo, M.J. Induction Motor Stator Current AM-FM Model and Demodulation Analysis for Planetary Gearbox Fault Diagnosis. IEEE Trans. Ind. Inform. 2019, 15, 2386–2394. [Google Scholar] [CrossRef]
  15. Hu, C.; Smith, W.A.; Randall, R.B.; Peng, Z. Development of a Gear Vibration Indicator and Its Application in Gear Wear Monitoring. Mech. Syst. Signal Process. 2016, 76–77, 319–336. [Google Scholar] [CrossRef]
  16. Feng, K.; Smith, W.A.; Randall, R.B.; Wu, H.; Peng, Z. Vibration-Based Monitoring and Prediction of Surface Profile Change and Pitting Density in a Spur Gear Wear Process. Mech. Syst. Signal Process. 2022, 165, 108319. [Google Scholar] [CrossRef]
  17. Cao, W.; Han, Z.; Yang, Z.Z.; Wang, N.; Qu, J.X.; Wang, D. Deterioration State Diagnosis and Wear Evolution Evaluation of Planetary Gearbox Using Vibration and Wear Debris Analysis. Measurement 2022, 193, 110978. [Google Scholar] [CrossRef]
  18. Resendiz-Ochoa, E.; Saucedo-Dorantes, J.J.; Benitez-Rangel, J.P.; Osornio-Rios, R.A.; Morales-Hernandez, L.A. Novel Methodology for Condition Monitoring of Gear Wear Using Supervised Learning and Infrared Thermography. Appl. Sci. 2020, 10, 506. [Google Scholar] [CrossRef] [Green Version]
  19. Cheng, F.; Peng, Y.; Qu, L.; Qiao, W. Current-Based Fault Detection and Identification for Wind Turbine Drivetrain Gearboxes. IEEE Trans. Ind. Appl. 2017, 53, 878–887. [Google Scholar] [CrossRef]
  20. Peng, Y.; Qiao, W.; Cheng, F.; Qu, L. Wind Turbine Drivetrain Gearbox Fault Diagnosis Using Information Fusion on Vibration and Current Signals. IEEE Trans. Instrum. Meas. 2021, 70, 1–11. [Google Scholar] [CrossRef]
  21. Samuel, D.-Y.; Nabhan, A.; Mousa, M.-O. Survey of Gear Fault Diagnosis Using Various Statistical Signals Parameters. J. Egypt. Soc. Tribol. 2022, 19, 14–27. [Google Scholar] [CrossRef]
  22. Göktas, T.; Arkan, M.; Özgüven, Ö.F. A New Method to Separate Broken Rotor Failures and Low Frequency Load Oscillations in Three-Phase Induction Motor. In Proceedings of the 2013 9th IEEE International Symposium on Diagnostics for Electric Machines, Power Electronics and Drives (SDEMPED), Valencia, Spain, 27–30 August 2013; pp. 122–127. [Google Scholar]
  23. Göktaş, T.; Arkan, M.; Özgüven, Ö.F. Detection of Rotor Fault in Three-Phase Induction Motor in Case of Low-Frequency Load Oscillation. Electr Eng 2015, 97, 337–345. [Google Scholar] [CrossRef]
  24. Morinigo-Sotelo, D.; Romero-Troncoso, R.d.J.; Panagiotou, P.A.; Antonino-Daviu, J.A.; Gyftakis, K.N. Reliable Detection of Rotor Bars Breakage in Induction Motors via MUSIC and ZSC. IEEE Trans. Ind. Appl. 2018, 54, 1224–1234. [Google Scholar] [CrossRef]
  25. Shin, J.; Park, Y.; Lee, S.B. Flux-Based Detection and Classification of Induction Motor Eccentricity, Rotor Cage, and Load Defects. IEEE Trans. Ind. Appl. 2021, 57, 2471–2480. [Google Scholar] [CrossRef]
  26. Ali, M.Z.; Shabbir, M.N.S.K.; Liang, X.; Zhang, Y.; Hu, T. Machine Learning-Based Fault Diagnosis for Single- and Multi-Faults in Induction Motors Using Measured Stator Currents and Vibration Signals. IEEE Trans. Ind. Appl. 2019, 55, 2378–2391. [Google Scholar] [CrossRef]
  27. Gritli, Y.; Rossi, C.; Zarri, L.; Filippetti, F.; Chatti, A.; Casadei, D. Double Frequency Sliding and Wavelet Analysis for Rotor Fault Diagnosis in Induction Motors under Time-Varying Operating Condition. In Proceedings of the 8th IEEE Symposium on Diagnostics for Electrical Machines, Power Electronics & Drives, Bologna, Italy, 5–8 September 2011; pp. 676–683. [Google Scholar]
  28. Vedreño-Santos, F.; Riera-Guasp, M.; Henao, H.; Pineda-Sénchez, M.; Antonino-Daviu, J.A. Diagnosis of Eccentricity in Induction Machines Working under Fluctuating Load Conditions, through the Instantaneous Frequency. In Proceedings of the IECON 2012—38th Annual Conference on IEEE Industrial Electronics Society, Montreal, QC, Canada, 25–28 October 2012; pp. 5108–5113. [Google Scholar]
  29. El Hachemi Benbouzid, M. A Review of Induction Motors Signature Analysis as a Medium for Faults Detection. IEEE Trans. Ind. Electron. 2000, 47, 984–993. [Google Scholar] [CrossRef] [Green Version]
  30. Mac, T.T.; Iba, D.; Matsushita, Y.; Mukai, S.; Inoue, T.; Fukushima, A.; Miura, N.; Iizuka, T.; Masuda, A.; Moriwaki, I. Application of Genetic Algorithms for Parameters Identification in a Developing Smart Gear System. Forsch. Im Ing. 2022, 86, 433–450. [Google Scholar] [CrossRef]
  31. Cerrada, M.; Zurita, G.; Cabrera, D.; Sánchez, R.-V.; Artés, M.; Li, C. Fault Diagnosis in Spur Gears Based on Genetic Algorithm and Random Forest. Mech. Syst. Signal Process. 2016, 70–71, 87–103. [Google Scholar] [CrossRef]
  32. Li, X.; Li, J.; Qu, Y.; He, D. Semi-Supervised Gear Fault Diagnosis Using Raw Vibration Signal Based on Deep Learning. Chin. J. Aeronaut. 2020, 33, 418–426. [Google Scholar] [CrossRef]
  33. Saucedo-Dorantes, J.J.; Delgado-Prieto, M.; Osornio-Rios, R.A.; de Jesus Romero-Troncoso, R. Multifault Diagnosis Method Applied to an Electric Machine Based on High-Dimensional Feature Reduction. IEEE Trans. Ind. Appl. 2017, 53, 3086–3097. [Google Scholar] [CrossRef]
  34. Feng, K.; Ji, J.C.; Ni, Q.; Beer, M. A Review of Vibration-Based Gear Wear Monitoring and Prediction Techniques. Mech. Syst. Signal Process. 2023, 182, 109605. [Google Scholar] [CrossRef]
  35. Daniel, R.; Paulus, T. Chapter 11—Introduction to Gate Drives. In Lock Gates and Other Closures in Hydraulic Projects; Daniel, R., Paulus, T., Eds.; Butterworth-Heinemann: Oxford, UK, 2019; pp. 705–784. ISBN 978-0-12-809264-4. [Google Scholar]
  36. Smith, R.; Mobley, R.K. Chapter 13—Gears and Gearboxes*. In Rules of Thumb for Maintenance and Reliability Engineers; Smith, R., Mobley, R.K., Eds.; Butterworth-Heinemann: Burlington, VT, USA, 2008; pp. 225–238. ISBN 978-0-7506-7862-9. [Google Scholar]
  37. ISO 10825-1:2022; Gears—Wear and Damage to Gear Teeth—Part 1: Nomenclature and Characteristics. Available online: https://standards.iteh.ai/catalog/standards/iso/183dbb21-7022-442c-aaad-ab240de89aaa/iso-10825-1-2022 (accessed on 16 November 2022).
  38. Jayalakshmi, S.L.; Chandrakala, S.; Nedunchelian, R. Global Statistical Features-Based Approach for Acoustic Event Detection. Appl. Acoust. 2018, 139, 113–118. [Google Scholar] [CrossRef]
  39. Osornio-Rios, R.A.; Jaen-Cuellar, A.Y.; Alvarado-Hernandez, A.I.; Zamudio-Ramirez, I.; Cruz-Albarran, I.A.; Antonino-Daviu, J.A. Fault Detection and Classification in Kinematic Chains by Means of PCA Extraction-Reduction of Features from Thermographic Images. Measurement 2022, 197, 111340. [Google Scholar] [CrossRef]
  40. Holland, J.H. Adaptation in Natural and Artificial Systems: An Introductory Analysis with Applications to Biology, Control, and Artificial Intelligence, 1st ed.; Complex adaptive systems; MIT Press: Cambridge, MA, USA, 1992; ISBN 978-0-262-08213-6. [Google Scholar]
  41. Rao, S.S. Engineering Optimization: Theory and Practice, 4th ed.; John Wiley & Sons: Hoboken, NJ, USA, 2009; ISBN 978-0-470-18352-6. [Google Scholar]
  42. Bhoskar, M.T.; Kulkarni, M.O.K.; Kulkarni, M.N.K.; Patekar, M.S.L.; Kakandikar, G.M.; Nandedkar, V.M. Genetic Algorithm and Its Applications to Mechanical Engineering: A Review. Mater. Today: Proc. 2015, 2, 2624–2630. [Google Scholar] [CrossRef]
  43. Said, Y.H. 13—On Genetic Algorithms and Their Applications. In Handbook of Statistics; Rao, C.R., Wegman, E.J., Solka, J.L., Eds.; Data Mining and Data Visualization; Elsevier: Amsterdam, The Netherlands, 2005; Volume 24, pp. 359–390. [Google Scholar]
  44. Telgaonkar-Archana, H.; Deshmukh, S. Dimensionality Reduction and Classification through PCA and LDA. Int. J. Comput. Appl. 2015, 122, 4–8. [Google Scholar]
Figure 1. Failure modes according to ISO 10825 [37].
Energies 16 00948 g001
Figure 2. Flow diagram of the steps for implementing the GA.
Energies 16 00948 g002
Figure 3. Structure adopted for the ANN.
Energies 16 00948 g003
Figure 4. Block diagram of the proposed methodology.
Energies 16 00948 g004
Figure 5. Experimental setup, in (a) Physical system, and (b) Gears with gradual wear.
Energies 16 00948 g005
Figure 6. Arrangement of the matrix of features of high dimensionality.
Energies 16 00948 g006
Figure 7. LDA applied over all the features in the matrix of high dimensionality.
Energies 16 00948 g007
Figure 8. Features optimization through GA for current signal (not data fusion is considered), in (a) Two-dimensional projection of clusters (fault conditions) through LDA with limit bounds, and (b) Confusion matrix that validates the ANN classification of faults.
Energies 16 00948 g008
Figure 9. Features optimization through GA for Ay and Az vibration signals (not data fusion is considered), in (a) Two-dimensional projection of clusters (fault conditions) through LDA with limit bounds, and (b) Confusion matrix that validates the ANN classification of faults.
Energies 16 00948 g009
Figure 10. Features optimization through GA and data fusion (current signal and Ay and Az vibration signals), in (a) Two-dimensional projection of clusters (fault conditions) through LDA with limit bounds, and (b) Confusion matrix that validates the ANN classification of faults.
Energies 16 00948 g010
Figure 11. Feature optimization through the proposed methodology with Gaussian noise added for 40 dB, in (a) Two-dimensional projection of clusters (fault conditions) through LDA with limit bounds, and (b) Confusion matrix that validates the ANN classification of faults.
Energies 16 00948 g011
Table 1. Case studies performance comparisons.
CaseGA Optimized
Features
Data
Fusion
Overall
Performance (%)
Current + Vibrations (Ay, Az)No (all features used)NoNot achieved
CurrentMean, Max, SRM, CF, IF, 5thM, 6thMNo72.5
Vibrations (Ay, Az)Mean, SRM, Kur, 6thMNo83.7
Current + Vibrations (Ay, Az)Mean, Max, SRM, CF, IF, 5thM, 6thMYes92.2
Current + Vibrations (Ay, Az) + white Gaussian noiseMean, SRM, Sk, Kur, 5thMYes91.4
Disclaimer/Publisher’s Note: The statements, opinions and data contained in all publications are solely those of the individual author(s) and contributor(s) and not of MDPI and/or the editor(s). MDPI and/or the editor(s) disclaim responsibility for any injury to people or property resulting from any ideas, methods, instructions or products referred to in the content.

