1. Introduction
Bucket elevators are used in many industries as an efficient method for transporting bulk materials vertically at high rates. Their most popular applications include transportation of solid fuel, such as coal or biomass, to boiler furnaces in power stations, unloading of bulk materials (fine-grained coal, sand, corn, etc.) from ships or bulk material handling in the chemical industry. Unlike in the case of belt conveyors, the material handled by bucket elevators does not form a continuous stream, but it is moved cyclically in buckets mounted to chains or belts.
There are two main advantages of using bucket elevators. Firstly, they can lift materials vertically up to a height of 40 m. Secondly, due to their tight housing, they do not produce dust when handling bulk materials. This is especially important in the context of environmental pollution, as it can help to decrease potential health hazards. Contemporary bucket elevators can achieve a capacity of up to 1000 t/h [
1].
At the same time, high operational reliability is required from bucket elevators, as any faults or breakdowns may cause downtime and costly consequences, e.g., interruptions in fuel supply to power plants.
The major components of bucket elevators are drive units. They are usually foot mounted on the support frames that are installed on the housings of the elevators. Their reliability contributes significantly to the reliability of the entire bucket elevators.
Therefore, this article presents the results of research and comparative analyses of the technical condition of two drive units in twin bucket elevators operating in the fuel supply system of a power plant in Poland.
Classic drive units used in bucket elevators usually consist of electric motors, flexible couplings and toothed gears. An alternative solution are the so-called gear-motors.
Common flaws or failures in gears usually relate to:
Gear wheels (e.g., pitting, seizing, tooth profile error, tooth cracking, or breakage),
Gear shafts (e.g., misalignment, bending, and eccentricity),
Bearings (e.g., damage to the inner or outer race, and damage to the rolling elements).
Gear defects or failures can most often be detected using a narrow-band spectral analysis of vibration velocity or acceleration. Various techniques of signal analysis are implemented to obtain the most useful diagnostic information. A detailed discussion of these issues is beyond the scope of this article.
Among the physical quantities that could be monitored to assess the technical condition of a drive unit, vibrations are one of the best indicators. Therefore, there are plenty of diagnostic procedures based on information related to drive vibrations. There are also many comprehensive reviews and analyses of the possibilities to use vibrations in condition monitoring of machinery, among others [
2,
3,
4,
5,
6].
On the other hand, it should be emphasized that some mechanical structures are so complex that it is difficult to correctly identify the sources of changes in the diagnostic signal. Consequently, there are different techniques of filtering the observed vibration changes in such mechanical power drive units, including gearboxes [
7].
Time-spectral analysis is the dominating method of signal analysis to obtain diagnostically useful information. There is a particular preference for narrow-band analysis in the frequency domain supported by various analysis tools, including Fourier transform, Hilbert transform, autocorrelation function analysis, wavelet transform, envelope analysis method, and cepstral analysis.
Assessments of such indicators as RMS, kurtosis or skewness are also very helpful in formulating a proper diagnosis [
7,
8,
9,
10,
11,
12,
13]. On the other hand, a combination of signals used in such analyses can be more beneficial for the diagnosis than when selected signals are used separately. An experimental study of the fusion of electrical, acoustic and vibration analysis is presented, among others, in [
14]. In addition, the operating gears can produce disturbances in the vibroacoustic signal, e.g., because of a lower quality of their surfaces [
15], while the most common failures within gear transmissions involve the teeth, which are usually damaged by fractures occurring at their base or by pitting [
16].
When it comes to evaluating the usefulness of diagnostic parameters, two approaches can be distinguished [
17]. The first one consists in selecting a minimum number of parameters which provide useful information, while the second approach combines more parameters which on their own can be less meaningful. The method should be chosen individually for each case. It is worth noting that different parameters can be used differently depending on the type of defect to be identified. For instance, changes in the median frequency and the spectral centroid are related to the condition of inner races and roller elements in bearings, whereas the latter indicator can be also used for evaluating the technical state of outer races. A more detailed study on the benefits of specific indicators in the diagnostics of bearings is presented in [
18]. It should be emphasized that changes in the distribution of vibroacoustic energy, are also good diagnostic indicators because bearing failures affect the level of this particular energy [
19].
Besides diagnostics, vibrations play a significant role during the operation of a wide range of machines including those used in the mining industry. If such machines are subjected to a significant level of vibrations while in operation, their wear accelerates. Furthermore, some researchers suggest that vibrations increase the total energy within these machines above levels that are typically estimated by popular formulas [
20]. Understanding this is particularly important because an underestimation of dynamic conditions during operation can lower machine reliability, i.e., the probability of its failure-free operation. Additionally, vibrations can lead to changes in the dynamic behavior of a specific machine, for example, its center of gravity might shift [
21].
Diagnostics of industrial machinery in real operating conditions is always influenced by various disturbances, which sometimes can be very difficult to eliminate from the diagnostic signals. This problem is encountered not only in the field of mechanical engineering, but also in the study of operation of various devices in civil and electrical engineering [
22,
23]. Such interferences can be observed, amongst others, in vibroacoustic signals.
2. Purpose of the Research
This study focuses on two bucket elevators, labelled BE#1 and BE#2, which were installed in a Polish power plant. Each of the drive units of those elevators comprises an electric motor and a three-stage angular cylindrical gear (
Figure 1).
The main goal of the research was to perform a comparative assessment of two bucket elevators using vibration severity as an indicator of their technical condition.
Although the methods of advanced analysis of diagnostic signals presented in the introduction have been successfully used in many cases, this study attempted to apply the diagnostic method to real industrial conditions. It was assumed that the method should enable a quick comparative evaluation of two identical elevators and detect potential accelerated wear or assembly errors.
The article describes the methods of comparative assessment of the technical condition of the bucket elevators with the ultimate goal of selecting a method that can be used to assess the technical condition of elevators operating in the industry. Therefore, the descriptions of the implemented techniques of diagnostic signal analysis were omitted in the article. We focused on presenting the method of comparative evaluation of both power units and the final results of this evaluation. In particular, the article does not describe the principles of vibration measurements in diagnostic tests of drive units as formulated in the standard ISO 10816, PN-ISO 8579-2: 1996, the techniques of broadband signal analysis, such as obtaining a third octave spectrum of vibration velocity, and methods of estimating probability distributions of static diagnostic signals.
The research was carried out when both elevators were running at nominal speed of the bucket chains, but with empty buckets because it was not possible to conduct the experiment with a variable load and operating speed of the elevators. The technical condition of the drive units was evaluated using a symptom-based diagnostic method, which analyzed the velocity signals measured on the bearing housings.
3. The Diagnostic Method
In industrial diagnostics, it is important to use appropriate measures of vibroacoustic signals, which can be determined in real operating conditions and, at the same time, are useful for assessing the technical condition of the device under study.
In the research task described in this article, we had to take into account the fact that the tested drive units were mounted on frames installed on the casings of bucket elevators. Thus, there was the possibility that the diagnostic signals from the tested drives would also contain components originating from the operation of other elements, especially the transport system, e.g., the chain with buckets. This fact significantly complicated the diagnostic tasks.
With this in mind, the comparative assessment of the drive units of both bucket elevators was carried out using symptomatic diagnostics methods based on the analysis of the vibration intensity measured at selected points, such as bearing assemblies.
In a broader context, comparative assessment can help to identify which of the drive units requires special attention and which should be inspected in advance. Such tasks are usually carried out as part of predictive maintenance programs. Such programs are especially useful for the diagnostic evaluation of similar machines.
The idea of the diagnostic inference process, applied in this study, relies on comparing the numerical values of the symptoms which determine the technical condition of the assessed drive units.
The symptoms were selected on the basis of the current state of diagnostic knowledge and the possibility of encountering these symptoms in specific industrial conditions characterized by large-scale mechanical devices operating continuously.
As the selection of diagnostic symptoms is crucial for the final result of inference, the diagnostic assessment was performed independently in three categories using three following approaches:
Analysis and comparison in the time domain;
Analysis and comparison in the frequency domain;
Analysis and comparison using the probabilistic approach.
These three methods are based on the analysis of vibration severity that is generally accepted as the best overall indicator of technical condition of machinery. Vibration velocity was selected as the diagnostic signal.
3.1. The Concept of Time Domain Analysis
When assessing the condition of machinery, one of the key questions is which vibration quantity: displacement, speed or acceleration, should be chosen as a diagnostic signal that is the most sensitive to changes in the technical condition.
The literature on the subject shows different approaches to the problem. In the case of machines with low frequencies of working movements, i.e., below 10–30 Hz, it is preferable to use displacement as a diagnostic signal. For most machines with operating frequencies above 10–30 Hz but below 1000–1500 Hz, it is vibration velocity that is used as a reliable diagnostic signal. In the case of machines with higher operating frequencies, vibration acceleration is used most often [
24,
25].
In view of the above, the comparative analysis in the time domain was based on the following three diagnostic indicators:
Classic indicators: Mean, RMS and Peak;
Dimensionless factors: the Crest factor (defined as the ratio of Peak to RMS); and
The Impulse factor (defined as the ratio of Peak to Mean).
The RMS value is generally considered as a proper measure for steady-state signals, whereas Peak is more adequate for signals whose mean level remains relatively low while some impulses occur [
25]. The Crest factor is recommended and used in particular by Bruel&Kjaer Co. (Virum, Denmark) as an index for assessing the technical condition of rolling bearings [
26].
3.2. The Concept of Frequency Domain Analysis
The comparative analysis in the frequency domain was carried out on the basis of the broad-band (1/3 Octave) spectra of the vibration velocity measured in the bearings. Then, the vibration severity was evaluated and the technical condition was classified depending on the RMS velocity values as “A” (good), “B” (acceptable), “C” (conditionally acceptable in restricted conditions) or “D” (not acceptable) according to the guidelines of ISO-10816-3 (
Table 1). The boundaries of these levels are related to the total RMS vibration velocity in the frequency range from at least 10 Hz to 1000 Hz.
It should be noted that some researchers claim [
28,
29] that the requirements of ISO-10816-3 are too restrictive and instead refer to new drive units installed on special test stands, where the influence of environmental vibrations on the diagnostic signals can be kept at minimum.
However, the drive units of industrial bucket elevators are usually installed on frames mounted on a thin-walled casing. Under such conditions, diagnostic signals are usually subject to interference from vibrations caused by other components of a bucket elevator, especially by the operation of the bucket chain or by the resonant vibrations of the casing.
In this context, a more practical and less restricted classification of the technical condition of drive units with gears has been proposed. Similarly to ISO-10816-3, this classification is based on vibration severity and is presented in
Table 2.
3.3. The Concept of Using a Probabilistic Approach to Comparative Analysis
In real operation of machinery, diagnostic signals are random variables, and this is especially true of vibration severity, which is considered to be a basic diagnostic tool. Due to this variability, the condition of drive units should be assessed using the probabilistic approach.
A new approach has been proposed that comprises the following steps:
Estimation of statistical distributions for values of diagnostic signals (e.g., vibration velocity or acceleration) treated as random variables;
Computation of the Quantile Qp (where p is the arbitrarily assumed confidence level) of signal velocity or acceleration applied as a measure of vibration severity;
Establishment of the limit values of diagnostic signals to serve as critical levels that determine the relevant category of technical condition of the machinery.
According to this idea, if the Quantile
Qp of the vibration velocity at the measuring point does not exceed the assumed upper level
vRMS(Limit), i.e., when:
then the drive unit meets the requirements and can be considered as acceptable for operation.
In particular, these Quantile values
Qp can be compared with the upper limit of the “B” zone (in accordance with the recommendations of ISO-10816-3 Standard, see
Table 1), i.e., with the value
vRMS = 4.5 mm/s or with the higher value
vRMS = 8.0 mm/s, if one were to adhere to the less restrictive requirements (
Table 2).
4. Results of the Research and Diagnostic Analysis
4.1. Research Conditions
Measurement procedures and measurement locations in the tested drive units were in compliance with the ISO 10816-3 International Standard.
In accordance with the recommendations of the aforementioned standard, diagnostic tests of the drive units were carried out during the operation of the bucket elevators BE#1 and BE#2 in the following conditions:
Without load, i.e., in idle gear;
With loaded buckets operating at nominal speed.
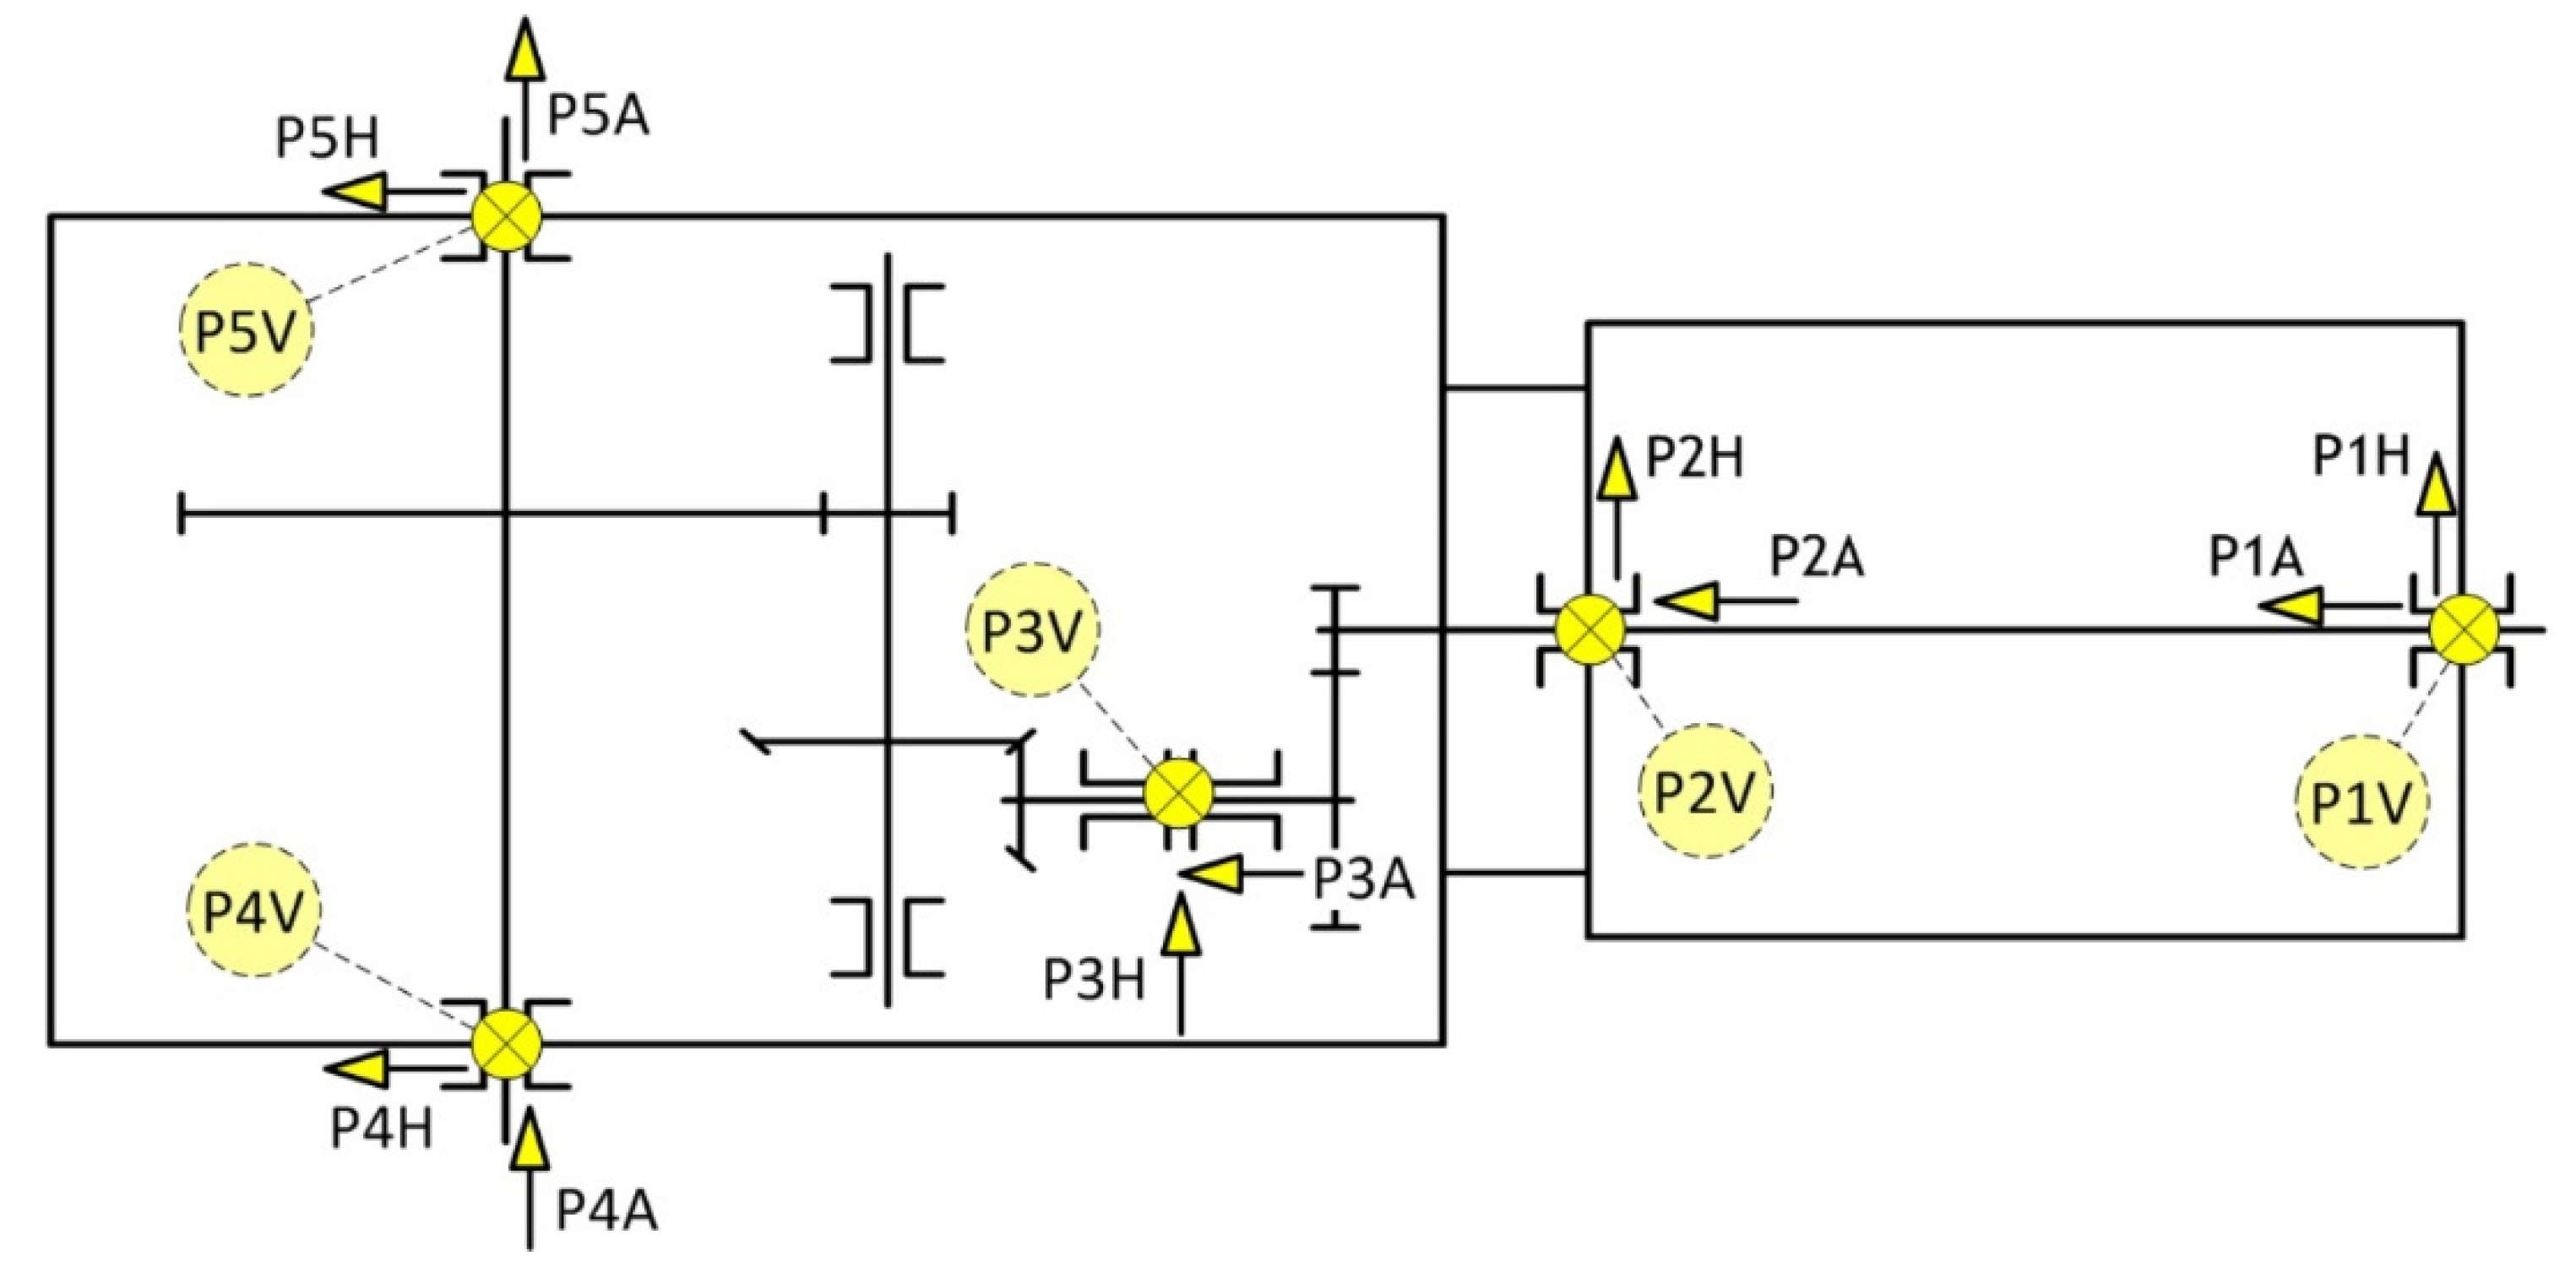
During the tests, the velocity and acceleration of vibrations were measured at the following 5 points located on the bearing housings of both drive units (
Figure 2):
Two points, P1 and P2, located on the engine bearing units;
Three points, P3, P4 and P5, located on the bearing units of the gear.
Not all of the bearing units were readily available for testing. This applies in particular to the P1 and P2 bearing nodes. The signals (vibration velocity) were measured in the vertical (V), horizontal (H) and axial (A) directions.
Measurements were performed using the SVAN 954 vibration level meter and analyzer with DYTRAN 3185D piezoelectric accelerometer manufactured by Svantek LTD. The chosen equipment has three vibration profiles, which allow parallel measurements of acceleration, velocity and displacement. The advanced time history logging for each profile, which provides complete information about the measured signal, can be stored in non-volatile internal memory. The equipment used in this study was capable of measuring broad-band r.m.s. vibration in a frequency range of 1 Hz to 16,000 Hz.
The vibration signals were measured and recorded in real time in the internal memory. Then, the files were downloaded using the USB interface and SvanPC+ software to a desktop computer for later offline analysis.
4.2. Analysis in the Time Domain
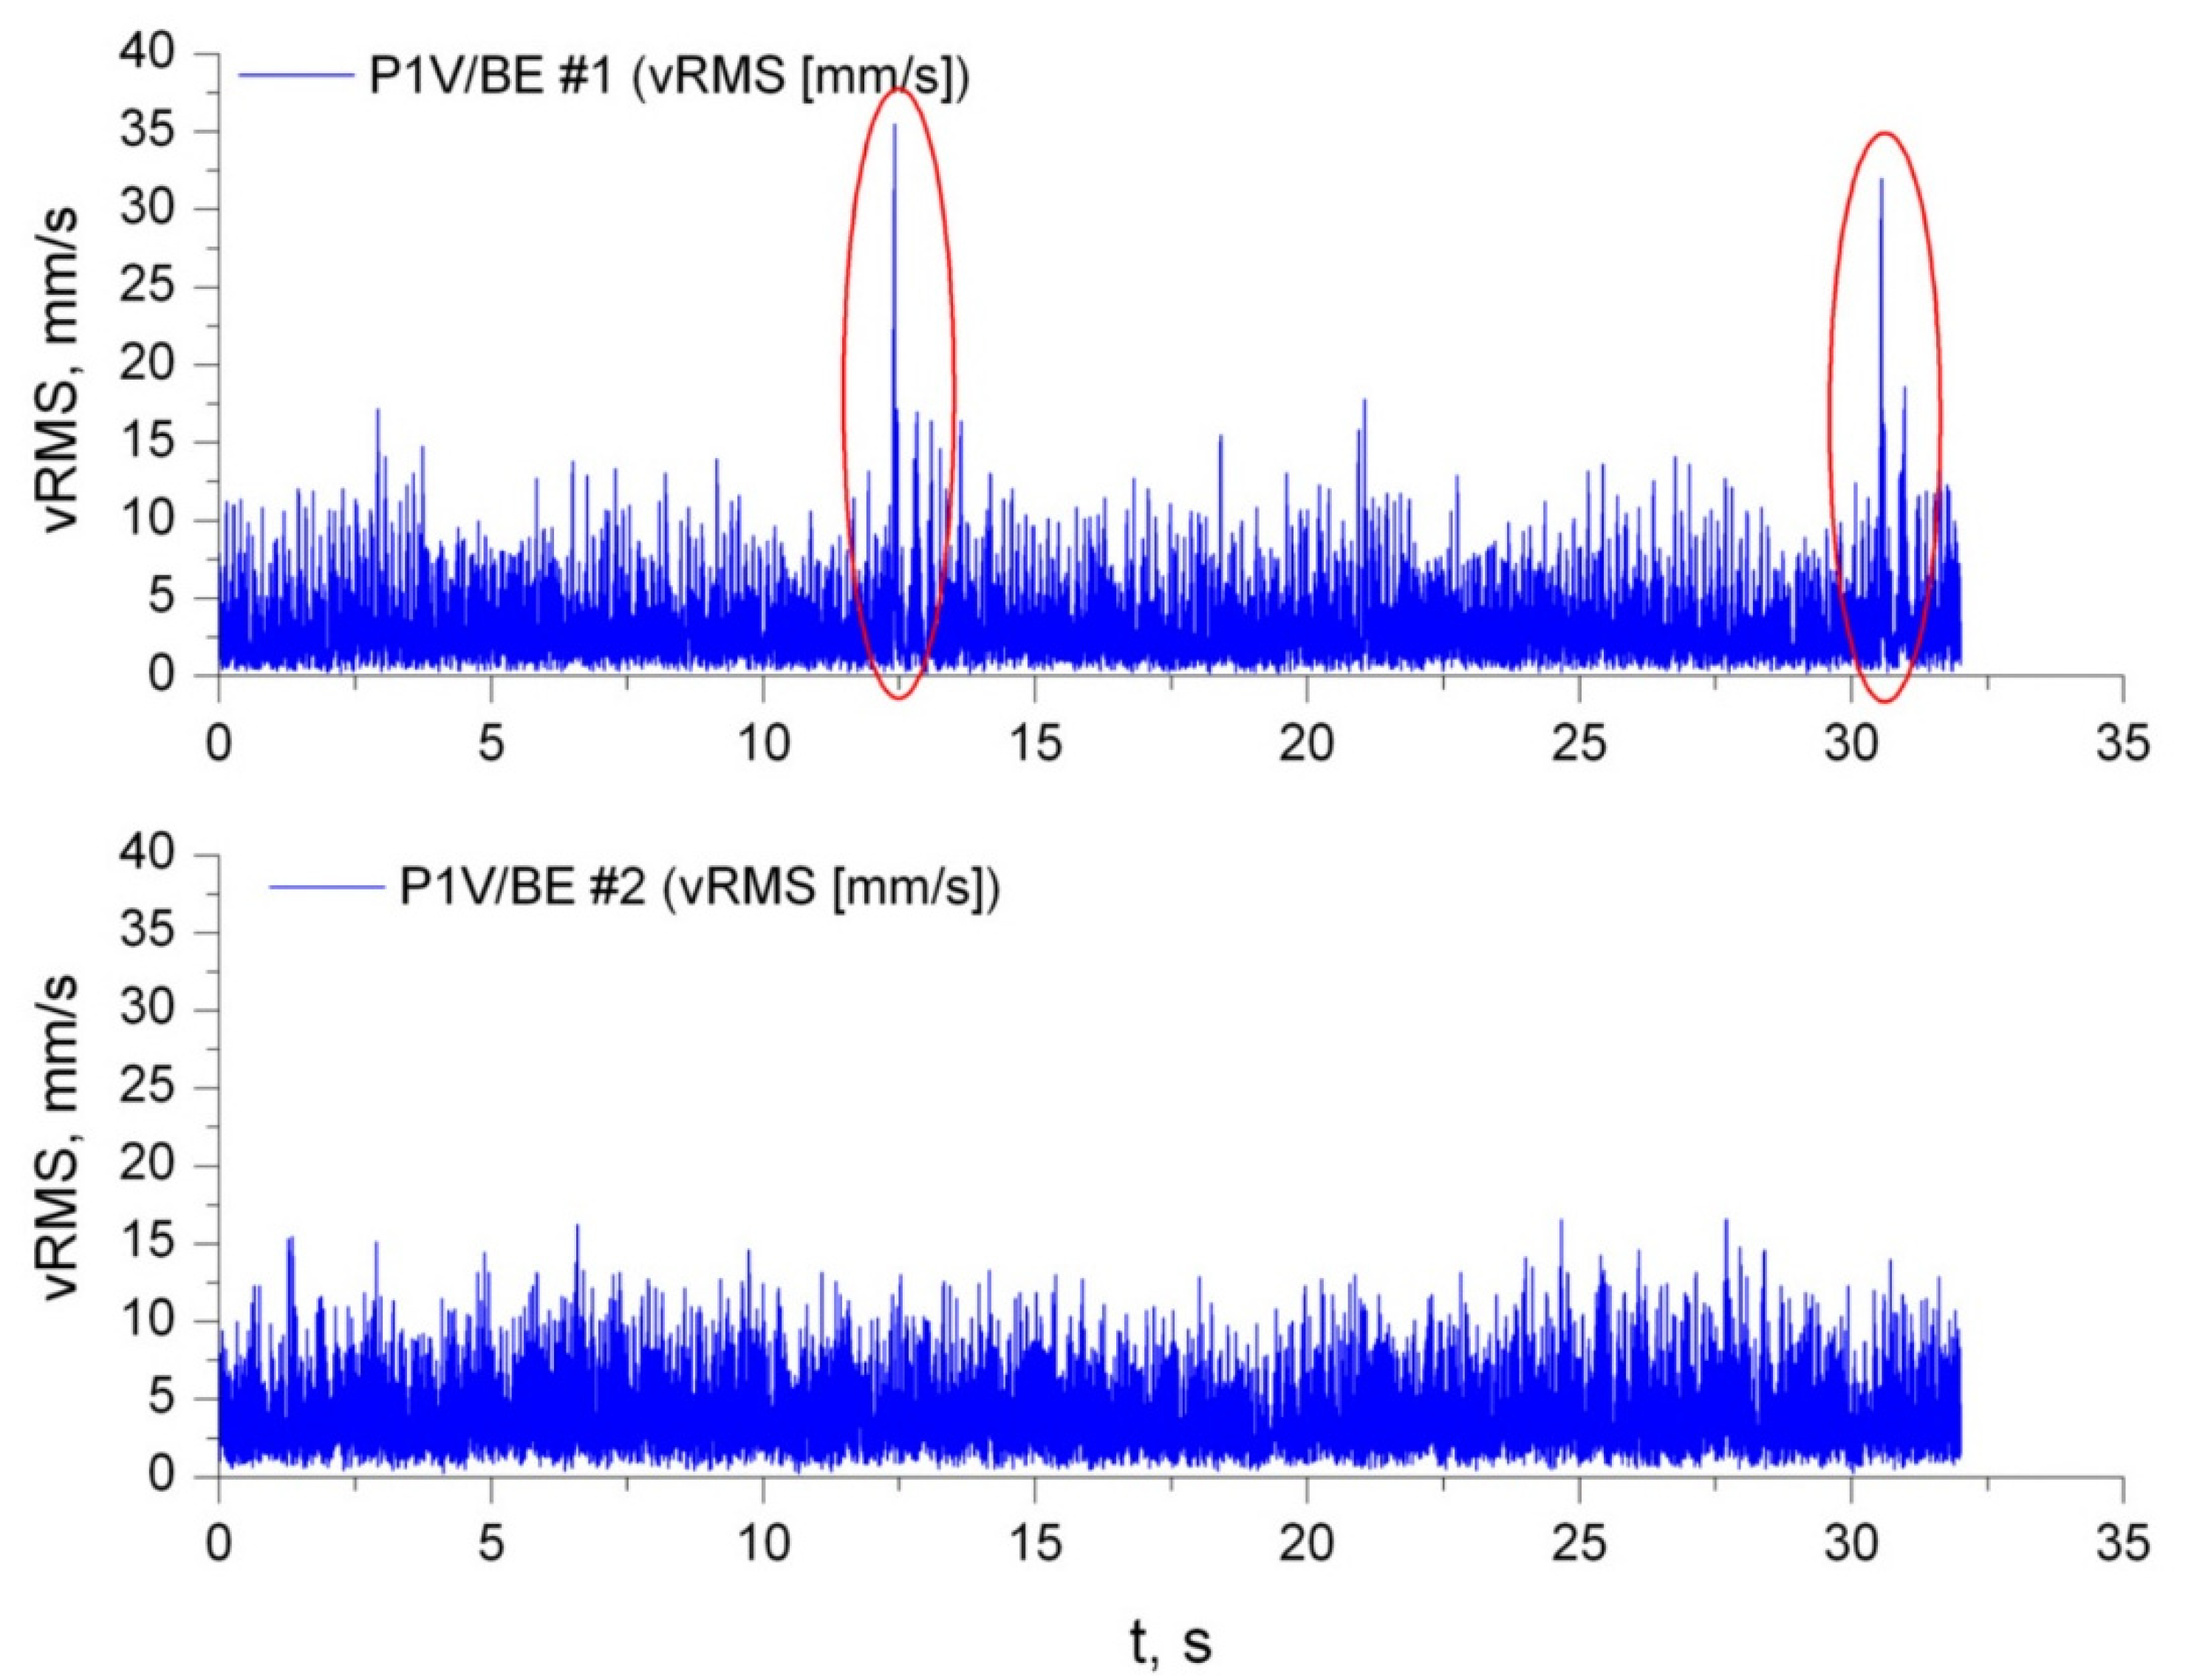
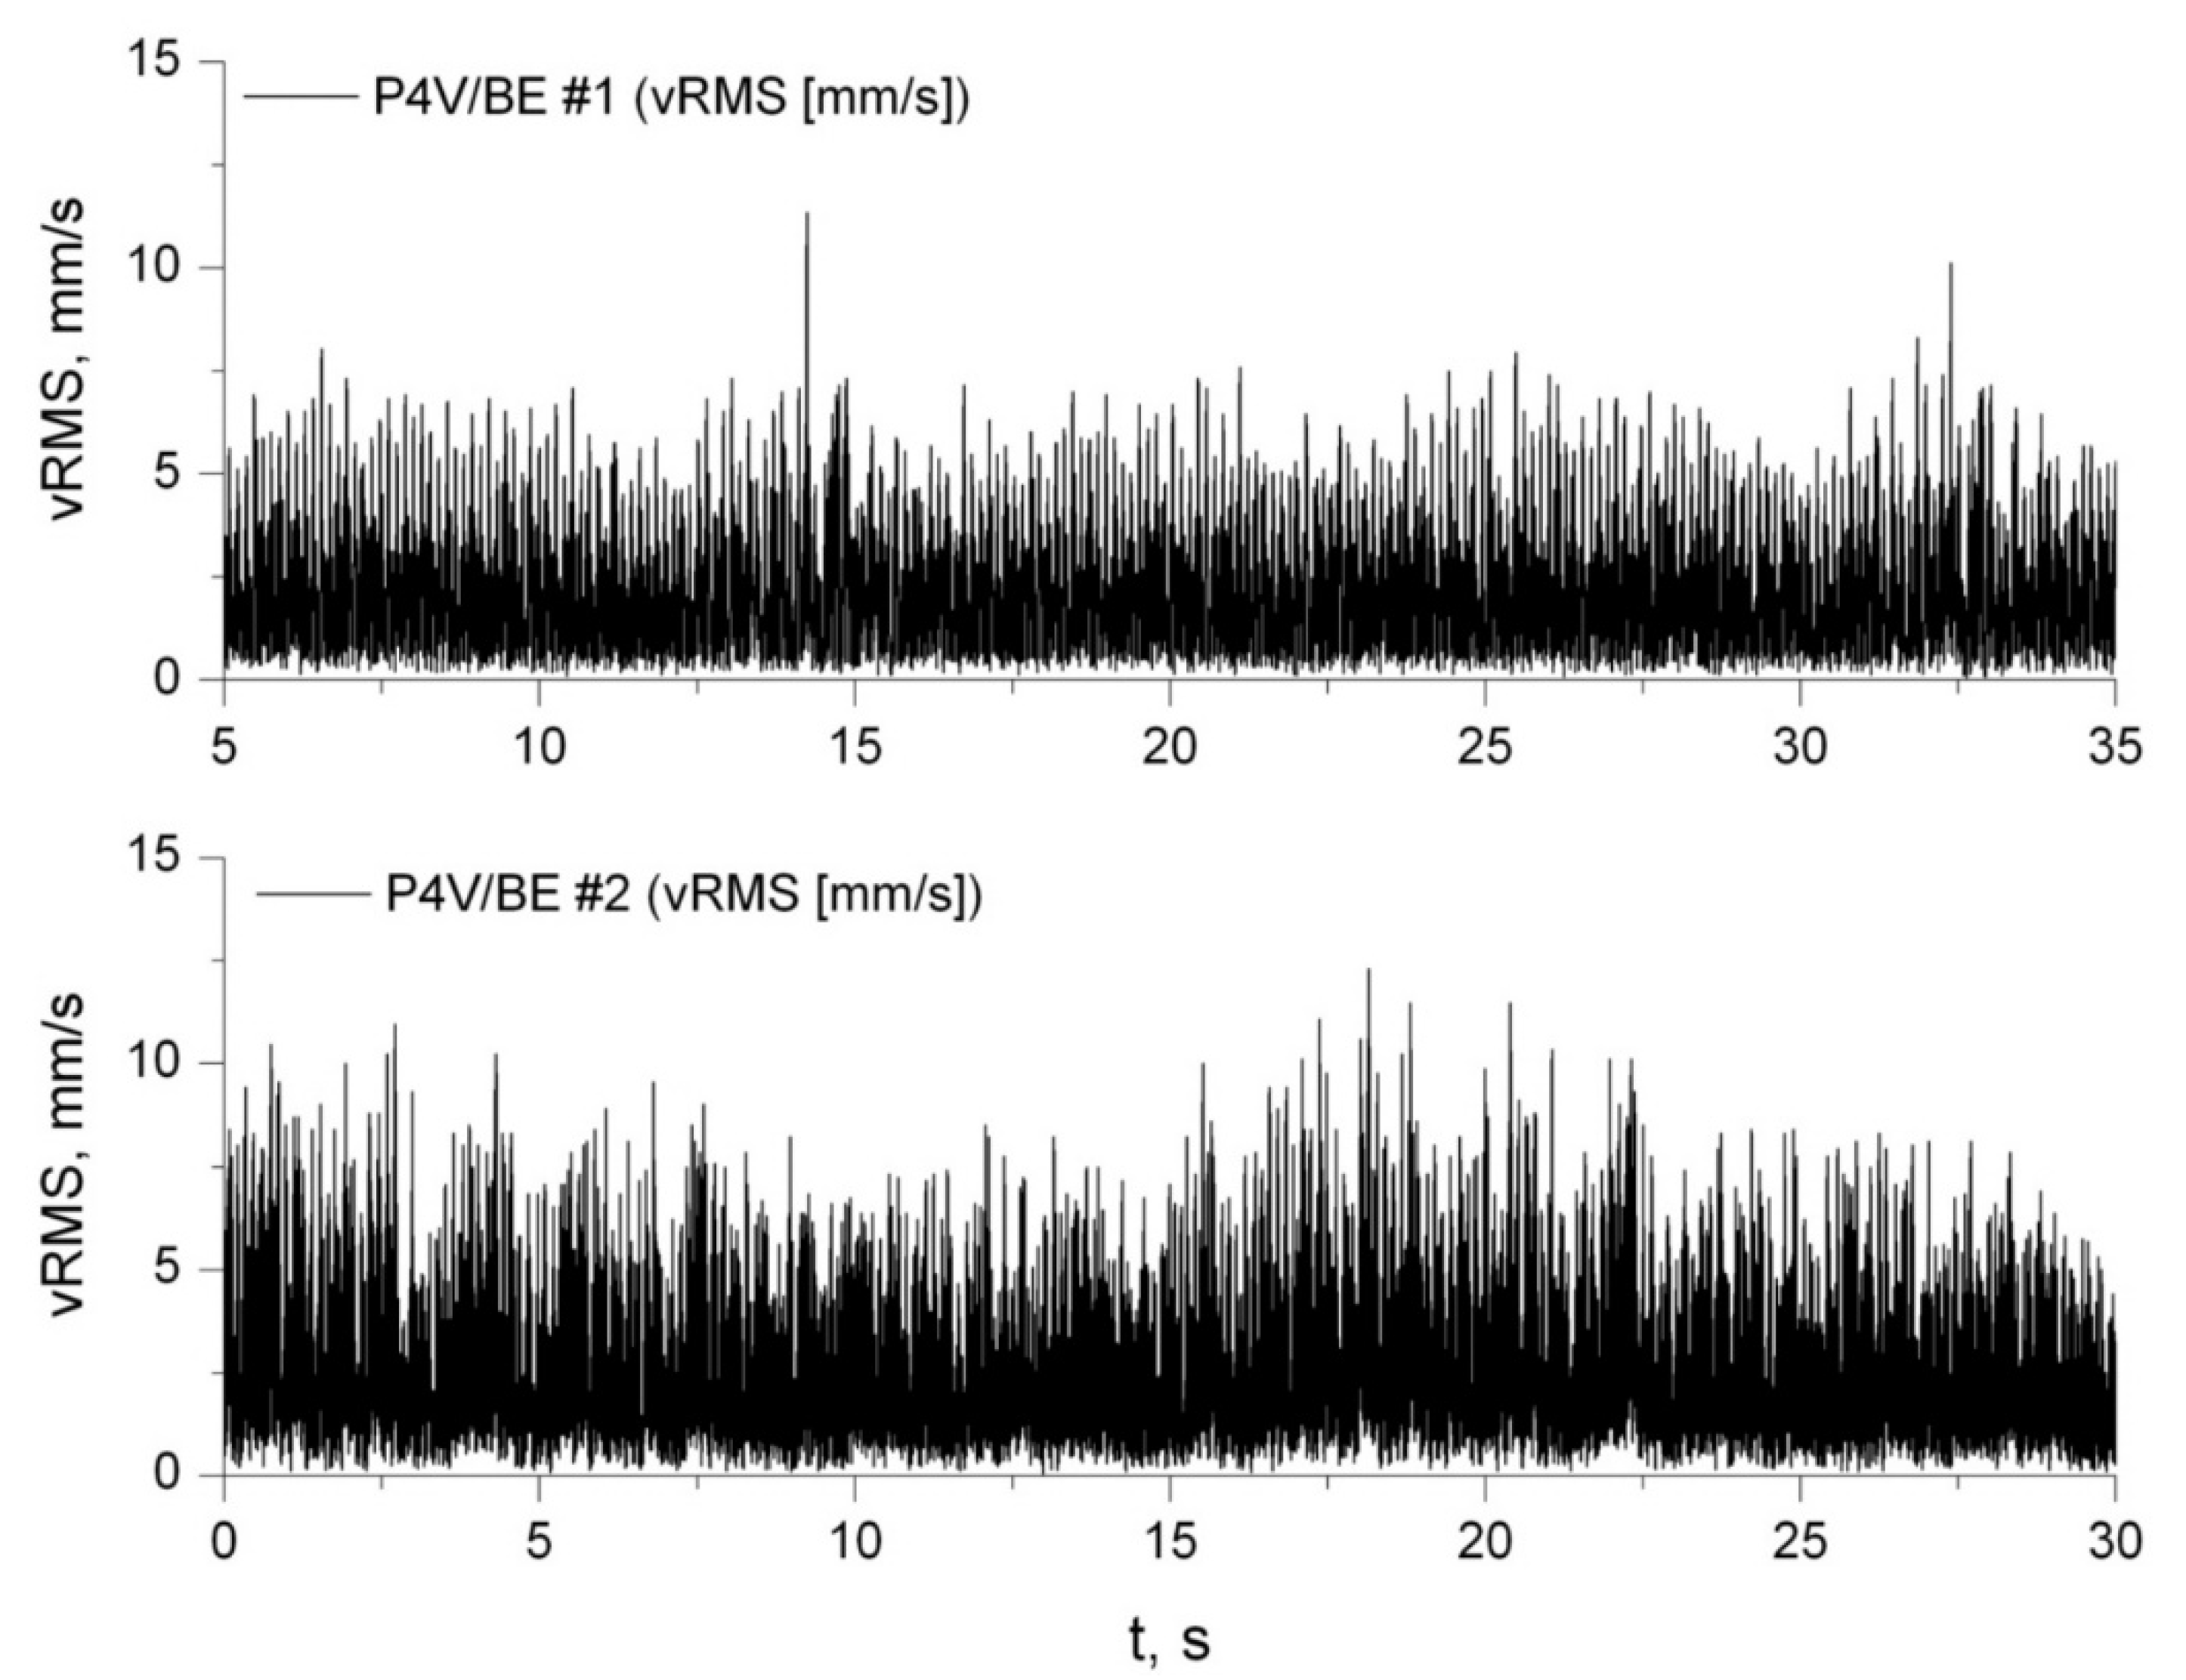
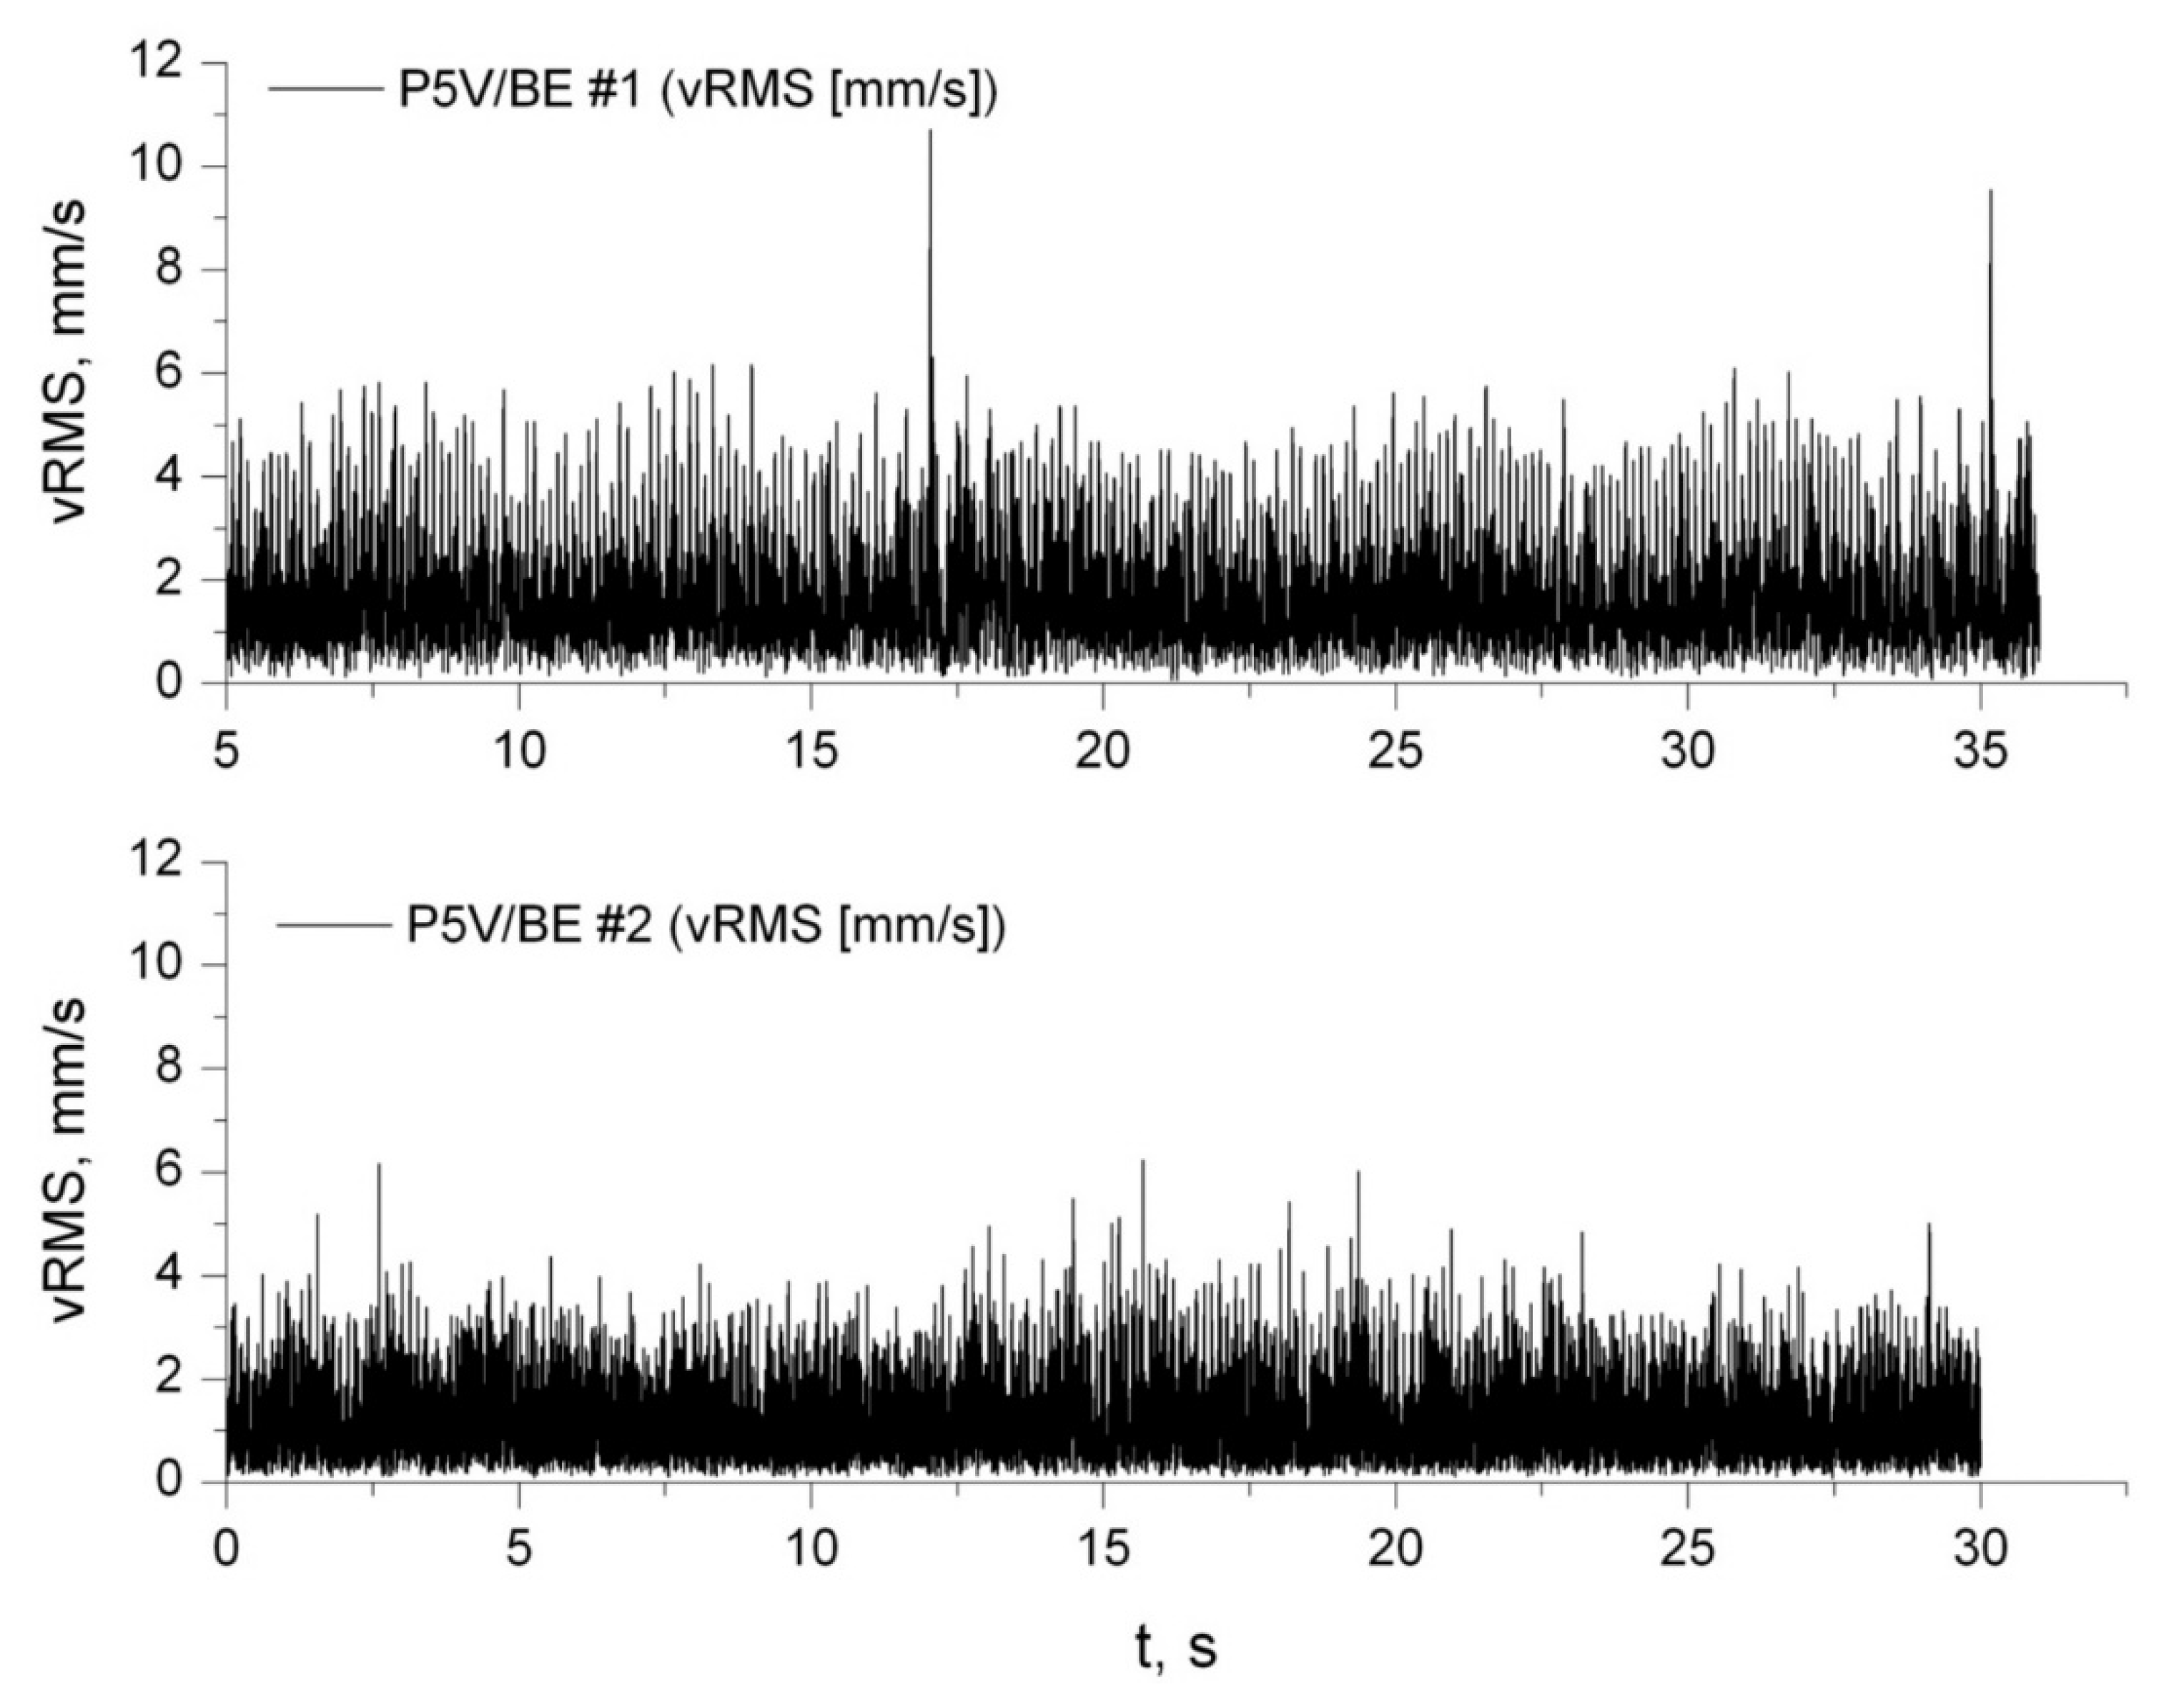
Figure 3,
Figure 4 and
Figure 5 present fragments of typical time waveforms of vibration velocity measured on the bearing housings of the tested drive units and serve as examples of the recorded results.
However, in the first bucket elevator, BE#1, there were quite high Peak values that occurred periodically in the vibration velocity signals, and they could not have been caused by the operation of the drive unit. The repeat time of these Peaks was approximately 19 s (
Figure 3), which is equal to a full circulation time of the bucket chain:
Tch =
L/
v = 19.5 s (where:
L is the length of the chain and
v is the speed of the chain).
On this basis, these Peaks were recognized as a symptom of a local defect of the bucket chain, e.g., seizure of a pin joint in chain link. This is an additional diagnostic conclusion that is not directly related to the drive unit, but to the overall technical condition of the traction system of the bucket elevator BE#1.
On the basis of a preliminary comparative analysis of the time runs, no significant differences were found in terms of the general level of vibration velocity in the bearing assemblies of the tested drive units.
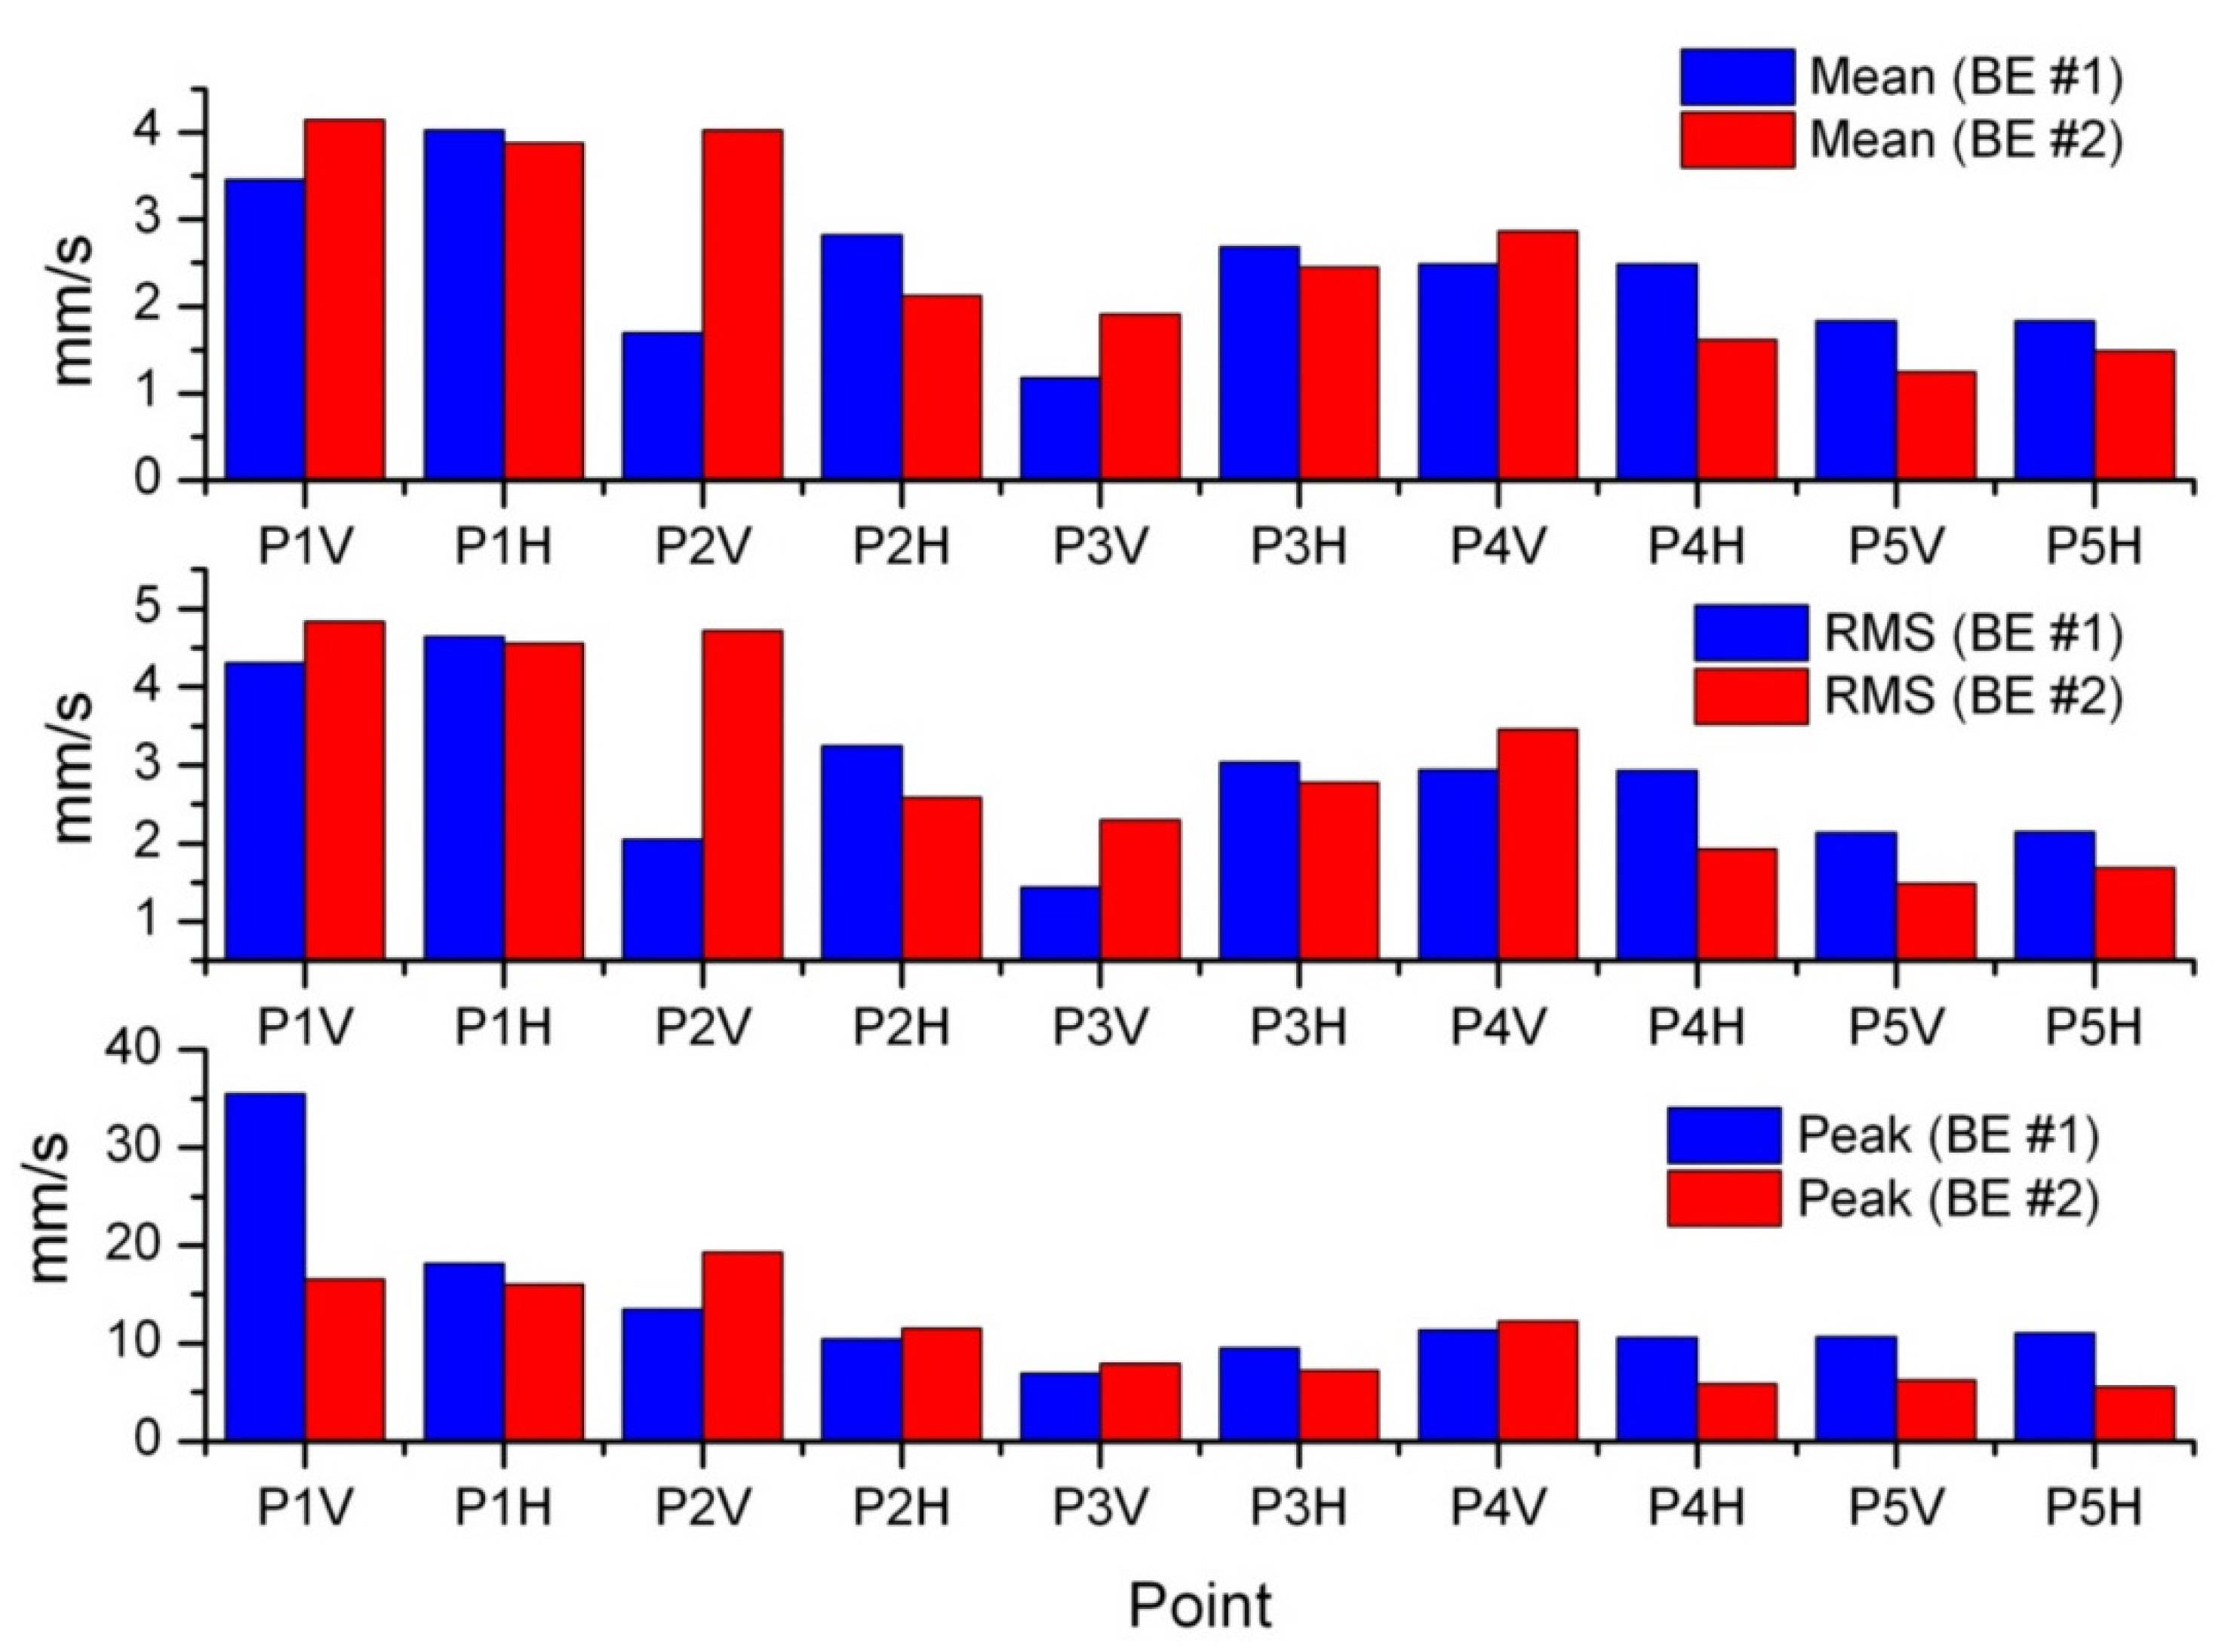
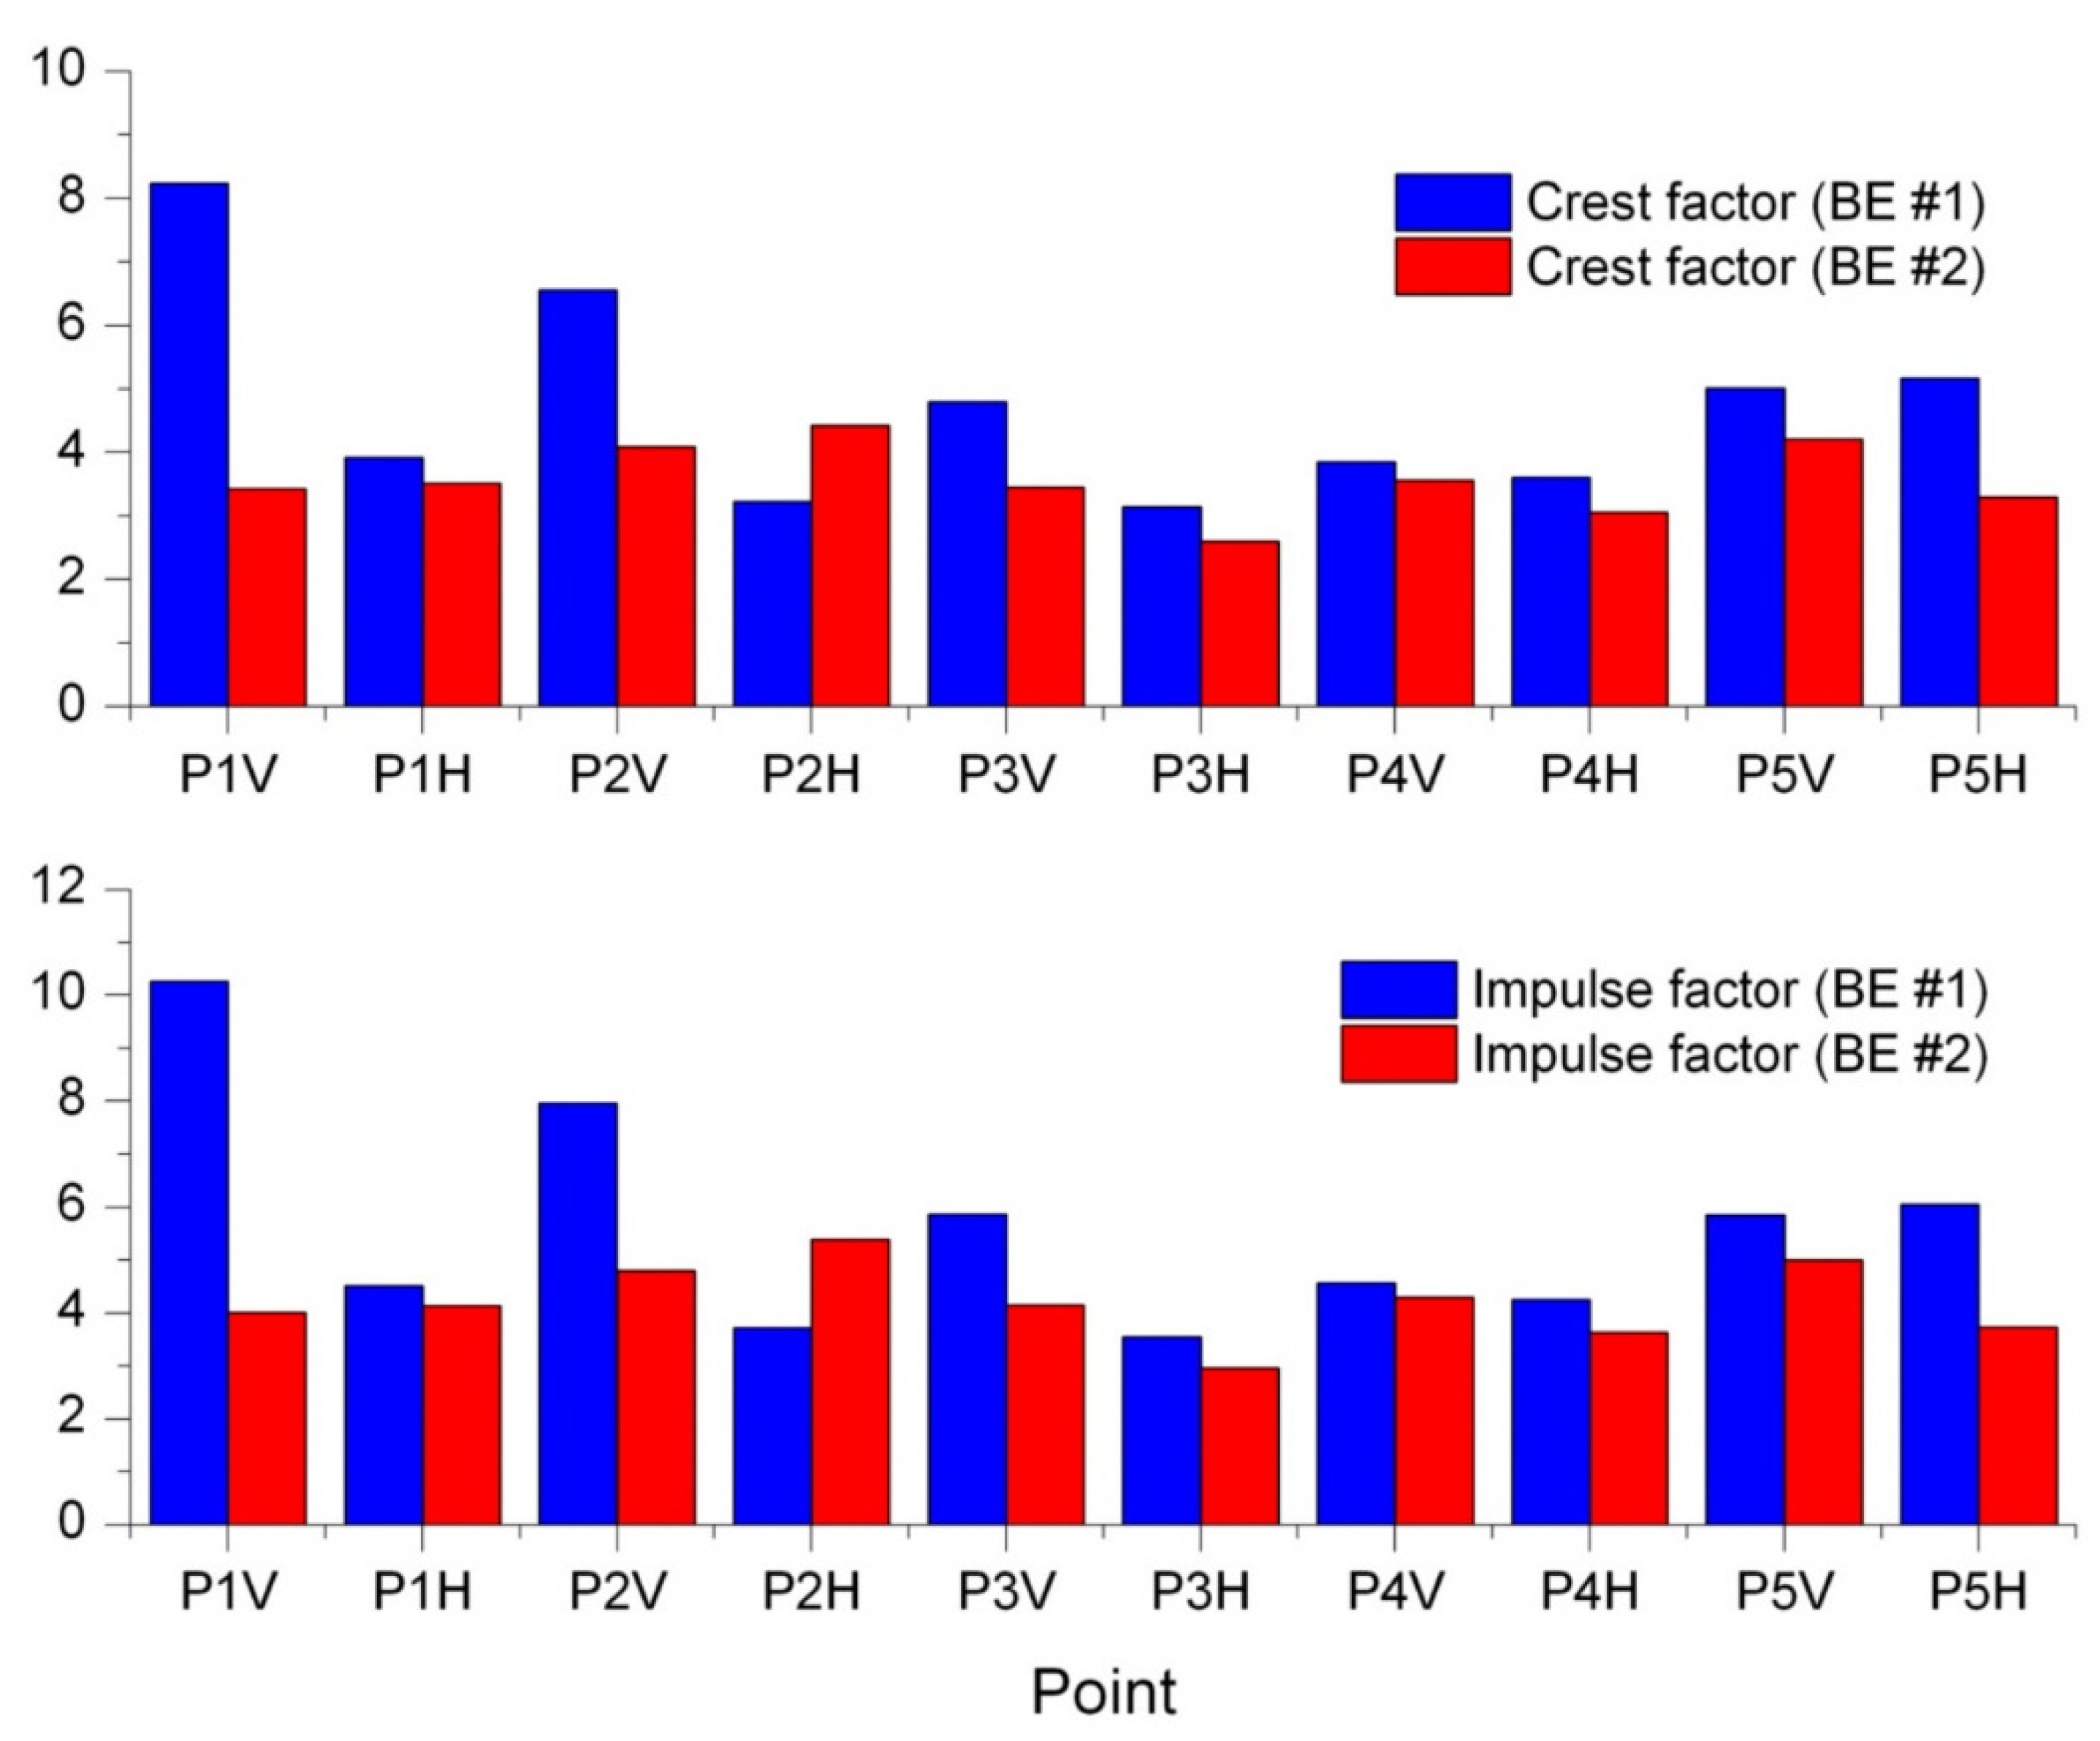
Subsequently, basic simple estimators, such as Mean Value, Peak Value, RMS, Crest Factor, and Impulse Factor were determined for each vibration signal. These estimators are more useful in the time domain analysis when assessing the technical condition of machines. The results are shown in
Figure 6 and
Figure 7.
When used as diagnostic measures, higher values of these velocity signals are considered as symptoms of a worsening condition of the drive unit under evaluation. The analysis of diagnostic signals in the time domain showed that the highest vibration intensity occurred in the motor bearing units, with slightly smaller values occurring in elevator BE#1 than in elevator BE#2 (
Figure 7).
The highest values of the Crest factor and Impulse factor measured in bucket elevator BE#1 were caused by the high Peak values of vibration velocity (
Figure 3). The higher level of vibration severity at points P1 and P2, as compared to other measuring points, was influenced by the flexible mounting of the drive units on the frame attached to the housing of the bucket elevator.
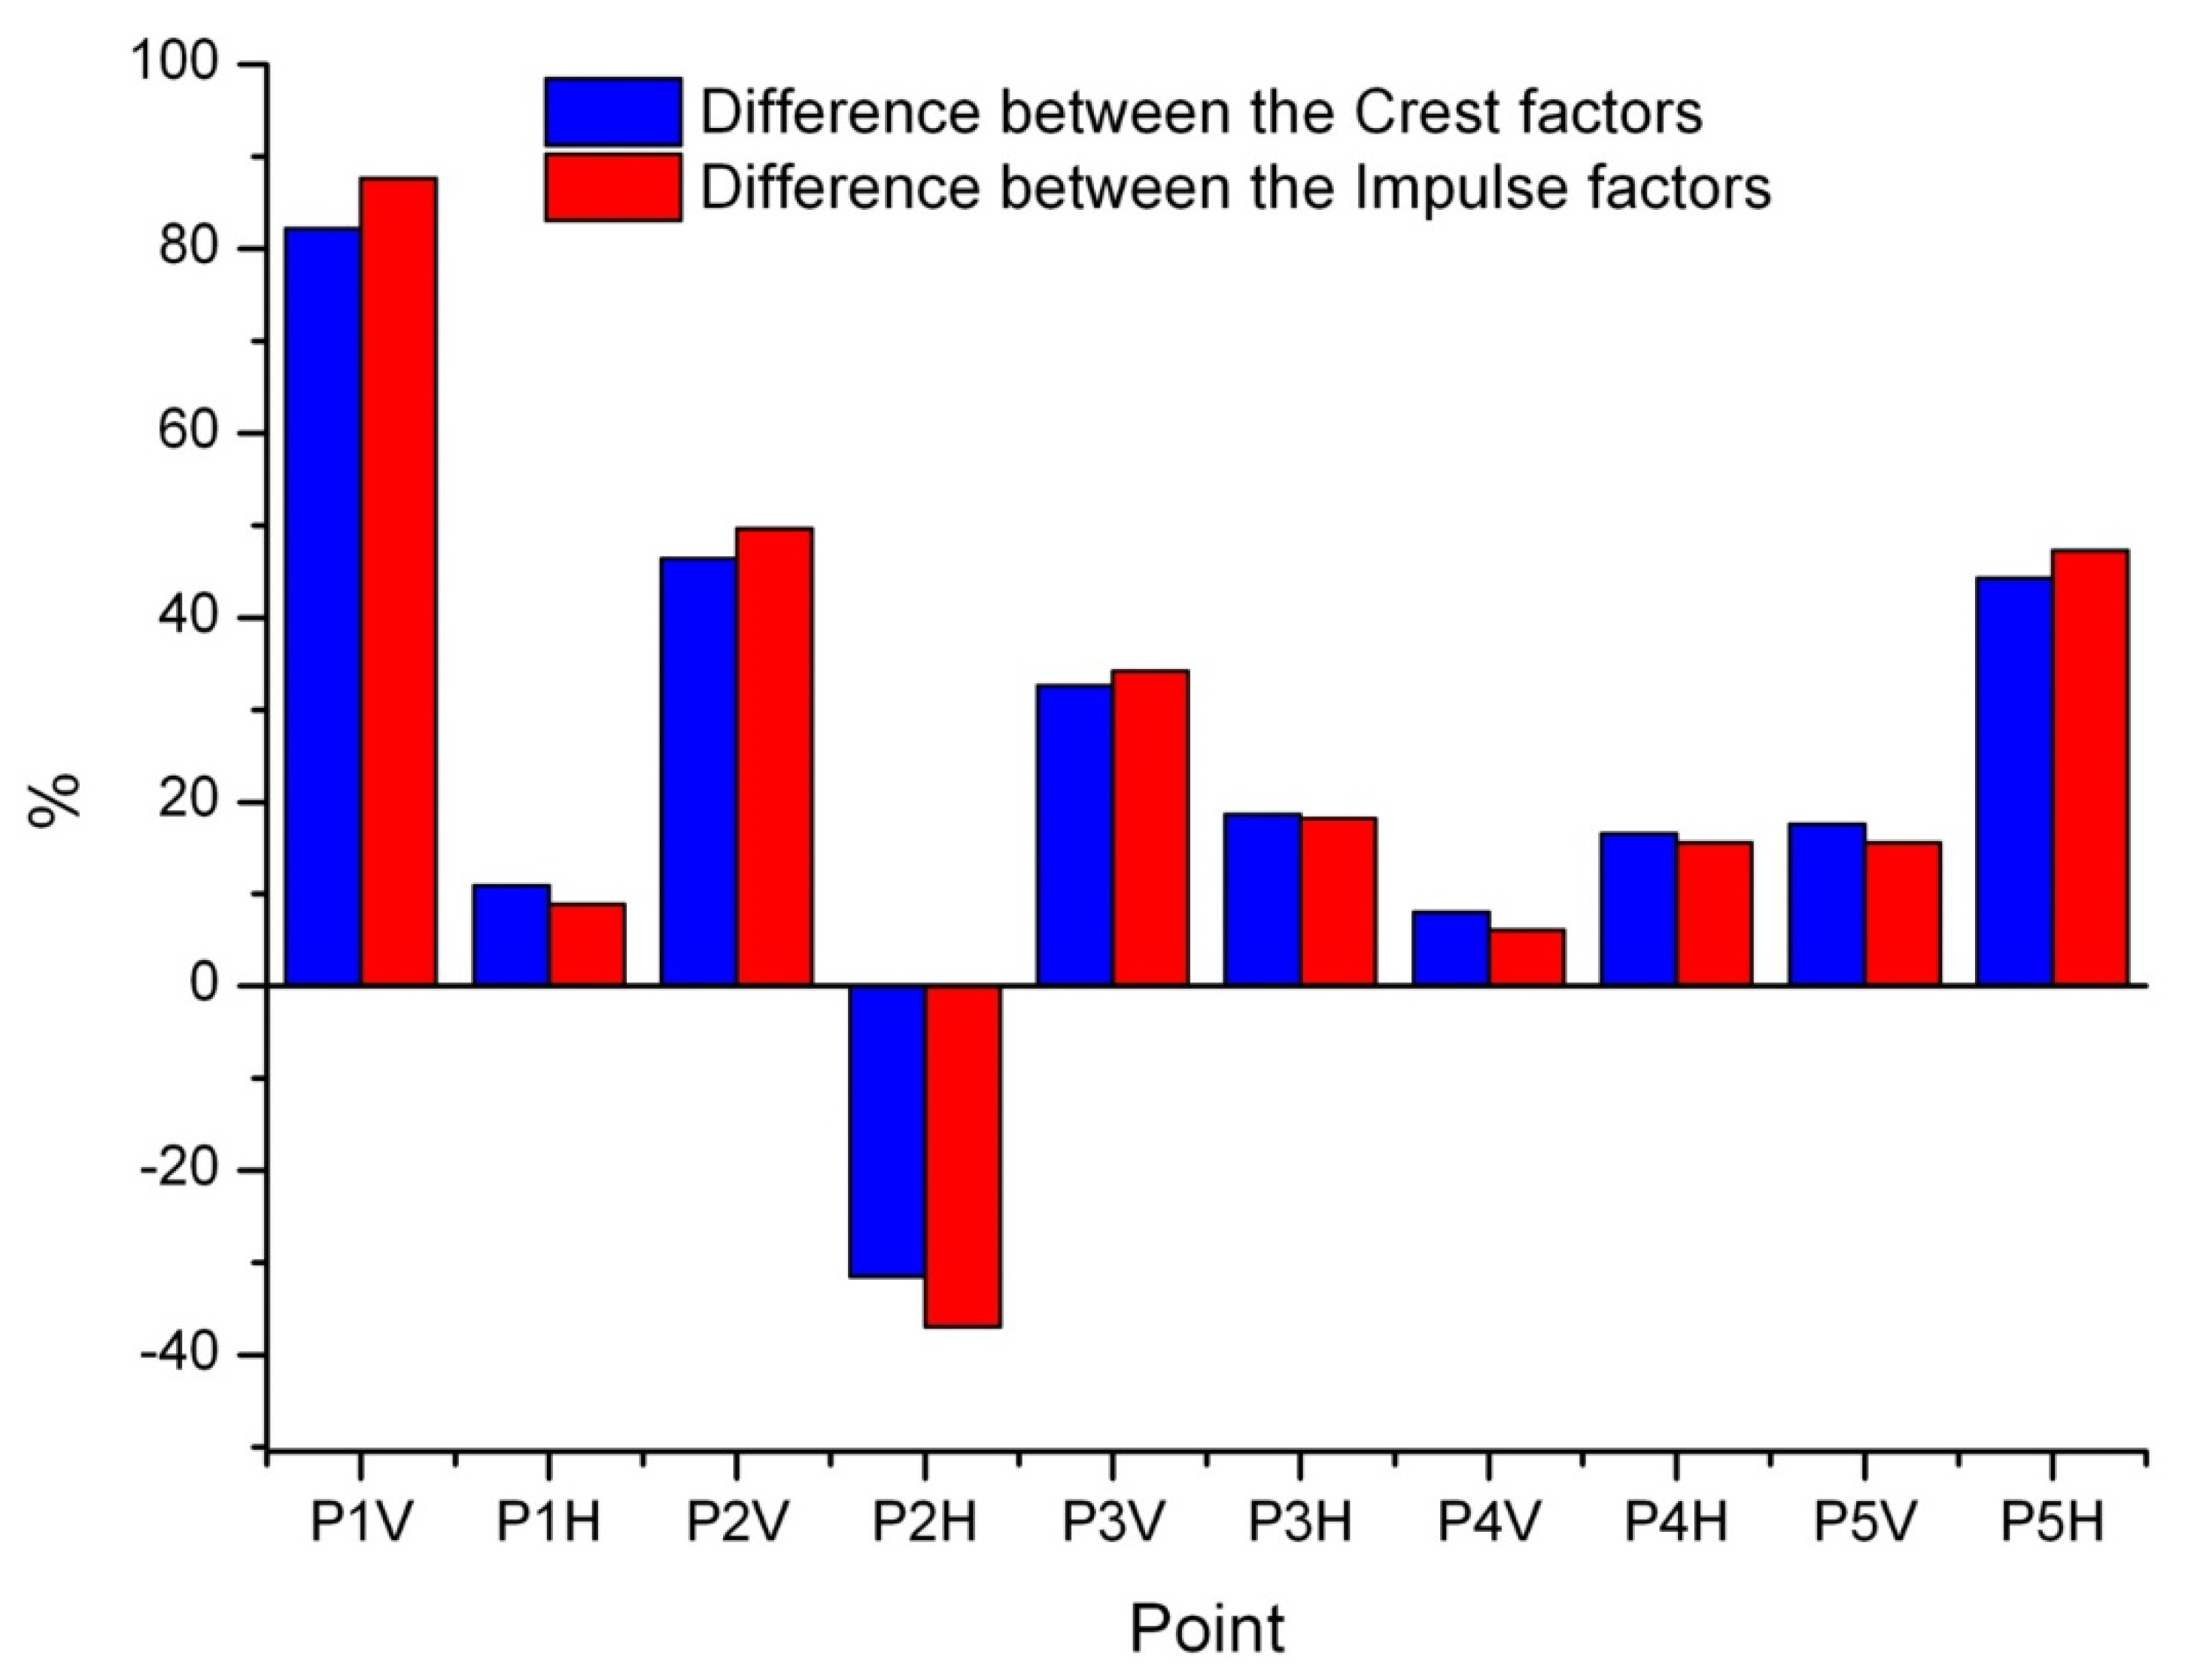
Figure 8 shows differences between the values of the Crest factor and Impulse factor at points P1 to P5 in the drive units of elevators BE#1 and BE#2. The differences between the vibration intensity level in both drive units were assessed on the basis of an additional index of relative difference
WCF adopted in this study and defined as the ratio of the difference between the Crest factor values (
CF) to their average value at respective measurement points P1–P5:
The values of the
WCF coefficient are shown in
Figure 8. A positive value of
WCF > 0 means that the Crest factor at a given point in the drive unit of BE#1 is higher (vibration intensity is greater) than the one for the corresponding point in the drive unit of BE#2 and vice versa: a negative
WCF < 0 means a lower vibration intensity in the measuring points in the BE#1 group (as compared to the BE#2 group).
To sum up, the time-based analysis showed that the condition of both drive units was not the same. Moreover, we observed that there were identifiable symptoms of local failures in the operation of the bucket chain in elevator BE#1, i.e., relative high Peaks in the values of vibration velocity (
Figure 3). If we were to diagnose bucket elevator BE#1 without this observation, i.e., solely by comparing the Crest and Impulse factors, the presence of these Peaks could have led us to conclude that its technical condition is worse than in actuality.
The maximum differences in the Crest factor and Impulse factor values occurred at P1 points (in the vertical direction) in the motor bearing units and they reached the level of 80–90% (
Figure 8). This was due to the presence of large, single Peaks of vibration velocities in bucket elevator BE#1. These peaks were identified as a symptom of local bucket chain damage, most probably a partial seizure of the pin joint.
The maximum differences in the Crest factor and Impulse factor values occurred at P1 points.
Conclusion from the time domain analysis:
A comparative assessment of both drive units made in the time domain on the basis of the Crest factor and Impulse factor showed that the BE#1 drive unit was characterized by higher vibration severity, which means that it was in a worse technical condition than the drive unit of the BE#2 elevator.
4.3. Analysis in the Frequency Domain
The time based analysis of the vibration velocity waveforms was the first step in the assessment of the technical condition of the tested power units.
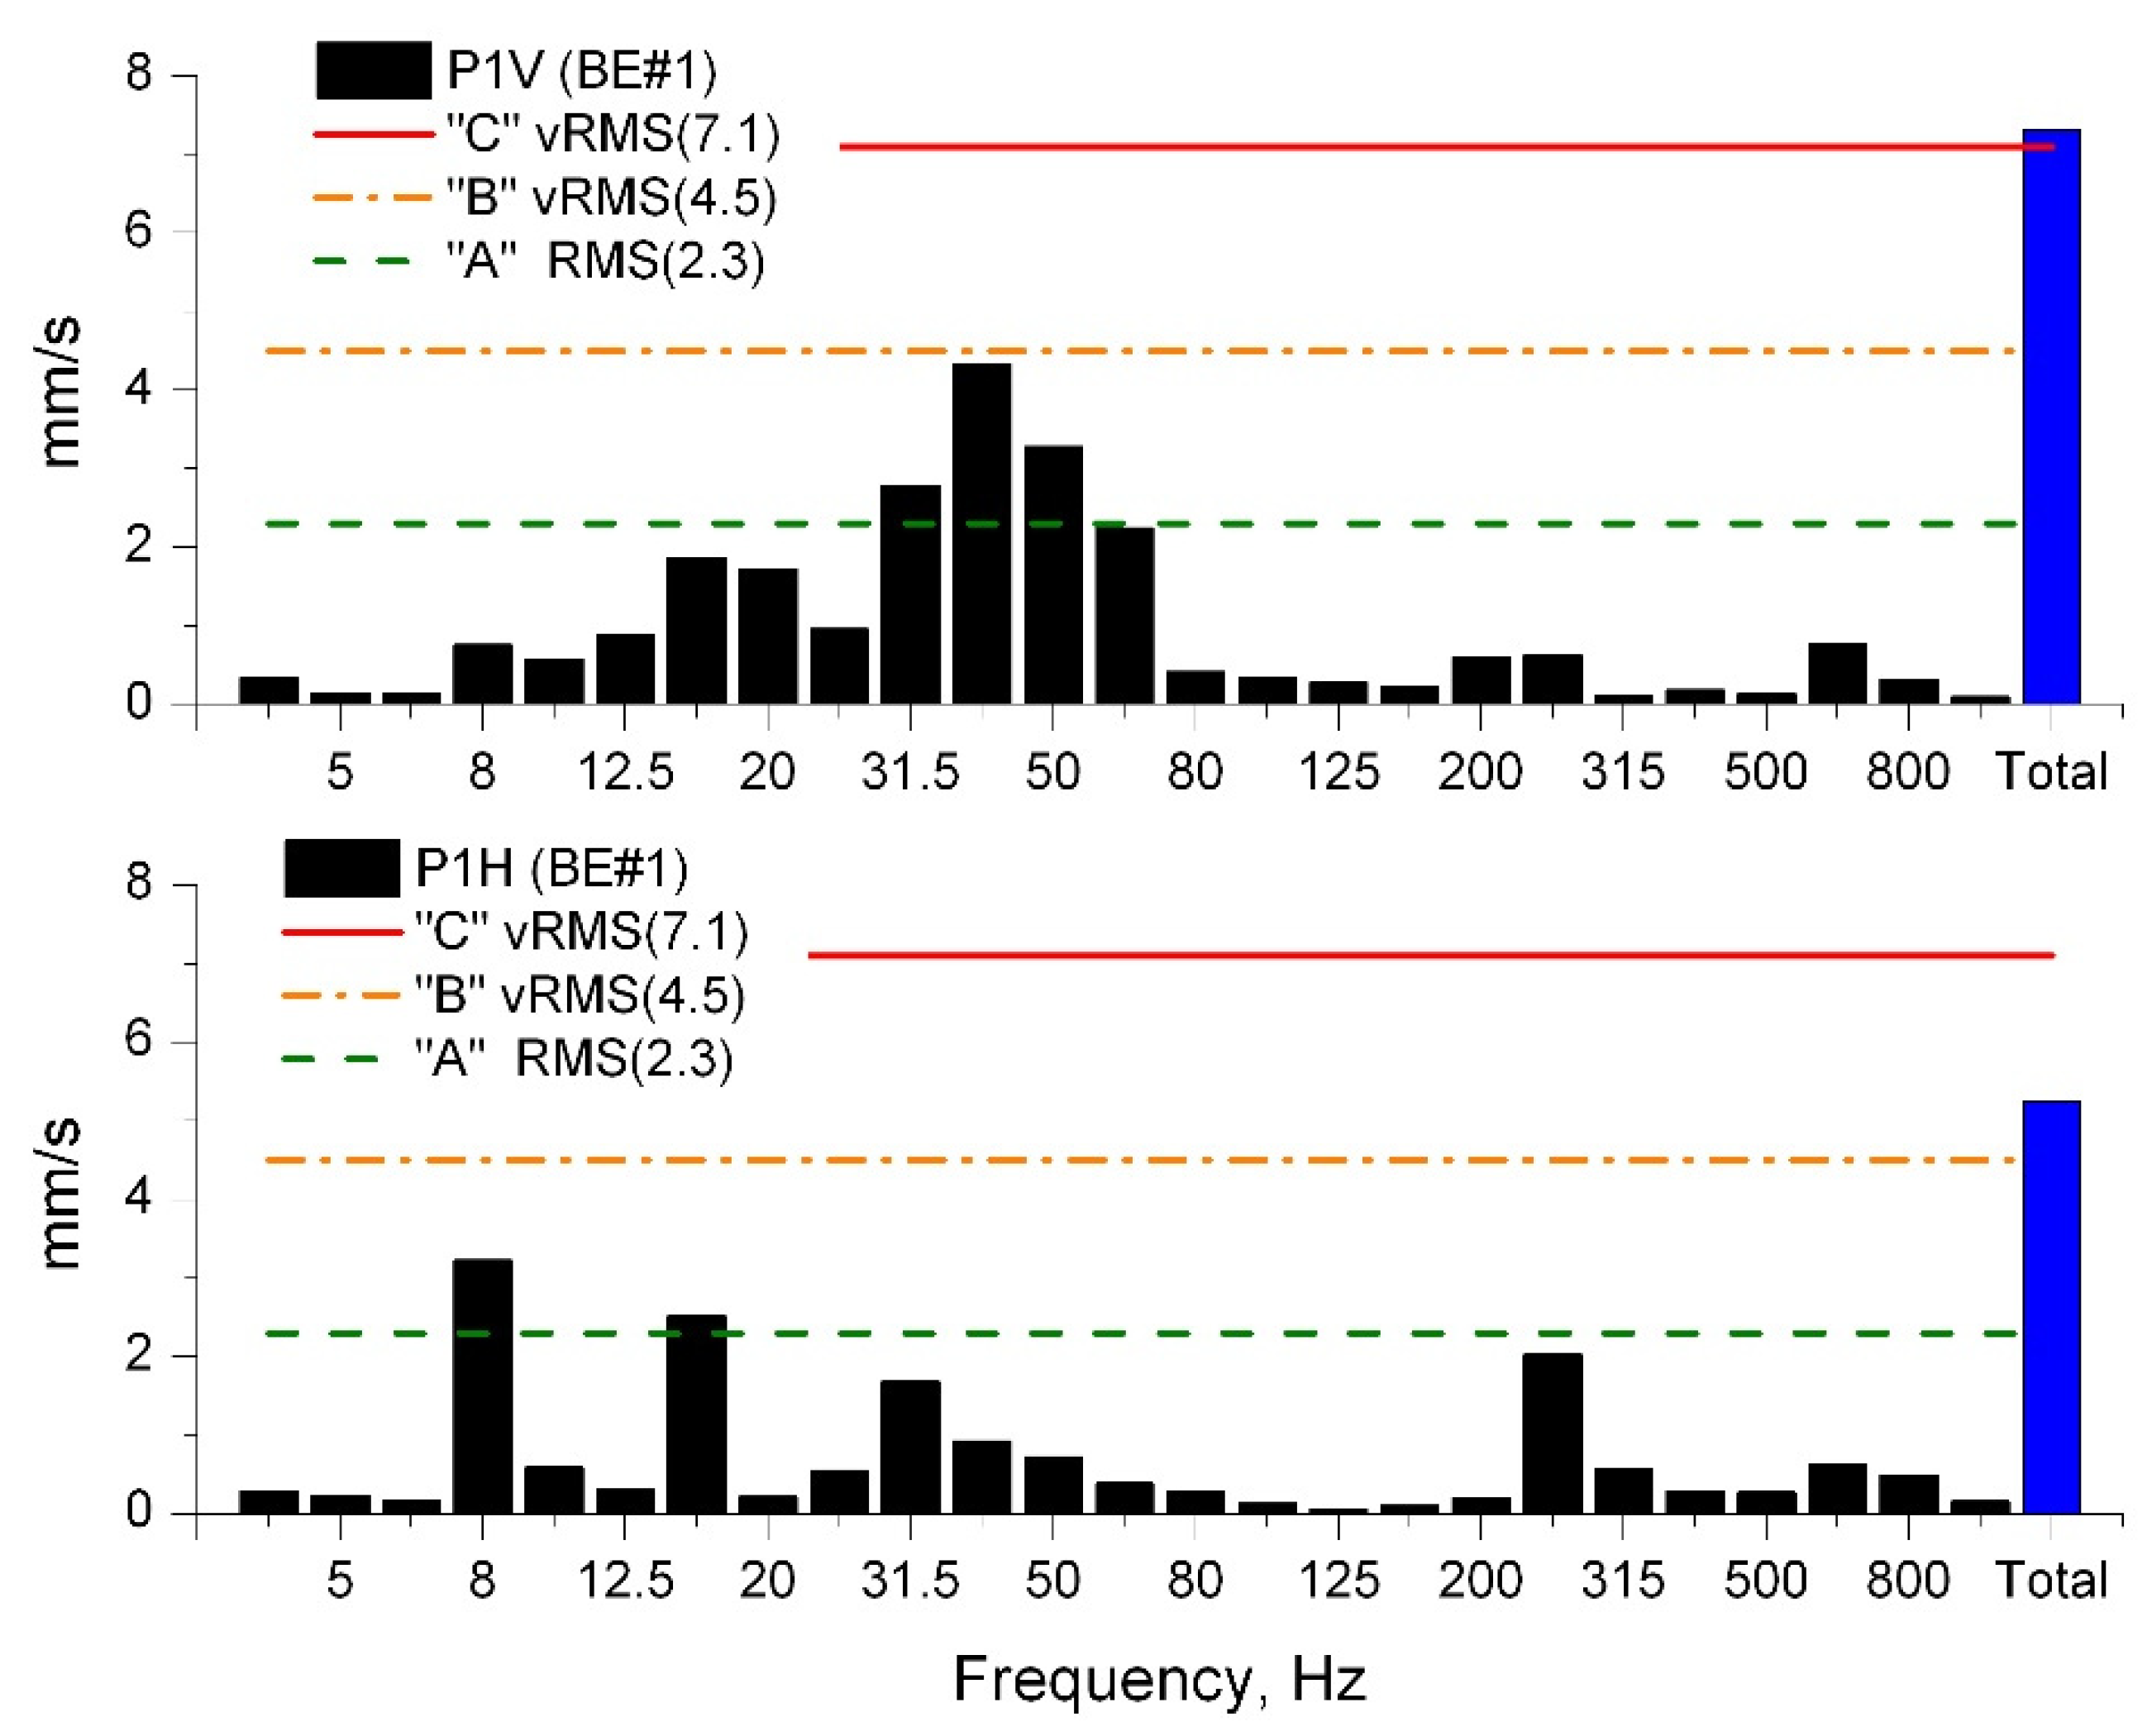
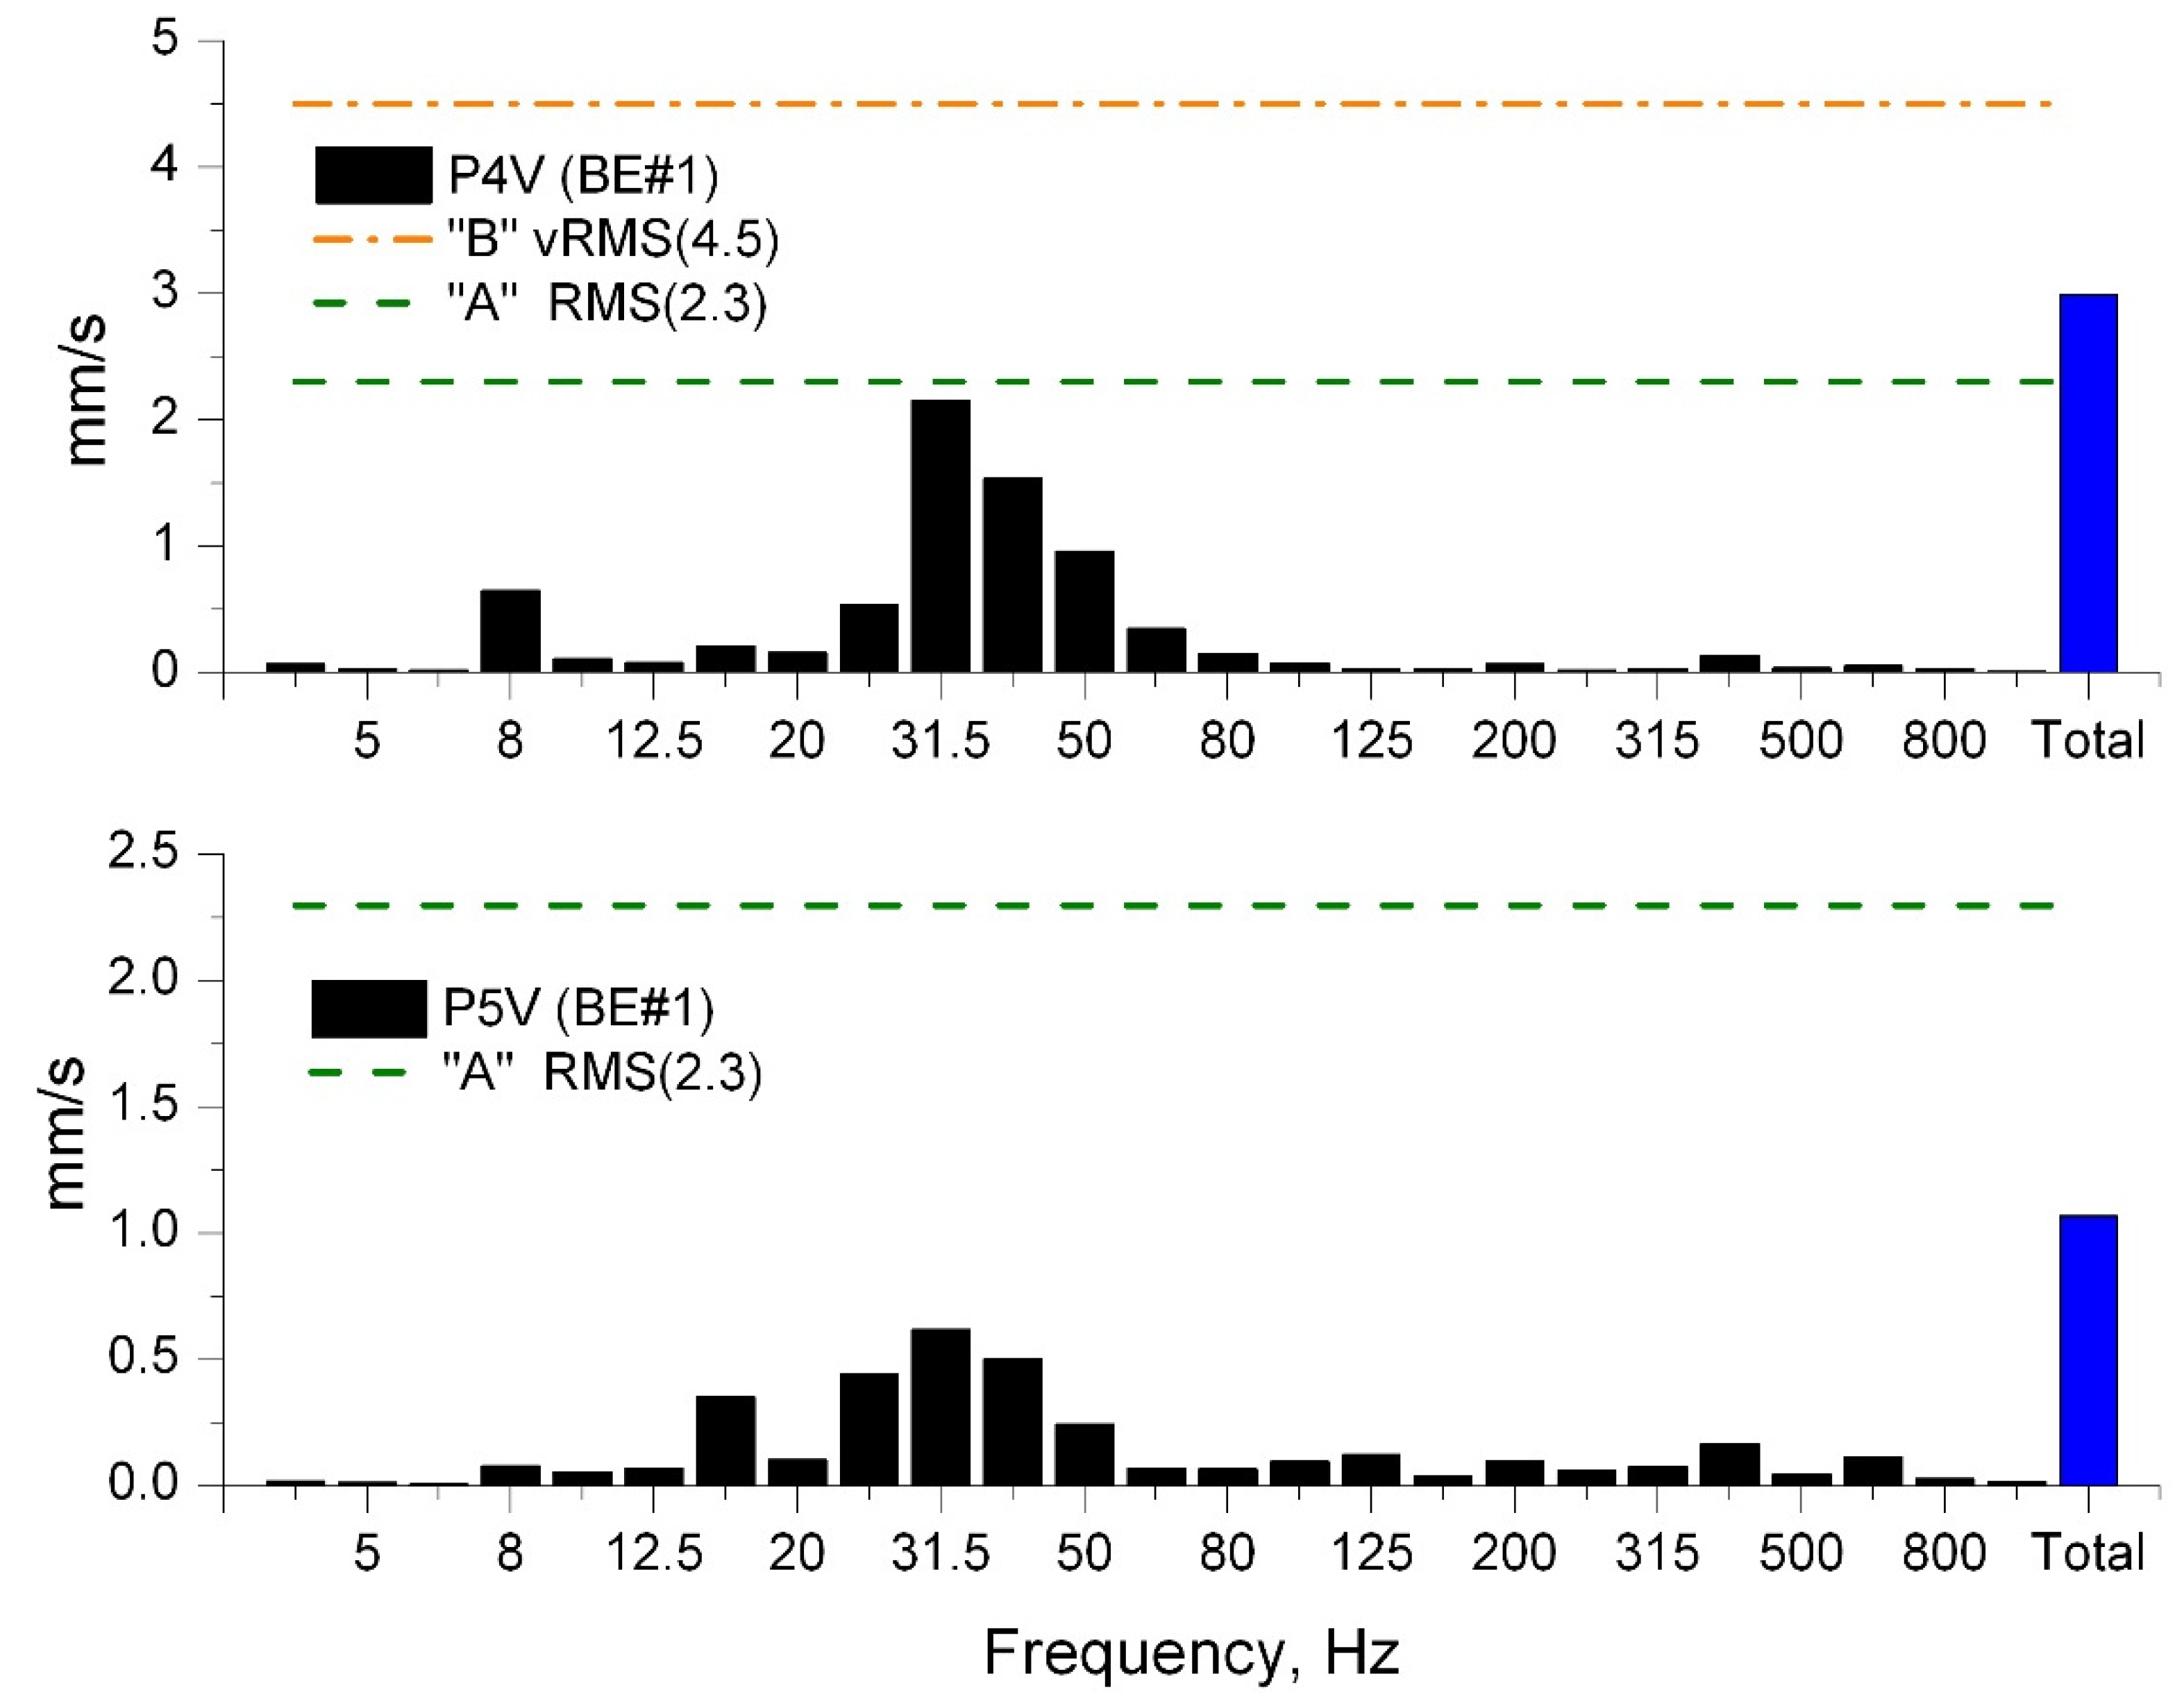
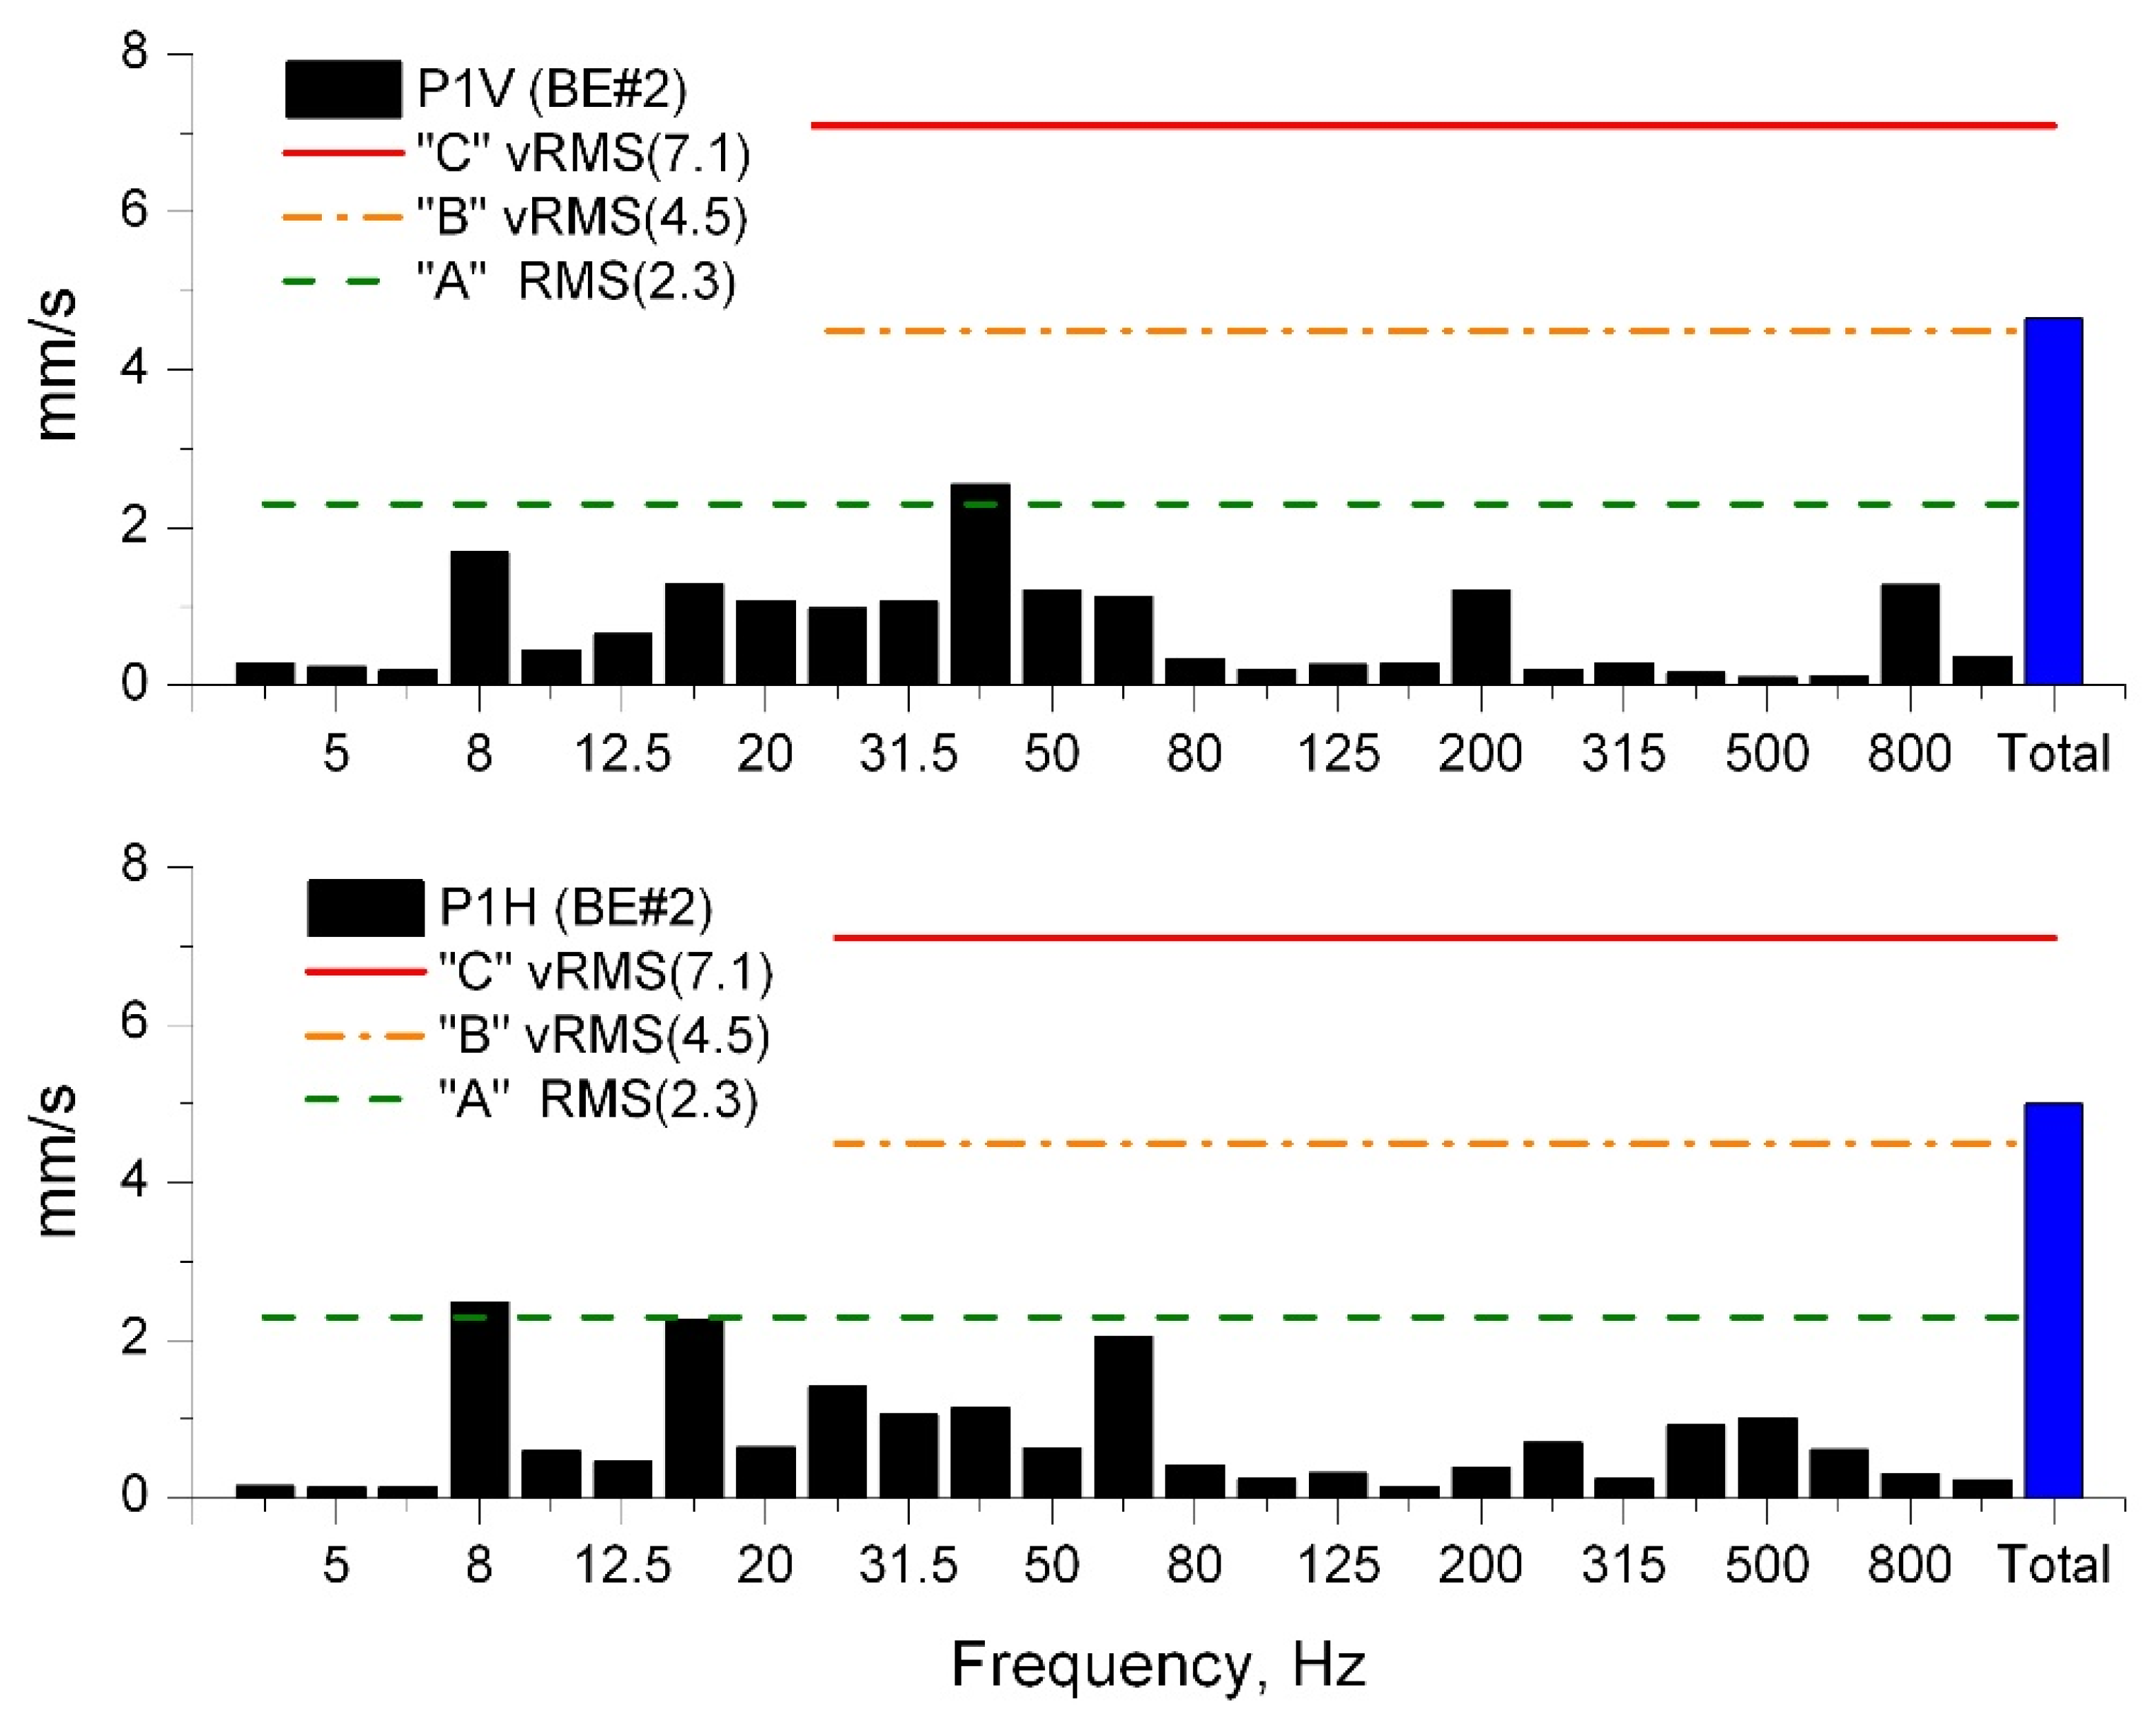
The second step involved the analysis of diagnostic signals in the frequency domain and was carried out using broad-band vibration velocity spectra (the 1/3 Octave spectra).
The broad-band frequency analysis of vibration velocity signals was performed according to the basic recommendation of the ISO-10816-3 Standard.
The 1/3 Octave analysis was performed in the range from 1 Hz to 10 kHz for all the points P1 to P5 in both tested drive units. Examples of the results of this analysis are presented in
Figure 9,
Figure 10,
Figure 11 and
Figure 12 where the upper limits for the zones “A” to “D” of vibration severity were also marked by relevant lines (dash, dash-dot or solid).
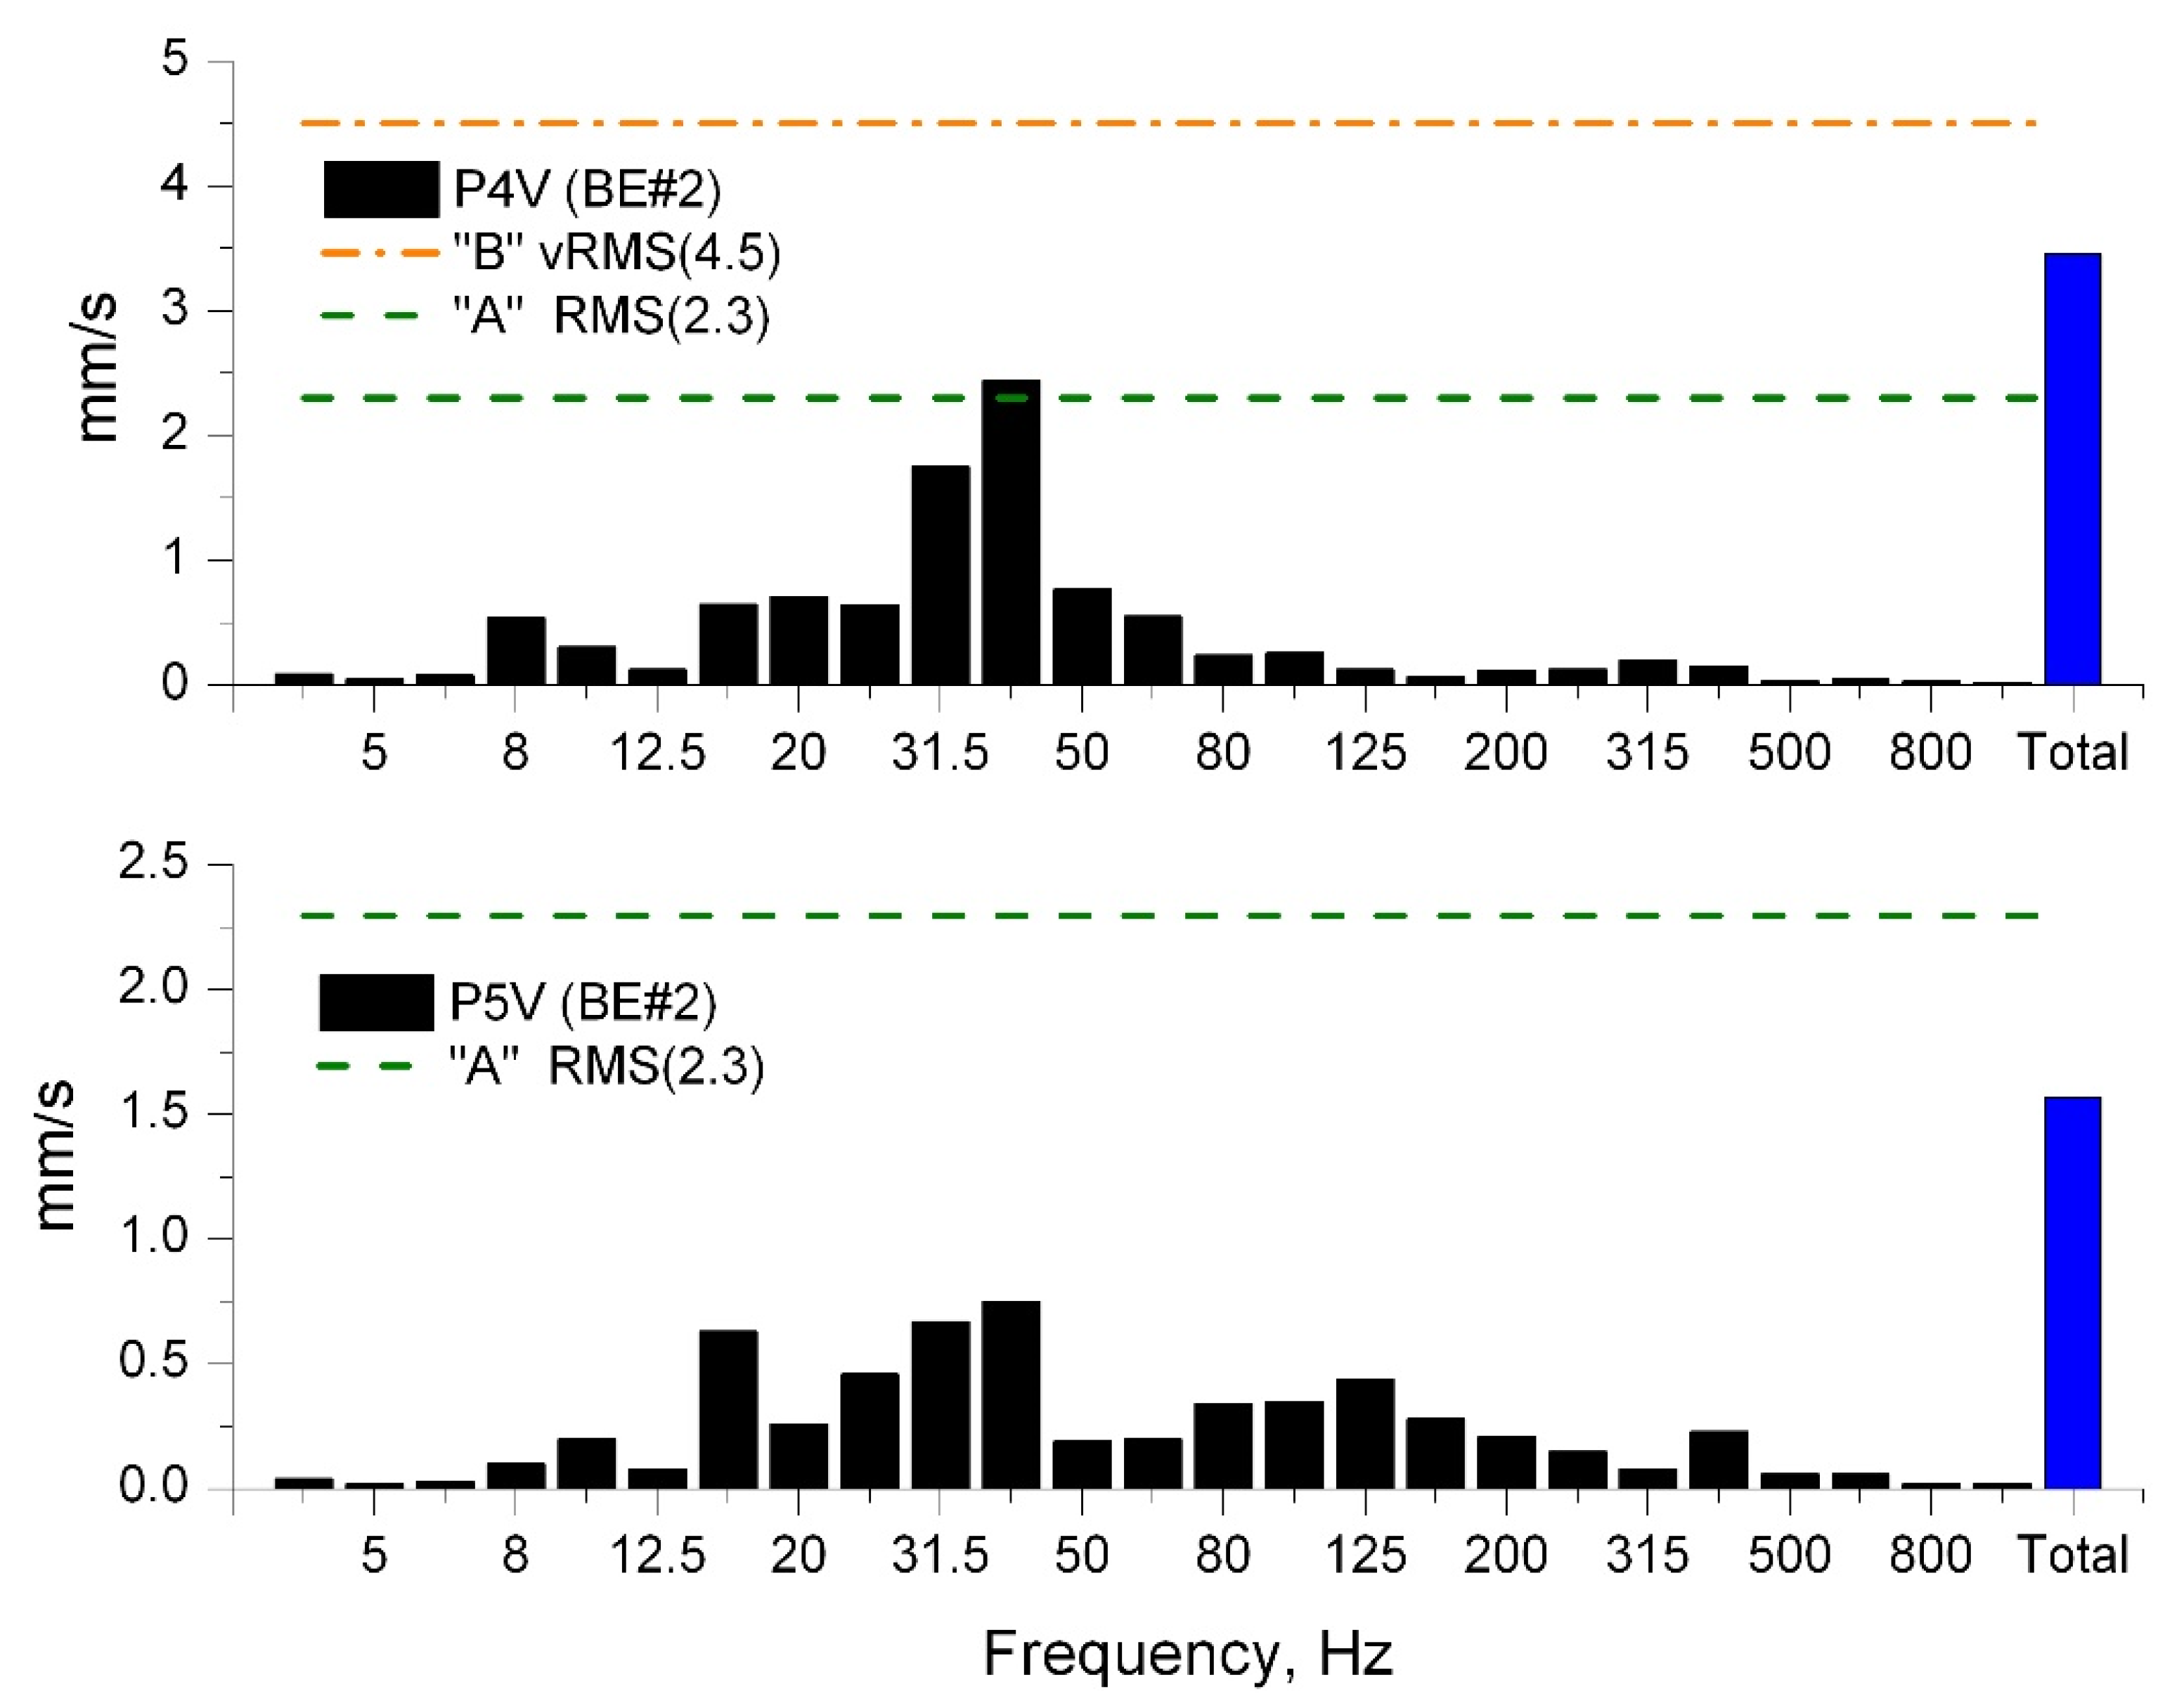
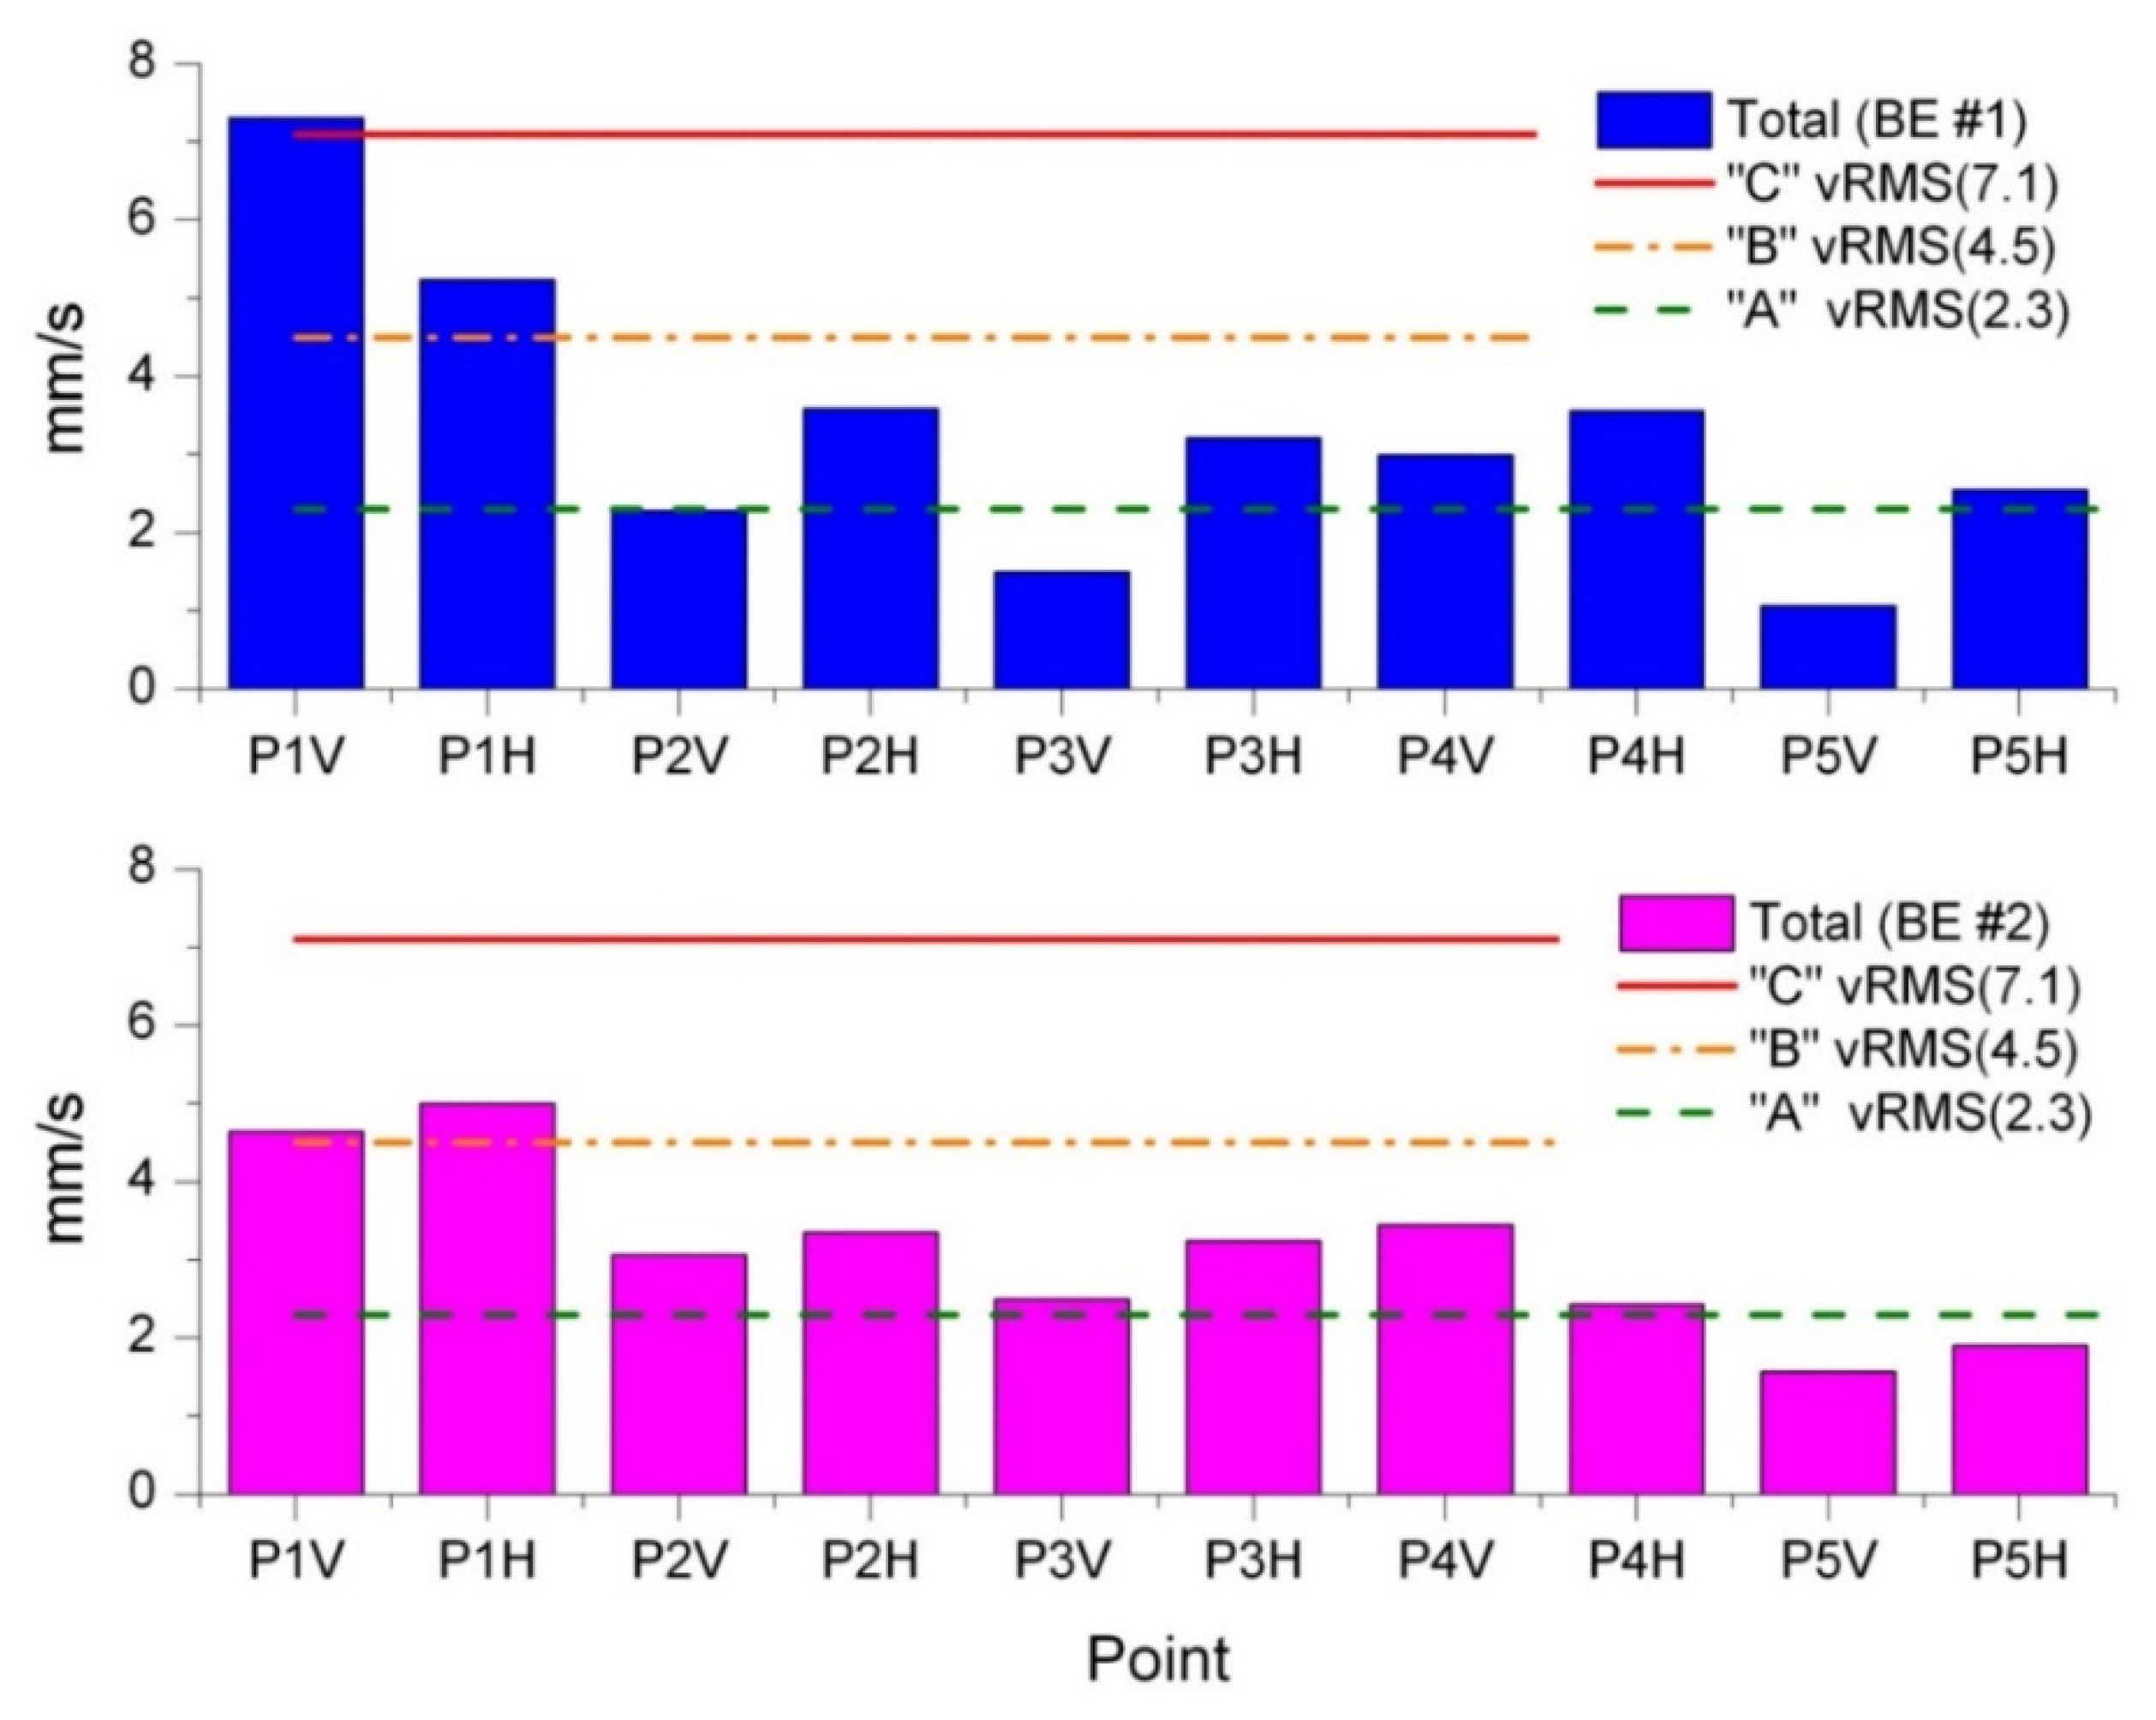
The broadband analysis of the vibration velocity at the measurement points shows, among others, that the highest vibration intensity during the operation of both bucket elevators occurred in the bearing units of the drive motors (
Figure 13). This conclusion is consistent with that of the diagnostic evaluation made on the basis of the time domain analysis.
The broadband analysis of the vibration velocity at the measurement points shows that the vibration severity of both tested elevators was virtually equal. Only for measurements in the vertical direction at point P1V of bucket elevator BE#1, the total value of vibration velocity was higher in comparison with point P1V on bucket elevator BE#2. This difference was caused by high peaks generated by the local defect of the bucket chain in elevator BE#1 (
Figure 3).
In the context of the requirements formulated in the ISO-10816-3 standard, it was found that the vibration intensity at the tested points did not exceed the upper limit of state “B”. This means that both power units are generally within the zone, which is considered acceptable for unrestricted long-term operation (
Table 3).
However, the above does not hold true for the bearing units of both electric motors, in which the vibration intensity exceeded the upper limit of zone “B” (reaching zone “C”) and even exceeded the upper limit of zone “C” (reaching zone “D”), as presented in
Table 3.
However, these relative higher vibration velocity values at point P1 in both elevators BE#1 and BE#2 (
Table 3) did not result from the operation of the tested drive units, but were caused by the vibration of support frames mounted to the elevator casings, which are made of steel sheets. As a result, vibrations caused by the operation of the elevator were directly transferred to the pedestal and increased the vibration severity in the measurement points located in the drive unit.
Moreover, there was a local defect in the bucket chain in elevator BE#1 that caused quite high Peak values of vibration velocity. These peak values occurred periodically and were observed especially in points P1 and P2 located on the electric drive motor (
Figure 3).
However, if we adopt less restrictive requirements regarding the vibration intensity level, e.g., the acceptable vibration velocity
vRMS (8.0) = 8.0 mm/s as shown in
Table 2, then the results obtained in P1 and P2 measurement points in the bearing units of both electric motors meet the criteria for long-term use in both drive units.
Diagnostic signals were subjected to narrowband frequency analysis with the use of Fast Fourier Transform (FFT) to identify the dominant frequencies forming the signals in respective measurement points P1–P5.
To filter out interfering frequencies from the measuring signals and extract diagnostically useful components, the autocorrelation function was used, followed by FFT.
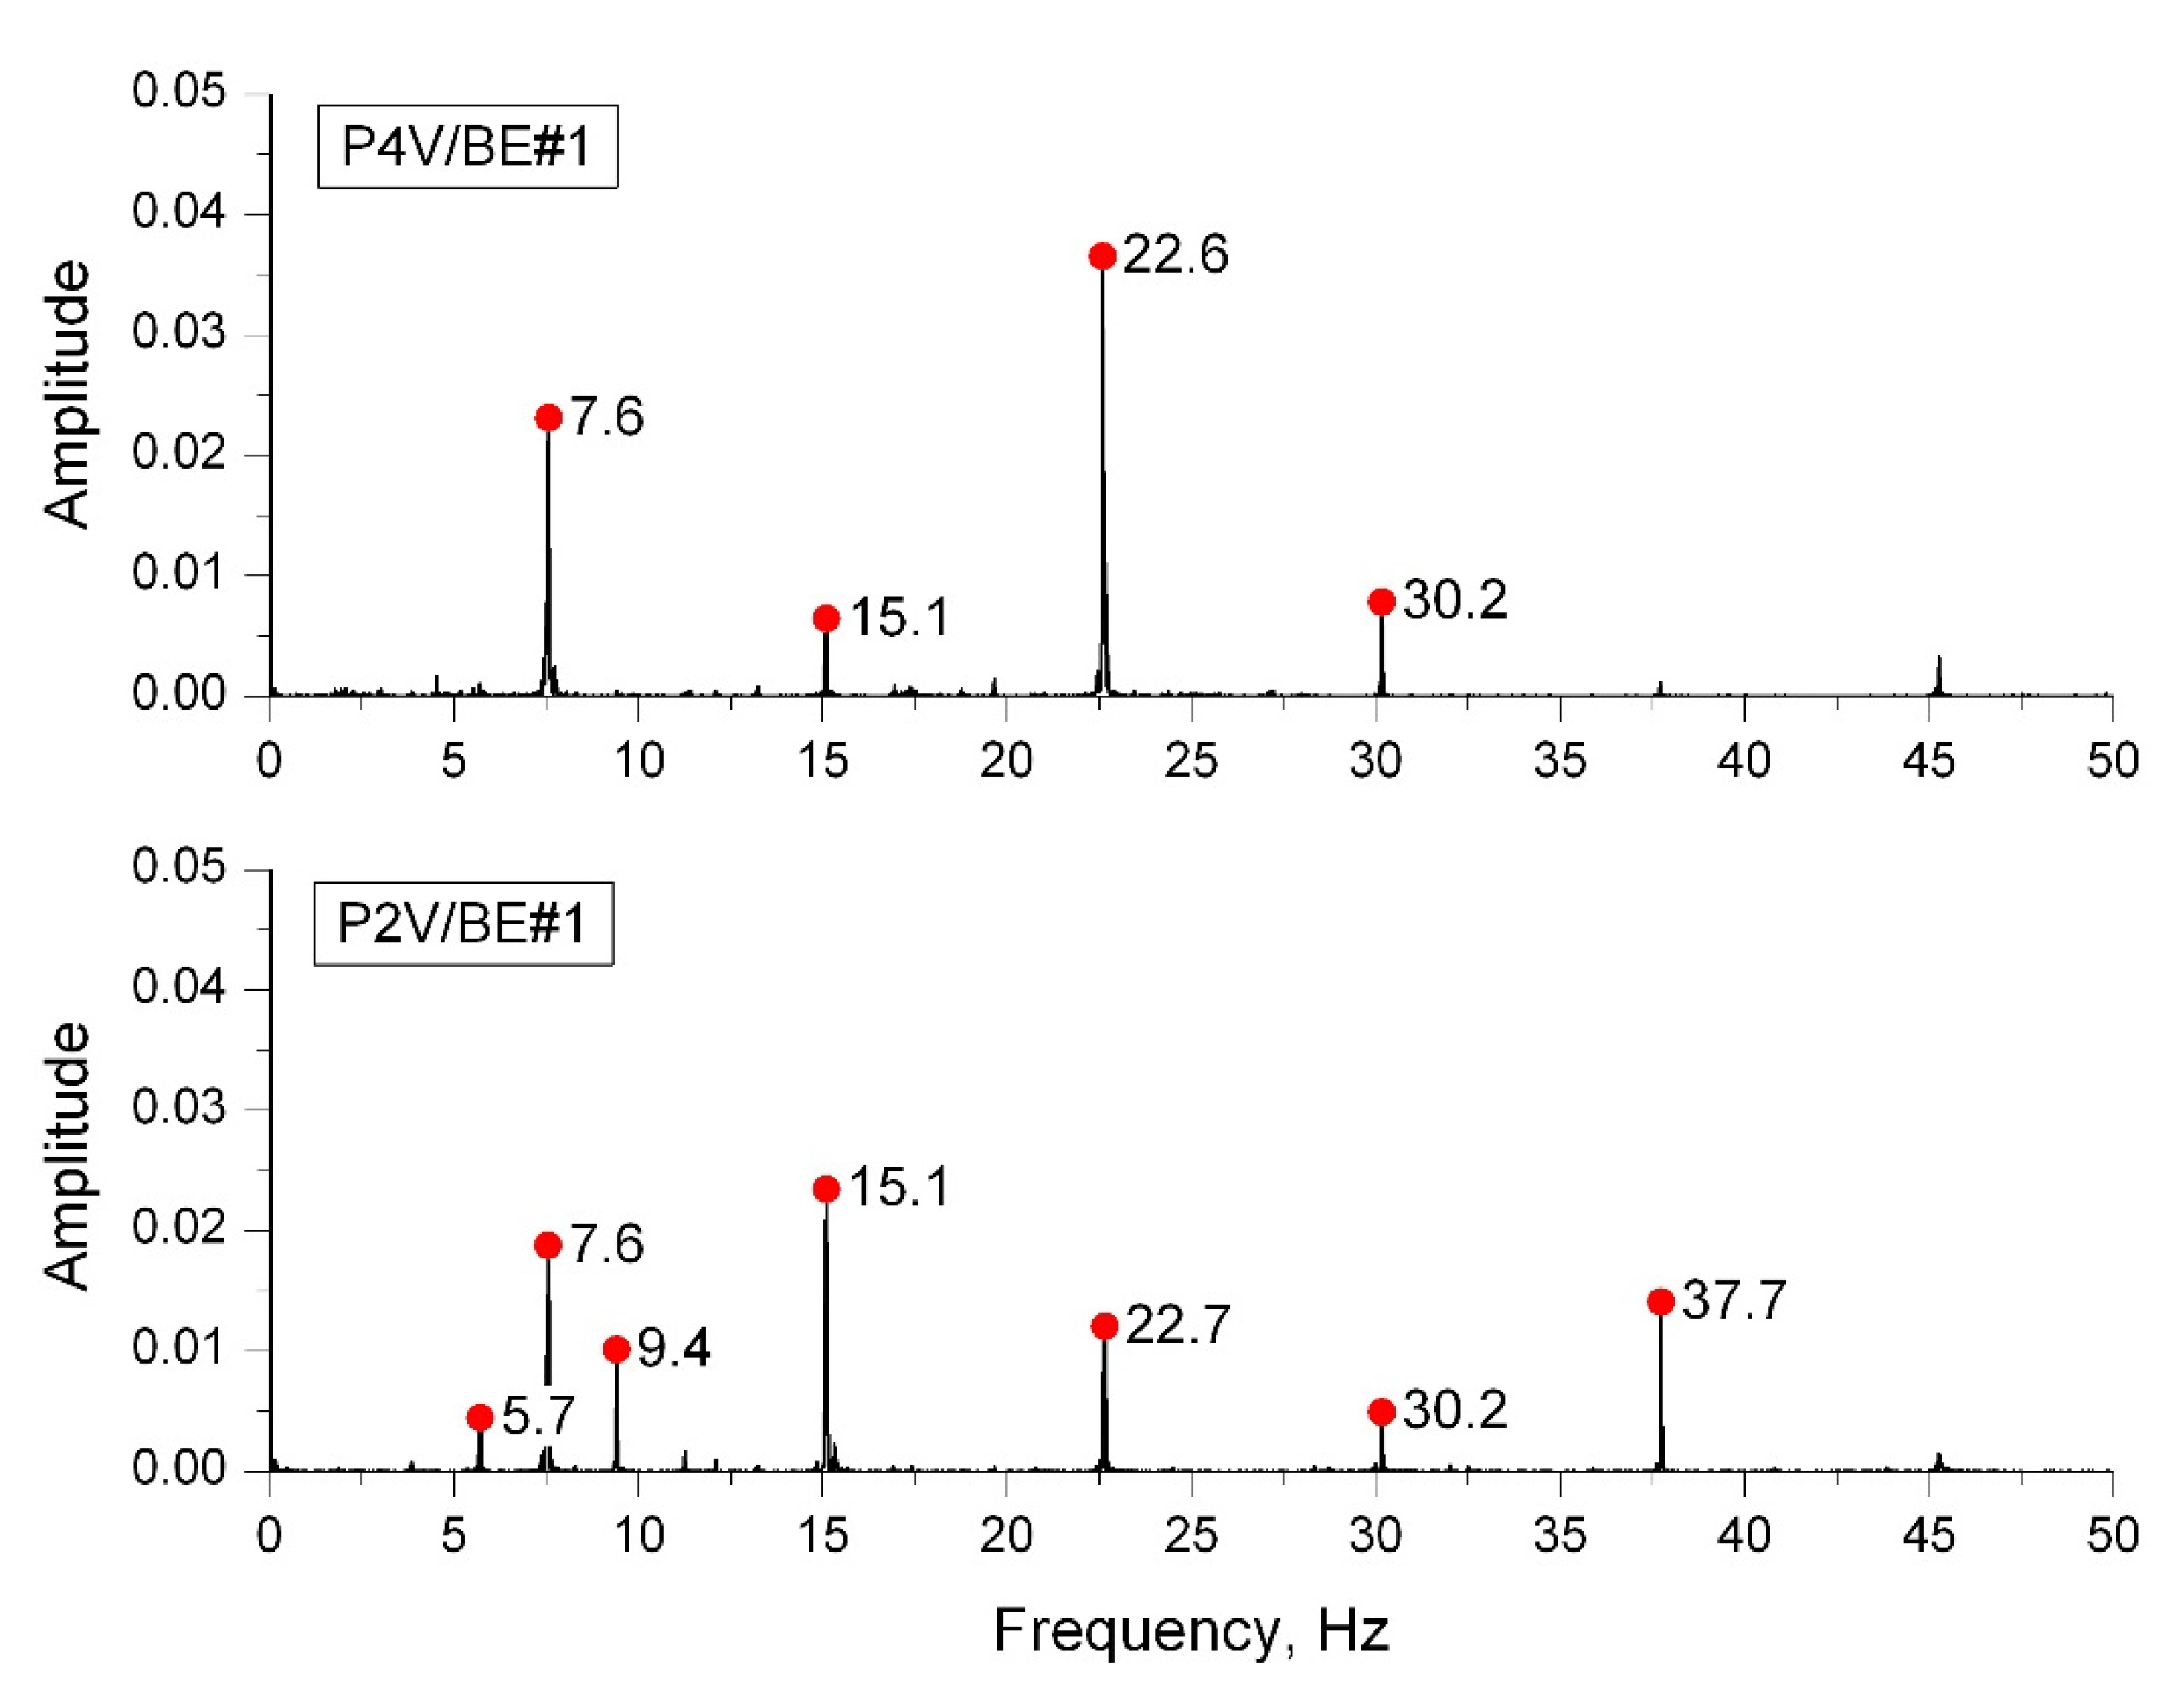
Figure 14 shows examples of results for two selected points, P2 (motor bearing unit) and P4 (bearing unit of the gear output shaft), in the BE#1 bucket elevator drive unit.
Based on the analysis of the spectrograms, we identified the characteristic frequencies that make up the spectra. In particular, the frequency f0 = 7.6 Hz was generated by the bucket chain and was the frequency at which the respective buckets passed through the drive drum. Additionally, the frequency f1 = 22.6–22.7 Hz was consistent with the frequency of rotation of the drive shaft (motor shaft).
The spectrum of the signal measured at point P2 (bearing unit) of the engine additionally included a lower sideband f01 = 5.7 Hz and an upper sideband f02 = 9.4 Hz near the bucket chain frequency f0 = 7.6 Hz. There was also a lower sideband f11 = 15.1 Hz and upper sideband f12 = 30.2 Hz near the frequency f1 of the propeller shaft. The sidebands in the spectrum of the signal measured at point P2 on the bearing of the electric motor occurred, among others, because of too much flexibility in the mounting of the drive unit on the frame, which was installed directly on the bucket elevator housing.
The narrowband spectral analysis of the remaining measurement signals was carried out for both tested elevators in a similar manner, but is beyond the scope of this article.
Conclusion from the frequency domain analysis:
A comparative assessment of both drive units made in the frequency domain on the basis of a broadband vibration velocity spectrum showed that the BE#1 drive unit was characterized by a higher vibration severity, which means that this unit was in a worse technical condition than the drive unit of the BE#2 elevator. This finding was in line with the assessment made on the basis of the time domain analysis.
4.4. Analysis Using the Probabilistic Approach
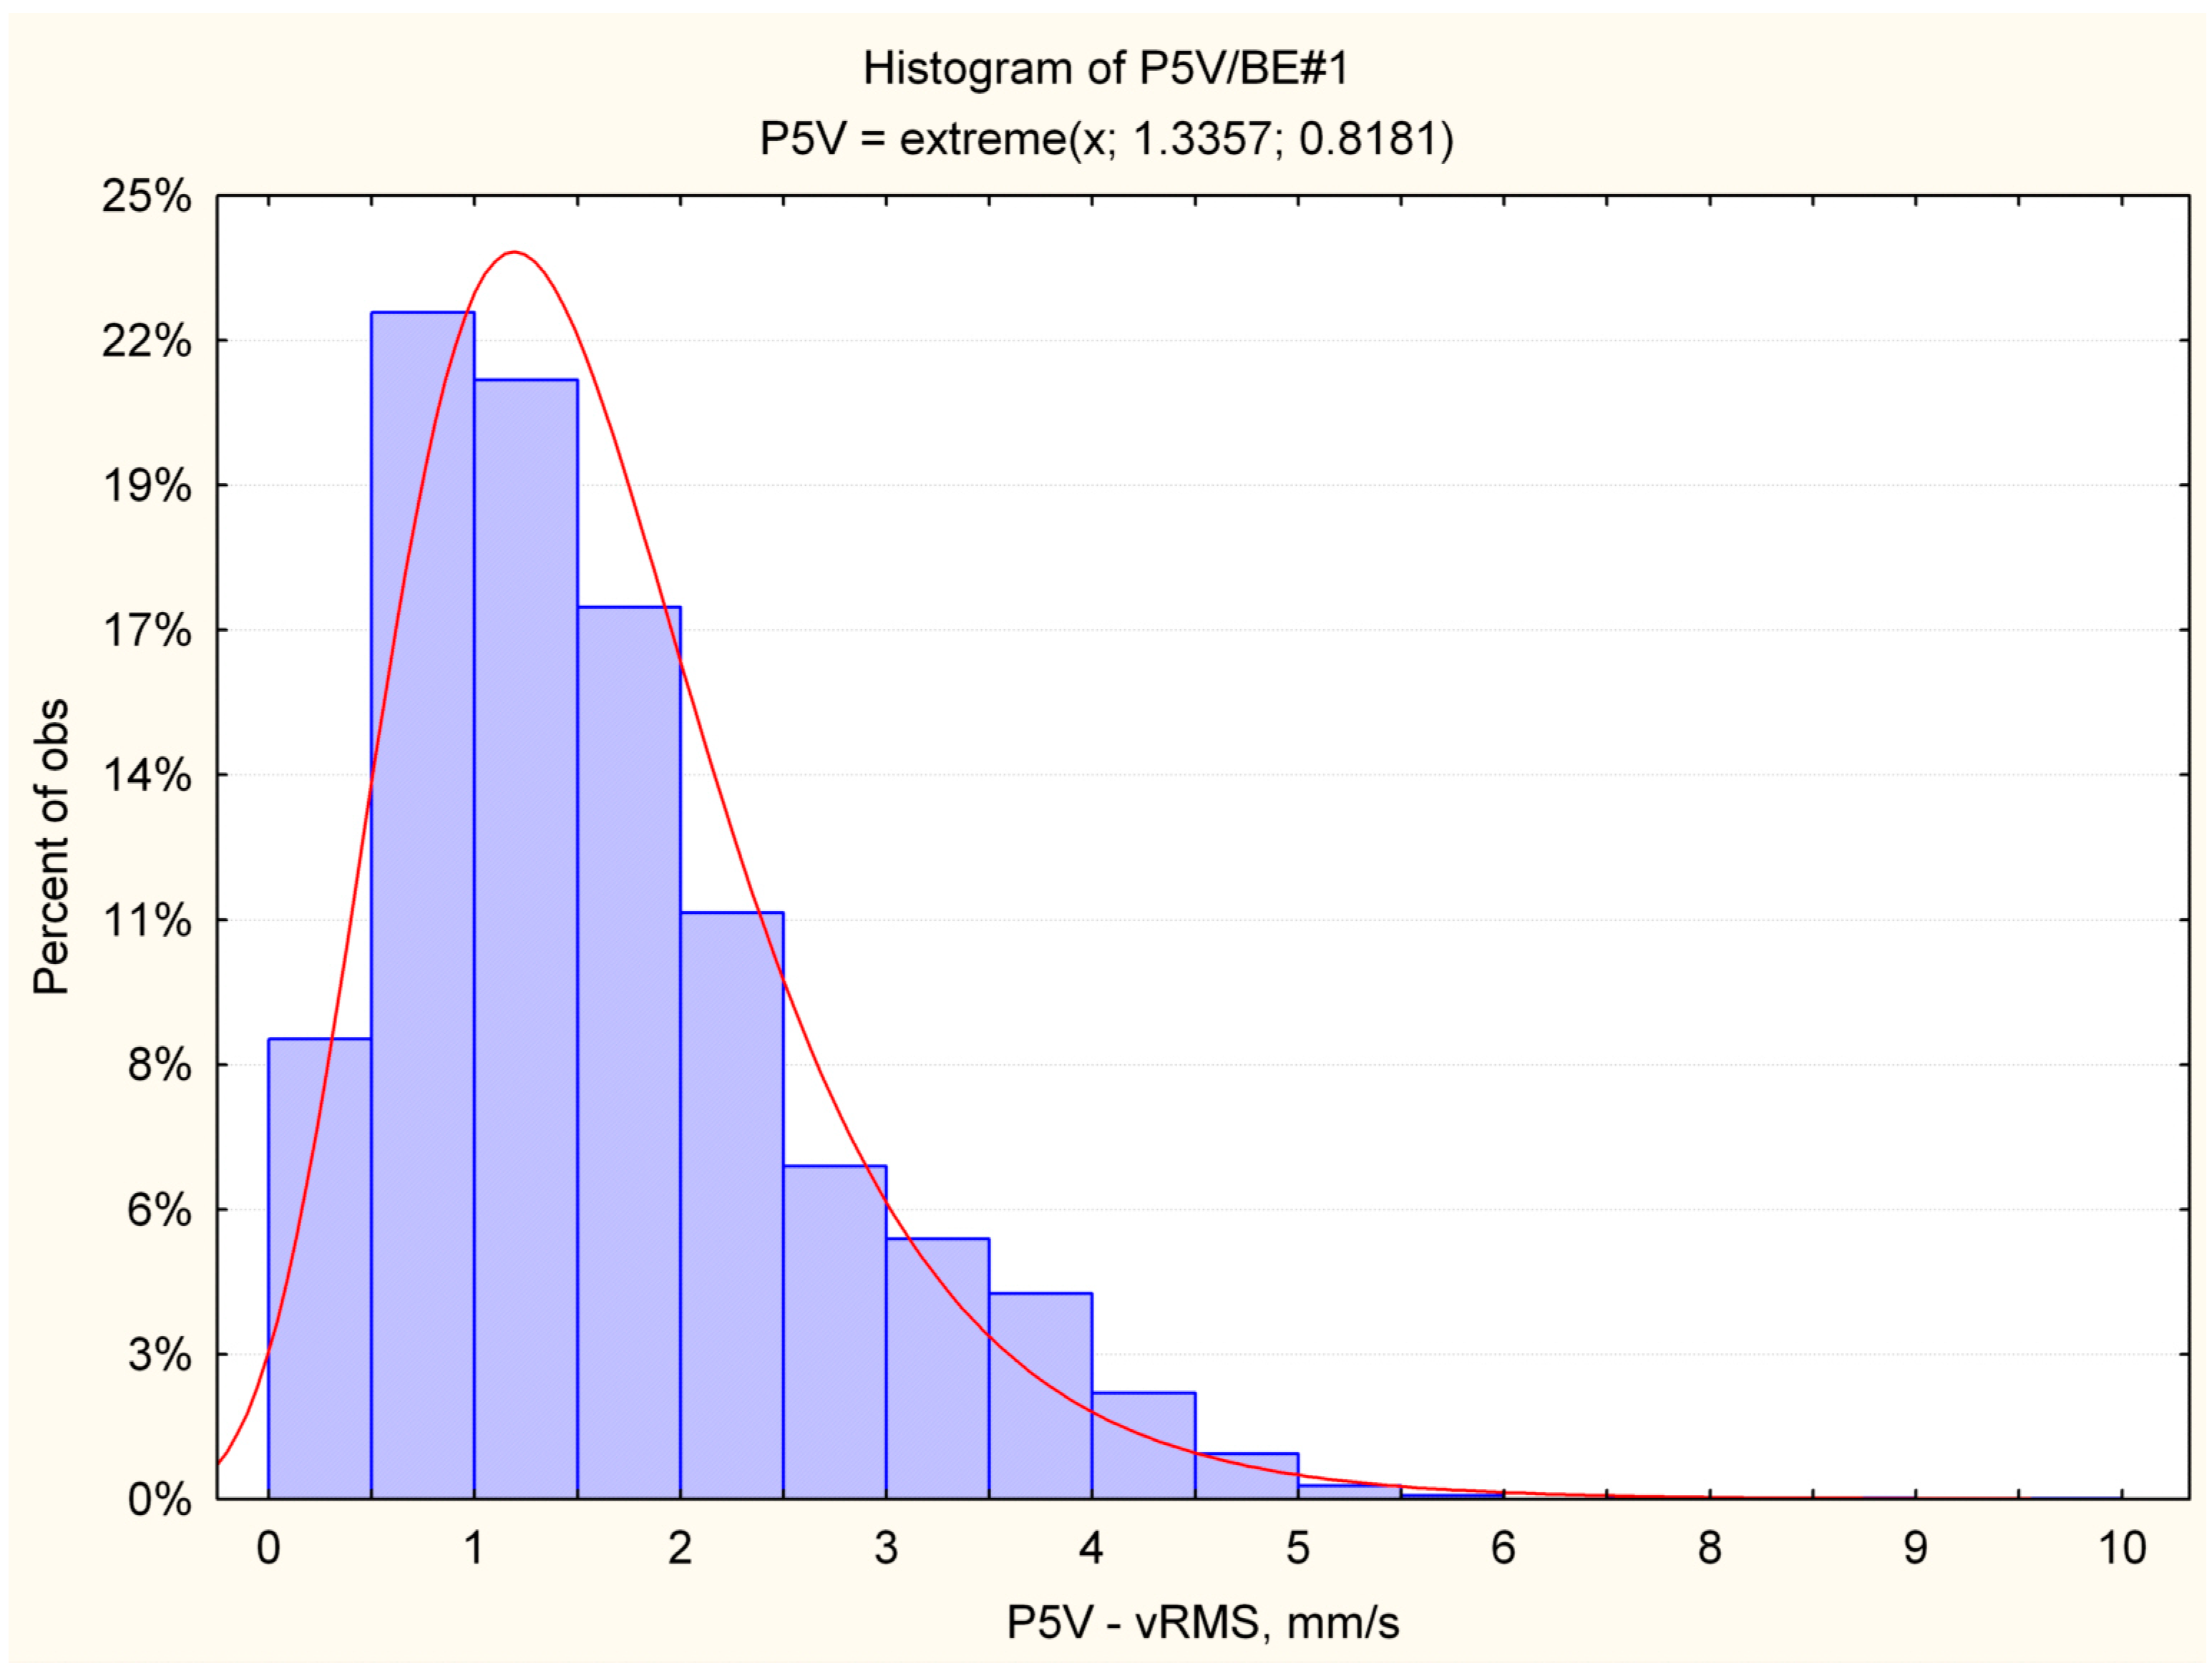
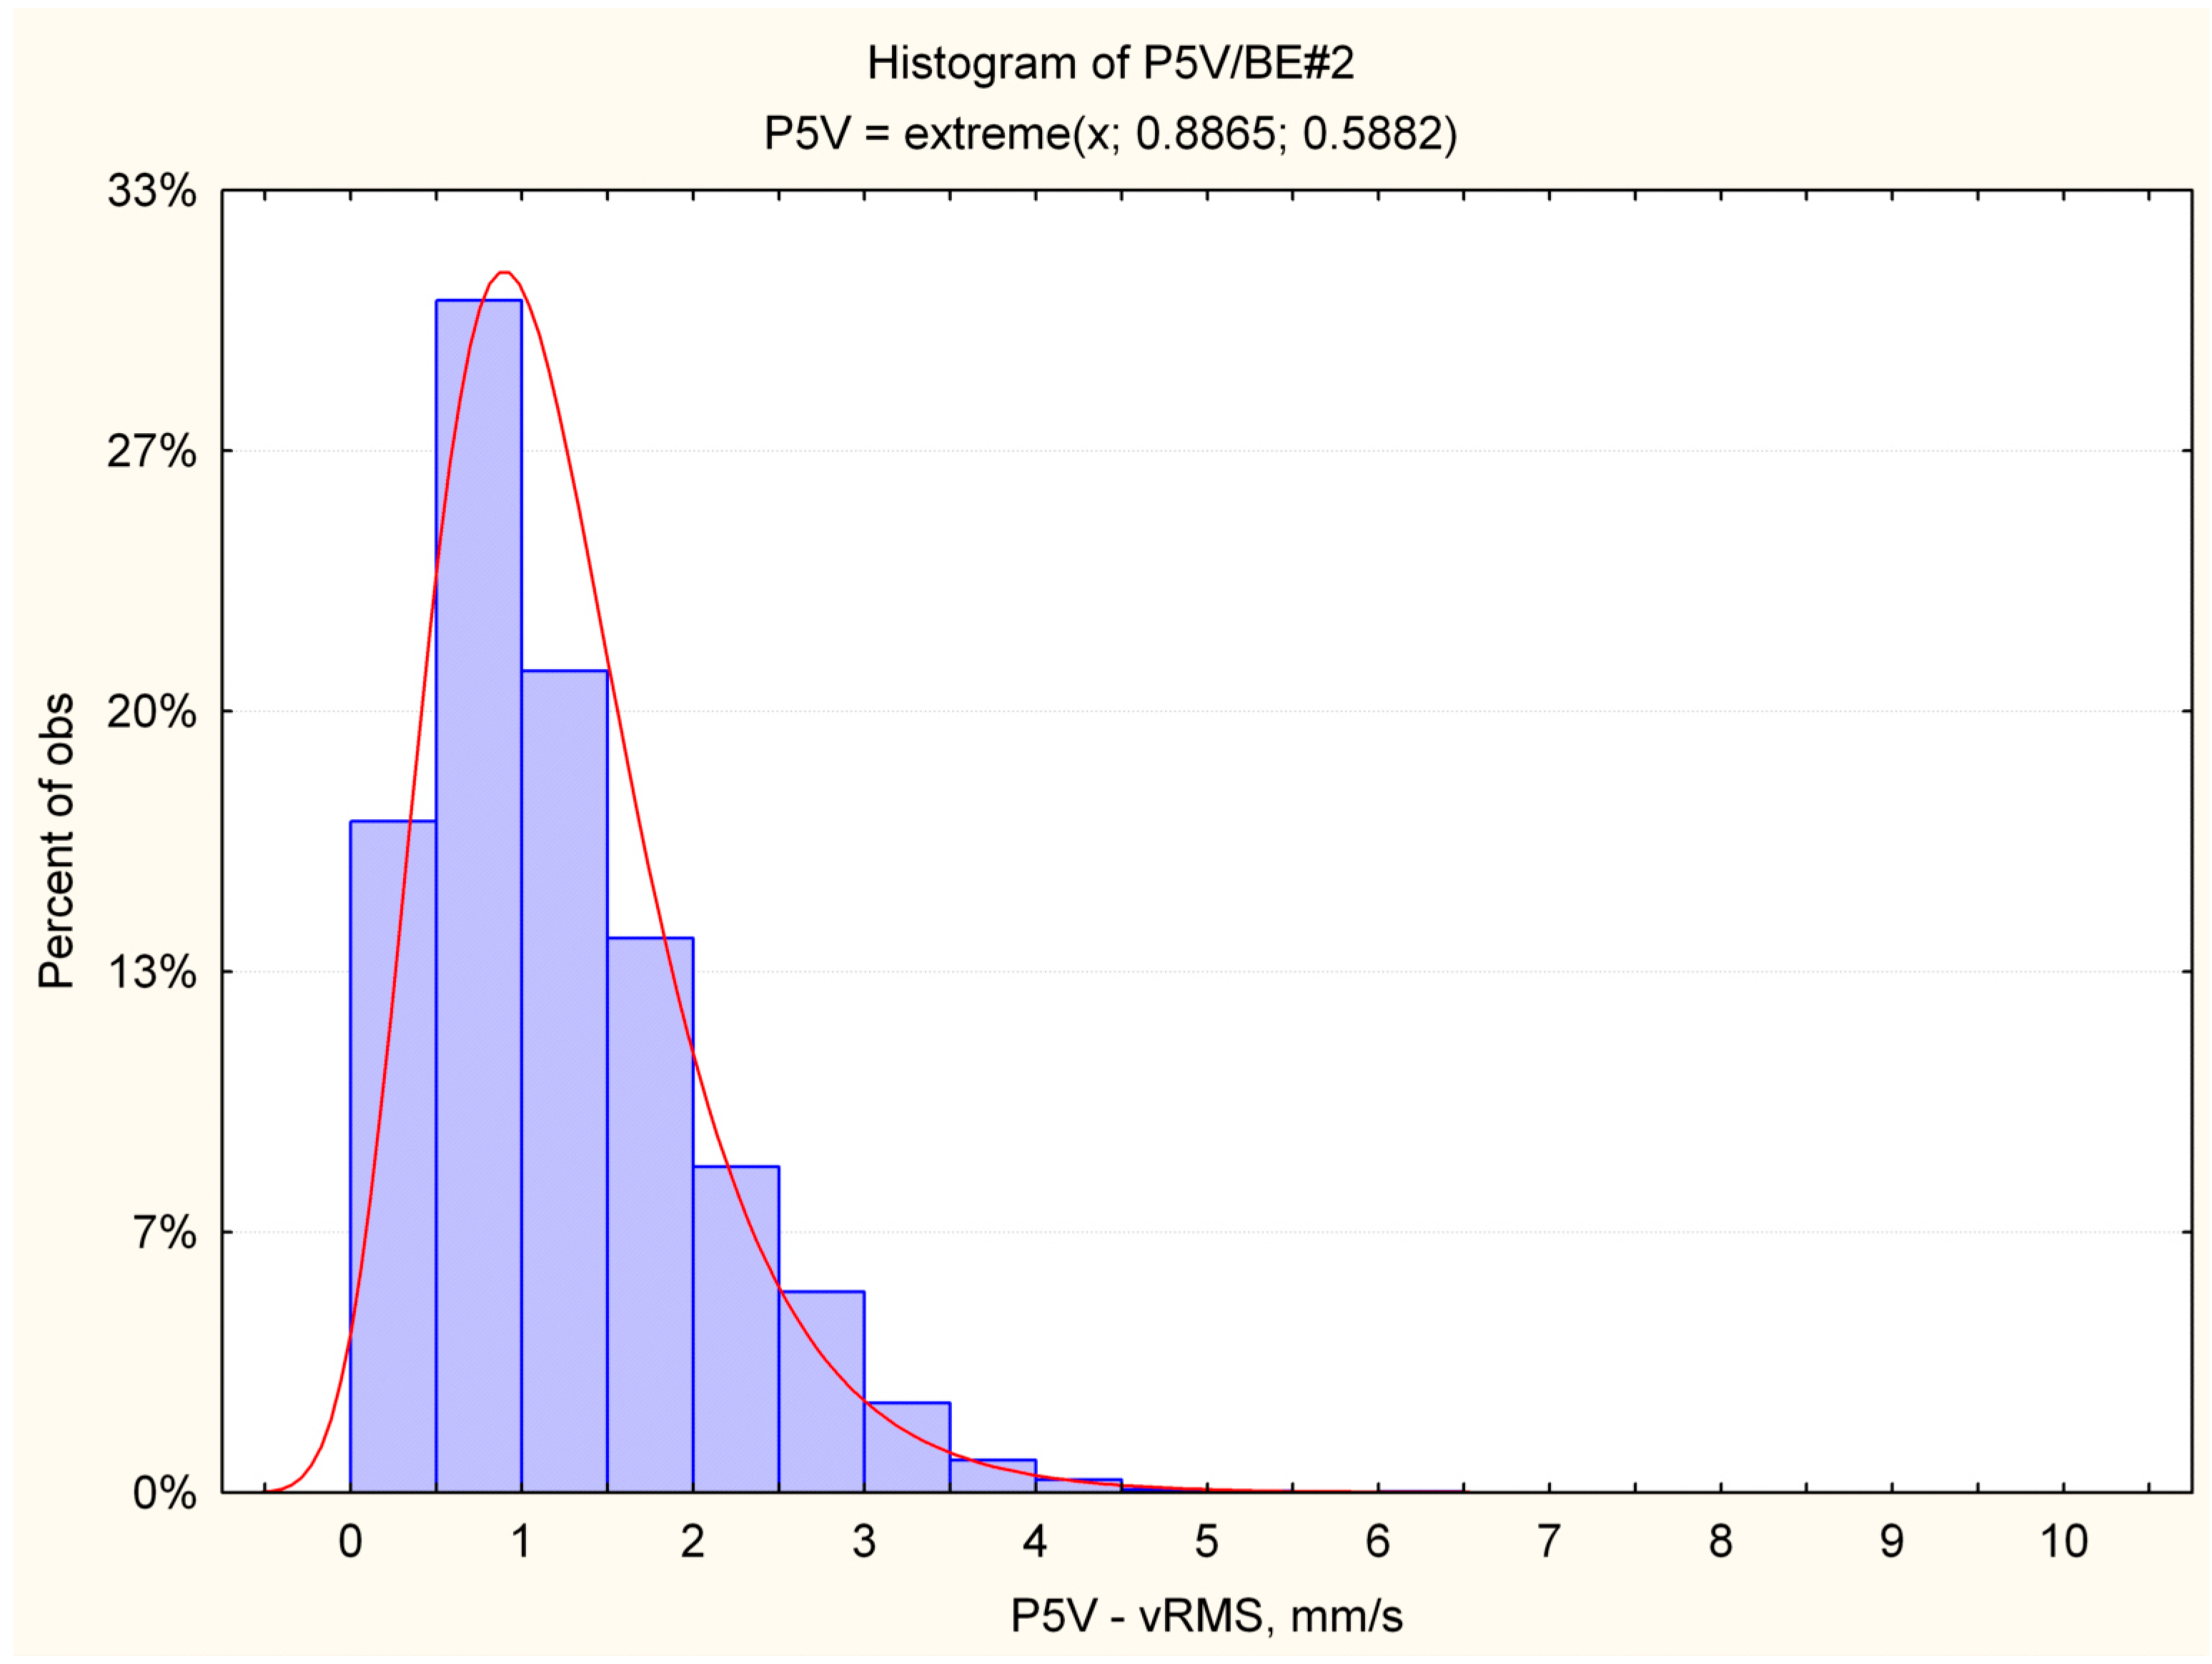
According to the probabilistic approach to condition assessment, the maximum likelihood method was used to estimate the statistical distribution of vibration velocity
vRMS in measuring points P1 to P5 of the tested drive units [
29,
30]. The best approximation with experimental data was obtained using the Gumbel Extreme Value (GEV) Models:
where:
x is the value of RMS vibration velocity,
b is the scale parameter, and
a is the threshold parameter.
The analysis of the measurement results showed, among others, that the vibration velocity as a diagnostic signal was not a Gaussian random variable and that the vibration velocity histograms for all measurement points P1–P5 of both drive units had a positive skewness.
Figure 15 and
Figure 16 present examples of the velocity histograms with the relevant Probability Density Functions (PDF).
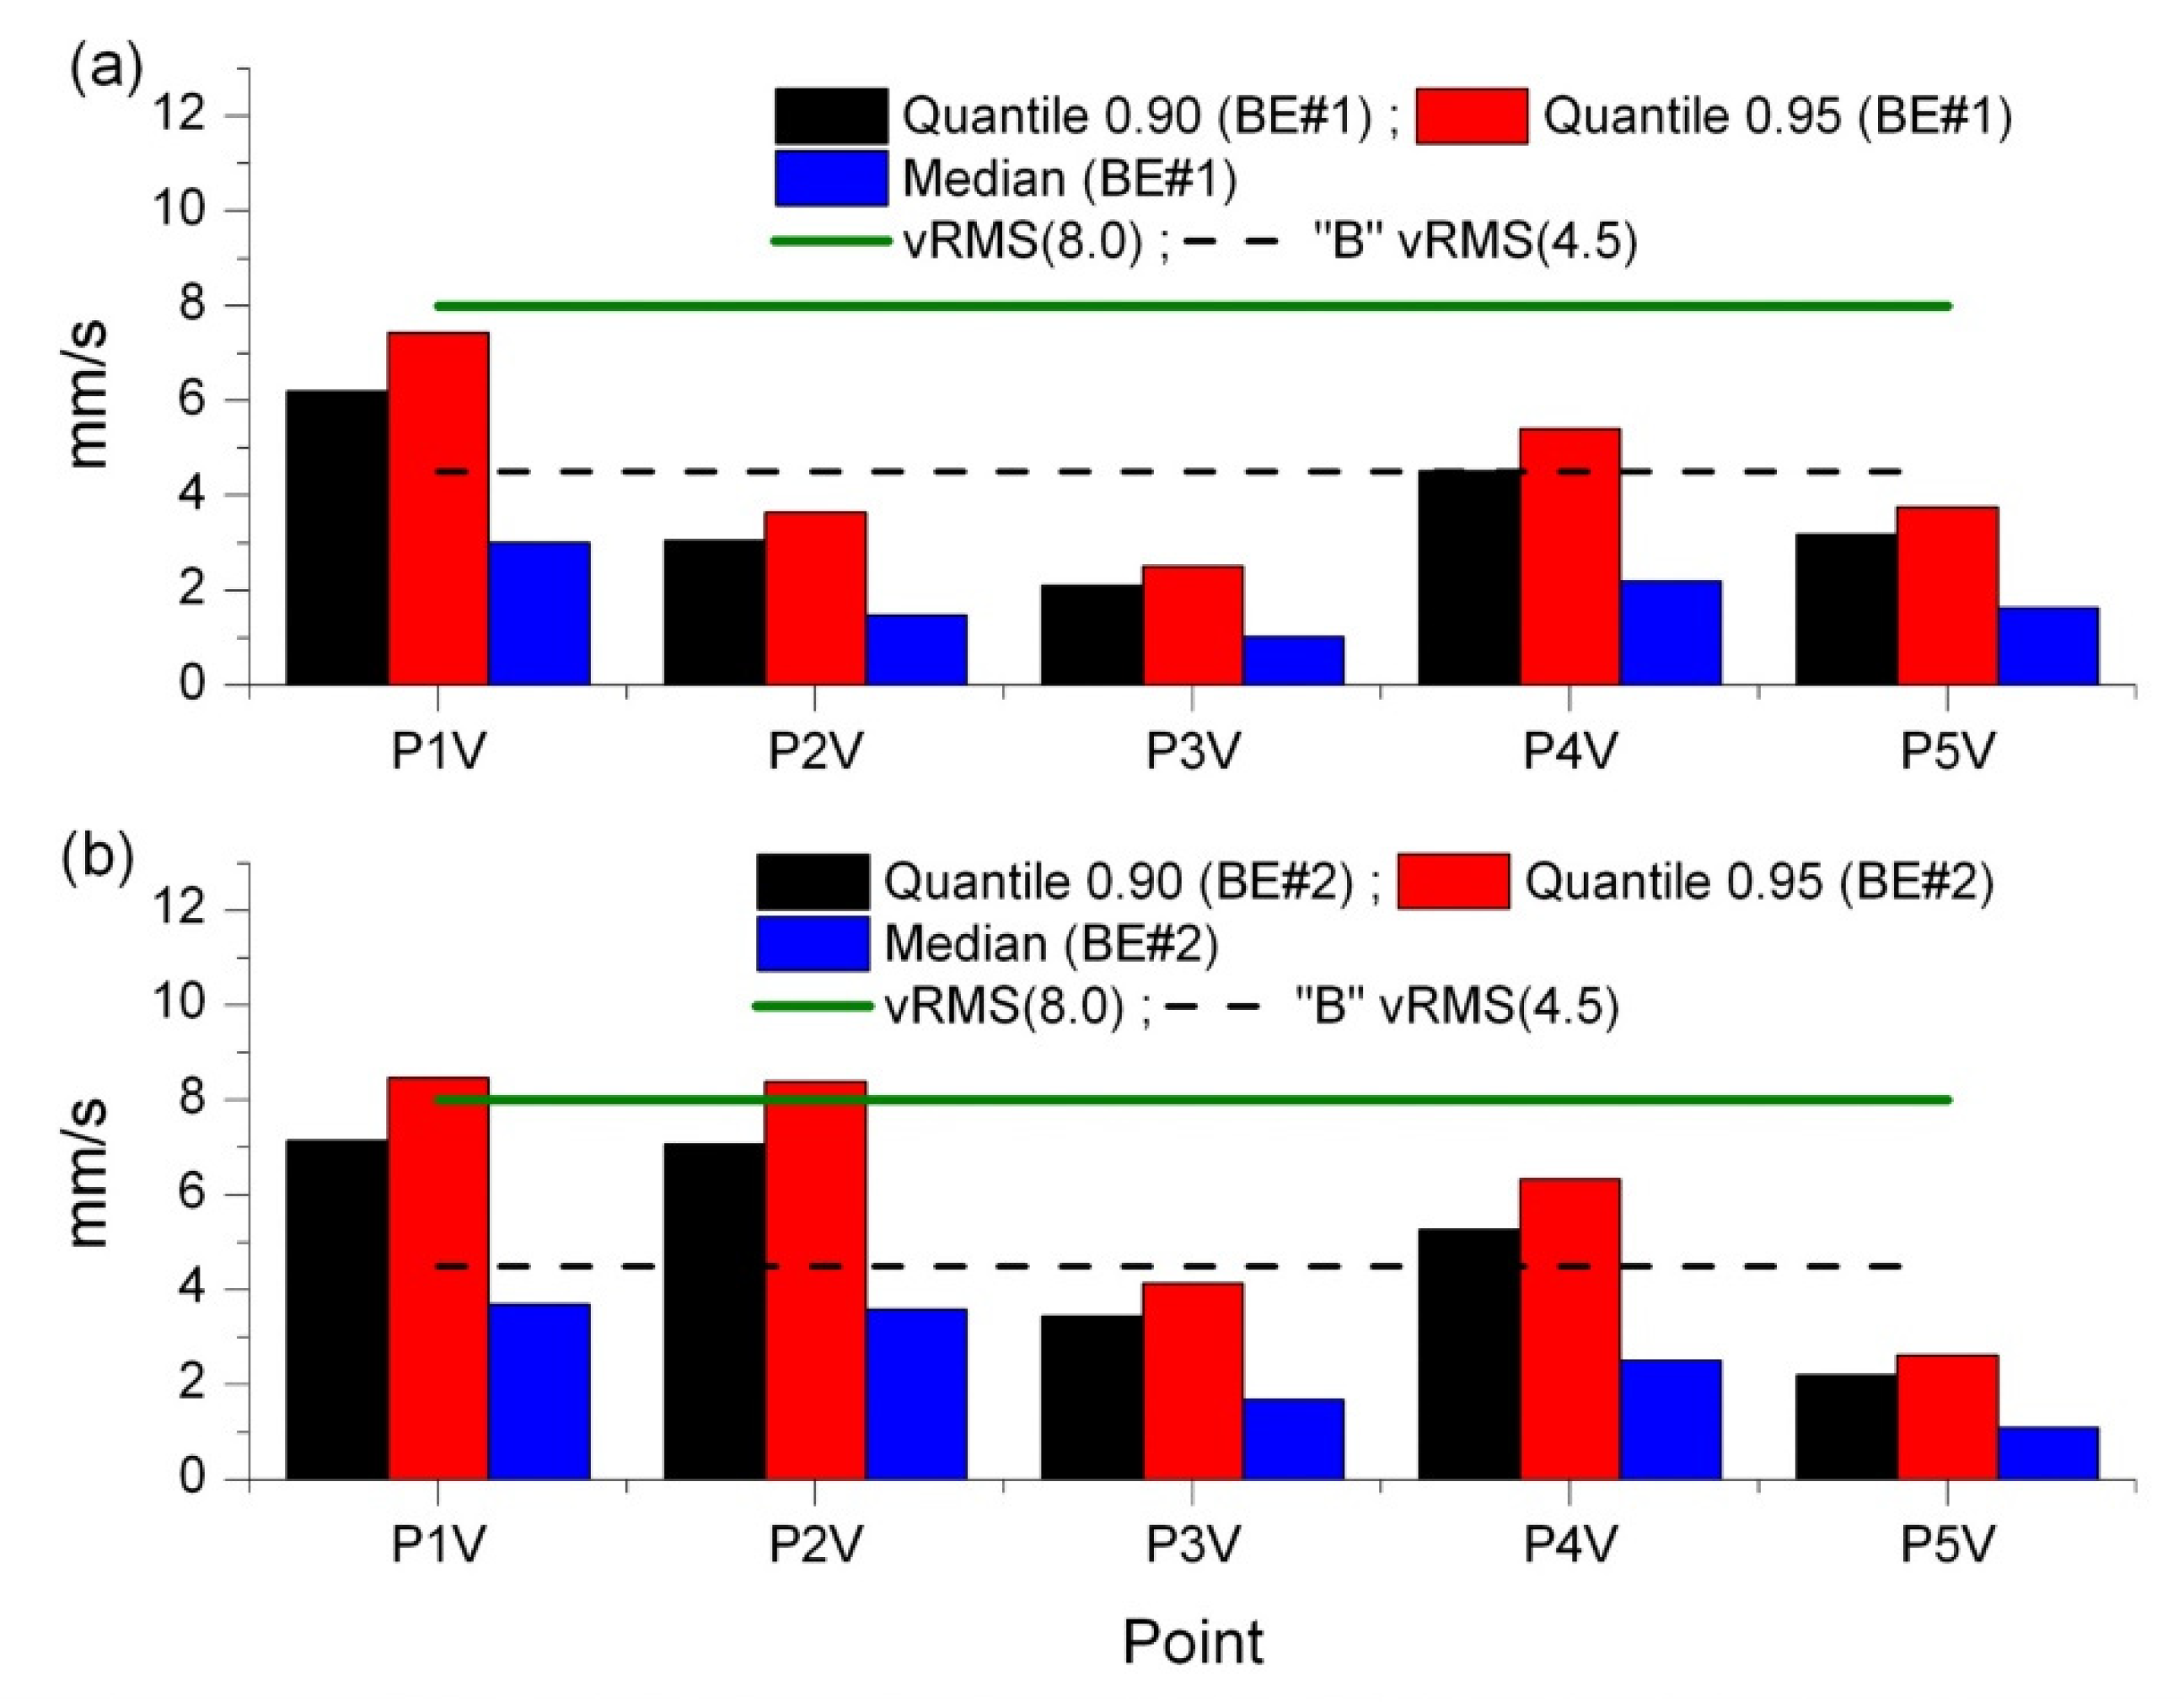
Figure 17 shows the relevant Quantiles
Q0.90,
Q0.95 and the Mode of vibration velocity in the measurement point P5 in both tested elevators. The lines mark the upper limits of vibration severity for the “B” zone, i.e.,
vRMS = 4.5 mm/s (according to the ISO-10816-3 Standard) and
vRMS = 8.0 mm/s (according to the less restrictive recommendation shown in
Table 2).
Compared to other approaches, the larger values of quantiles Q0.90, Q0.95 in the probabilistic approach characterized a higher level of vibration intensity and were symptoms of a worse technical condition of both drive units.
Conclusion from the analysis using the probabilistic approach:
The comparative assessment of both drive units made using the probabilistic approach based on quantiles Q0.90 and Q0.95 of vibration velocity showed that the BE#1 drive unit was characterized by a lower vibration severity, which means that this unit was in better technical condition than the drive unit of the BE#2 elevator. The assessment of the technical condition of the BE#2 drive unit is influenced by the relatively higher vibration intensity of the motor bearing units (points P1 and P2) as compared to the BE#1 drive unit motor.
This conclusion is slightly different than that from the deterministic estimation in the time domain using the classic Crest factor and the Impulse factor. The single Peaks of vibration velocity that occurred in the BE#1 elevator (
Figure 3) formally increased the Crest factor and Impulse factor values. However, these Peaks were recognized as a symptom of a local bucket chain flaw in BE#1 elevator and were not caused by the drive unit.
The diagnostic assessment made using the probabilistic approach is more realistic, as it takes into account the actual nature of randomly changing signals. In general, the tested objects generate non-Gaussian diagnostic signals, which is also confirmed by other studies [
24].
5. Conclusions
The research focused on the drive units of twin bucket elevators installed in a Polish power plant.
The main goal of the research was to make a comparative assessment of these elevators with respect to vibration severity, which was chosen as an indicator of their technical condition.
The vibration velocity measured at the bearing housings of the aforementioned drive units was selected as the diagnostic signal.
The diagnostic assessment was performed independently in three categories:
Analysis and comparison in the time domain;
Analysis and comparison in the frequency domain;
Analysis and comparison using the probabilistic approach.
The comparative condition assessment in the time domain was based on the Crest Factor and Impulse Factor of vibration velocity that have been extracted from the velocity-time runs. Although this type of approach is easy to implement in industrial conditions, the assessment can sometimes be distorted by peak values generated by other vibration sources.
The comparative condition assessment performed in the frequency domain was based on the analysis of the broad-band (1/3 Octave) spectra of vibration velocity and the vibration severity zones according to the recommendation of ISO-10816-3.
The condition assessment using the probabilistic approach was carried out according to the concept presented above and was based on the Probability Density Function of vibration velocity and the relevant Quantiles. The Probability Density Functions were estimated from the measured data using the maximum likelihood method.
Comparative evaluations clearly showed that the vibration intensity in the BE#1 bucket elevator drive unit was higher compared to the BE#2 unit. On this basis, a conclusion was drawn that the drive unit in the BE#1 elevator was in a worse technical condition than the drive in bucket elevator BE#2.
The assessment of the technical condition of the BE#1 and BE#2 bucket elevators made on the basis of the Crest Factor and Impulse Factor uses the cyclical peak values of vibration velocity at given measurement points P1-P5 as the starting point.
In the case of the BE#1 bucket elevator, the typical time waveforms of vibration velocity contained relatively high Peak values, whose source was not the drive unit of this elevator’s conveyor. On the basis of a detailed offline analysis of the results, it was determined that these high peaks (see
Figure 3) were generated by a local defect of the bucket chain. For this reason, the evaluation of the intensity of vibrations in the deterministic approach in real time was distorted in the case of the elevator BE#1 and resulted in an underestimated assessment of the technical condition of this drive unit.
The evaluation of the technical condition on the basis of the 1/3 Octave spectrum showed that the vibration intensity in both drive units BE#1 and BE#2 was similar. The greatest differences in Total Value occurred at points P1 in the vertical direction (P1V). It was determined that this difference was caused by vibrations generated by a local defect of the bucket chain in the BE#1 elevator.
Based on the frequency domain analysis it was concluded that some bearing assemblies in both power units do not meet the stringent criteria set out in ISO-10816-3. This discrepancy applies to the P1 point located on the external bearings of the motors (
Figure 13).
However, if we adopt the less restrictive criteria (
Table 2), then both drive units can be considered as acceptable for unrestricted long-term operation and no special remedial action is required.
The diagnostic evaluation using the probabilistic approach proposed in this article offers new possibilities because it takes into account the actual random nature of the intensity of vibrations. The assumption that tested machines generate Gaussian signals is not always justified, which was demonstrated, among others, in this article.
The assessment of the technical condition in the probabilistic approach takes into account the results of measurements over a longer period of time and is performed using off-line data analysis. The vibration velocity peaks generated in the BE#1 elevator drive unit by a local defect of the bucket chain are not taken into consideration.
For this reason, the probabilistic approach gives a more reliable assessment of the technical condition of the tested bucket elevators.
Additionally, it can be concluded that a probabilistic approach to diagnostic assessment helps to forecast the so-called symptom reliability of drive units. These symptoms of reliability are based on the statistical relationship between the relevant vibroacoustic symptom, e.g., the relevant Quantile of vibration velocity, and the predicted residual life of a studied machine. The overall concept of our method as applied to machinery in industrial conditions was described, among others, in our previous papers [
29,
30]. Pros and cons of the methods used in our research are presented in
Table 4.


