1. Introduction
There are two primary applications of wave energy converters (WECs) under consideration: converting wave energy to electrical energy and using wave energy to power the desalination of seawater. It has been argued that the application of wave energy to desalination, specifically reverse osmosis (RO) desalination, can be more economical than the production of electrical power [
1] and several groups have worked to evaluate and advance the technology for that purpose [
2,
3,
4,
5]. The cited advantage of applying wave energy to reverse osmosis comes with the use of a hydraulic power take-off (PTO) with filtered seawater as the working fluid and direct coupling to the RO process; the advantage is that significant power conversion losses are avoided [
3,
5,
6,
7].
Prior work by the authors and others have considered systems that co-produce electrical power and fresh, desalinated water, as this is believed to be a more practical and robust approach. The primary purpose of the systems is freshwater production, while their co-production of electrical power serve electrical power demands. Examples for electrical power demands in these systems include supervisory control and data acquisition, ultraviolet sanitation of produced water, actuation of valves, and driving charge pumps and circulation pumps with electric motors.
Several architectures for the power take-off (PTO) that follow this co-production scheme have been proposed [
2,
8,
9,
10] and were compared through the lens of a multi-objective design problem that considered production rates and component sizes as performance metrics [
11]. This study considered PTO architectures with either fixed or variable displacement WEC-driven pumps, fixed or variable active RO membrane areas, and components being placed in series or parallel. A significant finding from this study is that variable displacement, in particular, as a feature of the WEC-driven pump, does not offer a significant improvement in the system’s design performance. However, the scope of this finding is recognized as being limited.
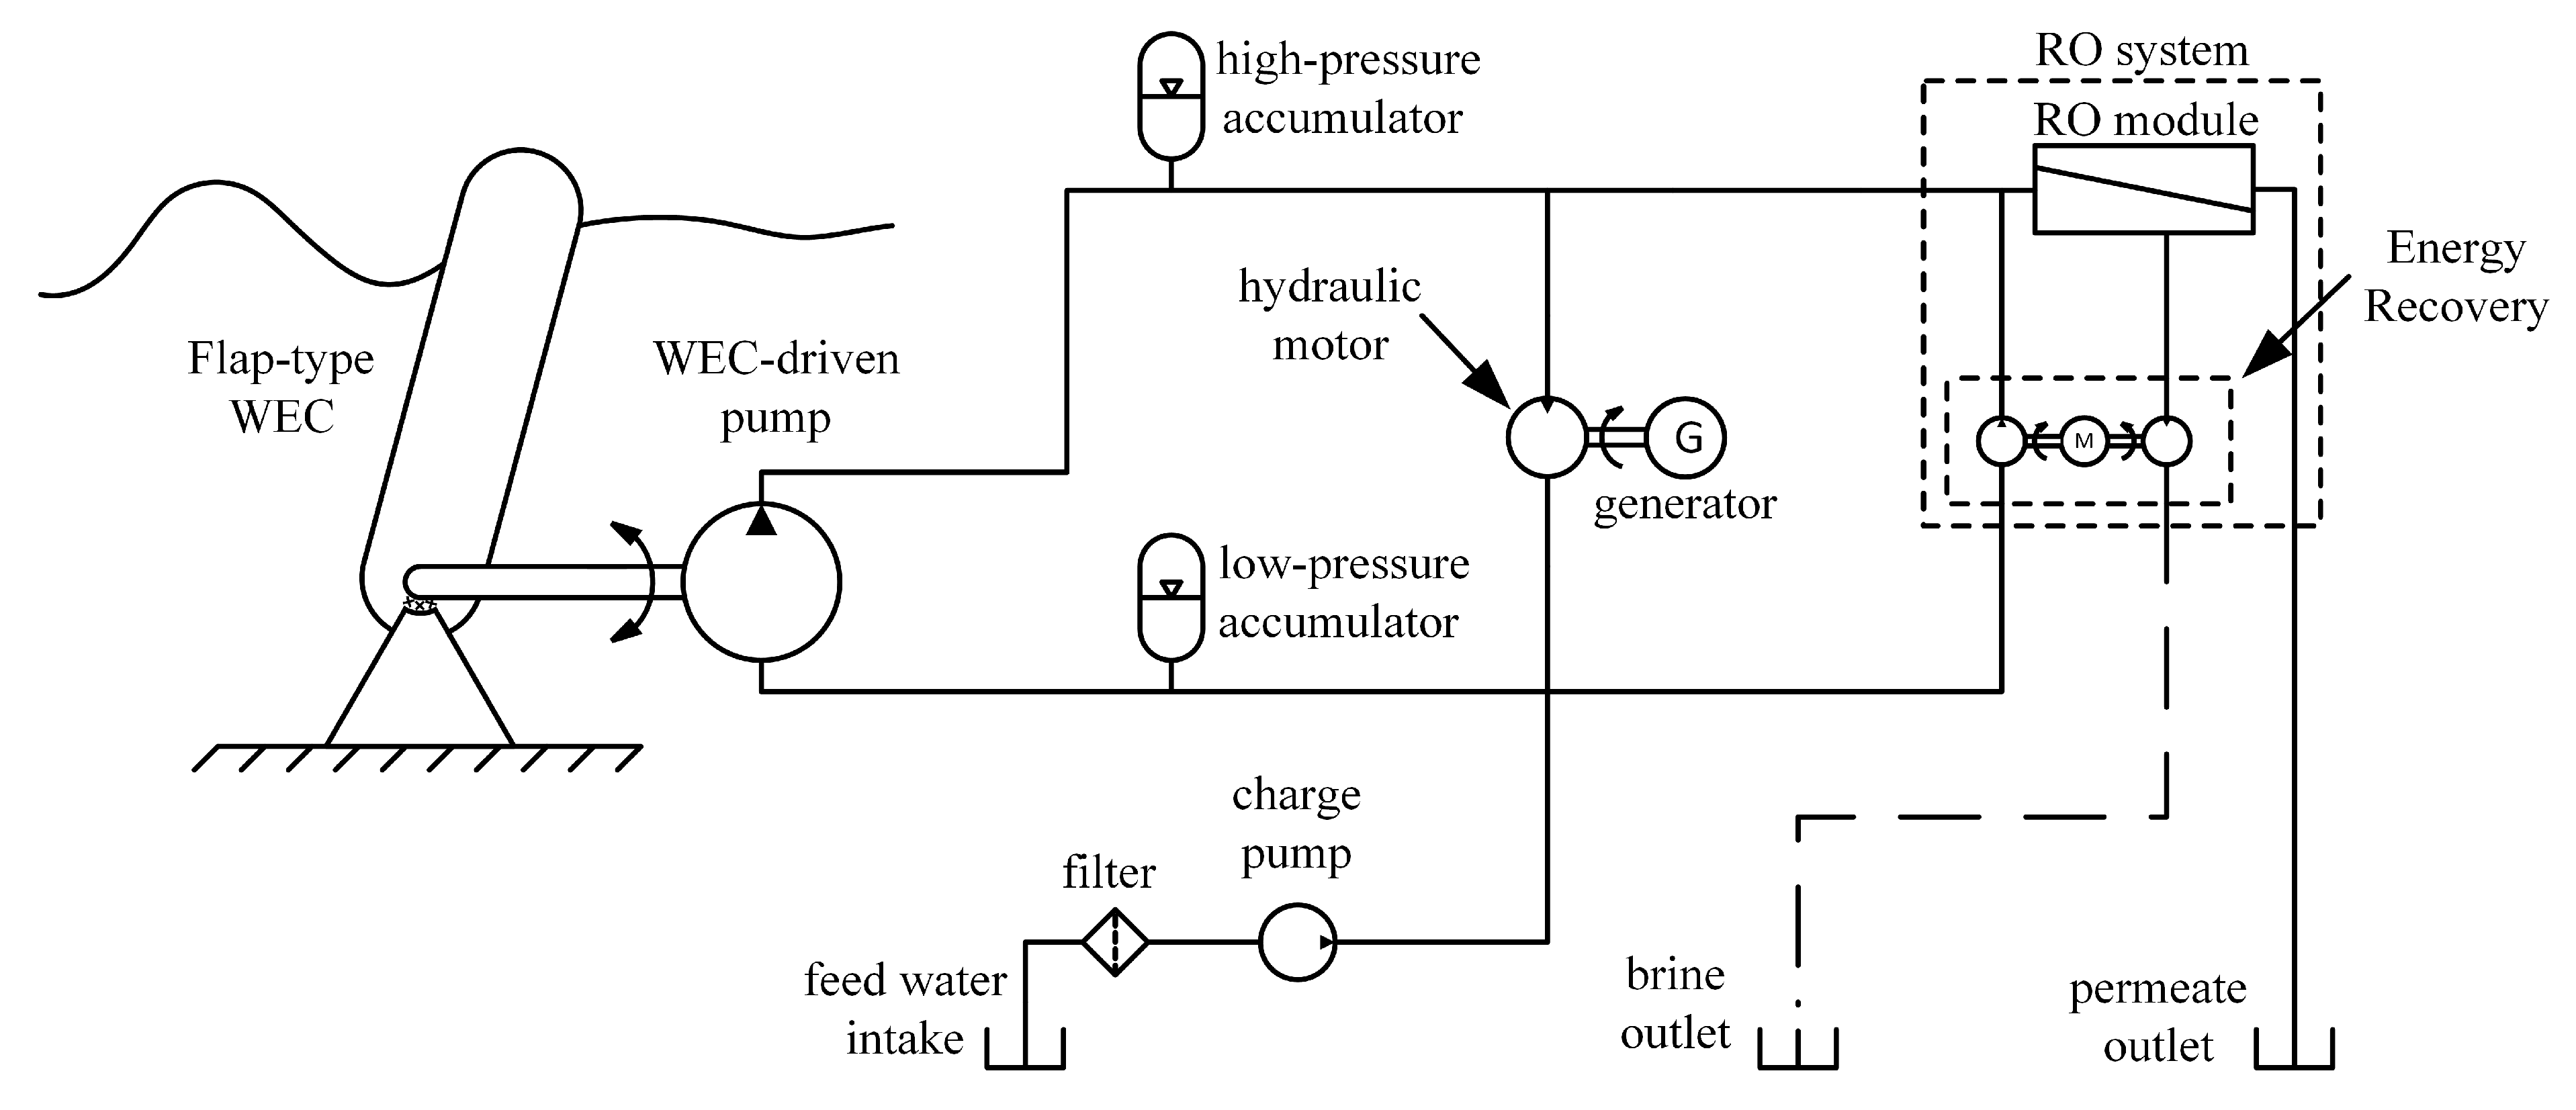
The limitation of the prior study is that it used time-averaged performance models of the system that assumed a constant load from the PTO on the WEC within a given sea state. This approach to load control is referred to as “Coulomb damping” due to the similarity to Coulomb’s constant force model as opposed to the linear resistive damping often considered for WECs where the load is proportional to velocity. The average power absorbed by the WEC was characterized as a function of the Coulomb damping magnitude using a high-fidelity, hydrodynamic model of the WEC simulated in the time domain. The static, time-averaged power curve generated by this characterization of the WEC was then coupled to a static model of the PTO that assumed constant flow rates and pressures in the system. Under that modeling framework, the role of a variable displacement pump—such as in the PTO architecture illustrated in
Figure 1—can only be to provide an additional degree of freedom toward achieving an optimal combination of the Coulomb damping magnitude and freshwater production rate. This modeling framework omits the potential for a controlled, moment-to-moment variation of the PTO load that enhances wave energy capture by adapting to the variations in the incoming waves.
A more robust comparison of PTO architectures should include their capacity for load control; it would be ideal to include an estimate for the upper bound in the performance that this capacity affords. Yet, this relies on the implementation of the load control scheme to direct changes in the PTO load. There are a variety of PTO load control schemes that have been proposed and a few studies comparing their performances [
12,
13]. However, there is general dependence between the design of the PTO (with its non-ideal behavior and physical limitations) and the success of the load control scheme. Consequently, O’Sullivan and Lightbody [
14] proposed that the model-predictive control (MPC) framework be used to approximate an optimal PTO load control for the purpose of design studies that evaluate the design of a PTO.
Model predictive control is a popular optimal control method having origins in the 1970s [
15]. The fundamental principles of MPC are the (1) use of a model to predict future behavior, (2) optimization of future control signals based on the model’s performance predictions, and (3) the use of a receding time horizon for performing the optimization and implementation of control signals. A significant advantage of model predictive control is that the optimization problem posed by the designer can include constraints on the system’s behavior. One notable adaptation of MPC for wave energy conversion is that the typical control objective is to maximize either the energy absorbed by the WEC or the output of the PTO, while more traditional control system applications would aim to minimize tracking errors.
Model-predictive control has been considered for the load control of WECs (see [
16] for a recent, comprehensive review) and progress continues toward improving its implementations in terms of computational speed for real-time applications, prediction of future wave elevation, and the inclusion of system constraints [
17]. Considering MPC as a means of providing optimal performance estimates in PTO design studies, as suggested by O’Sullivan and Lightbody [
14], is supported by results in the literature. Coe et al. compared MPC to other load control methods and found it was the highest performing control method subject to a passivity constraint [
13] (a PTO is passive when it only absorbs power rather than also feeding power back to the WEC). A complex conjugate control, which requires a reactive PTO load, was the only higher-performing method in their study; MPC was not tested in conditions where reactive PTO loads were allowed. When model predictive control was not subject to a passivity constraint, Hals et al. found that this control method was the highest performer [
12].
The work presented here expands on the findings of Simmons and Van de Ven ([
11]), comparing PTO architectures for wave-powered reverse osmosis, by examining the potential improvements to the average power absorption achieved with controlled, moment-to-moment variations of the PTO load. In addition, this work considers how practical limits on the PTO load variability affect power absorption. These constraints include (1) a maximum load, (2) a minimum load, and (3) a limit on the rate of load adjustment. For example, in the context of a constant-pressure-type PTO with a WEC-driven pump having a variable displacement, these constraints translate to (1) the maximum displacement, (2) the minimum displacement, and (3) the speed that the pump can adjust the displacement. While constraints on the PTO load are not new (e.g., limits on the magnitude and the rate of change in the load are considered in [
18,
19]), the constraints are assumed to be predetermined and are not studied for their effect beyond the effect of their inclusion. Instead, this work seeks to characterize how varying these constraints (i.e., their values) affects WEC performance. This makes the effect of their inclusion more transparent and can inform objectives in the design of PTOs (e.g., how responsive they are and what range of loads can be achieved).
As limits to the scope of this work, the study enforces the passivity of the PTO (i.e., power only flows in the direction from the WEC to the PTO) and the continuity of the PTO load. The types of PTO load behavior being excluded from this study are (1) discrete PTO load changes, as in latching and declutching [
20,
21,
22,
23], and digital, multi-chamber pumps [
24,
25] and (2) reverse power flow, as seen with complex conjugate control. The types of hydraulic PTO architectures captured by this study are (1) constant-pressure-type PTOs with variable displacement WEC-driven pumps, (2) variable-pressure-type PTOs with fixed displacement WEC-driven pumps, and (3) variable-pressure-type PTOs with variable displacement WEC-driven pumps.
The implementation of MPC in wave energy conversion studies has typically framed the optimization as a quadratic programming problem, which requires discretized, linear system models [
13,
18,
19,
26,
27]. In these cases, computational efficiency becomes a major concern for real-time control and is often traded off with performance. In contrast, this present study has no need for real-time implementation and, therefore, uses the same high-fidelity, nonlinear time domain model in the model’s predictive control as is used for simulating the ’true’ system. The aim here is to estimate the upper bound in performance, not to achieve a practical control scheme that can be implemented in real time.
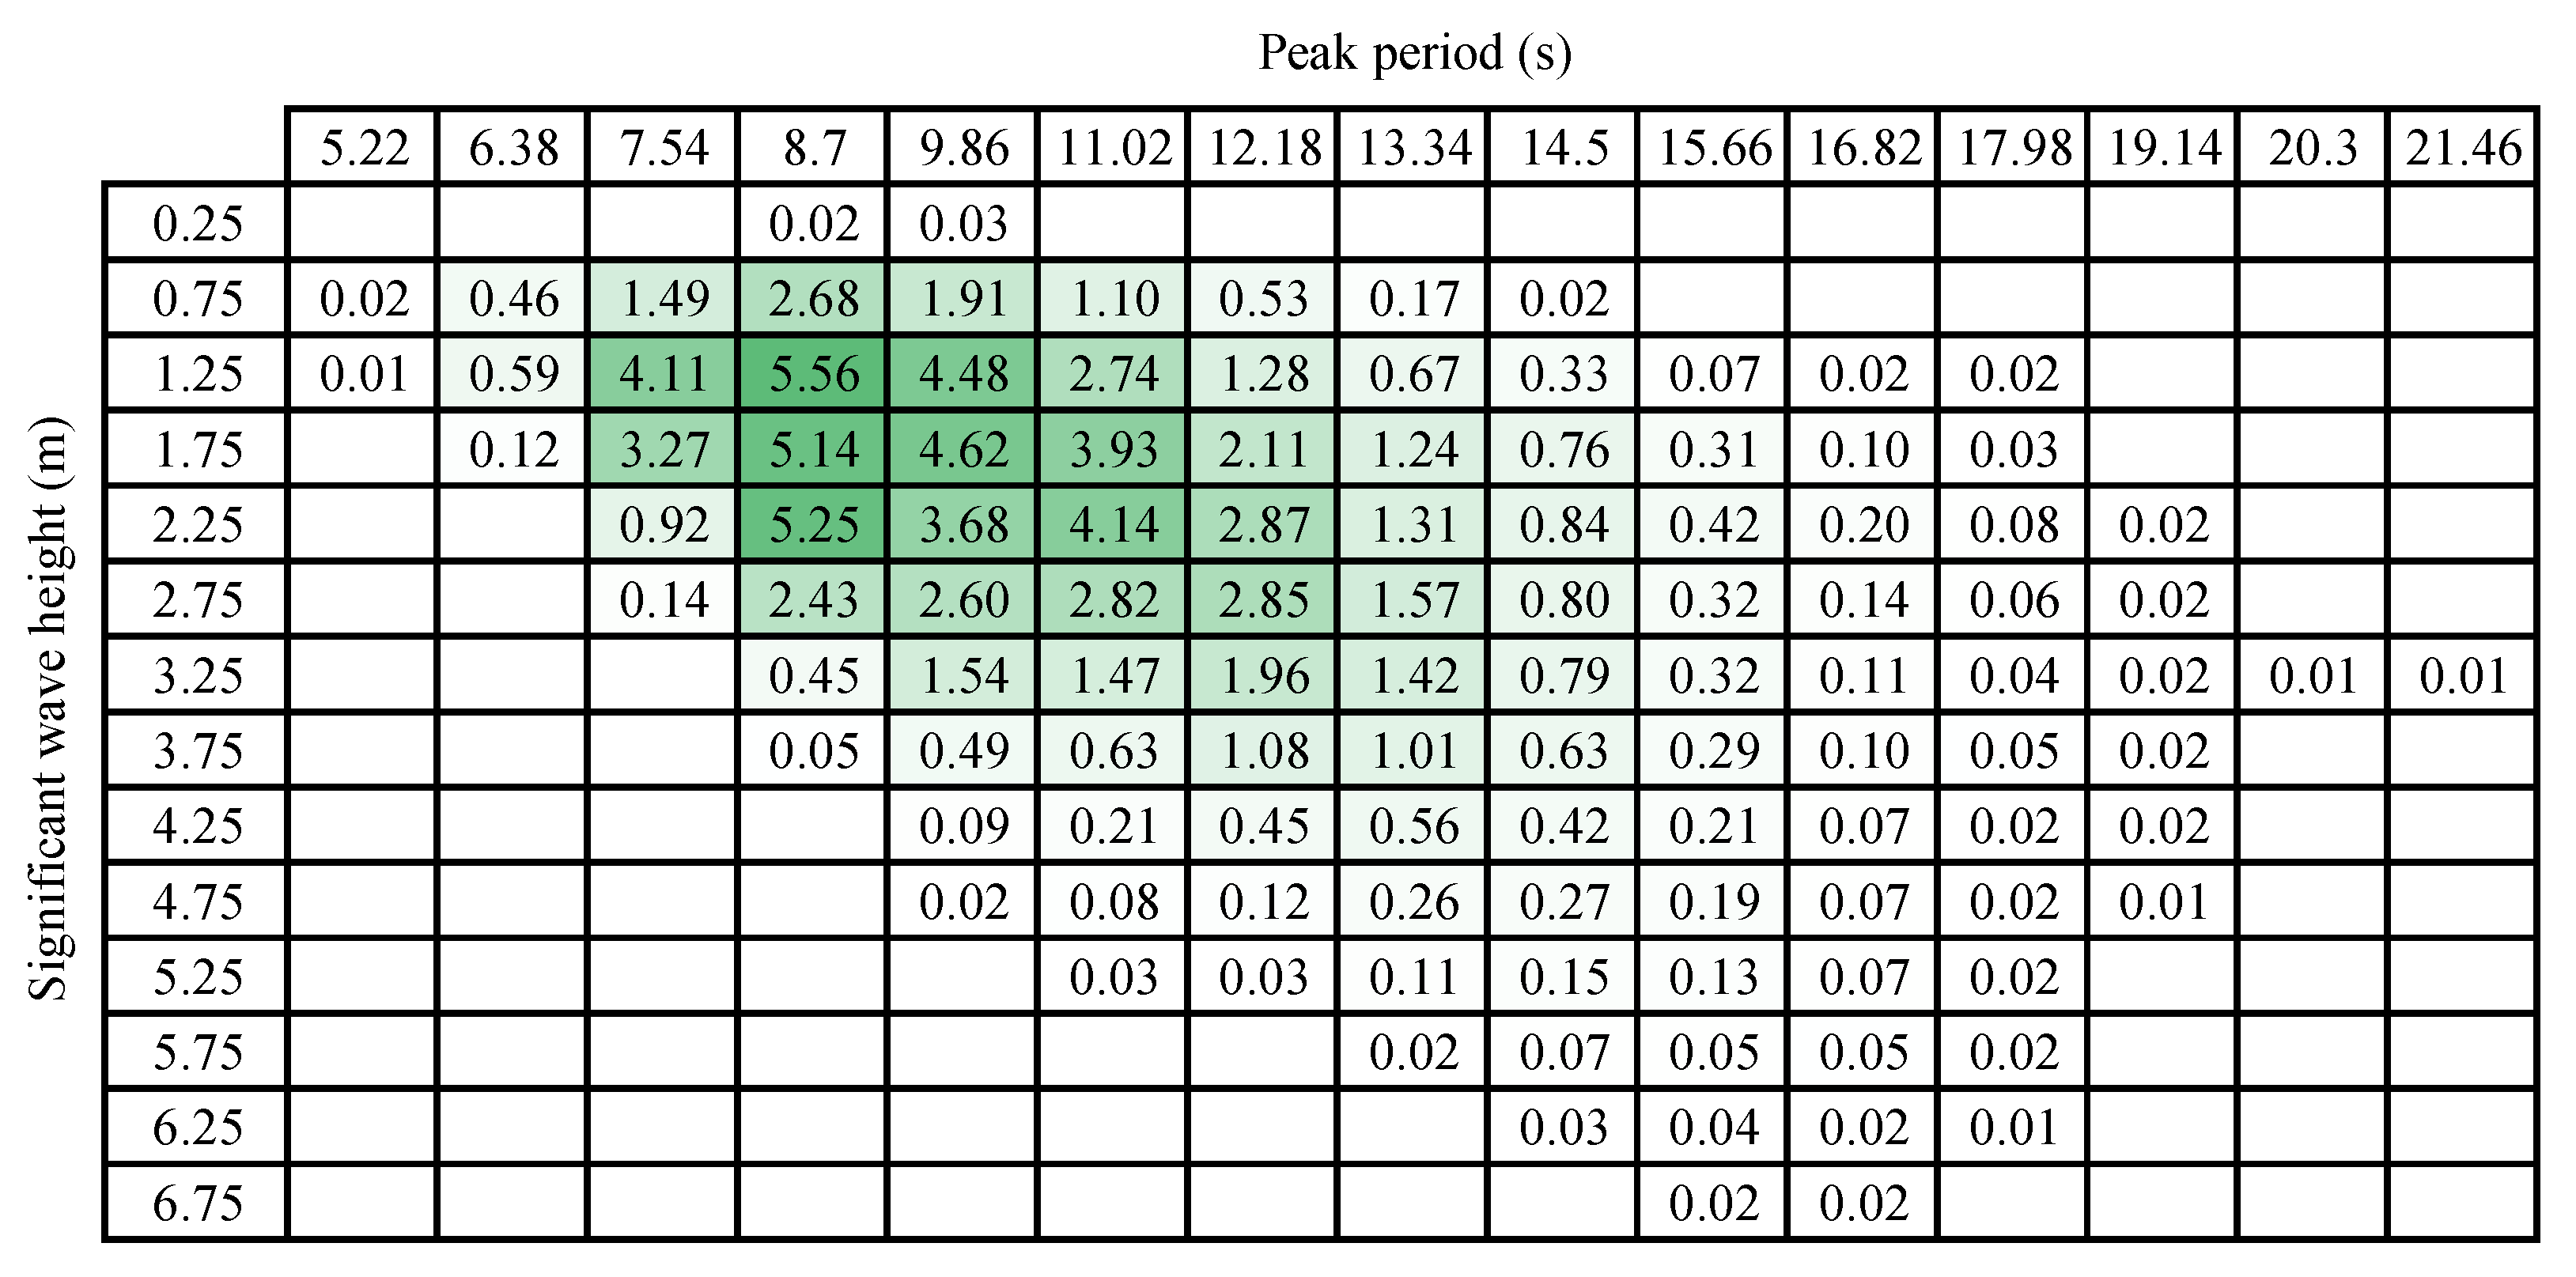
In keeping with the prior study, this work considers the Oyster 1 WEC, an oscillating wave surge converter (OWSC) designed by the Irish company Aquamarine Power Ltd. (Edinburgh, UK) [
9]. Historical data for the occurrence rate of sea conditions near Humboldt Bay, CA, shown in
Figure 2, are used to weight average power capture performance across sea conditions, providing estimates for annual average performance. These data were originally generated for [
1] using the methods given in [
28]. Bench-marking performance results of this study is facilitated by literature that has considered this WEC in design studies [
1,
3,
7] and experimental testing [
29], including results assuming the same rates of occurrence for sea conditions [
1].
The remainder of this report is structured as follows. The following section presents the methods of the study, consisting of the dynamic model used for simulating the WEC, the implementation of model predictive control, and the structure of three design studies. This is followed by a presentation of results from these three design studies. The paper closes with a discussion of the results, a statement of conclusions drawn from this work, and suggestions for future work.
2. Methods
The methods for this work consist of three parts: the system model, the implementation of the model’s predictive control for the PTO load (forces between the WEC and PTO), and the structure of the design studies. The design studies for this work consider the effects of design requirements for the PTO on the average power absorption by the WEC using a constrained optimization of the PTO load on the WEC. Specifically, the design studies account for limits on the range of the PTO load and limits to the speed of load adjustment. These are implemented as constraints on the PTO load in the optimization problem within the model’s predictive control algorithm. In this work, the ‘true’ system and predictive model are the same time domain model simulating the hydrodynamics of the WEC. Further details for the system model, the model’s predictive control implementation, and design studies are presented in the following subsections.
2.1. WEC Model
The model used to simulate the behavior of the WEC is identical to the model used by the prior study motivating this work ([
11]). A summary of the modeling approach is provided here, but the reader may refer to the prior publication for more details.
The model of the WEC includes the effect of inertia, weight, buoyancy, and the time history effects of the WEC motion on the surrounding fluid that lead to energy being radiated away from the WEC. The WEC is forced by incoming waves and by the reaction torque of the PTO. It loses energy to the radiated waves. Models of the radiation damping (characterized by the Cummins equation [
30]) and excitation force from the waves are parameterized using NEMOH, a free and open-source, boundary-element-method-based frequency-domain potential flow solver [
31]. This software provides frequency-dependent coefficients for the excitation force and an impulse response function for the radiation damping. Modeling the radiation damping using the convolution integral in the Cummins equation is computationally expensive; instead, the radiation damping force is modeled by a linear system that approximates the impulse response provided by NEMOH. This linear system is identified using the algorithm presented in [
32]. The system order was chosen to be a third-order system through iteration using this method. The hydrostatic restoring force on the WEC approximates the flap-like, OWSC-type WEC as a thin flat plate, accounting for both partial and full submersion of the WEC, along with changes in wave elevation.
Wave elevation and WEC excitation force are represented by discrete, finite trigonometric series that implement an inverse Fourier transformation of a power spectrum representing the frequency content of a realistic wave environment. The time series model of wave elevation is parameterized by an amplitude coefficient derived from the power spectrum and phase angles that are generated by a random number generator, producing a uniform probability distribution. Discretization of the frequency domain is performed using an equal-energy method, where the integral of the power spectrum for each discrete frequency bin is equal. This method is preferred over specifying constant bin widths because it provides signals that do not repeat within any practical length of time. The Pierson–Moskowitz spectrum, describing fully developed waves [
33], is used. This power spectrum can be expressed as follows:
where
is the significant wave height,
is the peak wave period, and
denotes the frequency in radians per second. The excitation force is scaled in amplitude and features a shifted phase from the wave elevation time series. These amplitude and phase coefficients are provided by NEMOH.
A variety of realizations of the same sea condition can be obtained using different sets of random values for the phase angles in the wave elevation frequency components. These can be controlled by a seed value provided to the random number generator. However, this study only uses a single realization for each sea state, with the same seed value and discretization of Equation (
1) used in all cases.
To validate the performance of this WEC model, its results were compared to experimental results from [
29] and results reported in [
7] using WEC-Sim (wave energy converter SIMulator), an open-source hydrodynamic model developed by the National Renewable Energy Laboratory and Sandia National Laboratories. In both cases, linear damping was used to represent the PTO, where the reaction force was proportional to velocity; this was replicated for the validation of the model used for this work. This validation is presented in [
11], but to summarize, a comparison of results showed that the model’s mean power captured across several simulated realizations of realistic waves matched results from the WEC-Sim model and were within 12% of the experimental results.
The parameters used in each simulation for the following studies are presented in
Table 1. The parameters for the WEC design assumed for these simulations are presented in
Table 2. The geometry provided to NEMOH is identical to the geometry used in [
29].
2.2. Model Predictive Control
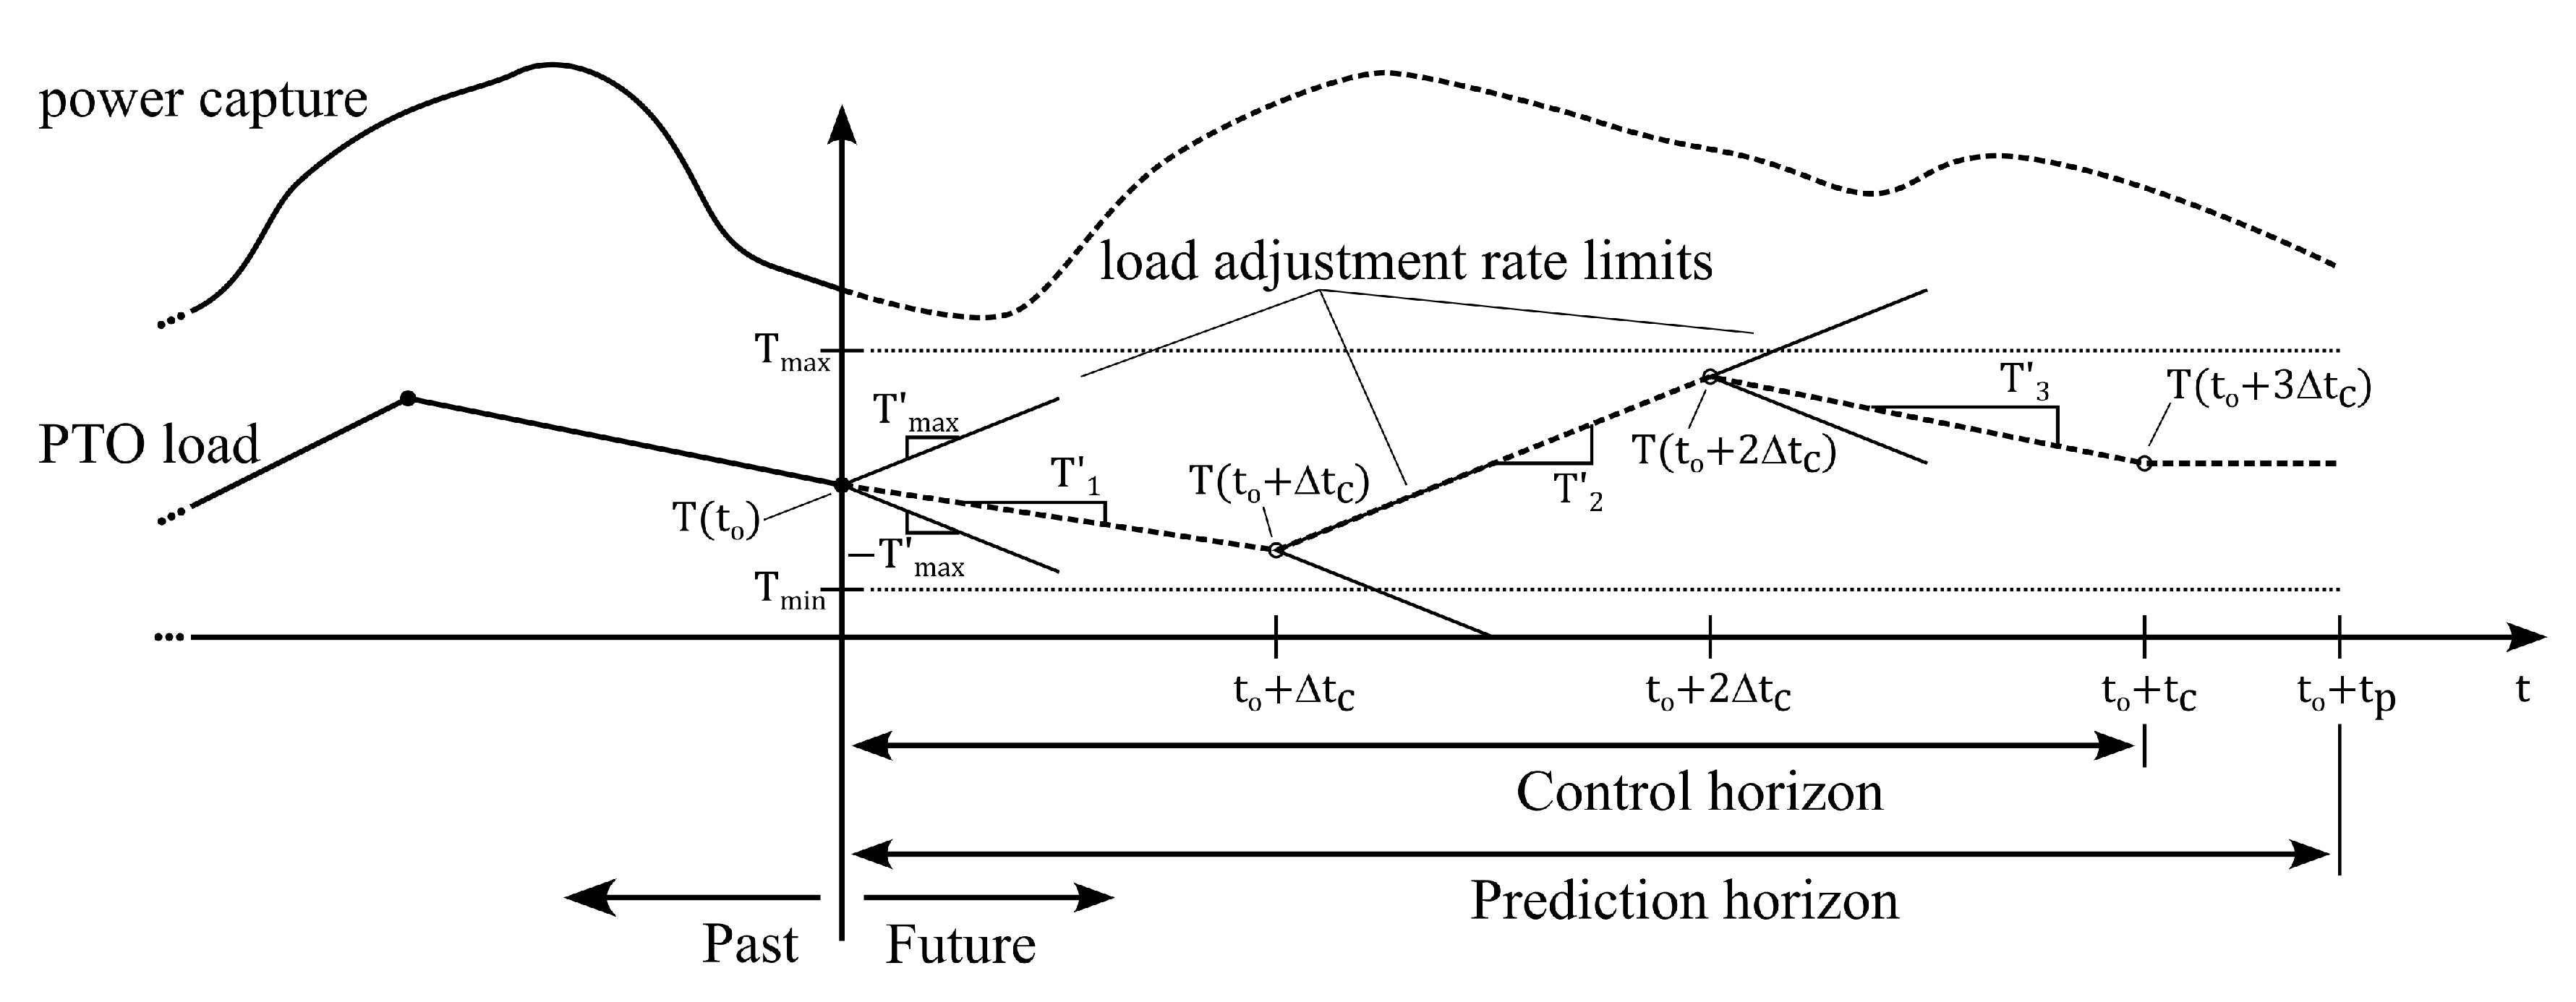
This work assumes the PTO load as the control signal generated by the model’s predictive control. The passivity of the PTO is enforced by defining the PTO load as the magnitude of the PTO’s reaction force on the WEC, which opposes the WEC motion. Given that the PTO load is a function of continuous states within the PTO system (e.g., the position of the displacement adjustment mechanism in a variable displacement pump or charge state of hydraulic accumulators), the PTO load is formulated as being continuous in the model’s predictive control; as such, the PTO load control signal is implemented as a linear interpolation between the discrete control updates rather than being held constant. For the flap-like OWSC device, the reaction force from the PTO is a torque on the WEC.
The formulation of the PTO load for optimization in the model’s predictive control framework is illustrated in
Figure 3. In the model-predictive control framework, the system has some history in the past, establishing the system state, and a future that will be determined based on future choices for the PTO load. At a given time,
, the algorithm is tasked with producing an optimal choice for the PTO load,
, over the next control interval,
. That decision is based on predictions of the system behavior over some prediction horizon,
. To limit the size of the variable space,
n discrete control points in time,
(where
), are distributed equally throughout the control horizon,
, distinguishing
n control intervals. The PTO load at each control point,
, serves as a single variable within a constrained, multi-variable optimization problem, with the PTO load assuming a constant slope (i.e., the first derivative with respect to time) between control points,
. After the optimal PTO load is determined for this control horizon, the system implements the PTO load for the immediate control interval,
. The system then evolves until the end of the control interval,
, and the process is repeated to predict the optimal PTO load over the new control horizon and determine the load to be implemented for the next control interval.
As illustrated in
Figure 3, the PTO load is specified as being constant after the final control interval to complete the prediction horizon. In this work, the prediction horizon has been specified as being longer than the control horizon by 1.5 times the control period; that is,
. The intent of this practice is to provide additional influence of future system behavior on the selection of control inputs at a lower computational cost than adding to the number of control points; this assumes that the computation of the system behavior over the interval
is cheaper than the added dimensionality of the variable space in the optimization.
Limits on the PTO load are illustrated in
Figure 3 as the maximum load,
, the minimum load,
, and a maximum magnitude for the rate of change in the PTO load,
. Consequently, the optimization problem is as follows: select the variables
that maximize the average power captured over the interval
, subject to the constraints
and
.
The nonlinear, constrained optimization implemented in this work uses the interior-point method, as implemented by the function fmincon() within the computing software MATLAB. This algorithm requires initial values. The initial values provided for the start of the computations are all equal and are the average of the minimum and maximum torque; that is, . This places the initial values at the center of the variable space meeting all constraints. Going forward from the first control update, the initial values provided to the optimization algorithm are the optimal results from the prior control update. The initial value for torque at the end of each new control horizon is set equal to the initial value of the second to last control update period; that is, . This follows from the assumed constant PTO load over the interval .
Surrogate variables are used in place of the constraints given above. These serve as more practical descriptors of the PTO performance requirements and serve as the parameters varied in the design studies that follow. The minimum fractional load,
f, is defined as a surrogate for the minimum load:
The minimum transition time between the minimum and maximum load value,
, is defined as a surrogate for the maximum rate of change in the load:
2.3. Design Studies
Three design studies are presented in this work. The first varies the parameters of the model’s predictive control (the control update period, , and the length of the control horizon, ) to determine their effects on the performance and to identify suitable values to be used in the second and third studies. This study only considers the performances of the WEC and PTO in a single sea state. The second and third studies vary values of the constraints on the PTO load to determine their effects on the performance.
The second study only considers the performance of the WEC and PTO in a single sea state, while the third study considers the yearly-average performance using historical data from Humboldt Bay, CA to weigh the performances from 114 distinct sea states, as presented in
Table 2. The constraints on the PTO load, as discussed above, include (1) the upper limit to the PTO load,
, (2) the lower limit to the PTO load, as a fraction of the upper limit,
f, and (3) the limit to the rate of change in the PTO load, as the minimum time required to adjust the load between extremes,
. The second study varies all three constraints while the third study assumes a specific value for the limit to the rate of change based on the results of the second study.
Results from the second and third studies are compared to results where Coulomb damping is used. The Coulomb damping results represent two cases. First, for a given maximum PTO load, the magnitude of the Coulomb damping is identical to the maximum load (’fixed Coulomb damping’). That is, . Second, an optimal choice for the Coulomb damping magnitude is made, subject to the same constraints as the model’s predictive control (’optimal Coulomb damping’). The optimization problem is posed as follows: select , for which , maximizing the average power captured over the simulated time interval subject to the constraint .
3. Results
The results of the three studies performed in this work are presented below. These include (1) a study on the performance of the MPC algorithm as a function of its parameters, namely the control update period and the length of the control horizon, (2) a study of the average WEC power absorption in a single sea state as a function of PTO load constraints, namely the maximum torque, the minimum fractional load, and the minimum load transition time, and (3) a study of the weighted average power absorption for the sea states presented in
Table 2, as a function of the maximum torque and the minimum fractional load. All results represent performance in an identical realization for the wave elevation in each given sea state. The results exclude a 250 s start-up duration and are averaged over 500 s of simulation time in the first study and 2000 s of simulation time in the second and third studies.
3.1. Mpc Algorithm Parameter Study
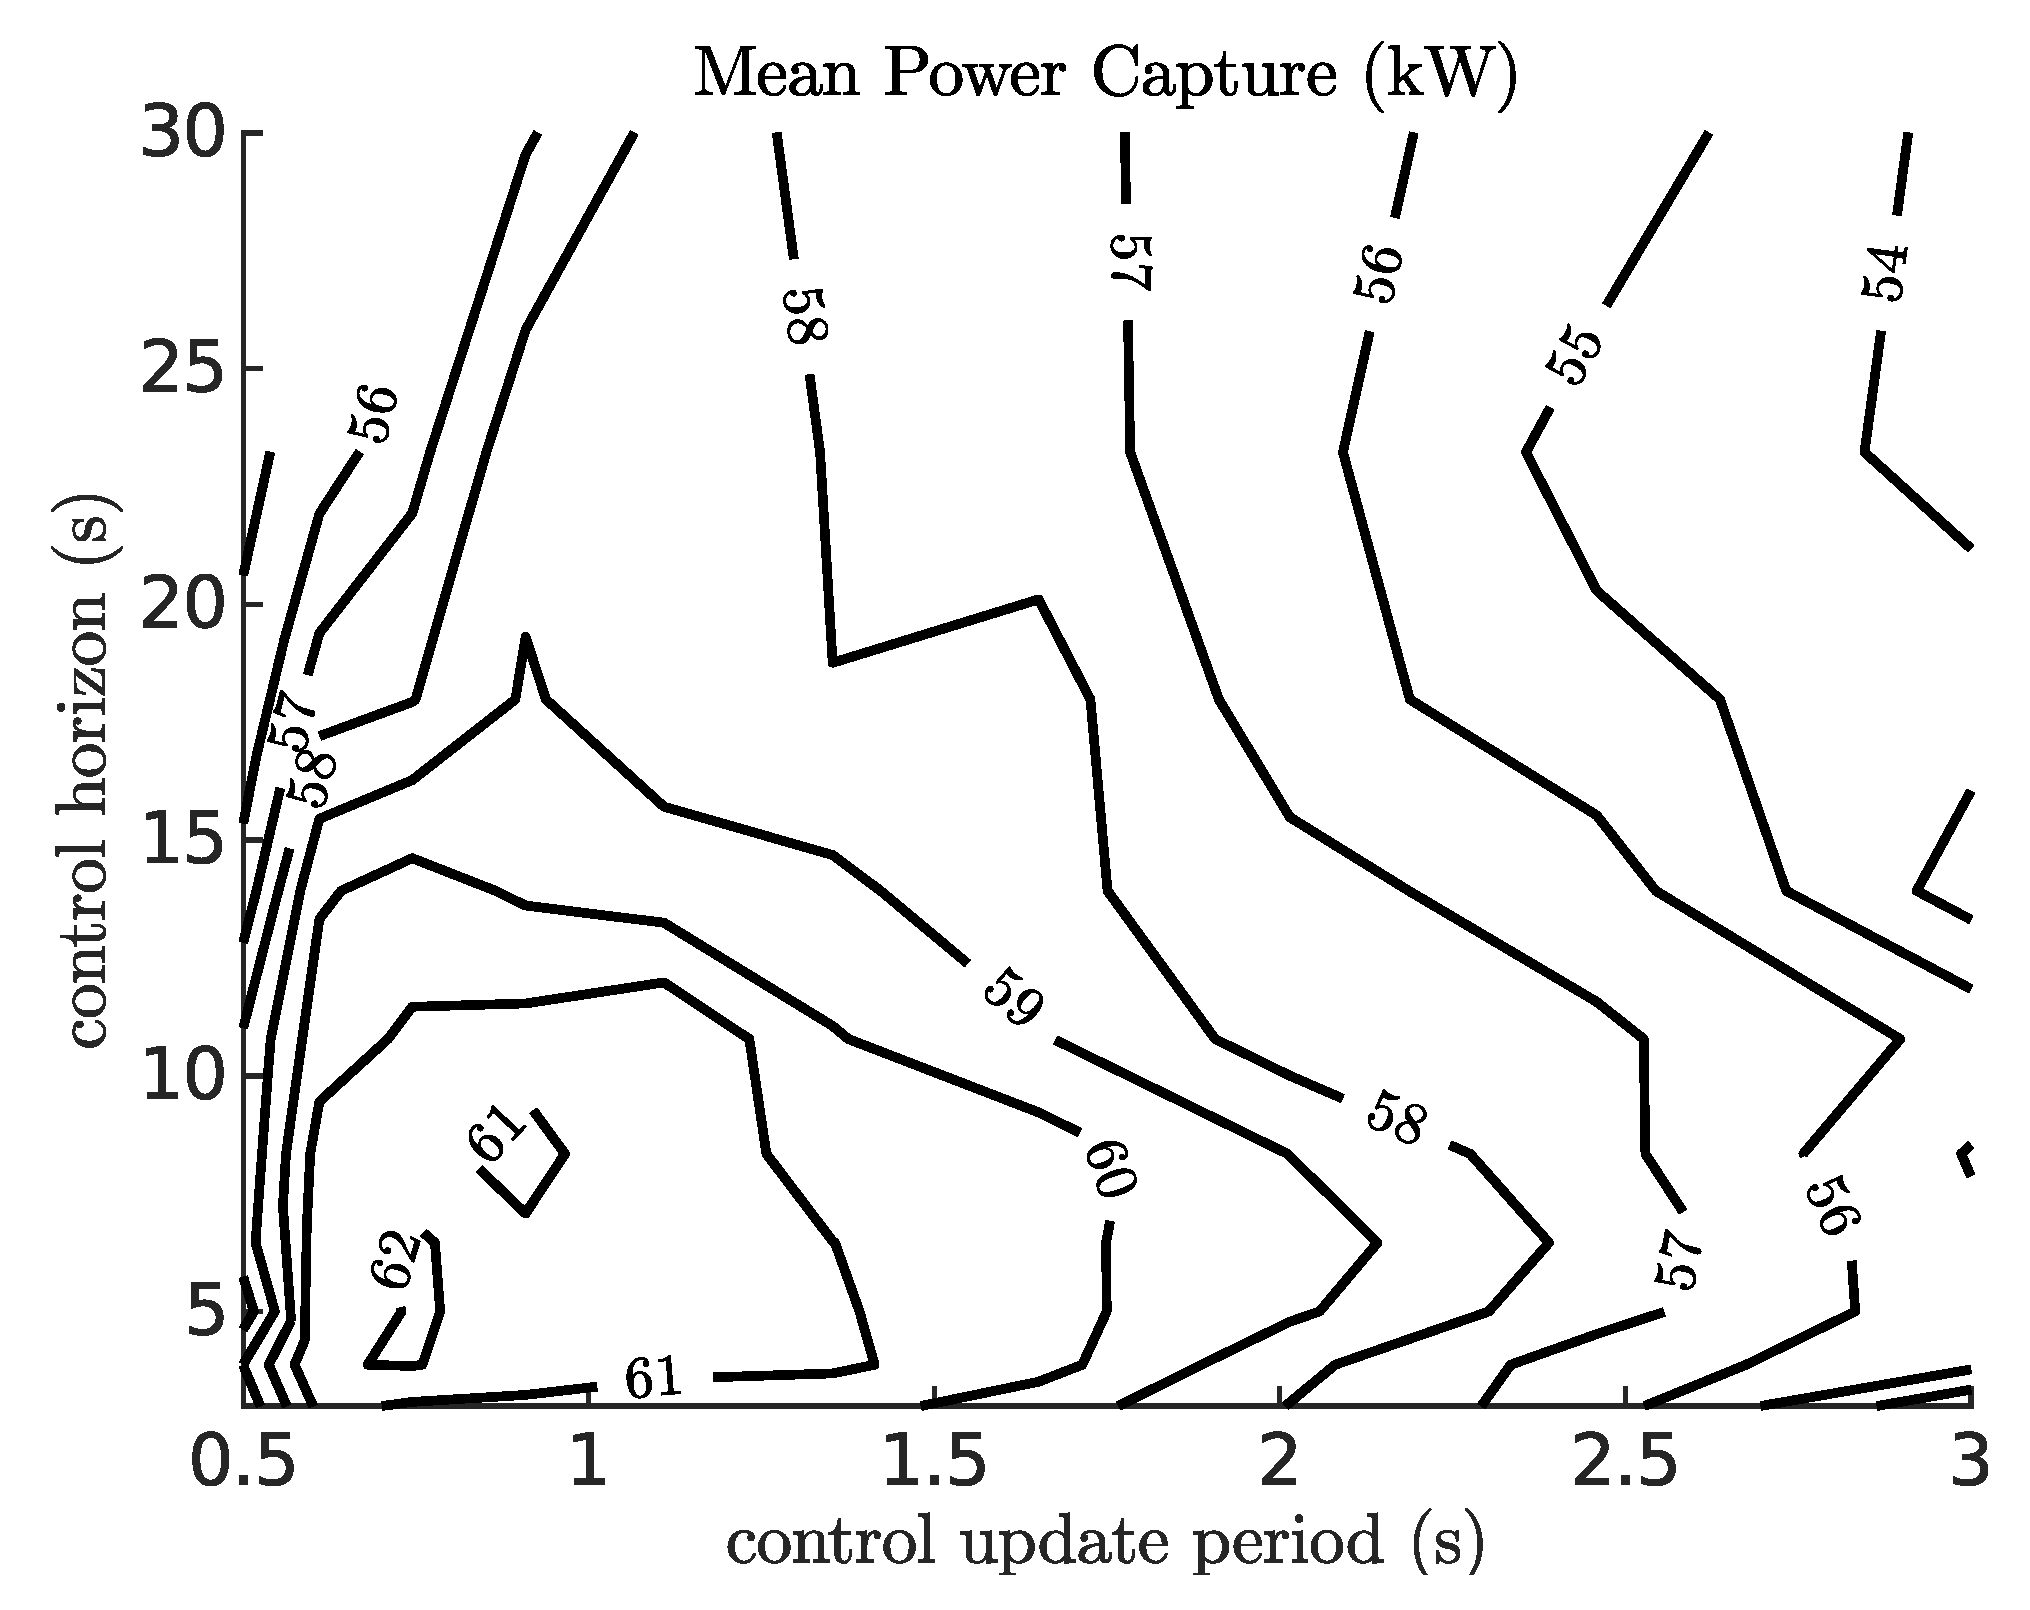
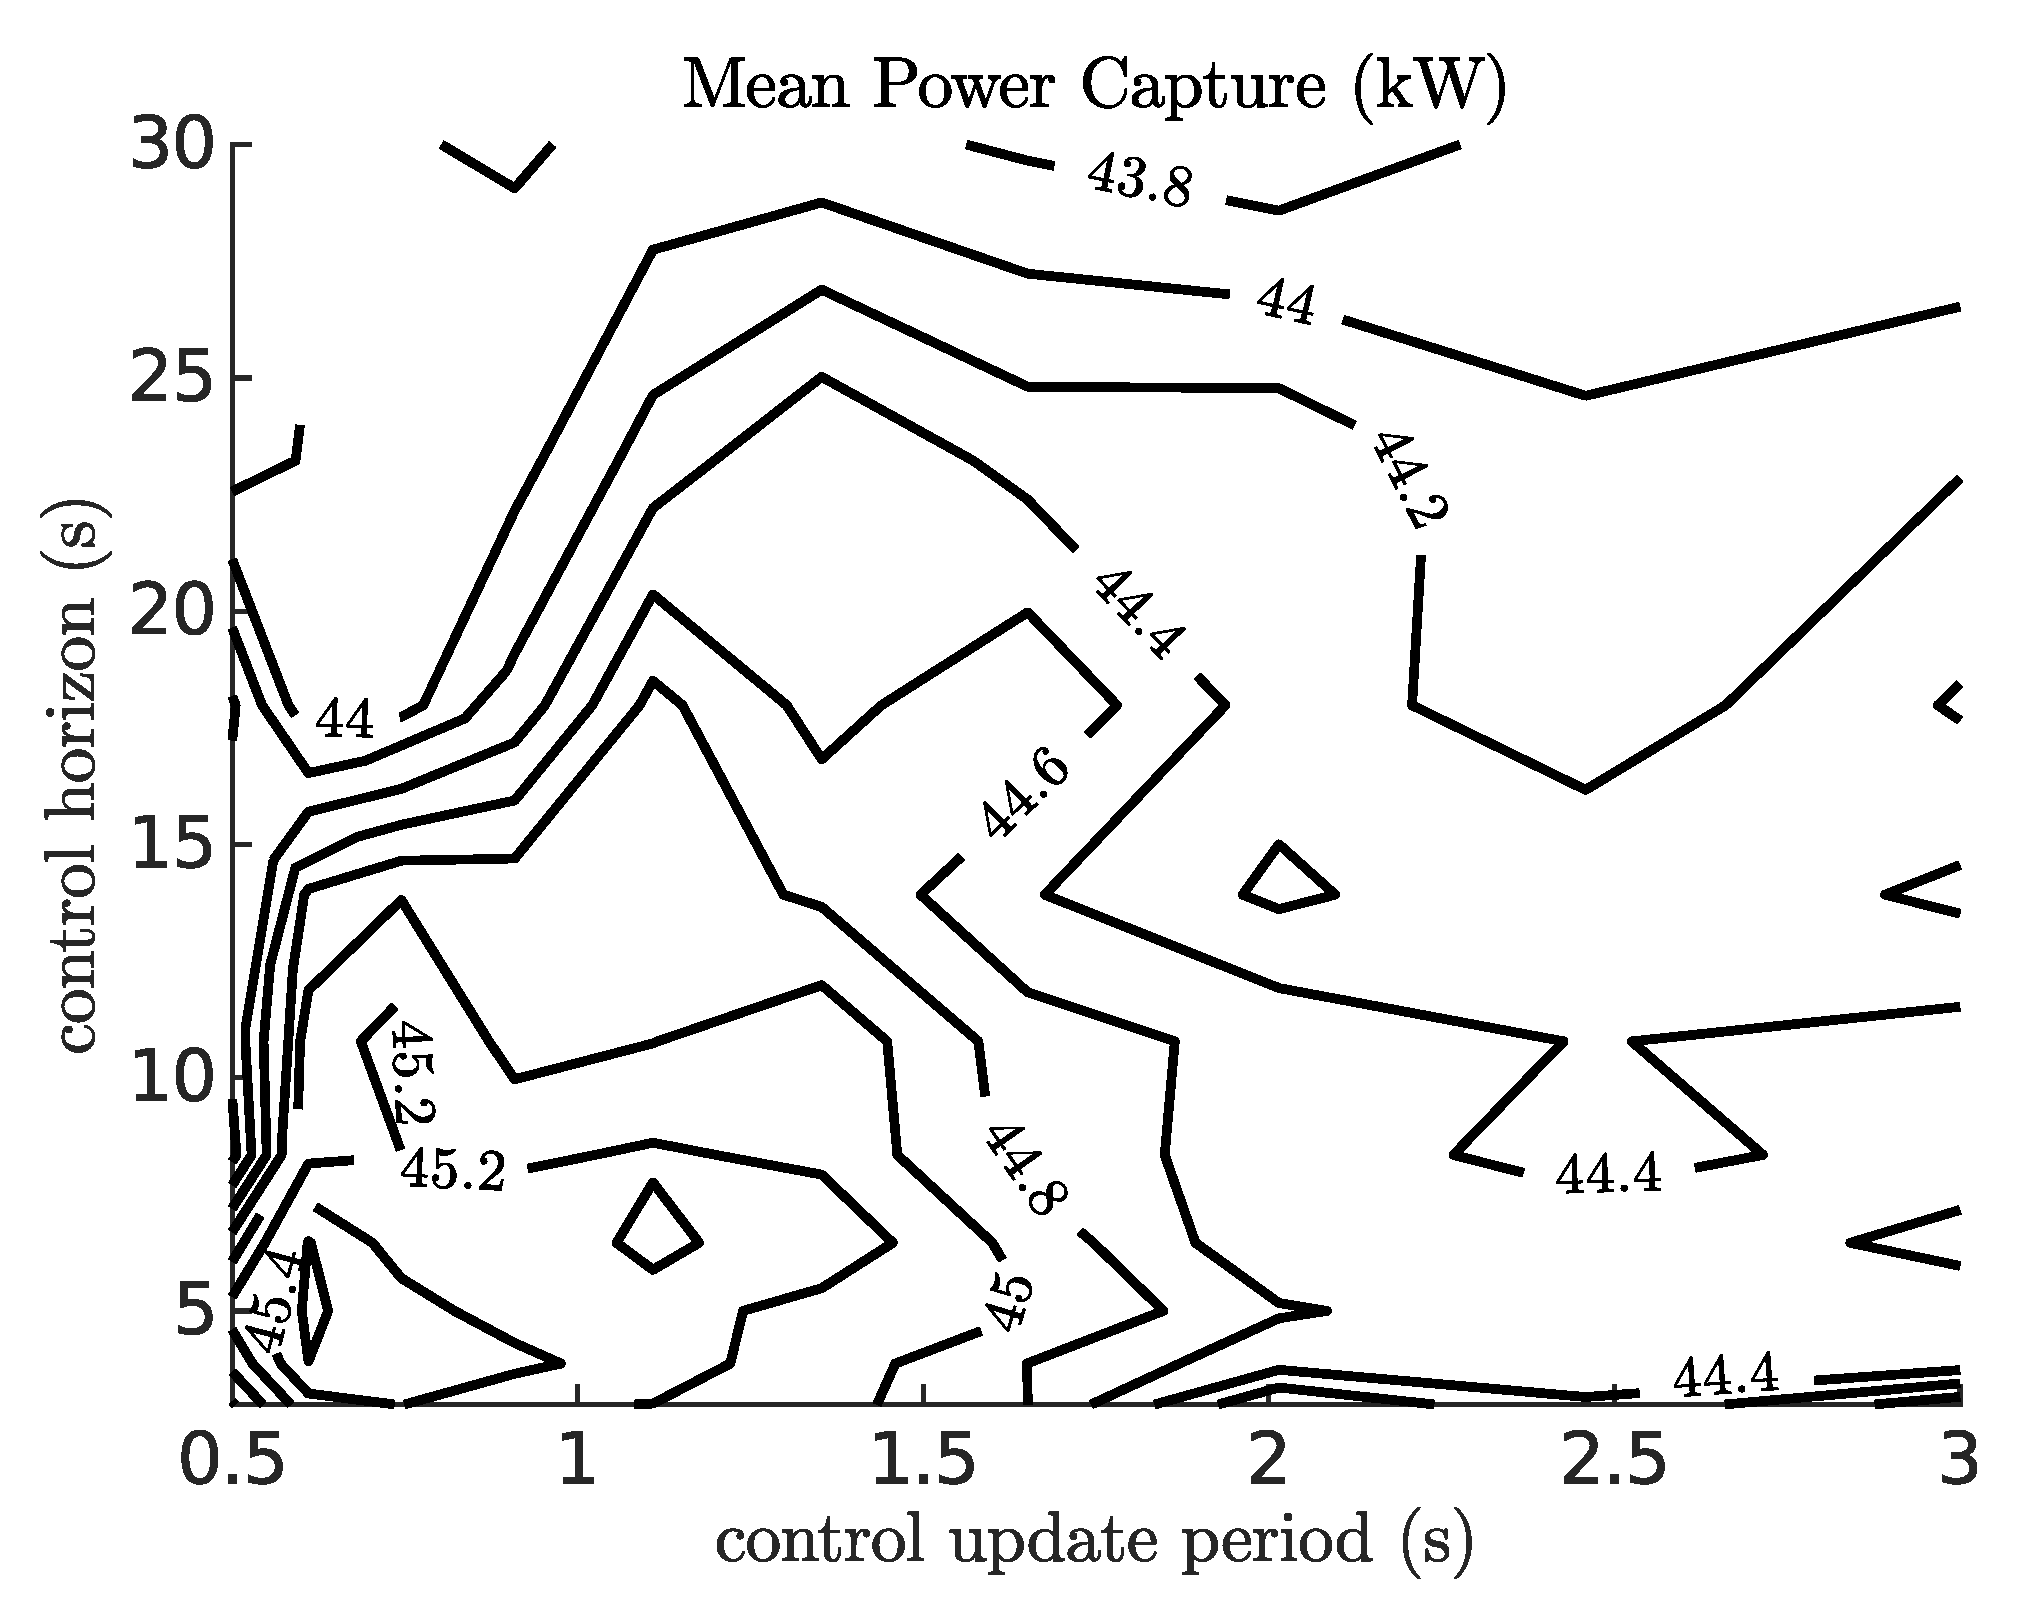
Three cases are examined for a study on the MPC algorithm parameters, with each assuming different values for the PTO load constraints. The results presented in
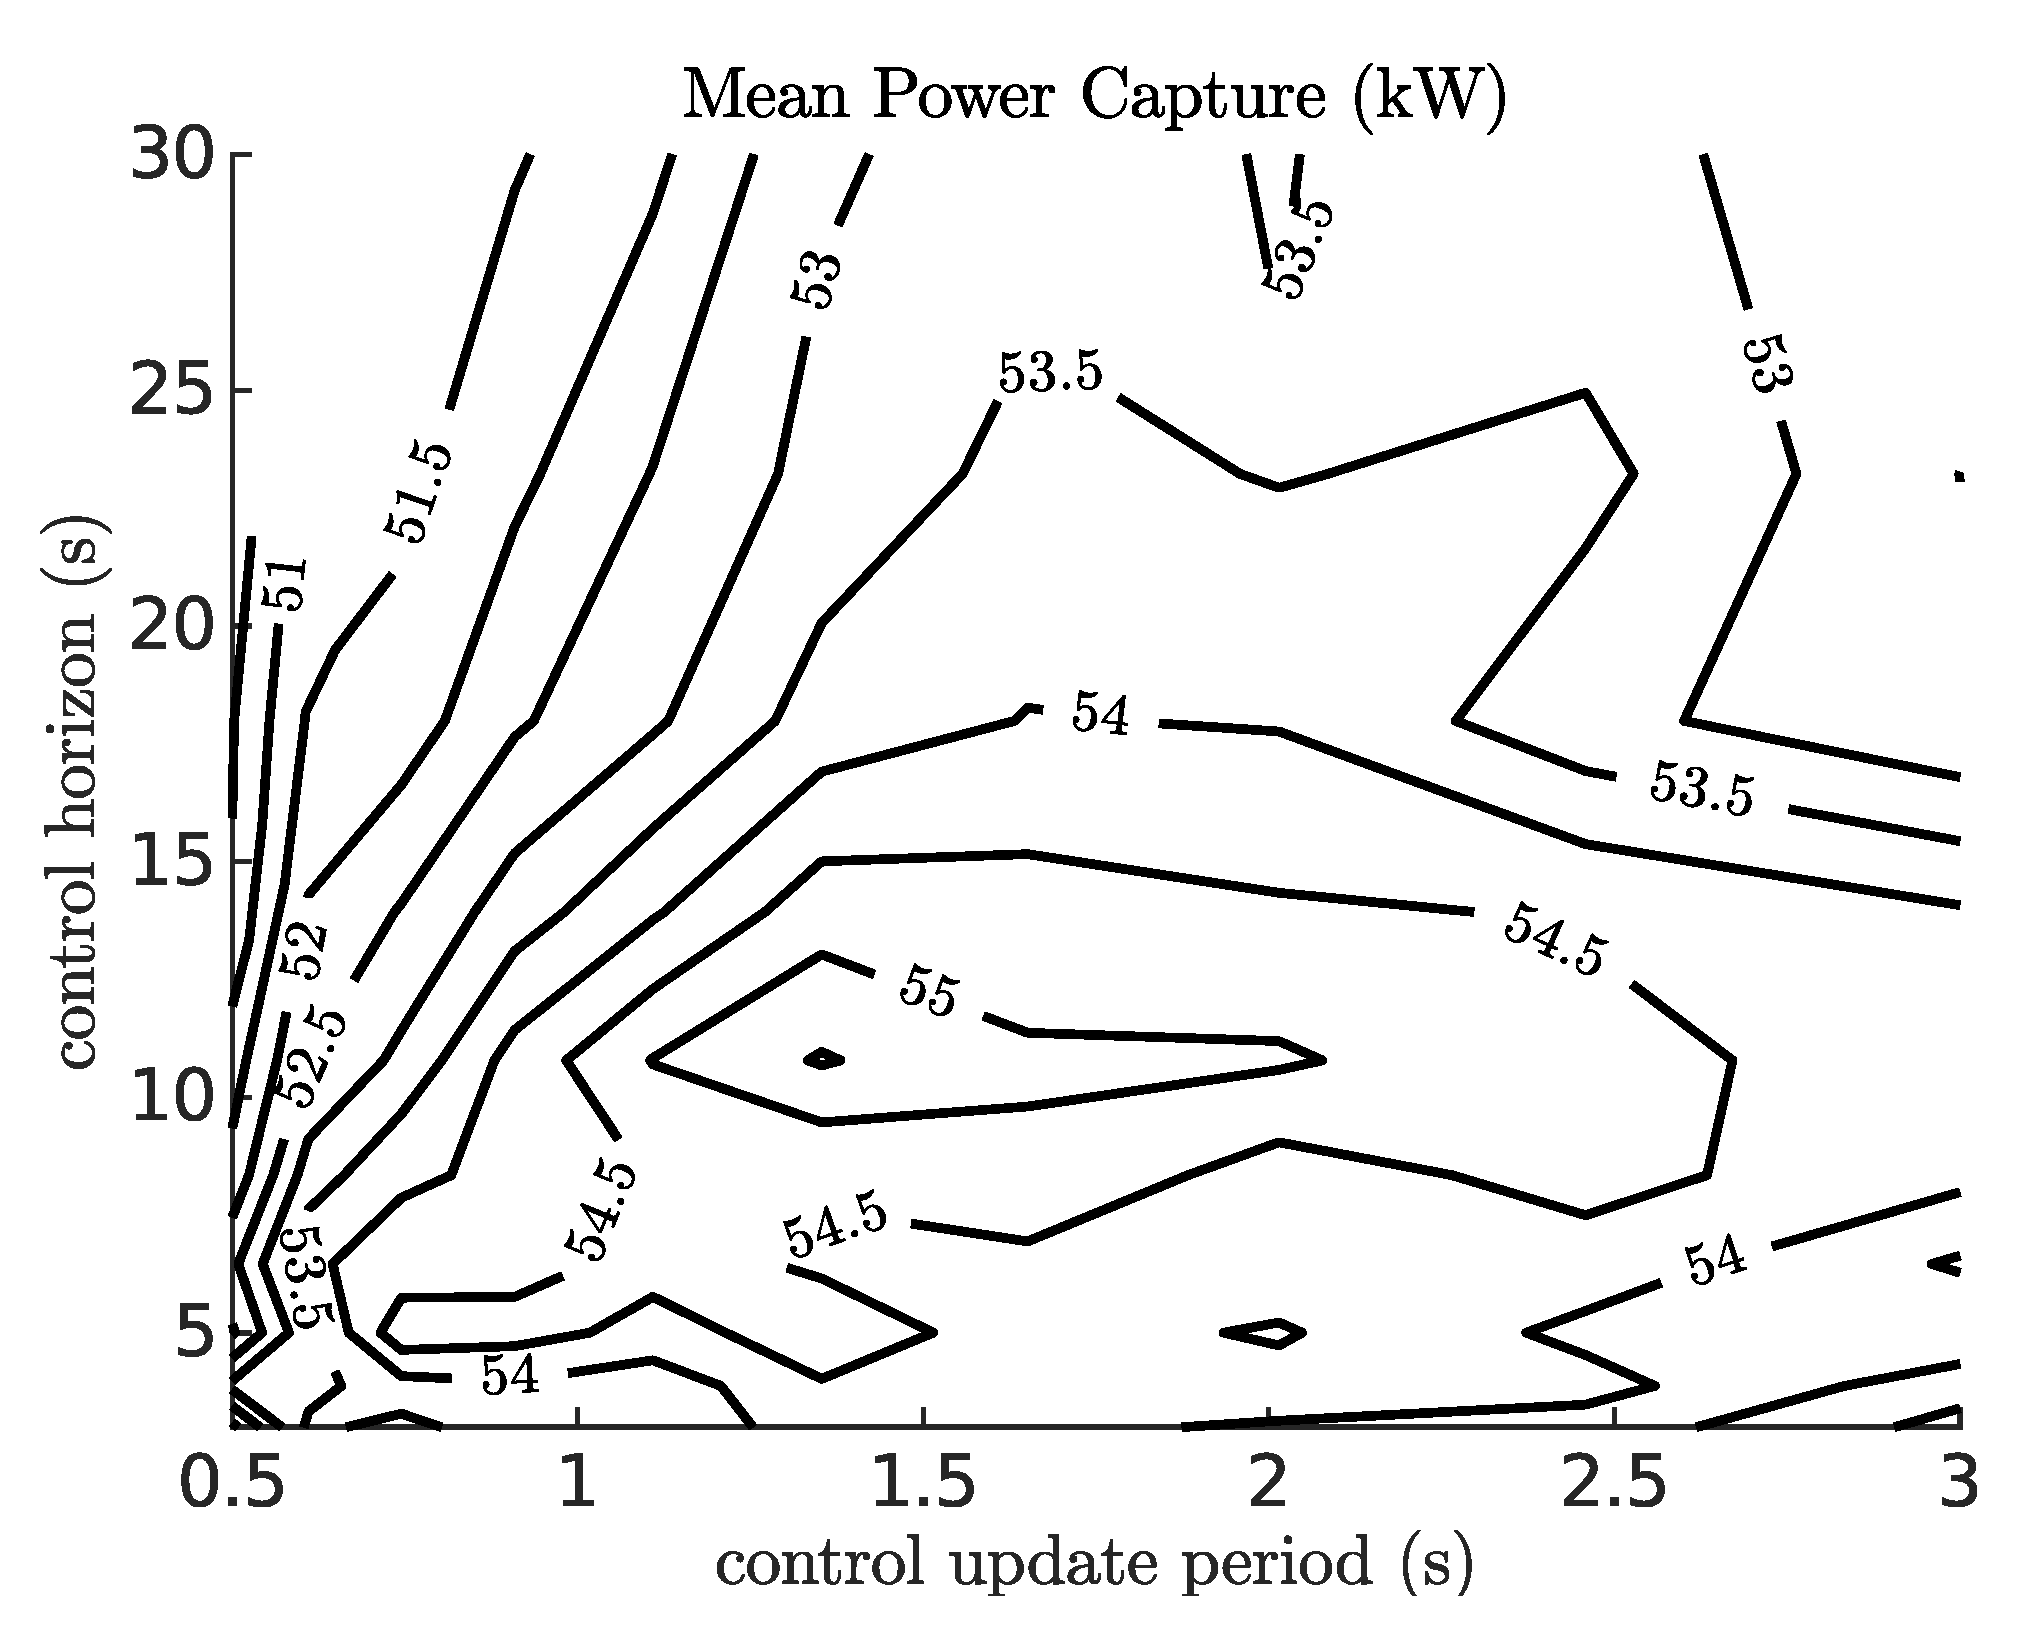
Figure 4 assume 5 MNm as the maximum torque, 0 as the minimum torque, and 5 s for the minimum transition time between the minimum and maximum torque. The other two studies assume the same except for a higher minimum torque of 3.75 MNm for results presented in
Figure 5 and a longer control horizon of 20 s for the results presented in
Figure 6. Each case assumes the same sea conditions, a significant wave height of 1.25, m and a peak period of 7.5 s.
The results are presented as contour plots with the contour lines being interpolated from a 10-by-10 grid of data points. Grid values are in the range of [3, 30] seconds for the length of the control horizon and [0.5, 3] seconds for the control update period and are evenly spaced on a base-10 log scale. Because the control horizon is composed of a series of control update periods, its length is rounded up to the nearest integer multiple of the control update period length. In each case, data are missing for the corner conditions with a control horizon of 30 s and a control update period of less than 0.75 s; for these values, the calculations fail to complete the computing resources within the time allotted.
In
Figure 4, the performance of the WEC at absorbing energy is maximized near a control update period of 0.75 s and a control horizon time of 5 s (the maximum points from the grid study are 0.745 s and 6.46 s, respectively). In
Figure 5, the maximum grid value is located at (0.61, 5.0) seconds. In
Figure 6, it is (1.35, 10.78) seconds. Despite the differences in the location of the maximum grid value, the power capture results at these locations within each dataset are within 4%. This suggests that PTO load constraints do not have a significant coupling effect with the parameters of the model’s predictive control algorithm near these choices and that 0.75 s and 5 s for the update period and control horizon are suitable for the following studies.
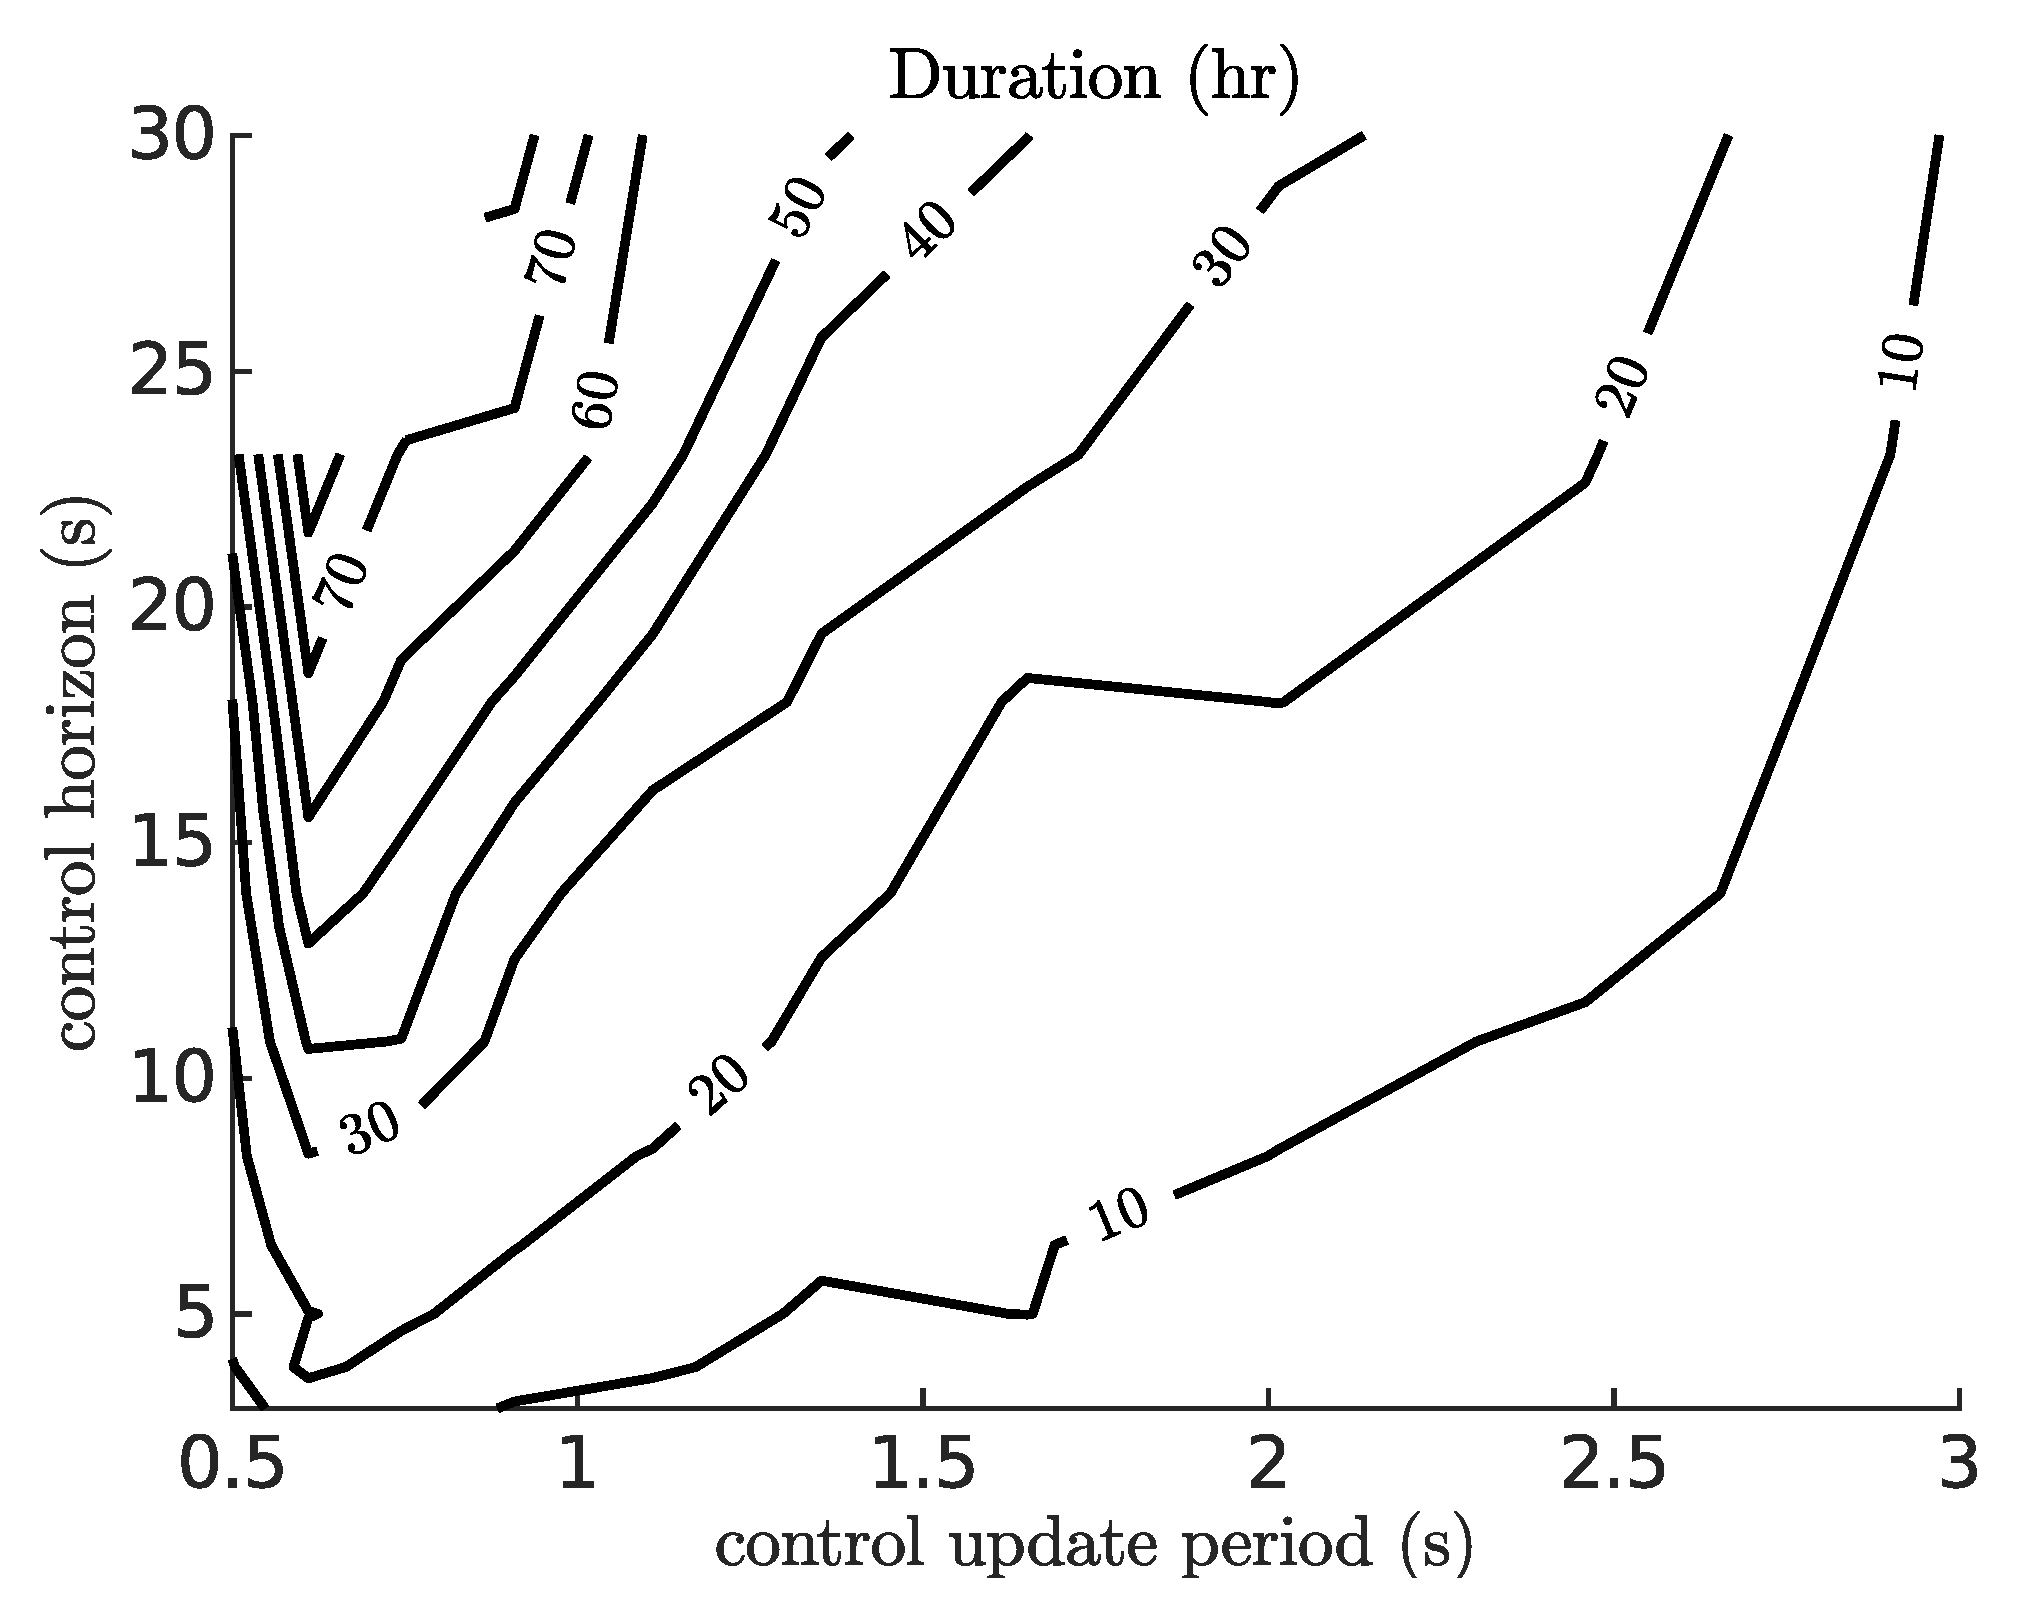
The length of time required to perform the computations for the entire optimized and simulated time of 500 s was recorded for the case presented in
Figure 4. These data are presented in
Figure 7 and are based on the use of 3 processor cores on an AMD EPYC 7302P with 16 Gigabytes of RAM available and with the MATLAB function
fmincon() executing function evaluations in parallel. Generally, the computational cost of the algorithm increases with an increasing time horizon and decreasing control update period as both increase the number of control points,
n, being optimized in the MPC algorithm, and with a longer control horizon increasing the length of the simulations performed in evaluating the objective function. The compute time is on the order of tens of hours, which is about two orders of magnitude higher than the simulated time of 0.14 h (500 s).
3.2. Load Constraint Study: Single Sea State
The second study considers the same single sea state as in
Section 3.1 (a significant wave of 1.25 m and a peak period of 7.5 s) but evaluates the influence of the maximum and minimum torques and the minimum load adjustment time on the WEC power absorption. The control update period and control horizon used for this study are 0.75 s and 5 s, respectively, based on the results of
Section 3.1.
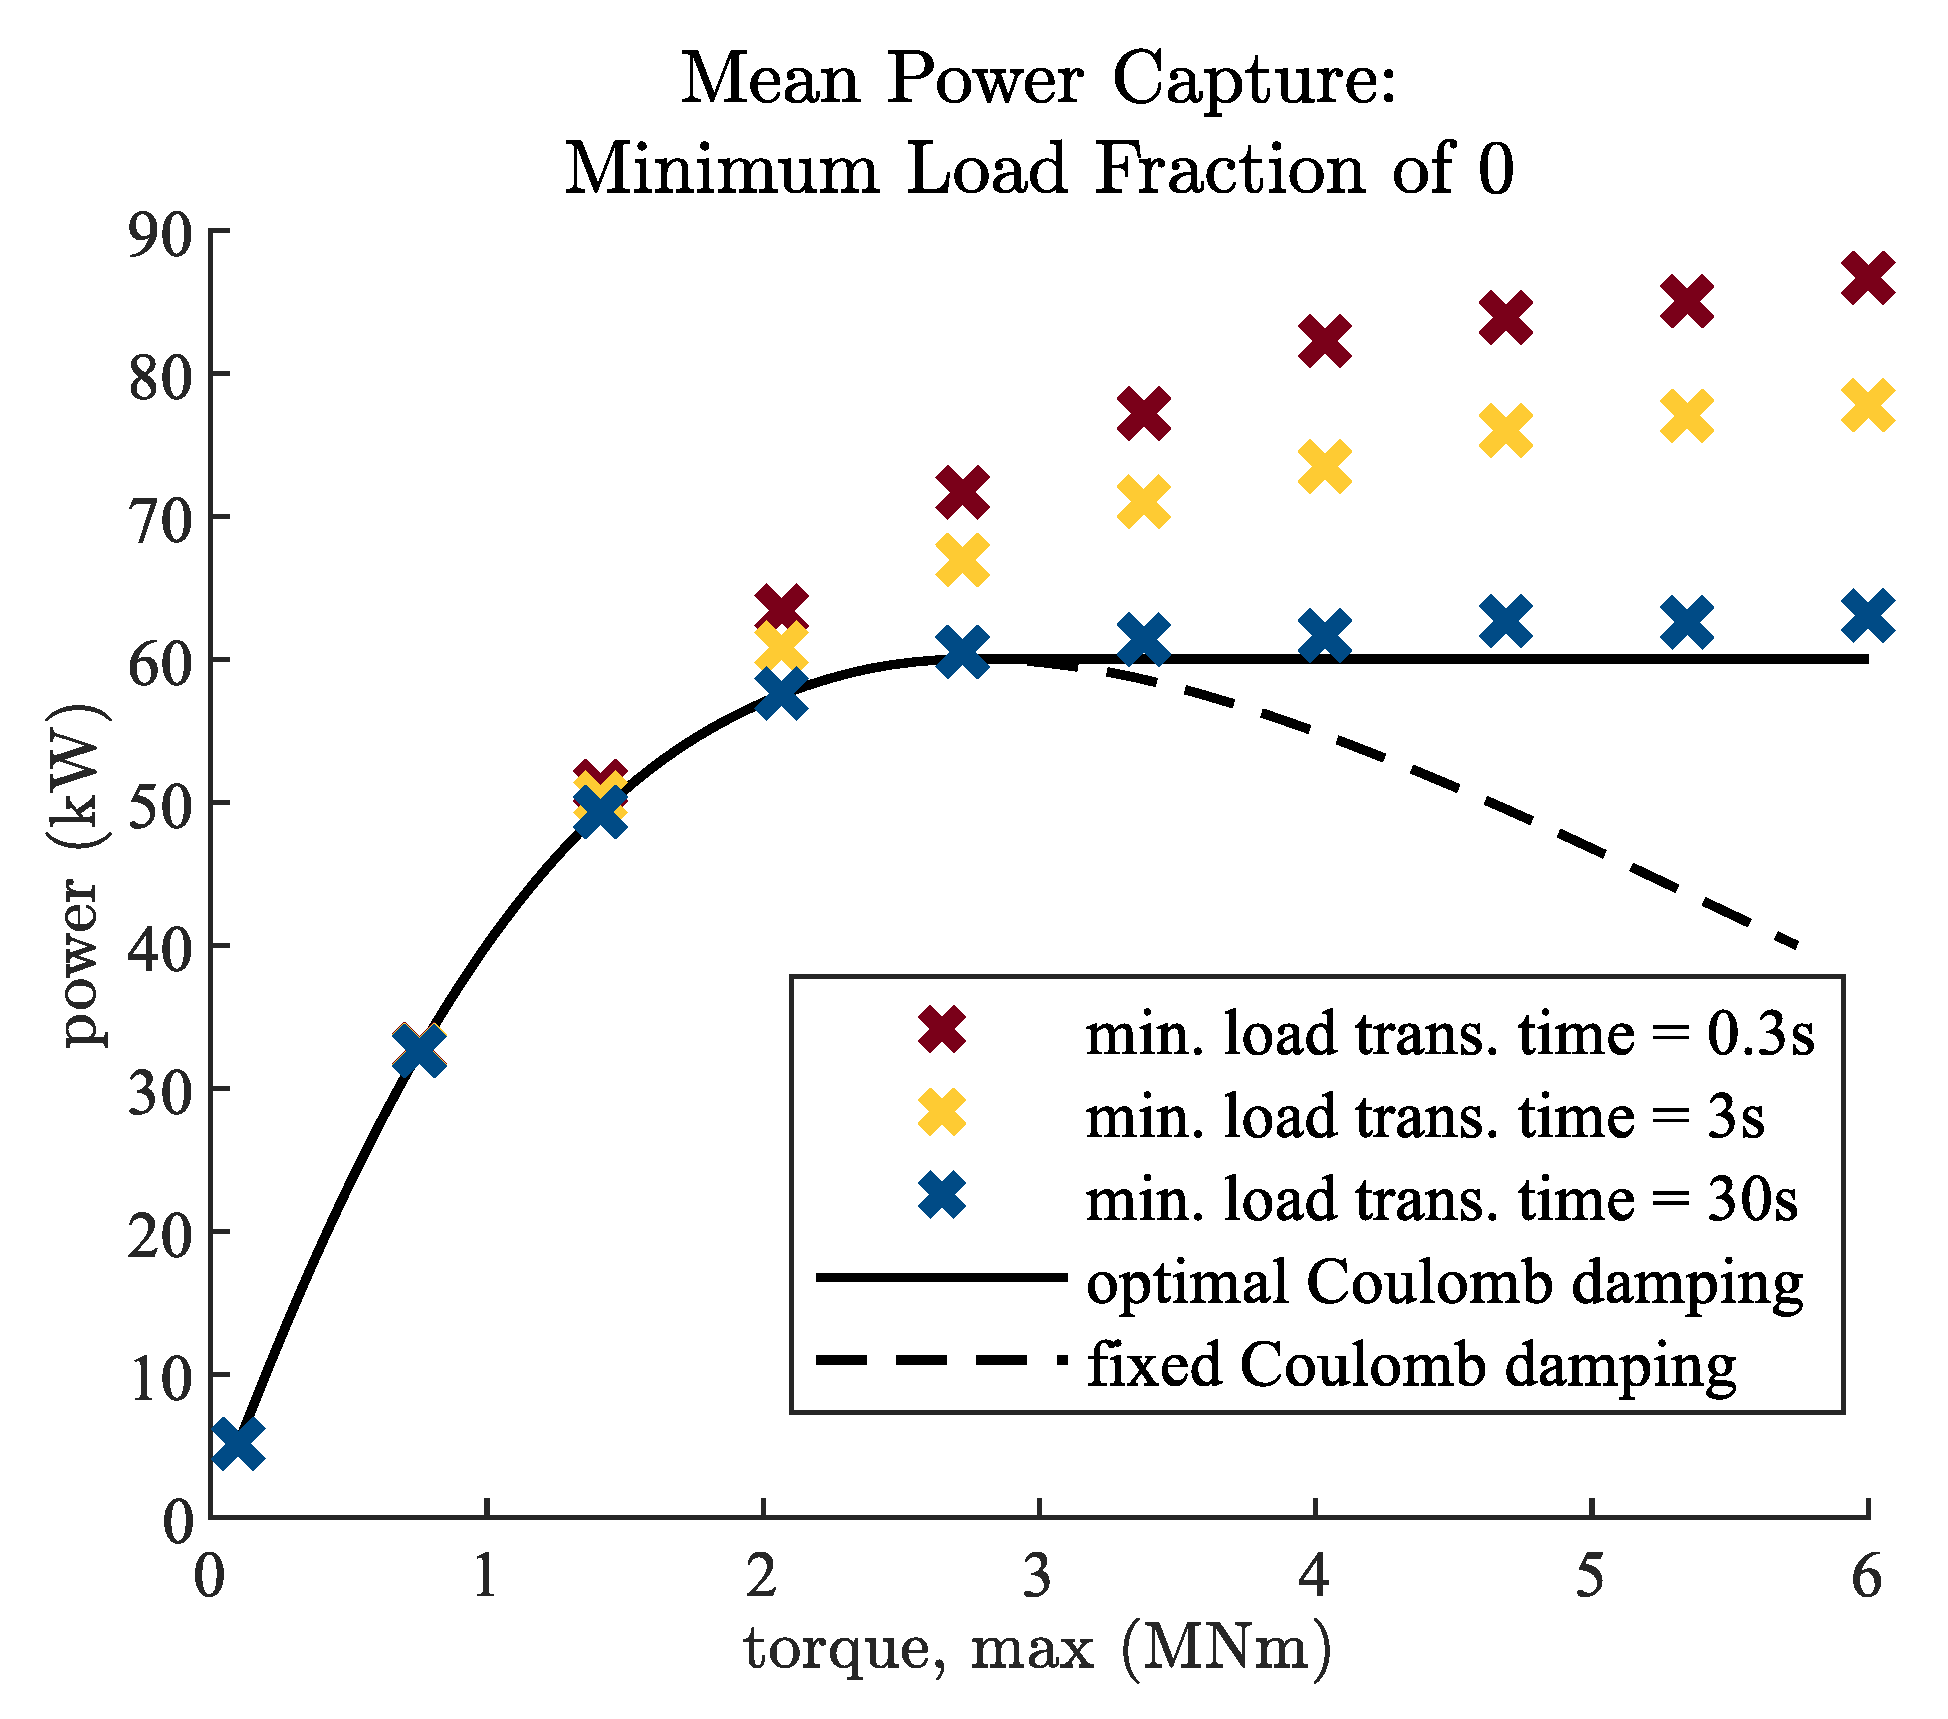
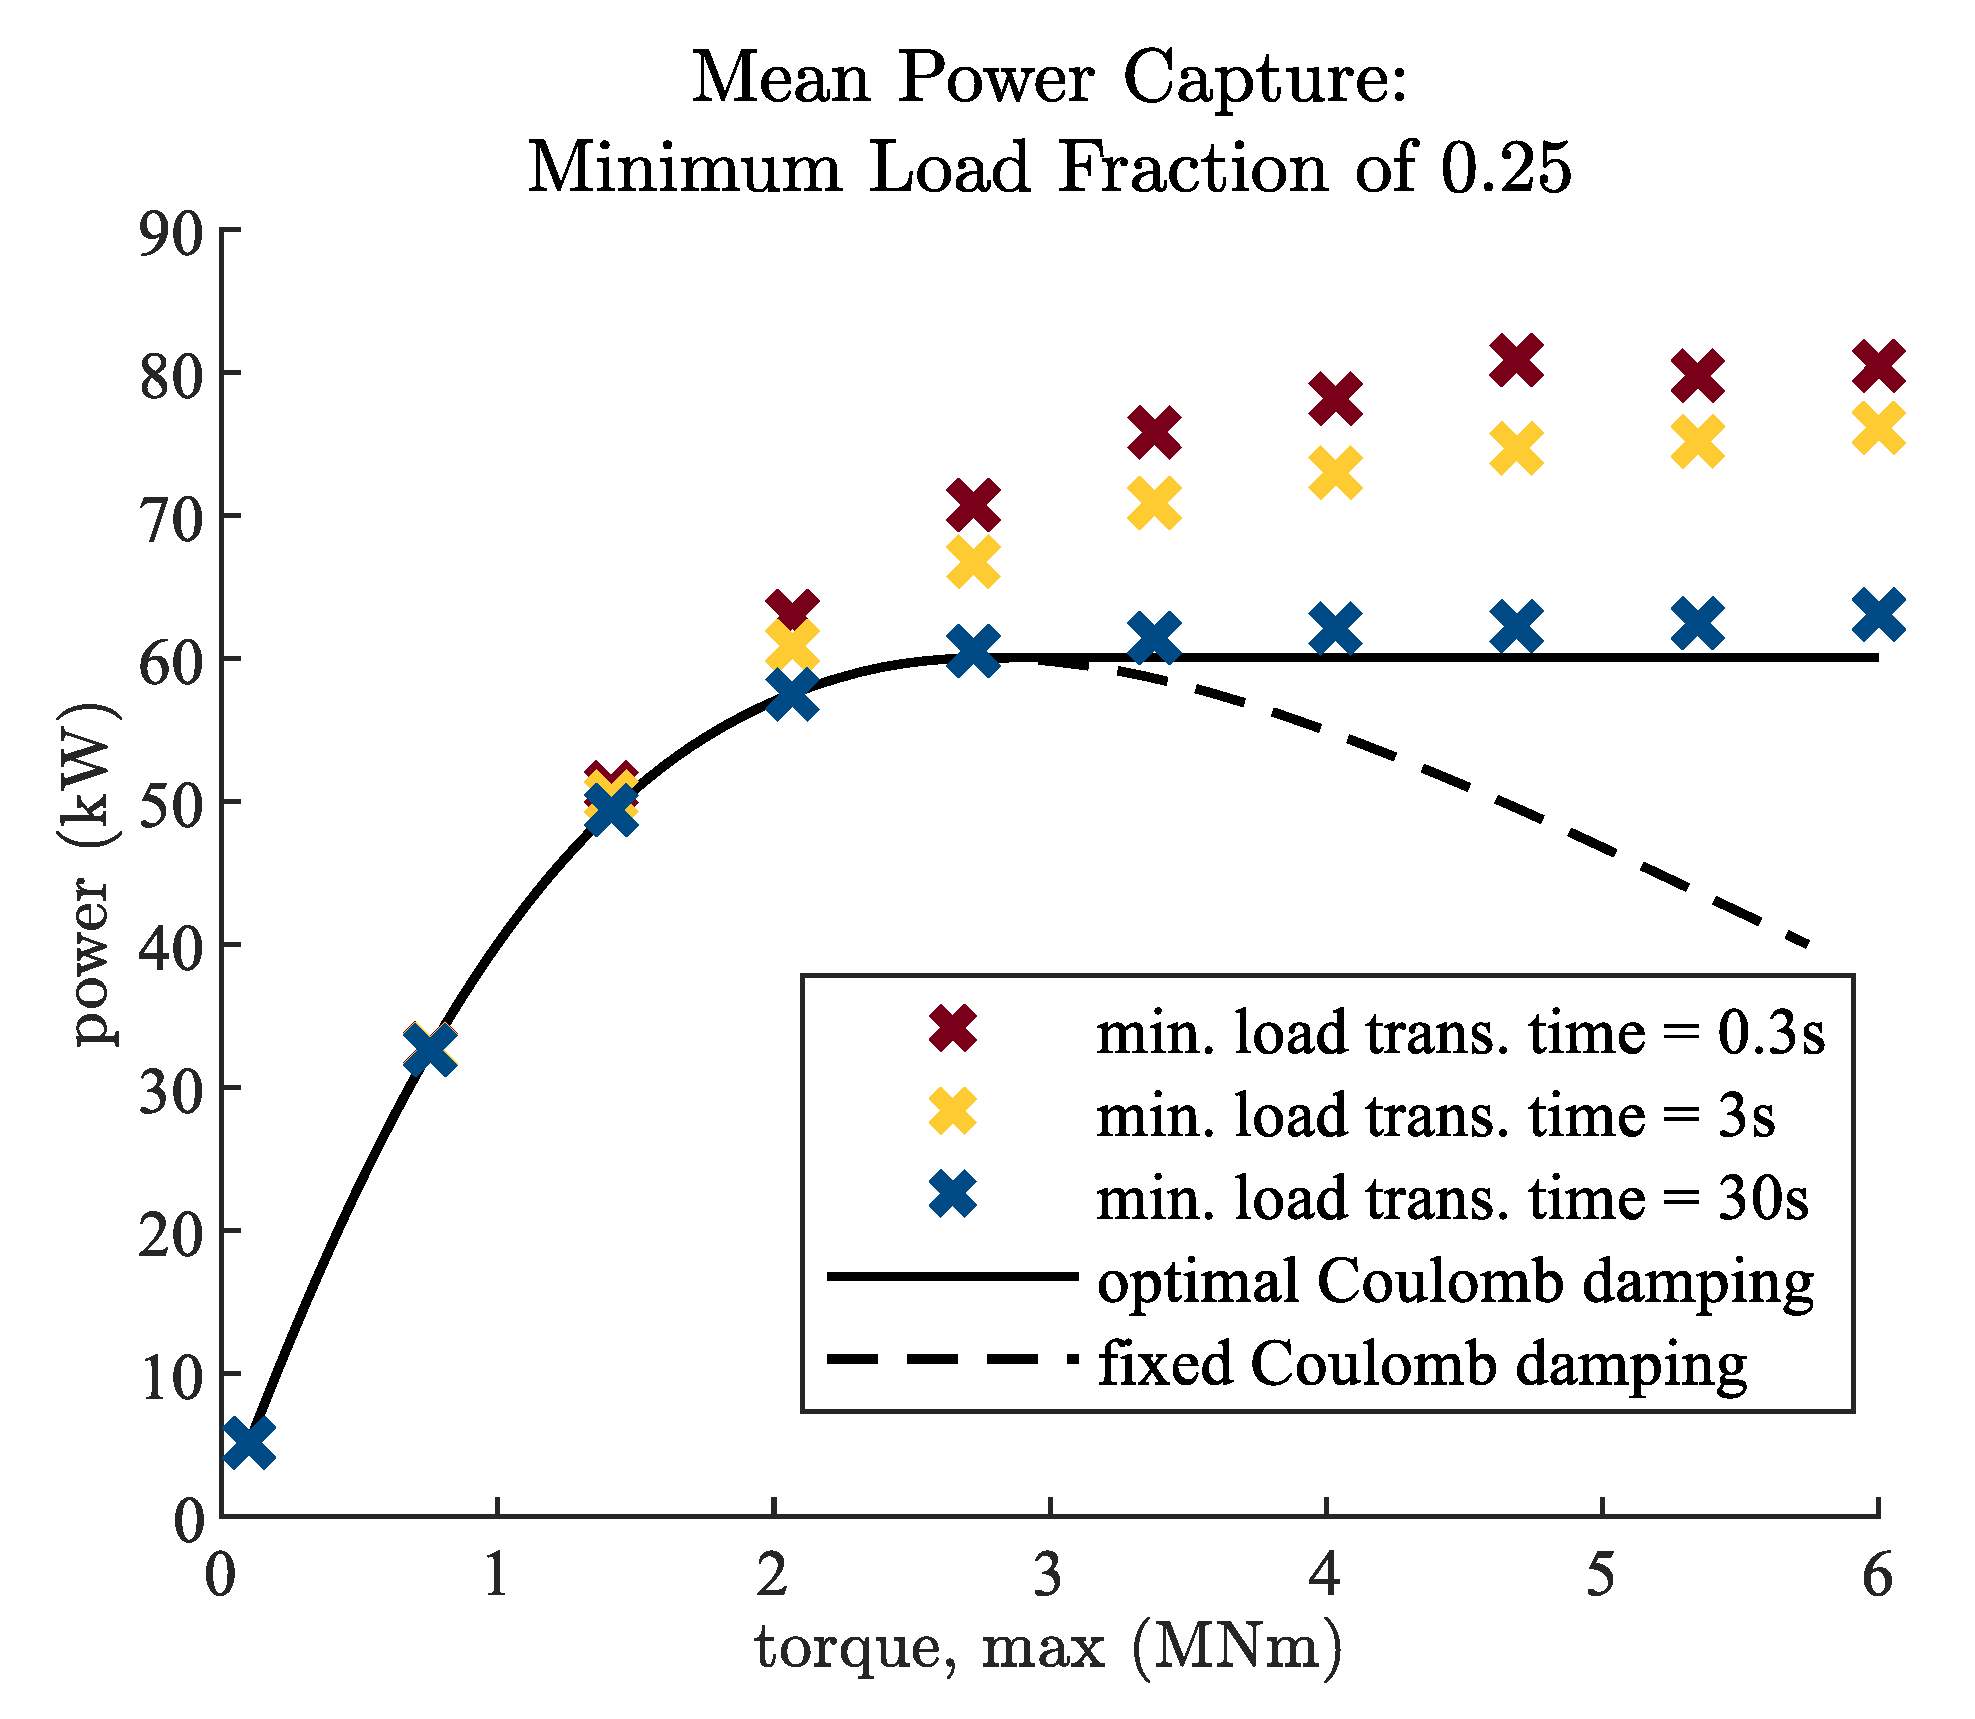
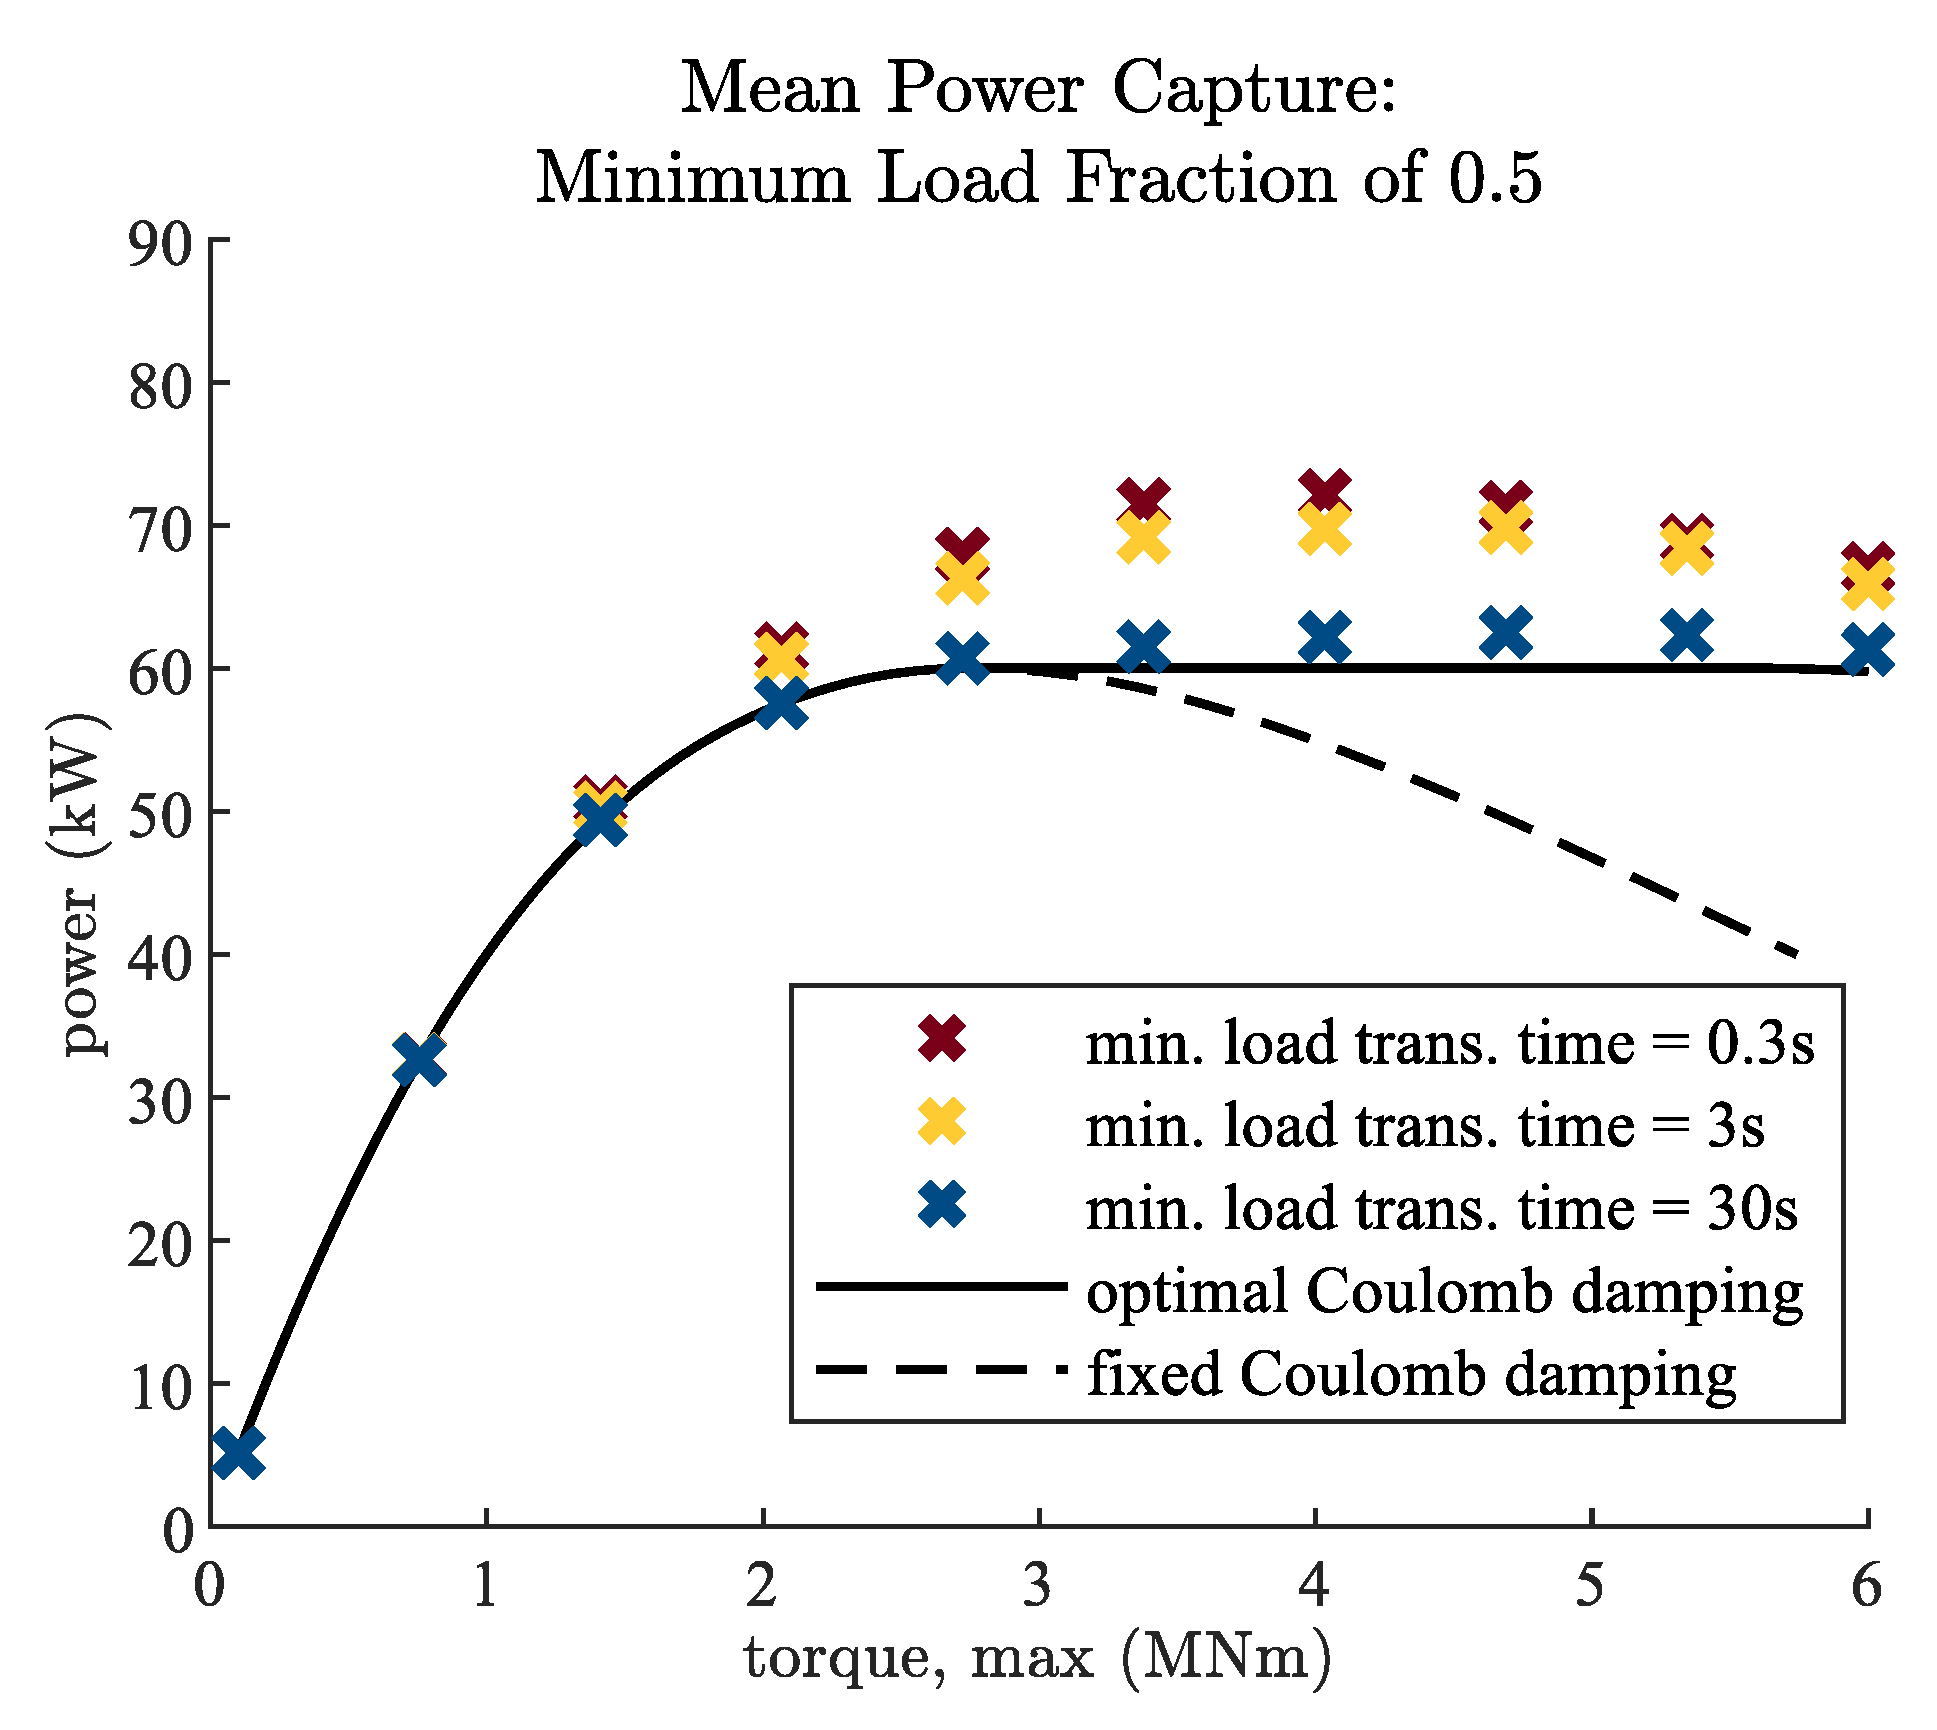
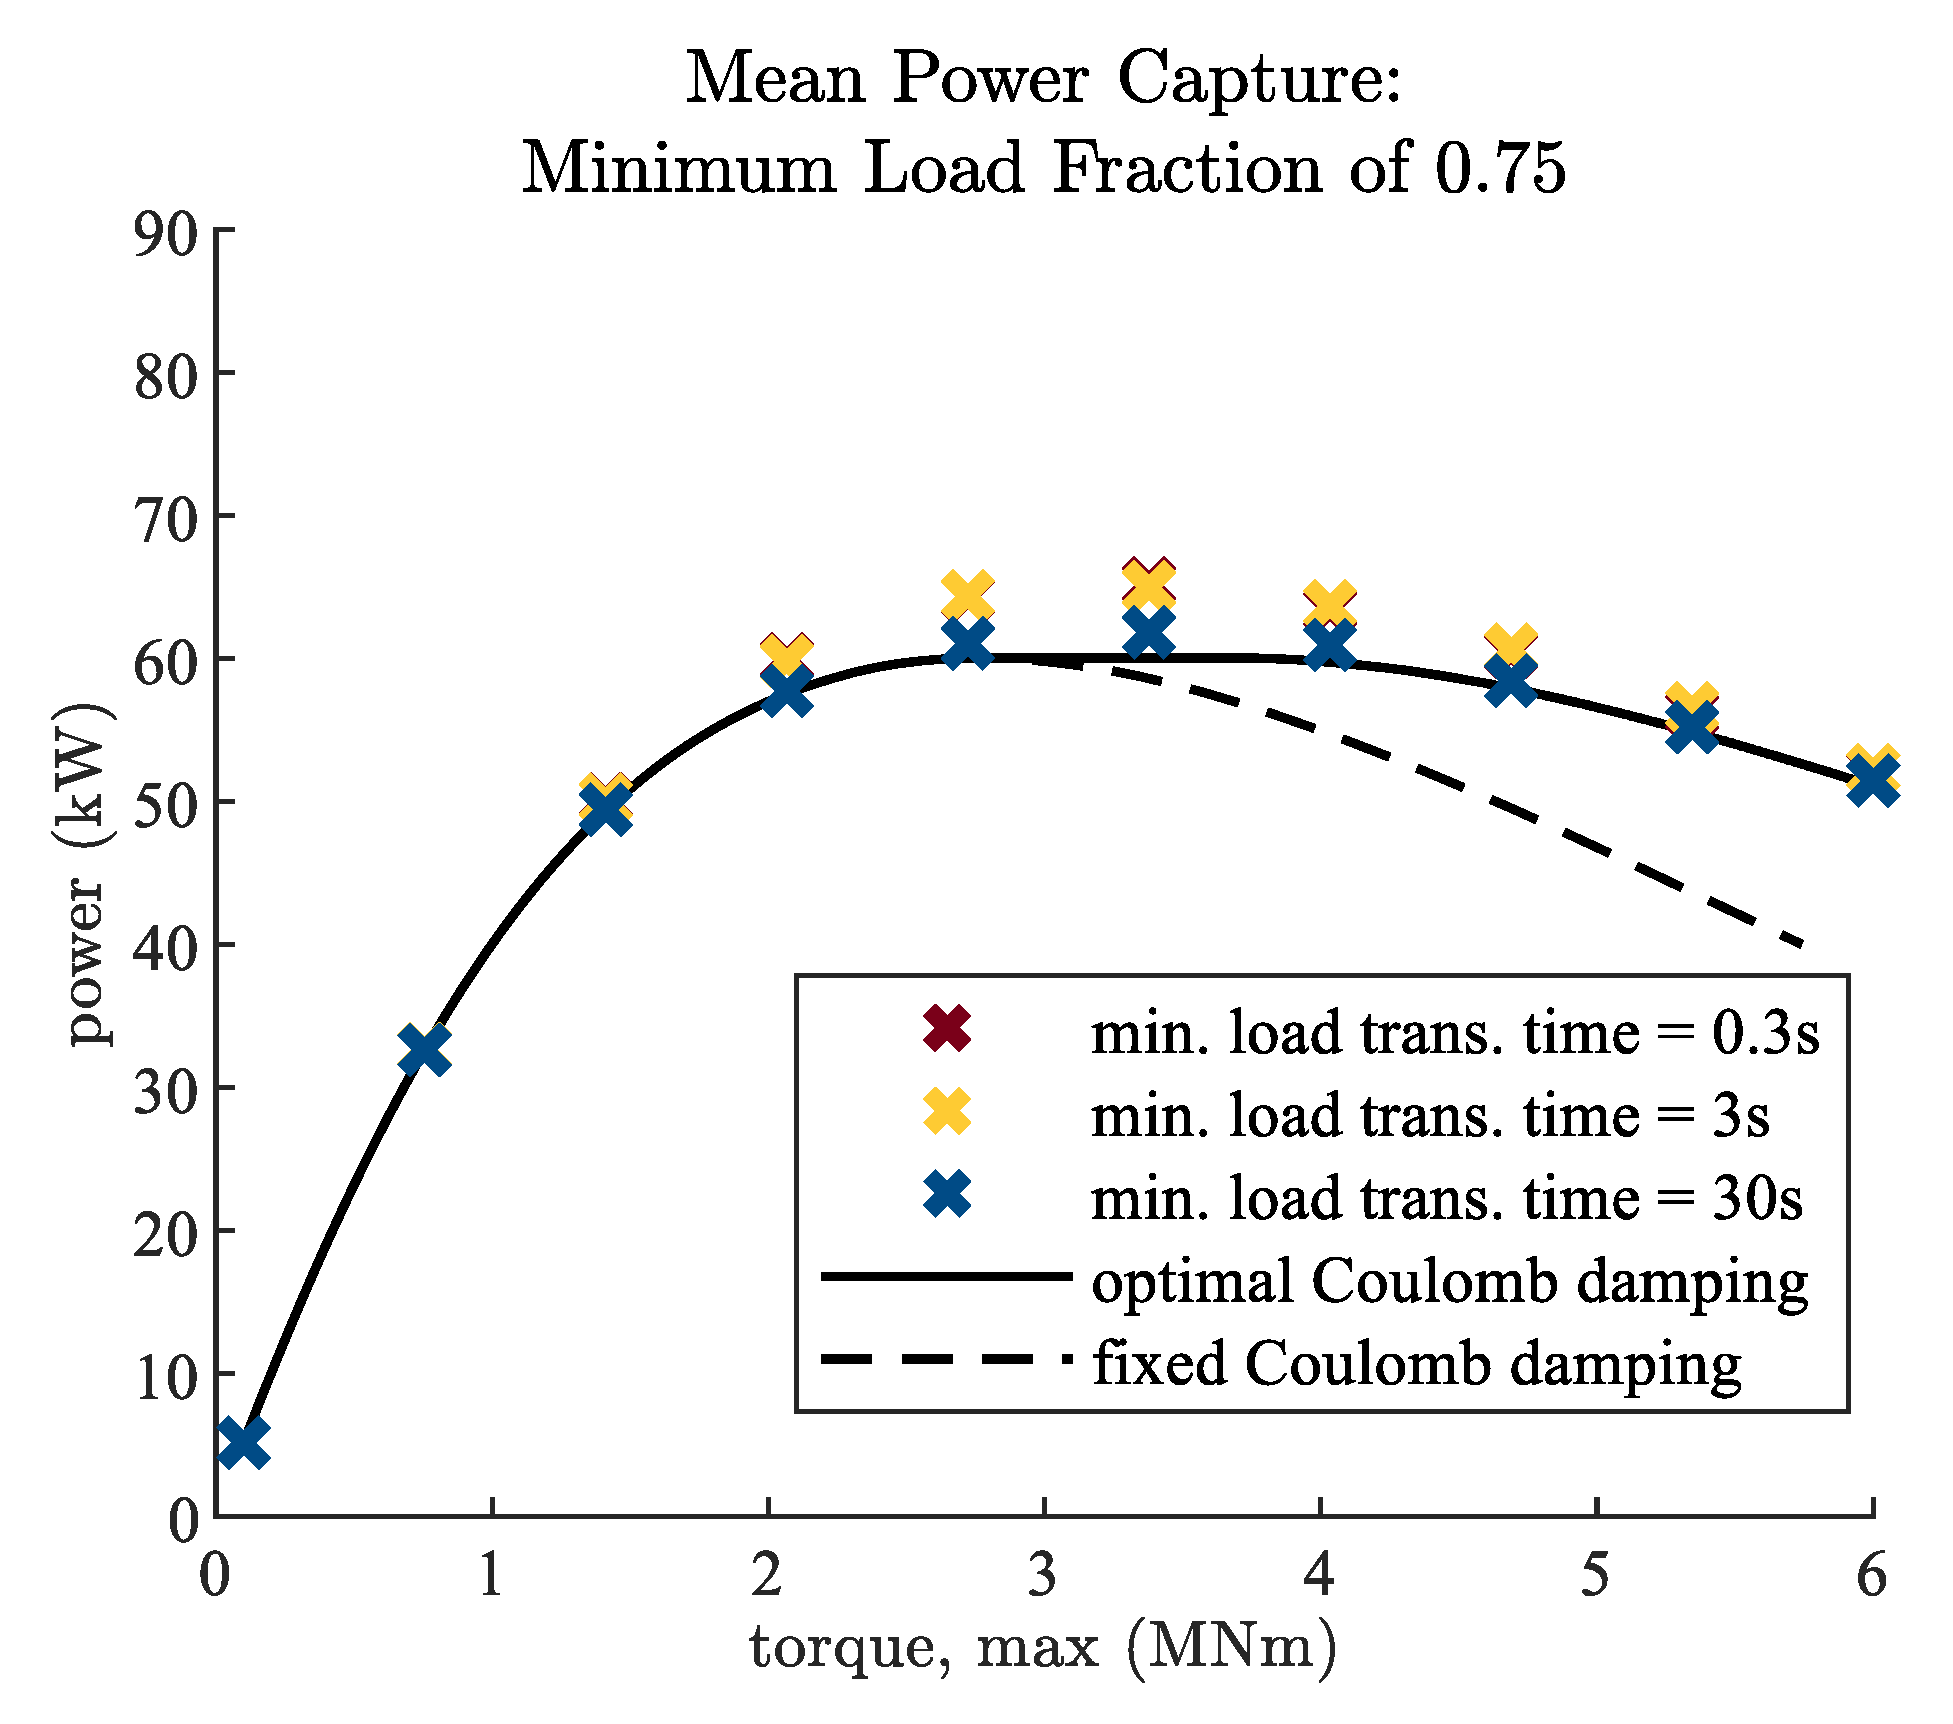
The results are plotted separately for four minimum fractional load values: 0, 0.25, 0.5, and 0.75 in
Figure 8,
Figure 9,
Figure 10 and
Figure 11, respectively. Therefore, in each case, the mean power absorbed by the WEC is plotted against the maximum PTO torque and minimum load transition time. These results are compared against the performance of the WEC with Coulomb damping under the two conditions described in
Section 2.3.
The power capture performance results are monotonic with respect to the minimum fractional load and the minimum load adjustment time but not with respect to the maximum load in all cases. Minimum load fraction values of 0 and 0.25 (
Figure 8 and
Figure 9) provide a monotonically increasing power capture, within the tested values; however, with minimum load fractions of 0.5 and 0.75 (
Figure 10 and
Figure 11), the mean power capture declines at very high values for the maximum torque. This trend is evident for the optimal Coulomb damping case as well.
The fastest load transition time of 0.3 s provides the greatest improvements in performance. The more moderate minimum load transition time of 3 s provides 56–77% of this improvement (for maximum torque values above 2 MNm); in a different framing, a transition time of 0.3 s is 4–12%, and performs higher than a 3 s transition time. The longest transition time considered, 30 s, provides very little improvement in performance over the optimal Coulomb damping, if any.
Considering a minimum load fraction of 0 and the fastest response time of the PTO tested, the potential improvement over Coulomb damping is about 20% without increasing the maximum load capability of the PTO above the optimal Coulomb damping load of about 2.72 MNm. For higher maximum load values, the model’s predictive control outperforms the optimal Coulomb damping performance by up to 45%. For a minimum fractional load of 0.25, the potential improvements are reduced to about 11% and 30%, respectively. With a minimum load fraction of 0.5, there is improvement of up to only 20% over the optimal Coulomb damping. With a value of 0.75, the improvement is only up to 9%.
With respect to the maximum rate of load adjustment, faster rates of load adjustment improve mean power capture, but with only moderate improvement between minimum load transition times of 3 s and 0.3 s. The power capture is also improved by a wider range in the load achievable by PTO, provided primarily by lower minimum fractional load values.
3.3. Load Constraint Study: Yearly Average Performance
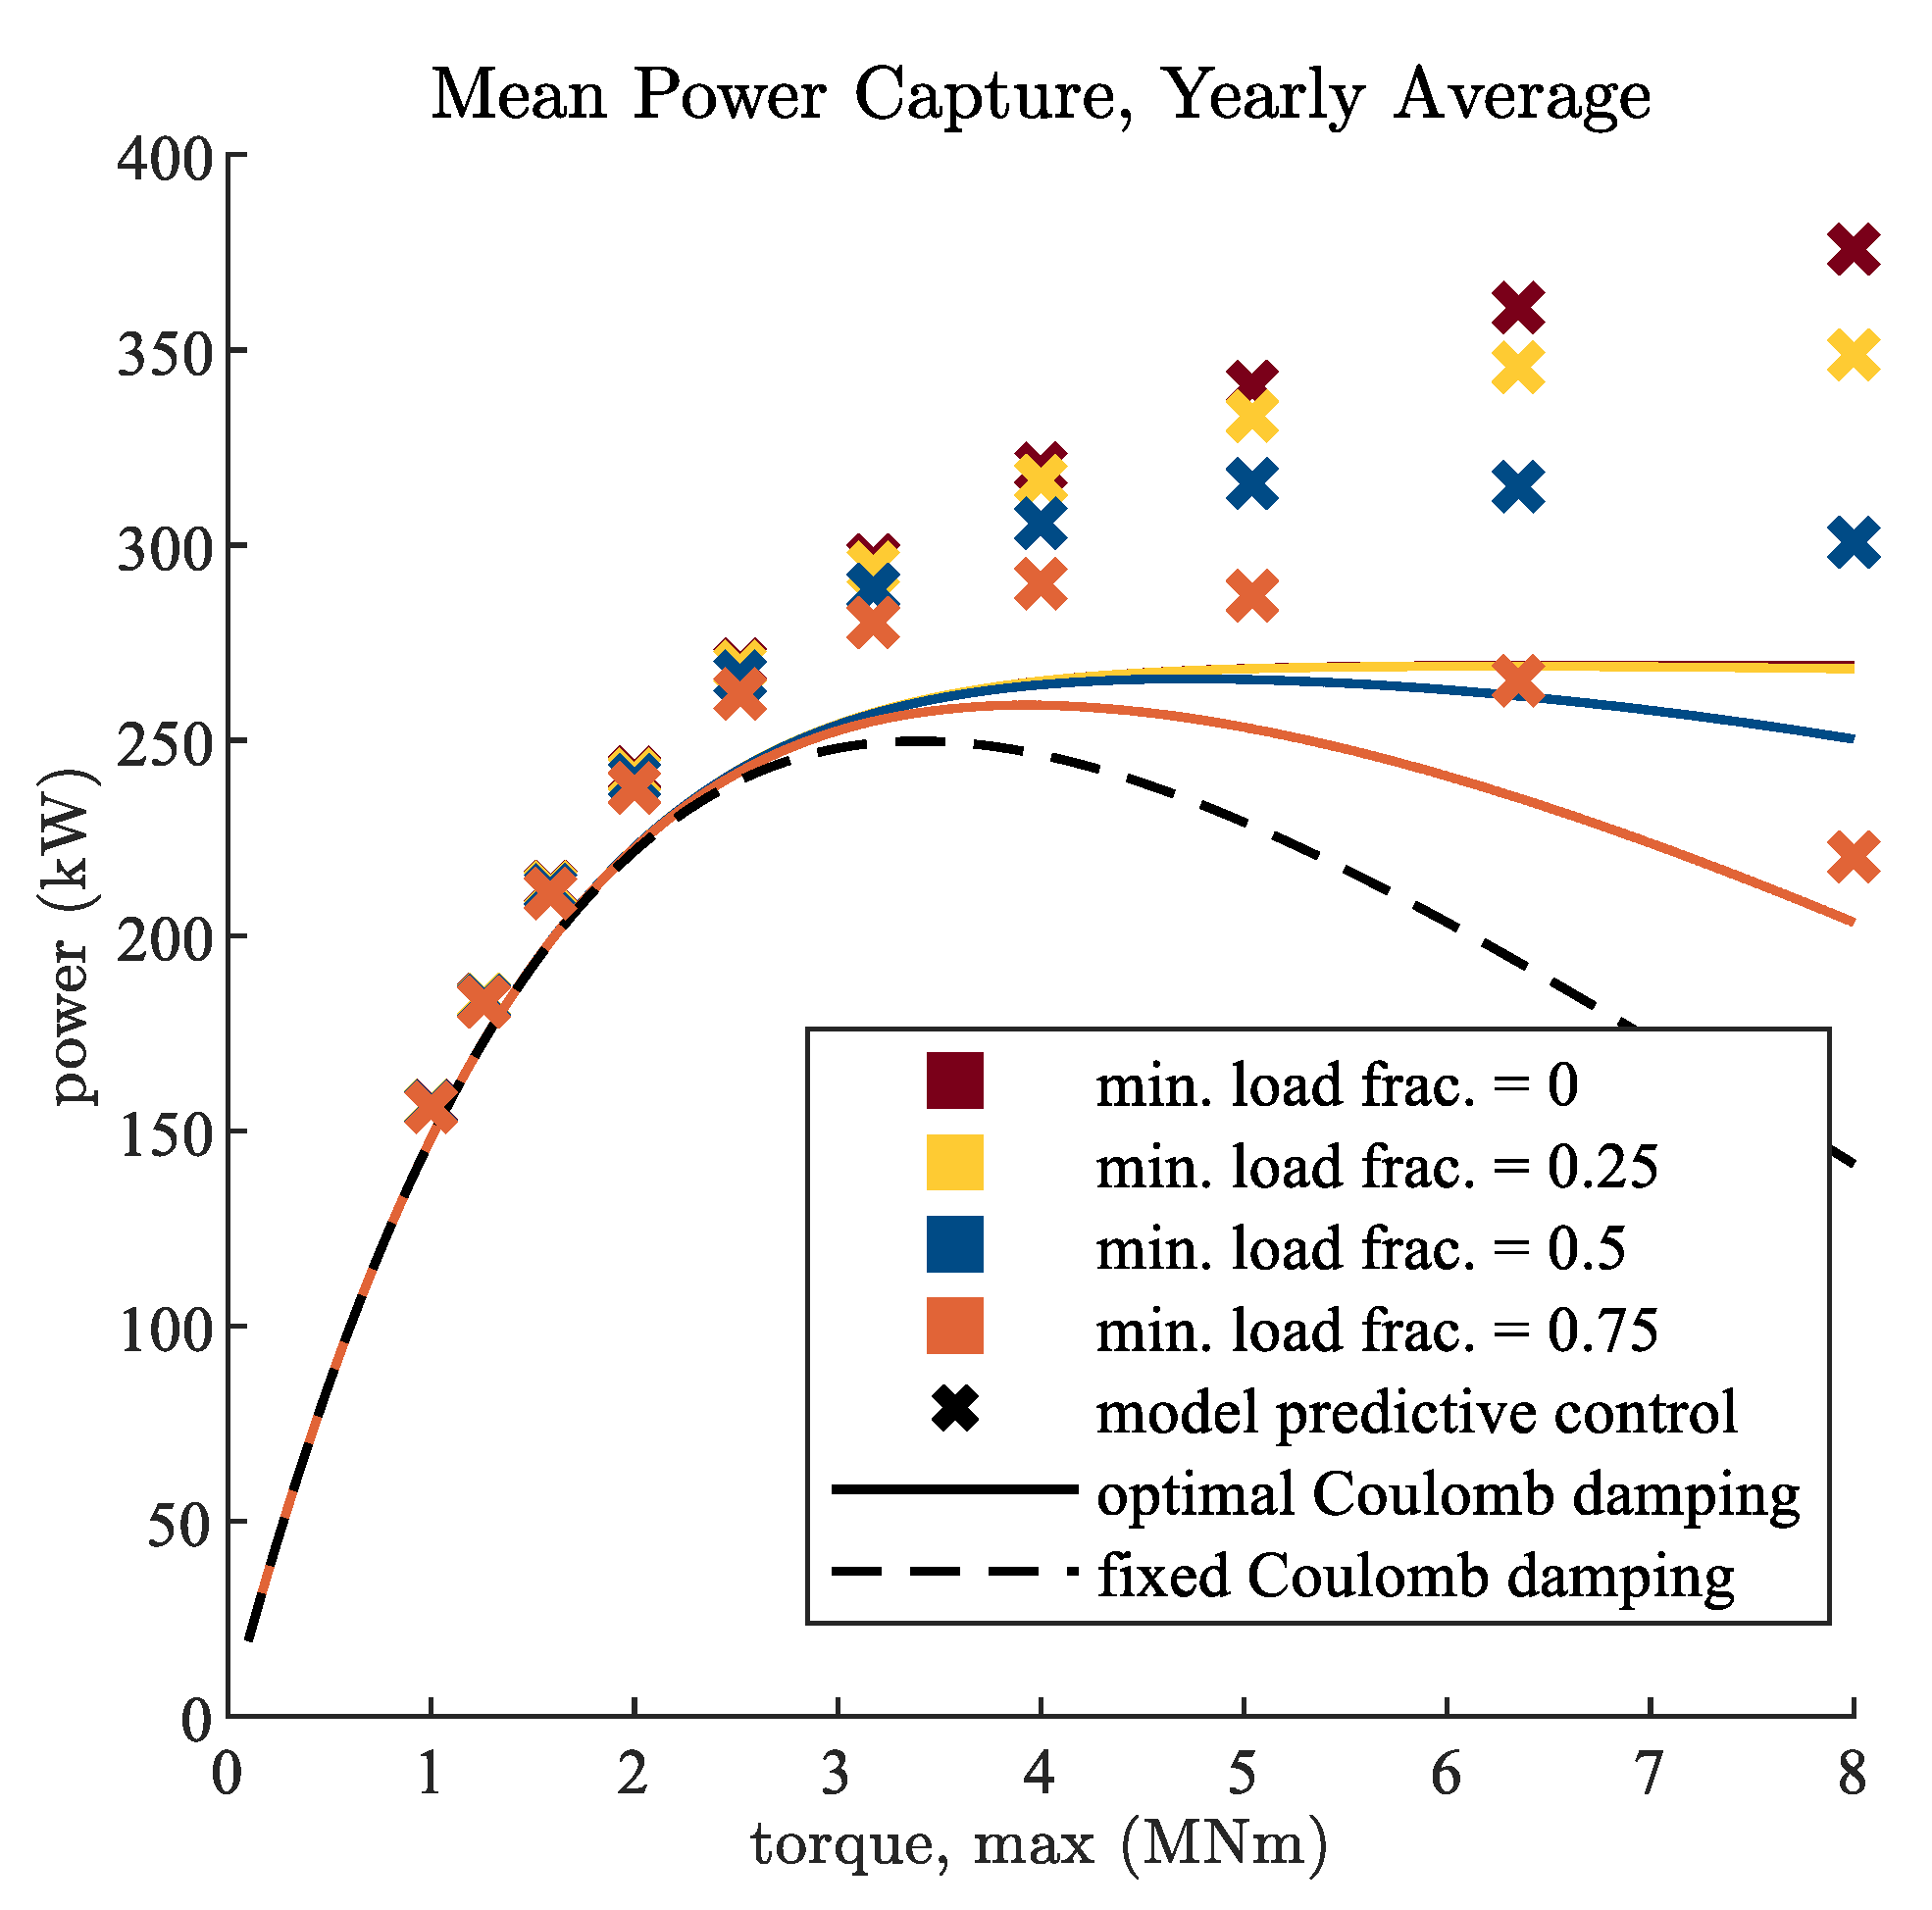
The third study investigates the weighted average WEC power absorption throughout a year using the same parameters for the MPC algorithm as the study in a single sea state. It also assumes a minimum load transition time of 3 s (based on this being only marginally lower performing than for the faster transition time of 0.3 s). Therefore, the power capture results, presented in
Figure 12, are presented as functions only of the maximum load and minimum load fractions.
The results obtained using the model’s predictive control are distinguished by color based on the minimum fractional load limit. These results are compared against the Coulomb damping results under the two conditions, as before. The results for the fixed Coulomb damping load case (i.e., the load is identical to the maximum load across all sea conditions) are plotted with a black dashed line. For optimal Coulomb damping, where the Coulomb damping is subject to the same constraints on the load as the model’s predictive control, results are plotted as a solid line with the color corresponding to the minimum load fraction.
The results show similar trends as for the performance in a single sea state but with less improvement (improvements are approximately two-thirds as high as for the performance in a single sea state). With a minimum load fraction of 0, the load control provides a 12% improvement with a maximum torque of 4 MNm and up to 29% at 8 MNm. With a minimum load fraction of 0.25, the improvements are in the range of 11% with a maximum torque of 4 MNm and up to 20% at 8 MNm. A minimum load fraction of 0.5 provides 5% improvement with a maximum torque of 4 MNm, and up to 9% with a maximum load of 5 MNm. Again, a minimum load fraction of 0.75 provides little improvement, and at higher maximum torque values, the performance is worse than the optimal Coulomb damping, which is likely due to poor performance of the optimization within the model’s predictive control in these cases.
4. Discussion
The results of these studies provide important information for understanding design trade-offs in the PTO design. As expected, a capacity for adjusting the load on the WEC on a moment-to-moment basis is shown to provide significant improvements over holding the PTO load constant within a given sea state. Furthermore, the results identify the degree to which the limits on the PTO load magnitude and response time affect the performance of this load control.
Results show that a larger range of adjustment in the PTO load improves power capture, generally. However, a minimum load fraction of 0.25 appears to be a good target for PTO performance as a potential point of diminishing returns. With a minimum load of zero, the moment-to-moment load control achieved a 29% improvement over optimal Coulomb damping; however, compared to performance with a minimum load fraction of 0.25, a minimum load of zero provides less than a 1% greater performance at a maximum load of 4 MNm and up to 7% above that.
Performance improvements seen for a single sea state suggest that the speed of load adjustment between limits by the PTO should be at least as fast as a few seconds. A faster response on the order of a fraction of a second would further enhance the performance by about 5–12% while a slow response on the order of tens of seconds would provide no significant improvement over Coulomb damping.
An important case to consider involves implementing load control for a PTO that is designed based on optimal Coulomb damping. A PTO designed for a maximum torque of 4 MNm serves as a good reference for this case. With this reference design, moment-to-moment load control with a moderate load adjustment time of 3 s could provide up to a 12% improvement in the system performance, based on the results presented in
Figure 12.
As an alternative, the PTO could be designed with moment-to-moment load control in mind. In this case, the plant performance could be improved up to about 29%. However, this would require the PTO to be capable of producing these higher loads, accompanied by a greater cost. For example, the maximum displacement of a WEC-driven pump size would need to be doubled to access the 29% improvement. Generally, the cost of a pump would be approximately proportional to its displacement. Therefore, the increased cost of the pump may outweigh the improved power capture.
Although the architecture of the PTO is not explored explicitly in this study, the results are highly relevant to the issue of choosing an architecture. The choice of architecture is a primary factor in determining the degree to which the PTO load can be varied and how quickly changes in the load can be implemented. For example, a parallel-type architecture studied in prior work on PTO architectures for wave-powered reverse osmosis, illustrated in
Figure 1, has the outlet of the WEC-driven pump feeding the same pressure rail from which the RO module sources feedwater. With a fixed pump displacement, the load provided by the PTO is constrained by the pressure limits of the RO module (about 4–8 MPa), giving a minimum fractional load of 50%. Furthermore, with the WEC-driven pump sharing a pressure rail with the RO module, a high degree of capacitance is required to meet the limits on pressure variability at the RO module. That capacitance extends the time scale with which the load can be adjusted. Considering that the flow ripple from the WEC-driven pump, generated by the excitation of the waves, has a period of 3–10 s, a time constant on the order of several seconds to tens of seconds should be expected for a pressure response in this system. Such a time constant would be outside the recommended speed capability for the moment-to-moment load control. Alternatively, implementing a variable displacement pump in such a system would increase the speed at which the load could be adjusted and could offer a greater range in the PTO load.
Finally, this study relied on a specific implementation of model predictive control that is computationally expensive and could not be implemented for real-time control, as shown by the results in
Figure 7. However, note that this does not necessarily reflect the potential performance of more efficient implementations of MPC. Rather, these results serve the purpose of estimating the maximum potential performance levels achievable regardless of the control method implemented. However, the results presented here are in line with those found in [
19], which compared an efficient MPC implementation to linear resistive damping control. In that work, the authors found that MPC achieved 40–60% greater average power capture than linear resistive damping. This level of improvement is in line with the 45% maximum improvement achieved in the single sea state performance in this work. However, comparing these results is not a definitive comparison between the two implementations of MPC because (1) linear resistive damping and Coulomb damping are not the same, (2) the authors did not optimize the resistive damping rate for irregular wave conditions, and (3) the WEC types used are different (a buoy versus an OWSC).
5. Conclusions
Model predictive control of the PTO load on a WEC was used in this study to estimate the performance advantage of controlled, moment-to-moment variation in the load over a Coulomb damping scheme. Along with this, the advantage was characterized concerning PTO capabilities and the constraints on the load it applies to the WEC. The PTO performance was framed in terms of constraints on the range of the load and the speed at which the load could be adjusted. The average power captured by the WEC was characterized as a function of these constraints, with results provided for both single sea state performance and yearly average performance, calculated as a weighted average across a realistic distribution of sea states. For single sea state performance, moment-to-moment load control achieved an improvement between 10% and 45% over an optimal Coulomb damping load. The improvement in yearly average performance was slightly lower, ranging between 11% and 29%. Therefore, these results show that there is a significant advantage offered by controlled, moment-to-moment adjustment of the PTO load. Further, the results suggest that the PTO should be able to adjust the load to at least 50% of its maximum load, and that the capability to adjust down to 0–25% is a worthwhile target. The results also suggest that the PTO should be able to adjust the load between extremes within a few seconds, while faster adjustment, on the order of 0.1–1 s could provide an additional 4–12% improvement.
The PTO load was formulated under the assumption that the PTO is passive and provides a load that is continuous in time. Future work may consider different formulations of the PTO load for similar studies, such as those involving reactive control or discrete changes in load. This would be important for considering how PTO performance affects the effectiveness of these types of load variations and for comparing different types of load variations.
Future work should also consider the effect of energy losses in the PTO, as the improved power capture by the WEC may be counteracted by increased losses in the PTO. For example, variable displacement hydraulic pumps and motors typically have lower efficiency at fractional displacements. While losses in the PTO were not considered in this work, the methods used could be modified to include them.


