Article

A Comparison of Power Take-Off Architectures for Wave-Powered Reverse Osmosis Desalination of Seawater with Co-Production of Electricity

by
Jeremy W. Simmons II
and
James D. Van de Ven
*
Department of Mechanical Engineering, University of Minnesota, Minneapolis, MN 55455, USA
*
Author to whom correspondence should be addressed.
Energies 2023, 16(21), 7381; https://doi.org/10.3390/en16217381
Submission received: 21 September 2023 / Revised: 19 October 2023 / Accepted: 25 October 2023 / Published: 31 October 2023
(This article belongs to the Collection Modeling and Design of Offshore Renewable Energy Systems)

Abstract

:
Several power take-off (PTO) architectures for wave-powered reverse osmosis (RO) desalination of seawater are introduced and compared based on the annual average freshwater production and the size of the components, which strongly relate to the costs of the system. The set of architectures compared includes a novel series-type PTO architecture not previously considered. These seawater hydraulic PTO architectures are composed of a WEC-driven pump, an RO module, an intake charge pump driven by an electric motor, and a hydraulic motor driving an electric generator for electric power production. This study is performed using an efficient two-way coupled steady-state model for the average performance of the system in a given sea state, including freshwater permeate production, electric power production, and electric power consumption. A multi-objective design problem is formulated for the purposes of this comparative study, with the objectives of maximizing annual freshwater production, minimizing the displacement of the WEC-driven pump, and minimizing the installed RO membrane area. This establishes a framework for comparison in the absence of a mature techno-economic model. The requirement that the system produces enough electric power to meet its consumption is applied as a constraint on the operation of the system. The oscillating wave surge converter Oyster 1 is assumed as the WEC. Weights on performance of the system in a given sea state are based on historical data from Humboldt Bay, CA. This study finds that (1) architectures in a series configuration allow for a reduction in the WEC-driven pump size of 59–92% compared to prior work, (2) varying the displacement of the WEC-driven pump between sea conditions does not provide any significant advantage in performance, and (3) varying the active RO membrane area between sea condition offers improvements between 7% and 41% in each design objective.

1. Introduction

For many coastal locations, ocean wave energy is a substantial resource but is challenging to economically convert into electricity. Instead, several groups have considered using this form of energy to power seawater desalination plants—especially reverse osmosis (RO) desalination [1,2,3,4,5,6,7,8,9,10,11,12]. This application of ocean wave energy is estimated to be more economical than the production of electrical grid power [13].
Reverse osmosis is a process used to desalinate seawater by presenting pressurized seawater to a semipermeable membrane, leading to the permeation of water across the membrane while solutes remain in the original solution. The pressure of the seawater must be greater than its osmotic pressure of about 3 MPa, but typical operating pressures are around 6 to 7 MPa. Conventional RO system components typically have maximum pressure ratings of 7 MPa or 8.3 MPa [14].
Hydraulic power take-offs (PTOs) that use filtered seawater as the working fluid have been considered for a more direct coupling of the RO process to the wave energy harvesting process [2,4,5,12,15,16,17,18]. This avoids power conversion losses that would otherwise come with the intermediate conversion of power to and from electricity. In addition to the expected higher efficiency of the system, hydraulic system components are well suited to the low speed and high forces of wave energy converters (WECs). A few groups have demonstrated WECs with hydraulic PTOs [19,20,21], and others have performed computer-aided design studies exploring their use for the production of electrical power [22,23,24,25].
Prior conceptions of wave-powered desalination systems have considered fresh water as the only output of the system. However, these systems may rely on electrical power to power various processes like intake charge pumps and transfer pumps (e.g., [18]), control and monitoring equipment, and other processes relevant to reverse osmosis and plant operation. As an alternative, the system can be designed for co-production of electricity and potable water so that the plant’s operation does not rely on local power grids or other sources of electrical power. This approach was taken for a prototype plant built by Carnegie Wave Energy with their CETO 5 project [19], was considered in a patent by Aquamarine Power Ltd. [26], and has been considered as part of the design for a batch RO process [12]. The use of electric power within a wave-powered RO system is assumed in this work.
The schematic in Figure 1 illustrates a baseline hydraulic WEC PTO that is designed for co-production of electricity and potable water. This system includes (1) a WEC-driven, double-acting hydraulic cylinder and check valve rectifier that together function as a pump, (2) an RO system composed of an RO membrane module and an optional energy recovery unit (ERU) used to recover power from the high-pressure brine that would otherwise be throttled with a valve, (3) an electric-motor-driven charge pump that drives the seawater intake flow and provides an elevated pressure that avoids cavitation in the suction port of the WEC-driven pump, (4) an electric generator that is driven by a hydraulic motor and is used as a source of electrical power and a means of regulating the pressure at the RO feed inlet, and (5) hydraulic accumulators that give the system capacitance, reducing the pressure variation caused by the variations in flow rate from the WEC-driven pump. In this system, electric power would be used to drive the intake charge pump and control the rotational speed of the ERU. The ERU is illustrated as being composed of a coupled hydraulic pump, hydraulic motor, and electric motor, although other designs are available, such as the isobaric type [27,28] and the piston type [2,29,30]. Overall, there are different ways to configure this system while preserving its functions; several alternative PTO architectures are presented in Section 2.
Along with the introduction of several PTO architectures, this paper presents a comparative study that quantifies and compares their potential design performance in terms of the annual average production rate of fresh water, the power density of the WEC-driven pump, and the installed capacity of the RO module. This study preserves the separation of these metrics rather than attempting to combine their effect into a single metric such as the levelized cost of water as examined in [13,31,32] (i.e., the cost of constructing and operating the system normalized by the water that is produced). In the context of PTO design, a comparative study using the levelized cost of water would require a techno-economic model that includes the effects of PTO design parameters. While the analyses in [13,31,32] include techno-economic models of similar systems, they do not include the effect of the PTO’s component sizes on the costs of the system, other than the installed capacity of the RO module [13,31]. Developing a suitable techno-economic model is not necessary for providing a comparison and is out of the scope of this work. Instead, the comparisons made in this work will made under the framing of a multi-objective design problem where the design of the system can trade merit between the objectives and the concept of Pareto optimality can be applied to compare overall design performance.
This comparative study includes the design and performance of the system studied in [13] and adopts several assumptions that were made in that work. This enables effective bench-marking and establishes a useful point of reference for comparing the design performance of the proposed PTO architectures. Although these assumptions effect estimates of the performance of the system in an absolute sense, their use preserves the relative nature of a comparative study. The assumptions adopted from [13] include:
  • The WEC driving the plant is the Oyster 1, designed and tested by the former Irish company Aquamarine Power [33]. Notably, the same WEC has been considered in other research on ocean-wave-powered RO desalination [2,13,17] and in modeling studies that included experimental validation [34].
  • The probability of occurrence of sea conditions is based on data from a near shore buoy in Humboldt Bay, CA; the distribution of the probability of occurrence of sea conditions derived from this buoy is given in Figure 2. These data were derived using methods based on work in [35].
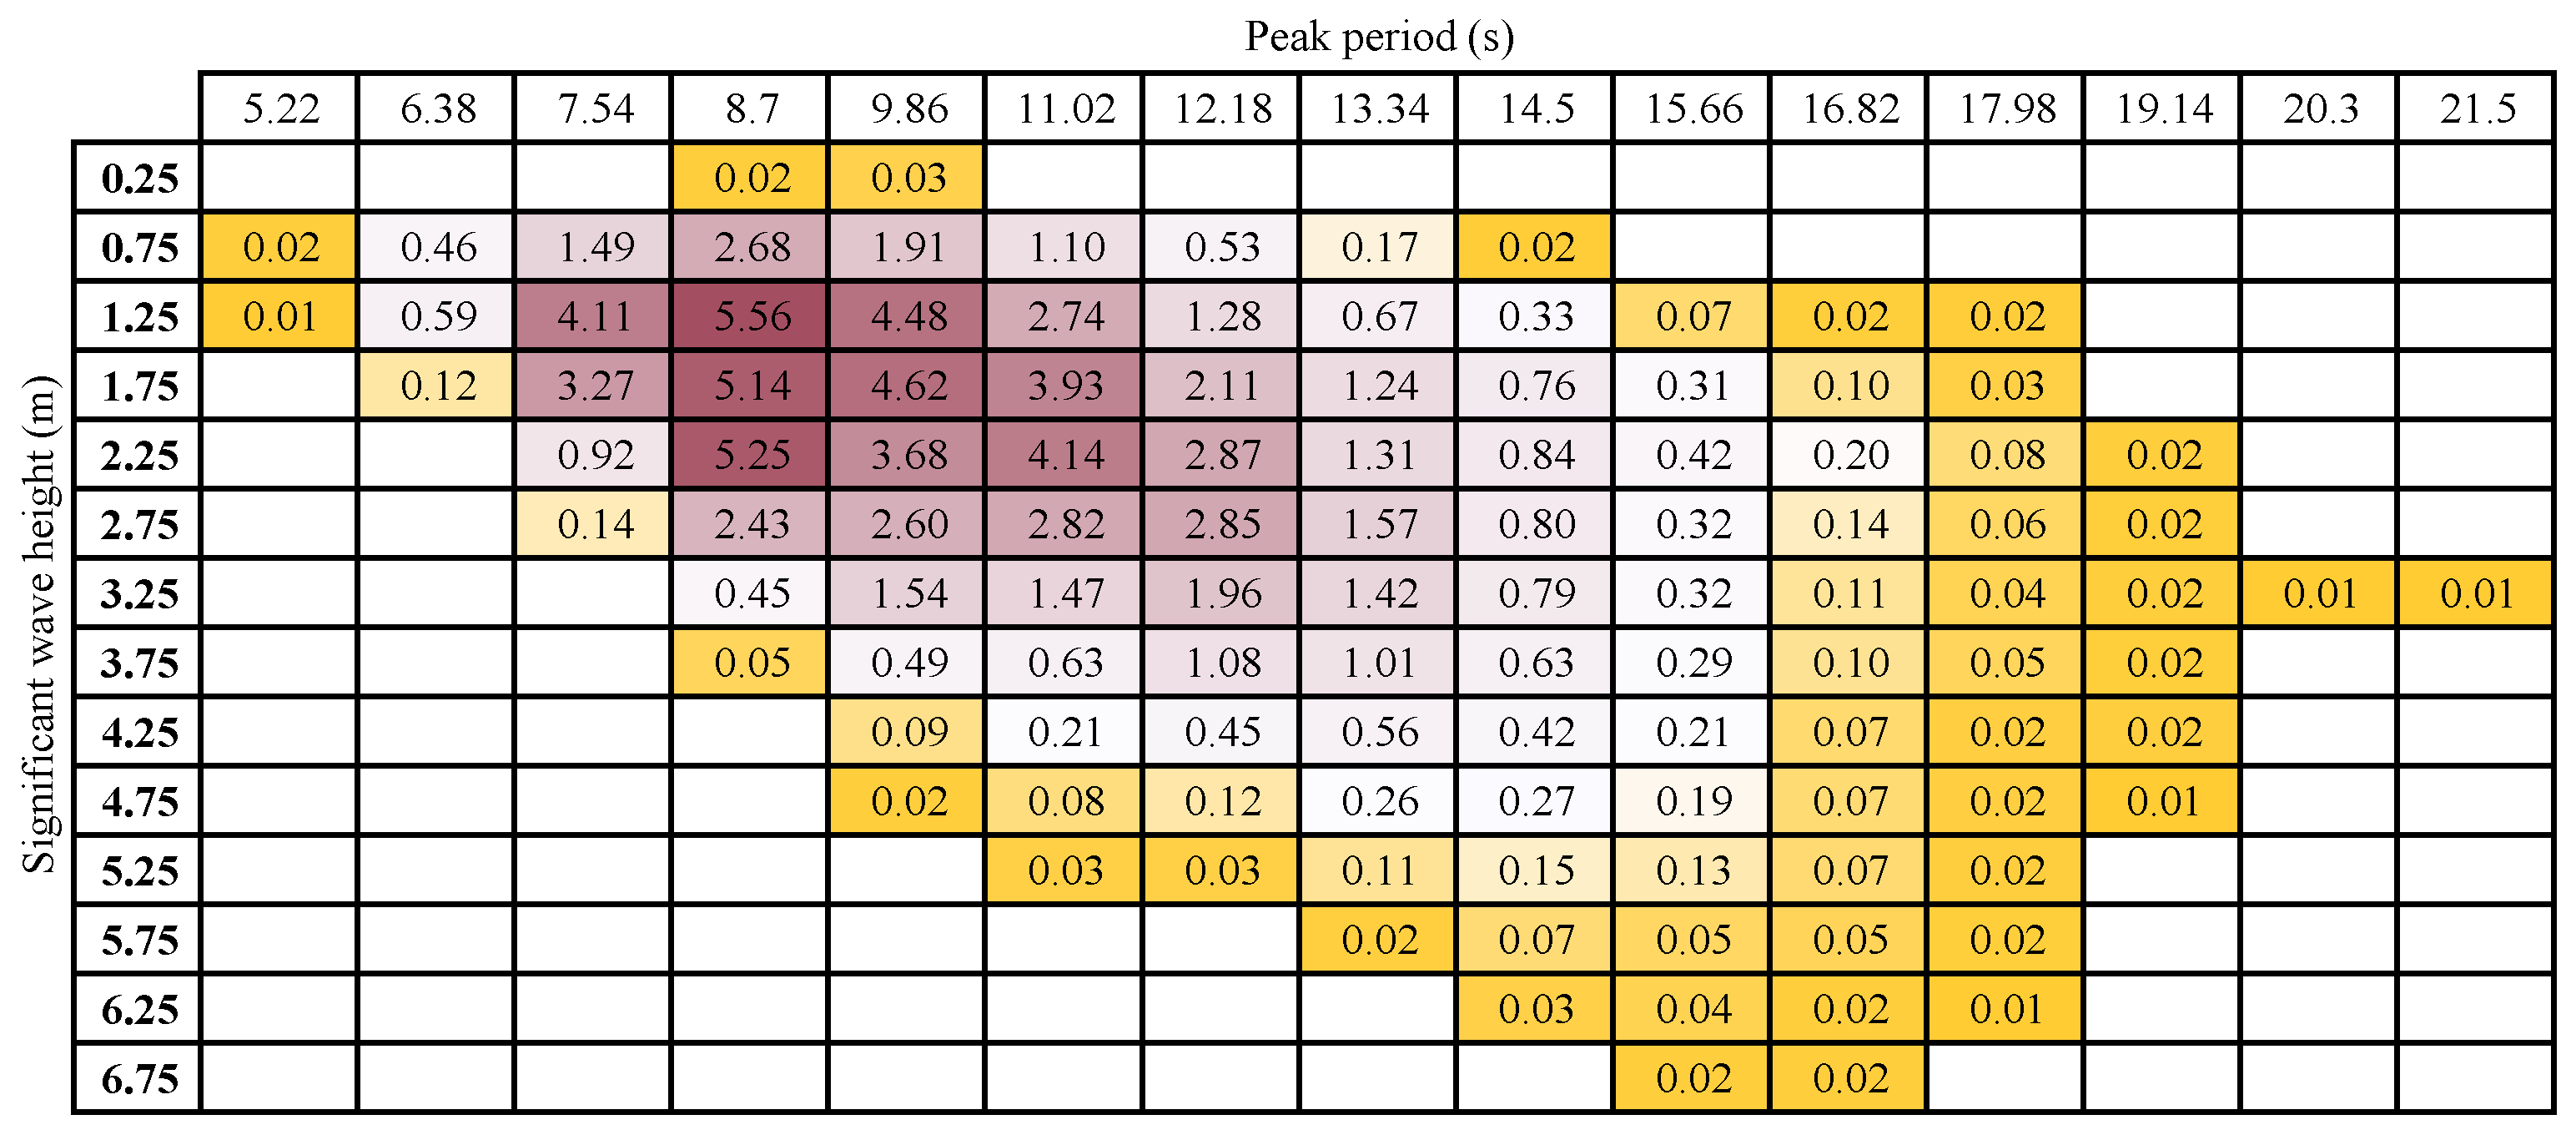
  • Waves are fully developed and are described by the Pierson–Moskowitz spectrum [36].
  • There is no variation in wave direction with respect to the WEC.
  • The ERU maintains a constant recovery ratio of the RO process of 25%. This is achievable either through control (e.g., control of shaft speed) or design of the ERU, depending on its type.
  • The solute concentration of the seawater is constant with an osmotic pressure of 2.275 MPa.
Some additional work is required in order to include the design performance of the Yu and Jenne system [13]. Specifically, work is required to establish values for the displacement of the WEC-driven pump and capacity of the RO module in terms considered by this work. Furthermore, the performance results of the system in [13] do not account for limits to the pressure of the RO system. Although the issue of limiting the RO feed pressure was addressed by the work in [17] with the addition of a pressure relief valve, an updated estimate for the average annual freshwater production has not been produced. Therefore, the model used in [13] will be augmented to include the effect of a pressure relief valve and will be exercised to produce an updated estimate for its average annual production.
In addition to the assumptions adopted from [13], a significant simplifying assumption is made for modeling the power take-off so that computations can be completed in a reasonable time frame. The assumption is that the power take-off operates in a steady state, with constant pressure and flow rate throughout the system. The reason for this assumption is not that system dynamics cannot be simulated in a reasonable time frame; a dynamic simulation including the WEC and PTO may typically only take one to two hours for every hour of simulated time. The reason for this simplifying assumption is that the coupled WEC/PTO model is used as part of a computationally intensive design algorithm (presented in Section 4.3) which requires the system to be simulated on the order of hundreds of million times. This assumption is assumed to be reasonable based on the the nature of the proposed power take-off architectures which, like the baseline architecture given in Figure 1, include accumulators and a hydraulic motor and generator used to control the nominal system pressure; both features reduce the variation in pressure and help to establish a persistent mean pressure and flow rate.
This work is organized as follows. Several PTO architectures will be presented in Section 2. Then, the work to establish the design performance of the Yu and Jenne system design will be presented in Section 3. Next, the methods used to study the proposed PTO architectures are presented in Section 4. These methods include the mathematical models, the design optimization algorithm, and the method used to compare architectures with the use of a reference design. In Section 5, the results will be presented and discussed, including several example designs produced by the design optimization algorithm, results for the overall design performance of each PTO architecture, and comparisons between the design performance of each architectures. Comparisons are first made using the performance of the system in [13] as a reference and, second, using a reference design selected from the results of the design optimization algorithm used in this work. A set of conclusions about the choice in PTO architecture will be presented in Section 6 and is followed by recommendations for future work.

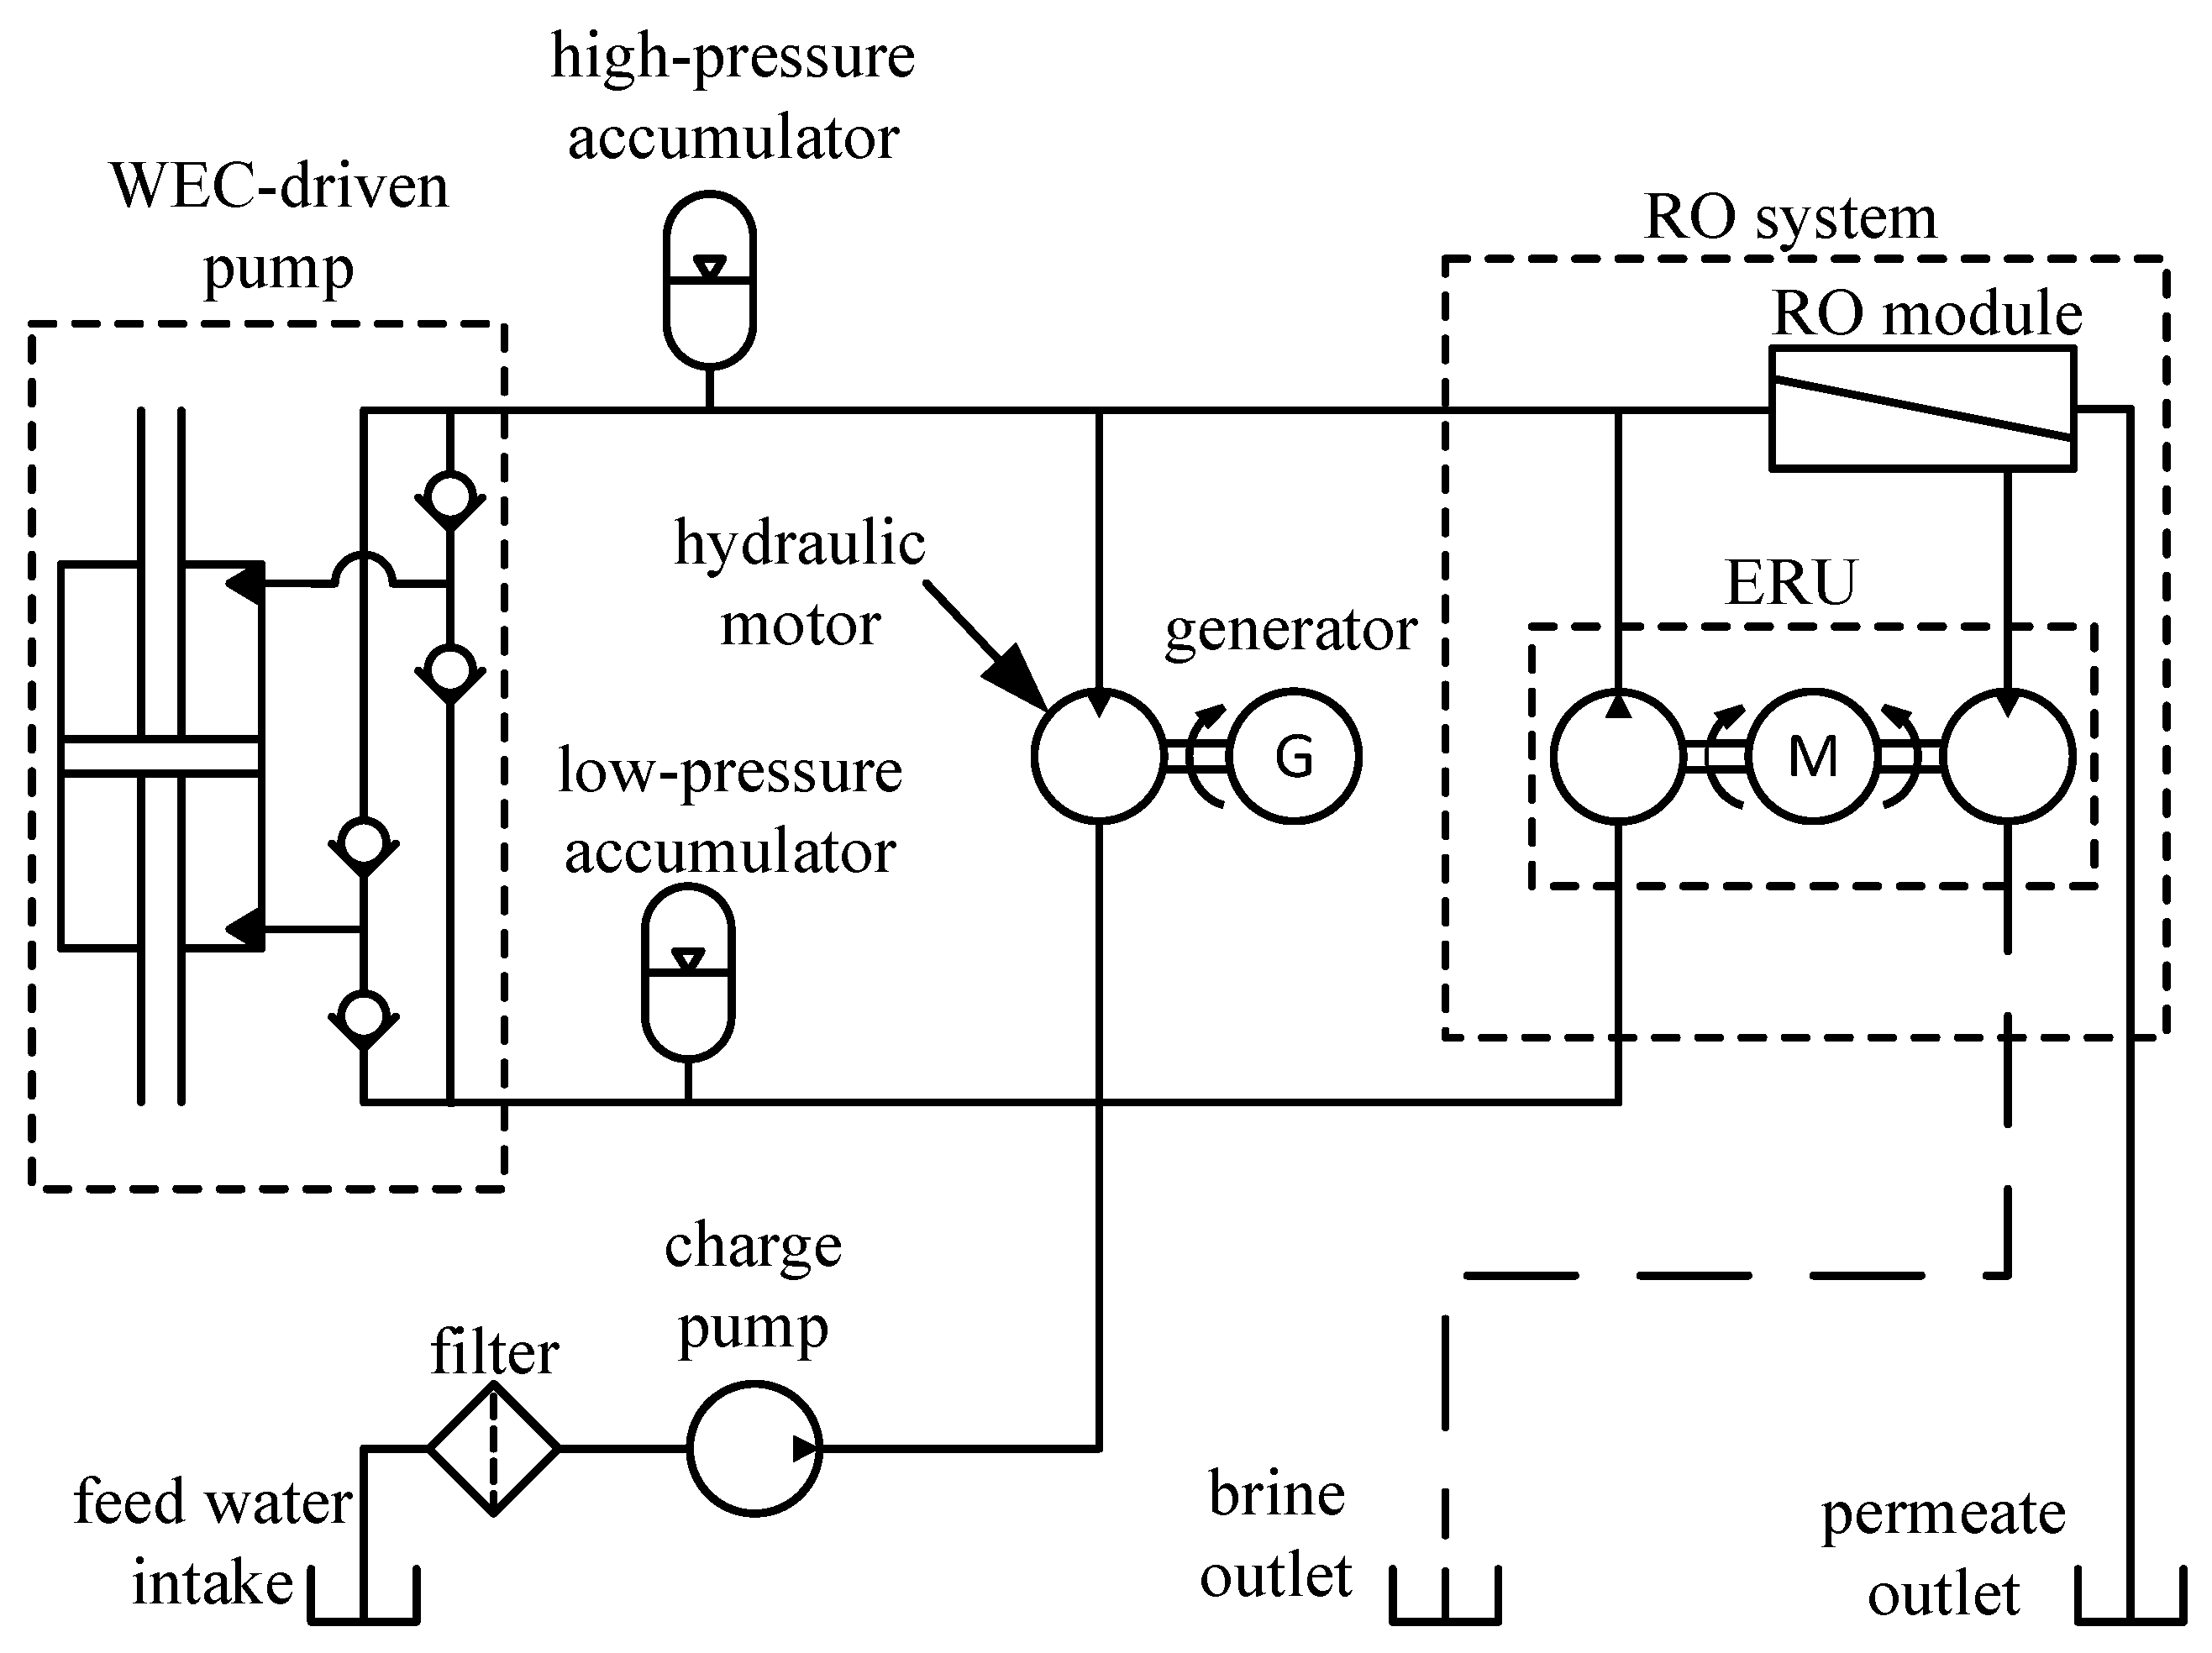
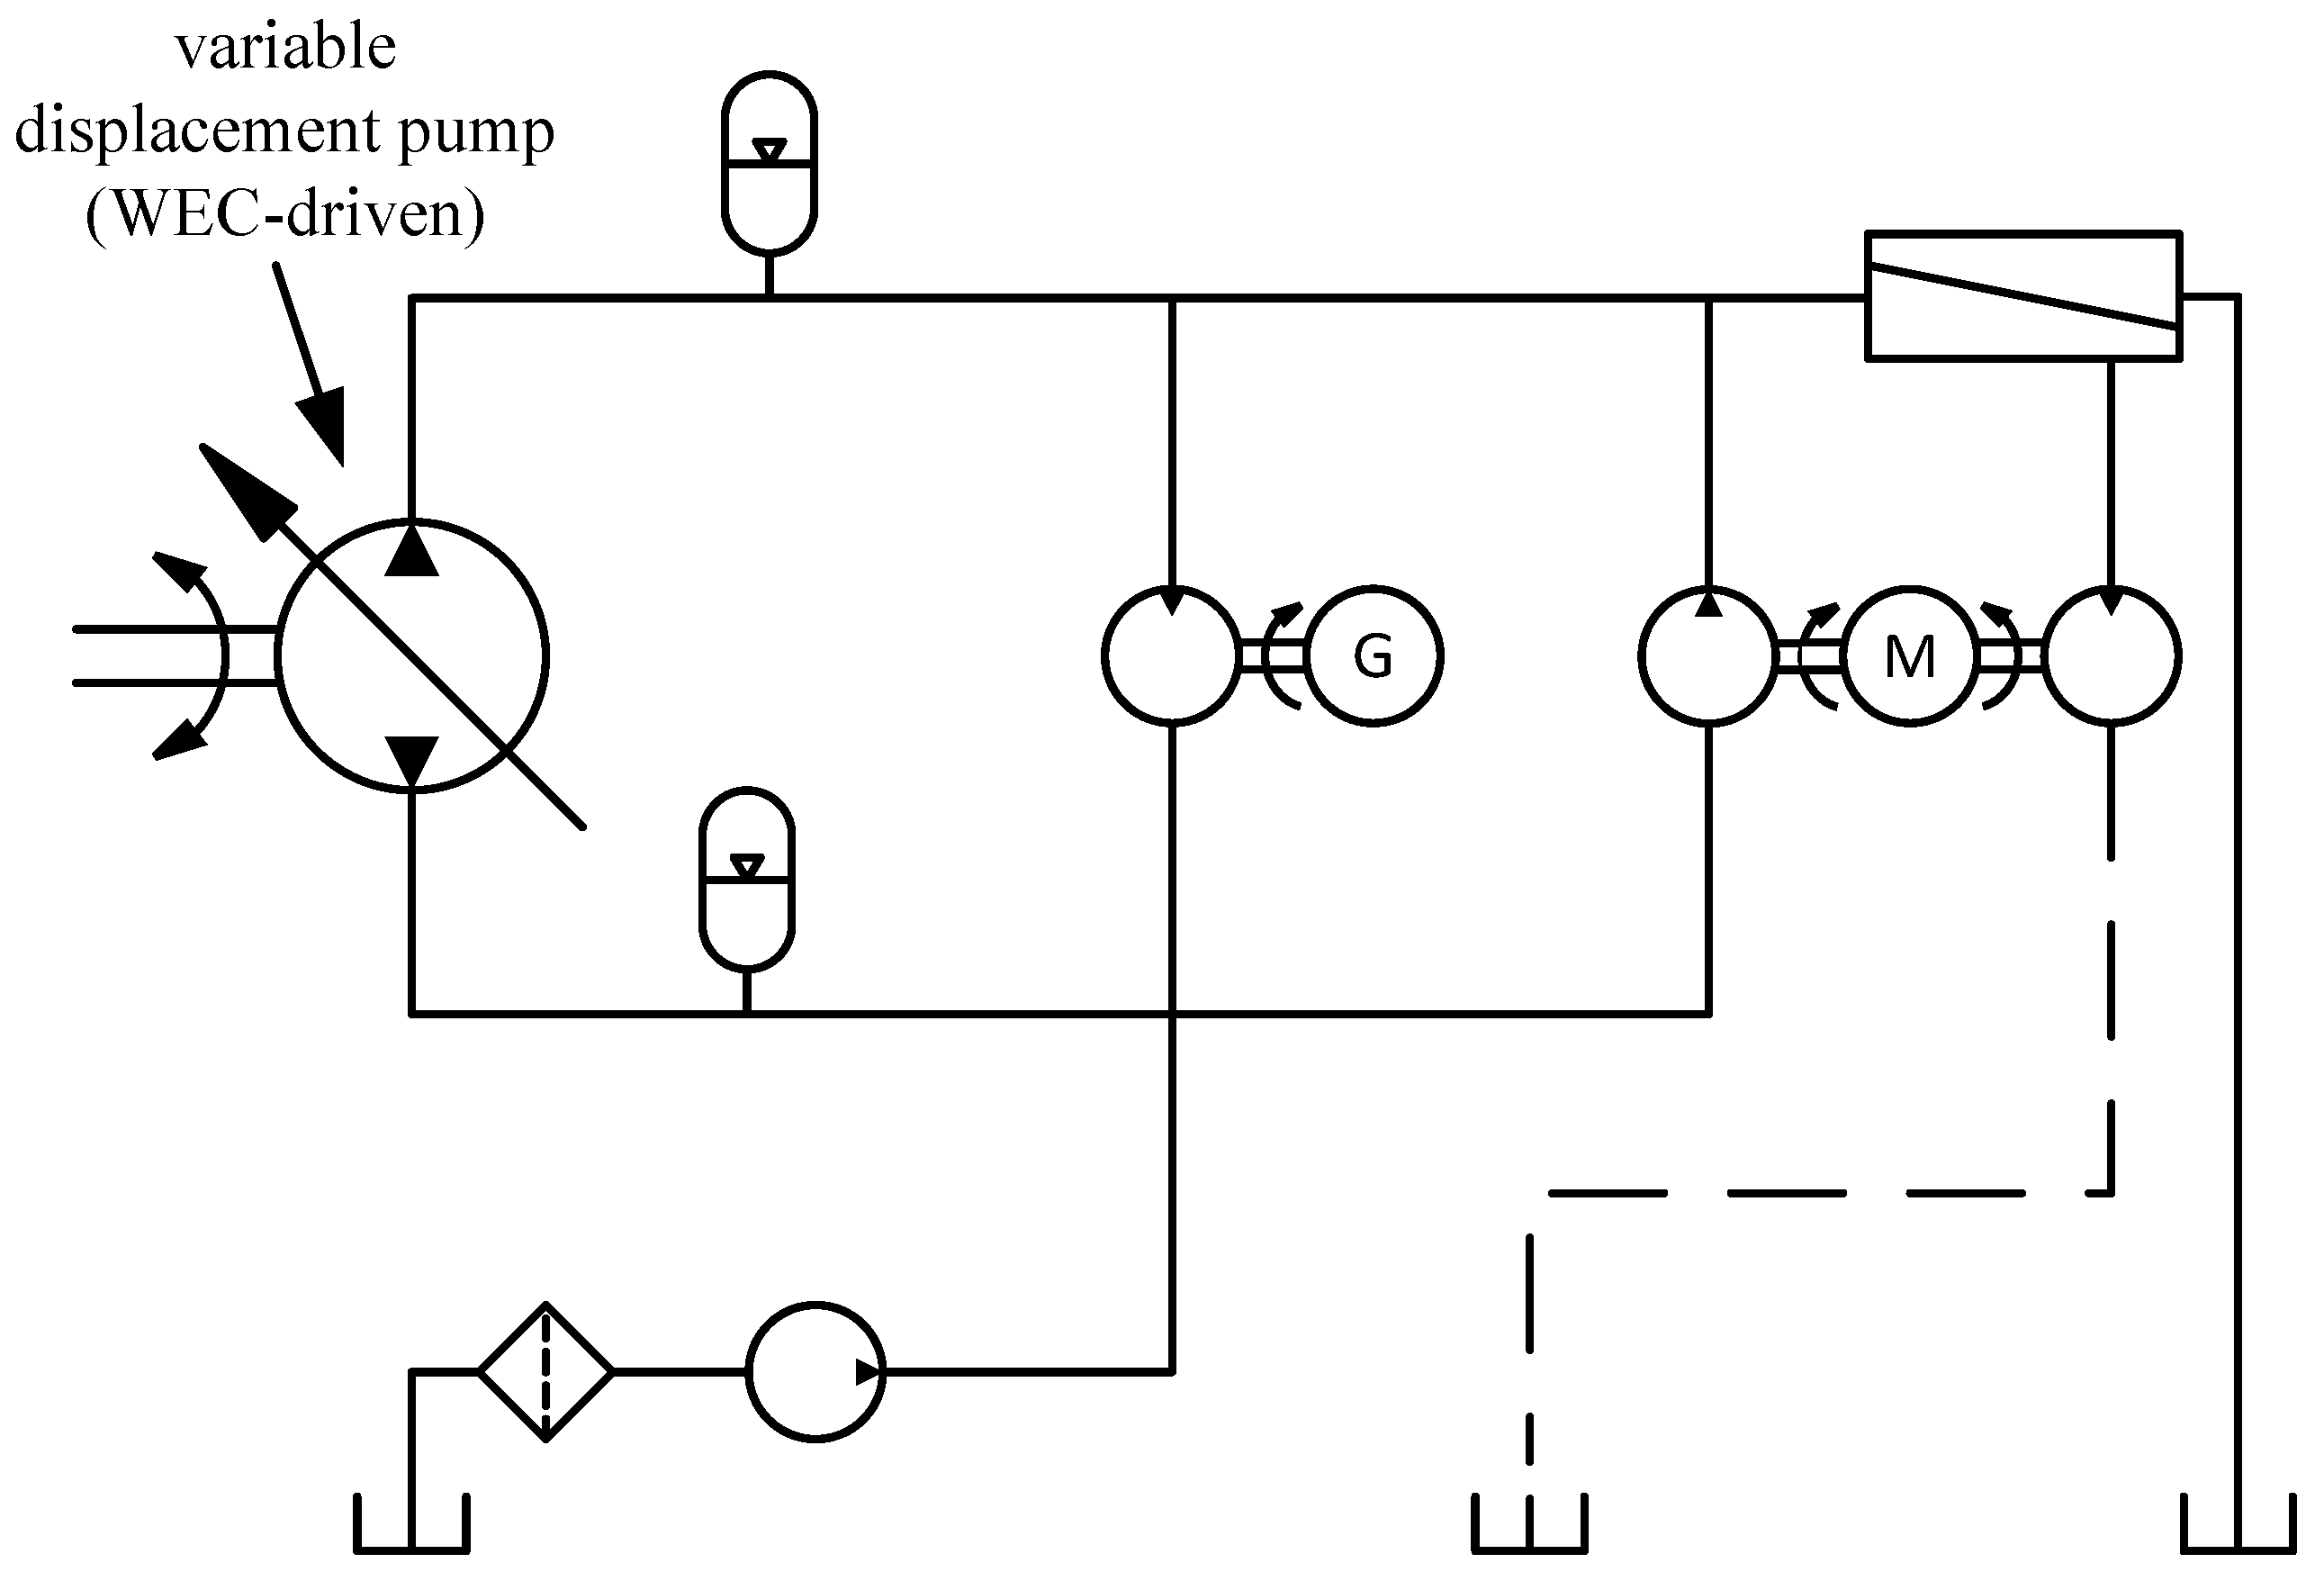
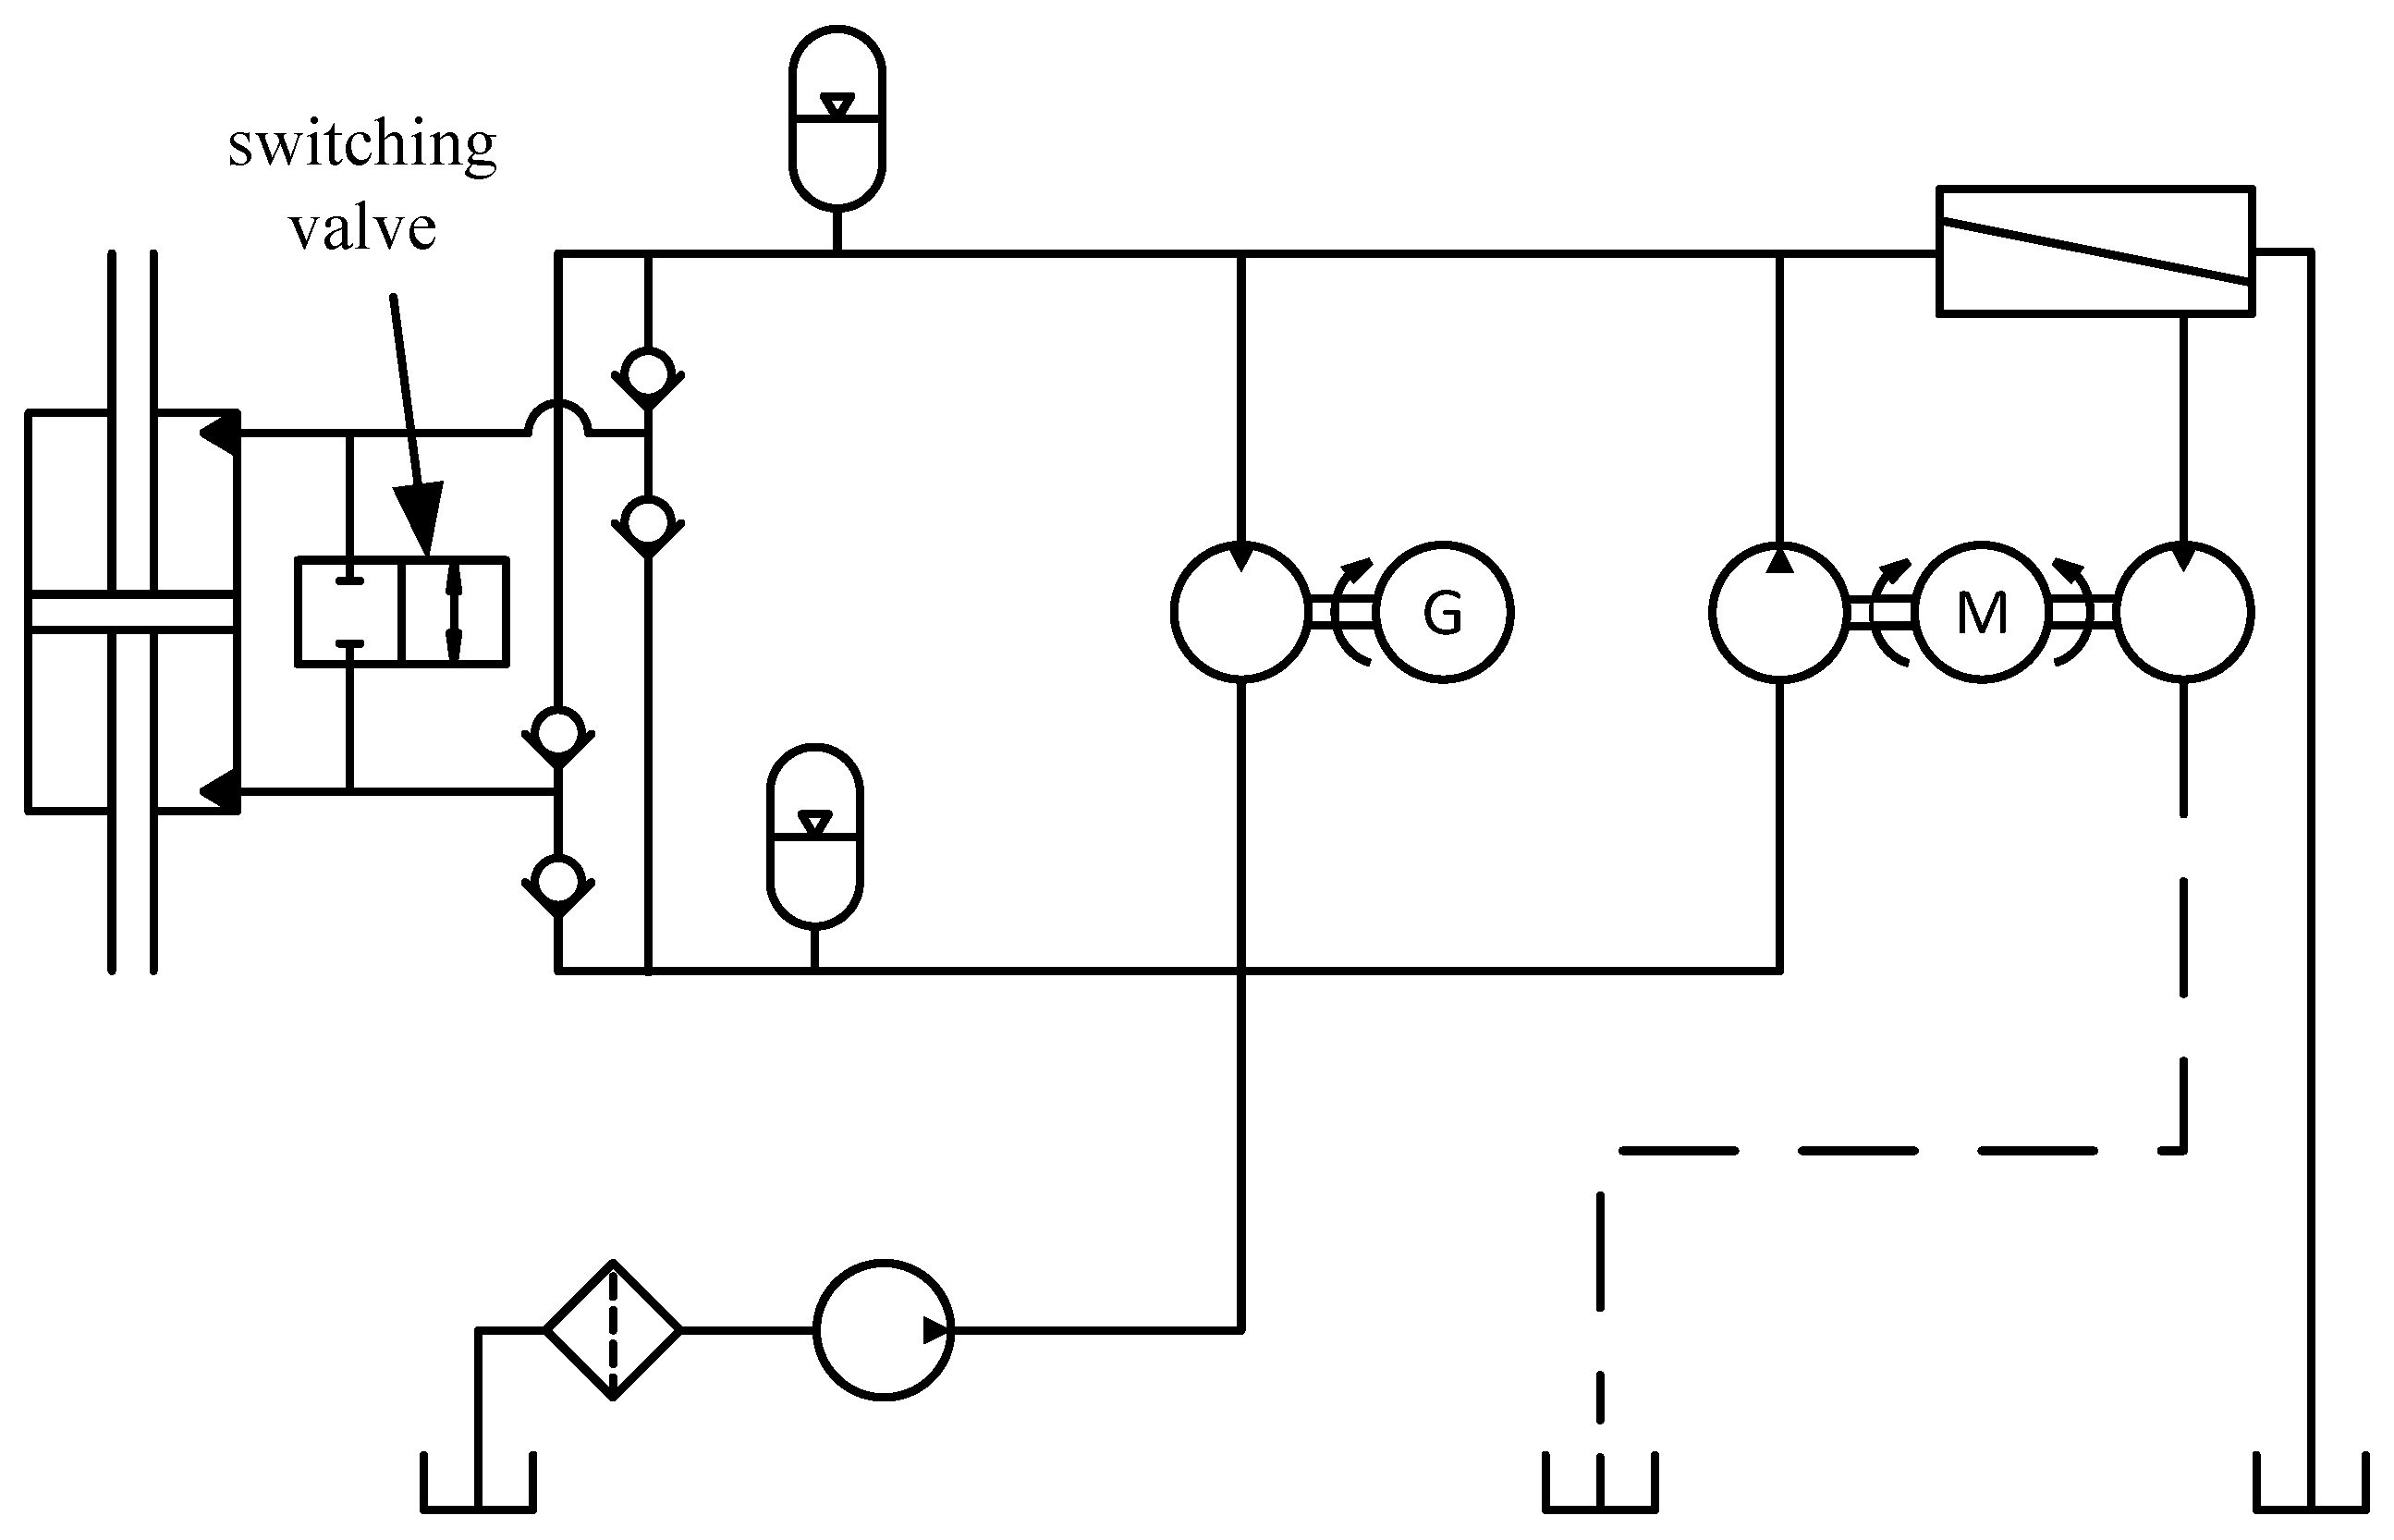
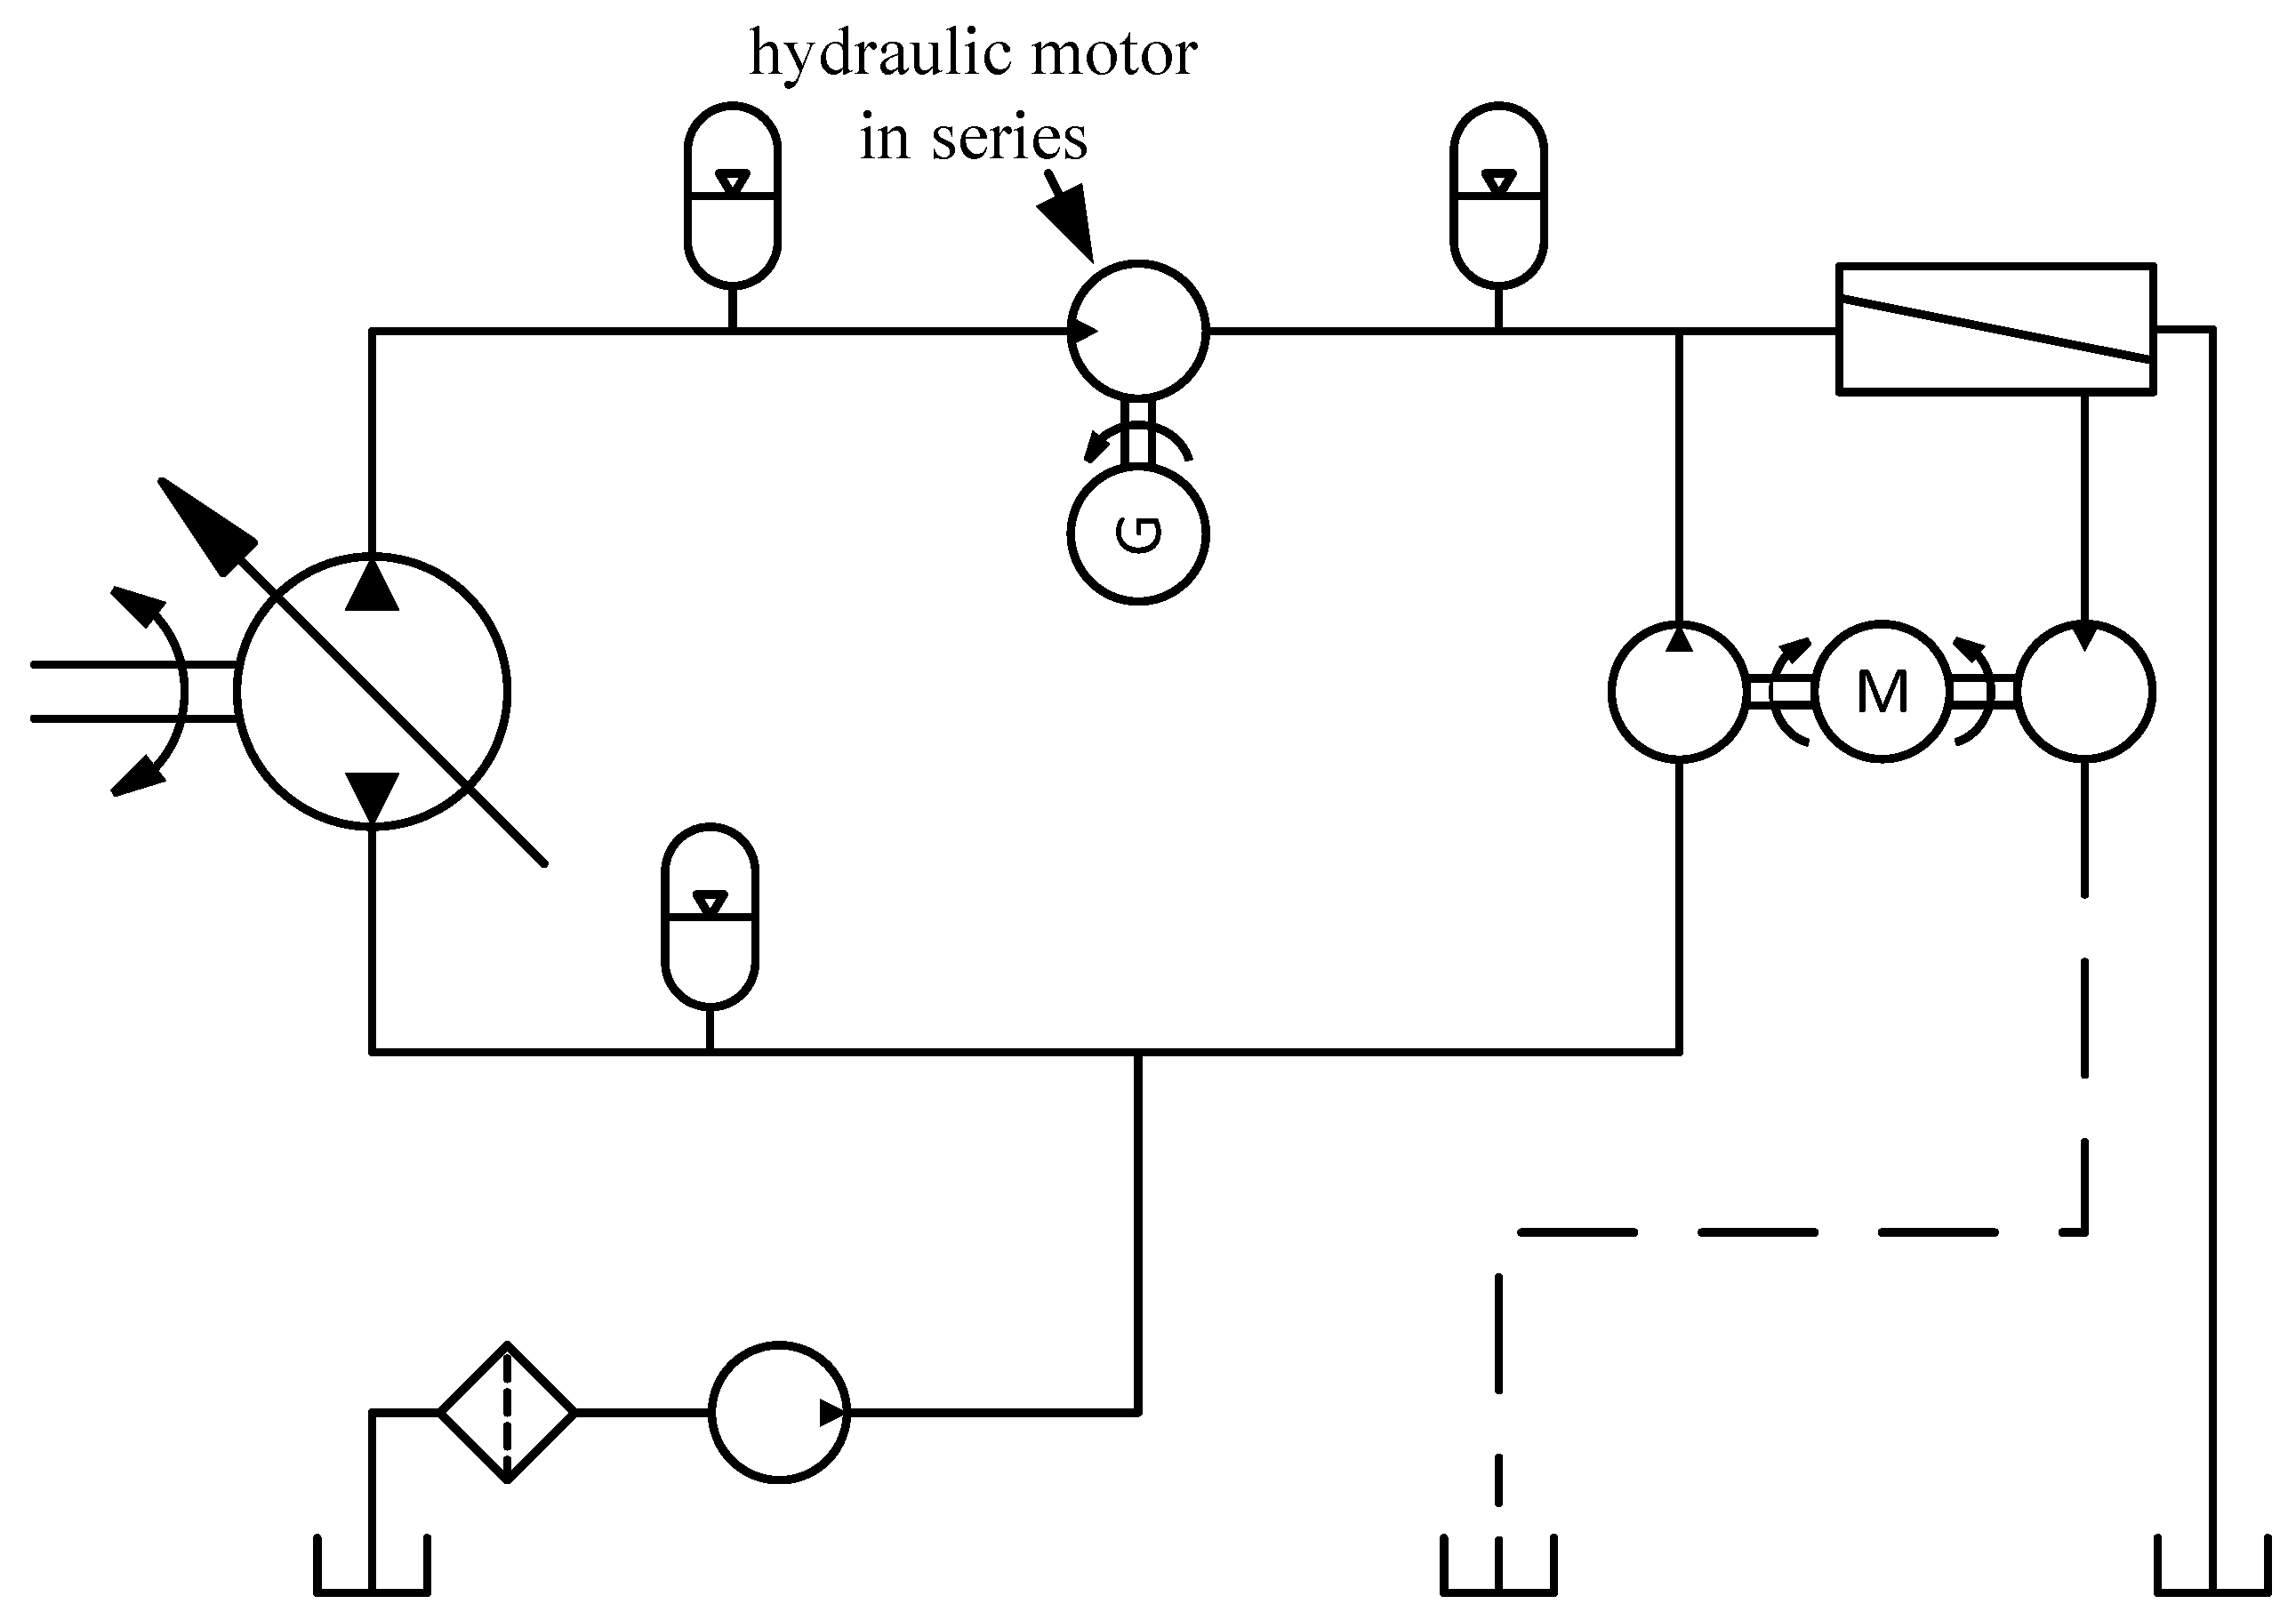
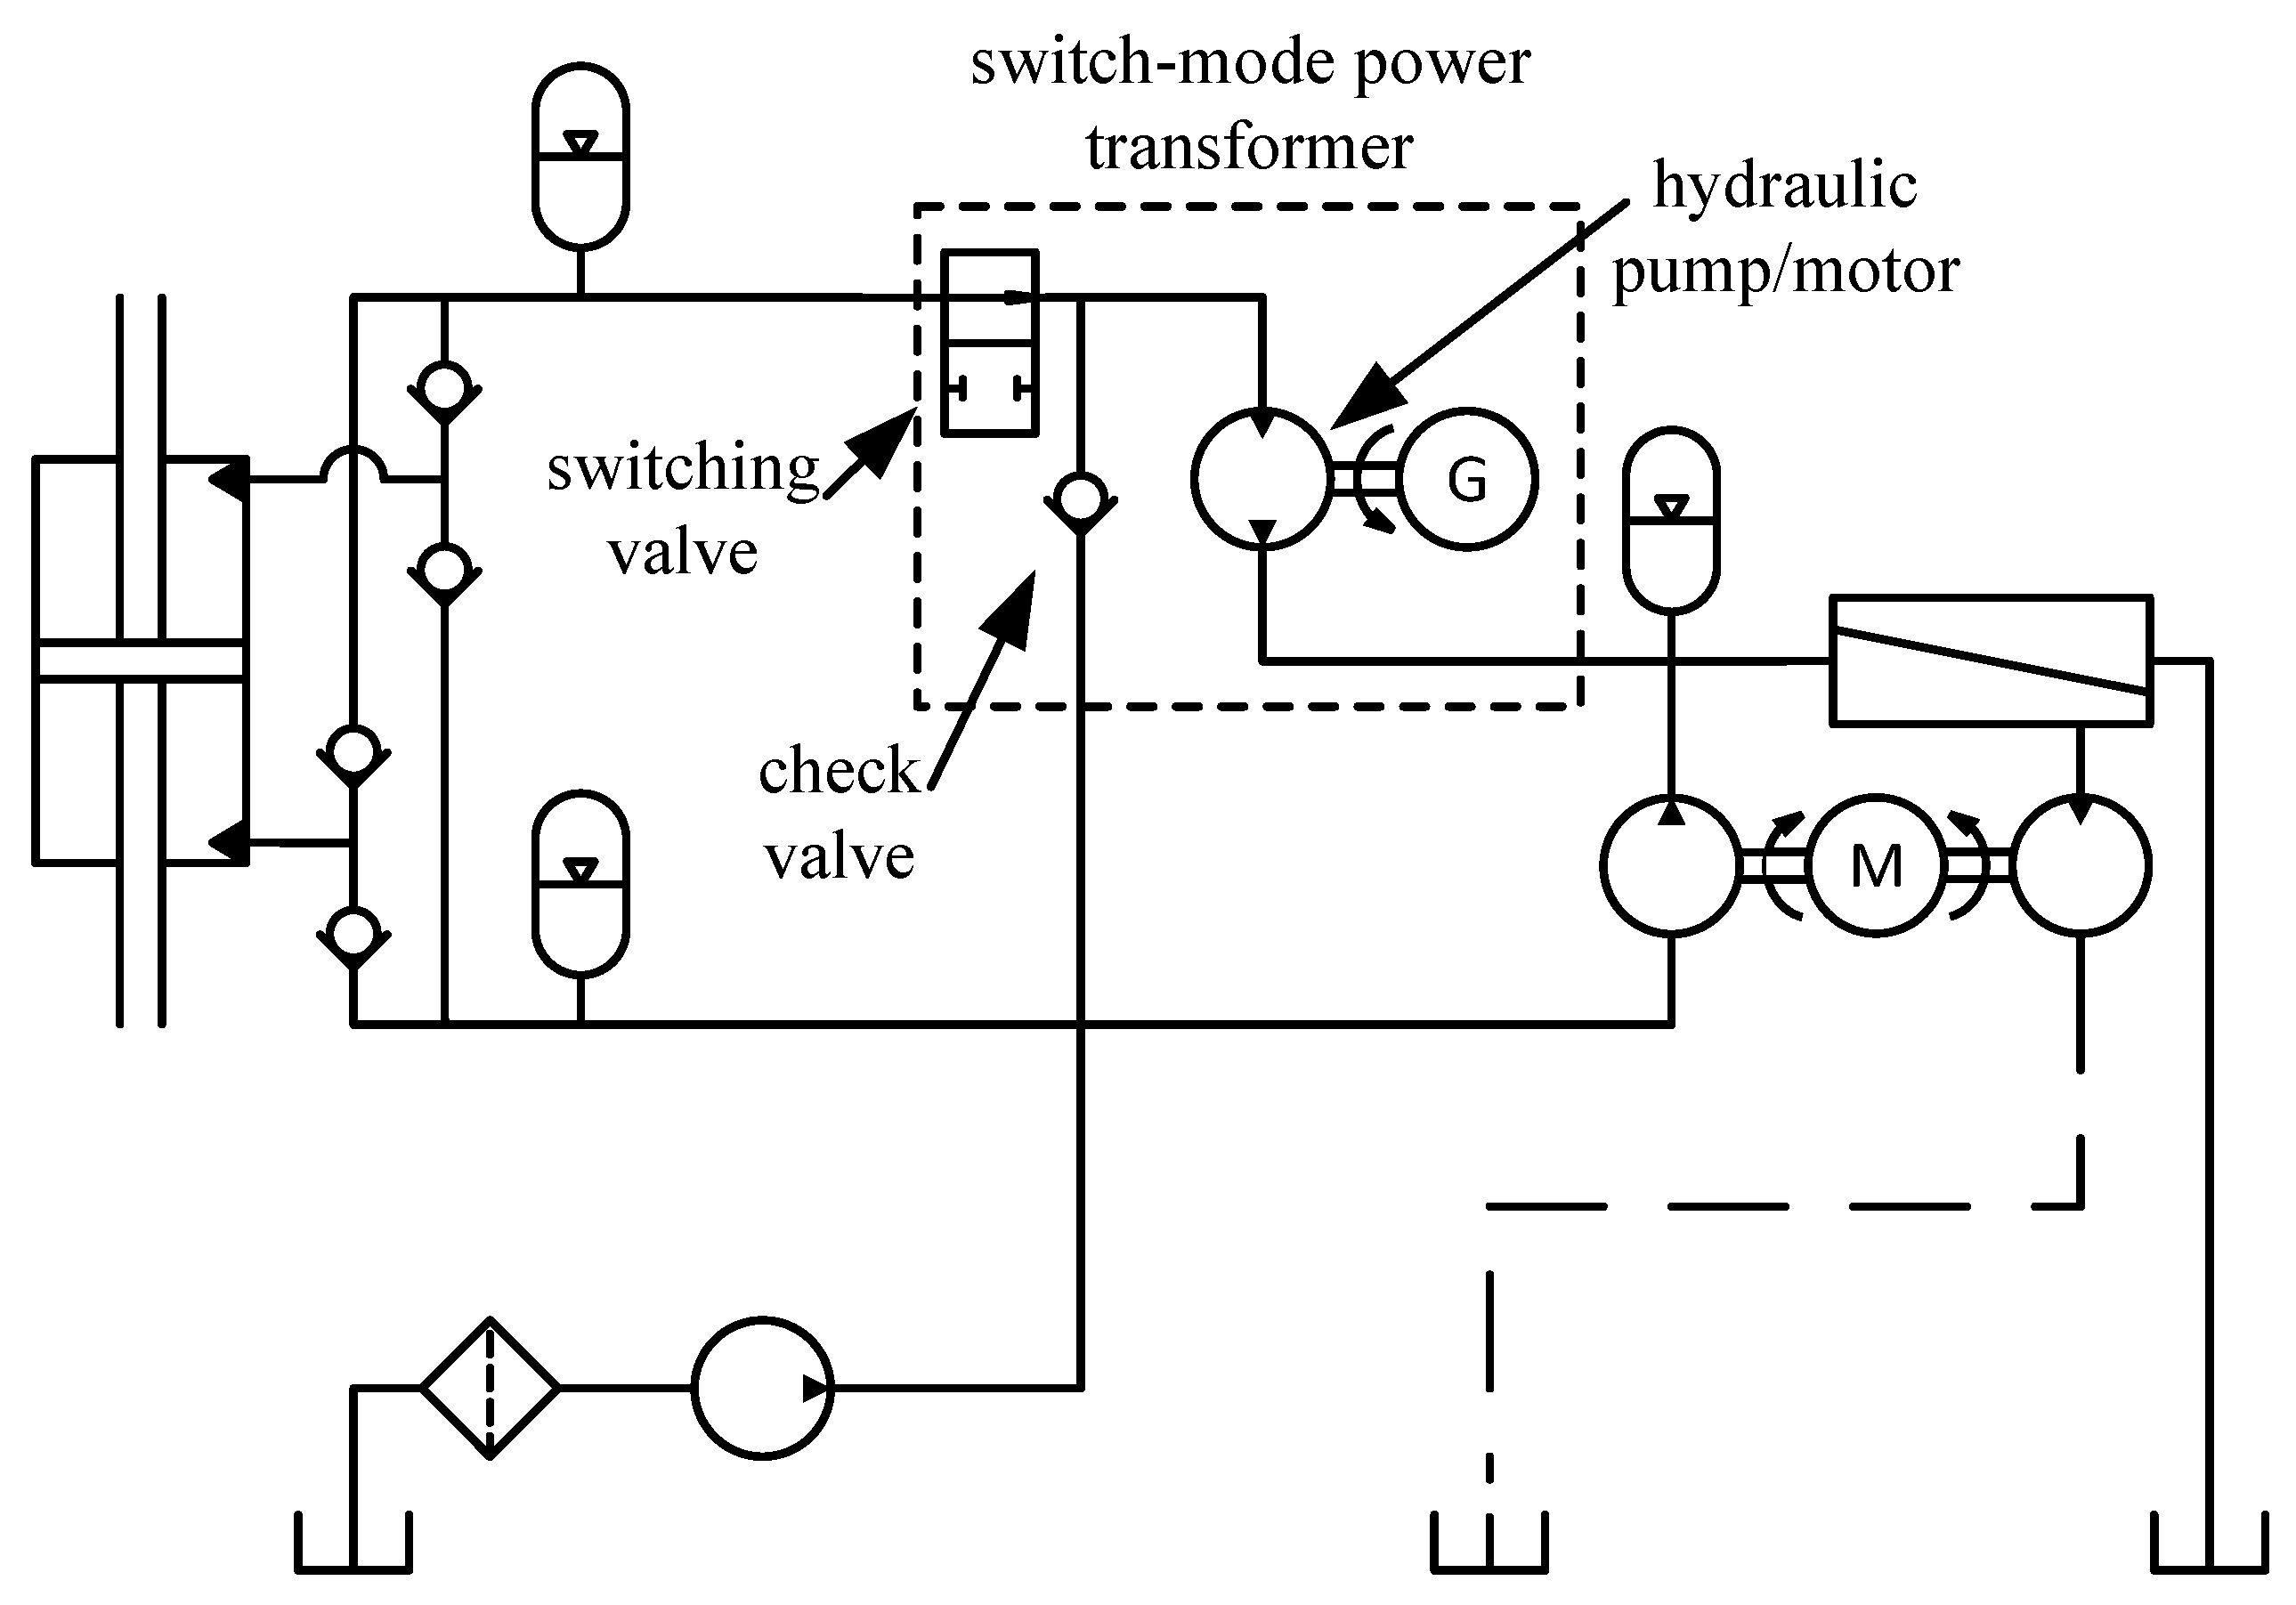
2. Proposed Power Take-Off Architectures

The PTO architectures proposed in this work are motivated by two goals: (1) maximizing the energy that is absorbed and transmitted to the RO membrane module to produce freshwater and (2) maximizing the power density of the WEC-driven pump. The drawbacks of the baseline architecture shown in Figure 1 will be discussed along with proposed modifications that address these drawbacks. This discussion begins with how the design and operation of the baseline architecture affect wave energy capture and freshwater production and ends with a discussion of methods for improving power density.
The reaction forces between the WEC and the power take-off, referred to as the PTO load, serve an important role in determining the rate that wave energy is captured by the WEC. Similarly, the pressure of the seawater fed to the RO module determines the rate of permeate production and the power it consumes (along with the active RO membrane surface area). A drawback of the baseline system shown in Figure 1 is that, once the component sizes are fixed, the only variable available to modulate the load on the WEC and the production rate of the RO module is the pressure of the high-pressure rail. Both the power draw of the RO process and the power absorption of the wave energy harvesting process are solely dependent on this shared pressure level. For any given sea condition, this would not be an issue, since the pressure, displacement of the WEC-driven pump, and total membrane area in the RO module can be optimized in conjunction to maximize the system performance. However, sea conditions at a production site are variable and the system must perform in a variety of sea conditions.
The relationships between the system pressure in the PTO and (1) the power absorbed by the WEC and (2) the power consumed by the RO module are illustrated in Figure 3. The effect of the sea state and the effect of the size of the pump are illustrated by four separate curves. The average power absorbed by a WEC depends on the PTO load and has some maximum value. Different sea states offer different levels of power. Changing the pump displacement shifts the relationship between the pressure differential across the WEC-driven pump and power absorbed, since the load on the WEC is the product of the pressure and displacement (plus losses). The effect of the total active membrane area, affected by the size and number of RO membrane elements comprising the RO membrane module, is illustrated with two different curves. The permeate production rate of the RO process is approximately linear with respect to pressure, resulting in a quadratic relationship between the operating pressure and the power consumed. The production rate and power consumed scale proportionally with the active membrane surface area.
As suggested in Figure 3, the pressure resulting in the maximum power absorption by the WEC will not correspond to commensurate power consumption by the RO module in all sea states; for example, compare the combination of the higher pump displacement and higher membrane area in the first and second sea states (SS1 and SS2, respectively). However, if either the displacement of the WEC-driven pump or the active RO membrane area is adjustable between sea states, the power capture and consumption could be made to correspond, as with the change to either a lower pump displacement or lower membrane area for operation in the second sea state (SS2). This motivates two potential features for the architecture of the PTO: (1) a WEC-driven pump with a variable displacement and (2) an RO system that can vary the active membrane area. Either of these approaches would provide an additional degree of freedom to the operation of the system and may provide greater performance across sea conditions.
Implementation of a variable displacement WEC-driven pump instead of the fixed displacement pump is illustrated in Figure 4 as a modification to the baseline architecture. Note that the change from a fixed displacement pump to a variable displacement pump may require moving away from the linear cylinder pump architecture used by some PTOs (for example, see [18,37]) to a low-speed, high-torque rotary-type pump architecture like the design introduced in [38] and demonstrated in [39]. Alternatively, implementing the switch-mode system shown in Figure 5 provides the effect of a variable displacement pump displacement while not requiring any major change to the pump architecture. For this reason, a switch-mode pump may be a more economical choice. In the switch-mode system, the average rate of volume displaced to the high-pressure line is modulated by the duty cycle of the repetitive switching of the on/off switching valve (i.e., the proportion of time the valve is closed instead of open within a switching cycle).
Implementing a variable RO membrane area would consist of taking a portion of the pressure vessels in the RO module, which contain the RO membrane elements, out of operation or putting more into operation as the sea conditions change. Doing so will change the total active membrane area.
Sharing a common high-pressure rail between the WEC-driven pump, RO module, and hydraulic motor/generator brings about another disadvantage of the baseline system, which will be referred to as a parallel-type architecture. As mentioned above, the operating pressure of the RO module is constrained to pressures below 7 MPa or 8.3 MPa (depending on the components selected). With a parallel-type architecture, the WEC-driven pump is limited to these same pressures. This is a relatively low operating pressure by conventional standards for oil-based hydraulic systems (where pressures of 20–40 MPa are common) and, therefore, the power density of the WEC-driven pump will be relatively poor. Since this is one of the most expensive components in the system, increasing its power density can have a significant impact on decreasing the cost of the plant as well as improving the ease of packaging components.
To accomplish a higher power density for the WEC-driven pump, a series-type architecture is proposed that places the electric generator’s hydraulic motor in series with the WEC-driven pump and RO module, as shown in Figure 6. The load of the hydraulic motor driving the generator creates a pressure differential that sets the operating pressure of the WEC-driven pump above that of the RO module. At the same time, all of the flow from the pump is directed through the hydraulic motor and to the RO module, rather than being split between the two in the parallel-type architecture. This reduces the displacement required for the pump for a given power level, improving the power density. As with the parallel-type architecture, a series-type architecture can achieve the two degrees of freedom in the operation of the plant by including a variable displacement WEC-driven pump, as illustrated in Figure 6, or an RO system with a variable membrane area.
Another series-type PTO architecture, first proposed in [40], adds an on/off switching valve and check valve into the configuration, shown in Figure 7, which is referred to as a switch-mode power transformer. This places a power transformer between the WEC-driven pump and RO module that can also generate electricity. Like the switch-mode scheme for variable displacement shown in Figure 5, switching of the on/off valve in the switch-mode power transformer modulates the average flow contributed by the WEC-driven pump to the RO module. When the valve is open, flow though the hydraulic motor is sourced from the high-pressure node at the WEC-driven pump. This accelerates the inertia of the rotating components of the hydraulic motor/pump and generator, storing kinetic energy (Because the hydraulic motor driving the generator is used as a motor and a pump in the switch mode power transformer, it will be referred to as the “motor/pump” throughout). When the valve is closed, flow is sourced from the low-pressure rail through the check valve. In this case, the inertia of the motor/pump and generator drive the hydraulic motor as a pump to drive flow to the RO module.
With the switch-mode power transformer in place, the WEC-driven pump can be downsized and operate at lower average flow rates and higher pressures than any of the other PTO architectures proposed above. This is so because the flow through the WEC-driven pump can be lower than the flow through the hydraulic motor/pump and RO module while delivering the same power as the pump in the other PTO architectures.
A fixed displacement, WEC-driven pump is suitable for this PTO architecture since the switch-mode power transformer already has the two degrees of freedom needed for independently managing both the wave energy harvesting process and the RO process; the average speed of the hydraulic motor/pump determines the RO feed flow rate, and the switching duty of the on/off valve controls the pressure at the WEC-driven pump.

3. Design Performance of a System from Prior Work as a Point of Reference

The Yu and Jenne system from [13] is examined in this section for the purpose of comparing its design performance with the PTO architectures proposed in Section 2.
The component sizes and specifications for the pumping mechanism are not reported in the publication, but their details have been obtained from the simulation files provided by the authors of [13]. The parameters used by that model are used to derive the WEC-driven pump displacement and installed RO membrane area for comparisons made in this work. Additionally, the presented results did not account for the pressure limit of conventional RO systems and therefore they overestimate the potential annual production of the design. For a more accurate comparison in this study, the model used in [13] was modified to include a pressure relief valve set to limit the pressure at the RO feed inlet to 8 MPa. The estimated yearly average permeate production resulting from this modified model will serve as the reference for comparison rather than the results presented in [13].
The analysis of the pumping mechanism used to derive a value for the WEC-driven pump displacement is presented in Section 3.1. The analysis of the RO module used to determine a value for the installed RO membrane area is presented in Section 3.2. The modification made to their model to include a pressure relief valve and the results the modified model produce are presented in Section 3.3.

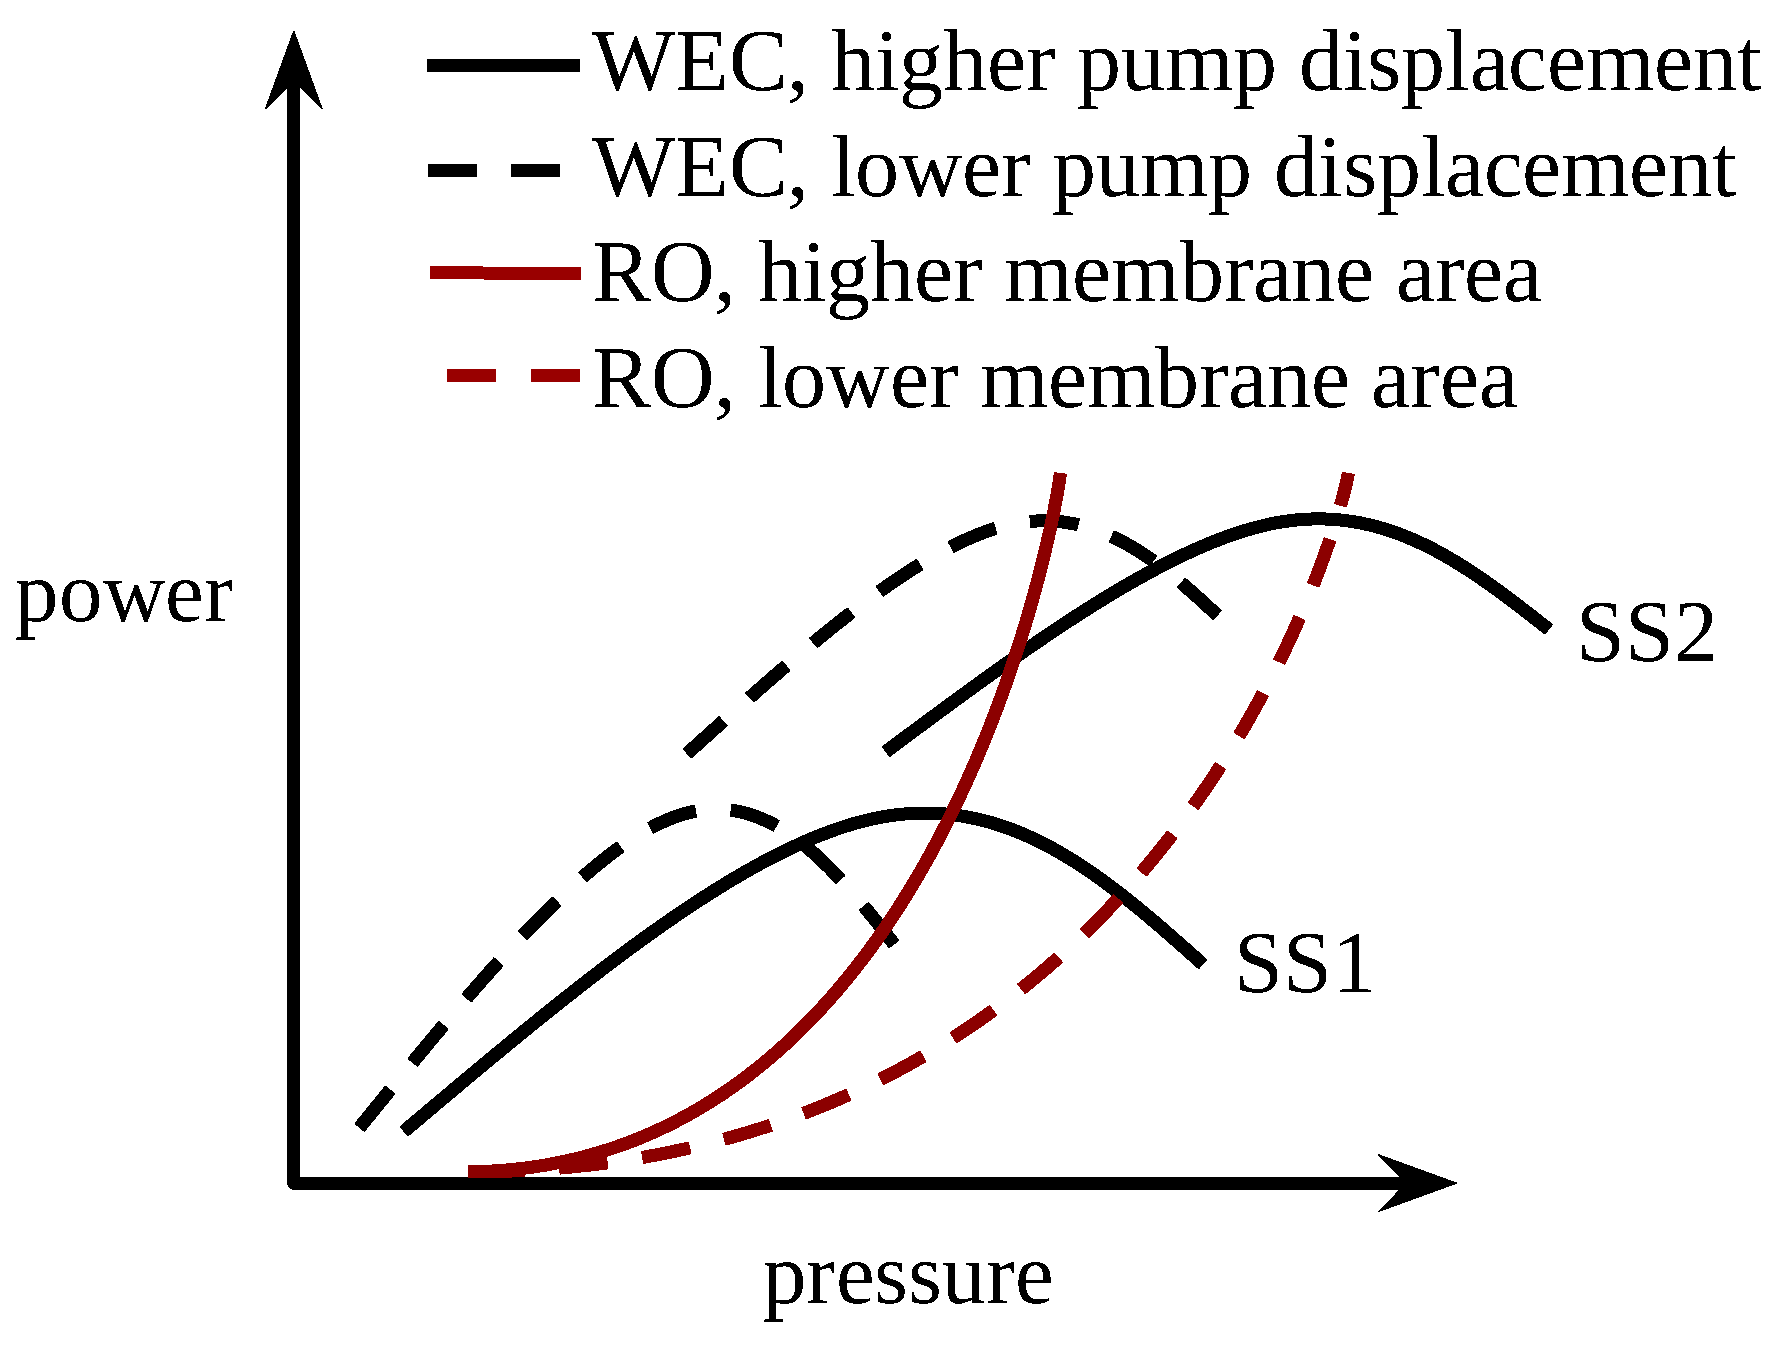
3.1. Pump Displacement

Yu and Jenne [13] modeled the system as having the slider–crank pumping mechanism shown in Figure 8 with the parameters given in Table 1.
In this design, the displacement of the pump is not constant with respect to the position of the WEC. The displacement at a given position can be determined by multiplying the piston area by the ratio between the linear piston velocity and angular velocity of the WEC. Equating the power input and power output of the mechanism reveals that this ratio is equivalent to the ratio between the torque on the crank and force on the piston. A static force analysis of the mechanisms gives the following expression for the displacement as a function of the WEC’s position (this analysis would be carried out more efficiently using the instant centers method and Kennedy’s rule, but this formulation is adopted because this is how the WEC-Sim model from [13] has been formulated):
D = A p L c sin θ + cos 1 L c cos θ L o L r cos sin 1 L c cos θ L o L r
The pump displacement with respect to the WEC motion about the upright position for this PTO design is 0.54 m 3 /rad.

3.2. Reverse Osmosis Membrane Area

The permeate flow rate in Yu and Jenne’s model was calculated using as the following relation:
q p e r m = S r o A p e r m p f p o s m
where S r o is the surface area of active membrane in the RO module, A p e r m is the permeate flux coefficient for the RO module configuration, p f is the pressure at the RO feed inlet, and p o s m is the osmotic pressure of the feedwater (i.e., seawater) [13]. For the model used in [13], this relationship is parameterized with the product of the membrane area and permeate coefficient rather than specifying these parameters separately. The value used for this parameter is 5.56 × 10 9 m 3 s 1 Pa 1 .
In this work, the value assumed for the permeate flux coefficient is based on the work in [17] and is representative of an RO module configuration with parallel sets of three 40-inch RO membrane elements in series. That work analyzed this configuration of RO membrane elements using the WAVE design tool offered by FilmTec, which incorporates the concentration polarization effect and the effect of a progressively increasing feedwater concentration [41]. It found that a constant permeate flux coefficient is a reasonable assumption for the range of pressures considered [17]. The value found is 2.57 × 10 12 m 3 N 1 s 1 . Using this permeate flux coefficient and the osmotic pressure assumed in both [13,17] (2.275 MPa), the equivalent value for the total membrane area of the RO module is 2162 m 2 .

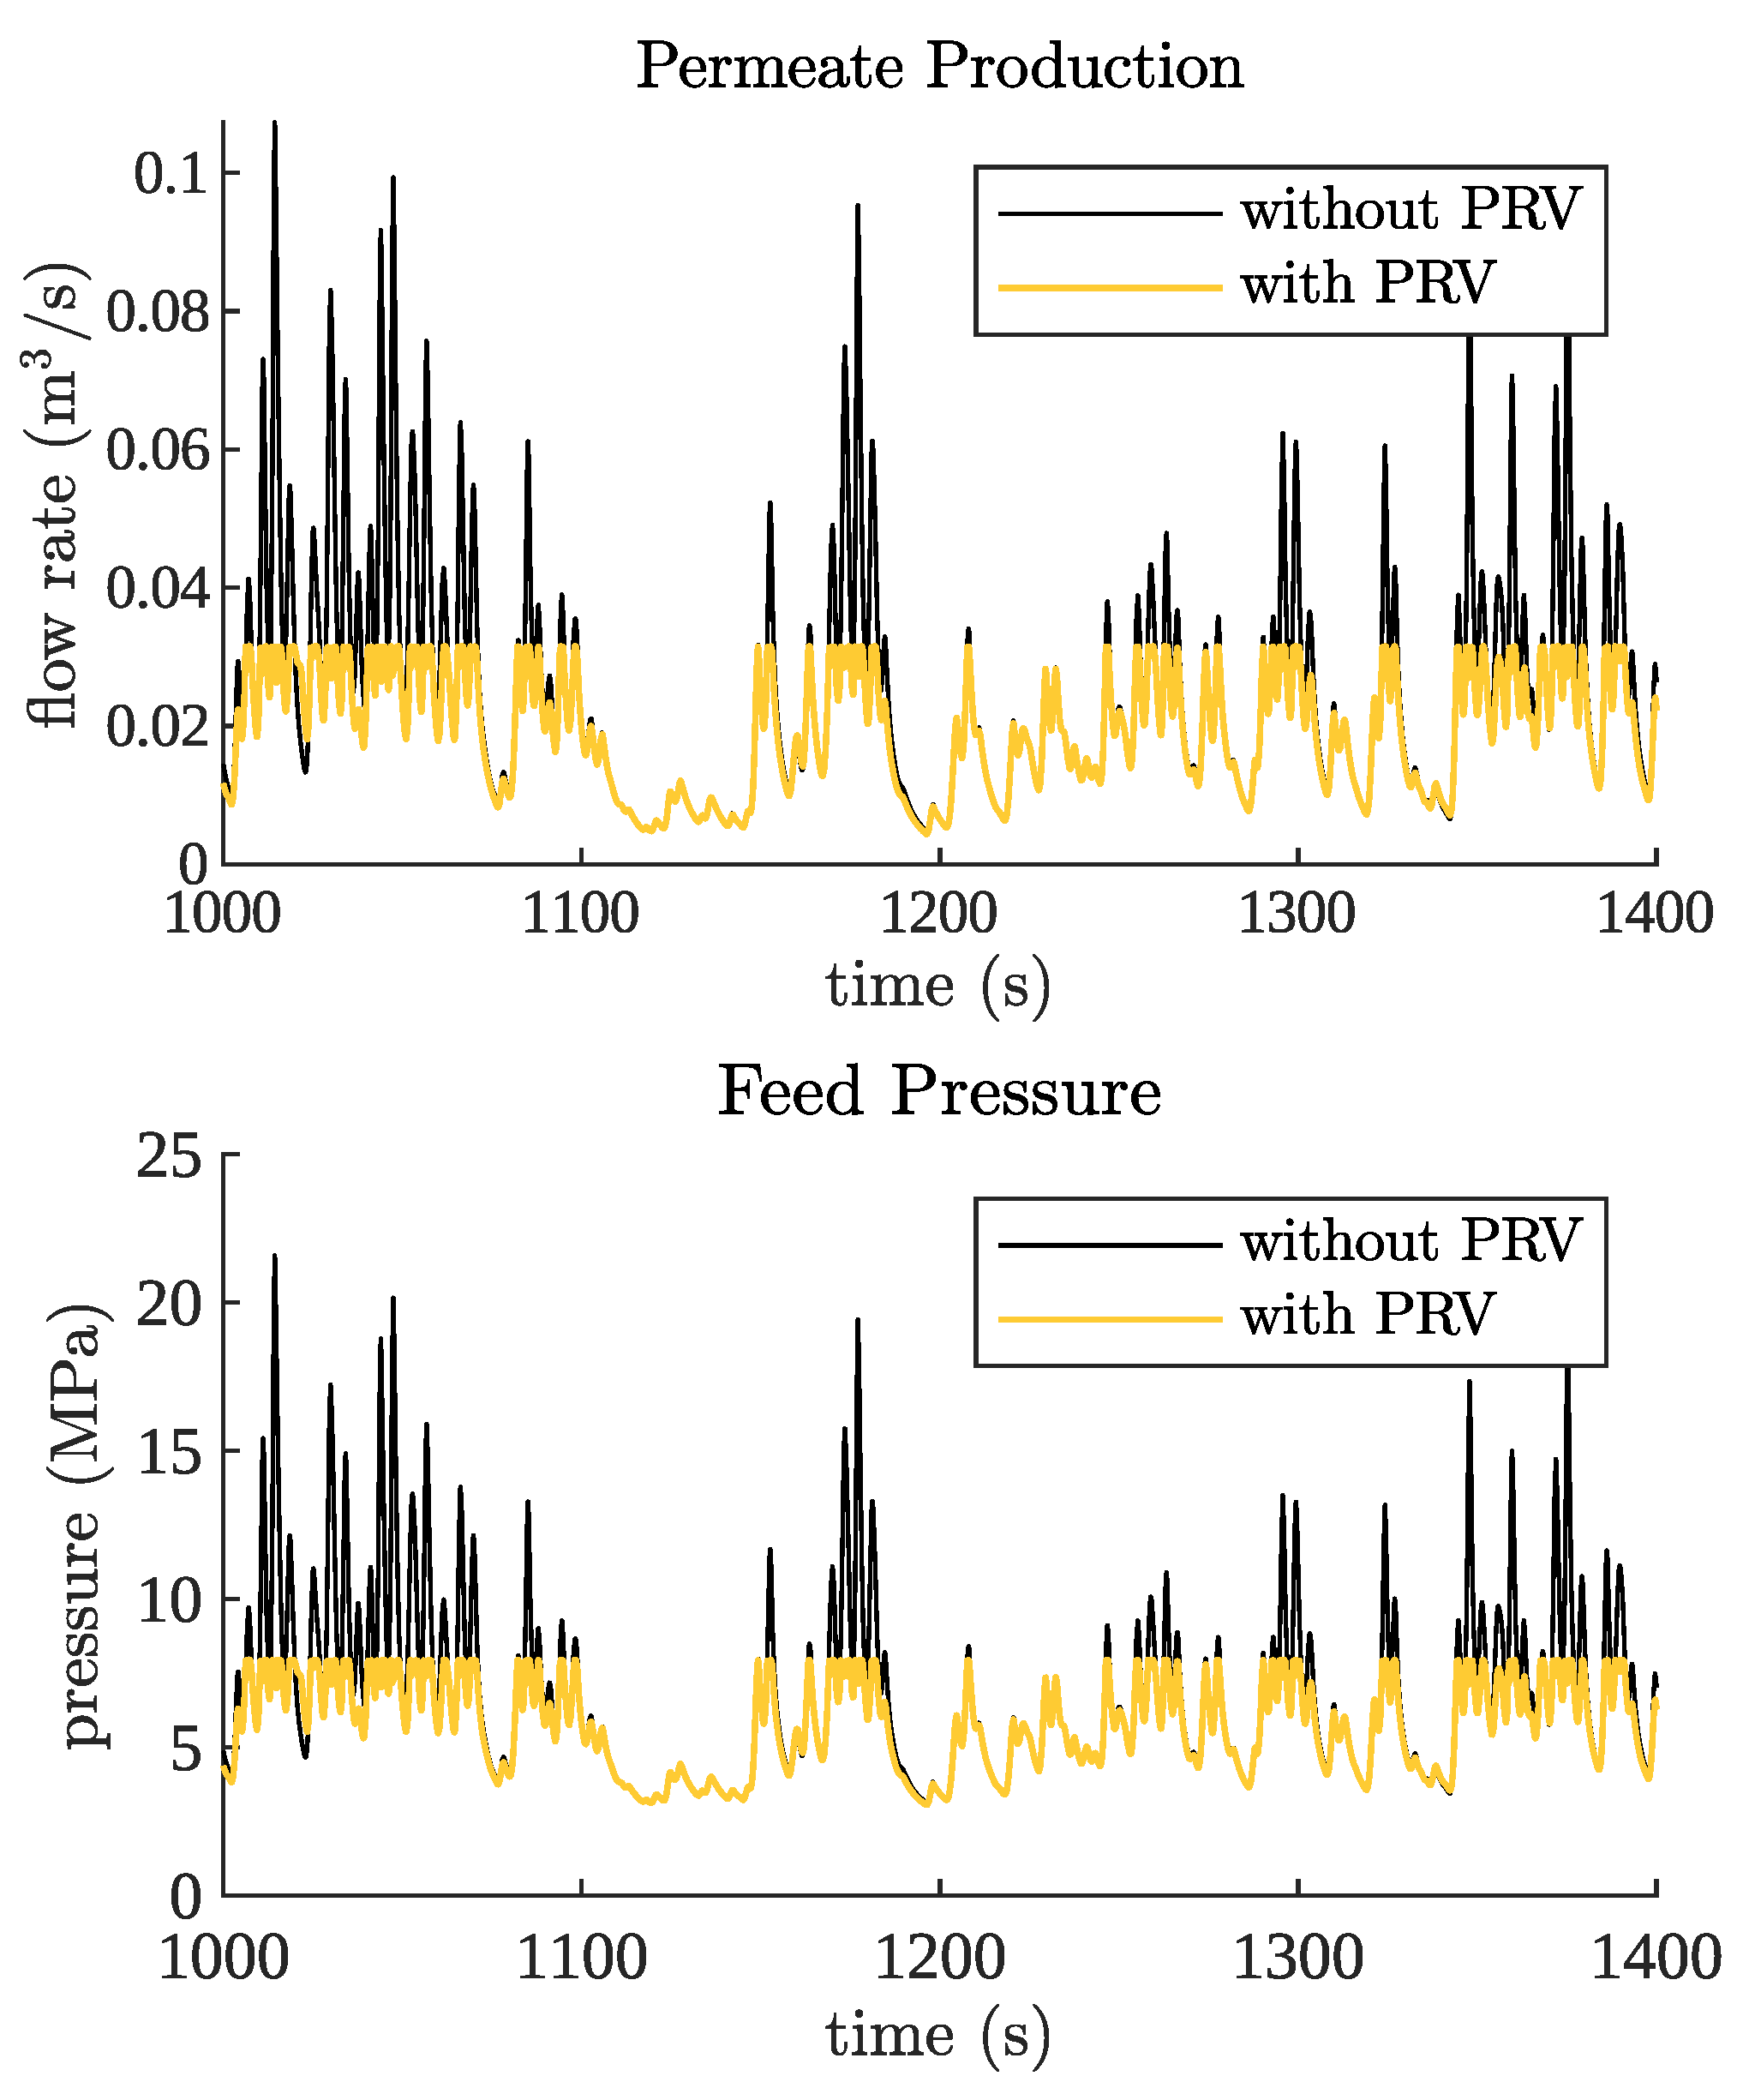
3.3. Modified Model with Pressure Relief Valve

A pressure relief valve was added to the Yu and Jenne model to account for a realistic pressure limit at the RO module feed inlet, and the model was exercised to give an updated estimate of the system’s permeate production.
The pressure relief valve model added to the Yu and Jenne model considers a force balance between the linear restoring force (provided by a spring and steady flow forces) and the static pressure force on the valve face on the poppet in a poppet valve. Unsteady flow forces and the inertia of the poppet are ignored as the response of the valve is assumed to be orders of magnitude faster than the dynamics of the WEC and PTO. The flow through the valve is assumed to be turbulent and is modeled by the orifice equation. The orifice area is assumed to be proportional to the distance of the poppet from the valve seat. Lumping terms allows this model to be parameterized by a valve coefficient, C, and a cracking pressure, p c r . The equation relating flow, q, to the source pressure, p, is
q = 1 C p 3 2 p c r p 1 2
The valve coefficient is determined by specifying a flow rate for a given cracking pressure and source pressure. For example, for a desired limit pressure and assumed peak flow rate, the valve can be designed to not allow the pressure to exceed that limit. This requires the cracking pressure to be set below that limit pressure.
The parameters used for the pressure relief valve are a cracking pressure of 7.95 MPa and a valve coefficient of 1.41 × 10 9 m 3 s 1 Pa 3 / 2 . Figure 9 compares the results of the unmodified Yu and Jenne model and the modified model that includes the pressure relief valve.
To recalculate the yearly average permeate production rate, the modified model was simulated using the same settings as in [13] and five different wave elevation signal realizations for each sea condition (i.e., those given in Figure 2). The average permeate production rates from each of the five simulations were averaged to give a single estimate. These are presented in Figure 10. The weighted-average production from these results is 1476 m 3 /day. This is 17% less than the estimate of 1786 m 3 /day presented by Yu and Jenne for the system without a pressure relief valve [13].

4. Methods

The remainder of this paper presents a design study that compares the optimal design performance of the PTO architectures proposed in Section 2. This section presents the methods used for that design study. This includes the models for the system, the design problem formulation and design methods, and the method for comparing PTO architectures.
The system is modeled by a two-way coupled steady-state model of the WEC/PTO system. Instead of using a dynamic model of the PTO and solving it numerically in the time domain, the flow rates and pressures are assumed constant and as a function of the average power input to the system. The power input to the PTO is a function of the PTO load on the WEC and is based on hydrodynamic simulations of the WEC in the time domain assuming a constant PTO load. The hydrodynamic simulations are used to generate data sets for each sea condition a priori that relate the average power absorbed by the WEC to the constant magnitude PTO load. A continuous function is interpolated in situ from the a priori data sets and is coupled to the steady-state PTO model. The power input to the PTO results in a load on the WEC and vice versa. The model used for the PTO is presented in Section 4.1. The model used for the WEC is presented in Section 4.2 along with validation of the model in the Model Validation Sub-Section. Given the models for the PTO presented in Section 4.1, the combined model is solved directly with no need for iterative solution methods.
The design problem addressed by this study is treated as having multiple objectives. The data for the design performance of the PTO architectures consist of estimated annual average rates of permeate production as a function of the maximum displacement of the WEC-driven pump and the installed membrane surface area in the RO module. These two component specifications, pump displacement and membrane area, serve the dual purposes of being objectives to be minimized and of being independent variables determining the permeate production. The optimal annual permeate production rate for each combination of pump displacement and membrane area is determined by a single objective optimization of the system operation in each of the sea conditions given in Figure 2.
The overall design performance of each PTO architecture includes three objectives; thus, there are no single optimal designs for each PTO architecture that can be used to rank the architectures. Therefore, this design study uses a method of comparing the design performance based on Pareto optimality and the use of reference designs. A detailed formulation of the design problem, the method of obtaining the optimal permeate production as a function of component sizes, and the method of using reference designs as points of reference are presented in Section 4.3.

4.1. Power Take-Off Models

This section presents the steady-state models used to estimate the performance of the PTO. This section begins with common aspects of the models for each PTO architecture, which include the behavior of the RO system (including the ERU), charge pump, and the WEC-driven pump. The flow and pressure drop across the hydraulic motor/pump and the generation of electric power differ between the PTO architectures and are presented next. This section concludes with a specification of the parameters assumed for these models.
In all cases, the flow through the charge pump, q c , is equal to the RO feed flow rate. The feed flow rate is the sum of the permeate and concentrate flow rates and is determined from the permeate flow rate, as in Equation (2), and a recovery ratio, Y, such that
q c = q p e r m Y
This assumes the recovery ratio is determined. The ERU is assumed to maintain this recovery ratio. The power consumed by the charge pump is given by
P c = q c p c η c η m
where p c is the charge pressure, η c is the efficiency of the charge pump, and η m is the efficiency of the electric motor driving it. The electrical power consumption by the ERU is assumed to be negligible while providing an equivalent amount of sea water to the RO feed and the concentrate being discharged.
The power absorbed by the WEC, P w , is a function of the PTO torque and is determined by interpolating the a priori data set characterizing its time-averaged performance. The PTO torque is given by
T P T O = D w p h p c η w
where D w is the displacement of the WEC-driven pump per radian, p h is the pressure at the outlet of the pump, and η w is the combined efficiency of the WEC and WEC-driven pump.
The flow rate through the WEC-driven pump is a function of the power absorbed by the WEC and is given by
q w = P w η w Δ p w
The rest of the relations between pressure and flow rates are specific to each PTO architecture. For parallel-type architectures, the high pressure at the WEC-driven pump is assumed to be equal to the RO feed pressure,
p h = p f
the pressure differential across the motor/pump is equal to the difference between the RO feed pressure and the charge pressure,
Δ p m p = p f p c
and the flow rate through the motor/pump is equal to the difference between the flow rates of the WEC-driven pump and the RO permeate,
q m p = q w q p e r m
For the series-type architecture without the switch-mode power transformer, the flow rates for the WEC-driven pump, the motor/pump, and permeate produced by the RO module are equal:
q w = q m p = q p e r m
With the switch-mode power transformer, the switching duty, d, determines the ratio between the flow rate coming from the WEC-driven pump and the flow rate through the hydraulic motor/pump such that
q w = d q m p
Without the switch-mode power transformer, the pressure differential across the motor/pump is equal to the difference between the pressure at the WEC-driven pump and the RO feed:
Δ p m p = p h p f
For the parallel-type architecture and series-type architecture without the switch-mode power transformer, the motor/pump only functions as a motor. In this case, the power generated by the hydraulic motor/pump and generator is
P g e n = η g e n η m p q m p Δ p m p
where η g e n is the efficiency of the electric generator, η m p is the efficiency of the hydraulic motor/pump, q m p is the flow rate through the hydraulic motor/pump, and Δ p m p is the difference in pressure between the inlet and outlet of the hydraulic motor/pump.
With the switch-mode power transformer, the motor/pump alternates between motoring and pumping modes within a switching cycle. However, it is assumed that the power to drive the machine in the pumping mode comes from the stored kinetic energy of the rotor and that the electric generator is always in a power generating mode. It is further assumed that throttling losses across the valve and switching losses arising from the compressible fluid volume switching between pressures are negligible. Under these assumptions, the electrical power generated is given by
P g e n = η g e n q m p η m p d p h p f 1 d p f p c η m p
With 100% duty (i.e., d = 1 ), this becomes identical to Equation (14),applying to the series-type architecture without the switch-mode power transformer.
The parameters used in this study are given in Table 2. The permeate flux coefficient and osmotic pressure match the values used in Section 3.2 to analyze the Yu and Jenne system. The recovery ratio matches the assumption from [17] on which the permeate flux coefficient is based. A charge pressure of 0.3 MPa was selected. The efficiency values assumed are typical for conventional components.

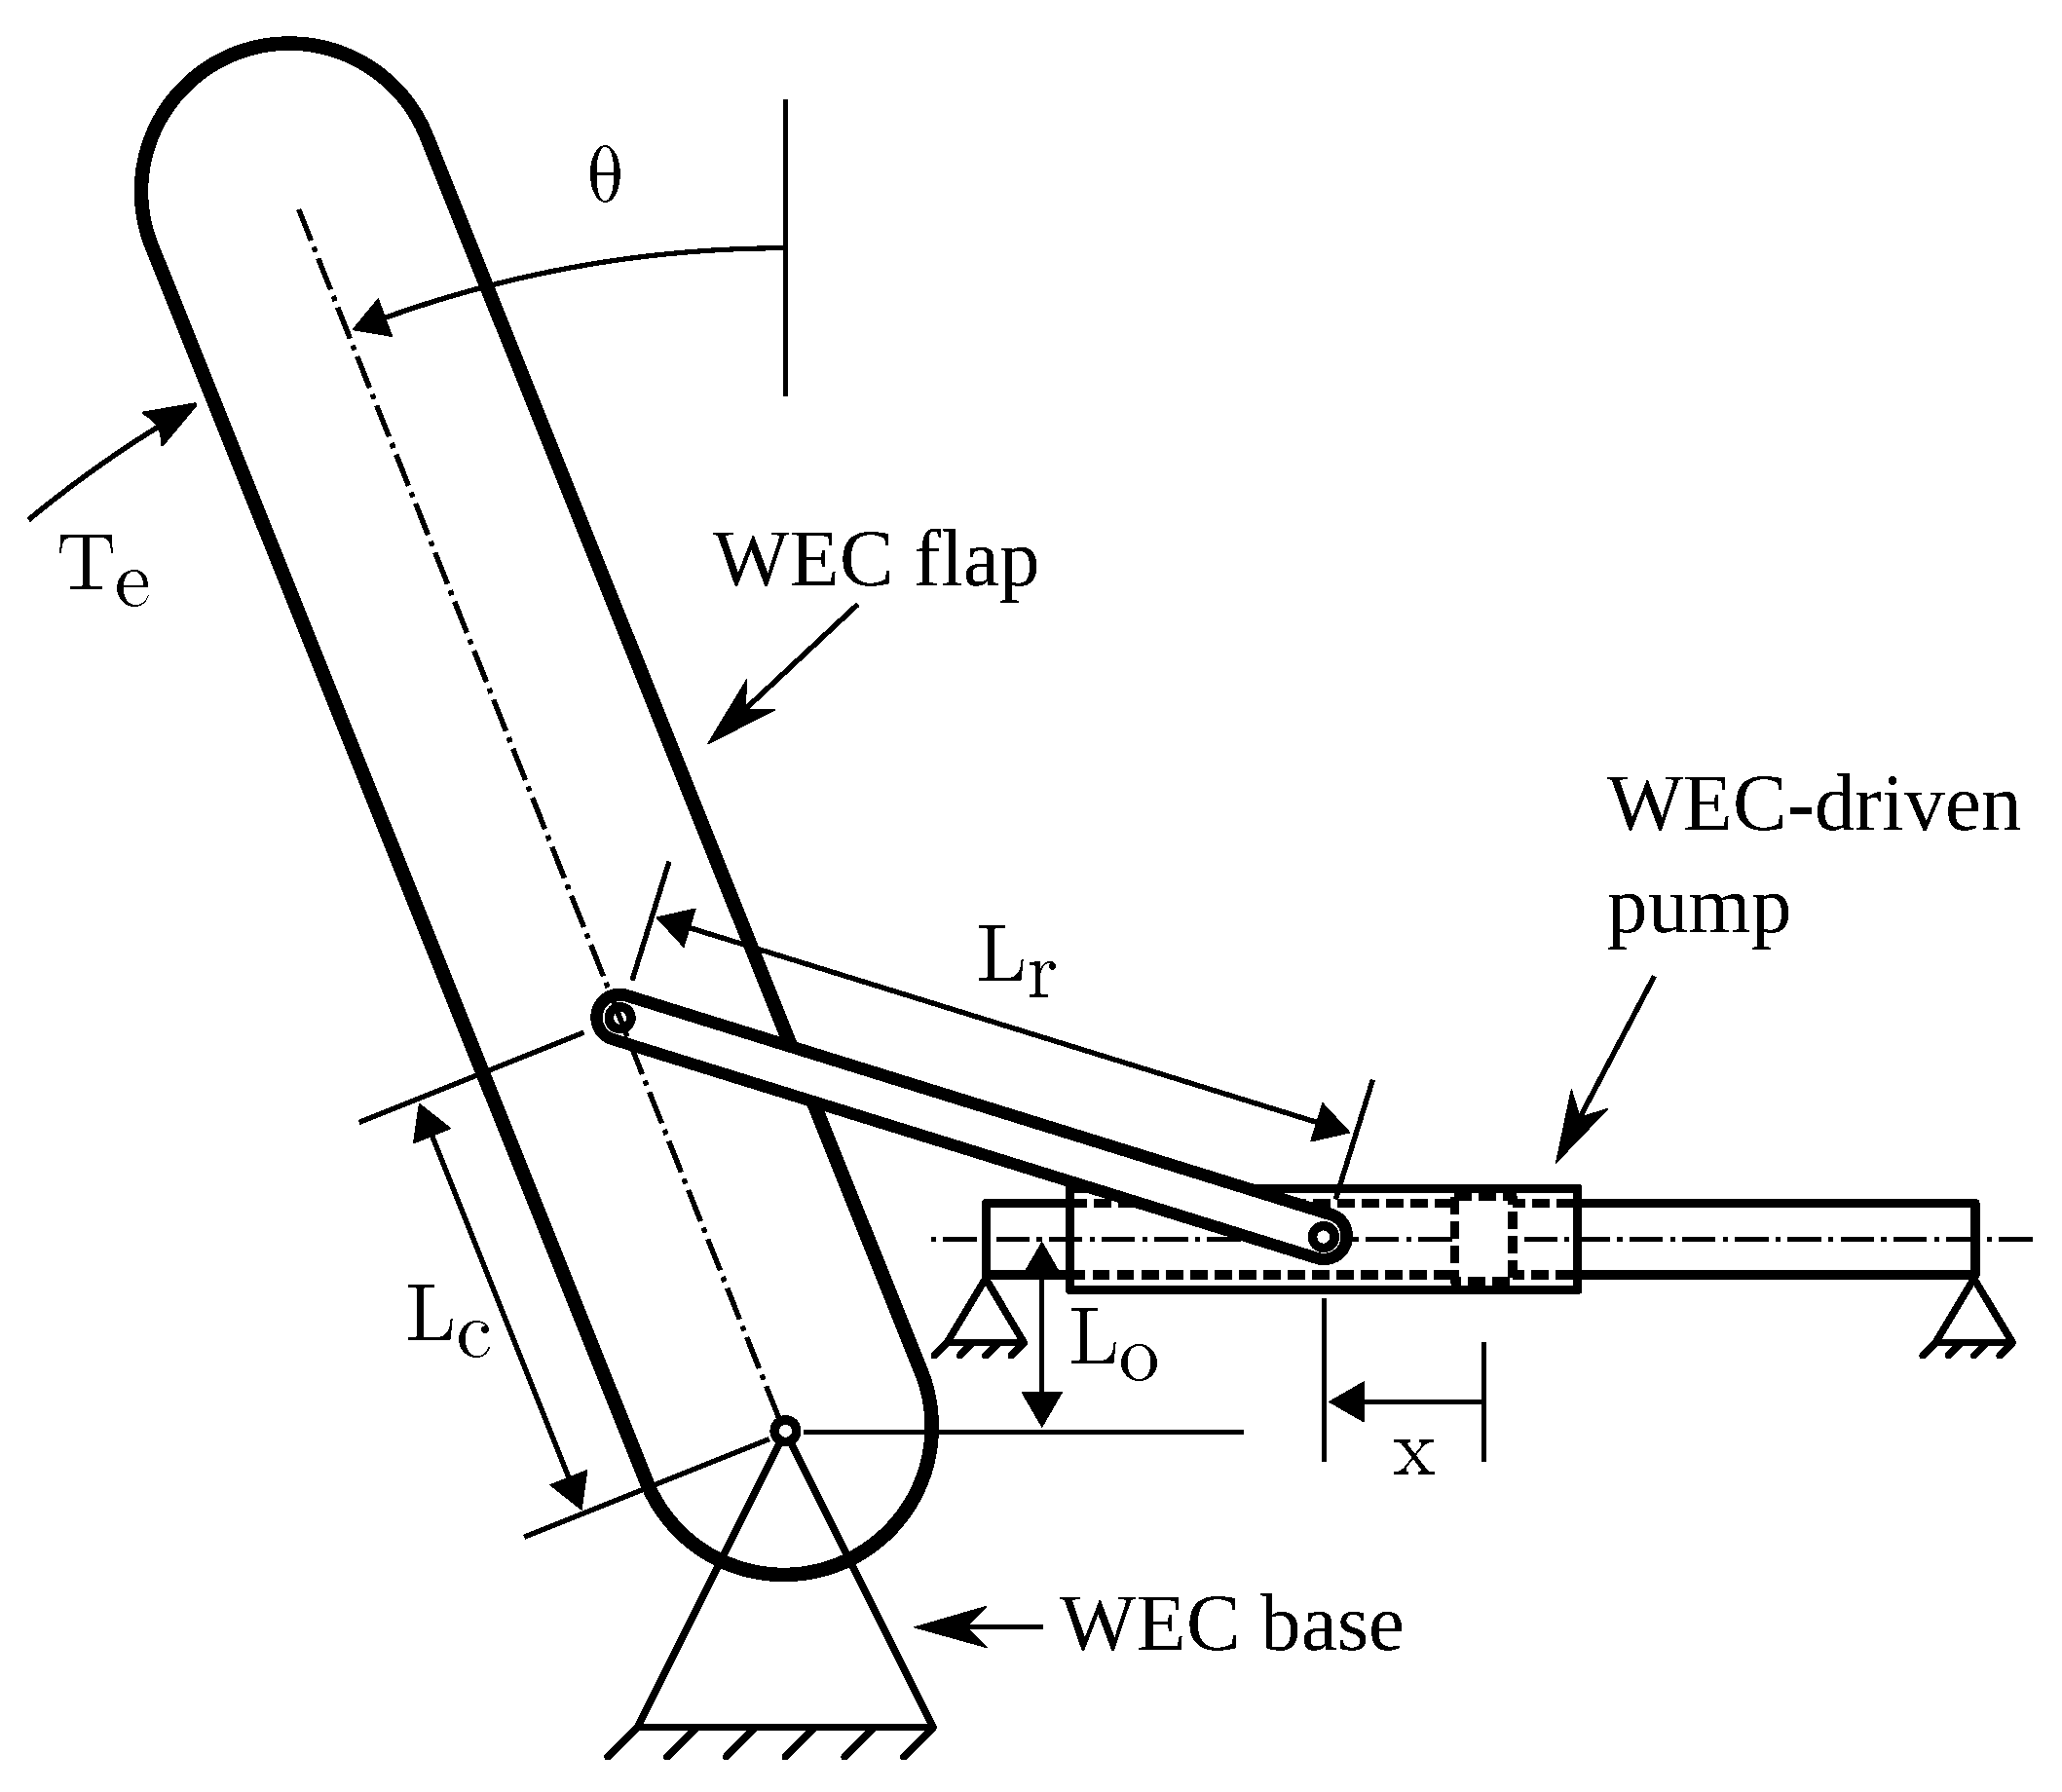
4.2. Wave Energy Converter Model

This section presents the dynamic WEC model used to produce the time-averaged characterization of the WEC performance that is coupled to the steady-state PTO models. This begins with a description of the equation of motion and the models for each force involved. The description of the model is followed by a specification of the parameters assumed for the model, how it was solved, and how it was used to inform the time-averaged characterization of the WEC. The section concludes with the validation of this model.
The equation of motion used to model the WEC is the Cummins equation, which uses an impulse response function to represent the time-history effects of the motion of ships and marine structures on forcing by radiating waves [42]. Applied to an oscillating surge wave converter rigidly attached to the ocean floor, the Cummins equation is
I + I a θ ¨ + T d + T h + T r a d = T e + T P T O
where θ is the angular position of the WEC’s flap (the position is taken to be zero when the flap is vertical and is positive when the flap leans toward shore), I is the inertia of the WEC about its axis of rotation, I a is the hydrodynamic added inertia, T d is the torque from viscous damping (which is not considered in this study), T h is the hydrostatic restoring force, T r a d is the torque due to waves radiating from the WEC, which are the result of the time history of the motion of the WEC, T e is the torque resulting from the excitation by the wave elevation, and T P T O is the reaction torque from the PTO’s WEC-driven pump and the mechanical losses attributable to the WEC. The radiation damping torque, as suggested by Cummins, is represented by convolution of an impulse response function such that
T r a d = t K t τ θ ˙ τ d τ
where K t is the torque response on the WEC given a unit impulse in the angular velocity of the WEC. Note that this assumes that the amplitudes of the waves are small and therefore behave linearly. Since convolution integrals are computationally expensive, the radiation damping is instead modeled by a linear system which has the impulse response function approximating K t . The identification of this approximated model uses the algorithm presented in [43].
The wave excitation to the WEC is modeled as a linear frequency response that scales proportionally with the wave amplitude. That is, given a sinusoidal wave profile passing the WEC, the excitation force is sinusoidal with the same frequency, an amplitude proportional to the wave amplitude dependent on frequency, and a shift in phase dependent on frequency. Realistic waves are not sinusoidal but can be represented by a trigonometric series. A finite series with frequency components is used such that
T e t = i = 1 n E ω i a ω i sin ω i t + ψ e ω i + ψ i
where ω is the i-th frequency in the series, E ω is the frequency-dependent coefficient of the excitation torque, a ω is the frequency-dependent wave elevation amplitude, ϕ e ω is the frequency-dependent phase shift between the wave elevation and the excitation force, and ϕ i is the phase of the i-th frequency component in the constructed wave elevation signal, which is a randomly generated number between zero and 2 π . Different wave elevation signals are generated by changing either the seed used for the random number generator or changing the discretization of the frequency domain. The discretization affects the quality of the signal, so random number generator seeds are used to construct unique wave elevation signals.
The wave elevation amplitude for each frequency component is calculated from an assumed power spectral density function, S ω , describing realistic wave elevations, such that the amplitude of a frequency component is
a ω i = 2 S ω i Δ ω i
where Δ ω i is the bin width used for discretizing the frequency spectrum about the i-th frequency component. The Pierson–Moskowitz spectrum is used [36]. This is
S ω = 5 π 4 H s 2 T p 4 ω 5 exp 20 π 4 T p 4 ω 4
where H s is the significant wave height and T p is the peak period.
An equal-energy method of discretization is used to discretize the frequency spectrum, where the width of the bins is determined by the range of frequencies to be discretized and the number of frequencies making up the discretization such that the integral of the power spectral density function within each bin is equal. This method is preferred over a constant bin width because it generates a signal that does not repeat within any practical length of time.
The frequency responses of the excitation torque and radiation damping impulse response function are determined by boundary-element-method-based frequency-domain potential flow solvers. For this study, the open-source solver NEMOH was used [44]. This program provides frequency-dependent coefficients for the excitation force, added inertia, and a radiation damping impulse response function. The added mass and radiation damping impulse response functions are inputs to the frequency-domain identification algorithm used to generate the linear system model for the radiation damping torque. The added mass is equal to the high frequency asymptote for the frequency-dependent added mass coefficients, when these are made is available [43]. In this case, the system is rotational and it is the added inertia, I a , that is provided.
The hydrostatic restoring torque is the torque due to a buoyancy less the torque due to the weight of the flap such that
T h = m g x c m V s u b ρ x c b
where, for the torque due to weight, m is the mass of the flap, g is the acceleration due to gravity, and x c m is the distance of the center of mass from the axis of rotation and orthogonal to the direction of gravity, and for the torque due to buoyancy, V s u b is the submerged volume of the flap, ρ is the density of the seawater and x c b is the distance of the centroid of the submerged volume from the axis of rotation and orthogonal to the direction of gravity. A simple model for the submerged volume, V s u b , assumes that the flap of the WEC is a thin, flat plate such that the submerged volume is
V s u b = L t L w L s u b
where L t is the thickness of the flap, L w is the width, and L s u b is the length of the submerged portion of the flap. A model for the submerged length of the flap, which assumes a high curvature of radius in the wave elevation compared to the motion of the flap, is given by
L s u b = h + h w t cos θ , if cos θ > h + h w t L f , otherwise
where L f is the total length of the flap, h is the depth of the axis of rotation from the mean surface level, and h w t is the wave elevation as it deviates from the mean surface height. Like the excitation torque, the wave elevation is constructed from a discrete and finite trigonometric series such that,
h w t = i = 1 n a ω i sin ω i t + ψ i
The distances of the center of mass and centroid of the buoyancy from the axis of rotation are given by
x c b = L s u b 2 sin θ
and
x c m = L f 2 sin θ
The torque from the PTO, T P T O , is constant in magnitude and opposes the motion of the WEC.
This WEC was solved numerically using the forward Euler method. Convergence of the mean power absorption by the WEC was found with respect to the numerical solver time step, the length to the simulation, and the number of frequency components used to generate the wave elevation and excitation force. The simulations informing the steady-state model of the WEC were solved using a 0.01 s time step and a length of 2000 s with 1000 frequency components. Ten simulations with different sets of random phases were averaged to produce the a priori data set for the average power absorption for the WEC in each sea state. The initial conditions of the simulation were obtained using a 250 s simulation, where the excitation force on the WEC was ramped from zero to its full value by multiplying the excitation torque by a time-dependent modifier such that
T e * = 1 2 + 1 2 cos π + t T r a m p π T e
where T e * is the modified excitation torque value, t r a m p is the duration of the ramp period, and the time t is zero at the beginning of the ramp period. This method was reported in [45] and is useful for avoiding excessive transient responses at the beginning of the simulations.
The parameters for the WEC are summarized in Table 3. The parameters used in simulating the WEC are summarized in Table 4.

Model Validation

To validate the performance of this WEC model, its results were compared to results for the same design reported in [17] and to experimental results reported in [34]. The results from each source used the same conditions in terms of sea conditions, PTO behavior, and parameters. Both cases used a power take-off with linear damping, where the reaction force is proportional to velocity; this was replicated for the purpose of model validation.
The WEC with a linear damping PTO was tested with a damping coefficient of 50 MNm·s·rad 1 and sea conditions of a significant wave height of 1.75 m and an energy period of 7 s (about 0.86 times the peak period). The experimental results of van’t Hoff had a mean power absorption of 129 kW [34]. Yu and Jenne reported that, from ten simulations, each having unique wave elevation signal realizations, WEC-sim produced an average mean power absorption of 147 kW with the 95% confidence interval between 137 kW and 159 kW [17]. The model developed in this paper was run for fifty different realizations and produced an average mean power absorption of 147 kW with the 95% confidence interval between 128 kW and 166 kW. Although the confidence interval is wider for this model, the mean result matches the numerical simulation results in [17] and is within 12% of the experimental result obtained by van’t Hoff.

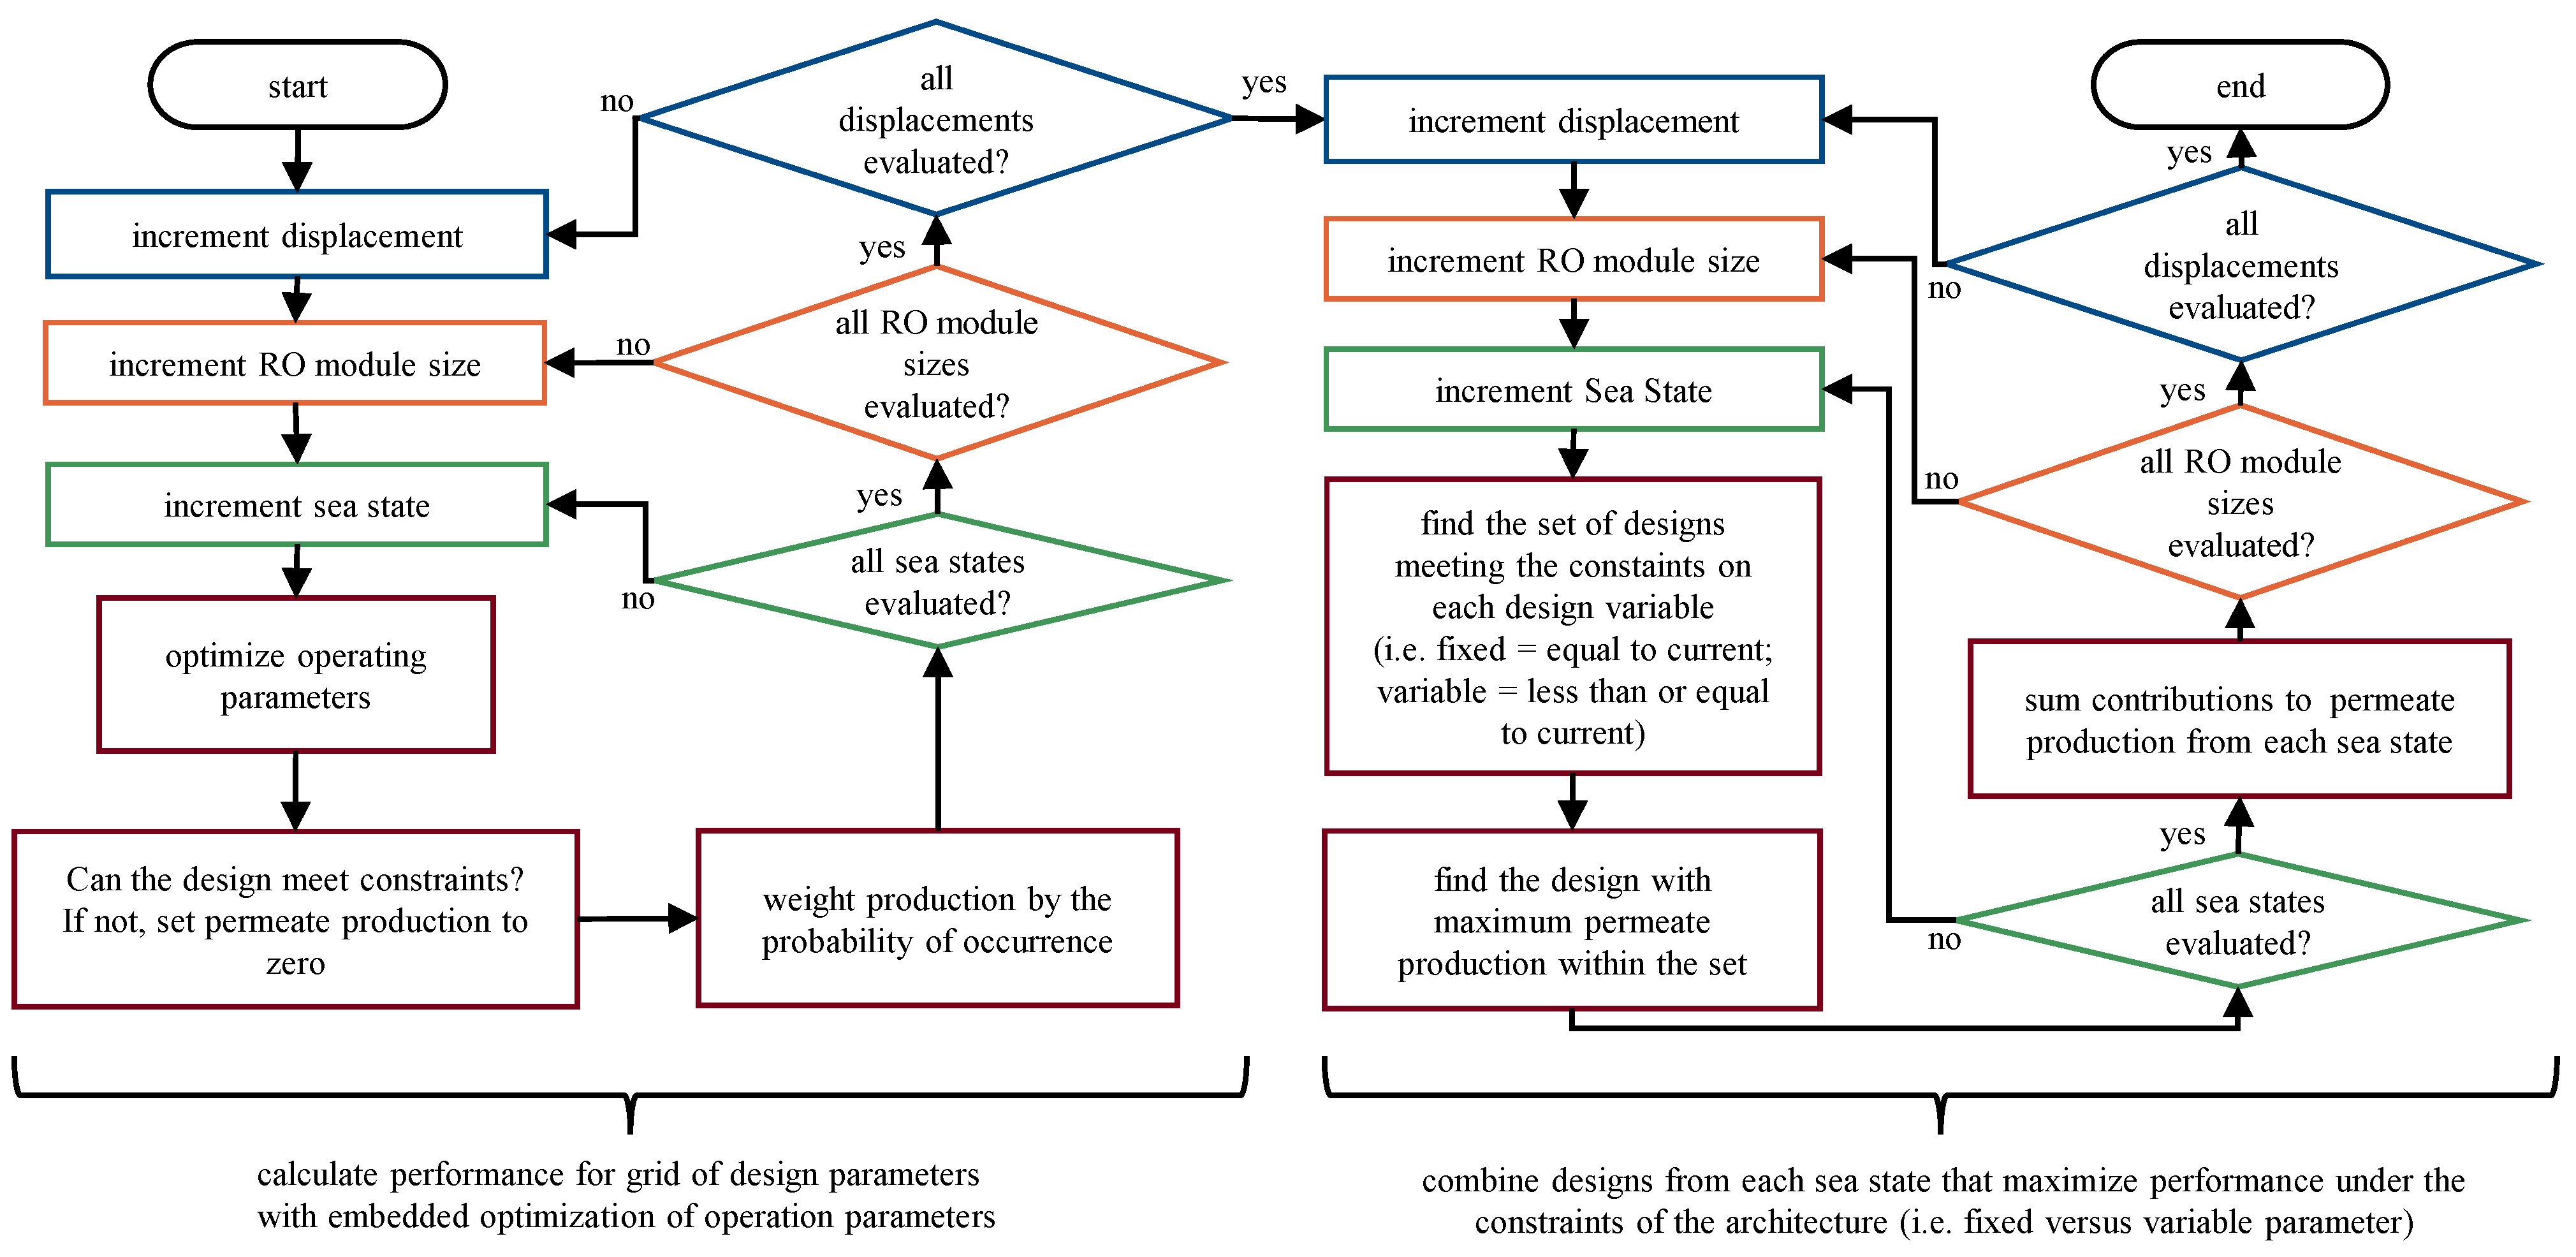
4.3. Design Study Methods

A design problem is proposed, which includes the design objectives, a set of primary design variables, a set of operational parameters that can be varied as a function of the sea condition, and constraints on the operation of the system (“Operational parameter” refers to a variable that is not fixed but can be adjusted as the plant operates, such as a control setpoint. This contrasts with “design variable” which refers to a variable that is fixed before the plant is installed and cannot be changed without changing or modifying components). The design objectives include (1) maximizing the annual average permeate production, (2) minimizing the WEC-driven pump displacement, and (3) minimizing the total installed RO membrane area. The primary design variables are (1) the maximum WEC-driven pump displacement and (2) the total installed RO membrane area. The operational parameters are optimized for each sea condition and include (where applicable) (1) the nominal operating pressure at the control pressure node, (2) the switching duty of the on/off switching valve, (3) the adjusted pump displacement, and (4) the active RO membrane area. The constraints placed on the operation of the system include (1) the upper and lower limits to the pressure at the RO feed inlet (8 MPa and 4 MPa, respectively), (2) the upper limit to the pressure at the WEC-driven pump outlet (30 MPa), and (3) a requirement that the system balances the electrical power consumption of the charge pump with electrical production by the generator in each sea condition. If these constraints are not met for a given sea condition, the system is assumed to not operate in those conditions.
The PTO architectures will be compared based on their performance in the three design objectives. These data are produced using the algorithm illustrated in Figure 11. The first stage of this design algorithm consists of optimizing the operational parameters for every combination of pump displacement and active RO membrane area in each sea condition. This optimization is a single objective optimization since the pump displacement and RO membrane area are fixed. The built-in MATLAB function fmincon, which implements the interior-point method for multivariable, nonlinear, constrained optimization problems, is used to solve for the operating parameters that maximize permeate production while satisfying the constraints specified above.
The second stage accounts for cases where the PTO architecture allows for a variable pump displacement and/or a variable RO membrane area. Each combination of pump displacement and active RO membrane area has already been evaluated in the first stage; therefore, the second stage searches these results for combinations with a higher performance and a pump displacement and/or an active RO membrane area less than or equal to the combination being evaluated.
The results of the design studies are presented in Section 5 in the following ways. First, examples will be given for the optimal operational parameters found for a selection of sea conditions. These examples include several select combinations of PTO architectures, pump displacements, and installed membrane areas. Second, results for the three design objectives are plotted for each PTO architecture in the form of contour plots with the annual average production as a function of the pump displacement and installed membrane area. Finally, comparisons between architectures are made using reference designs as points of reference. These reference designs are each specified by a single combination of pump displacement, membrane area, and permeate production. The comparison is made by evaluating the performance of each PTO architecture for the following three design cases:
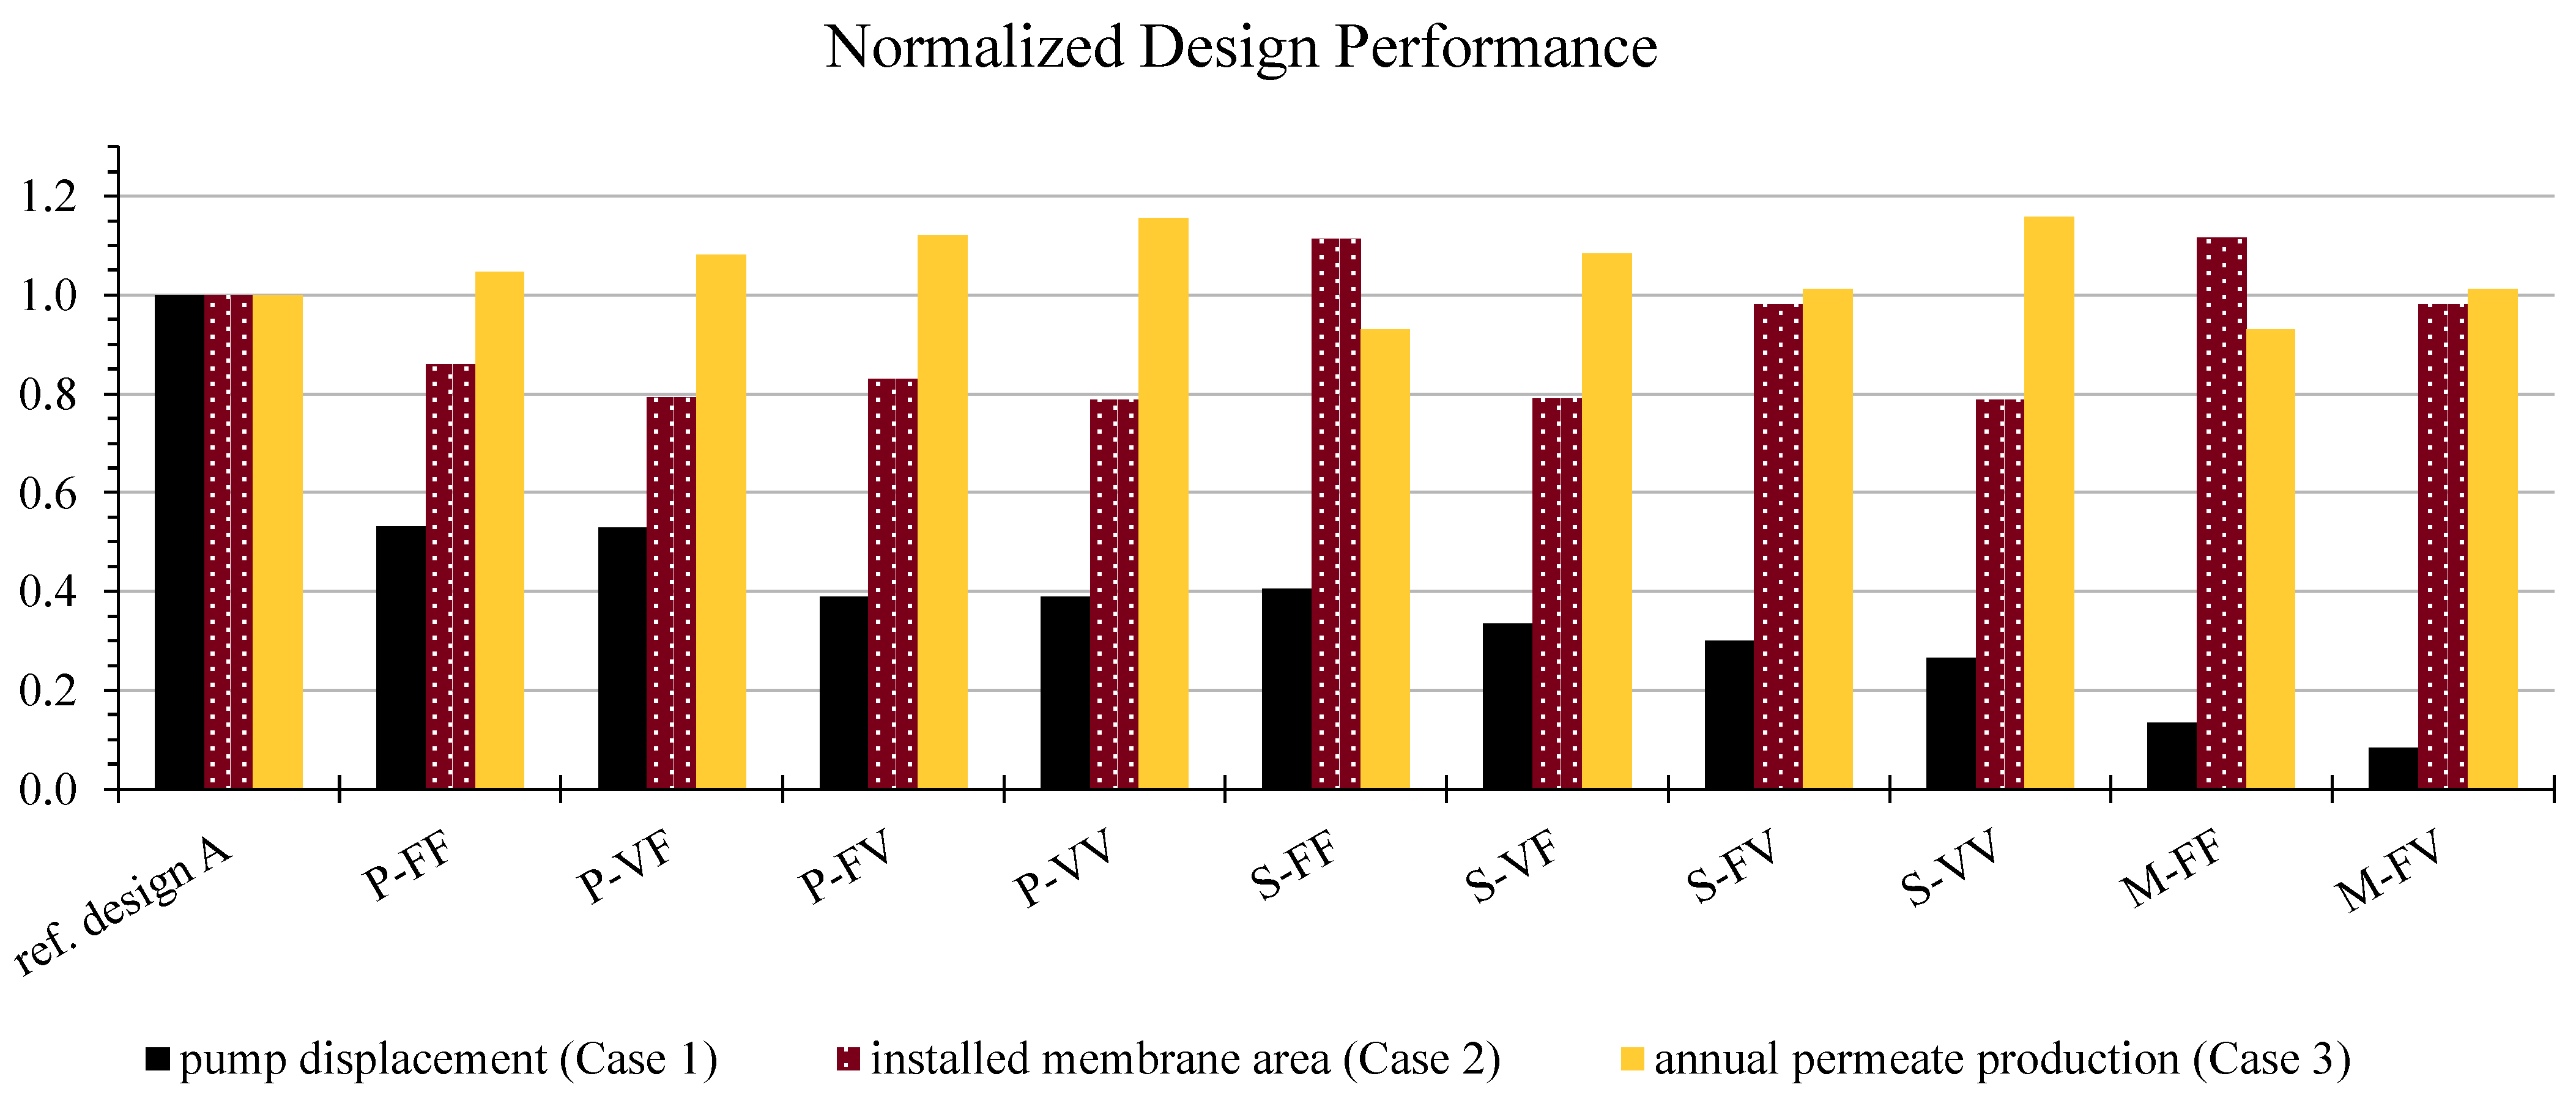
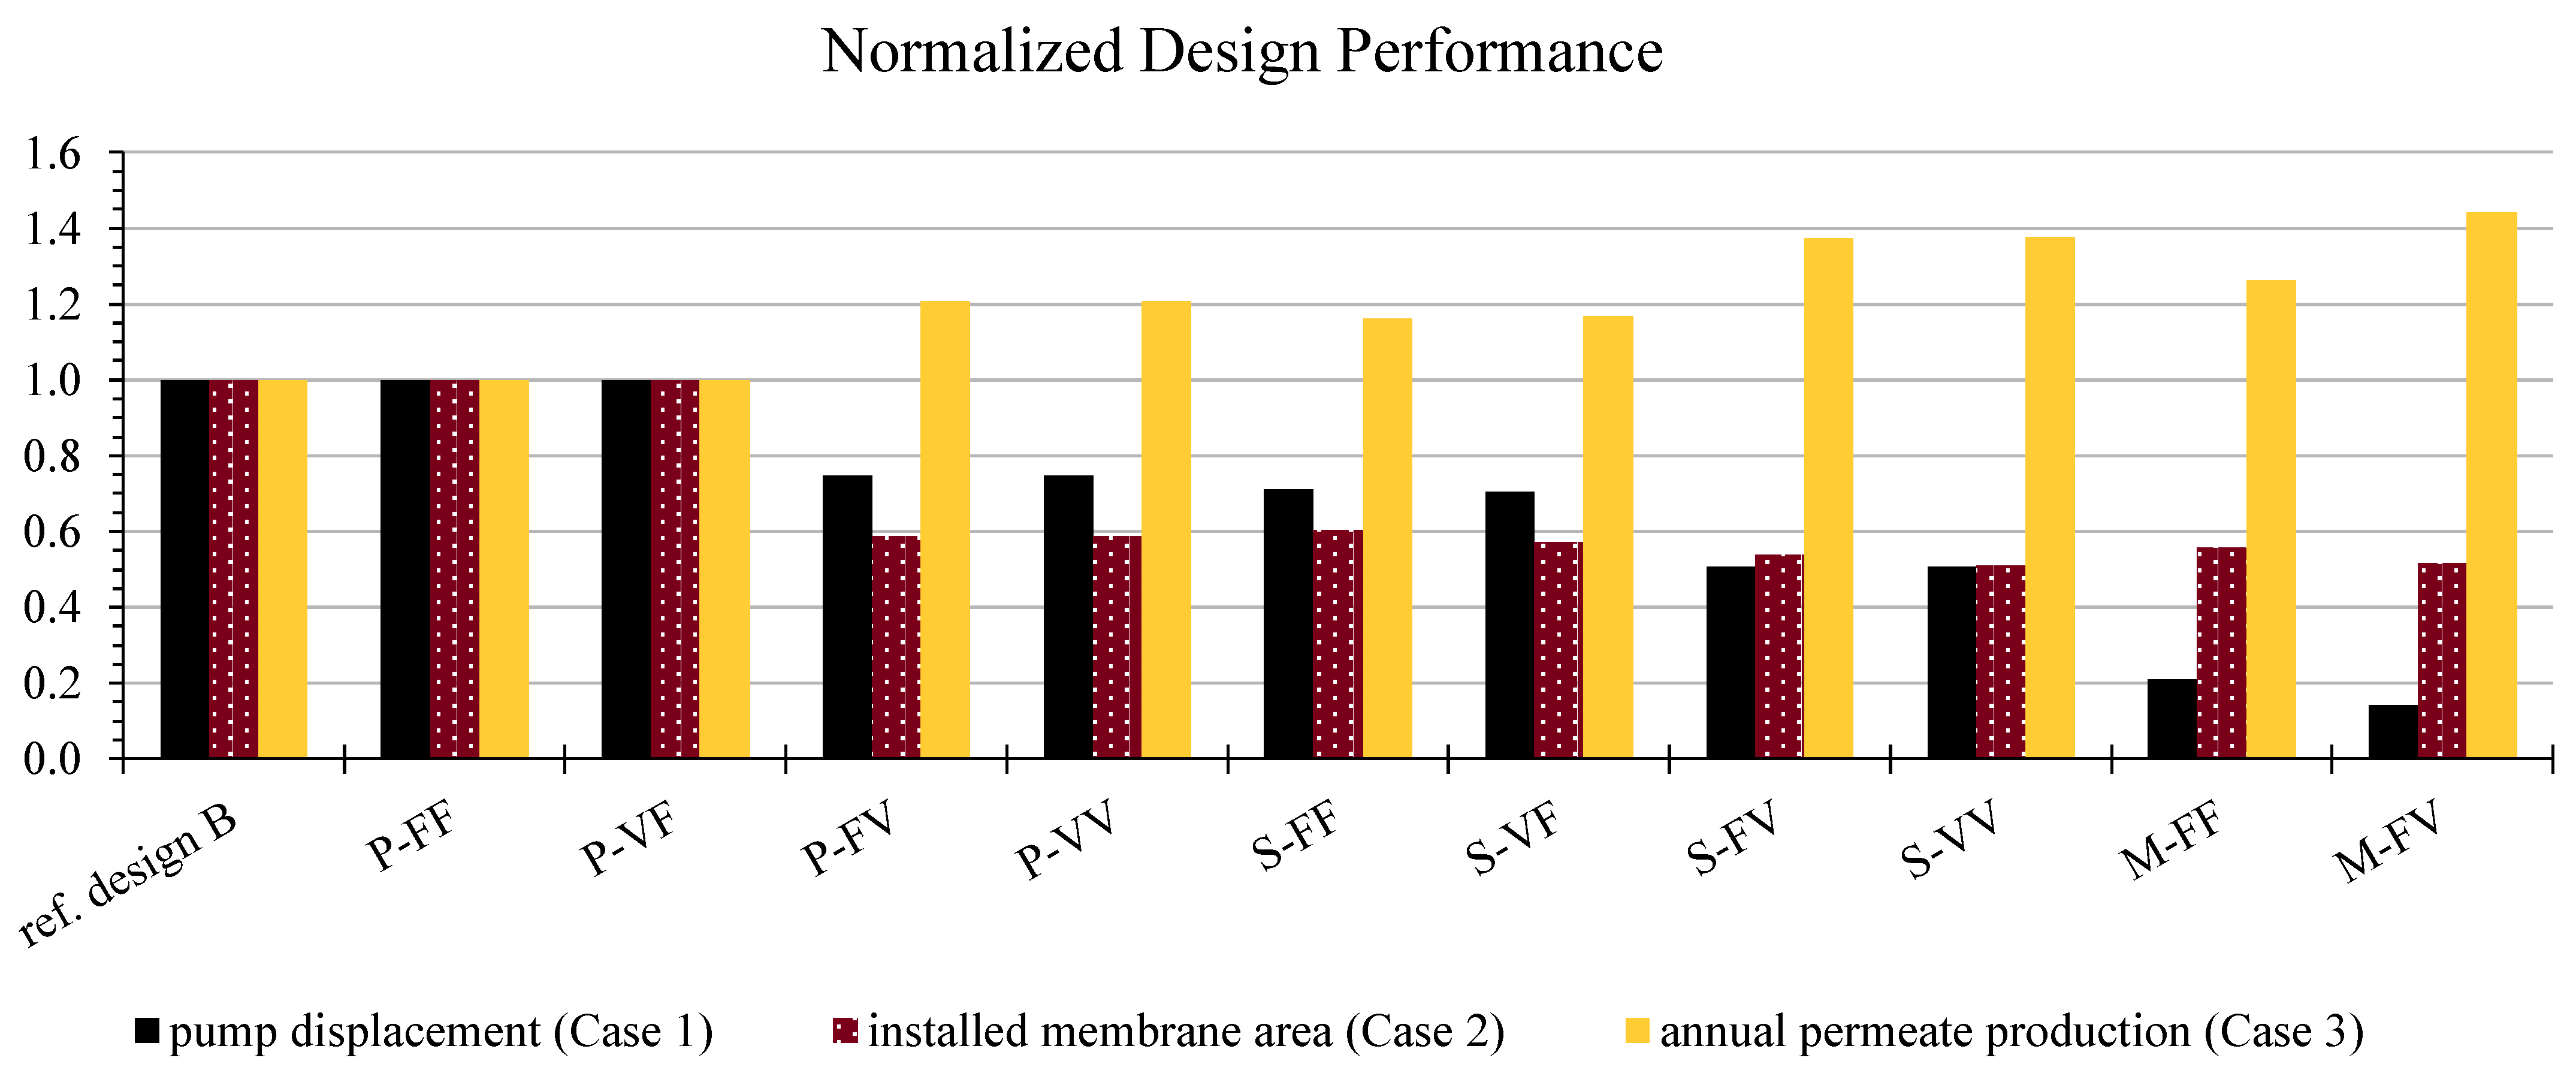
  • Case 1—Determination of the lowest pump displacement that achieves the same permeate production as the reference design, while having an installed membrane area that matches the reference design.
  • Case 2—Determination of the lowest installed membrane area that achieves the same permeate production as the reference design, while having a pump displacement that matches the reference design.
  • Case 3—Determination of the permeate production with a pump displacement and installed membrane area that match the reference design.
The reference designs used in the comparisons are based (A) on the design from [13] as evaluated in Section 3 and (B) on the baseline PTO architecture illustrated in Figure 1.

5. Results and Discussion

The following subsections present the results of the design study. Section 5.1 presents the results for the optimal operating parameters specific to selected PTO designs. Section 5.2 presents the entire collection of results for the optimal annual permeate production rate as a function of pump displacement and installed RO membrane area; together, these represent the objective space consider for this comparative study. Section 5.3 presents two comparisons of the design performance of the PTO architectures Finally, Section 5.4 presents a broad discussion about these results.
For brevity, the PTO architectures are distinguished throughout this section using three-letter abbreviations that specify the type of architecture (“P” for the parallel-type architecture, “S” for series-type architecture, and “M” for the series-type architecture with the switch-mode power transformer), whether the WEC-driven pump has a fixed or variable displacement, and whether the active membrane area is fixed or variable (“F” for fixed and “V” for variable). For example, “P-FV” specifies the parallel-type architecture with a fixed-displacement pump and a variable active membrane area.
The comparisons made of the performance of each PTO architecture use two reference designs, the specifications of which are given in Table 5. The first uses the design from [13] as a point of reference based on the analysis presented in Section 3; this is referred to as reference design A. The second comparison assumes the parallel-type PTO with a fixed pump displacement (P-FF) with the performance obtained using the design algorithm and models presented in Section 4; this is referred to as reference design B.

5.1. Optimal Operating Parameters

The results presented below are the optimal operating parameters found for several PTO designs operating in a random sample of ten sea conditions. Each table presents the sea conditions, the optimal operating parameters found for each sea condition, and the resulting permeate production rate and its weighted contribution to the yearly average production.
The three parallel-type architectures chosen as examples are the P-FF, P-VF, and P-VV architectures. The results for the selected P-FF design are presented in Table 6, the P-VF design in Table 7, and the P-VV design in Table 8. The PFF example is the results of reference design B. The P-VF and P-VV examples are selected based on the design criterion of Case 1 taking reference design B as the point of reference; that is, their installed membrane areas match but they have the smallest pump displacement required to match the annual average permeate production.
For the P-FF design, it is observed that system cannot satisfy the design constraints for operation in four out of the ten sea conditions, including the sea conditions not shown; the design fails to operate in 29 out of 114 sea conditions. As a general trend, the RO feed pressure is lower in cases where less power is available for production of permeate. In the two highest power sea conditions shown, the RO feed pressure is set to the upper limit and the excess power is converted to electricity (comparing the power consumed by the charge pump and the power generated by the generator).
The P-VF design has practically identical results to reference design B, including failure to operate in the same sea conditions, despite the added degree of freedom offered by the variable displacement of the WEC-driven pump. The only sea condition shown where the variable pump displacement is used is the in highest power condition where there is an excess of power available; no advantage is gained in terms of permeate production.
In contrast, the P-VV architecture achieves operation in all 114 sea conditions. The overall design performance is better because the annual average permeate production and installed membrane match, while the P-VV design has a pump displacement that is 25% lower. Permeate production rates for this P-VV design in Table 8 are generally lower compared to the P-FF results in Table 6, but this is made up for with the greater number of sea conditions the P-VV design can operate in. As with the P-VF design, this design makes little use of the variable pump displacement, with it only being varied in 4 of 114 sea conditions. However, the design does make use of the variable RO membrane area, with it being reduced in all but 1 of the 10 selected sea conditions and all but 11 out of the entire set of 114 sea conditions. Figure 12 shows the distribution of the specified active membrane area for all 114 sea conditions. The distribution of the variable membrane area is essentially bi-modal with median values of about 700 square meters in the lesser mode and 3200 square meters for the greater mode.
The second set of examples is for series-type architectures. The first is for the S-VV architecture, given in Table 9. The second is the M-FV architecture given in Table 10. These selected designs are also derived using the criterion of Case 1, with reference design B as the point of reference.
Like the P-VV example design, both series-type PTO examples appear to be more flexible to changing sea conditions than the baseline design. They succeed in operating in all sea conditions and make use of the variable membrane area. However, these examples make less use of the variable membrane area, with the S-VV using all the membrane area in 81 out of 114 sea conditions and the M-FV using all the membrane area in 83 out of 114 sea conditions. Similar to the P-VV example, the S-VV example only varies the pump displacement in 4 out of 114 sea conditions.
For the M-FV example, the pressure at the WEC driven pump is essentially maximized at the imposed limit of 30 MPa in all but ten sea conditions (one is shown in Table 10). The switching duty for the M-FV example is varied between 0.22 and 0.50; this is a reasonable range for switch-mode systems.

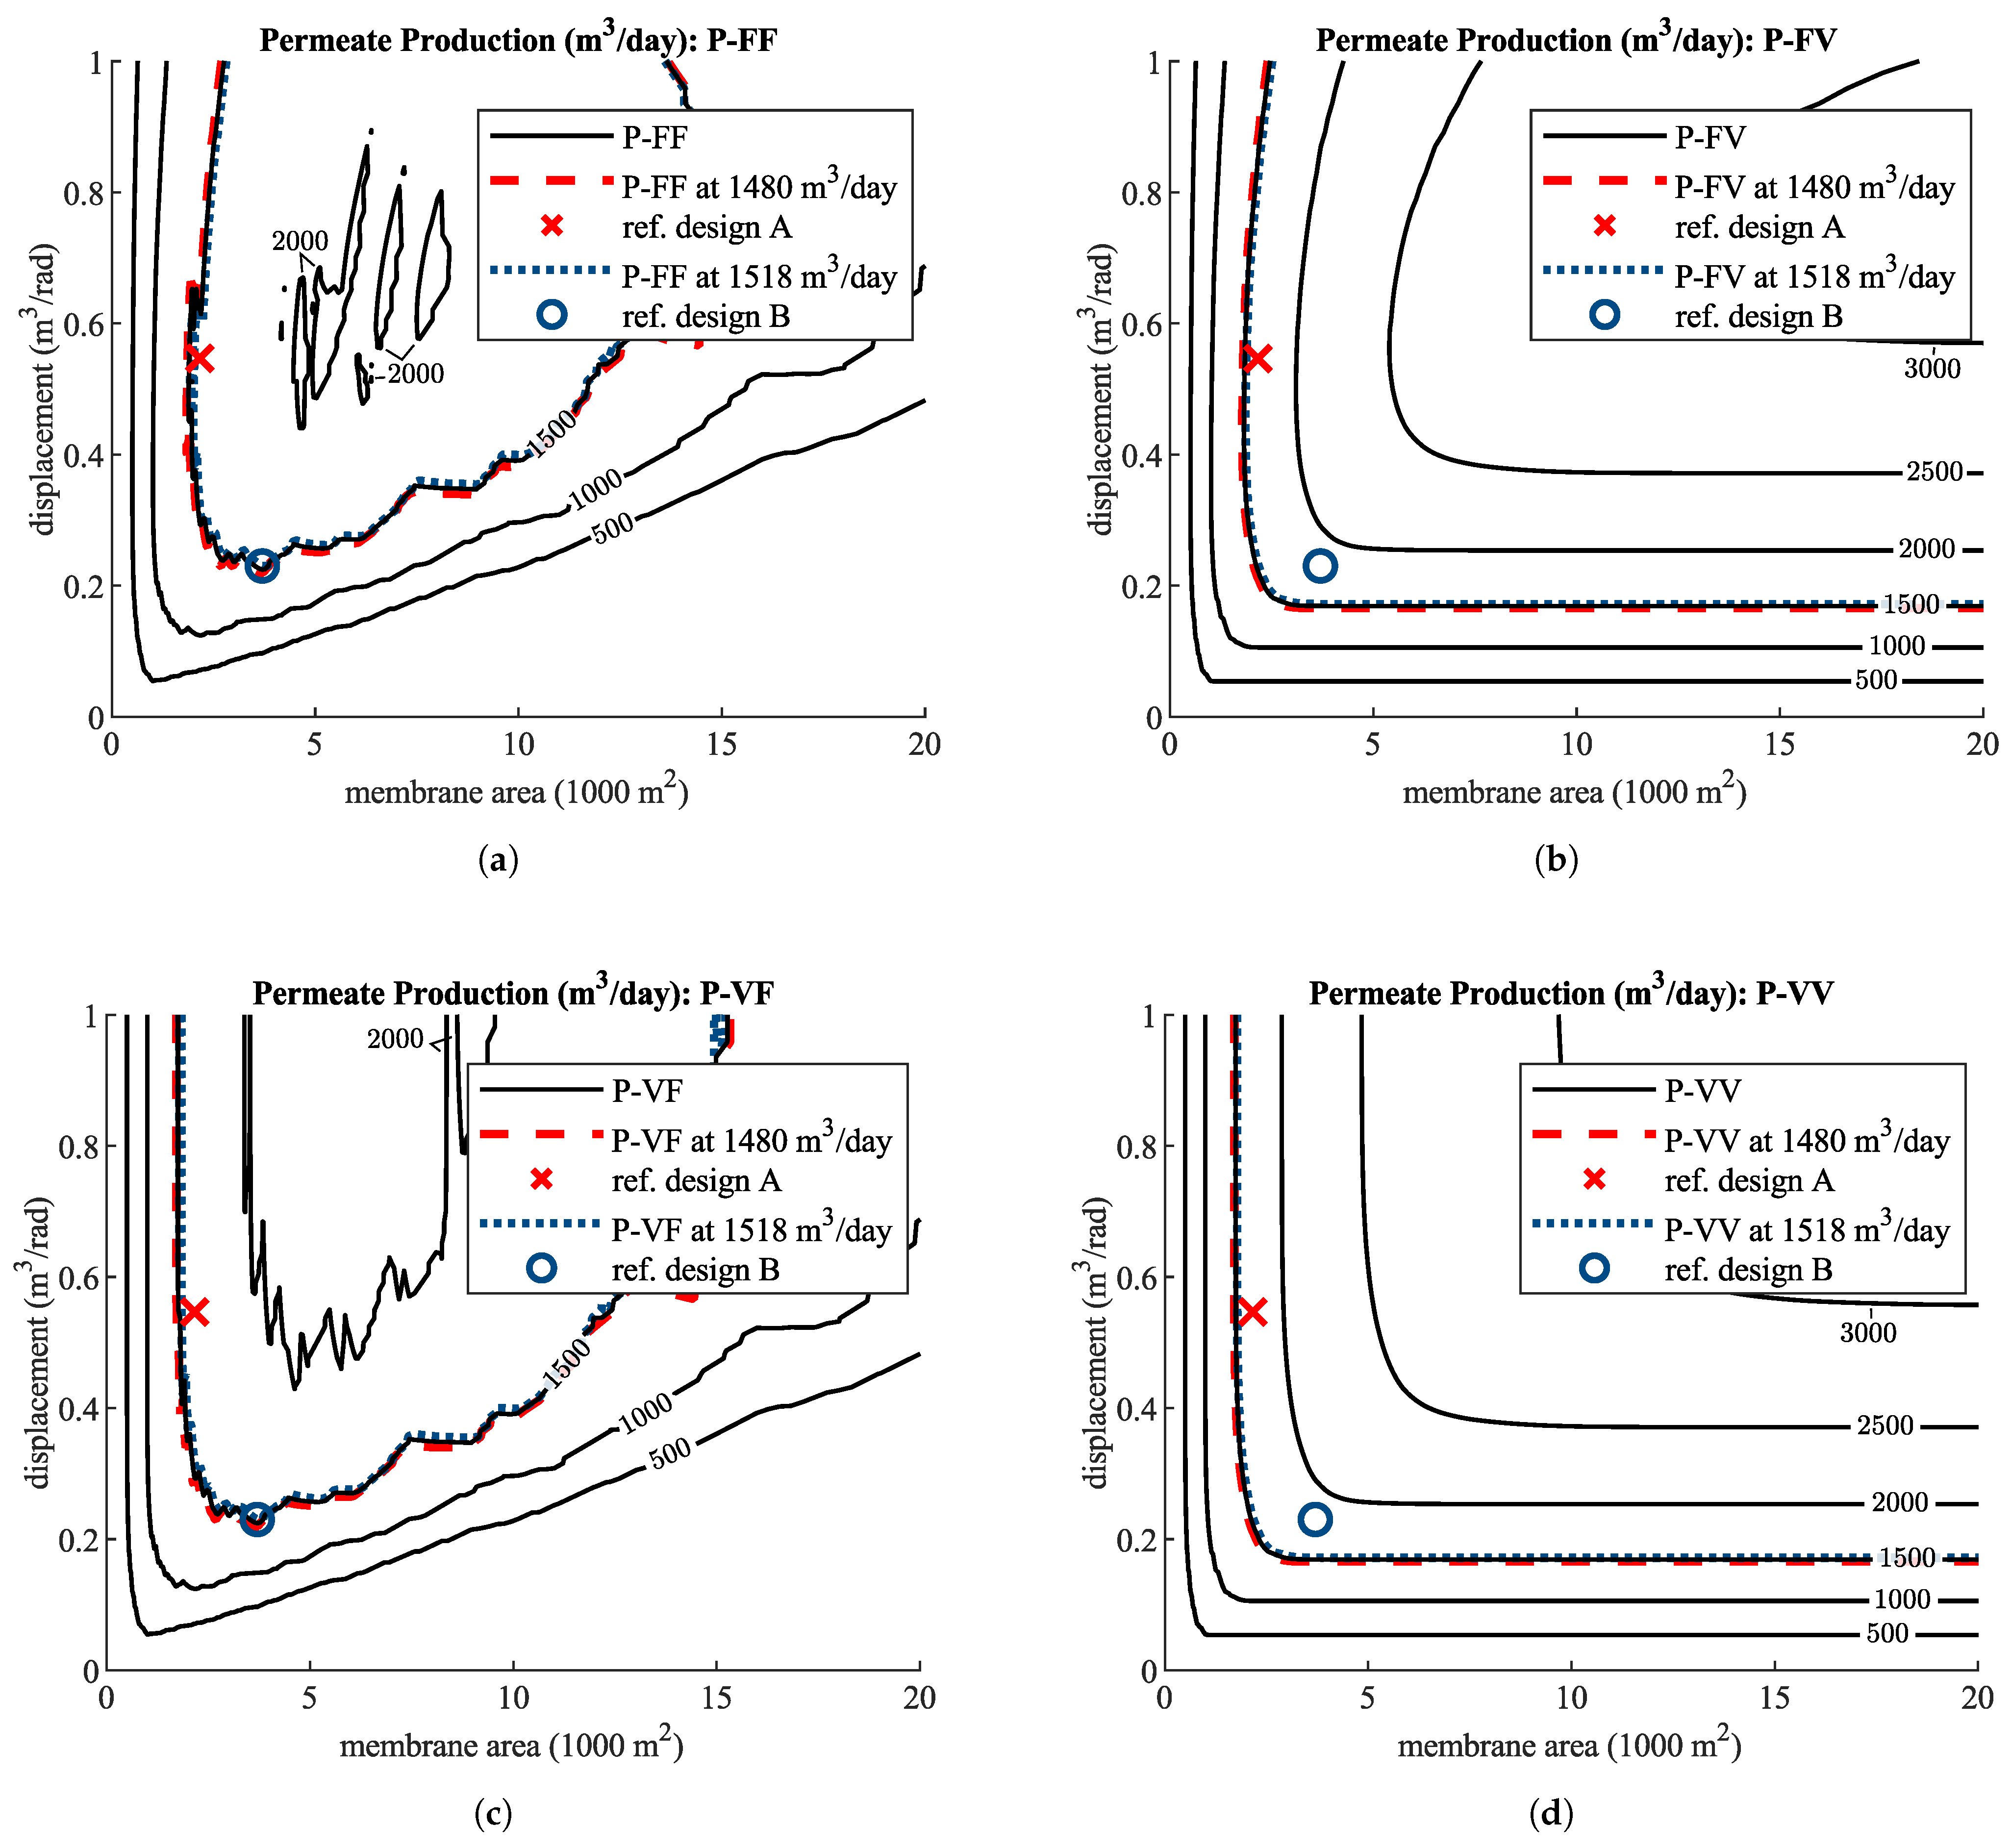
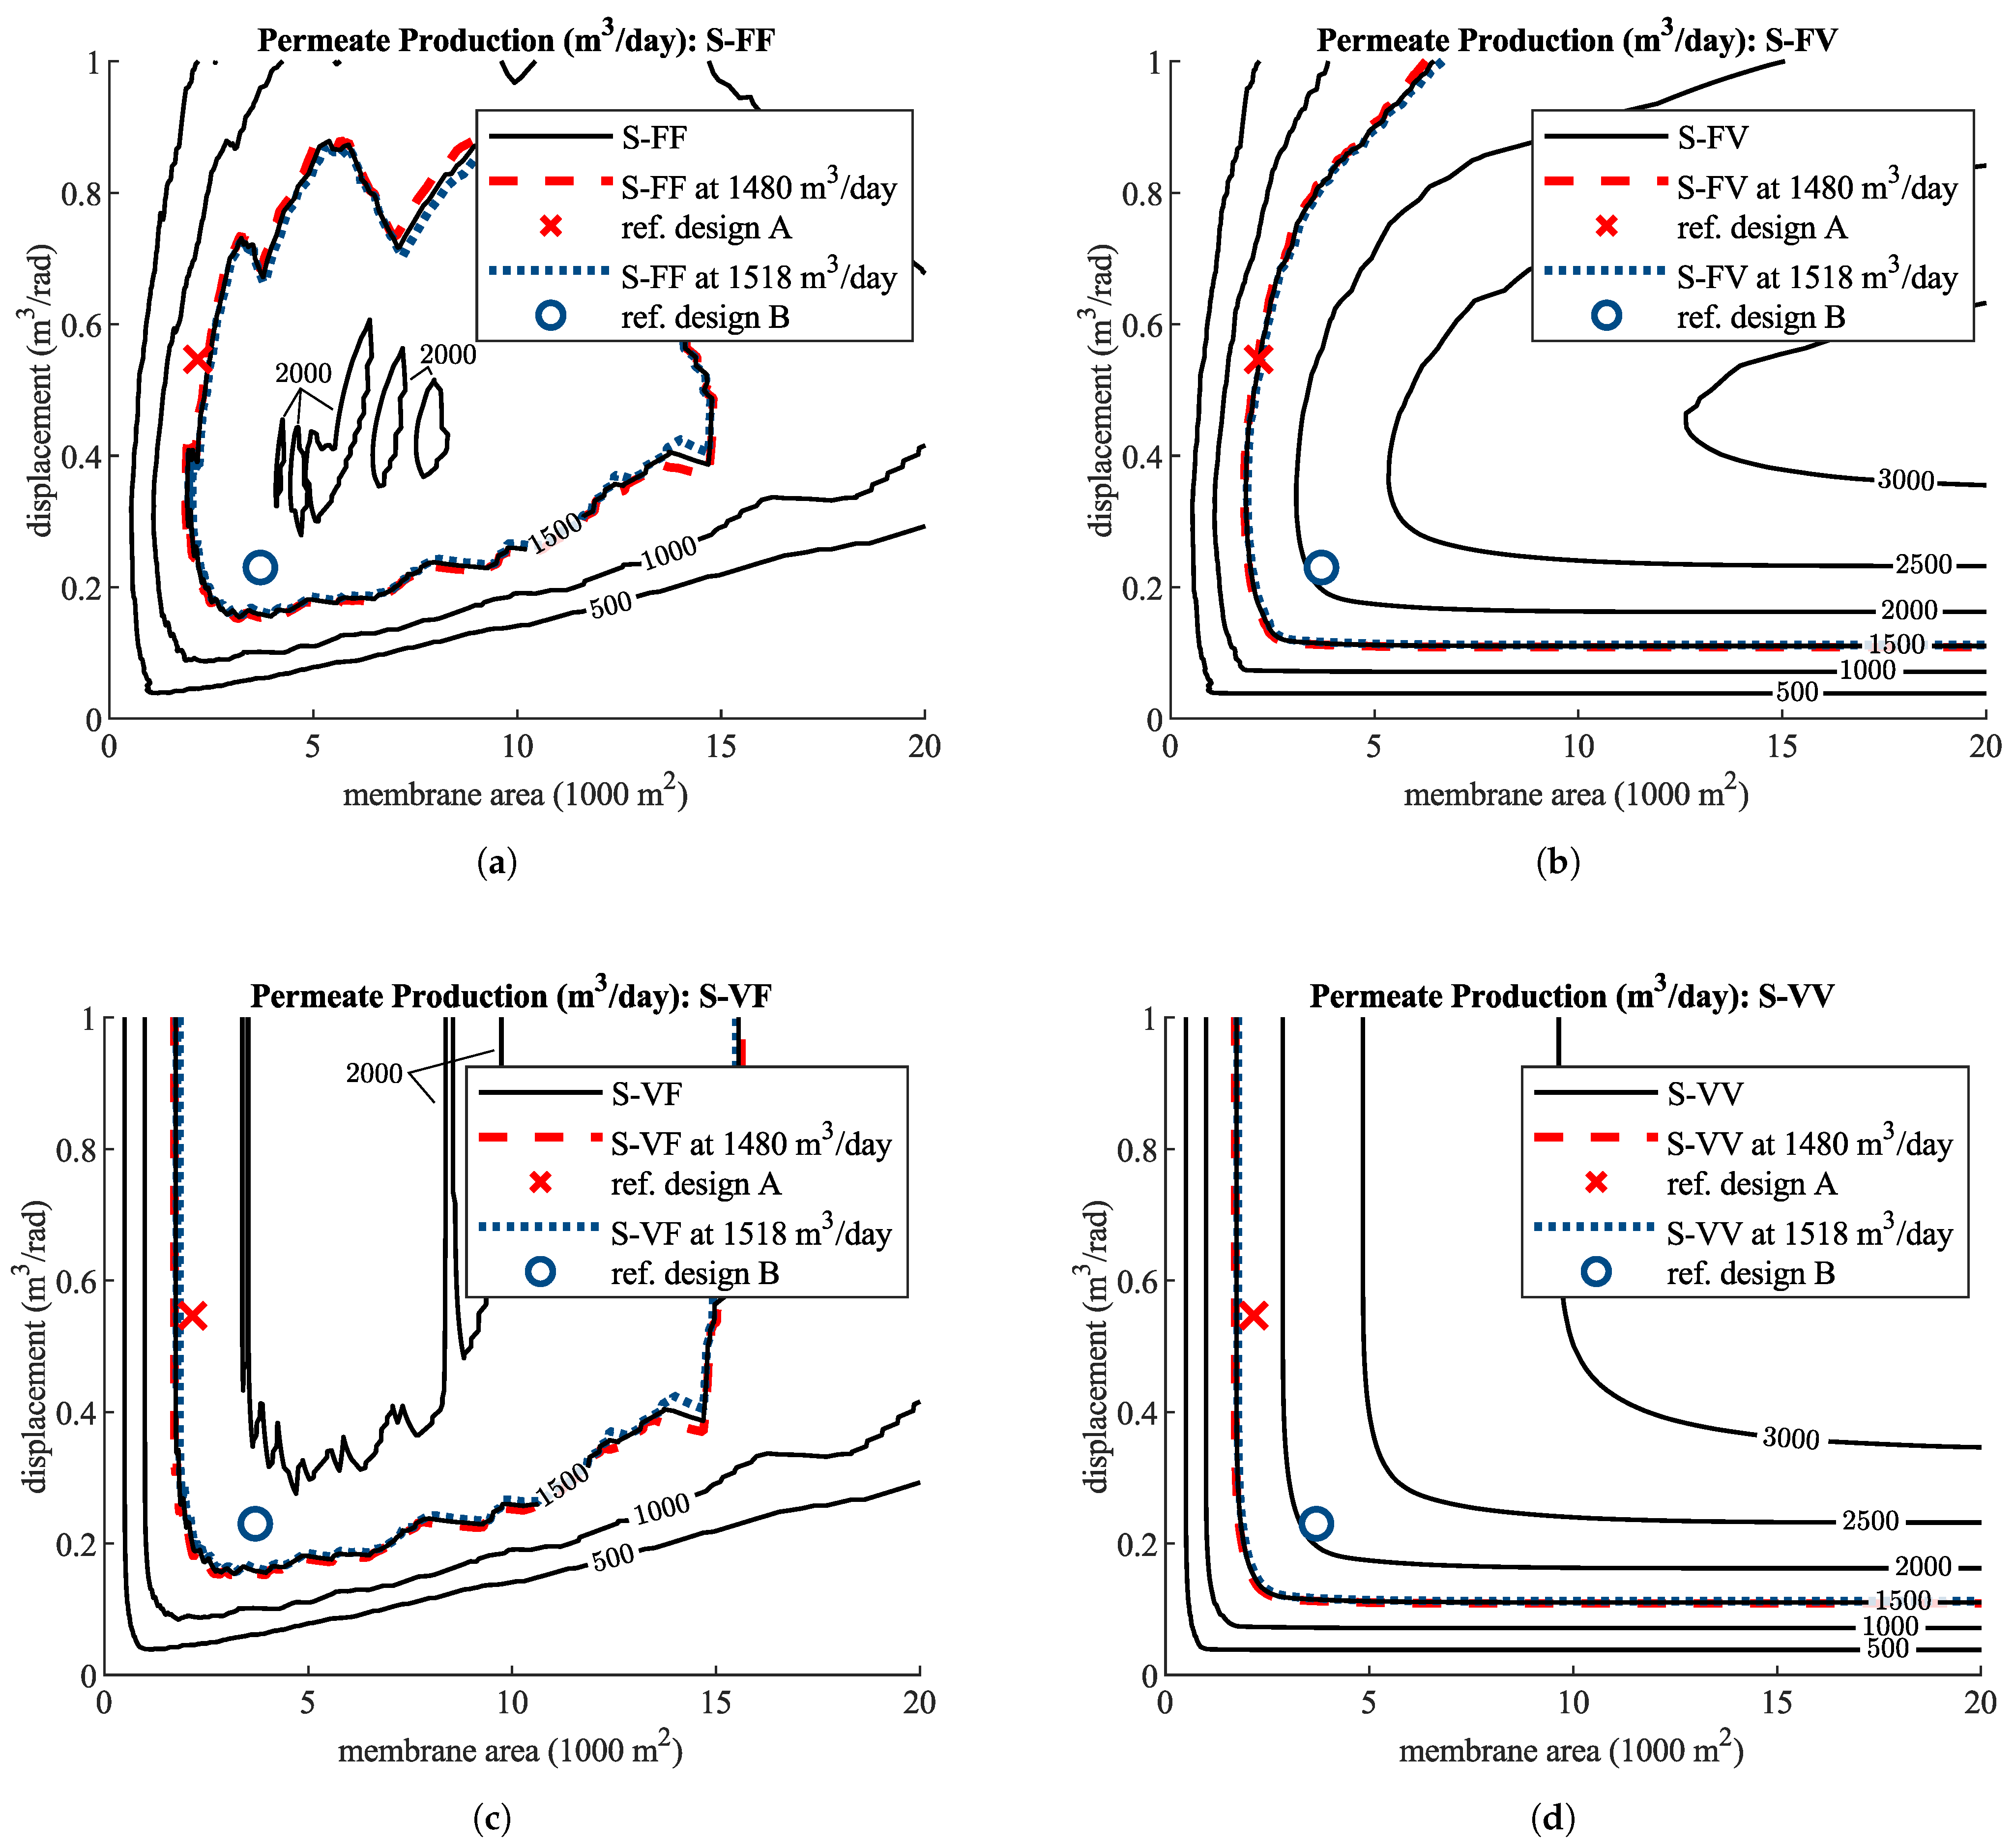
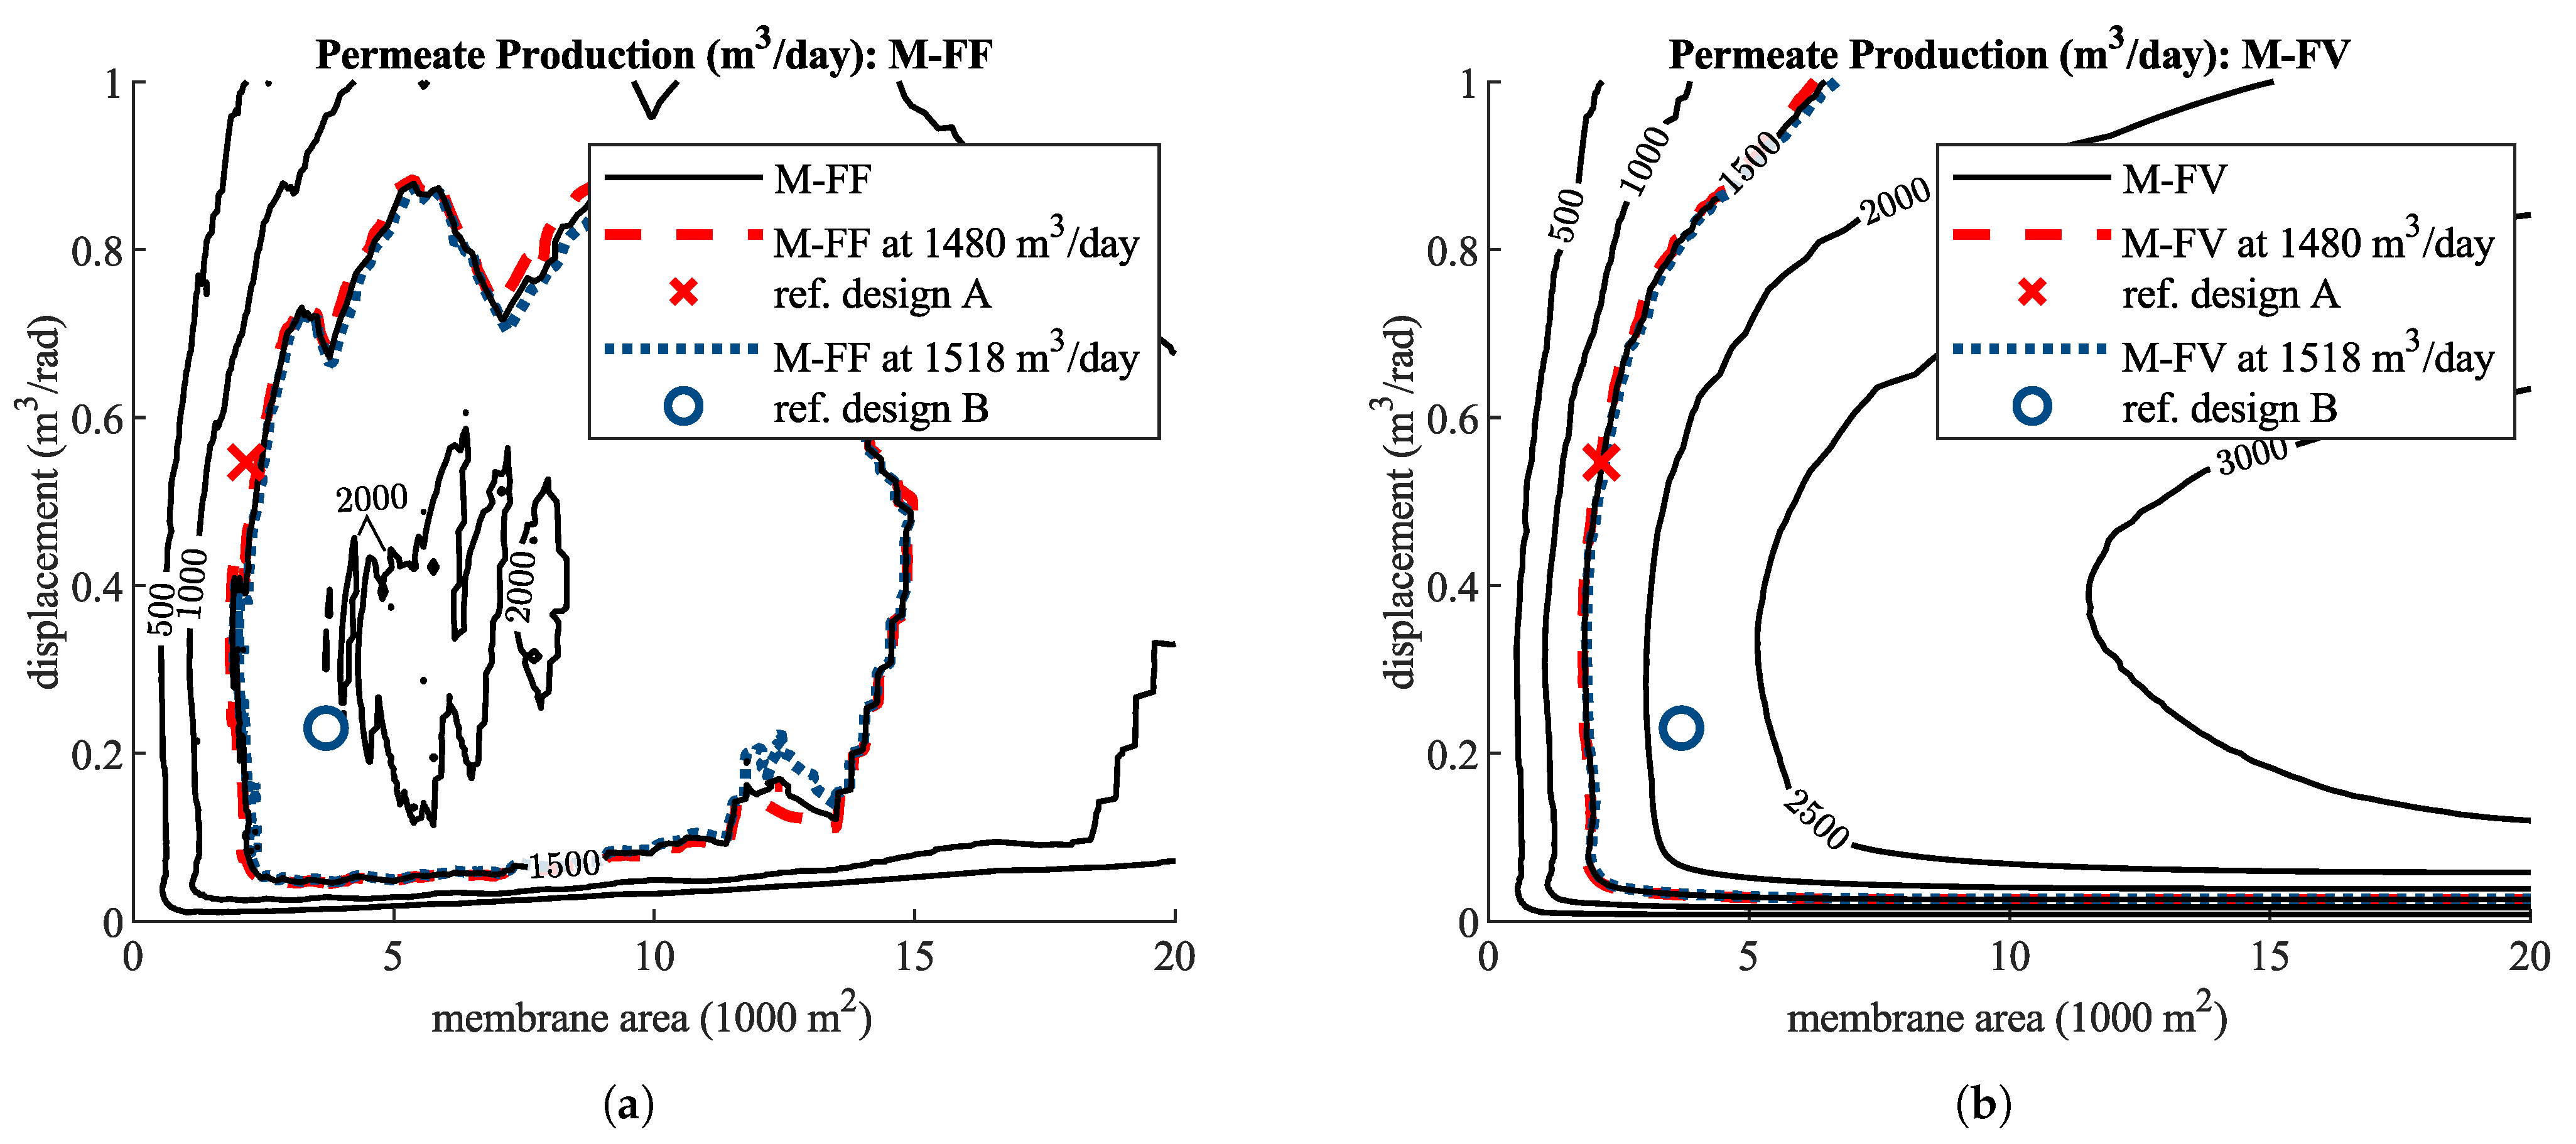
5.2. Objective Space

This subsection presents all data obtained by the design study for the performance of each architecture with respect to the three primary design objectives: maximizing permeate production, minimizing pump displacement, and minimizing the total installed membrane area. The design study produces a surface that can be presented on contour plots for the yearly average permeate production as a function of the maximum pump displacement and total installed membrane area, with each data point being based on optimal operating conditions in each sea condition.
Along with these data, contour-level curves and markers are included to provide a visual comparison to the reference designs specified in Table 5. These include contour-level curves for permeate production matching the performance of the two reference designs and markers at the pump displacement and total installed membrane area for the reference designs. A notable use for these visual aids is in determining whether a PTO architecture can surpass the design performance of the reference design. When the reference contour level for a given architecture crosses through points with a lower pump displacement and total installed membrane area than the corresponding reference marker, it is possible for that architecture to outperform the reference design with respect to all three design objectives simultaneously. In other words, choosing this architecture over the reference design would be a strong Pareto improvement to the system design (Applied to multi-objective machine design, a “Pareto improvement” is a design change that improves on at least one design objective while not degrading performance in the other objectives. A “strong Pareto improvement” is a design change that improves on all design objectives simultaneously).
Note, however, that this is not a mandatory condition for showing a strong Pareto improvement over a reference design, as is noted in Section 5.3 for the S-FF and M-FF architectures.
The data are grouped by the type of architecture (i.e., parallel-type, series-type, and series-type with a switch-mode power transformer). The parallel- and series-type groups include each combination of fixed and variable pump displacement and active membrane area. The data for the parallel-type architectures are given in Figure 13. The data for the series-type architectures are given in Figure 14. The group with the switch-mode power transformer includes the option of a fixed and variable active membrane area but only includes the option of a fixed displacement pump; results for these architectures are given in Figure 15. In all cases, the grid spacing for the pump displacement and membrane area follows a base-10 log-scale with 200 increments in both dimensions. The pump displacement is varied between 0.01 and 1.25 cubic meters per radian and the installed membrane area is varied between 1000 and 30,000 square meters; however, only the ranges of 0 to 1 and 0 to 20,000 are shown, respectively. The displayed results include linear interpolations between the values of zero and the lowest grid values in each dimension; these assume no permeate production for values of zero pump displacement and/or zero membrane area. Note that the roughness of the contour curves in these figures is a result of having a discrete set of sea conditions with the possibility of designs being able to operate in some subset of sea conditions at one point and a different subset of conditions at adjacent points.
The results for the parallel-type architectures, shown in Figure 13, suggest an advantage in having a variable active membrane area but no significant advantage in using a variable displacement pump. The contours for the for P-VF architecture follow similar paths as the P-FF architecture, and both peak between 2000 and 2500 m3/day. However, the P-FV and P-VV architectures peak between 3000 and 3500 m3/day within the range of designs displayed. The general trend between the P-FF and P-VF results is that the P-VF results are nearly identical to the P-FF results moving in the direction of increasing pump displacement until the peak values are reached and remain constant thereafter. This reflects the observations made in Section 5.1 about the P-VF example design; the pump displacement is not varied across sea conditions to any significant extent and it achieves the same production rates as the the P-FF example design. The only difference seen in Figure 13 is that the P-VF architecture can always reduce the pump disparagement when the maximum pump displacement exceeds the optimal value. The P-FV results compare to the P-FF results in a similar way, except for the fact that the P-FV results are improved over the P-FF results before and after the P-FF results peak in the direction of increasing membrane area.
The results for the series-type architectures, shown in Figure 14, show similar trends to the parallel-type architectures with respect to how fixed and variable features affect the results. The most significant difference between the series- and parallel-type architectures is that the peak of the surface is shifted to lower pump displacements. Otherwise, the same trends occur between the cases of fixed versus variable conditions for the pump displacement and active membrane area. The peaks of each surface are again between 2000 and 2500 m3/day for the architectures with fixed active RO membrane areas and between 3000 and 3500 m3/day with variable active membrane areas. An interesting observation with respect to the reference contour and marker for reference design A is that the pump displacement of reference design A is beyond the peak in the surface and in a region where increasing the pump size harms the performance of the design.
The results for the architectures with a switch-mode power transformer, shown in Figure 15, are also similar to the other types of architectures, but with peaks shifted to even lower pump displacements. Additionally, the same observations made for the series-type architectures and the pump displacement of the reference design can be made for the switch-mode architectures, in that the pump displacement used by reference design A is in a region where increasing it will harm the performance of the design.
A final observation from these data is that each architecture is shown to be a strong Pareto improvement over the reference designs. The degree to which this is true will be analyzed in the next sub-section with a direct comparisons based on the three design cases outlined in the beginning of Section 3.

5.3. Comparison to Reference Designs

The following results are two sets of comparisons made between the proposed PTO architectures. These use the two reference designs specified in Table 5 as points of reference in the three design cases specified in Section 4.3.
Figure 16 presents a comparison of the proposed architectures using the reference design A as the point of reference. The most significant results from the three design cases are the improvements in the pump displacement for Case 1. With respect to this reference, the results for pump displacement show that (1) the parallel-type architectures offer a 47% to 61% reduction in pump size, (2) the series-type architectures offer a 60% to 74% reduction in pump size, and (3) the architectures with the switch-mode power transformer offer a 87% to 92% reduction in pump size. The reduction in the total installed membrane area for design Case 2 is less significant, but the results do show potential, with the parallel-type architectures offering a 14% to 21% reduction. Of the series-type architectures, an advantage in the installed membrane area is only achieved by the series-type architectures with a variable pump displacement (about 21% reduction). The trend in the results for permeate production in Case 3 is similar to the trend for the membrane area; the parallel-type architectures offer a 5% to 16% improvement in permeate production, while only the series-type architectures with a variable pump displacement achieve an improvement in production (8% and 16%).
A strong Pareto improvement over reference design A is not demonstrated for the series-type architectures with a fixed pump displacement. However, this only highlights a drawback of this approach in comparing the architectures; inspection of Figure 12 and Figure 13 shows it is possible to simultaneously reduce the pump displacement and installed membrane area while increasing the permeate production rate over reference design A. The pump displacement of reference design A is just not a favorable point of reference for demonstrating a strong Pareto improvement using this method of projecting the point of reference in the directions of the three axes.
While a strong Pareto improvement was not found relative to reference design A, reference design B offers a favorable point of reference for demonstrating strong Pareto improvement of the series-type architectures over the baseline parallel-type architecture. The results of this comparison are presented in Figure 17. This comparison shows improvements in design performance in all cases except for the P-VF architecture which has nearly identical performance to the P-FF architecture. For Case 1, parallel-type architectures with a variable displacement pump offer a 25% reduction in pump size, while the series-type architectures offer 29% to 49% and the switch-mode architectures offer 79% to 86%. For Case 2, parallel-type architectures with a variable active membrane area offer a 41% reduction in the total installed membrane area while the series-type architectures offer a 40% to 49% reduction and the switch-mode architectures offer a 44% to 48% reduction. For Case 3, Parallel-type architectures with a variable active membrane area offer a 21% improvement in permeate production while the series-type architectures offer improvements of 16% to 38% and the switch-mode architectures offer improvements of 26% to 44%.
For assessing the significance of a variable displacement pump or a variable active membrane area, it is more appropriate to compare the results within architecture types between the fixed and variable counterparts. This analysis will focus on the comparisons made with reference design B. On the choice to include a variable pump displacement, the results show no significant effect on the design performance for any of the parallel-type architectures and only a minor effect on the installed membrane area for series-type architectures (about a 5% reduction in Case 2). On the choice to vary the active membrane area between sea conditions, there are significant improvements regardless of the architecture. For Case 1, the pump displacement is reduced by 25% to 32. For Case 2, the parallel-type architecture achieves a reduction in the installed membrane area of 41%, while the series-type and switch-mode architectures achieve less significant reductions of 11% and 7%, respectively. Finally, for Case 3, improvements in the permeate production of about 21% for the parallel-type architectures and 14% to 18% for the series-type and switch-mode architectures are noted.
The results above assumed an upper bound for the pressure at the WEC-driven pump of 30 MPa. However, the effect of this upper bound is relevant to the detailed specification of components. While 30 MPa is widely achieved by state-of-the-art oil-based hydraulic systems, a limit of 20 MPa may be a more economical choice. Repeating the study presented above for an upper bound of 20 MPa at the WEC-driven pump outlet showed no significant effect on the design performance of the series-type architecture compared to reference design B, other than 14% and 20% increases in the installed membrane area for the S-FF and S-FV architectures, respectively, for design Case 2. However, the switch-mode architecture required significant increases in the WEC-driven pump size of 45% and 47% for the M-FF and M-FV architecture, respectively. The increase in installed membrane area for the M-FF and M-FV architectures is similar to the series-type architectures, with increases of 19% and 18%, respectively.

5.4. Discussion

There are several significant findings from this design study. First, the results suggest that the benefits of a variable displacement pump are not significant despite providing a degree of freedom to the plant operation. A caveat is that this design study assumed a constant displacement, pressure, and flow throughout the plant’s operation in a given sea state. The constant reaction force on the WEC that results from this assumption is a “Coulomb damping” load strategy. Other strategies for loading the WEC, such as linear damping, could be enabled by a variable displacement pump despite pressures in the system being regulated to a constant nominal value. Those other load strategies may outperform the Coulomb damping strategy and provide some advantages by including variable displacement as a feature of the WEC-driven pump. Other work by the authors uses model-predictive control to examine this possibility and finds that moment-to-moment variation in the PTO load can provide a significant improvement in power capture over the Coulomb damping strategy [46], even for reasonable limits in the range and rate of change in PTO load.
Second, despite variable displacement not offering a significant improvement in system performance in the context of this study, the ability to vary the active membrane area did offer significant improvements. An important caveat to this finding is that this study assumed a continuously variable membrane area (at least effectively continuously variable, given the high-density log-scale grid of values considered in this study). In practice, varying the active membrane area requires shutting down entire pressure vessels that each house a series of membrane elements, and it is therefore a discrete process. Pressure vessels hold three to six membrane elements that each provide 30 to 40 m 2 of active membrane area. Varying the active membrane area in increments of 90 to 240 m 2 results in a change of 3% to 9% of the total installed area (assuming a total of 2750 m 2 ) and may limit performance gains. There are strategies for improving the resolution of these kinds of digital systems, as has been discussed for fluid power systems [47], such as including a variety in size or a greater number of discrete elements. There are also drawbacks to increasing the number of times that parts of the RO system are started up or shut down. This would add to the number of large magnitude stress cycles and would contribute to fatigue damage and wear. There is also an energy cost associated with start-up and shutdown due to, for example, the permeate needing to be rejected during this transition and membranes needing to be flushed out to equalize the osmotic potential across the membrane. However, a lower resolution of the available membrane area may be sufficient, at least in the case of the P-VV example design in Section 5.1, where the membrane area was essentially bi-modal. Implementing a lower resolution could limit the added cost, energy consumption, and number of stress cycles associated with the shut-down and start-up when changing the active membrane area.
Third, there is a significant advantage in power density offered by a series-type architecture and a switch-mode power transformer. These architectures achieve higher pressures and lower flow rates at the WEC-driven pump by decoupling the pressures at the WEC-driven pump and the RO module, and they do this without adding significant components to the system. However, conventional hydraulic systems that achieve these higher pressures use oil as the working fluid. Using seawater with its lower viscosity may offer a challenge in lubricating the WEC-driven pump and the valves that are added for the switch-mode power transformer and in sealing against the higher pressure without increased wear.
Finally, the state–state time-averaged model used in this study, with its assumptions of constant pressure and flow rate throughout the system, is a relatively low-fidelity approach to modeling the system. This is especially notable considering that the performance of the Yu and Jenne system is estimated using dynamic simulations. Time-averaged models may over-predict the system’s performance and inaccurately assess constraints on its operation. Validation of these time-averaged models will be necessary for improving confidence in the conclusions from this work. However, if the models are reasonably accurate or have a predictable bias, they offer a significant opportunity for model-based design and computationally intensive design studies and optimization, as these models can be solved several orders of magnitude faster than dynamic models simulating the system in the time domain.

6. Conclusions and Future Work

Several PTO architectures for wave-powered reverse osmosis were proposed. Variations in the architecture include the configuration of the system in a parallel-type or series-type arrangement, the addition of a switch-mode power transformer, and the ability to vary the WEC-driven pump displacement and active membrane area. These architectures were modeled under an assumption of constant pressure and flow in the system to provide a time-averaged estimate of their performance in given sea conditions. The time-averaged model of the PTO was coupled with a time-averaged characterization of the power absorbed by the WEC in given sea conditions as a function of the magnitude of a constant PTO load. A design study using this model considered the optimal performance of each architecture across a grid of values for the WEC-driven pump displacement and total installed RO membrane area. The operation of the plant was optimized in each sea condition within a large set describing the environment of Humboldt Bay, CA, giving an optimal annual average rate of permeate production. The series-type architectures and the architectures with a switch-mode power transformer offered significant improvements to the power density of the WEC-driven pump, with the switch-mode power transformer offering an order-of-magnitude improvement in power density. The series-type architecture without the switch-mode power transformer achieved improvements of 30% to 74%, while the series-type PTO with the switch-mode power transformer achieved improvements of 70% to 92%. Under the assumptions of the time-averaged model, variable displacement did not offer significant performance advantages for any of the architecture types. However, the ability to vary the active membrane area in different sea conditions from the total installed membrane area provided significant advantages in the design performance of the PTO, with improvements in the range of 7% to 41%.
Several items are suggested for future work on consideration of the results of this study. Firstly, future work regarding the development of practical implementation of series-type architectures and the variable active RO membrane area is recommended. For series-type architectures, seawater-compatible hydraulic pumps and motors capable of higher pressures (e.g., up to 20 or 30 MPa), including a higher pressure at the lower-pressure port (e.g., 4–8 MPa), are not commercially available and there may be design challenges to overcome; however, there are commercially available bi-directional motors that can handle pressures up to 16 MPa (for example, see [48]). Developing these type of pumps and motors would be necessary. Additionally, a more detailed trade-off study examining the effect of the upper pressure limit in the system on the design performance should be performed to justify design targets for the maximum pressure rating.
Implementing on/off switching of the RO membrane pressure vessels should also be examined carefully. Conventional RO systems are generally designed for continuous, steady operation and may not be durable enough to handle frequent shutdown/start-up cycles. The failure modes of conventional RO components should be examined and addressed with alternative designs where necessary. Additionally, trade-offs regarding the extent to which a wave-powered RO system varies the active membrane area should be studied to justify the design of the RO module and its switching. These studies should also consider historical data of sea condition changes over time to determine a schedule for switching, rather than only considering the frequency of sea conditions as this study did.
The second direction of future work regards the methods of design and modeling of these systems. Firstly, the accuracy of the steady-state models used in this work should be examined by comparing the results of higher-fidelity dynamic simulations. A significant amount of design work is needed for this comparison since the higher-fidelity models contain many more design parameters then these simpler steady-state models. If these steady-state models prove to be accurate enough, there is significant opportunity for including them in model-based design work flows. Secondly, because the simpler models lack many of the design parameters that a dynamic model would include, a more computationally expensive model will be needed as part of a complete model-based design work flow. Careful planning of model-based design studies is needed.
Lastly, this study considered two major component specifications for these systems. A third set of component specifications, the size of the high- and low-pressure accumulators, is likely to be just as significant in the cost of constructing these systems. Design studies should be conducted to examine their sizing, alongside changes to the PTO architecture that may reduce their required size. For example, there may be a significant difference among the PTO architectures introduced in this work regarding the accumulator volume they require.

Author Contributions

Conceptualization, J.W.S.II and J.D.V.d.V.; methodology, J.W.S.II; software, J.W.S.II; validation, J.W.S.II; formal analysis, J.W.S.II; investigation, J.W.S.II; resources, J.W.S.II; data curation, J.W.S.II and J.D.V.d.V.; writing—original draft preparation, J.W.S.II; writing—review and editing, J.W.S.II and J.D.V.d.V.; supervision, J.D.V.d.V.; project administration, J.D.V.d.V.; funding acquisition, J.W.S.II and J.D.V.d.V. All authors have read and agreed to the published version of the manuscript.

Funding

This research was supported in part by an appointment with Marine and Hydrokinetic Graduate Student Research Program sponsored by the U.S. Department of Energy (DOE), Office of Energy Efficiency and Renewable Energy, and Water Power Technologies Office. This program is administered by the Oak Ridge Institute for Science and Education (ORISE) for the DOE. ORISE is managed by ORAU under DOE contract number DESC0014664. The authors also acknowledge the support of Resolute Marine Energy, Inc. through a subcontract of DOE SBIR Phase II Grant No. DE-SC0017699. All opinions expressed in this paper are the author’s and do not necessarily reflect the policies and views of DOE, ORAU, or ORISE.

Data Availability Statement

Data are available from the authors upon request. The custom software used is available at: https://github.com/novaTehnika/2021-TimeAvePTOarchetectureStudy (accessed 21 August 2023).

Conflicts of Interest

The authors declare no conflict of interest. The funders had no role in the design of the study; in the collection, analyses, or interpretation of data; in the writing of the manuscript; or in the decision to publish the results.

Abbreviations

The following abbreviations are used in this manuscript:
MDPIMultidisciplinary Digital Publishing Institute
DOAJDirectory of open access journals
WECwave energy converter
PTOpower take-off
ROreverse osmosis
OWSCoscillating wave surge converter
CACalifornia
PRVpressure relief valve
DOEU.S. Department of Energy
ORISEOak Ridge Institute for Science and Education
ORAUOak Ridge Associated Universities
SBIRSmall Business Innovation Research program

References

  1. Davies, P. Wave-powered desalination: Resource assessment and review of technology. Desalination 2005, 186, 97–109. [Google Scholar] [CrossRef]
  2. Folley, M.; Suarez, B.P.; Whittaker, T. An autonomous wave-powered desalination system. Desalination 2008, 220, 412–421. [Google Scholar] [CrossRef]
  3. Resolute Marine Energy. Available online: http://www.resolutemarine.com/ (accessed on 15 April 2019).
  4. Mi, J.; Wu, X.; Capper, J.; Li, X.; Shalaby, A.; Chung, U.; Datla, R.; Hajj, M.; Zuo, L. Ocean Wave Powered Reverse Osmosis Desalination: Design, Modeling and Test Validation. IFAC-PapersOnLine 2022, 55, 782–787. [Google Scholar] [CrossRef]
  5. Mi, J.; Wu, X.; Capper, J.; Li, X.; Shalaby, A.; Wang, R.; Lin, S.; Hajj, M.; Zuo, L. Experimental investigation of a reverse osmosis desalination system directly powered by wave energy. Appl. Energy 2023, 343, 121194. [Google Scholar] [CrossRef]
  6. Schallenberg-Rodríguez, J.; Del Rio-Gamero, B.; Melian-Martel, N.; Alecio, T.L.; Herrera, J.G. Energy supply of a large size desalination plant using wave energy. Practical case: North of Gran Canaria. Appl. Energy 2020, 278, 115681. [Google Scholar] [CrossRef]
  7. Hwang, J.; Kiung, Y. Wave energy converters (WEC) for desalination applications. A potential application in Mediterranean Sea. In Proceedings of the OCEANS 2017-Anchorage, Anchorage, AK, USA, 18–21 September 2017; pp. 1–6. [Google Scholar]
  8. Franzitta, V.; Curto, D.; Milone, D.; Viola, A. The desalination process driven by wave energy: A challenge for the future. Energies 2016, 9, 1032. [Google Scholar] [CrossRef]
  9. Cabrera, P.; Folley, M.; Carta, J.A. Design and performance simulation comparison of a wave energy-powered and wind-powered modular desalination system. Desalination 2021, 514, 115173. [Google Scholar] [CrossRef]
  10. Del Río-Gamero, B.; Alecio, T.L.; Schallenberg-Rodríguez, J. Performance indicators for coupling desalination plants with wave energy. Desalination 2022, 525, 115479. [Google Scholar] [CrossRef]
  11. Burgaç, A.; Yavuz, H. Renewable energy based freshwater production utilizing reverse osmosis desalination. In Energy Sources, Part A: Recovery, Utilization, and Environmental Effects; Taylor and Francis: Abingdon, UK, 2021; pp. 1–15. [Google Scholar]
  12. Brodersen, K.M.; Bywater, E.A.; Lanter, A.M.; Schennum, H.H.; Furia, K.N.; Sheth, M.K.; Kiefer, N.S.; Cafferty, B.K.; Rao, A.K.; Garcia, J.M.; et al. Direct-drive ocean wave-powered batch reverse osmosis. Desalination 2022, 523, 115393. [Google Scholar] [CrossRef]
  13. Yu, Y.H.; Jenne, D. Analysis of a wave-powered, reverse-osmosis system and its economic availability in the United States. In Proceedings of the International Conference on Offshore Mechanics and Arctic Engineering, Trondheim, Norway, 25–30 June 2017; American Society of Mechanical Engineers: New York, NY, USA, 2017; Volume 57786, p. V010T09A032. [Google Scholar]
  14. Dupont. Filmtec Reverse Osmosis Membranes Technical Manual; Dupont Water Solutions: Edina, MN, USA, 2023; Form No. 45-D01504-en, Rev. 16. [Google Scholar]
  15. Hicks, D.C.; Mitcheson, G.R.; Pleass, C.M.; Salevan, J.F. Delbouy: Ocean wave-powered seawater reverse osmosis desalination systems. Desalination 1989, 73, 81–94. [Google Scholar] [CrossRef]
  16. Leijon, J.; Boström, C. Freshwater production from the motion of ocean waves—A review. Desalination 2018, 435, 161–171. [Google Scholar] [CrossRef]
  17. Yu, Y.H.; Jenne, D. Numerical modeling and dynamic analysis of a wave-powered reverse-osmosis system. J. Mar. Sci. Eng. 2018, 6, 132. [Google Scholar] [CrossRef]
  18. Suchithra, R.; Das, T.K.; Rajagopalan, K.; Chaudhuri, A.; Ulm, N.; Prabu, M.; Samad, A.; Cross, P. Numerical modelling and design of a small-scale wave-powered desalination system. Ocean. Eng. 2022, 256, 111419. [Google Scholar] [CrossRef]
  19. CETO 5—Perth (WA). Available online: https://www.carnegiece.com/portfolio/ceto-5-perth-wa/ (accessed on 22 December 2022).
  20. Henderson, R. Design, simulation, and testing of a novel hydraulic power take-off system for the Pelamis wave energy converter. Renew. Energy 2006, 31, 271–283. [Google Scholar] [CrossRef]
  21. O’Boyle, L.; Doherty, K.; van’t Hoff, J.; Skelton, J. The value of full scale prototype data-testing oyster 800 at emec, orkney. In Proceedings of the 11th European Wave and Tidal Energy Conference (EWTEC), Nantes, France, 6–11 September 2015. [Google Scholar]
  22. Cargo, C.; Hillis, A.; Plummer, A. Optimisation and control of a hydraulic power take-off unit for a wave energy converter in irregular waves. Proc. Inst. Mech. Eng. Part J. Power Energy 2014, 228, 462–479. [Google Scholar] [CrossRef]
  23. Hansen, R.H.; Kramer, M.M.; Vidal, E. Discrete displacement hydraulic power take-off system for the wavestar wave energy converter. Energies 2013, 6, 4001–4044. [Google Scholar] [CrossRef]
  24. Penalba, M.; Ringwood, J.V. A review of wave-to-wire models for wave energy converters. Energies 2016, 9, 506. [Google Scholar] [CrossRef]
  25. Plummer, A.; Schlotter, M. Investigating the performance of a hydraulic power take-off. In Proceedings of the Eight European Wave and Tidal Energy Conference, Uppsala, Sweden, 7–11 September 2009; pp. 729–735. [Google Scholar]
  26. Thomson, A.R.; Morris, R. Desalination System and Method. U.S. Patent Application 12/781,456, 13 January 2011. [Google Scholar]
  27. Stover, R.L. Seawater reverse osmosis with isobaric energy recovery devices. Desalination 2007, 203, 168–175. [Google Scholar] [CrossRef]
  28. Danfoss. Energy Recovery Devices for Small to Medium SWRO Applications. Available online: https://www.danfoss.com/en/products/hpp/energy-recovery-devices/energy-recovery-device-for-small-to-medium-swro-applications/#tab-overview (accessed on 16 October 2023).
  29. Thomson, M.; Miranda, M.S.; Infield, D. A small-scale seawater reverse-osmosis system with excellent energy efficiency over a wide operating range. Desalination 2002, 153, 229–236. [Google Scholar] [CrossRef]
  30. Paulsen, K.; Hensel, F. Introduction of a new Energy Recovery System—Optimized for the combination with renewable energy. Desalination 2005, 184, 211–215. [Google Scholar] [CrossRef]
  31. Folley, M.; Whittaker, T. The cost of water from an autonomous wave-powered desalination plant. Renew. Energy 2009, 34, 75–81. [Google Scholar] [CrossRef]
  32. Ylänen, M.M.; Lampinen, M.J. Determining optimal operating pressure for AaltoRO—A novel wave powered desalination system. Renew. Energy 2014, 69, 386–392. [Google Scholar] [CrossRef]
  33. Oyster 1. Available online: http://www.aquamarinepower.com/technologies/oyster-1/ (accessed on 29 November 2010).
  34. Van’t Hoff, J. Hydrodynamic Modelling of the Oscillating Wave Surge Converter. Ph.D. Thesis, Queen’s University Belfast, Belfast, UK, 2009. [Google Scholar]
  35. Dallman, A.R.; Neary, V.S. Characterization of US Wave Energy Converter (WEC) Test Sites: A Catalogue of Met-Ocean Data; Technical Report; Sandia National Lab (SNL-NM): Albuquerque, NM, USA, 2014. [Google Scholar]
  36. Falnes, J.; Kurniawan, A. Ocean Waves and Oscillating Systems: Linear Interactions Including Wave-Energy Extraction; Cambridge University Press: Cambridge, UK, 2020; Volume 8. [Google Scholar]
  37. Folley, M.; Whittaker, T.; Van’t Hoff, J. The design of small seabed-mounted bottom-hinged wave energy converters. In Proceedings of the 7th European Wave and Tidal Energy Conference, Porto, Portugal, 11–13 September 2007; Volume 455, p. 312. [Google Scholar]
  38. Fulbright, N.J.; Boyce-Erickson, G.C.; Chase, T.R.; Li, P.Y.; Van de Ven, J.D. Automated design and analysis of a variable displacement linkage motor. In Fluid Power Systems Technology, Proceedings of the ASME/BATH 2019 Symposium on Fluid Power and Motion Control, Longboat Key, FL, USA, 7–9 October 2019; American Society of Mechanical Engineers: New York, NY, USA, 2019; Volume 59339, p. V001T01A036. [Google Scholar]
  39. Larson, J.; Pozo-Palacios, J.; Boyce-Erickson, G.; Fulbright, N.; Dai, J.; Voth, J.; Gajghate, N.; Saikia, J.; Michael, P.; Chase, T.; et al. Experimental validation of subsystem models for a novel variable displacement hydraulic motor. In Proceedings of the Fluid Power Systems Technology, Virtual, 19–21 October 2021; American Society of Mechanical Engineers: New York, NY, USA, 2021; Volume 85239, p. V001T01A014. [Google Scholar]
  40. Simmons, J.W.; Van de Ven, J.D. Switch-mode power transformer in a wave-powered, reverse osmosis desalination plant. In Fluid Power Systems Technology, Proceedings of the ASME/BATH 2019 Symposium on Fluid Power and Motion Control, Longboat Key, FL, USA, 7–9 October 2019; American Society of Mechanical Engineers: New York, NY, USA, 2019; Volume 59339, p. V001T01A020. [Google Scholar]
  41. WAVE Water Treatment Design Software. Available online: https://www.dupont.com/water/resources/design-software.html (accessed on 21 August 2023).
  42. Cummins, W. The Impulse Response Function and Ship Motions; Technical Report; David Taylor Model Basin: Washington, DC, USA, 1962. [Google Scholar]
  43. Perez, T.; Fossen, T.I. A Matlab Toolbox for Parametric Identification of Radiation-Force Models of Ships and Offshore Structures. Model. Identif. Control 2009, 30, 1–15. [Google Scholar] [CrossRef]
  44. Babarit, A.; Delhommeau, G. Theoretical and numerical aspects of the open source BEM solver NEMOH. In Proceedings of the 11th European Wave and Tidal Energy Conference (EWTEC2015), Nantes, France, 6–11 September 2015. [Google Scholar]
  45. Ruehl, K.; Michelen, C.; Kanner, S.; Lawson, M.; Yu, Y.H. Preliminary verification and validation of WEC-Sim, an open-source wave energy converter design tool. In International Conference on Offshore Mechanics and Arctic Engineering, Proceedings of the ASME 2014 33rd International Conference on Ocean, Offshore and Arctic Engineering, San Francisco, CA, USA, 8–13 June 2014; American Society of Mechanical Engineers: New York, NY, USA, 2014; Volume 45547, p. V09BT09A040. [Google Scholar]
  46. Simmons, J.W.; Van de Ven, J.D. Limits on the Range and Rate of Change in Power Take-Off Load in Ocean Wave Energy Conversion: A Study Using Model Predictive Control. Energies 2023, 16, 5909. [Google Scholar] [CrossRef]
  47. Linjama, M. Digital fluid power: State of the art. In Proceedings of the Proceedings of The Twelfth Scandinavian International Conference on Fluid Power, Tampere, Finland, 18–20 May 2011. [Google Scholar]
  48. The Water Hydraulics Company. Motors. Available online: https://www.waterhydraulics.co.uk/motors/ (accessed on 16 October 2023).
Figure 1. A wave-powered reverse osmosis desalination plant with co-production of electric power, an intake charge pump and filter, and energy recovery.
Energies 16 07381 g001
Figure 2. Joint probability of occurrence (percent) for sea conditions within bins centered at given values for significant wave height (0.5 m bins) and peak period (1.6 s bins) (data from [13]). The transparency of the fill color follows the magnitude of values as a visual aid.
Energies 16 07381 g002
Figure 3. An illustration of the relationships between the pressure differential across the WEC-driven pump and the average power absorbed by a WEC and the RO feed pressure and power consumed in RO process. Power absorption by the WEC is plotted for two sea states (SS1 and SS2) and two values of the WEC-driven pump displacement. The power consumed by the RO process is plotted for two values of the total active membrane area.
Energies 16 07381 g003
Figure 4. A parallel-type PTO architecture with a variable displacement WEC-driven pump.
Energies 16 07381 g004
Figure 5. A parallel-type switch-mode PTO architecture.
Energies 16 07381 g005
Figure 6. A series-type PTO architecture with a variable displacement WEC-driven pump.
Energies 16 07381 g006
Figure 7. A series-type PTO architecture with a switch-mode power transformer.
Energies 16 07381 g007
Figure 8. An illustration of the WEC-driven slider–crank pump mechanism from [13].
Energies 16 07381 g008
Figure 9. Simulation results for permeate flow rate (top) and RO feed pressure (bottom) with and without a pressure relief valve (PRV) for the sea conditions of a 2.25 m significant wave height and an 8.7 s peak period.
Energies 16 07381 g009
Figure 10. Average permeate production (cubic meters per day) by sea condition: Yu and Jenne design [13] with pressure relief valve. Fill color follows the magnitude of values.
Energies 16 07381 g010
Figure 11. A design algorithm for optimizing the annual permeate production for a given distribution of sea conditions where the maximum WEC-driven pump displacement and installed RO membrane area in the PTO are varied across a two-dimensional grid of values.
Energies 16 07381 g011
Figure 12. Histogram of active RO membrane specified for each sea condition for the parallel-type PTO with a variable displacement and a variable active RO membrane area (P-VV) which has a 0.172 cubic meter per radian pump displacement and 3700 square meters of total installed membrane area.
Energies 16 07381 g012
Figure 13. Annual average permeate production as a function of WEC-driven pump displacement and installed RO membrane area for parallel-type PTO architectures with a WEC-driven pump with a fixed displacement (P-FF and P-FV, (a,b)) or variable displacement (P-VF and P-VV, (c,d)) and an RO module with an active membrane area that is fixed (P-FF and P-VF, (a,c)) or variable (P-FV and P-VV, (b,d)).
Energies 16 07381 g013
Figure 14. Annual average permeate production as a function of WEC-driven pump displacement and installed RO membrane area for series-type PTO architectures with a WEC-driven pump with fixed displacement (S-FF and S-FV, (a,b)) or variable displacement (S-VF and S-VV, (c,d)) and an RO module with an active membrane area that is fixed (S-FF and S-VF, (a,c)) or variable (S-FV and S-VV, (b,d)).
Energies 16 07381 g014
Figure 15. Annual average permeate production as a function of the WEC-driven pump displacement and installed RO membrane area for series-type PTO architectures with a switch-mode power transformer with an RO module with an active membrane area that is fixed (M-FF, (a)) or variable (M-FV, (b)).
Energies 16 07381 g015
Figure 16. A comparison of PTO architecture performance normalized to the Yu and Jenne design [13] with a pressure relief valve (PRV) by design case. The references design has 0.54 cubic meter per radian pump displacement, 2162 square meter total installed membrane area, and 1476 cubic meter per day yearly average permeate production.
Energies 16 07381 g016
Figure 17. A comparison of PTO architecture performance normalized to a reference, a selected parallel-type PTO design with a fixed displacement and a fixed active membrane area (P-FF) by design case. The selected design has a 0.23 cubic meter per radian pump displacement, a 3700 square meter total installed membrane area, and a 1518 cubic meter per day yearly average permeate production.
Energies 16 07381 g017
Table 1. Slider–crank parameters [13].
ParameterValueUnits
Crank length, L c 3m
Rod length, L r 5m
Offset length, L o 1.3m
Piston area, A p 0.18m 2
Table 2. Power take-off parameters.
ParameterValueUnits
Permeate flux coefficient, A p e r m 2.57 × 10 12 m 3 N 1 s 1
Osmotic pressure, p o s m 2.275MPa
Recovery ratio, Y0.25-
Charge pressure, p c 0.3MPa
WEC and WEC-driven pump efficiency, combined, η w 0.9-
Hydraulic motor/pump efficiency, η m p 0.9-
Electric generator efficiency, η g e n 0.9-
Charge pump efficiency, η c 0.7-
Electric motor efficiency, η m 0.9-
Table 3. Wave energy converter (WEC) parameters.
ParameterValueUnits
WEC designOyster 1-
WEC typeoscillating wave-
surge converter
Mass127,000kg
Moment of inertia1,850,000kg m 2
Length of flap from hinge11m
Center of mass from hinge5m
Width18m
Thickness2m
Hinge location above sea bed2m
Mean water depth10.9m
Table 4. Simulation parameters.
ParameterValueUnits
Start-up duration250s
Simulation duration (after start-up)2000s
Solverfixed-step Euler method-
Time step0.01s
Number of wave frequency components100-
Random number generator seed3-
(MATLAB function rng())
Table 5. Reference design specifications.
ParameterMax. WEC-Driven
Pump Displacement
(m3/rad)
Total Installed RO
Membrane Area
(m2)
Annual Average
Permeate Production
(m3)
Source Description
A0.5421621476Design from [13]
re-evaluated in Section 3
B0.2337001518Selected design with the P-FF
architecture
Table 6. Optimal operating parameters and performance example for a parallel-type PTO with a fixed displacement and a fixed active RO membrane area (P-FF).
Sea ConditionOperating ParametersPermeate Production
(m3/day)
Power
(kW)
Significant
Wave Height
(m)
Peak
Period
(s)
RO Feed
Pressure
(Mpa)
UnweightedWeightedCaptured by
WEC
Consumed by
Charge Pump
Produced by
Generator
0.759.9-00---
0.7512.2-00---
1.255.2-00---
1.7514.55.1228317.35208.550.350.3
2.258.7-00---
2.2519.15.425390.508242.256.056.0
3.2513.37.4422459.98514.393.193.1
3.2514.57.4419933.17509.792.692.6
4.25118.047049.88610.4103.7105.4
4.7516.88.047043.29639.5103.7126.6
Note: Results are given for a randomly selected subset of sea conditions presented in Figure 2. This example design has a 0.230 cubic meter per radian pump displacement and 3700 square meter total installed membrane area. The annual average permeate production for this design is 1518 cubic meters per day. This is reference design B.
Table 7. Optimal operating parameters and performance example for a parallel-type PTO with a variable displacement and a fixed active RO membrane area (P-VF).
Sea ConditionOperating ParametersPermeate Production
(m3/day)
Power
(kW)
Significant
Wave Height
(m)
Peak
Period
(s)
WEC-Driven
Pump Displacement
(m3/rad)
RO Feed
Pressure
(Mpa)
UnweightedWeightedCaptured by
WEC
Consumed by
Charge Pump
Produced by
Generator
0.759.9--00---
0.7512.2--00---
1.255.2--00---
1.7514.50.2305.1228317.35208.550.350.3
2.258.7--00---
2.2519.10.2305.425390.508242.256.056.0
3.2513.30.2307.4422459.98514.393.193.1
3.2514.50.2307.4419933.17509.792.692.6
4.25110.2308.047049.88610.4103.7105.4
4.7516.80.2168.047043.29608.2103.7103.8
Note: Results are given for a randomly selected subset of sea conditions presented in Figure 2. This example design has a 0.230 cubic meter per radian pump displacement and 3700 square meter total installed membrane area. The annual average permeate production for this design is 1518 cubic meters per day.
Table 8. Optimal operating parameters and performance example for a parallel-type PTO with a variable displacement and a variable active RO membrane area (P-VV).
Sea ConditionOperating ParametersPermeate Production
(m3/day)
Power
(kW)
Significant
Wave Height
(m)
Peak
Period
(s)
WEC-Driven
Pump Displacement
(m3/rad)
Active RO
Membrane Area
(m2)
RO Feed
Pressure
(Mpa)
UnweightedWeightedCaptured by
WEC
Consumed by
Charge Pump
Produced by
Generator
0.759.9-629-2484.73---
0.7512.2- -3371.79---
1.255.2-518-2860.0286---
1.7514.50.17237004.8204515.54179.245.145.1
2.258.7-888-96950.85---
2.2519.10.17235525.021720.434197.747.947.9
3.2513.30.17228867.6343848.83428.675.875.8
3.2514.50.17227387.9340526.90434.875.175.1
4.25110.17229978.037977.97489.983.783.7
4.7516.80.17230718.038782.71499.385.585.5
Note: Results are given for a randomly selected subset of sea conditions presented in Figure 2. This example design has a 0.172 cubic meter per radian pump displacement and 3700 square meter total installed membrane area. The annual average permeate production for this design is 1518 cubic meters per day.
Table 9. Optimal operating parameters and performance example for a series-type PTO with a variable displacement and a variable active RO membrane area (S-VV).
Sea ConditionOperating ParametersPermeate Production
(m3/day)
Power
(kW)
Significant
Wave Height
(m)
Peak
Period
(s)
WEC-Driven
Pump Displacement
(m3/rad)
Active RO
Membrane Area
(m2)
RO Feed
Pressure
(Mpa)
UnweightedWeightedCaptured by
WEC
Consumed by
Charge Pump
Produced by
Generator
0.759.90.1176666.42604.9720.45.75.7
0.7512.20.1178886.43431.8226.87.67.6
1.255.20.1177776.43030.030323.76.76.7
1.7514.50.11737007.2207815.79183.245.845.8
2.258.70.11725166.497251.0175.821.421.4
2.2519.10.11737007.322020.440198.448.548.5
3.2513.30.11737008.6324846.12345.971.671.6
3.2514.50.11737008.5321025.36339.970.870.8
4.25110.11737008.935197.39389.677.677.6
4.7516.80.11737008.935392.48393.078.078.0
Note: Results are given for a randomly selected subset of sea conditions presented in Figure 2. This example design has a 0.117 cubic meter per radian pump displacement and 3700 square meter total installed membrane area. The annual average permeate production for this design is 1518 cubic meters per day.
Table 10. Optimal operating parameters and performance example for a series-type PTO with a switch-mode power transformer, a fixed displacement, and a variable active RO membrane area (M-FV).
Sea ConditionOperating ParametersPermeate
Production
(m3/day)
Power
(kW)
Significant
Wave Height
(m)
Peak
Period
(s)
DutyActive RO
Membrane Area
(m2)
RO Feed
Pressure
(Mpa)
UnweightedWeightedCaptured by
WEC
Consumed by
Charge Pump
Produced by
Generator
0.759.90.2366630.02614.9922.75.85.8
0.7512.20.2881423.83141.6627.06.96.9
1.255.20.2385130.03340.033429.17.47.4
1.7514.50.26370030.0205615.62201.245.345.3
2.258.70.23299730.0115060.3599.425.325.3
2.2519.10.26370030.022080.442222.048.748.7
3.2513.30.30370030.0304043.16350.167.067.0
3.2514.50.30370030.0301323.81345.766.466.4
4.25110.31370030.032226.77381.471.071.0
4.7516.80.31370030.032332.26383.271.371.3
Note: Results are given for a randomly selected subset of sea conditions presented in Figure 2. This example design has a 0.0327 cubic meter per radian pump displacement and 3700 square meter total installed membrane area. The annual average permeate production for this design is 1518 cubic meters per day.
Disclaimer/Publisher’s Note: The statements, opinions and data contained in all publications are solely those of the individual author(s) and contributor(s) and not of MDPI and/or the editor(s). MDPI and/or the editor(s) disclaim responsibility for any injury to people or property resulting from any ideas, methods, instructions or products referred to in the content.

