
Wave Resource Assessments: Spatiotemporal Impacts of WEC Size and Wave Spectra on Power Conversion


Abstract
:1. Introduction
2. Materials and Methods
2.1. Traditional Wave Resource Assessment Methods
2.2. WEC Net Power Assessment (NPA)
3. Case study WEC, Assessment Locations, and Study Scenarios
4. Results
4.1. IEC Assessment
4.2. WEC Net Power Assessment (NPA)
4.2.1. Mean Annual Average Energy Production
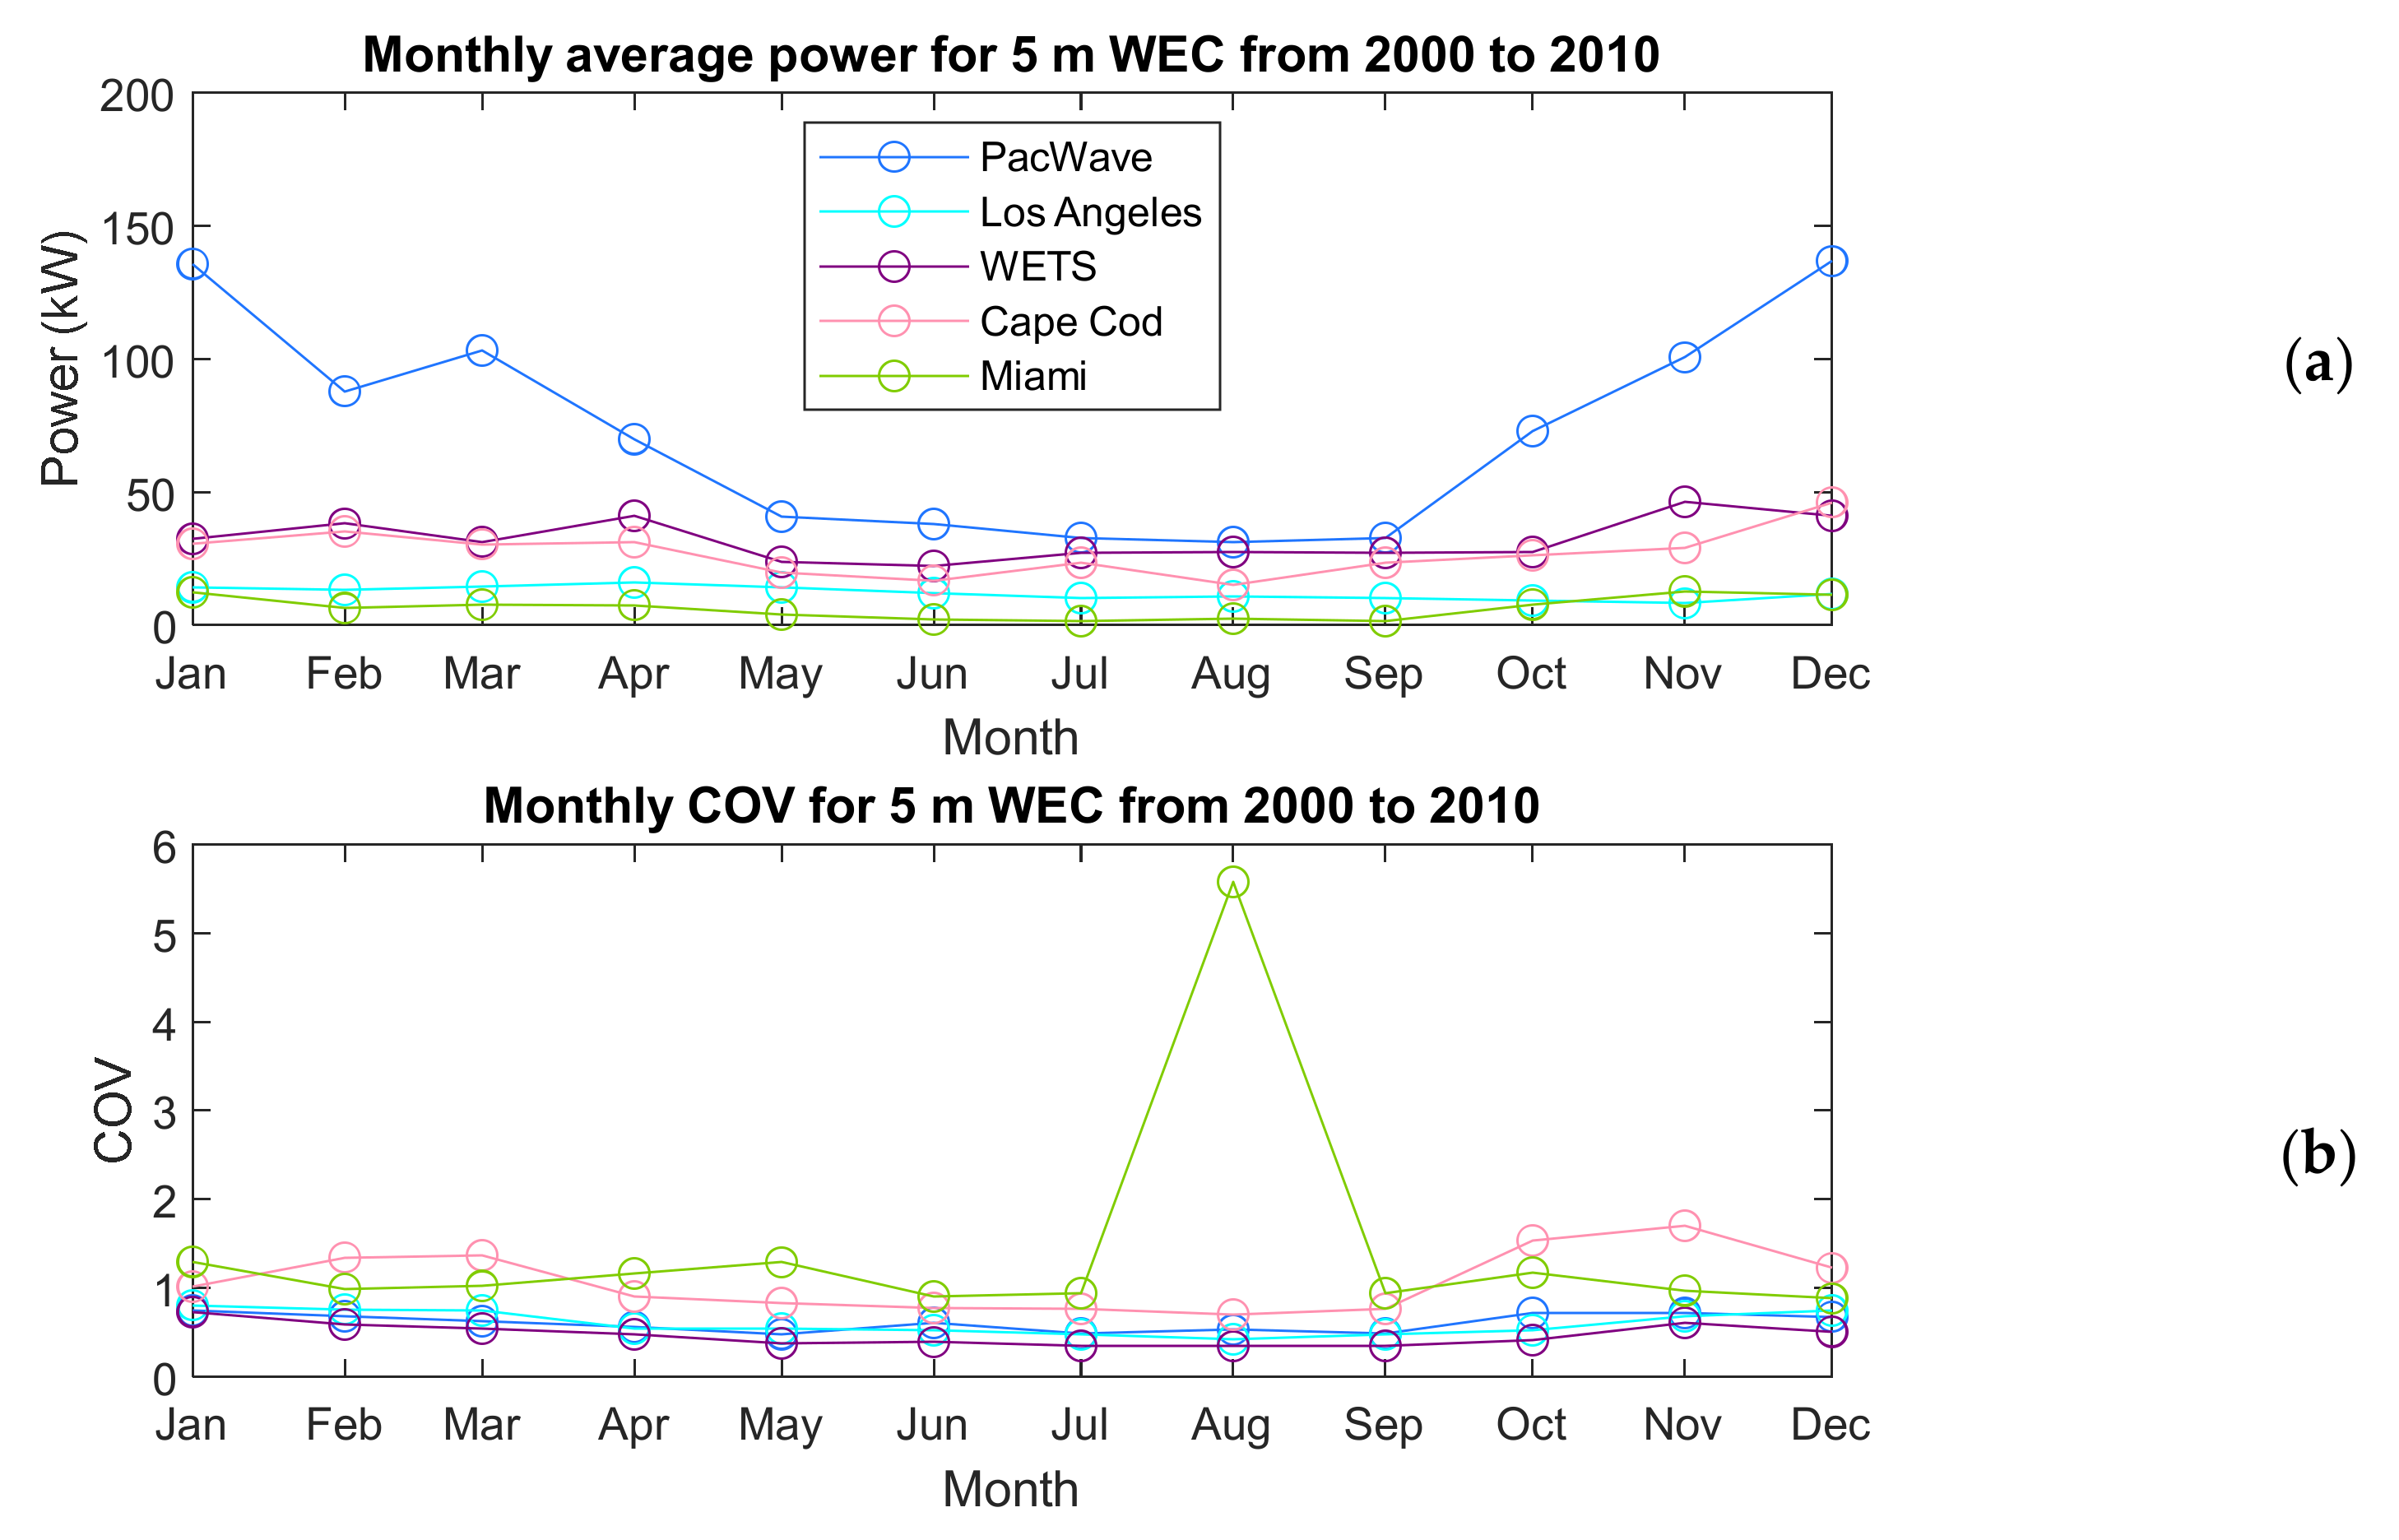
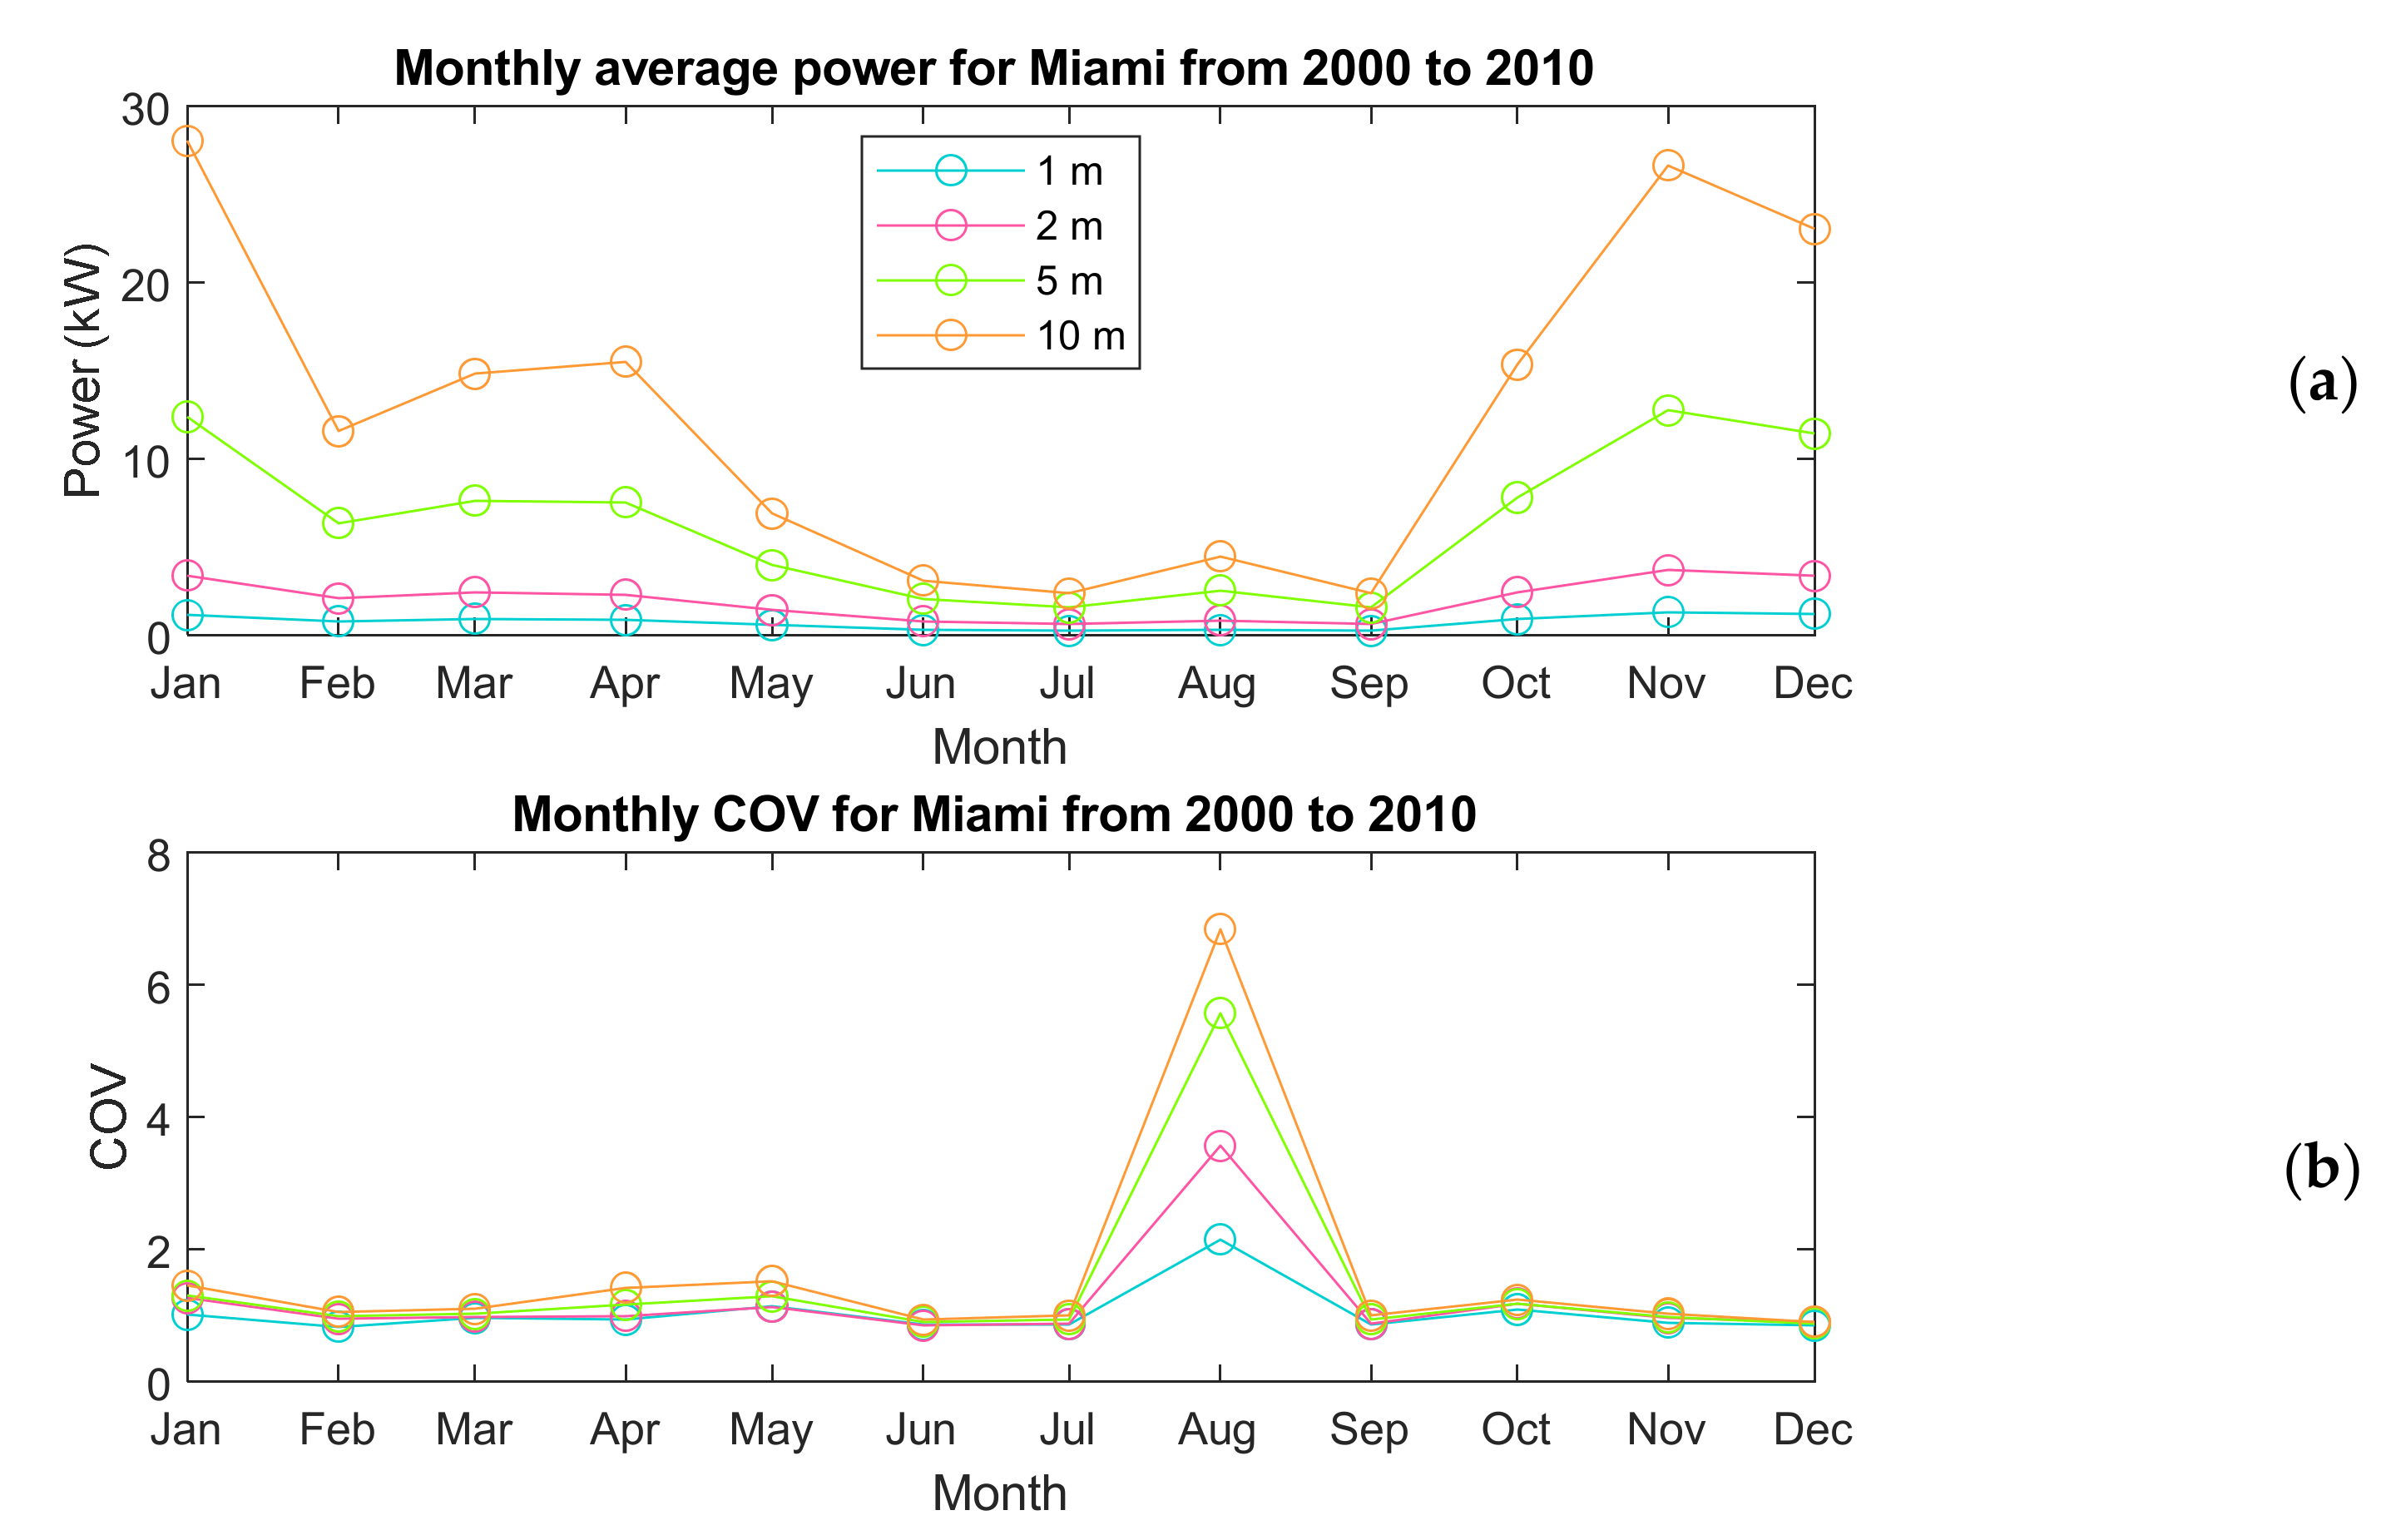
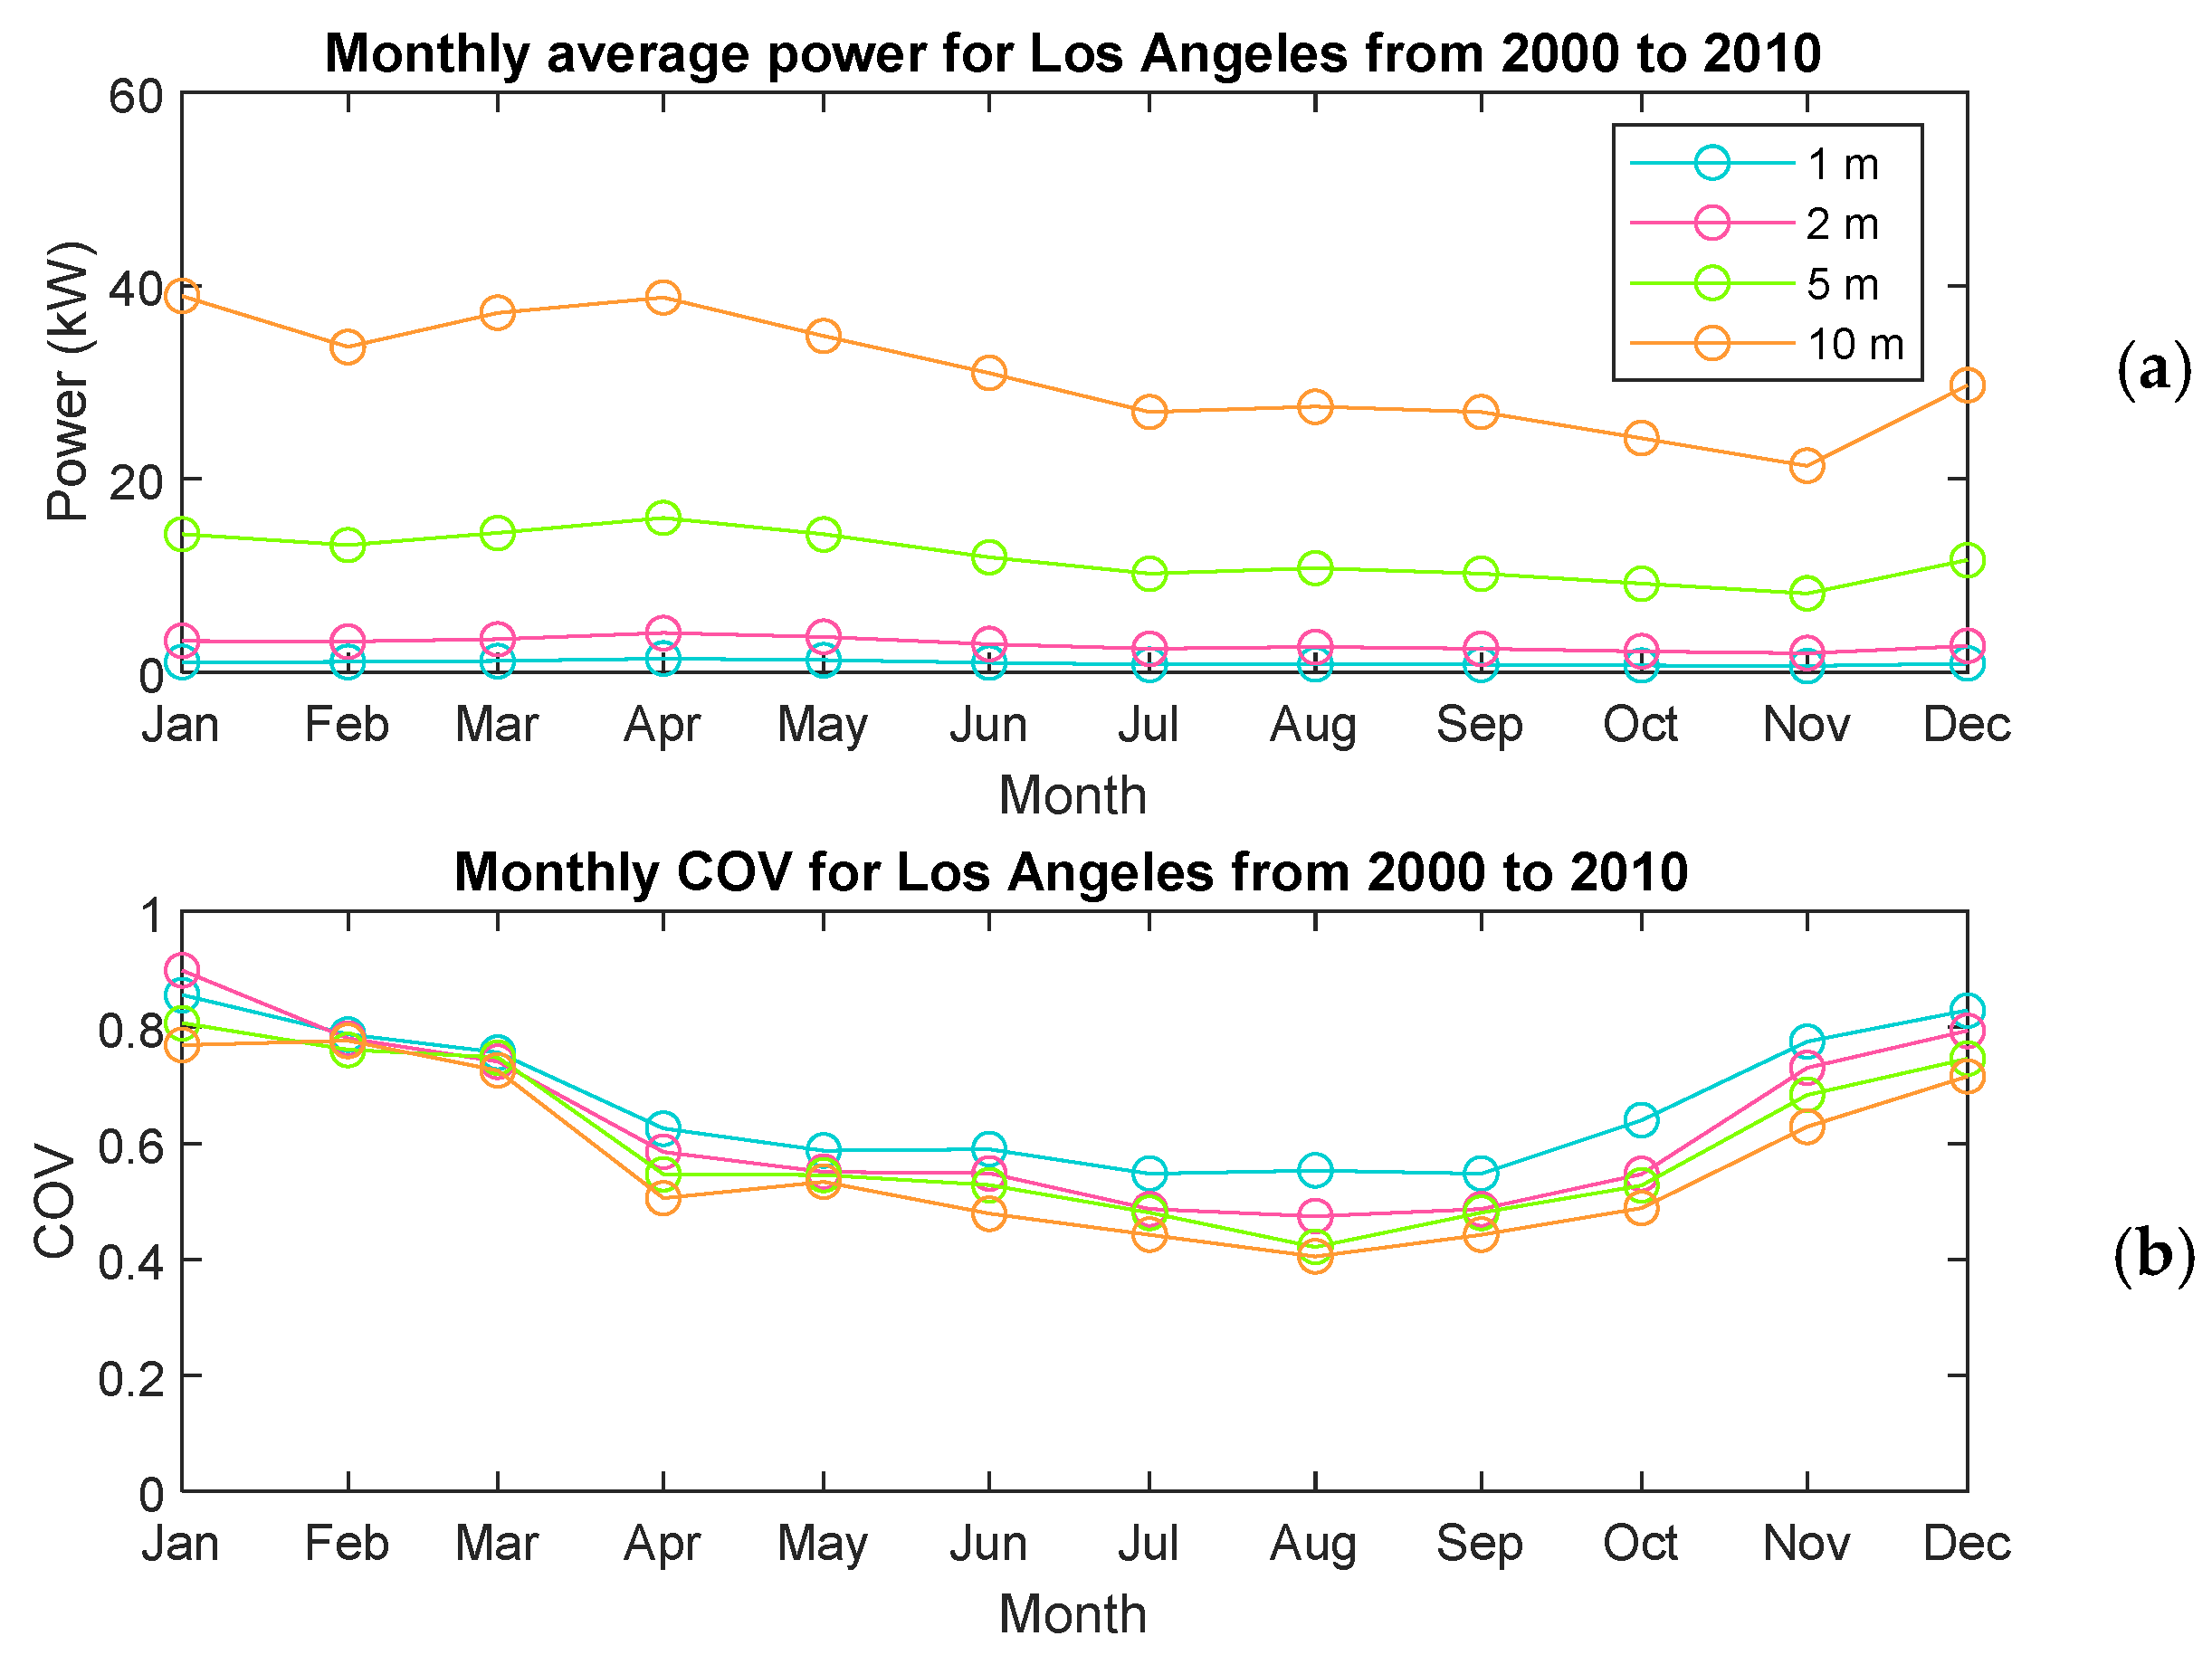
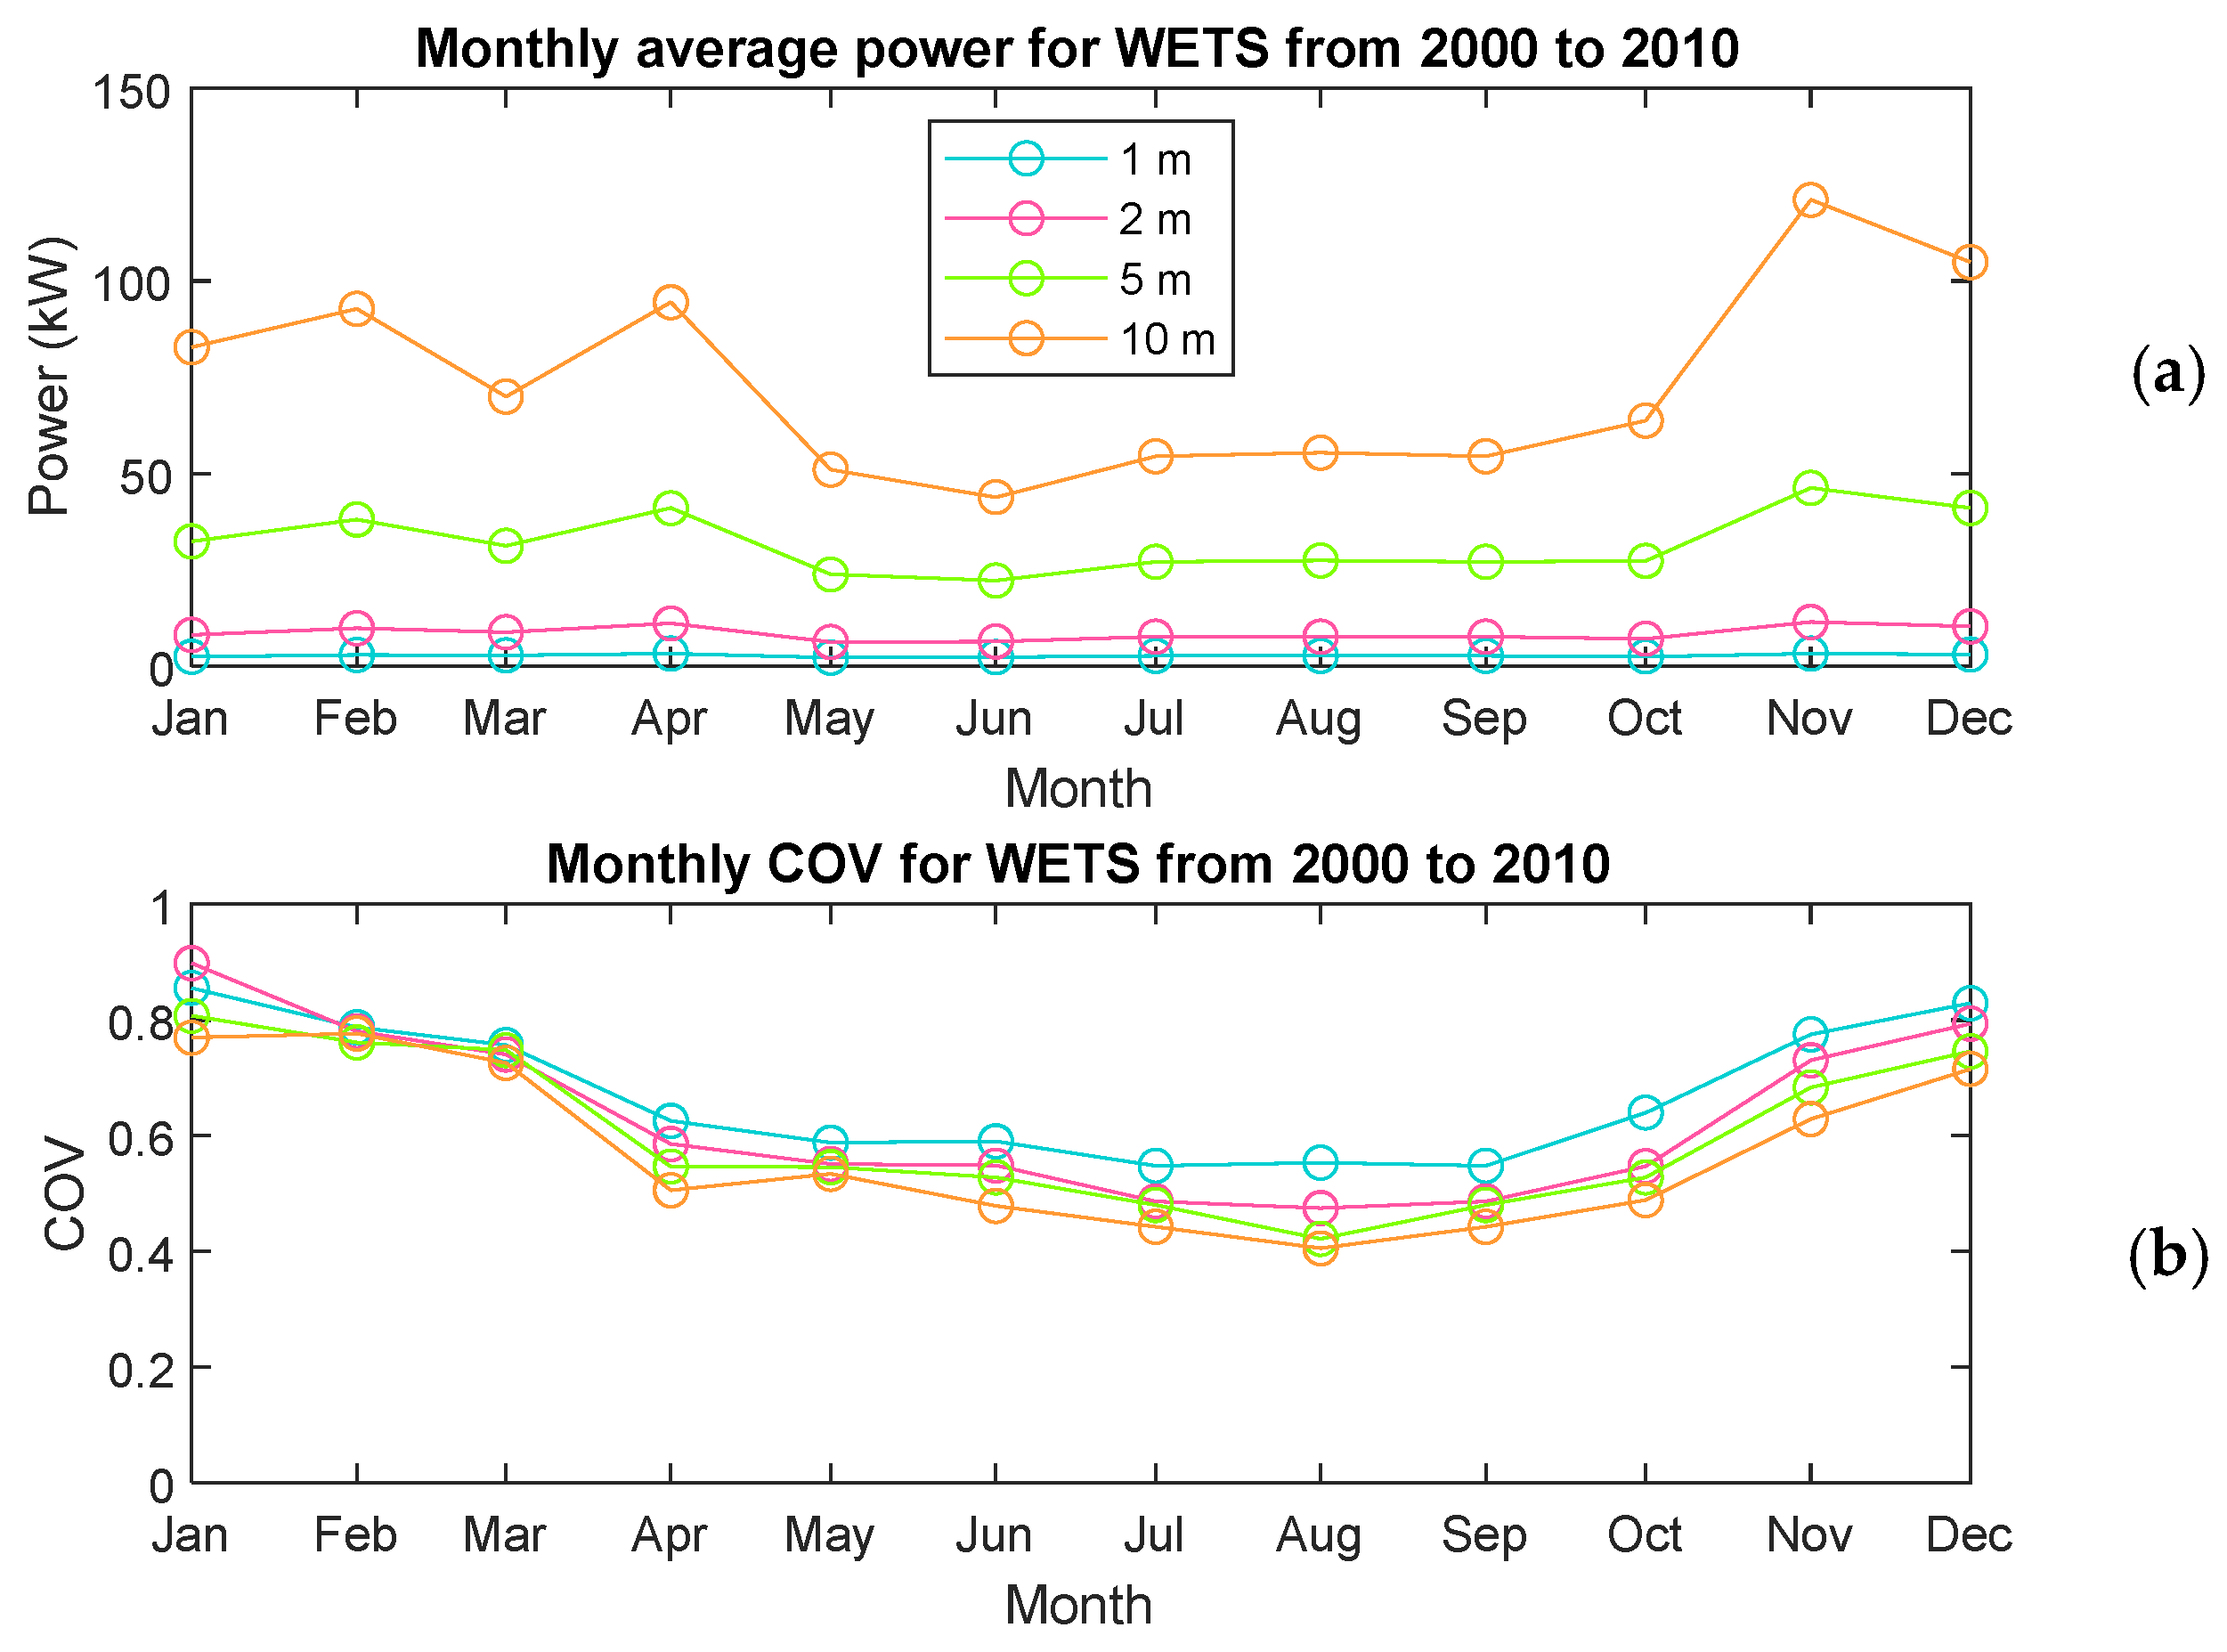
4.2.2. Monthly Power and COV
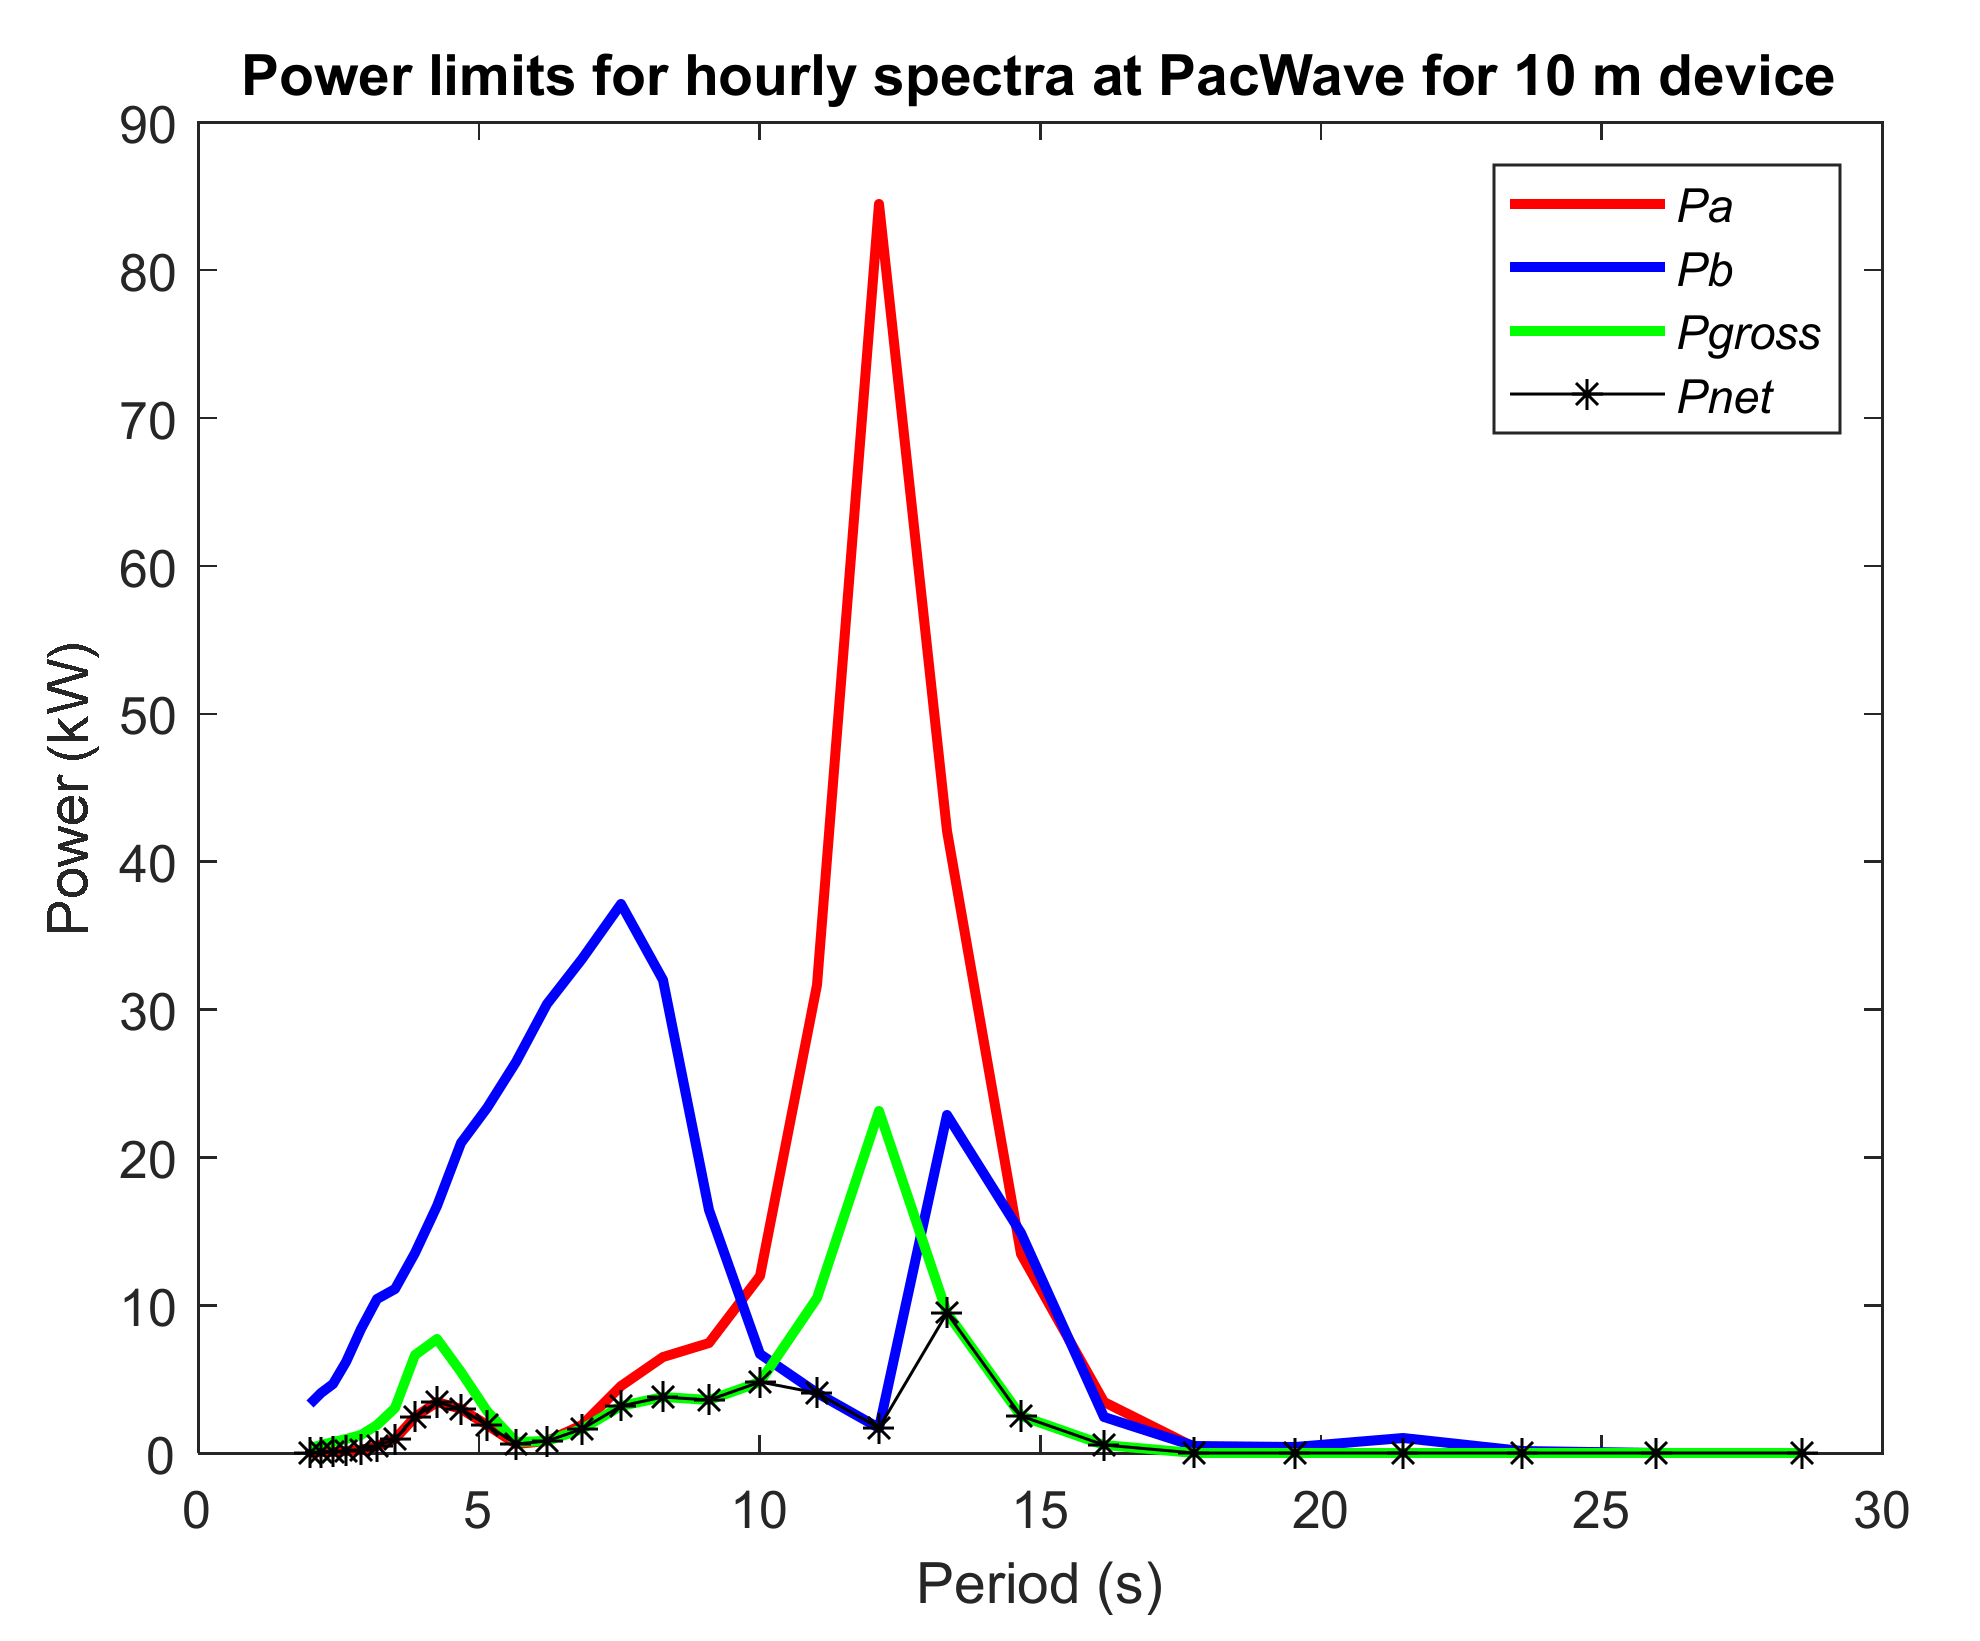
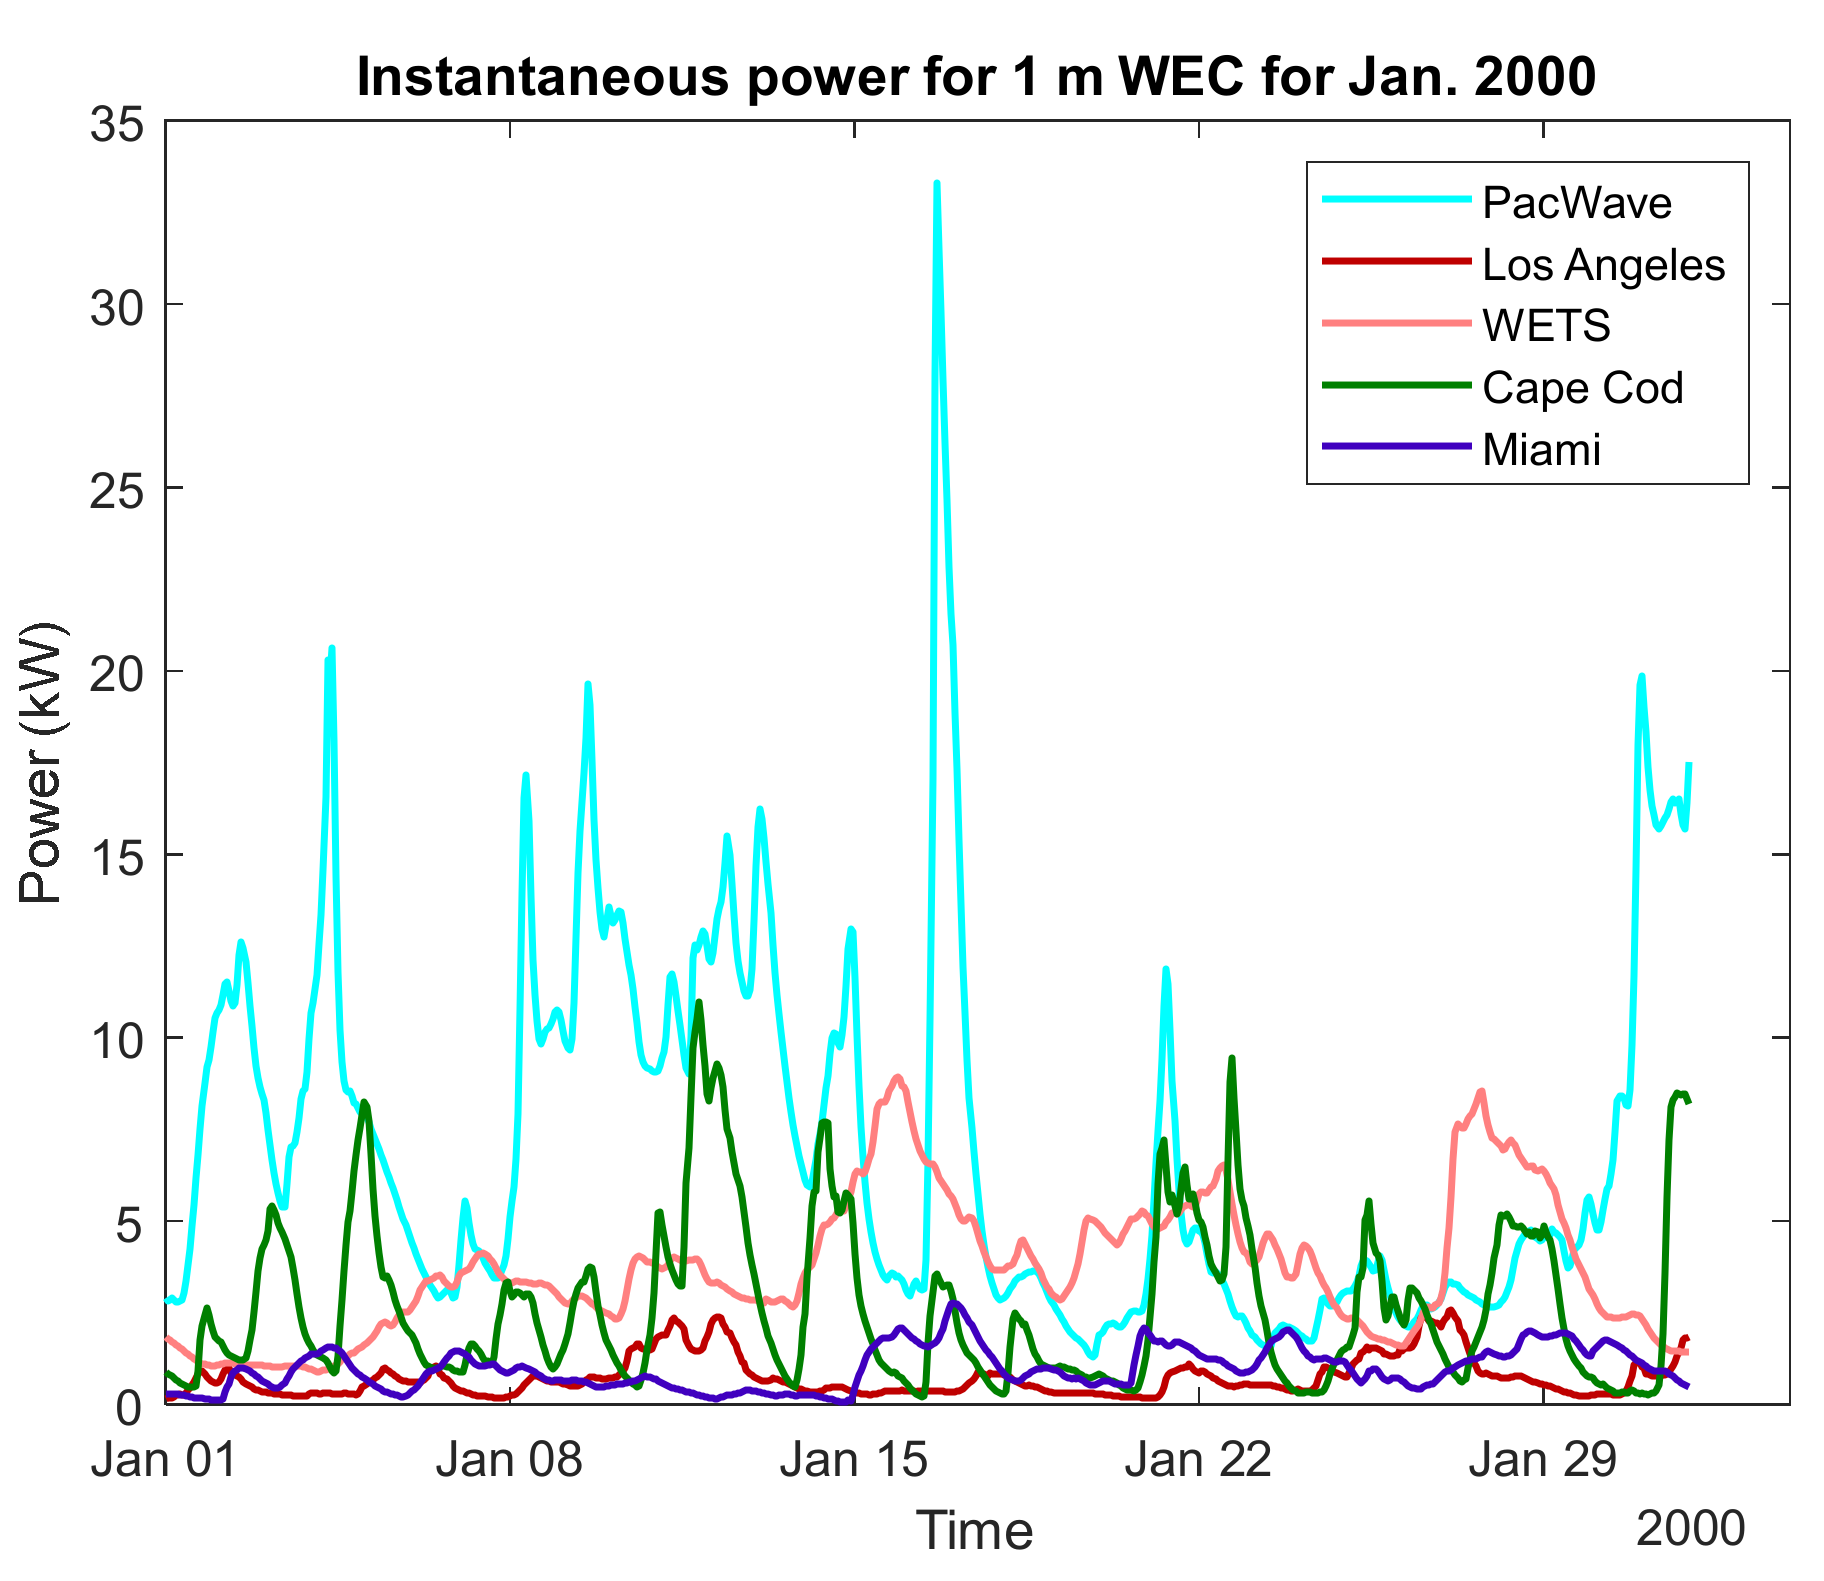
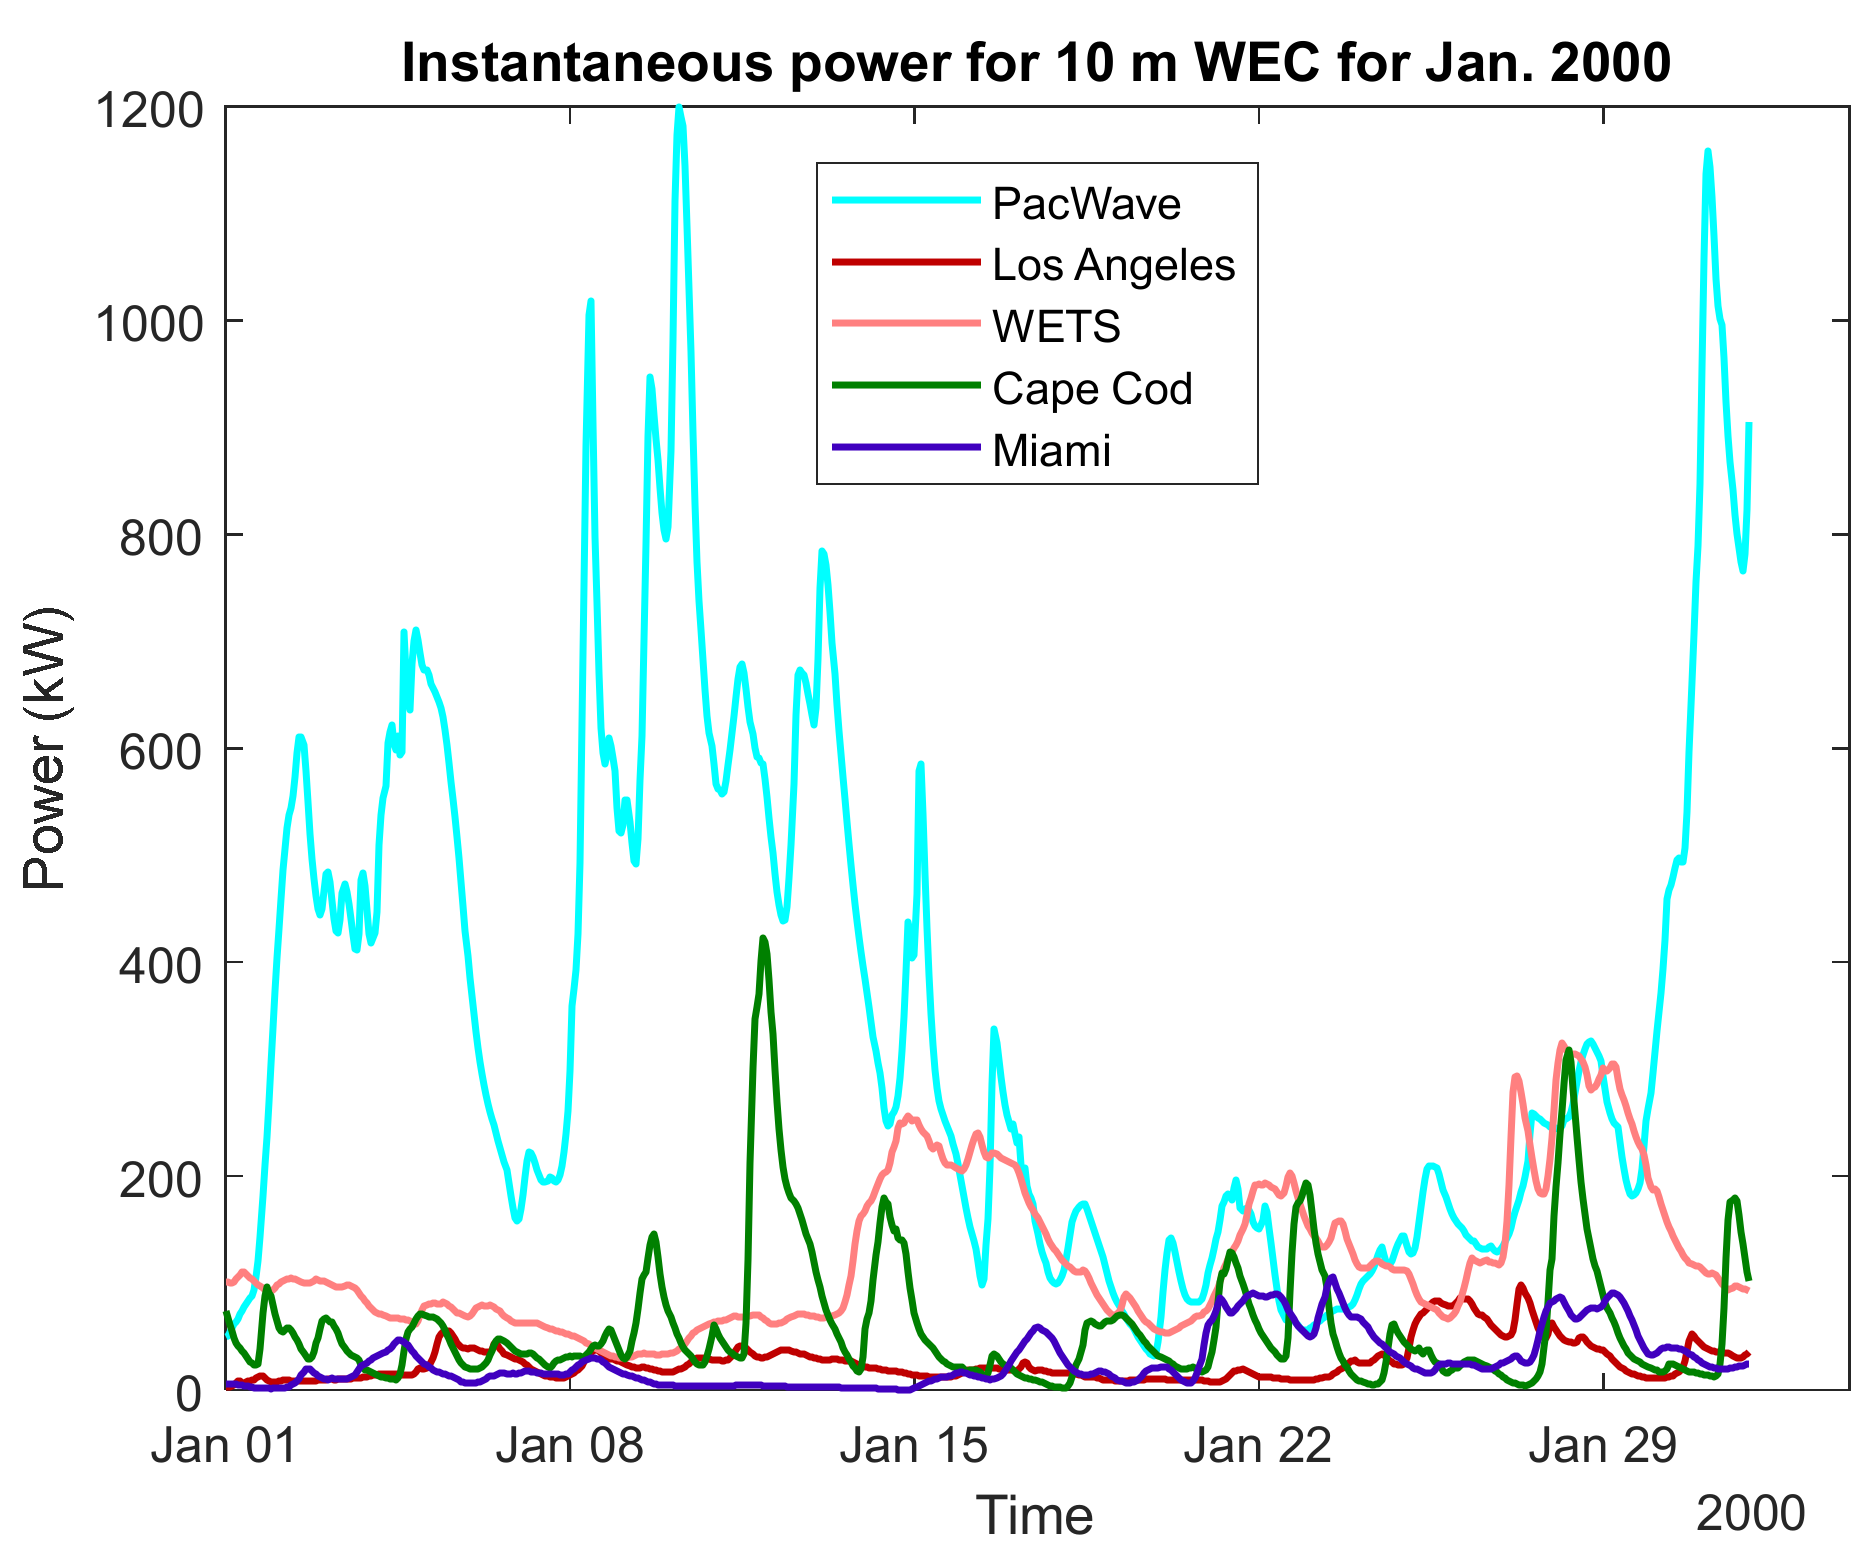
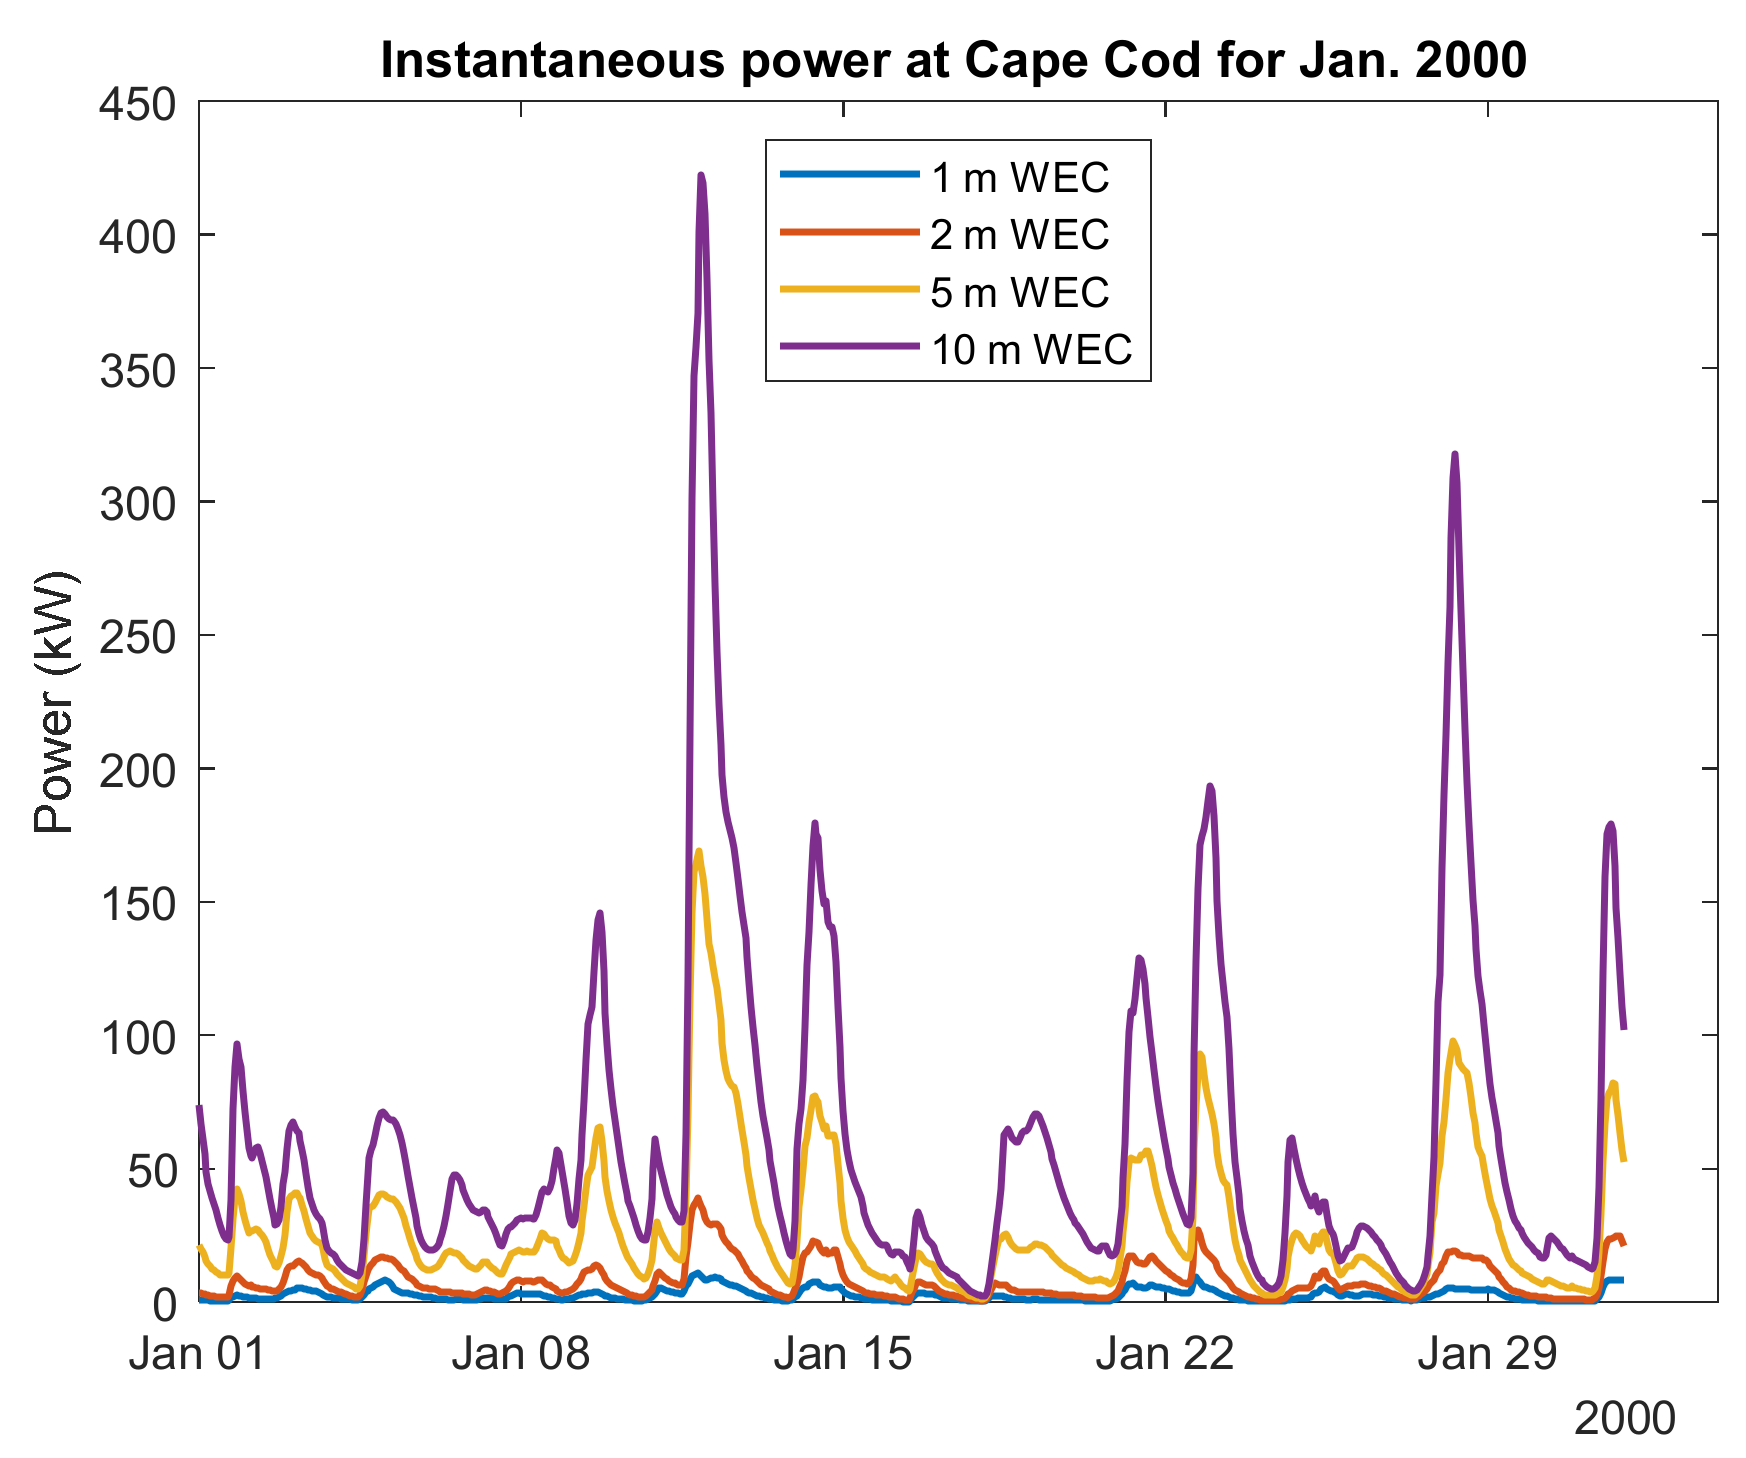
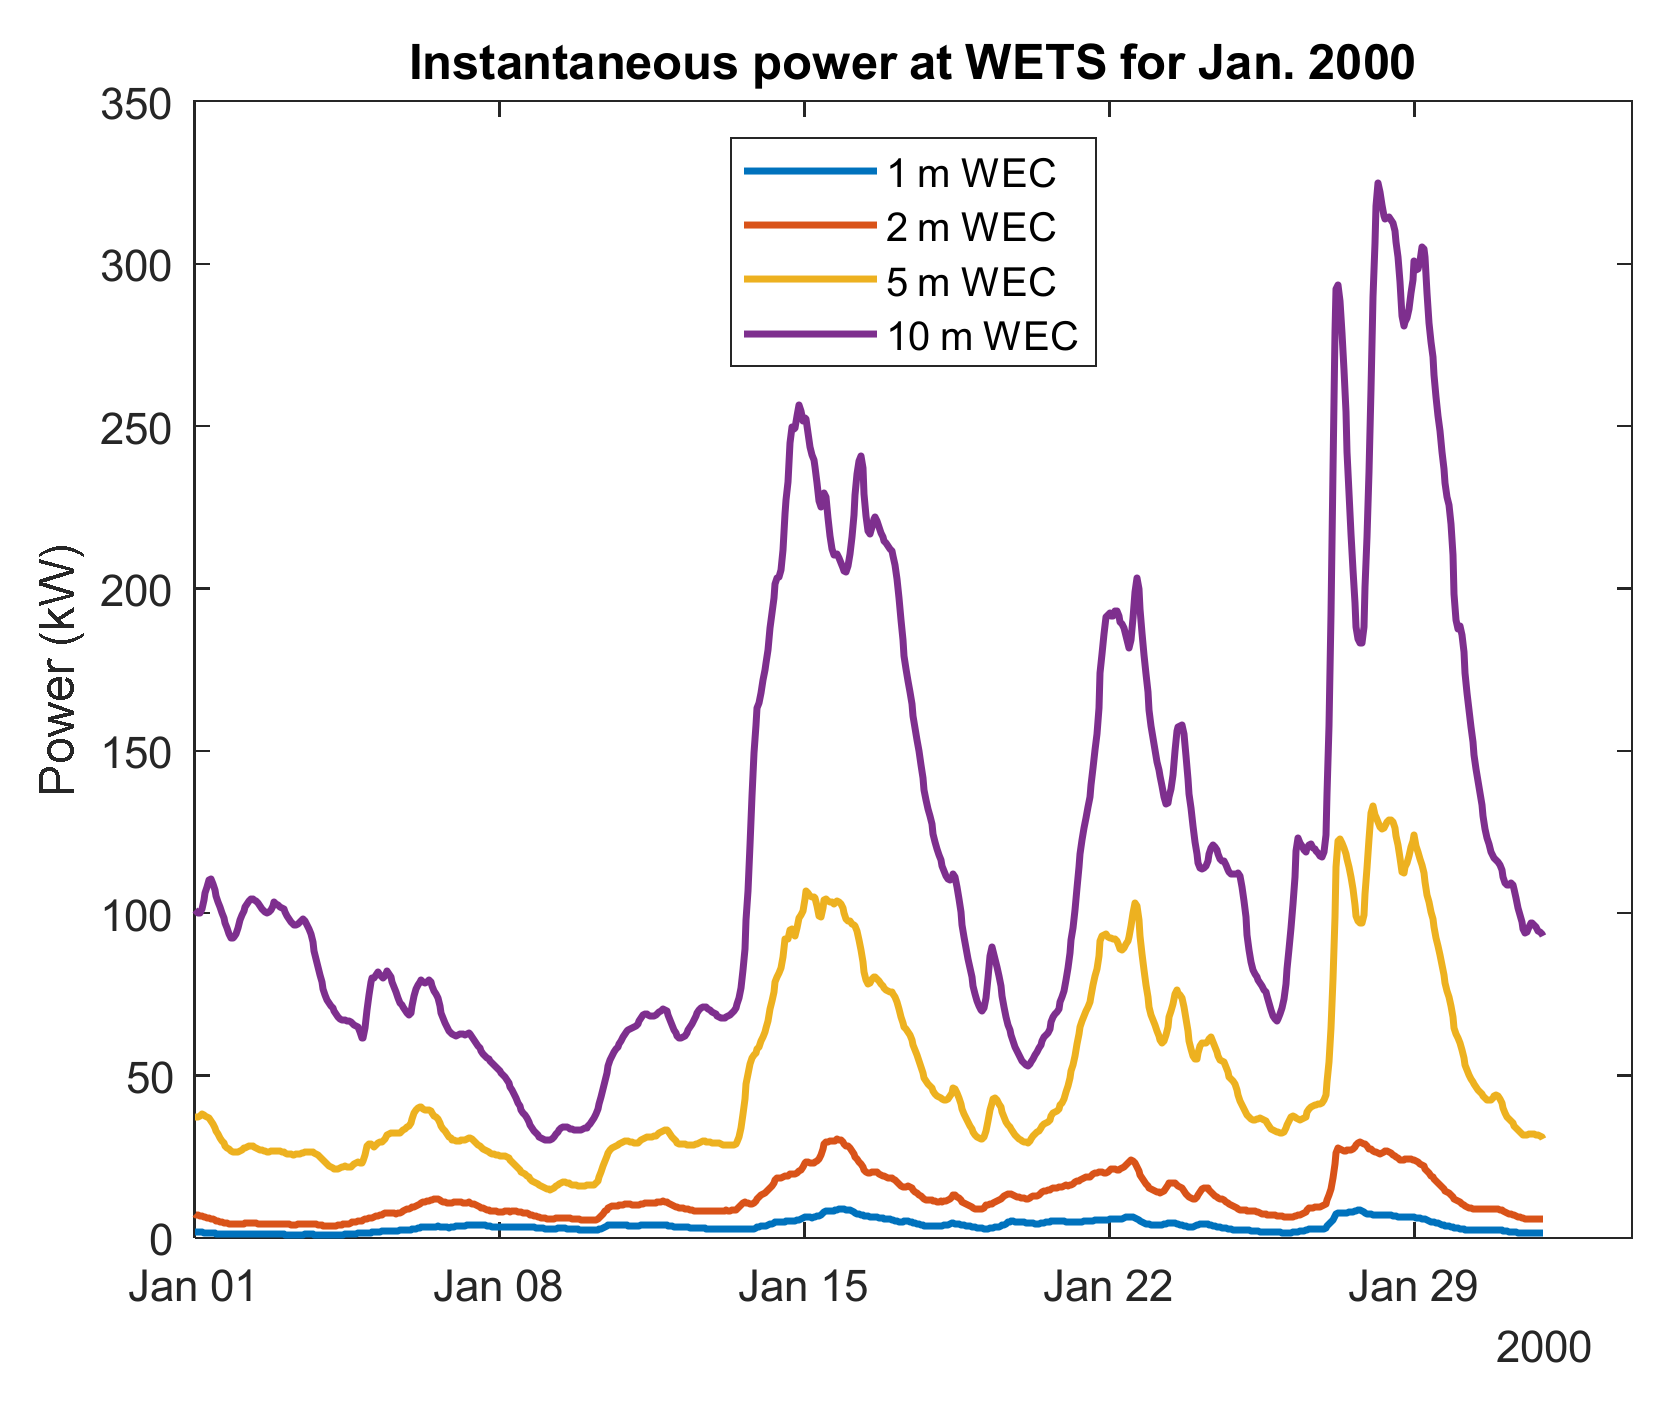
4.2.3. Instantaneous Power
5. Discussion
6. Conclusions
Author Contributions
Funding
Data Availability Statement
Conflicts of Interest
References
- Columbia Power Technologies. Why Wave Energy? 2019. Available online: https://cpower.co/why-wave-energy/ (accessed on 20 November 2021).
- Hashemi, M.R.; Neill, S.P. Fundamentals of Ocean Renewable Energy, 1st ed.; Academic Press, Ed.; Elsevier: Amsterdam, The Netherlands, 2018. [Google Scholar]
- LiVecchi, A.; Copping, A.; Jenne, D.; Gorton, A.; Preus, R.; Robichaud, R.; Green, R.; Geerlofs, S.; Gore, S.; Hume, D.; et al. Powering the Blue Economy: Exploring Opportunities for Marine Renewable Energy in Maritime Markets; U.S. Department of Energy, Office of Energy Efficiency and Renewable Energy: Washington, DC, USA, 2019.
- Driscol, B.P.; Gish, L.A.; Coe, R.G. A Scoping Study to Determine the Location-Specific WEC Threshold Size for Wave-Powered AUV Recharging. IEEE J. Ocean. Eng. 2020, 46, 1–10. [Google Scholar] [CrossRef]
- Jin, S.; Zheng, S.; Greaves, D. On the scalability of wave energy converters. Ocean Eng. 2022, 243, 110212. [Google Scholar] [CrossRef]
- Dunkle, G.; Robertson, B.; Garcia-Medina, G.; Yang, Z. PacWave Wave Resource Assessment. 2020. Available online: https://ir.library.oregonstate.edu/concern/technical_reports/hm50tz68v (accessed on 23 September 2021).
- Todalshaug, J.H. Hydrodynamics of WECs. In Handbook of Ocean Wave Energy; Pecher, A., Kofoed, J.P., Eds.; Springer International Publishing: Cham, Switzerland, 2017; pp. 139–158. [Google Scholar]
- Budal, K.; Falnes, J. Interacting Point Absorbers with Controlled Motion. In Power from Sea Waves; Count, B.M., Ed.; Academic Press: London, UK, 1980; pp. 381–399. [Google Scholar]
- Newman, J.N. Marine Hydrodynamics, 40th Anniversary ed.; The MIT Press: London, UK, 2018. [Google Scholar]
- Budal, K.; Falnes, J. Wave power conversion by point absorbers: A Norwegian project. Int. J. Ambient Energy 1982, 3, 59–67. [Google Scholar] [CrossRef]
- Falnes, J. A review of wave-energy extraction. Mar. Struct. 2007, 20, 185–201. [Google Scholar] [CrossRef]
- Falnes, J. Oscillating-Body Wave-Energy Converters. In Ocean Waves and Oscillating Systems: Linear Interactions Including Wave-Energy Extraction; Falnes, J., Kurniawan, A., Eds.; Cambridge University Press: New York, NY, USA, 2020; pp. 204–241. [Google Scholar]
- Falnes, J. Small is Beautiful: How to Make Wave Energy Economic. Proc. EBC Congr. 2003, 29, 481–489. [Google Scholar]
- Todalshaug, J.H. Practical limits to the power that can be captured from ocean waves by oscillating bodies. Int. J. Mar. Energy 2013, 3–4, e70–e81. [Google Scholar] [CrossRef]
- Beatty, S.J.; Hall, M.; Buckham, B.J.; Wild, P.; Bocking, B. Experimental and numerical comparisons of self-reacting point absorber wave energy converters in regular waves. Ocean Eng. 2015, 104, 370–386. [Google Scholar] [CrossRef]
- IEC TS 62600-101:2015; Marine Energy–Wave, Tidal and Other Water Current Converters–Part 101: Wave Energy Resource Assessment and Characterization. International Electrotechnical Commission: Geneva, Switzerland, 2015.
- Evans, D.V. A theory for wave-power absorption by oscillating bodies. J. Fluid Mech. 1976, 77, 1–25. [Google Scholar] [CrossRef]
- Holthuijsen, L.H. Waves in Oceanic and Coastal Waters; Cambridge University Press: New York, NY, USA, 2007. [Google Scholar]
- Falnes, J.; Hals, J. Heaving buoys, point absorbers and arrays. Philos. Trans. R. Soc. A Math. Phys. Eng. Sci. 2012, 370, 246–277. [Google Scholar] [CrossRef] [PubMed] [Green Version]
- Hals, J.; Falnes, J.; Moan, T. Constrained optimal control of a heaving buoy wave-energy converter. J. Offshore Mech. Arct. Eng. 2010, 133, 011401. [Google Scholar] [CrossRef] [Green Version]
- Tethys Engineering. RM3: Wave Point Absorber; U.S. Department of Energy: Washington, DC, USA, 2021.
- Cornett, A.M. A global wave energy resource assessment. In Proceedings of the Eighteenth International Offshore and Polar Conference, Vancouver, BC, Canada, 6–11 July 2008; Volume 50. [Google Scholar]
- Stopa, J.E.; Cheung, K.F.; Chen, Y.L. Assessment of wave energy resources in Hawaii. Renew. Energy 2011, 36, 554–567. [Google Scholar] [CrossRef]
- Kilcher, L.; Thresher, R. Marine Hydrokinetic Energy Site Identification and Ranking Methodology Part I: Wave Energy; National Renewable Energy Laboratory: Golden, CO, USA, 2016.
- Wu, W.C.; Wang, T.; Yang, Z.; García-Medina, G. Development and validation of a high-resolution regional wave hindcast model for U.S. West Coast wave resource characterization. Renew. Energy 2020, 152, 736–753. [Google Scholar] [CrossRef]
- Allahdadi, M.N.; Gunawan, B.; Lai, J.; He, R.; Neary, V.S. Development and validation of a regional-scale high-resolution unstructured model for wave energy resource characterization along the US East Coast. Renew. Energy 2019, 136, 500–511. [Google Scholar] [CrossRef]
- Dolan, R.; Davis, R.E. Coastal Storm Hazards. J. Coast. Res. 1994, 12, 103–114. [Google Scholar]
- Dunkle, G. Wave Resource Assessments: Spacio-Temporal Effect of Wave Energy Converter Scale and Blue Economy Opportunities. Master’s Thesis, Oregon State University, Corvallis, OR, USA, 2021. [Google Scholar]
- Brown, D.P.; Beven, J.L.; Franklin, J.L.; Blake, E.S. Atlantic hurricane season of 2008. Mon. Weather Rev. 2010, 138, 1975–2001. [Google Scholar] [CrossRef] [Green Version]
- Babarit, A.; Hals, J.; Muliawan, M.J.; Kurniawan, A.; Moan, T.; Krokstad, J. Numerical benchmarking study of a selection of wave energy converters. Renew. Energy 2012, 41, 44–63. [Google Scholar] [CrossRef]


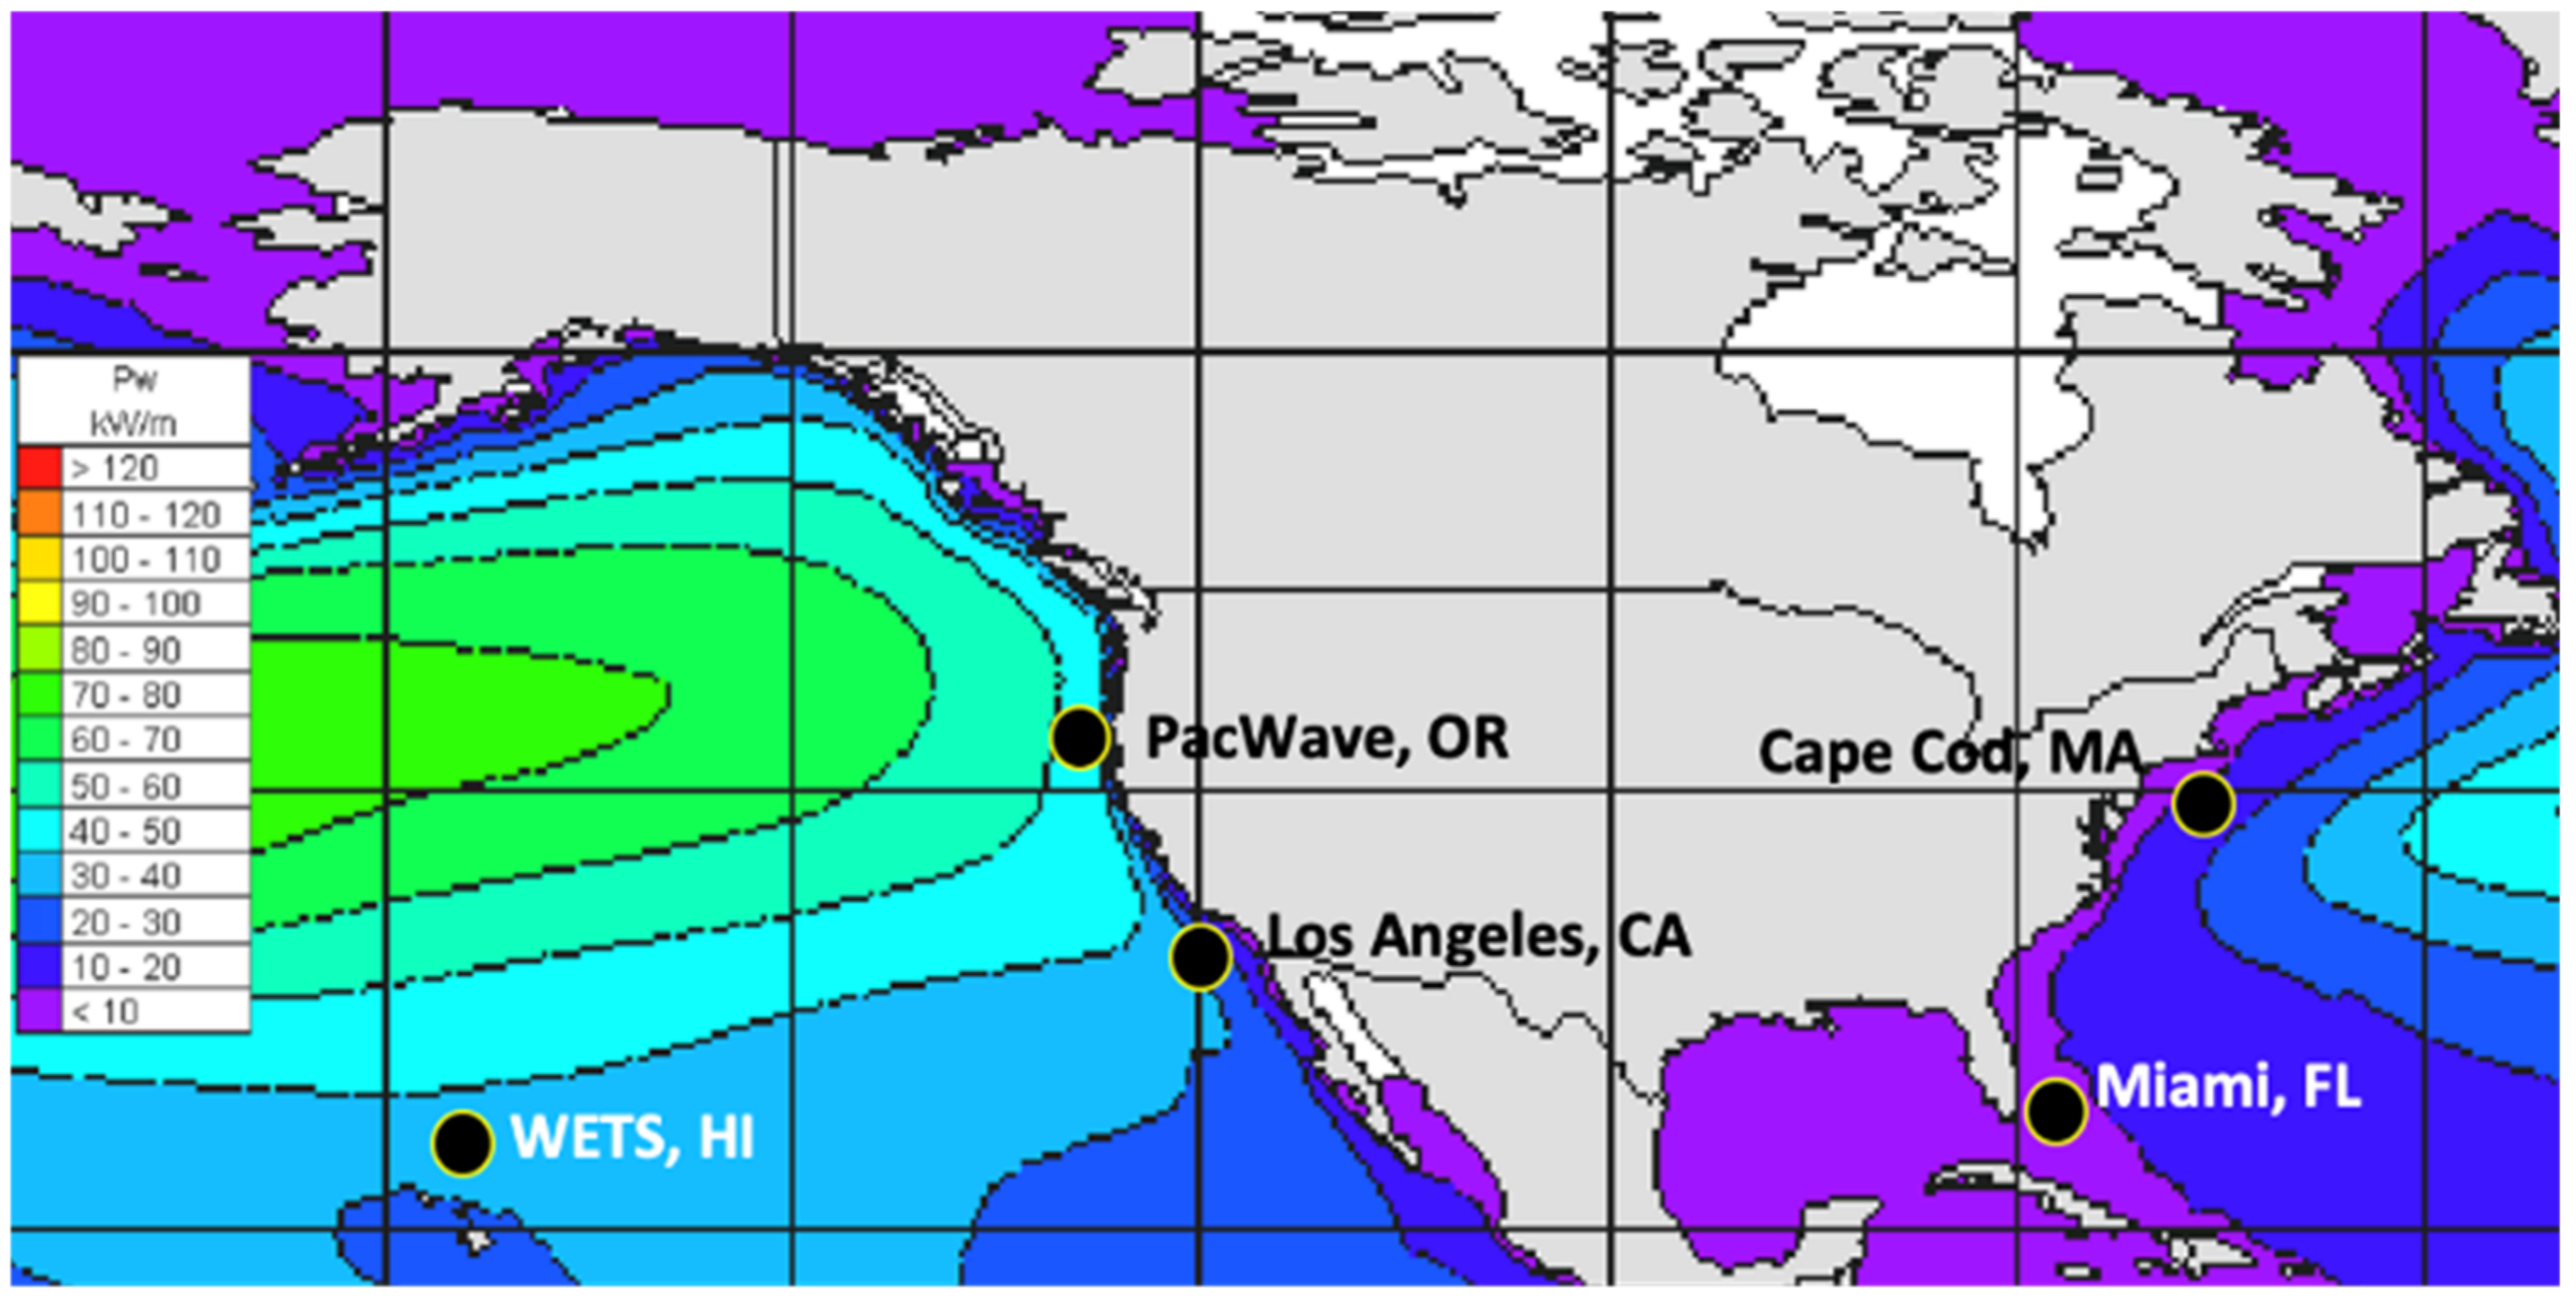
| Location | Lat, Lon (Degrees) | Depth (m) |
|---|---|---|
| PacWave, OR, USA | 44.557, −124.229 | 68 |
| Los Angeles, CA, USA | 33.854, −118.633 | 350 |
| WETS, Oahu, HI, USA | 21.466, −157.751 | 34 |
| Cape Cod, MA, USA | 41.140, −70.690 | 38 |
| Miami, FL, USA | 25.460, −80.030 | 318 |
| Baseline Scenario | Expanded Scenario | |
|---|---|---|
| Filters | ||
| Maximum stroke |
| Location | ||||||
|---|---|---|---|---|---|---|
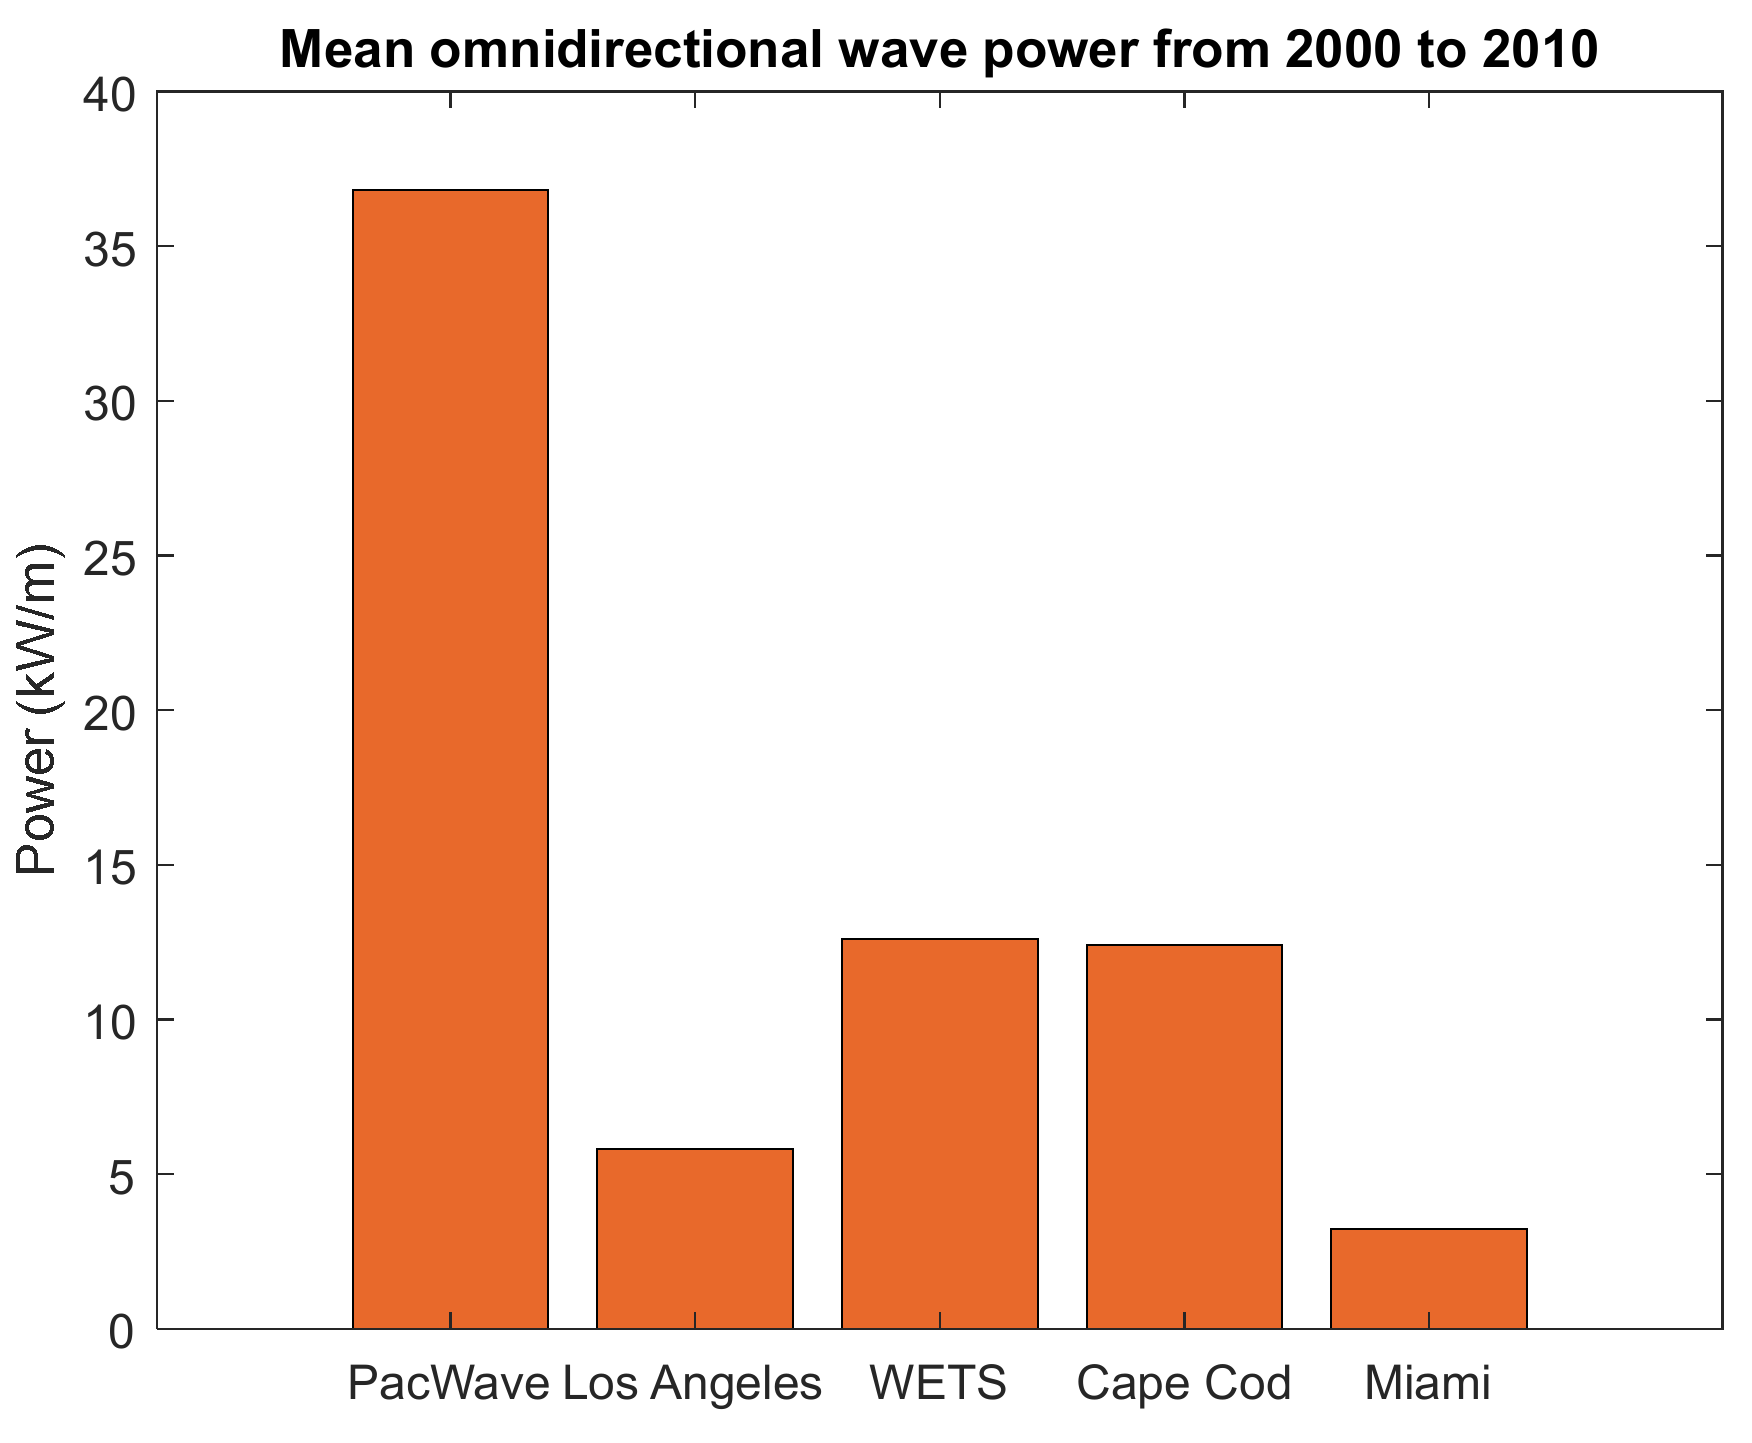
| PacWave, OR, USA | 9.70 m | 2.30 m | 19.80 s | 9.70 s | 719 kW | 36.8 kW |
| Los Angeles, CA, USA | 4.03 m | 1.07 m | 16.5 s | 9.38 s | 80.3 kW | 5.81 kW |
| WETS, Oahu, HI, USA | 4.46 m | 1.66 m | 15.4 s | 7.59 s | 145 kW | 12.6 kW |
| Cape Cod, MA, USA | 7.44 m | 0.857 m | 12.9 s | 5.49 s | 256 kW | 3.24 kW |
| Miami, FL, USA | 7.33 m | 1.55 m | 16.6 s | 6.78 s | 344 kW | 12.4 kW |
| Location | 1 m WEC | 2 m WEC | 5 m WEC | 10 m WEC |
|---|---|---|---|---|
| PacWave, OR, USA | 47.8 kW | 176 kW | 1.01 × 10³ kW | 3.52 × 10³ kW |
| Los Angeles, CA, USA | 7.00 kW | 37.1 kW | 140 kW | 349 kW |
| WETS, Oahu, HI, USA | 12.2 kW | 41.6 kW | 236 kW | 815 kW |
| Cape Cod, MA, USA | 27.8 kW | 106 kW | 581 kW | 1.80 × 10³ kW |
| Miami, FL, USA | 16.4 kW | 63.0 kW | 329 kW | 825 kW |
| Location | 1 m WEC | 2 m WEC | 5 m WEC | 10 m WEC |
|---|---|---|---|---|
| PacWave, OR, USA | 100% | 100% | 100% | 100% |
| Los Angeles, CA, USA | 83.00% | 75.00% | 58.70% | 47.10% |
| WETS, Oahu, HI, USA | 81.00% | 68.00% | 49.10% | 41.10% |
| Cape Cod, MA, USA | 82.70% | 72.30% | 56.10% | 48.30% |
| Miami, FL, USA | 77.90% | 67.70% | 56.80% | 56.20% |
Publisher’s Note: MDPI stays neutral with regard to jurisdictional claims in published maps and institutional affiliations. |
© 2022 by the authors. Licensee MDPI, Basel, Switzerland. This article is an open access article distributed under the terms and conditions of the Creative Commons Attribution (CC BY) license (https://creativecommons.org/licenses/by/4.0/).
Share and Cite
Dunkle, G.; Zou, S.; Robertson, B. Wave Resource Assessments: Spatiotemporal Impacts of WEC Size and Wave Spectra on Power Conversion. Energies 2022, 15, 1109. https://doi.org/10.3390/en15031109
Dunkle G, Zou S, Robertson B. Wave Resource Assessments: Spatiotemporal Impacts of WEC Size and Wave Spectra on Power Conversion. Energies. 2022; 15(3):1109. https://doi.org/10.3390/en15031109
Chicago/Turabian StyleDunkle, Gabrielle, Shangyan Zou, and Bryson Robertson. 2022. "Wave Resource Assessments: Spatiotemporal Impacts of WEC Size and Wave Spectra on Power Conversion" Energies 15, no. 3: 1109. https://doi.org/10.3390/en15031109