Article

System Hydrodynamics of a 1 MWth Dual Circulating Fluidized Bed Chemical Looping Gasifier

Institute for Energy Systems and Technology, Otto-Berndt-Str. 2, 64287 Darmstadt, Germany
*
Authors to whom correspondence should be addressed.
Energies 2023, 16(15), 5630; https://doi.org/10.3390/en16155630
Submission received: 20 June 2023 / Revised: 13 July 2023 / Accepted: 21 July 2023 / Published: 26 July 2023
(This article belongs to the Collection Renewable and Sustainable Energy)

Abstract

:

Highlights

What are the main findings?
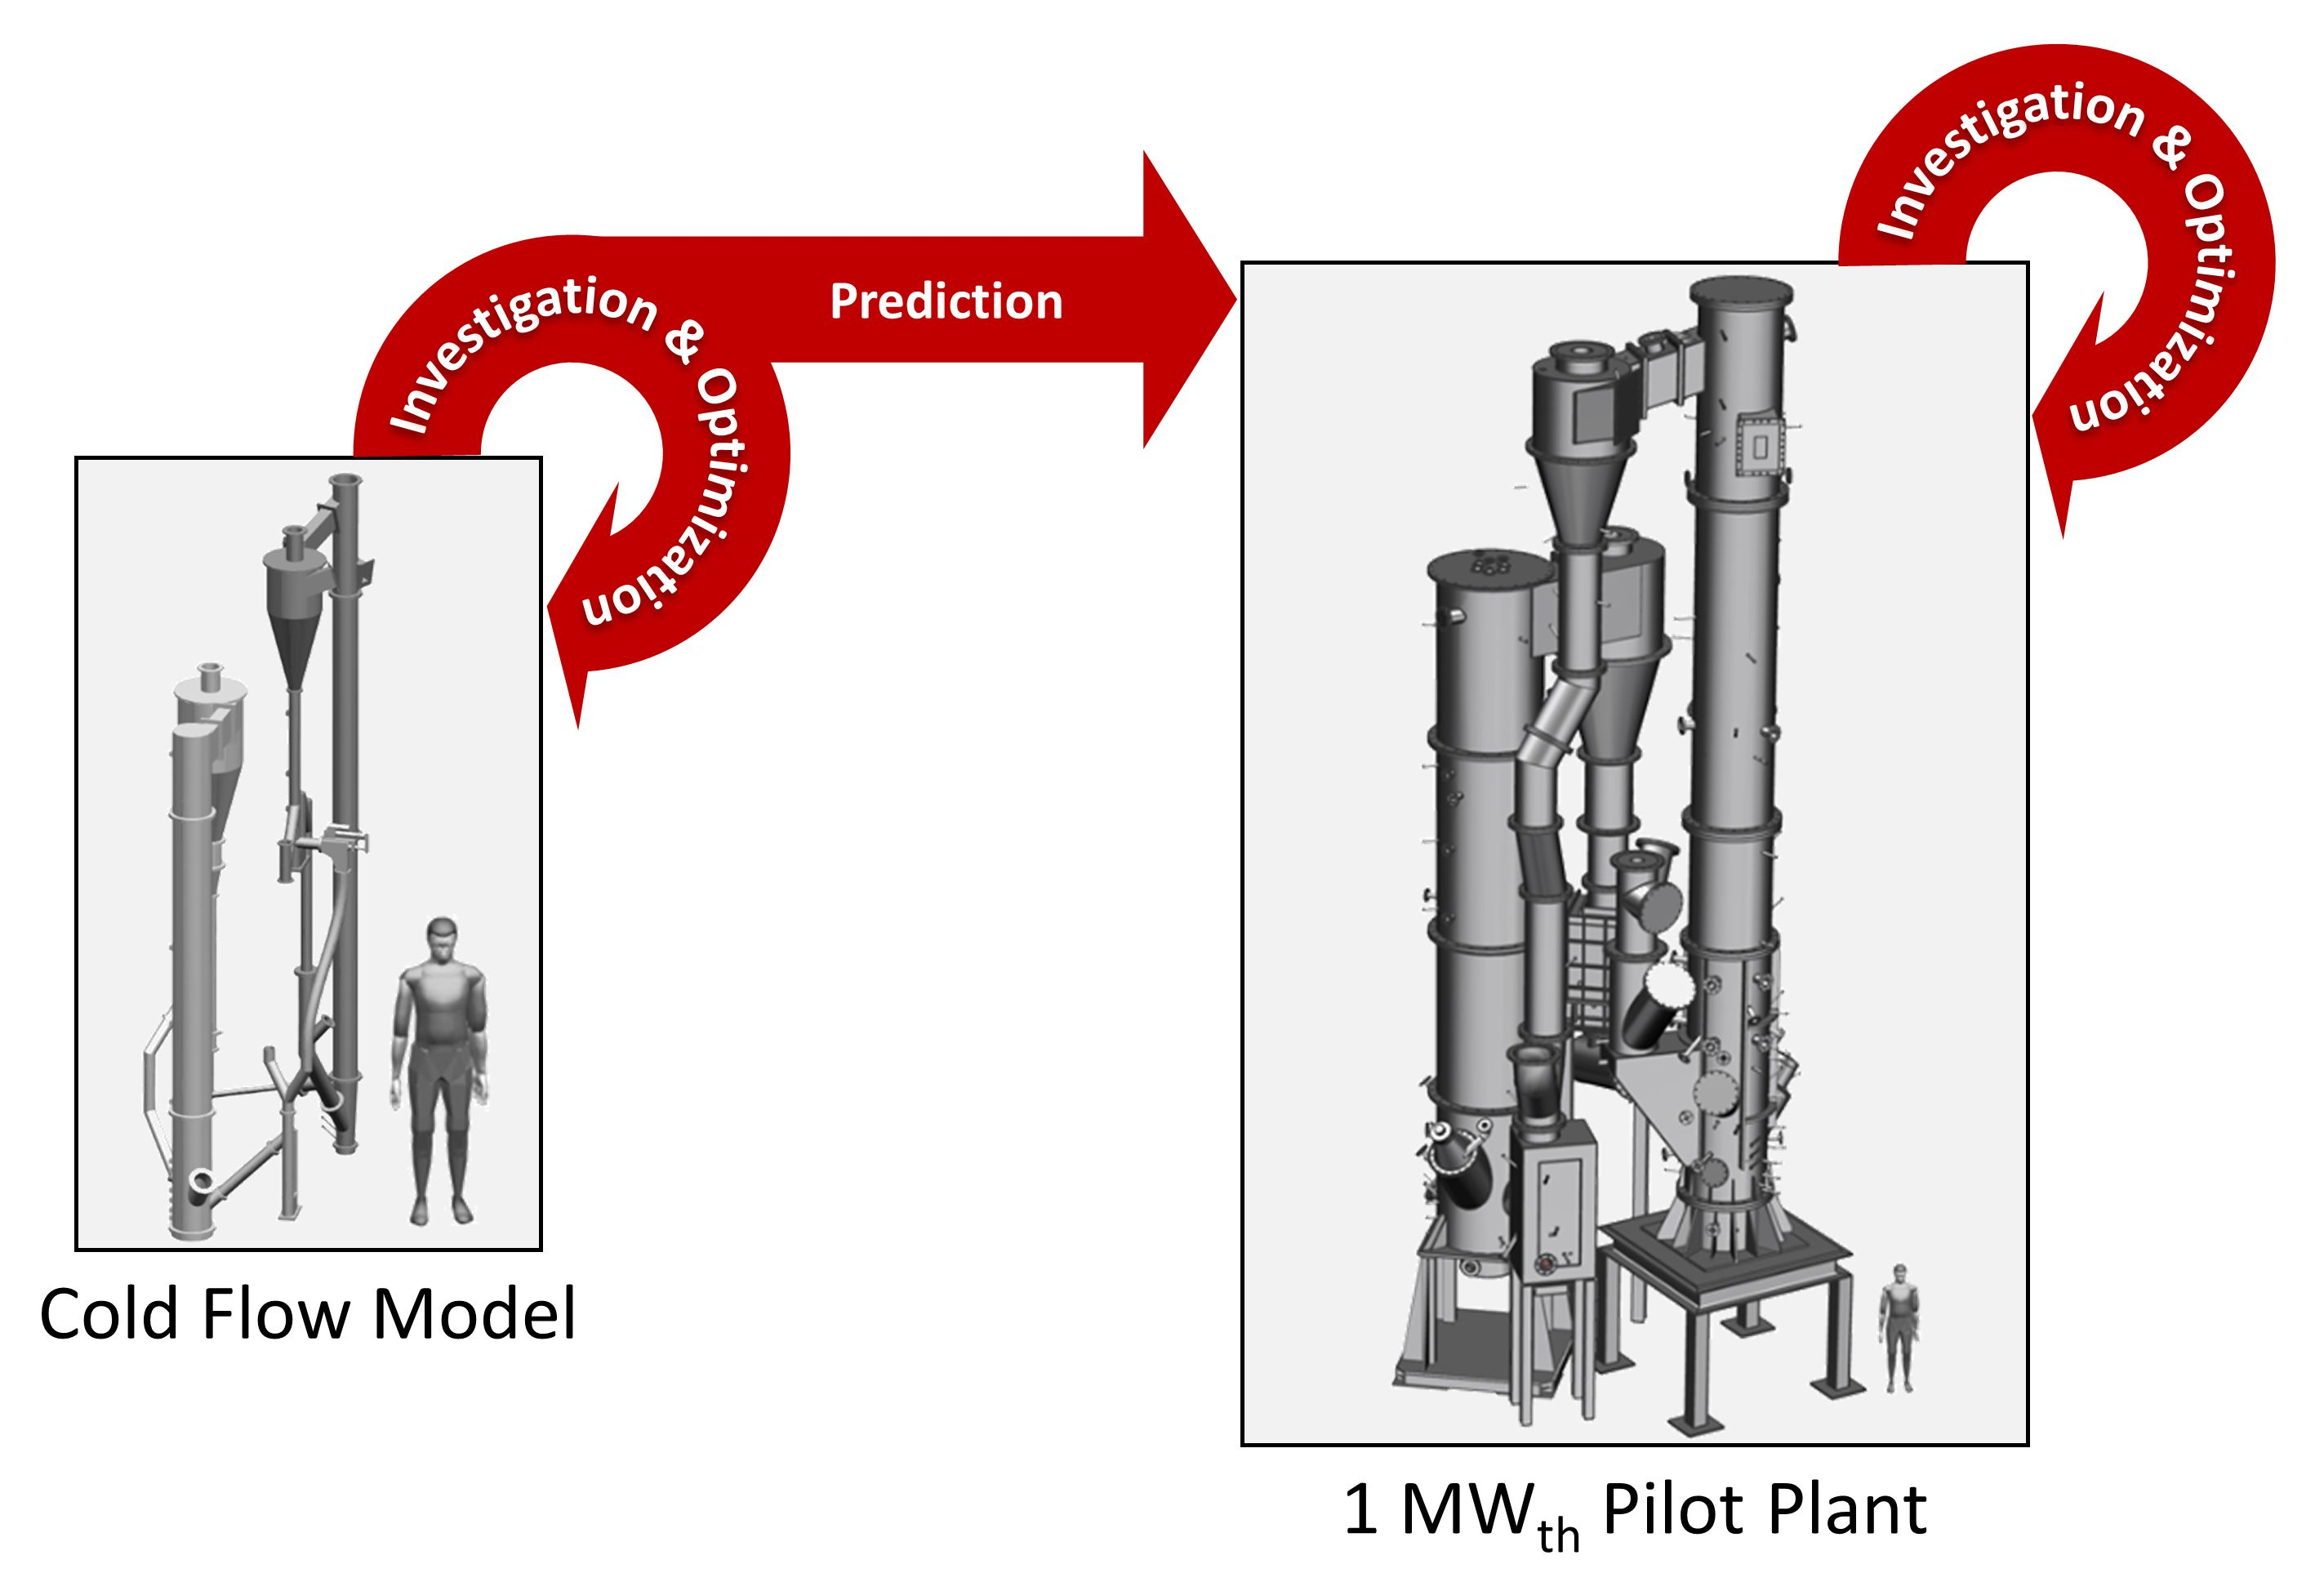
  • A holistic dataset covering the hydrodynamic behavior of a 1 MWth coupled dual-fluidized bed reactor system, encompassing more than 100 h of hot chemical looping gasification operation, is presented.
  • Using data collected during more than 50 h of operation of a downscaled cold flow model (CFM), the hydrodynamic behavior of the hot 1 MWth setup is predicted and further evaluated.
  • A novel and robust method to calculate solids entrainment from a circulating fluidized bed (CFB) system, relying solely on pressure and temperature measurements, developed using the CFM data and validated using live data from the 1 MWth chemical looping gasifier, is presented.
What is the implication of the main finding?
  • Data from the cold flow model and the 1 MWth pilot plant show that free variations of all underlying hydrodynamic boundary conditions are viable in a given range, each resulting in a characteristic response of the dual-fluidized bed reactor system. These findings are formalized in a set of operating ground rules, applicabale to similar dual-fluidized bed systems of any scale.
  • The novel calculation approach for the solid entrainment from the CFB(s) can be applied to any fluidized bed setup, allowing for accurate determination of this crucial parameter in any process configuration.

Abstract

Chemical looping gasification (CLG) is a novel dual-fluidized bed gasification technology that allows for the production of high-calorific syngas from various solid feedstocks (e.g., biomass). Solid circulation between the two coupled fluidized bed reactors, serving the purpose of heat and oxygen transport, is a key parameter for the CLG technology, making system hydrodynamics the backbone of the gasification process. This study serves the purpose to provide holistic insights into the hydrodynamic behavior of the dual-fluidized bed reactor system. Here, special focus is placed on the operational principles of the setup as well as the entrainment from the circulating fluidized bed (CFB) reactors, the latter being the driving force for the solid circulation inside the entire reactor system. Using an elaborate dataset of over 130 operating periods from a cold flow model and 70 operating periods from a 1 MWth CLG pilot plant, a holistic set of ground rules for the operation of the reactor setup is presented. Moreover, a novel easily-applicable approach, solely relying on readily-available live data, is presented and validated using data from the 1 MWth chemical looping gasifier. Thereby, a straightforward estimation of solid entrainment from any CFB setup is facilitated, thus closing a crucial research gap.

Graphical Abstract

1. Introduction

The unhalted increase of greenhouse gases (GHG) in the earth’s atmosphere, reaching an inglorious record-high concentration of the major GHG CO2 of 421 ppm in July 2022 on Mauna Loa [1], which was obliterated again in 2023 (424 ppm), show that immediate and unparalleled changes are required to mitigate the impact of man-made climate change to manageable extents in the future. One sector is crucial in terms of climate protection and energy transition, yet not having shown any significant improvement in terms of emitted GHG in recent years [2], is the transport sector. While the electrification of passenger vehicles is in full swing [3] to reduce the footprint of personal transport on the earth’s atmosphere, other alternatives are required for other means of transport (e.g., aviation, heavy transport, shipping) [4]. One route under broad consideration is the production of 2nd generation biofuels by converting biogenic residues and wastes into high-calorific syngas, before further treatment and fuel synthesis [5,6].
Amongst others, dual fluidized bed gasification (DFBG) and chemical looping gasification (CLG) are promising gasification technologies. Here, a bed material is transferred between two reactors, transporting heat to the fuel reactor (FR), in which the solid feedstock is converted into a high-calorific syngas, from the air reactor (AR), in which air is used to combust the remaining feedstock. For the CLG technology, illustrated in Figure 1, the utilized bed material is an active bed material, not only transporting sensible heat but also lattice oxygen between the two reactors, allowing for more complete conversion of the feedstock inside the FR. This bed material is thus called an oxygen carrier (OC). Because of the continuous cyclic reduction and oxidation of the OC inside the FR and AR, CLG constitutes an oxygen-driven gasification technology, not relying on a costly air separation unit. On top of that, the CO2 generated during the autothermal gasification step can be separated efficiently from the N2-free FR producer gas in a subsequent syngas cleaning unit. Hence, net negative CO2 emissions can be realized, when employing CLG in biomass-to-biofuel process chains and utilizing sustainably sourced feedstocks [7,8,9].
Although the CLG technology has also been investigated in fixed bed reactors [10,11], generally fluidized bed setups are preferred [12,13,14], mainly due to their superior heat and mass transfer characteristics. Here, some reactor setups rely on a combination of one bubbling fluidized bed reactor and one circulating fluidized bed reactor (usually the AR) [12,14,15,16,17], while others use a dual circulating fluidized bed (CFB) layout [18,19]. While each layout exhibits advantages and disadvantages, they are related to the fact that the solid circulation between the two reactors is facilitated by the entrainment from the CFB(s) [20]. This solid circulation thus forms the backbone of the CLG technology, transporting heat and oxygen between the AR and FR [21,22], thereby allowing for a N2-free oxidation of the feedstock inside the FR and the stabilization of FR temperatures at the desired levels (i.e., >800 °C). Consequently, efficient and accurate tailoring of system hydrodynamics is indispensable for efficient CLG operation. In contrast to other CFB applications (e.g., CFB combustion), where strong solid entrainment is undesired [23], maximizing the solid entrainment from the CFB(s) is key in CLG, in order to optimize process conditions (esp. heat transport from AR to FR) [24,25].
The general behavior of bubbling and circulating fluidized bed reactors is well-known and has been studied experimentally in great detail [23]. However, due to the complexity of the heterogeneous gas-solid system, its behavior depending on numerous boundary conditions (e.g., gas velocity and solid flux), the utilized particle system, reactor size, and geometry, etc. [26,27,28,29,30,31], accurate a priori assertions on the system’s performance under novel boundary conditions remains a challenge. Although several studies have formulated semi-empirical sets of equations for modeling of fluidized beds [32,33,34,35,36,37,38], their application generally is only valid for a given range of boundary conditions. Further complexity originates when considering a coupled fluidized bed system, where two separate reactors, with a sub-set of boundary conditions, interact with each other, making the application of existing modeling approaches to describe the system’s behavior impractical. Similitude studies form an alternative to modeling approaches, allowing for the prediction of a given system based on the knowledge gained from a similar system. Here, Glicksman formulated a set of dimensionless parameters (more details see Section 3) applicable for the scaling of fluidized bed reactors [39,40,41]. In the most general sense, using these scaling relations, one is enabled to devise a simplified experimental setup, from which operation one can thus predict the behavior of the desired fluidized bed layout. The simplified set of Glicksman’s dimensionless parameters has widely been used to set up scaled-down cold flow models (i.e., fluidized bed rigs operated at ambient conditions) to successfully predict the behavior of large-scale fluidized beds operated at process conditions. A summary of selected endeavors using Glicksman’s scaling approach is given in Table 1. More recent studies show that successful scaling requires the maintaining of all micro-structures of the gas solid conditions inside the CFB, to obtain similar transport properties and hence achieve successful CFB scaling [42], putting an additional requirement on scaling endeavors.
Due to the importance of the hydrodynamic behavior of the fluidized bed system in CLG conditions, the aim of this study is to predict and optimize system hydrodynamics of the 1 MWth CLG pilot plant at TU Darmstadt via investigations in a scaled cold flow model. Through the operation of the cold flow model (CFM) with a vast set of scaled boundary conditions, a holistic set of operational rules for the coupled dual-fluidized bed reactor system was derived. Moreover, a clear-cut correlation between the utilized boundary conditions and the solid entrainment from both risers of the reactor system was observed. Based on this dataset, a novel method to estimate the solids entrainment, solely based on temperature and pressure measurements, was developed. Ultimately, the knowledge gained via the operation of the CFM was transferred to the 1 MWth CLG unit. Here, it was shown that the operational principles derived at cold conditions allow for stable hydrodynamic operation of the hot gasification system. Consequently, it is inferred that the basic operational rules are also applicable to other reactor setups. Furthermore, the novel method for estimation of the solid entrainment from the CFBs was successfully transferred to the hot conditions in the 1 MWth CLG unit, thus allowing for a straightforward estimation of solid circulation between AR and FR, solely using pressure and temperature data.

2. Experimental

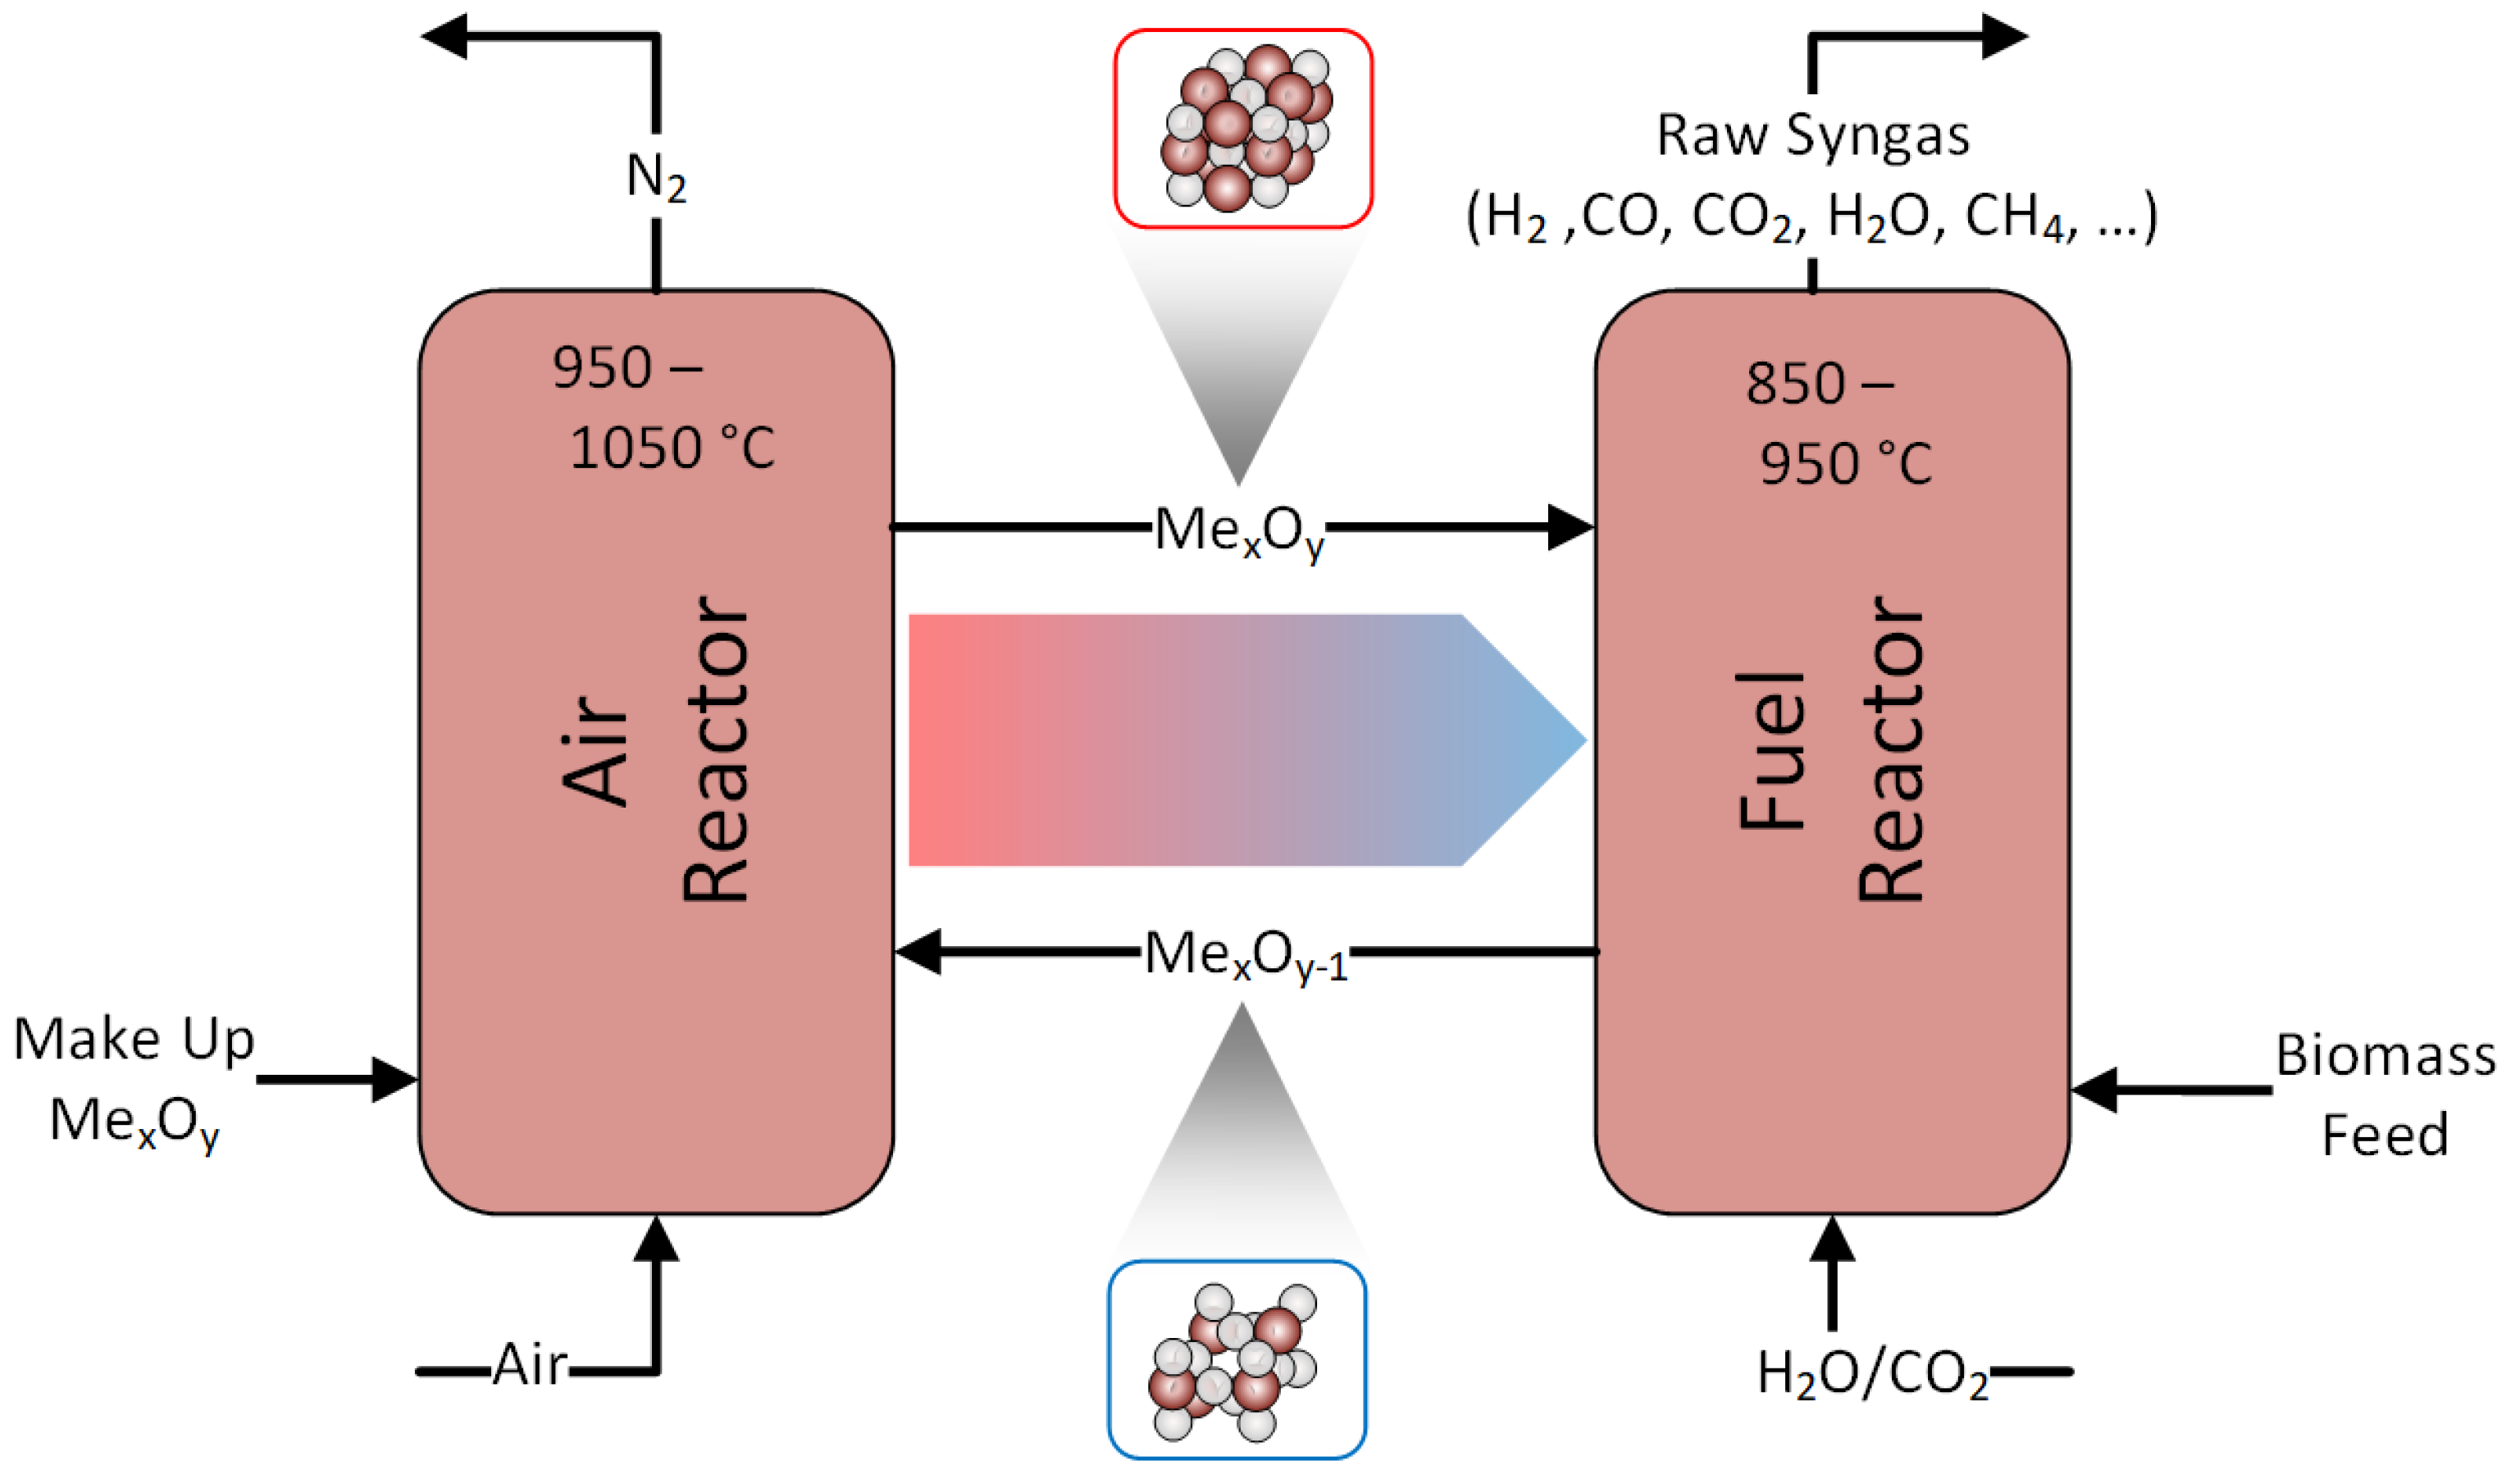
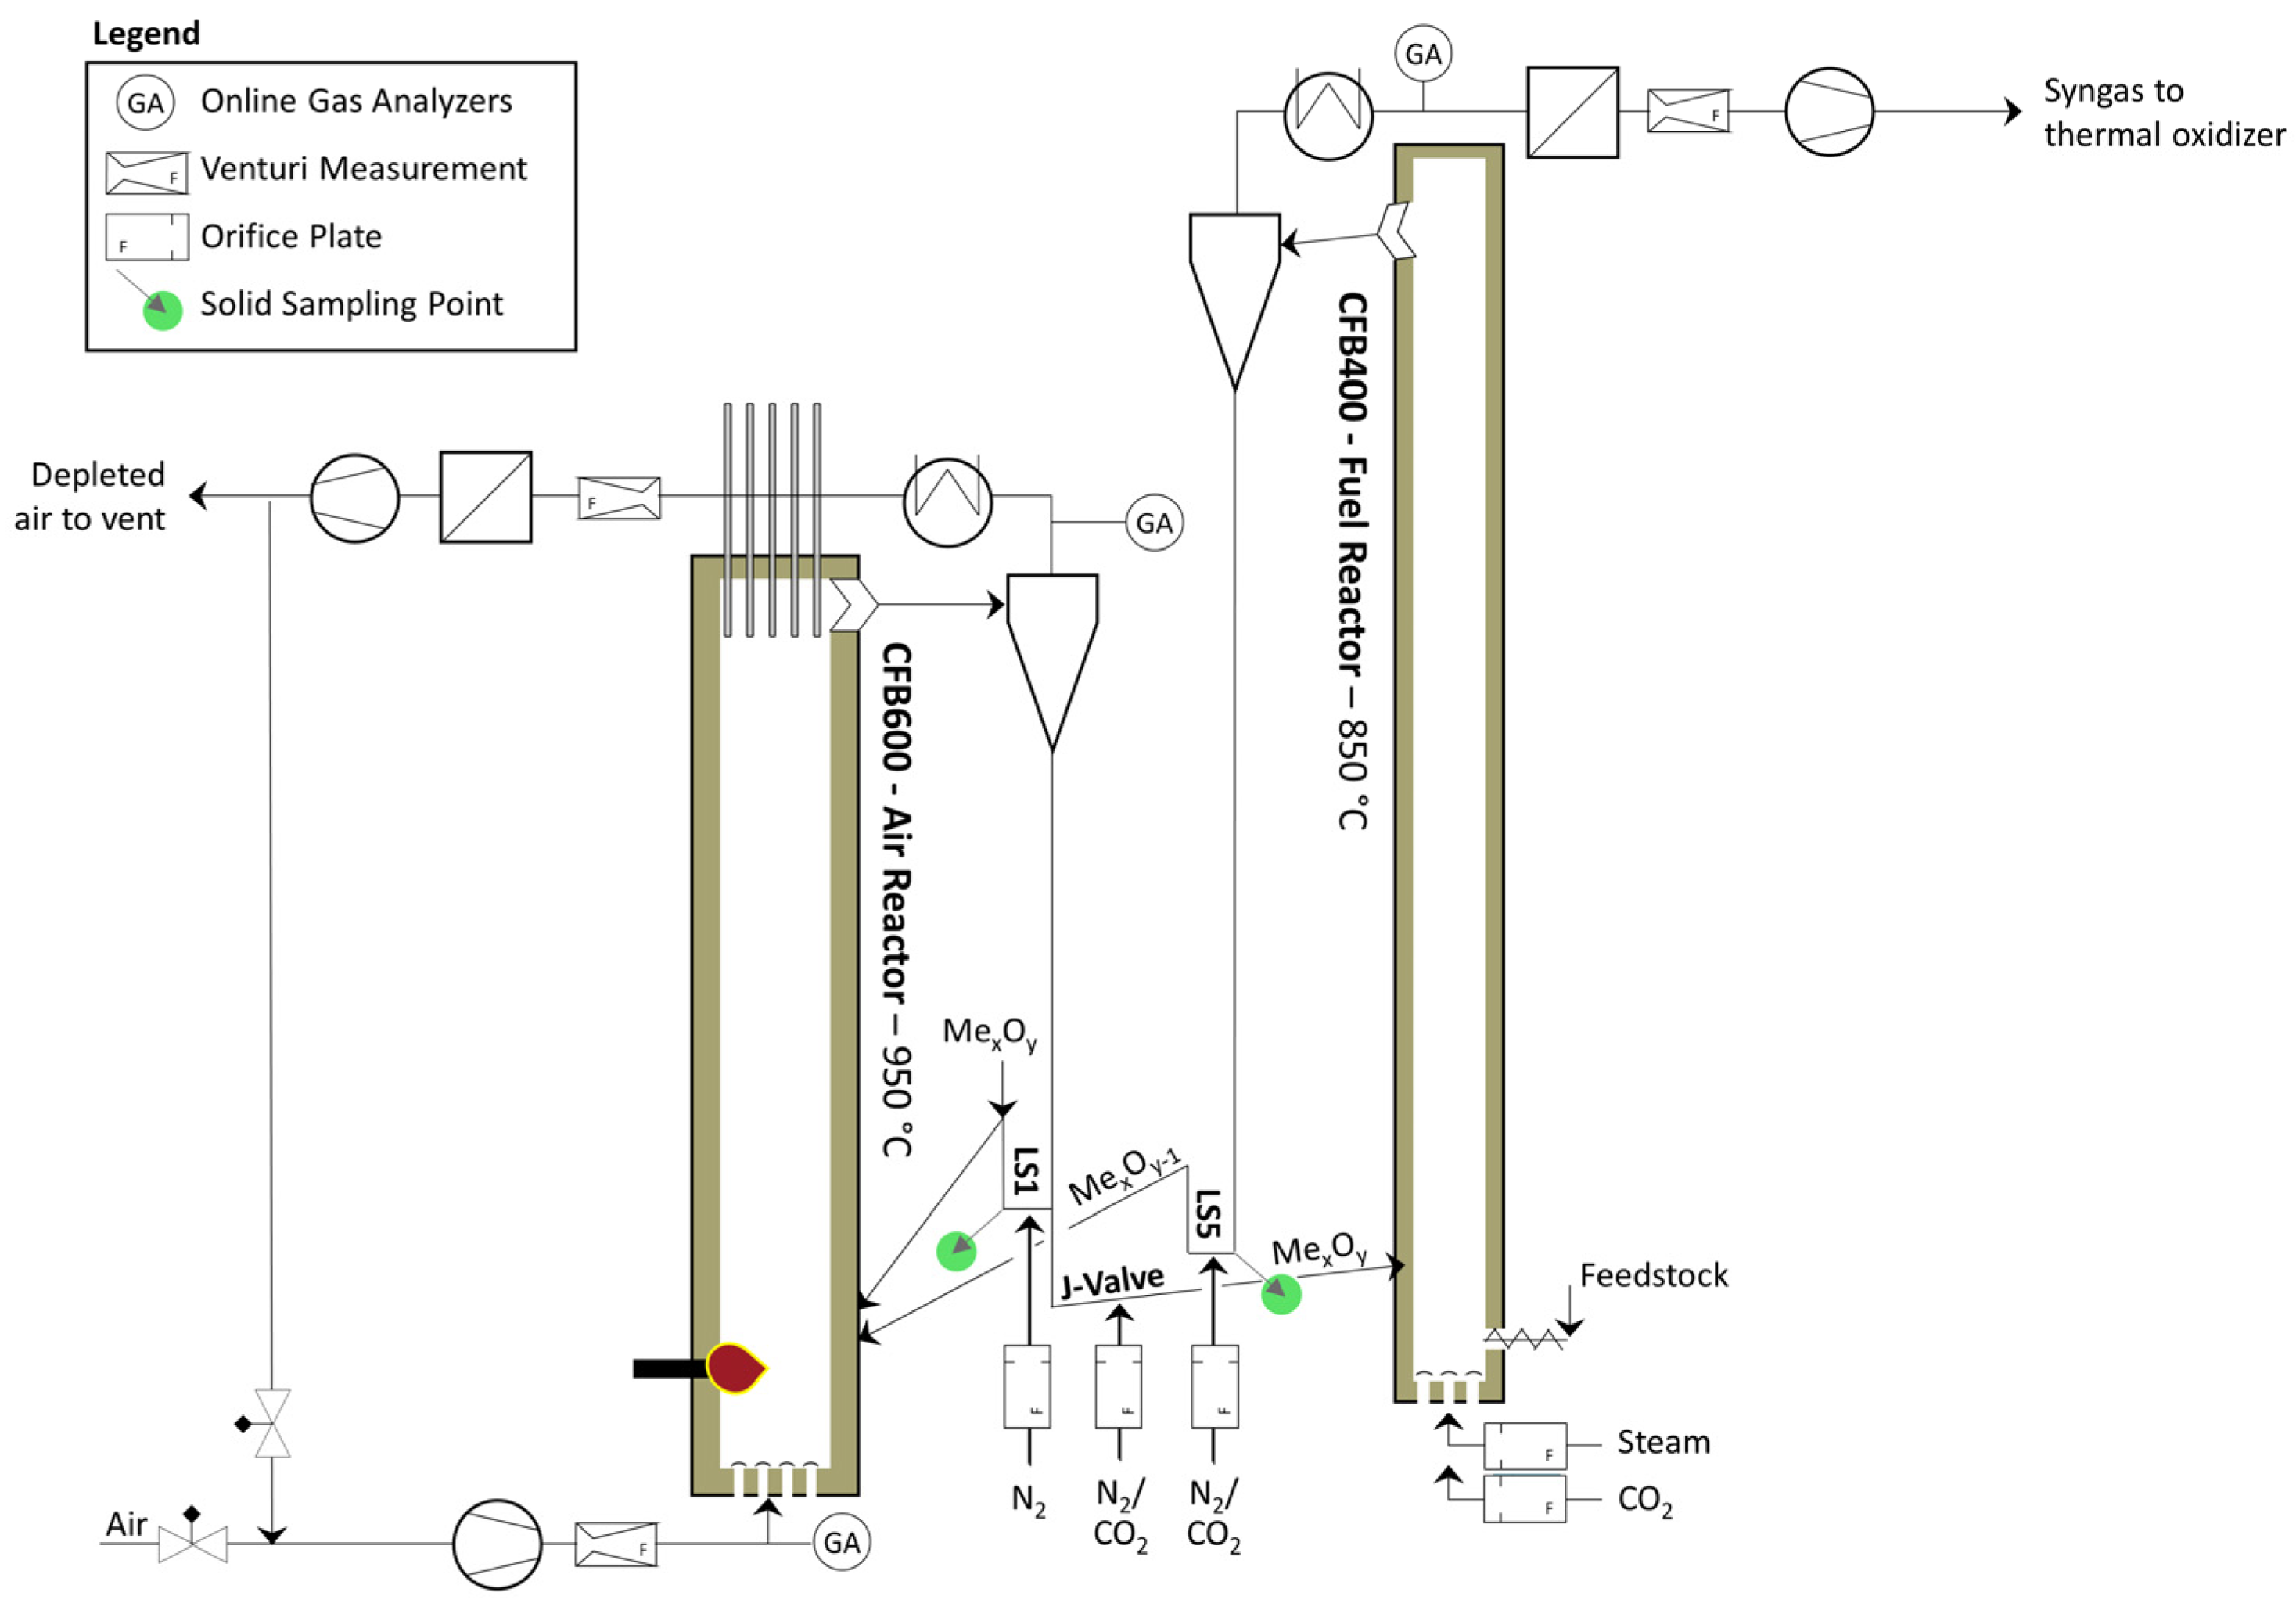
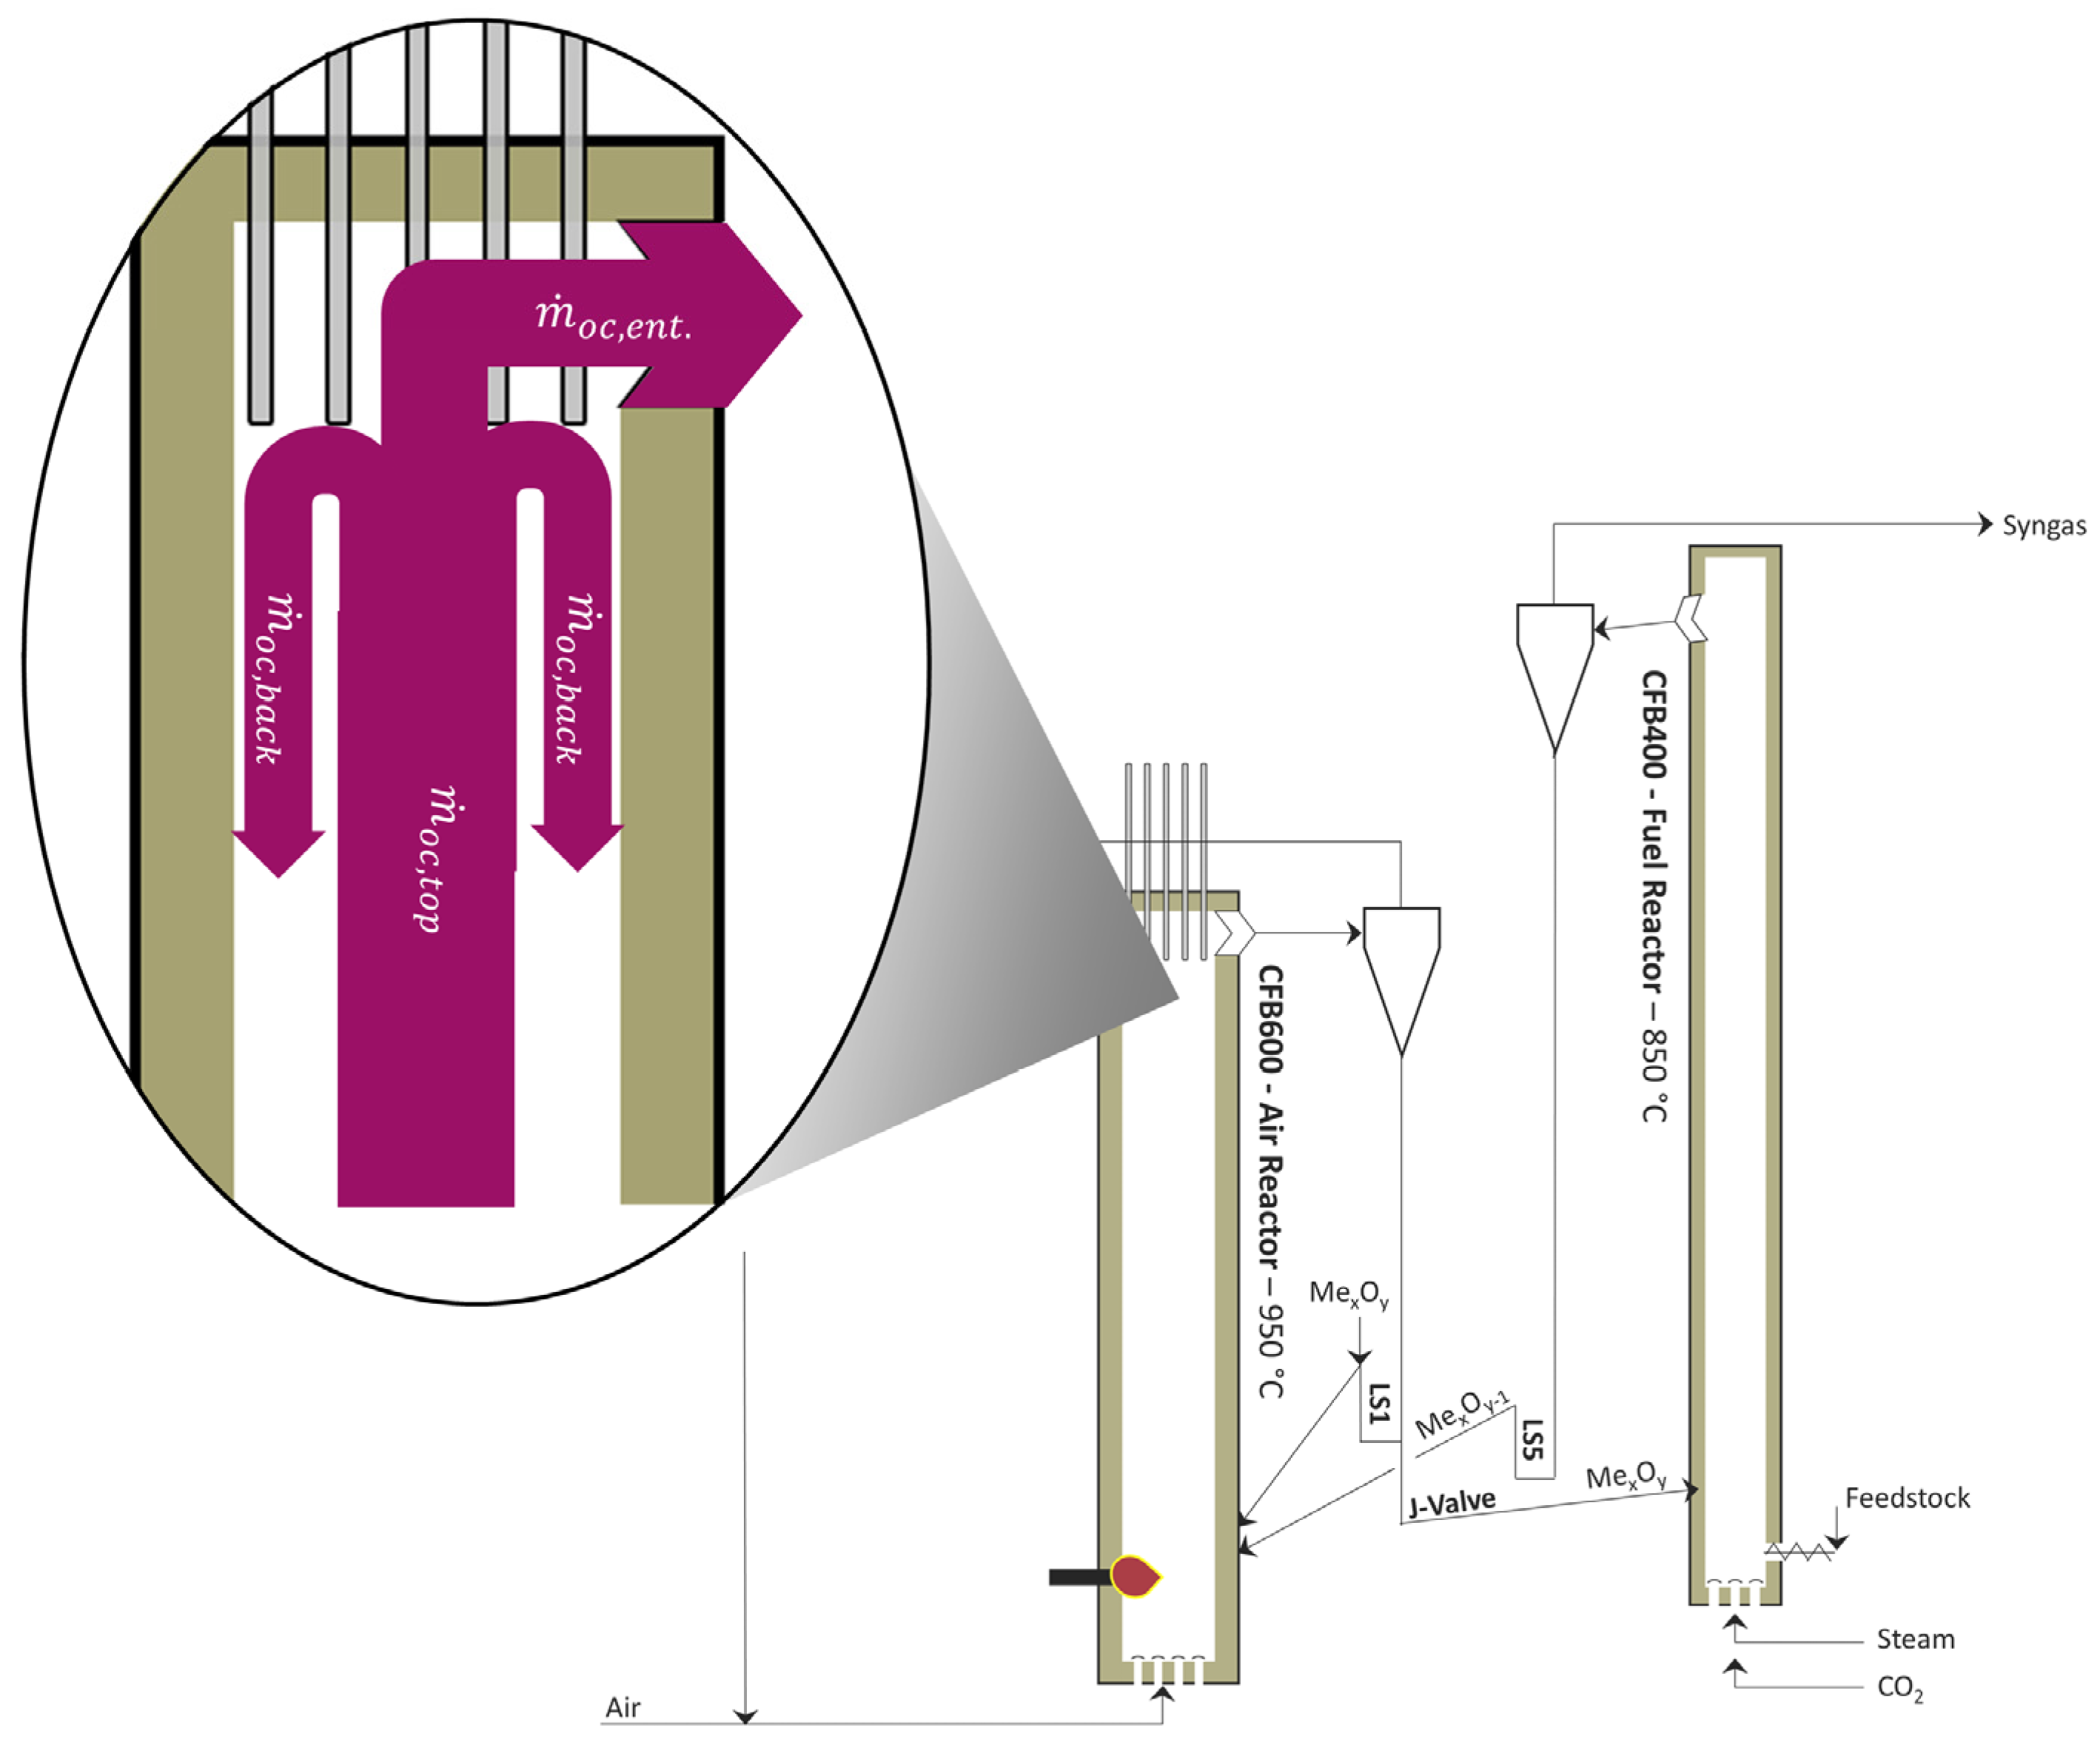
2.1. 1 MWth Pilot Plant

1 Pilot Plant Layout

Marx et al. [18] previously presented a detailed description of the layout of the 1 MWth CLG pilot plant, schematically shown in Figure 2. Hence, the subsequent elucidations will be restricted to the most crucial plant components for brevity.
The CLG reactor system consists of an air reactor (0.59 m inner diameter, 8.66 m height), a fuel reactor (0.4 m inner diameter, 11.35 m height), and three coupling elements (two loop seals and a J-valve). To reduce heat losses and hence allow for autothermal operation (i.e., without electrical heating), the entire system is refractory lined. During CLG operation, the system is filled with 1–1.2 t of OC material. To map the solids distribution in each riser, both risers are equipped with pressure sensors located at different heights (see Table 2). Fluidization of the AR, which has a design temperature of 1050 °C, is possible with air or a mixture of air and recycled flue gas. AR inlet gases can be electrically pre-heated to temperatures up to 375 °C. The gas composition (O2, CO2) of the AR inlet gases is continuously being measured due to process control reasons [24,25]. Fluidization of the fuel reactor, having a design temperature of 970 °C, can be achieved with air, steam, a mixture of steam and CO2, or a mixture of air and CO2. Similar to the AR, FR inlet gases can be electrically pre-heated to temperatures up to 450 °C. The AR and FR are each equipped with a cyclone for gas-solid separation and a loop seal to prevent bypassing of gases. By altering fluidization velocities of the J-valve (N2 or CO2), which connects the loop seal (LS) of the AR (LS1) with the fuel reactor, global solid circulation between the two reactors can be adjusted. All entrained material leaving the FR riser is directly transferred into the AR via LS5, which is fluidized with CO2 or N2. On the other hand, the option of internal solid circulation via LS1 fluidized with N2, exists for the AR. Each loop seal is equipped with a solid sampling device, allowing for the controlled removal of OC samples during operation (more details on the sampling procedure are provided by Marx et al. [50]). Using an oil-cooled feeding screw, a feedstock input of up to 340 kg/h, corresponding to a thermal power of about 1.7 MW (feedstock: PFR), can be introduced into the dense bed of the FR. Downstream of the cyclone, the FR product gas passes a syngas cooler, where it is cooled to a temperature of approx. 350 °C. At the syngas cooler outlet, the composition (CO, CO2, O2, H2, CH4) and the flow rate of the FR product gas are measured online. Before transferring the FR product gas to the stack, it is firstly transferred through a hot gas filter, operated at up to 250 °C, using an induced draft fan. Subsequently, it enters a thermal oxidizer where all hydrocarbon species are fully converted to CO2 and H2O. After online gas sampling (CO, CO2, O2, SO2, NO), the AR product gases are cooled in a heat exchanger to temperatures below 350 °C. Thereafter, particulate matter is removed from the gas stream in a fabric filter. As for the FR, the AR freeboard pressure is controlled with an induced draft fan. Downstream of the induced draft fan, the AR product gases can either be vented to the environment through a stack or can be partly recycled back to the AR airbox via the primary-air fan. Bed material reactor inventories are maintained at the desired levels throughout operation using a make-up feeding system, which allows for the controlled feeding of up to 200 kg/h of ilmenite (ILMf) into the standpipe of LS1 via a dosing screw.

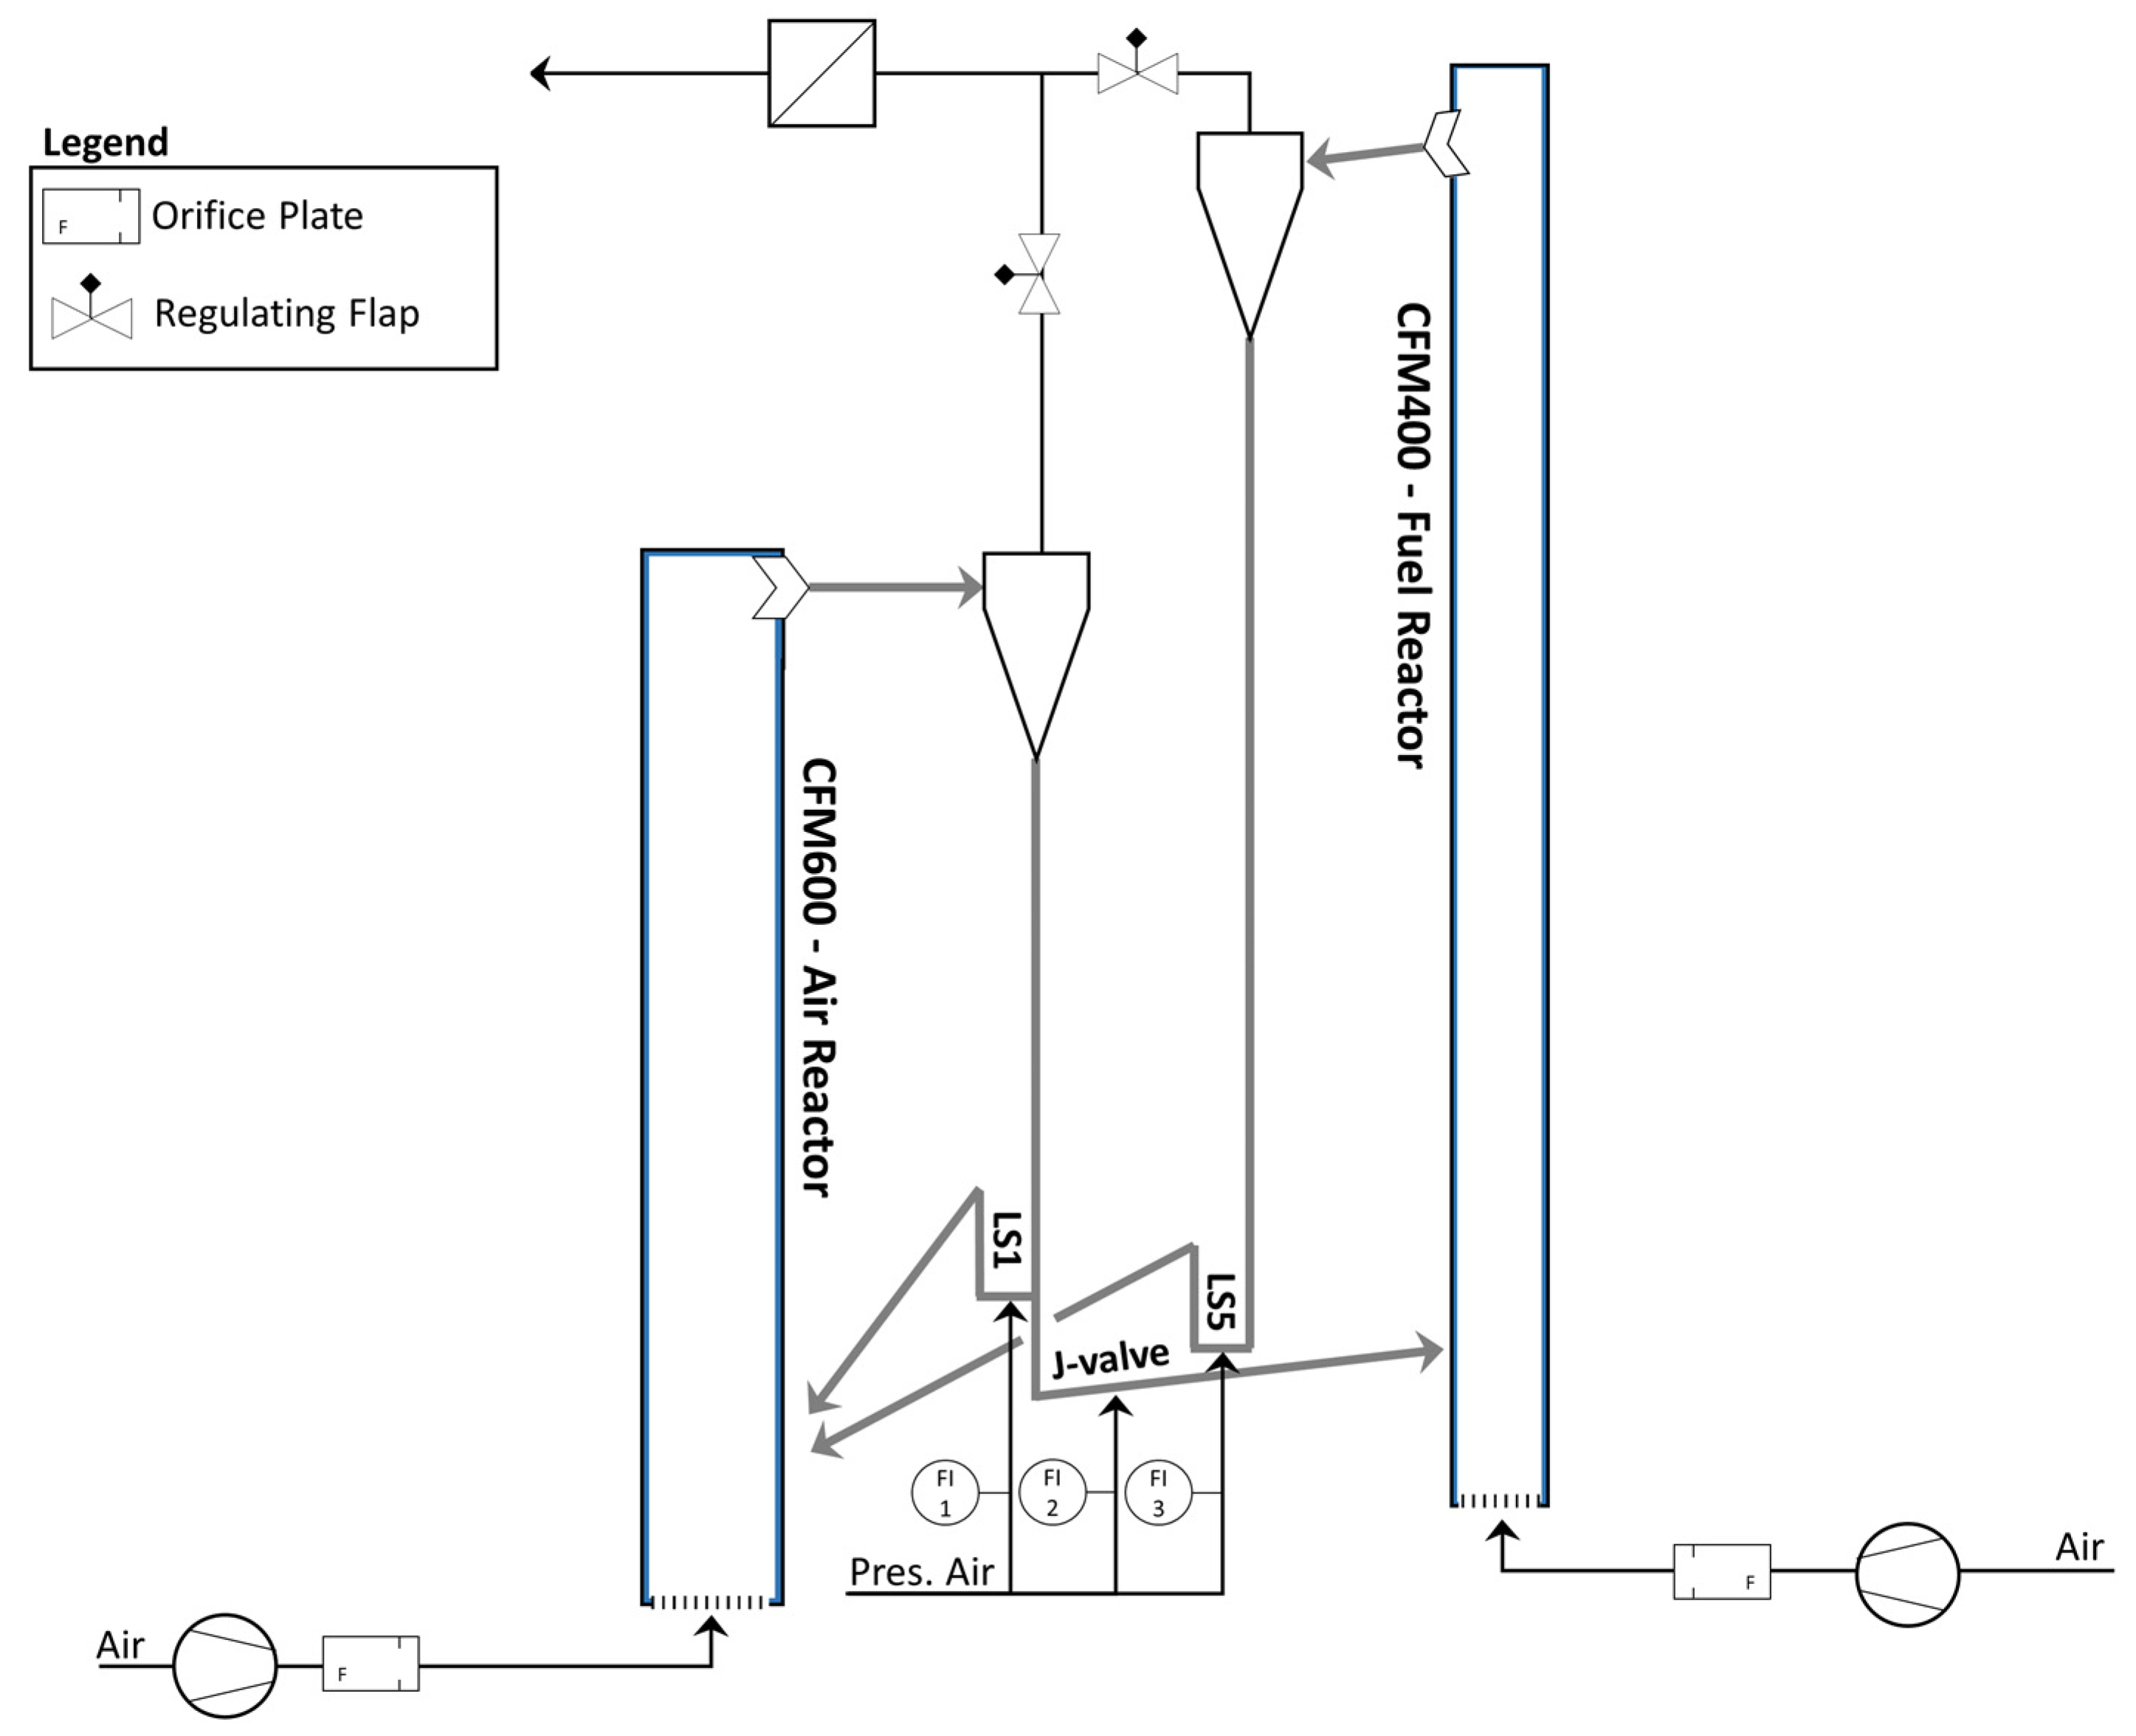
2.2. Cold Flow Model

Just like the 1 MWth pilot plant, the cold flow model (CFM) consists of two circulating fluidized bed reactors coupled with two loop seals and a J-valve (see Figure 3). Dimensions of the cold flow model are summarized in Table 5, indicating that all dimensions were scaled with a factor of 0.3264 (more details see Section 3). The two cyclones pose an exception to this, having been scaled so that particle separation at similar efficiencies as for 1 MWth pilot plant are attainable for the CFM. The FR riser and all coupling elements are made of Plexiglas, allowing for visual observation during operation, whereas the AR riser and both cyclones are made of steel. Fluidization of the two risers is achieved via two air fans, their rotary speeds being controlled via frequency converters. Each primary-air line is equipped with an orifice plate measurement, consisting of two pressure measurements and temperature measurements. An implemented PID controller thus allows for accurate control of the fluidization velocity via the frequency converters. The two loop seals and the J-valve are fluidized with pressurized air, with the inlet flow being adjustable via manual rotary meters. To measure the pressure gradient over the CFM, it is equipped with multiple pressure sensors, being located inside the AR riser, the FR riser (see Table 3), in the three coupling elements, and two at the outlet of the two cyclones.
At the top of the cyclones of both risers, a duct combines the two streams and transfers the gas into a filter, before venting into the atmosphere. Hence, the CFM is operated at slight overpressures induced by the pressure drop over the duct and filter. To adjust the riser overpressure for the AR and FR independently, two gas flaps are located downstream of the two cyclones.

2.3. Materials

2.3.1. Bed Materials

The ilmenite, which was used as bed material during the 1 MWth CLG experiments, was procured from Titania AS (Tellenes, Norway). The same material was previously successfully deployed for chemical looping experiments in the 1 MWth pilot [21,51,52]. During material characterization (more details see Section 2.6), a bulk density of 2550 kg/m3, a particle density of 4486 kg/m3, and a mean particle diameter of 111 µm (dp,10 = 31 µm, dp,90 = 224 µm) were determined for the fresh OC material. For selected operating periods, a different type of ilmenite from the Norwegian Company Titania AS was used (more details, see Section 2.4.1). This coarser material (ILMc) exhibits a bulk density of 2336 kg/m3, a particle density of 4621 kg/m3, and a mean particle diameter of 199 µm (dp,10 = 151 µm, dp,90 = 247 µm) in fresh delivery condition.
Bronze powder from the supplier Makin Metal Powders (Rochdale, UK) was used for the experiments in the scaled cold flow model (see Section 2.2). The fresh powder exhibits a bulk density of 5477 kg/m3, a particle density of 8710 kg/m3, and a mean particle diameter of 56 µm (dp,10 = 28 µm, dp,90 = 76 µm).

2.3.2. Feedstocks

Three different biomass feedstocks were used within three dedicated 1 MWth CLG test campaigns. During the first test campaign (K1), industrial wood pellets (IWP) conforming to the Norm ENPlus A1, purchased from Eckard GmbH (Lützelbach, Germany), were used. The pellets exhibit a cylindrical shape (l ~10–25 mm, d ~6 mm), a bulk density of 650 kg/m3, and a lower heating value of 17.96 MJ/kg. During the second test campaign (K2), pine forest residue pellets (PFR) from AB Torkapparater, Sweden, were used. The pellets also were cylindrical (l ~8–12 mm, d ~6–8 mm), exhibiting a bulk density of 630 kg/m3 and a lower heating value of 18.3 MJ/kg. For the third test campaign (K3), cylindrical (l ~8–12 mm, d ~6–8 mm), pre-treated wheat straw pellets (WSP), from AB Torkapparater (Stockholm, Sweden), with a bulk density of 504 kg/m3 and a lower heating value of 16.6 MJ/kg were used. The proximate and ultimate analysis of all pellet types are given in Table 4.

2.4. Operating Conditions

2.4.1. 1 MWth Chemical Looping Gasifier

In 2022, the modular 1 MWth pilot plant at TU Darmstadt was continuously operated (24 h/day) as an autothermal chemical looping gasifier for approximately 14 days each, in three separate test campaigns, yielding >400 h of chemical looping operation.
Within the first test campaign (K1), approx. 100 h of chemical looping operation were attained, using industrial wood pellets as the feedstock and fine ilmenite (ILMf) as the bed material. To allow for meaningful assessments and exemplifications of crucial trends, thirty operating periods (BP) were selected for analysis. During each BP, the most important boundary conditions, summarized in Table S1 in the Supplementary Material, were kept constant. In-between adaptions of those conditions, the system was left for stabilization, which was usually achieved within 15 min during which the OC inventory undergoes one full cycle through the system [50]. From these 30 operating periods, nine operating periods, during which loop seal samples were collected, are investigated in greater detail. Moreover, all 30 operating periods were split into 20-min intervals, yielding a total of 177 sub-periods for in-depth analysis in Section 4.1.2.
During the second test campaign (K2), the 1 MWth pilot plant was operated using pine forest residue pellets as the feedstock, resulting in more than 200 h of successful chemical looping operation. From these 200 h of operation, 35 operating periods, during which the most important boundary conditions were kept constant and loop seal samples were collected, were selected for subsequent analysis (boundary conditions see Table S2 in the Supplementary Material). Throughout the first section of K2, coarse ilmenite (ILMc) was used as the make-up bed material before it was replaced with fine ilmenite (ILMf) in the later stages of the second test campaign. For initial reactor filling at the start of K2, old bed material from K1 was used.
During the third test campaign (K3), the 1 MWth pilot plant was operated using pre-treated wheat straw pellets as the feedstock and fine ilmenite (ILMf) as the bed material. (Coarse ilmenite (ILMc) was utilized during system-start up, but was replaced with fine ilmenite (ILMf), before initiation of chemical looping operation). Here, the pilot plant was successfully operated in chemical looping mode for a total of ∼80 h, from which five operating periods, during which the most important boundary conditions were kept constant and loop seal samples were collected, were selected for subsequent analysis (boundary conditions see Table S3 in the Supplementary Material).

2.4.2. Cold Flow Model

In contrast to the 1 MWth pilot plant, the cold flow model (CFM) was operated over short periods (1–6 h), allowing for targeted investigations of individual operating conditions. Prior to the start of the cold flow model, it was filled with the desired amount of bed material. Here, it was safeguarded to sufficiently fill the two loop seals in order to avoid gas bypassing during system startup. Generally, the system was filled with an inventory between 50–120 kg. Subsequently, loop seal fluidization was started for LS1 and LS5 to allow for material transport through both seals before starting AR fluidization. When solid circulation was observed for the AR, FR and J-valve fluidization were started in quick succession to allow for material transport through the J-valve and entrainment from the FR and hence stable global solid circulation. When all boundary conditions (u0,AR, u0,FR and J-valve fluidization) were set to the target values, the system was left for stabilization for approx. 2–3 min. Thereafter, pressure and temperature signals were recorded for a minimum of 10–15 min, to allow for calculation of mean values for all system variables over a sufficiently long period. After successfully recording one operating period, data recording was terminated without changing the boundary conditions. Subsequently, entrainment was measured using the method described by Pröll et al. [20], i.e., by briefly terminating LS fluidization in one of the loop seals and measuring material accumulation in the LS stand-pipe (see Equation (19)). Following the measurement, LS fluidization was restarted, and the system was left for stabilization before initiating the subsequent entrainment measurement. A minimum of three entrainment measurements was carried out for each operating period for each reactor.
With this approach, a total of 128 operating periods with varying riser gas velocities, J-valve fluidization, and reactor inventories were investigated, yielding a dataset containing data from more than 50 h of CFM operation.

2.5. Evaluation Parameters

In this section, the most important evaluation parameters utilized for assessment of the system hydrodynamics in the CFM and 1 MWth pilot plant are briefly introduced.
The gas velocity in each riser is calculated by correcting the measured norm volume flow with the average riser temperature ( T R ) and dividing it by the cross-sectional area of the riser:
u 0 = V ˙ n · T R T A R
For the CFM, the norm volume flow was measured via orifice plates located upstream of the reactor inlet, whereas venturi measurements in the AR and FR product gas lines were used to calculate V ˙ for the 1 MWth pilot plant.
The pressure drop over each riser was defined as the pressure difference between the lowermost (1) and uppermost (N) pressure sensor in each riser (see Table 2 and Table 3):
Δ p = p 1 p N
Using the pressure drop over each riser, the reactor inventory was calculated using the earth’s gravity ( g ) and the riser diameter ( A R ) via:
m i n v . = Δ p · A R g
The solids concentration at any given location inside the riser was calculated by assuming that the pressure drop between two measurement ports is solely induced by the fluidized solids, yielding [23]:
ε s , i = ( p i + 1 p i ) ρ p · g · ( z i + 1 z i )
The particle Reynolds number is calculated using the gas velocity, particle diameter, and gas data:
R e = u 0 · d p · ρ g μ g
The Archimedes number for each solid-gas system is given by:
A r = d p 3 · ρ g · ( ρ p ρ g ) · g μ g 2
To be able to quantify the flow patterns of the particles at the riser outlet, the Stokes number is introduced:
S t k = d p 2 · ρ p · u 0 18 · μ g · D 2
Using the dimensionless numbers, the dimensionless particle diameter and velocity can be calculated via [23]:
d p * = A r 1 3
u * = R e A r 1 3
The terminal velocity of the particles inside the riser was calculated via [23]:
u t = [ 18 d p * 2 + 2.335 1.744 · ϕ s d p * 0.5 ] 1 · [ ρ g 2 μ g · ( ρ p ρ g ) · g ] 1 3 ,
thus yielding the effective slip velocity of particles suspended in the gas stream [23]:
u p = u 0 u t
The Reynolds number at minimum fluidization velocity of the ilmenite and bronze particles in the respective fluid was calculated by [23]:
R e m f = ( 28.7 2 + 0.0494 · A r ) 0.5 28.7 ,     for   d p * < 50 ( 33.7 2 + 0.0408 · A r ) 0.5 33.7 ,     for   d p * 50 ,
subsequently allowing for a direct calculation of the minimum fluidization velocity u m f via Equation (5).
As a reference for the experimentally determined values, the saturation carrying capacity is calculated by the approach of Geldart et al. [53,54]:
G s * = 23.7 · ρ g · u 0 · e 5.4 · u t u 0
Furthermore, the approach by Breault et al. [38] is used:
G s * = 51 · u 0 0.19 · d p 0.5 A r 1.2 · D R 1.5
From the values of G s * , calculated via Equations (13) and (14), the solids concentration of a saturated gas stream can be calculated via:
ε s * = G s * ρ p · u p
On the basis of the data collected in the CFM, an equation for the calculation of the entrainment from the riser based on Equation (15), is formulated:
G s , c a l c = e n t . · ε s , e · ρ p · u p
Here, e n t . signifies the entrainment probability of the particles at the top of the riser, either leaving the riser towards the cyclone or traveling back along the riser walls, which is illustrated in Figure 4. A similar parameter called the backflow ratio ( k b ), was previously introduced by Pallares and Johnson [35]:
e n t . = m ˙ o c , e n t . m ˙ o c , t o p = m ˙ o c , e n t . m ˙ o c , e n t . + m ˙ o c , b a c k = 1 1 + k b
Secondly, the solid concentration at the reactor exit ( ε s , e ) is introduced to be able to approximate the solids flow in the riser freeboard:
ε s , e = ( δ p δ z ) F B · 1 g · ρ p
Instead of only using the two uppermost pressure sensors to calculate the pressure gradient over the freeboard via Equation (4), ε s , e is approximated by calculating the slope of the pressure profile in the freeboard ( δ p δ z ) F B via a linear regression over the three topmost pressure sensors, thereby increasing robustness of the method. This approach thus builds on the findings of Chen et al. [34], who found a positive correlation between the pressure drop in the freeboard and solids entrainment from the riser.
Finally, the actual solid entrainment for the CFM is calculated using the change in height ( Δ z m e a s . ) of the solid bed accumulating inside the loop seal standpipe ( A S P ) during the measurement time ( t m e a s . ):
G s c = ρ b u l k · A S P · Δ z m e a s . t m e a s . · A R
On the other hand, the solid circulation in the 1 MWth CLG unit is calculated using the method described by Marx et al. [50], relying on an oxygen balance around the AR and the oxidation degree of solid samples collected from each loop seal:
G s h = m ˙ O , i n , A R m ˙ O , o u t , A R ( X S , A R X S , F R ) · R O C · A R
From both values, the actual entrainment mass flow can be calculated by:
m ˙ e n t . = G S · A R

2.6. Material Characterization

Solid materials collected from both loop seals (see Tables S1–S3 in the Supplementary Material) were analyzed using different lab techniques in order to allow for the subsequent calculation of important evaluation parameters (see Section 2.5).

2.6.1. Particle Size Distribution (PSD) and Mean Particle Diameter

The particle size distribution of the fresh materials and solid loop seal samples collected during operation from the 1 MWth unit was determined according to the norm DIN66165, using an air jet sieve type LS200-N by the company Hosokawa Alpine AG (Augsburg, Germany). Each PSD was determined singularly. Based on the measured PSD, integral parameters, such as the mean particle diameter, were calculated for each bulk material.

2.6.2. Bulk Density

Bulk densities for fresh materials and solid samples were determined using a self-made setup conforming to the norm ISO 697 [55]. Values were determined in triplicates.

2.6.3. Particle Density

Particle densities for fresh materials and solid samples were determined according to the norm DIN EN ISO 1183 [56], using water pycnometry in calibrated 25 and 50 mL pycnometers by Carl Roth (Karlsruhe, Germany). Prior to the measurements, the pycnometers were recalibrated using water at room conditions. During pycnometry, water temperatures were measured to account for the impact of changing room temperatures on water densities. All values were determined in duplicates. In case of strong deviations (>15%) for two corresponding values, a third value was determined.

2.6.4. Oxidation Degree

In chemical looping, the oxidation degree (Xs) of the OC is generally given by [57,58]:
X s , i = m O C , i m O C , r e d R O C · m O C , o x .
Here, m O C , r e d and m O C , o x are the mass of an OC sample in a fully reduced and oxidized state, respectively, while m O C , i is the mass of the OC sample in its current state.
In the current study, the oxidation degree of the solid samples collected from the 1 MWth pilot plant was determined using the method by Marx et al. [50]. Here, the mass of loop seal samples before ( m L S , 1 ) and after ( m L S , 2 ) oxidation in a laboratory oven as well as the carbon content ( w C , L S , f i n e ) determined in an elemental analyzer are used to calculate the oxidation degree of the OC:
X s , i = m L S , 1 · ( 1 w C , L S , f i n e ) m L S , 2 · ( 1 R O C )   R O C · m L S , 2 = 1 m L S , 2 m L S , 1 · ( 1 w C , L S , f i n e )   R O C · m L S , 2
The calculated values for Xs can then be utilized to determine the solid circulation via Equation (20).

3. Scaling Theory

The cold flow model of the 1 MWth pilot plant constitutes a scaled-down version of the 1 MWth CLG reactor system [18], with a scaling factor of 0.3624:
L s c = H c H h = D c D h
To be able to select suitable boundary conditions for scaling, the simplified set of scaling laws by Glicksman et al. [41] was used:
u 0 2 g · D ,   ρ p ρ g ,   u 0 u m f ,   G s u 0 · ρ p ,   H D ,   ϕ p ,   P S D  
Here, the individual dimensionless numbers signify the Froude number, the solid-gas density ratio, the ratio between gas velocity and minimum fluidization velocity, the dimensionless particle entrainment, the geometrical ratio, the particle sphericity and the particle size distribution, in that order.
To allow for model scaling, the data for the 1 MWth CLG unit was firstly compiled. For the particle data, figures for ilmenite used during chemical looping combustion operation were adapted from literature [59,60]. For gas properties (density and viscosity), temperatures and gas composition from estimated heat and mass balances for CLG operation were utilized [24]. Lastly, for the solid circulation, gas velocities, and pressure drops in the 1 MWth CLG unit, data from previous CLC experiments conducted in the 1 MWth unit were taken as a reference [51,52]. These figures are summarized in Table 5. Subsequently, gas density and viscosity for the CFM were calculated, for ambient pressure and temperature for air. In a last step, a suitable bed material, fulfilling the dimensionless parameters from Equation (25) as closely as possible, had to be determined. Ultimately, bronze powder with an average particle diameter of 57 µm, fulfilling the given criteria to the greatest extent, while also allowing for economically viable and safe operation, was chosen. To calculate the dimensionless groups for the 1 MWth CLG unit and the CFM, u 0 , G s , and Δ p for the CFM where calculated via:
u 0 c = L s c · u 0 h
G s c = G s h · L s c · ( ρ p c ρ s h )
Δ p c = L s c · Δ p h · ( ρ p c ρ s h )
A derivation for these expressions is provided in Appendix A.
By using the numbers listed in Table 5, one can thus calculate the dimensionless numbers for the 1 MWth unit and the CFM, summarized in Table 6. The quotient of the Froude number can be set to unity for both reactors by adjusting the (scaled) gas velocity accordingly. For the quotient of the density ratios, a value of 0.43 is obtained for AR and FR. This deviation can mainly be related to the fact that material selection for the CFM is limited, while the density of air at ambient conditions is significantly higher than that of the AR and FR product gases during CLG operation. For the quotient of the velocity ratio, similar values (i.e., around 0.4) are obtained, which again be related to material selection. (Minimum fluidization velocities were calculated, using solid and gas phase data via Equations (5) and (12)). Values closer to unity would be obtained for a denser material or a material with a larger particle diameter for the given particle density. While the former is not possible for safety and/or economic reasons, the latter would lead to a deviation for other dimensionless parameters listed in Equation (25). However, it was found in the literature that good scaling agreement was obtained even when the density ratio was not considered for CFB scaling [26]. However, it has to be noted that due to the difference in density ratios, the bronze powder falls onto the Geldart A/B transition regime, whereas the ilmenite powder is Type B, increasing overall uncertainty [42]. The quotient for the fourth dimensionless group, the dimensionless entrainment, is equal to one, as it is expected that the entrainment ( G s ) follows the scaling laws. The geometric similitude is given for both risers, which can be seen when considering the height/diameter ratios listed in Table 6. Finally, another dimensionless group previously used in the literature [20,43], which relates the mean particle and reactor diameter, is also provided in Table 6, as it yields the possibility of quantifying to which extent the PSDs in the hot and cold unit match one another. As visible from the figures presented in Table 6, excellent agreement is also attained for this dimensionless group for the 1 MWth unit and the CFM. This can be explained by the fact that the Bronze powder used for experiments in the CFM was selected in such a way that its PSD closely matches that of the ilmenite utilized for CLG operation in the 1 MWth unit, which is also visible in Figure 5. (Due to prior experience with chemical looping operation in the 1 MWth pilot plant [21,51,52], the effect of continuous operation on the PSD could be considered here, i.e., the PSD of the bronze powder was tuned in such a way that it matches used ilmenite particles, as opposed to the fresh material, subsequently yielding a better comparability of the resulting data).
Upon consideration of the data provided in Table 6, it can thus be summarized that a good agreement between the dimensionless parameters of the 1 MWth unit and the cold flow model is attained. Hence, the similitude of the governing hydrodynamic phenomena in the two reactor setups can be assumed. Thus, qualitative and quantitative scaling of the results obtained in the CFM to 1 MWth scale is deemed viable.

4. Results and Discussion

Using data from the cold flow model as well as from the 1 MWth pilot plant, the overall hydrodynamic behavior of the coupled dual fluidized system will firstly be evaluated in Section 4.1. Subsequently, the effect of the most important boundary conditions and operating variables on solid entrainment from both reactors in the cold and hot system will be investigated in Section 4.2 before a novel approach to predict solids entrainment solely on pressure and temperature measurements will be presented in Section 4.3.

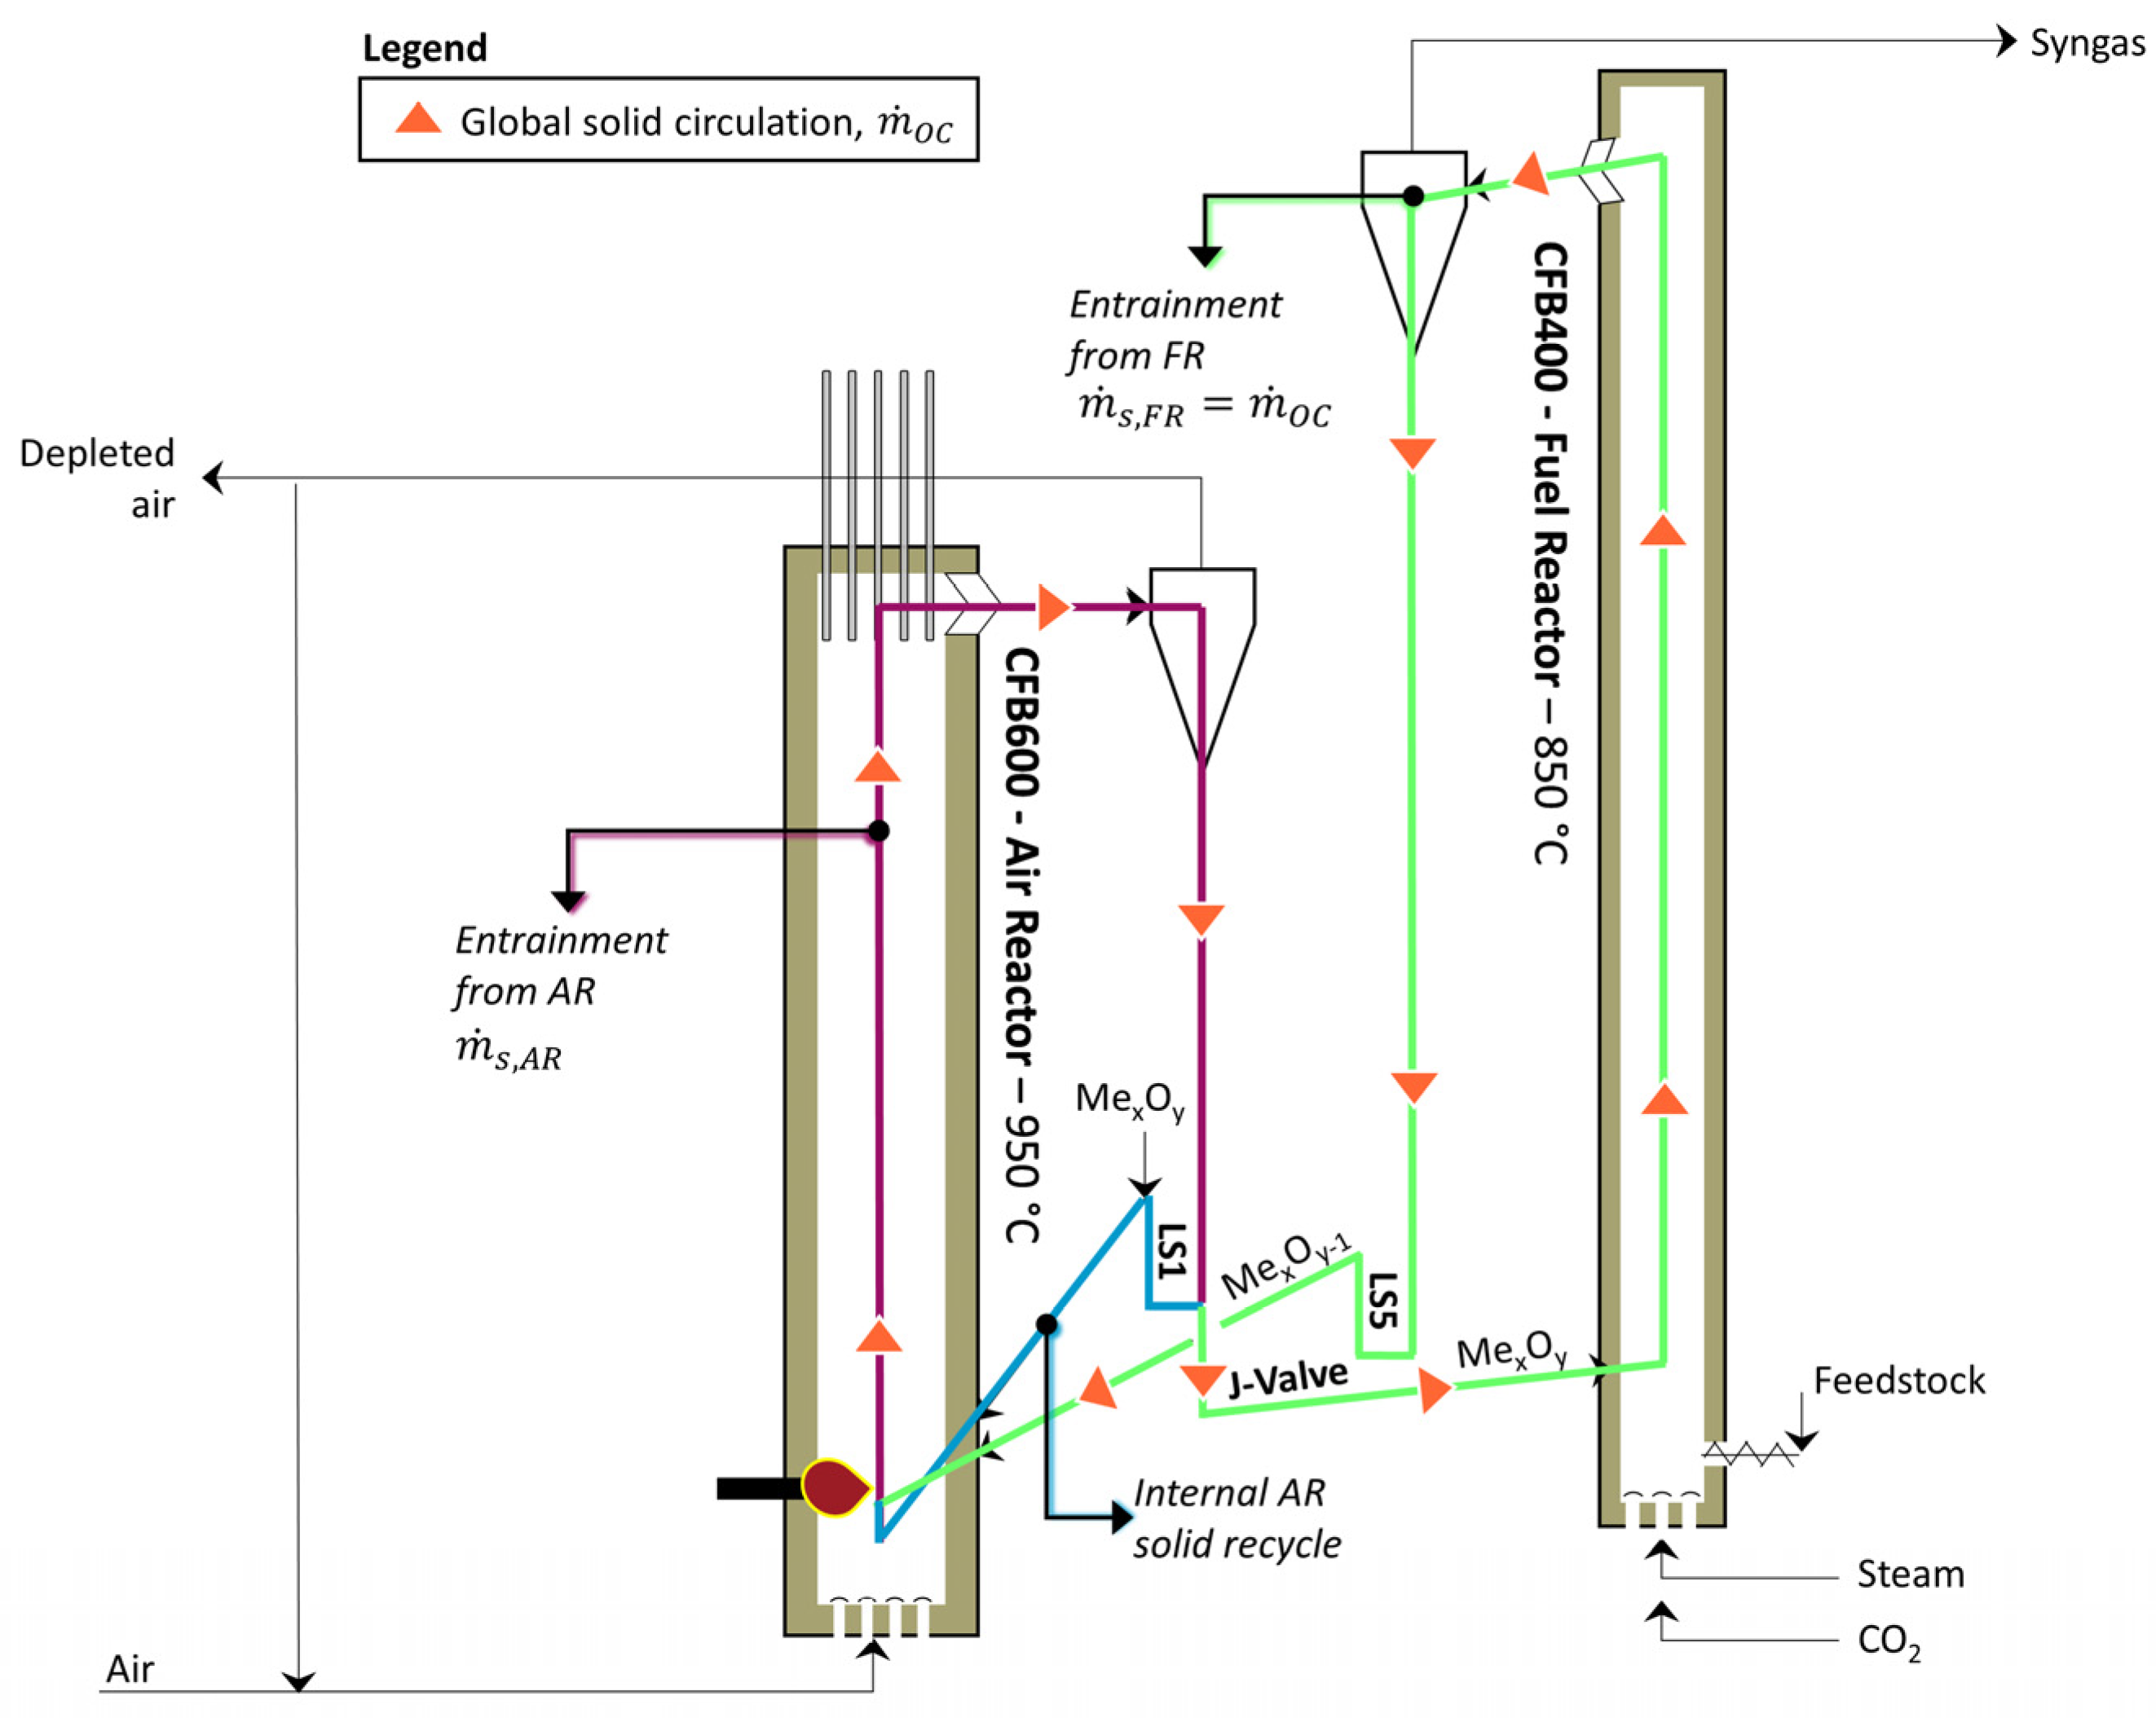
4.1. Hydrodynamic Behavior of Dual Circulating Fluidized Bed Reactor System

Obtaining a basic understanding of the hydrodynamic behavior of the dual-fluidized bed system is key when attempting to optimize CLG operation. In this Section, the extensive dataset determined in the CFM will first be used to derive a ground set of operating rules for the dual-fluidized bed reactor system in Section 4.1.1 before its applicability in the 1 MWth pilot plant will be demonstrated in Section 4.1.2.

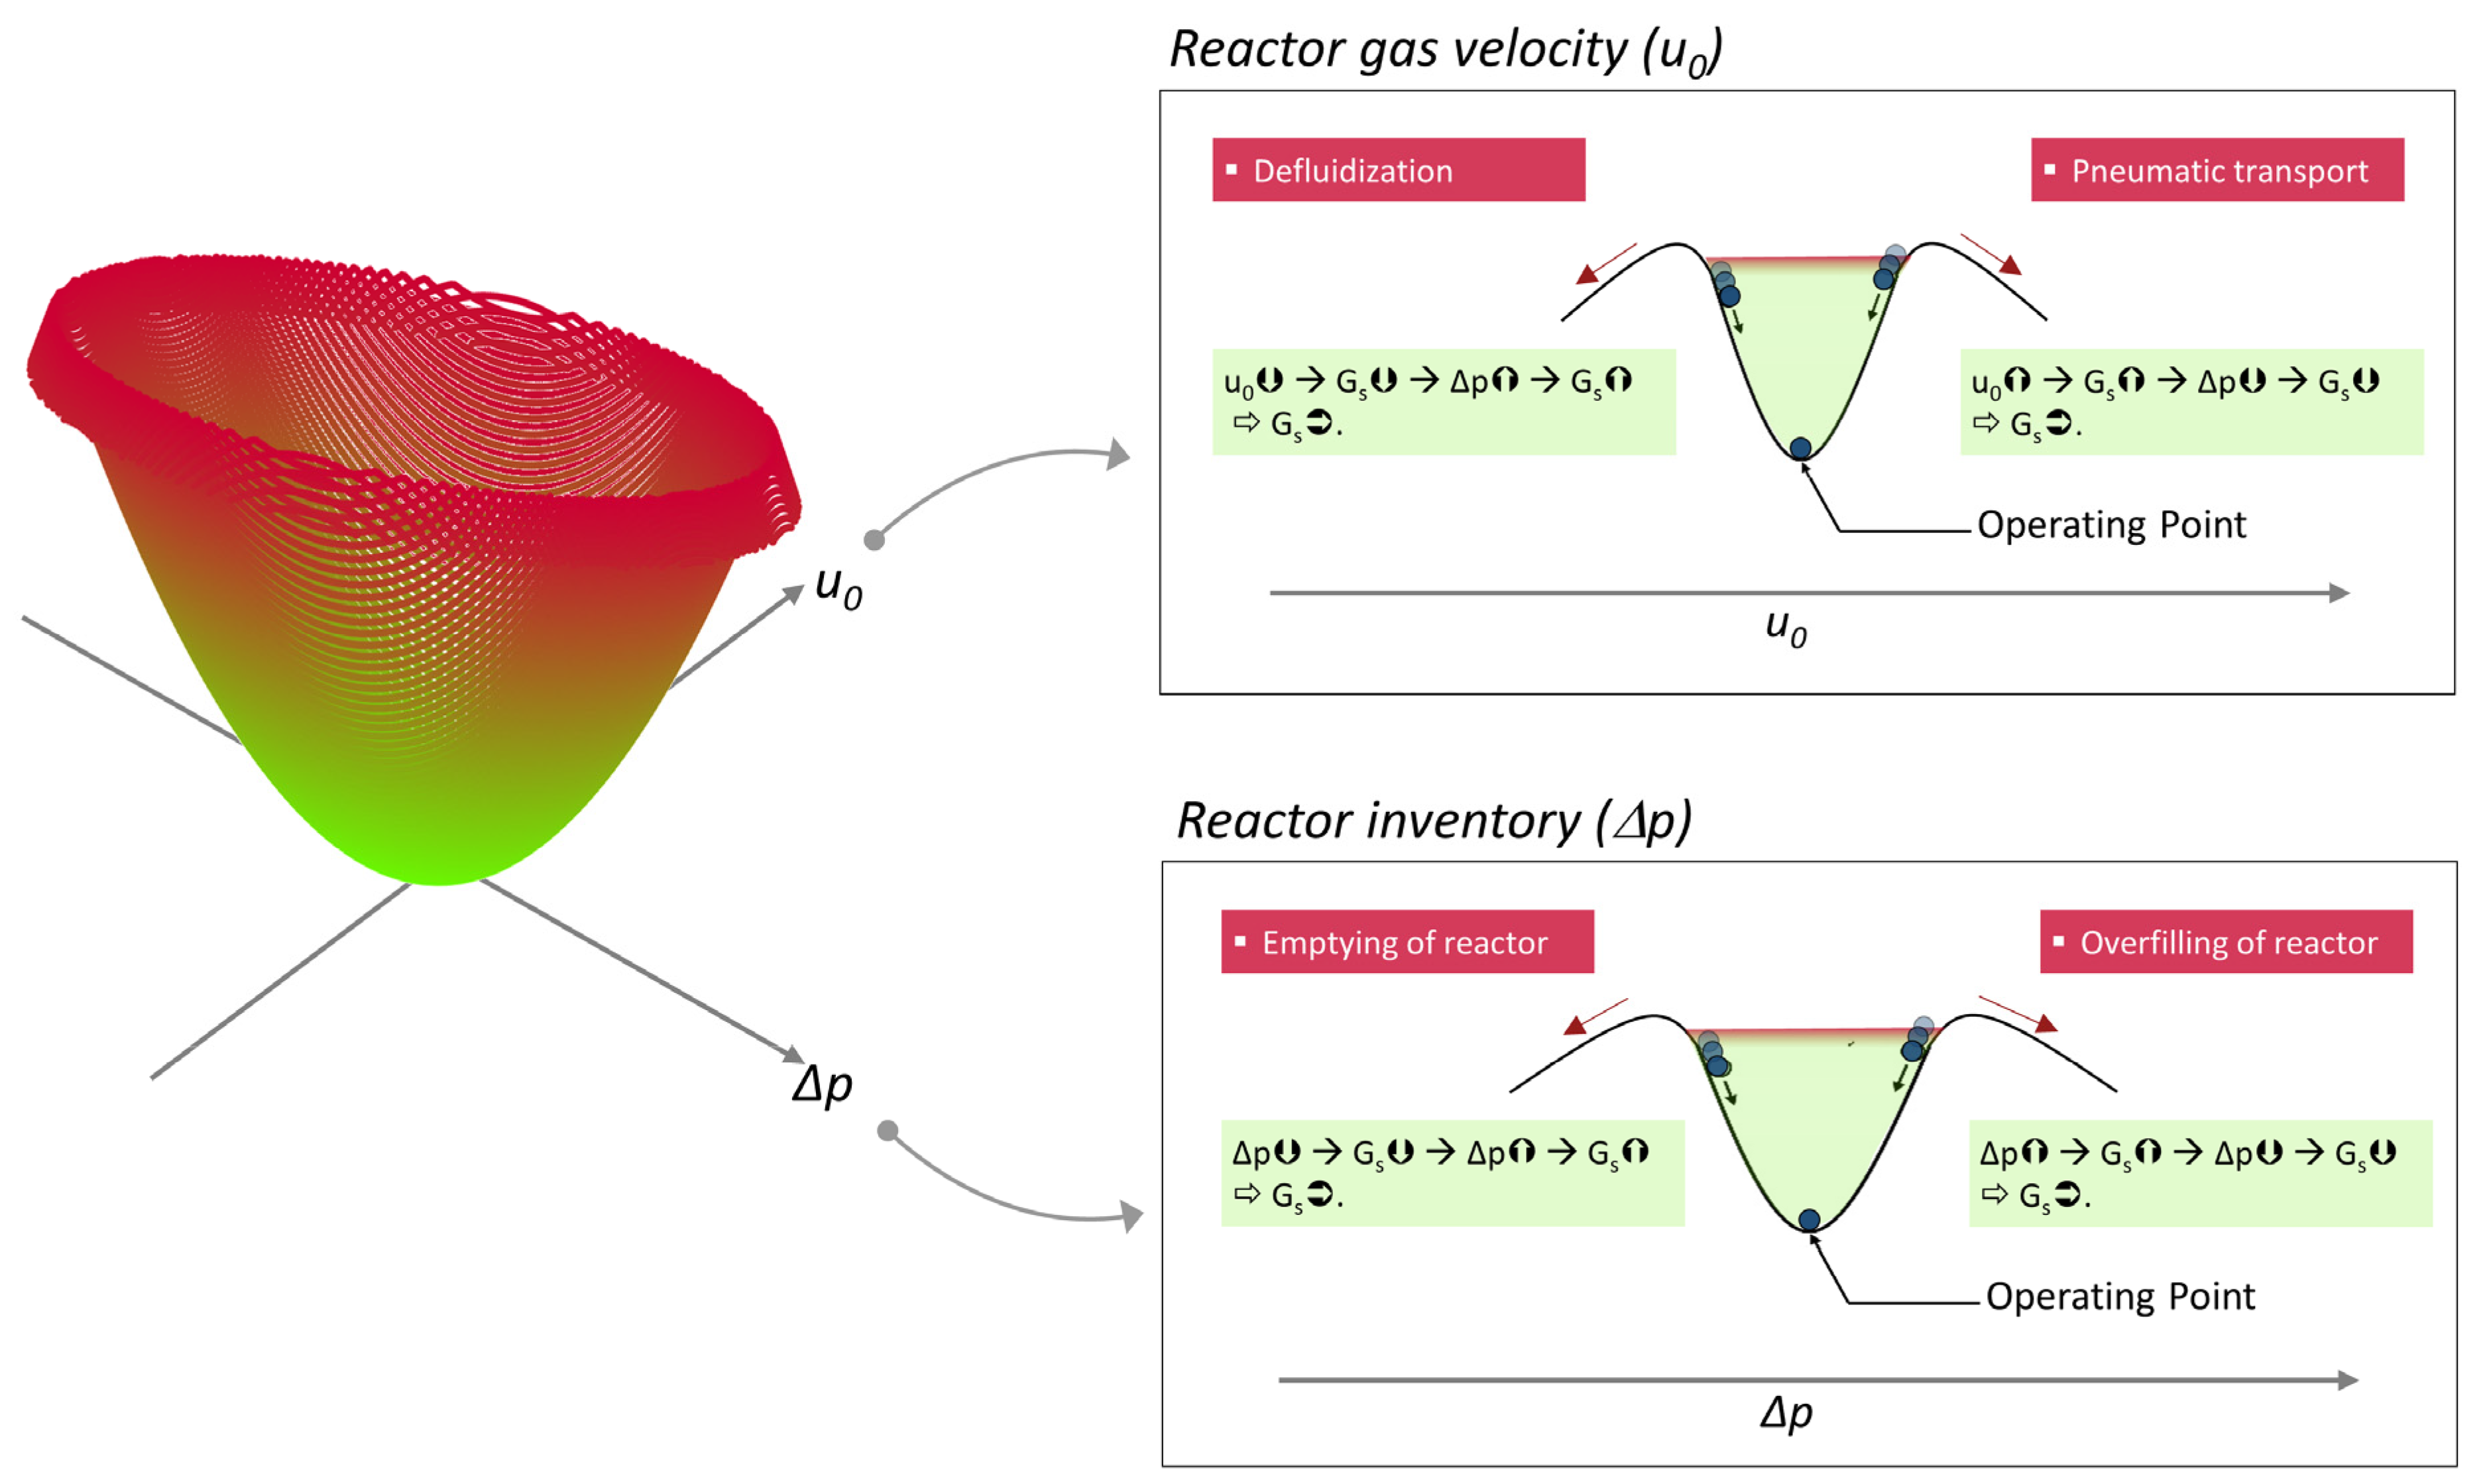
4.1.1. Operating Rules for Dual Circulating Fluidized Bed Reactor System

Before launching into the details of the hydrodynamic behavior of the dual-fluidized system, its reactor setup will first be explained in detail in the following, thus allowing for a subsequent in-depth investigation of system hydrodynamics.
As explained in Section 2.1, the AR is equipped with an internal solid recycle (blue color in Figure 6), which means that material entrained from the AR can be directly recycled back to it via LS1, so that changes in the FR hydrodynamics do not require a direct adjustment in hydrodynamic boundary conditions in the AR, thereby stabilizing system hydrodynamics. The material not traveling back to the AR is transported to the FR via the J-valve (green color in Figure 6). Here, the amount of material entering the FR through it can be adjusted by changing the amount of gas (N2 or CO2) used for J-valve fluidization [51]. When considering all solid streams inside the reactor system, it can be summarized that the entrainment from the AR ( m ˙ s , A R , purple color in Figure 6) constitutes the baseline for solid circulation, meaning that in order to obtain stable hydrodynamics, material transport through the J-valve ( m ˙ s , J V a l v e ) has to be smaller or equal to it. If not, more material is extracted from LS1 than enters it, and LS1 (slowly) empties. Secondly, the entrainment from the FR ( m ˙ s , F R ) and the material transport through the J-valve have to be equal so that the reactor inventory of the FR remains constant:
m ˙ s , A R m ˙ s , J V a l v e = m ˙ s , F R = m ˙ O C
The most efficient CLG operation is attained when entrainment from the FR is similar to entrainment from the AR, (Due to its smaller cross-sectional area, specific elutriation rates (given in kg/m2 s) have to be higher for the FR when compared to the AR, which generally means that higher gas velocities are necessary inside the FR). i.e., internal circulation from LS1 to the AR is minimal, as internal material circulation does not contribute positively towards heat or oxygen transport between the AR and FR. While material transport through the J-valve is primarily dependent on the amount of fluidization medium used for its fluidization [51], entrainment from both CFBs positively correlates with two independent operating variables. Firstly, entrainment increases with gas velocity, as more particles are carried with the gas streams at higher gas velocities and hence leave the reactor [27]. Secondly, entrainment was found to increase with increasing reactor inventory. This finding can be explained by the fact that at higher reactor inventories, the height of the dense zone in the CFB increases [27] and hence the distance from the top of the dense zone to the reactor decreases, making it easier for particles to be entrained from the riser. Moreover, even for CFBs with heights greater than the transport disengaging height (TDH), i.e., the height above which the solids concentration does not change with increasing height, entrainment was found to increase, which is attributed to the fact that bubble diameters in the dense bed increase with increasing reactor inventories, favoring solid entrainment [27] (more details see Section 4.2).
This underlying behavior of solid entrainment ultimately leads to a self-stabilization of the hydrodynamic system, which is best illustrated when investigating how it behaves during abrupt changes in the hydrodynamic boundary conditions. Since those are rarely observed in a large, continuously operated unit, where smooth operation is key, Figure 7 shows the hydrodynamic behavior of the scaled CFM during externally induced transient periods. (Despite the difference in temperature in scale and temperature, the underlying hydrodynamics in the cold flow model and the 1 MWth pilot plant are equal. As rapid changes in the boundary conditions are easily realizable in the cold flow unit, it is thus used for the following elucidations).
Firstly, Figure 7a shows how the cold flow model reacts to an abrupt increase in the AR gas velocity. While the reactor pressure drop in the AR decreases, it increases in the FR, which means that a fraction of the reactor inventory is shifted from the AR to the FR. This can be explained by the fact that the solid hold-up in the AR riser decreases with increasing u0 and, as the total solid inventory of the reactor system is constant, a slight increase in the pressure drop of the FR can be observed. Due to the difference in reactor diameters (AR,AR > AR,FR), changes in reactor pressure drop are always more pronounced for the FR than for the AR (see Equation (3)). Apart from the lower solid hold-ups in the AR, larger gas velocities lead to an increase in the entrainment rates for the AR. Yet, as the global solid circulation is only marginally increased, (The increase in global solid circulation arises from the fact that the pressure drop over the J-valve and the inventory in the FR increase, leading to an increase in material throughput through the J-valve and entrainment from the FR, respectively (see Figure 8)). since the fluidization of the J-valve is not altered, the excess entrained from the AR is reintroduced into the AR via LS1, which means that the internal AR circulation rate increases, leading to a stabilization of the overall system. Lastly, as the reactor inventory in the FR increases slightly, while the gas velocity is kept constant, it can be concluded that the global solid circulation rate increases slightly.
The impact of changes in the gas velocity of the FR is illustrated in Figure 7b. Here, a sudden increase in u0 leads to a rapid decrease in the pressure drop of the FR, whereas the AR pressure drop increases, as more material is entrained from the FR than enters it via the J-valve, leading to lower solid inventories inside the FR. Yet, due to this decrease in the FR inventory, entrainment from the FR decreases, as also observed by Alghamdi et al. [47]. This ultimately results in a stabilization of the system at a higher global circulation rate (i.e.,   m ˙ s , J V a l v e = m ˙ s , F R ). This also means that solid throughput through the J-valve is increased, which can be attributed to a higher pressure difference from LS1 to the FR bed, resulting in higher material transport rates (more details see Appendix B.1). On the other hand, entrainment from the AR slightly increases, as the reactor inventory increases. Consequently, the internal recycle of the AR tends to decrease slightly as the increase in entrainment from the AR generally is lower than the increase in material throughput via the J-valve. Hence, it has to be safeguarded that solid entrainment from the AR is sufficient, before increasing gas velocities in the FR, to prevent an emptying of LS1 (see also Figure 8).
When fluidization velocities are altered for the J-valve, material transport to the FR is altered, which is shown in Figure 7c. Here, an increase in fluidization of the J-valve, leading to a higher material transport rate to the FR, ultimately results in an increase in Δp for the FR. Due to the larger reactor inventory, the entrainment rate from the FR gradually increases until steady state (i.e.,   m ˙ s , J V a l v e = m ˙ s , F R ) is reached at a higher global circulation rate. For the AR, an increase in J-valve fluidization results in a decrease in reactor inventory as more material is directed into the FR. Consequently, the entrainment rate from the AR decreases, leading to another reason for the internal recycling of the AR to drop (apart from the higher throughput via the J-valve). Hence, an increase in J-valve fluidization is another measure that can only be carried out without jeopardizing system stability when safeguarding sufficient entrainment from the AR.
Finally, the overhead pressures of the two reactors can be varied independently in the 1 MWth pilot plant, (For the CFM, overhead pressures can be adjusted by repositioning the gas flap upstream of the filter). opening the question of how a change in the absolute pressure in one of the reactors alters system hydrodynamics. Figure 7d illustrates how a sudden increase in the overhead pressure of the FR affects hydrodynamics in the CFM. Clearly, FR reactor inventories decrease while AR reactor inventories increase, which can be explained by the fact that the material throughput through the J-valve decreases as the acting pressure over the J-valve is reduced. Consequently, the global solids circulation decreases measurably, while a slight increase in entrainment from the AR entails, thus leading to a significant increase in the internal solids recycled from LS1. Therefore, system hydrodynamics also restrict the extent to which the overhead pressures in the AR and FR can vary, potentially leading to insufficient global solid circulation rates in case of too high FR overhead pressures or an uncontrolled emptying of LS1 towards the FR via the J-valve in case of too high AR overhead pressures.
From the observations explained in detail above, it can thus be summarized that, within given boundaries (e.g., operating range of a CFB), the hydrodynamics of the dual fluidized bed system constitute a self-regulating system. This means that although a change in one variable (e.g., u0, FR) impacts multiple other variables (e.g., ΔpFR, ΔpAR, m ˙ s , F R ), a new stable operating point is found. At this new operating point, circulation rates might be different from before, yet the solid flows entering and leaving the CFB are equal for each of the two CFBs, leading to a stabilization of the system. This behavior is schematically illustrated in Figure 9. Consequently, a free variation of each process variable is possible when considering the following points:
  • LS1 must not be emptied, i.e., material entrainment from the AR has to exceed material throughput through the J-valve (see Equation (29)).
  • Generally, both reactors have to be operated above the minimum fluidization velocity of the utilized bed material to avoid defluidization. For the given reactor setup, the lower limit for the lower gas velocity is even more stringent, with u0 having to exceed the terminal velocity of the bed material to attain meaningful solid circulation.
  • The gas velocity has to be restricted to prevent complete emptying of the CFB, which would constitute pneumatic transport and hence sub-optimal heat and mass transfer rates inside the CFB.
  • The overall reactor inventory should be sufficient to prevent complete emptying of the CFB and should not exceed the maximum holding capacity of the system, which could entail (fluidization) issues during operation.
  • The pressure gradient between the overhead pressures should not rise to excessive values, which would lead to disturbances of controlled solid transport between AR and FR and/or pneumatic material transport through the loop seals.
Based on the behavior illustrated in Figure 7 and using the insights gathered from the operation of the scaled cold flow model, a ground-set of rules, summarized in Table 6, can thus be deduced for the operation of the dual-fluidized bed reactor system. Here, it becomes obvious that although each operator intervention comes with multiple side effects due to hydrodynamic system entanglement, dedicated measures to freely vary each important hydrodynamic process parameter exist, meaning that targeted and precise operator interventions are possible.

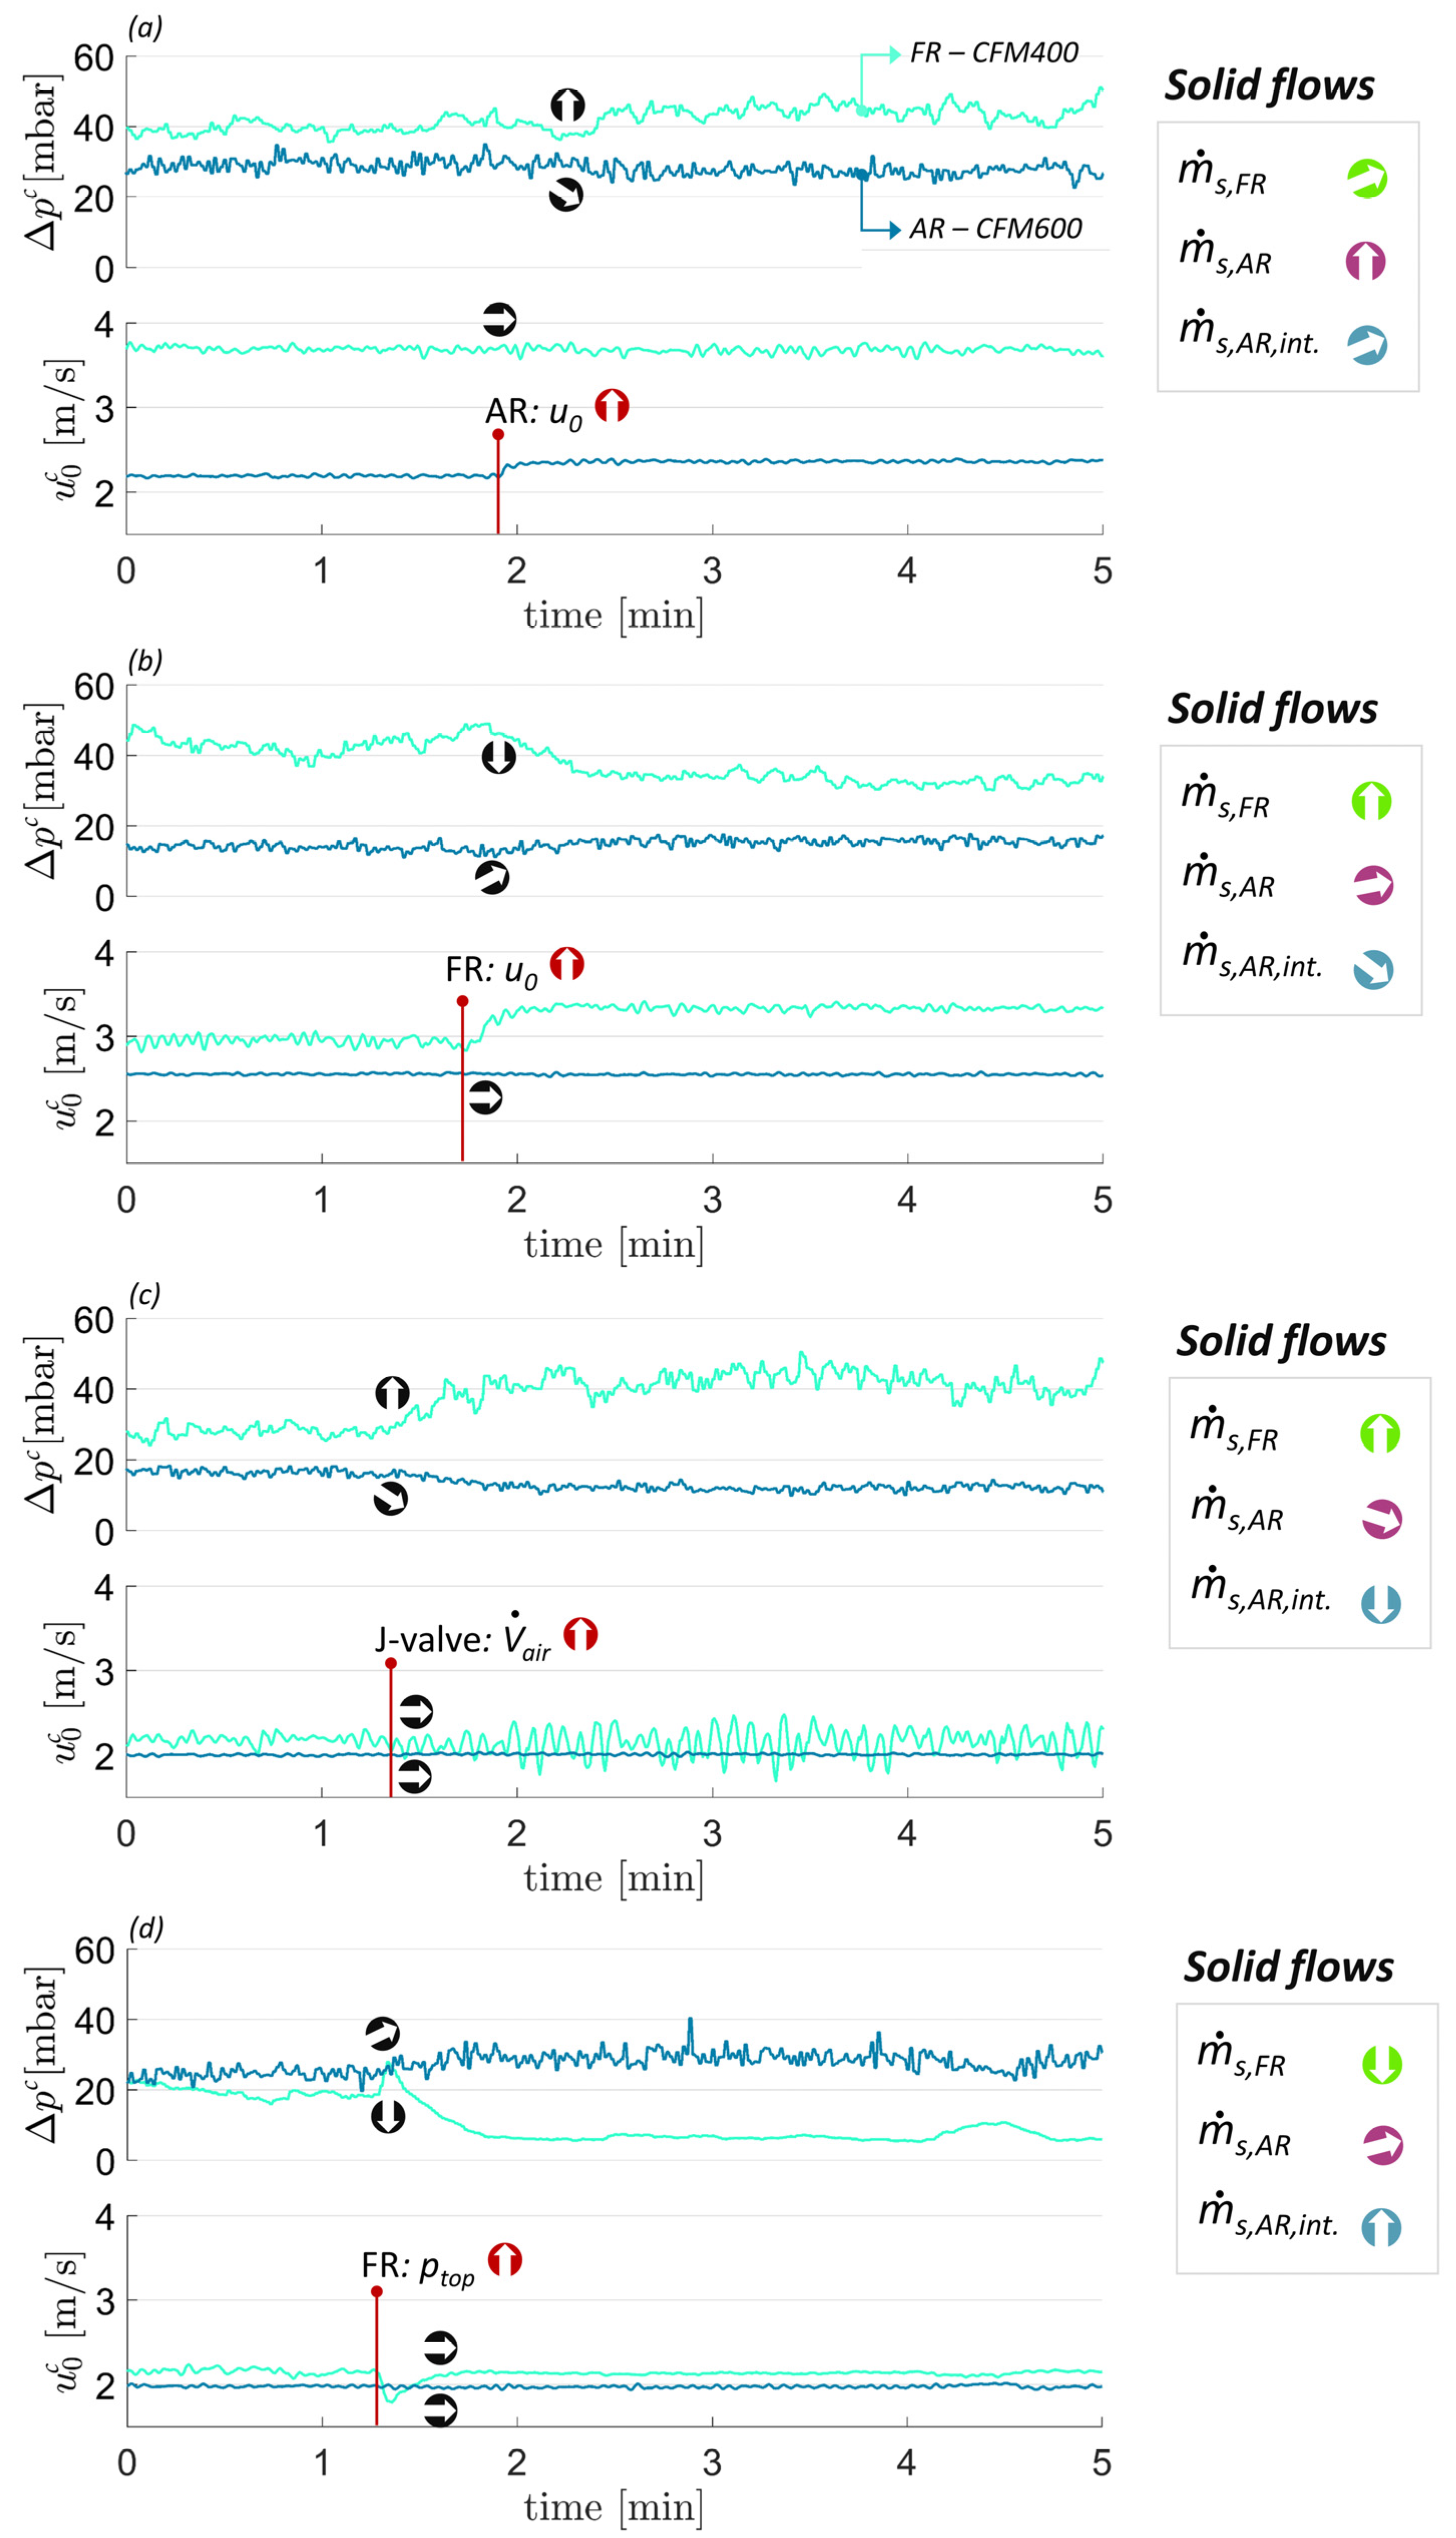
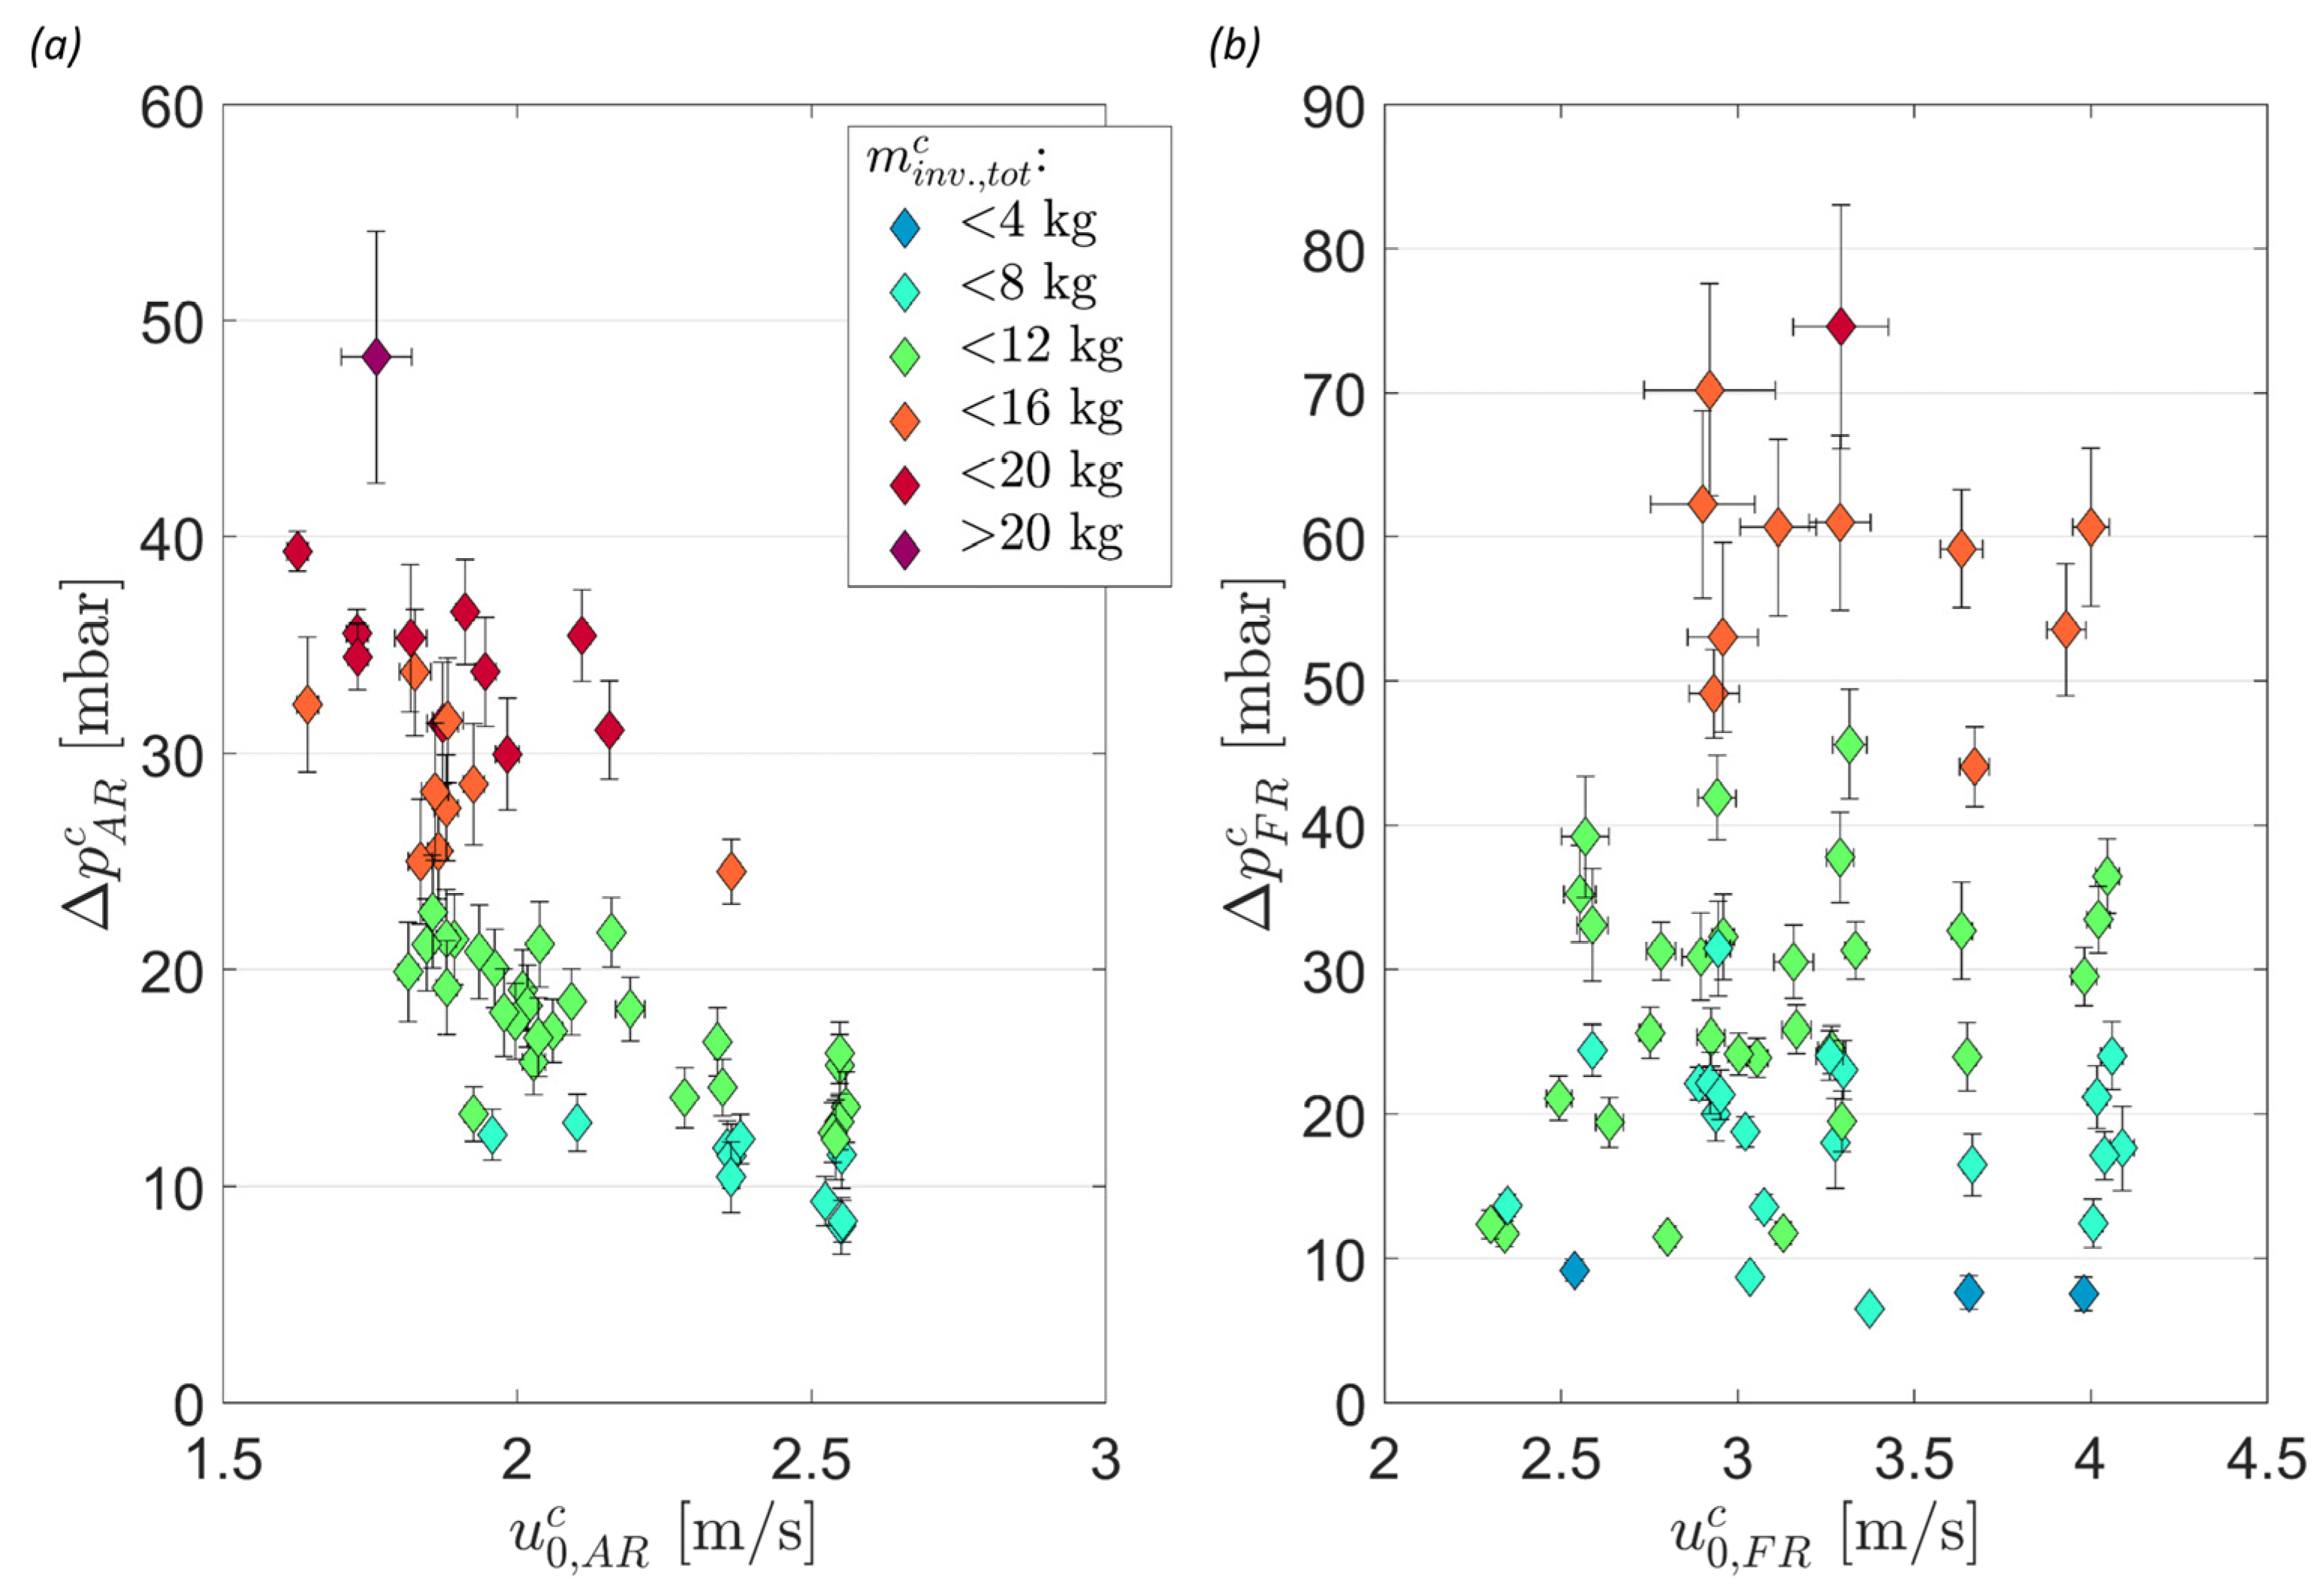
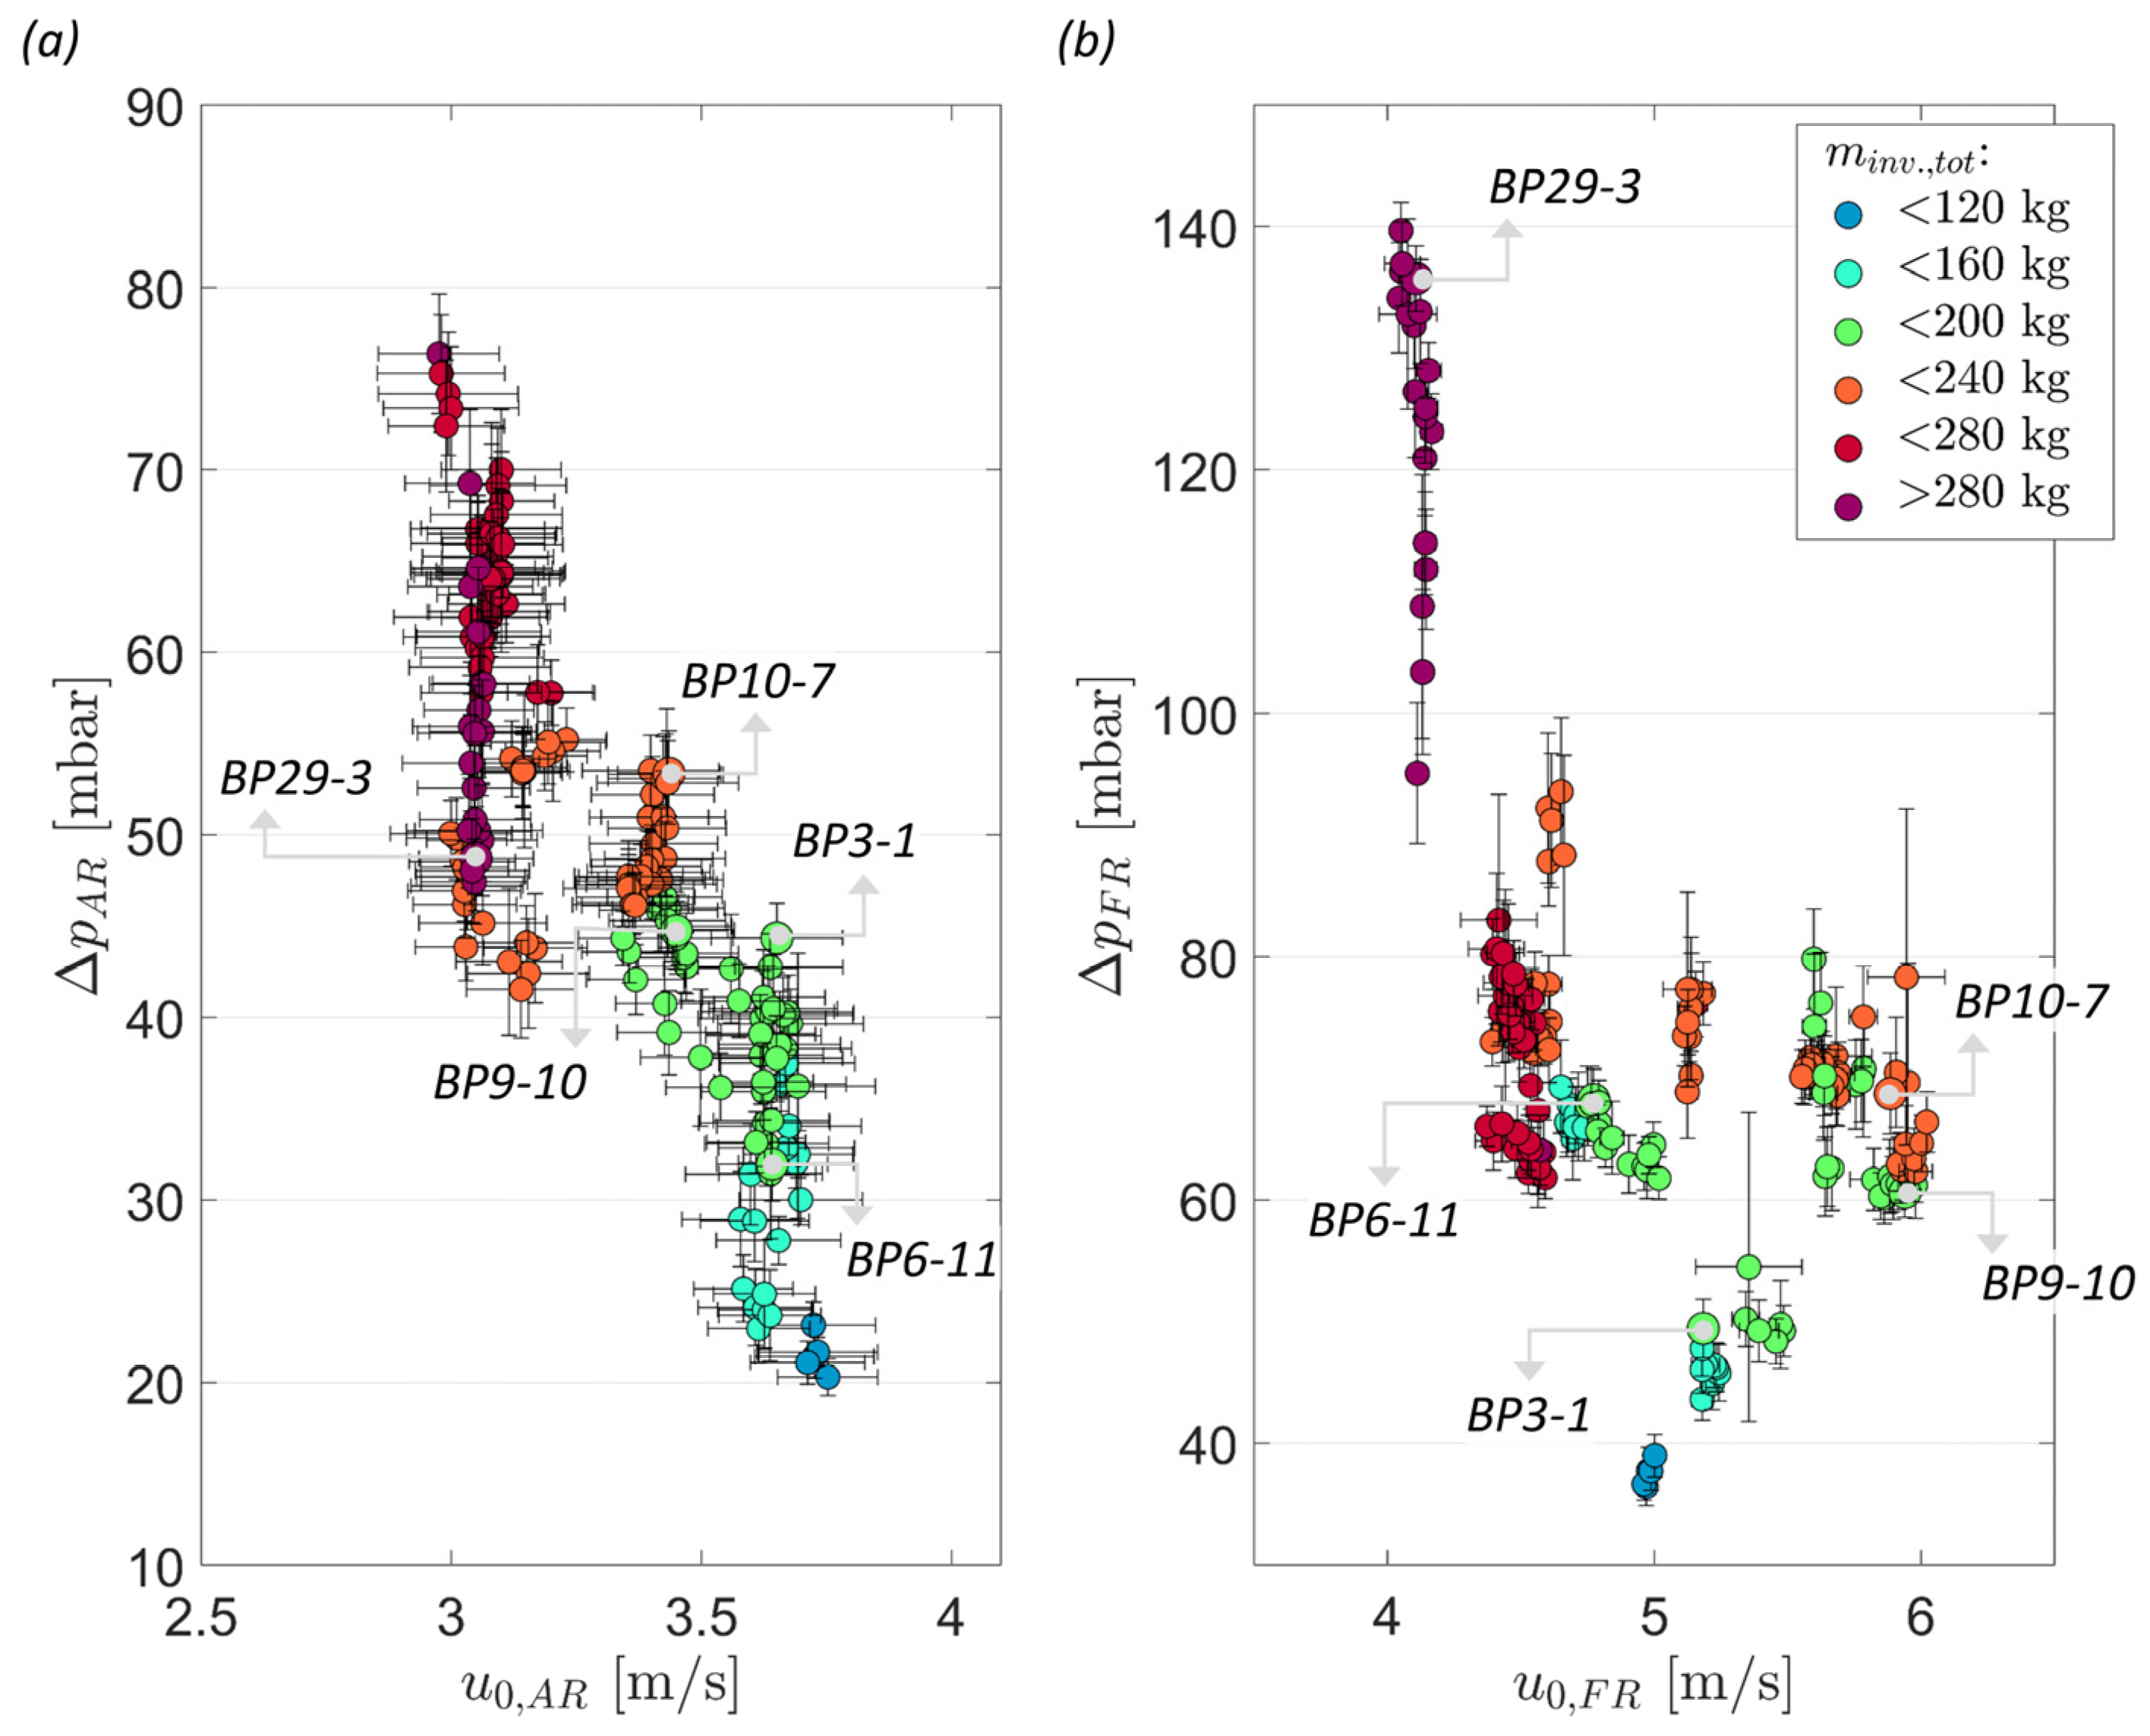
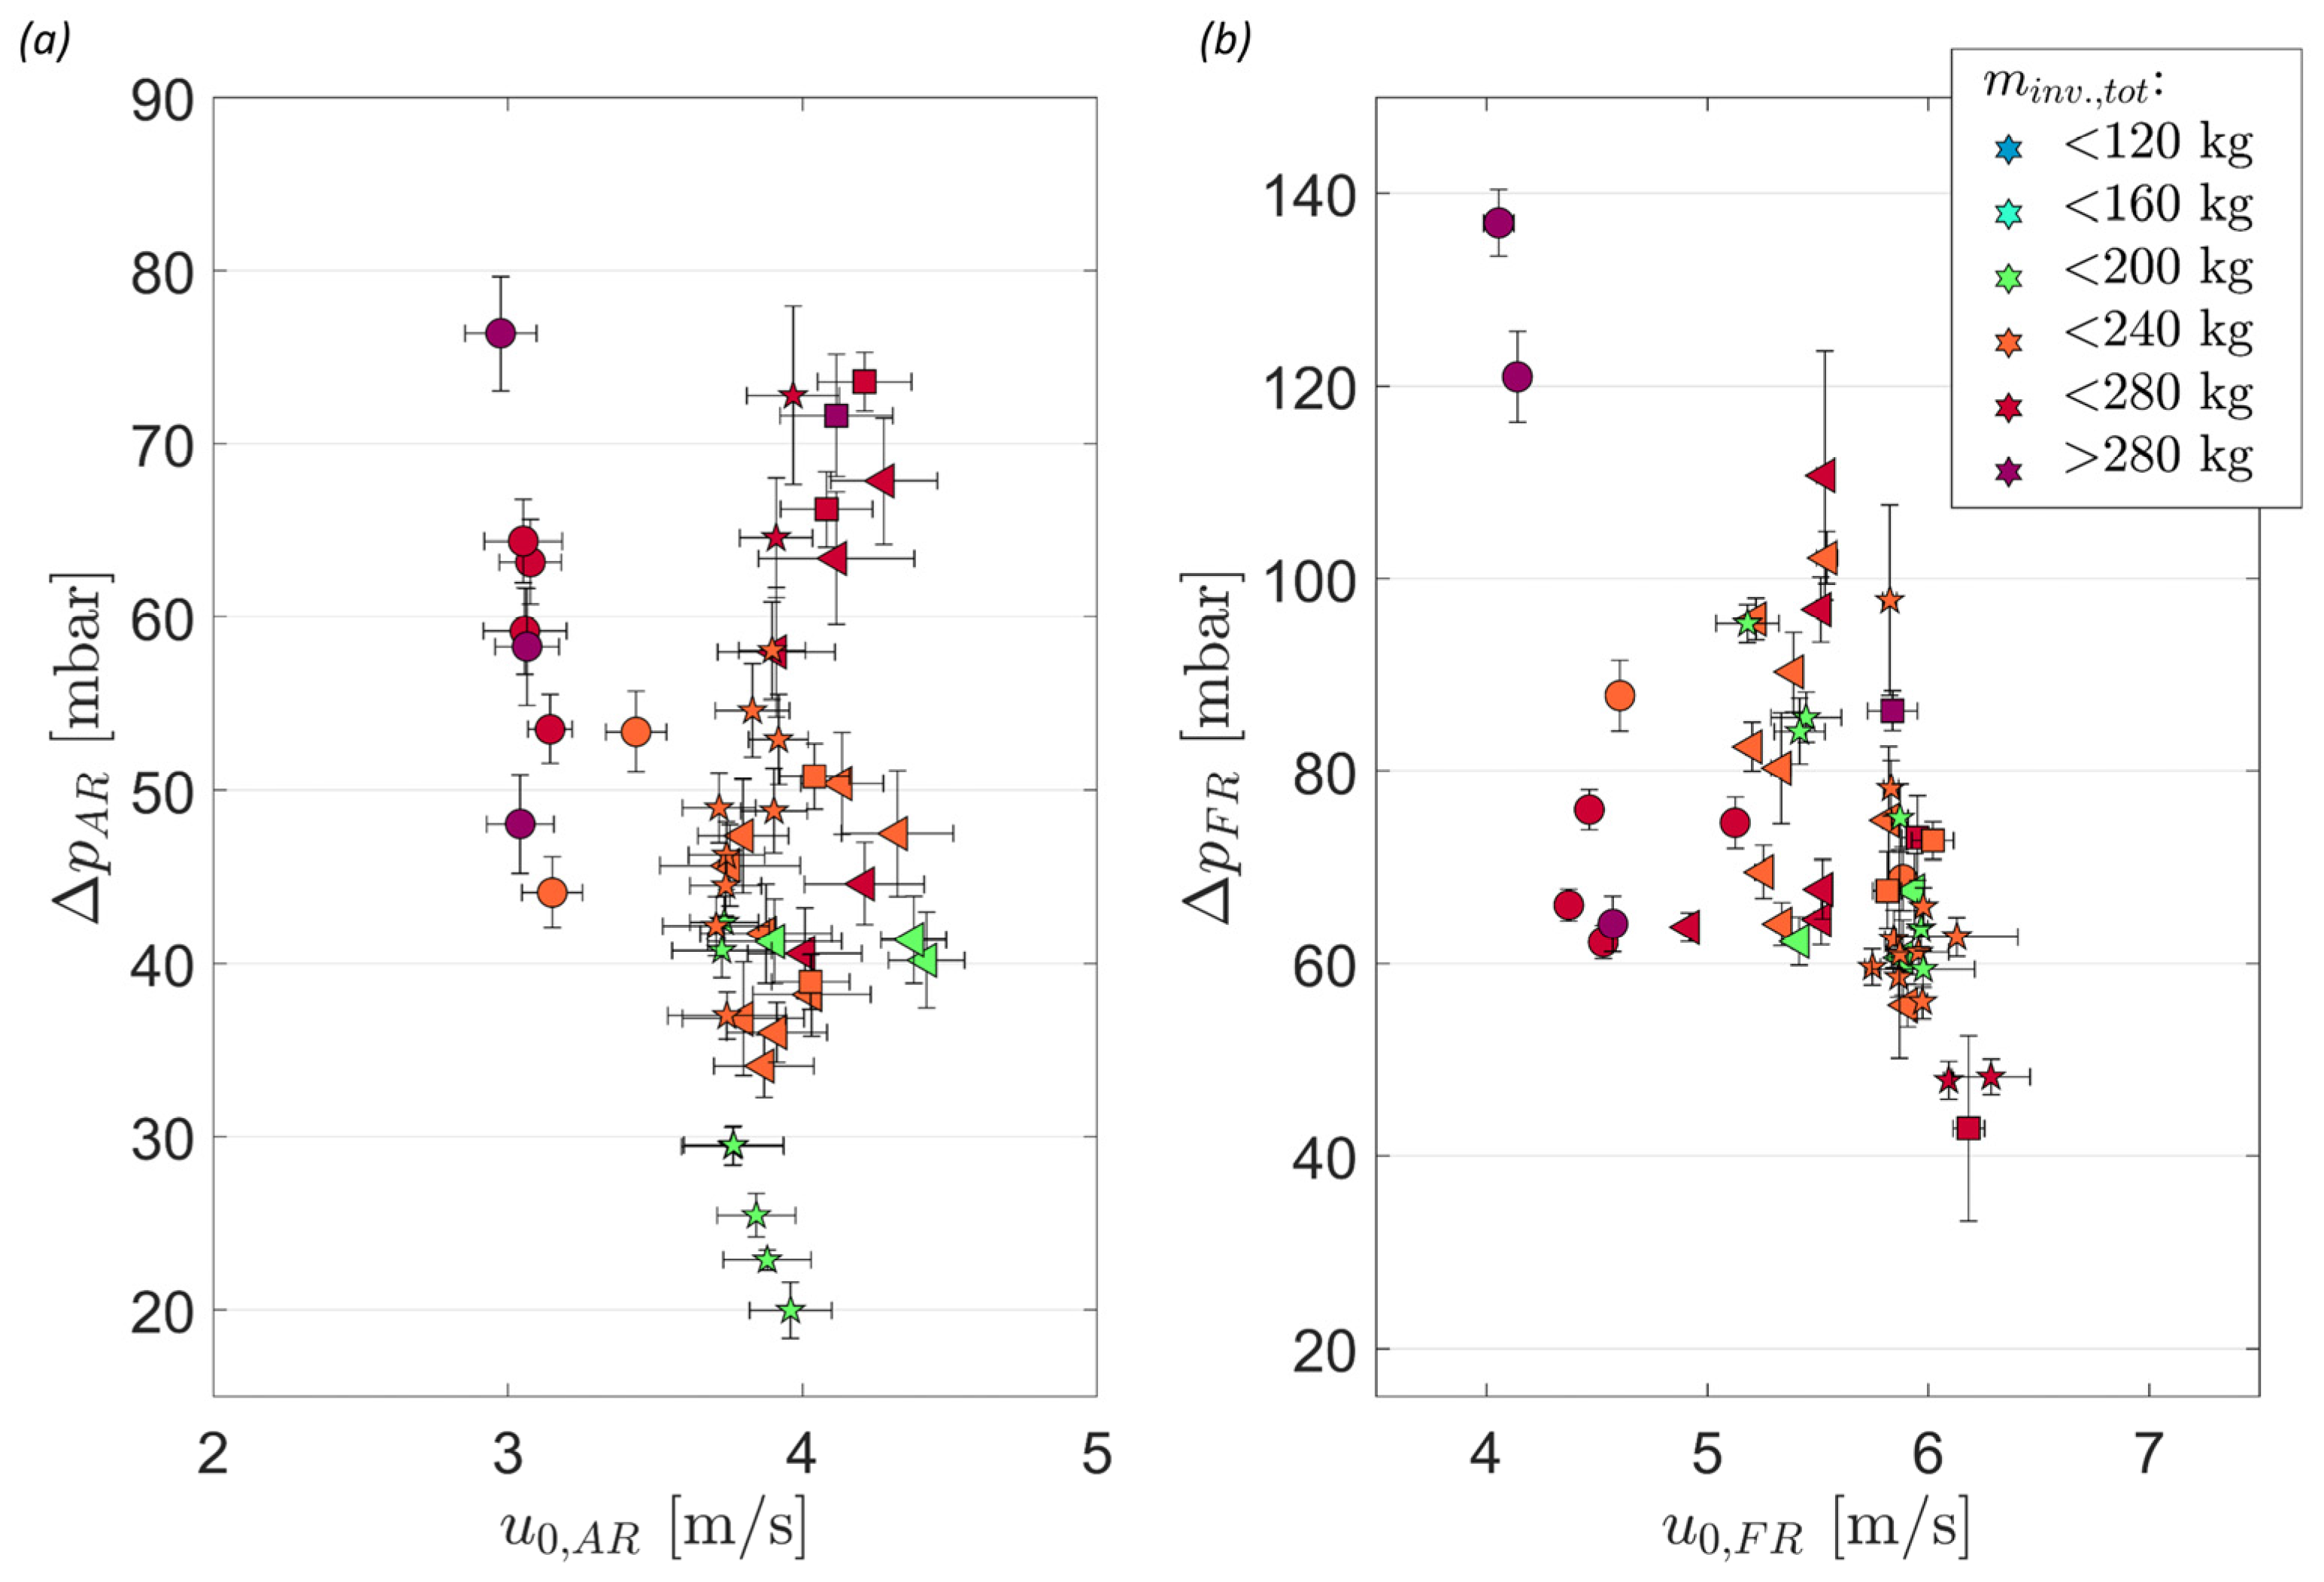
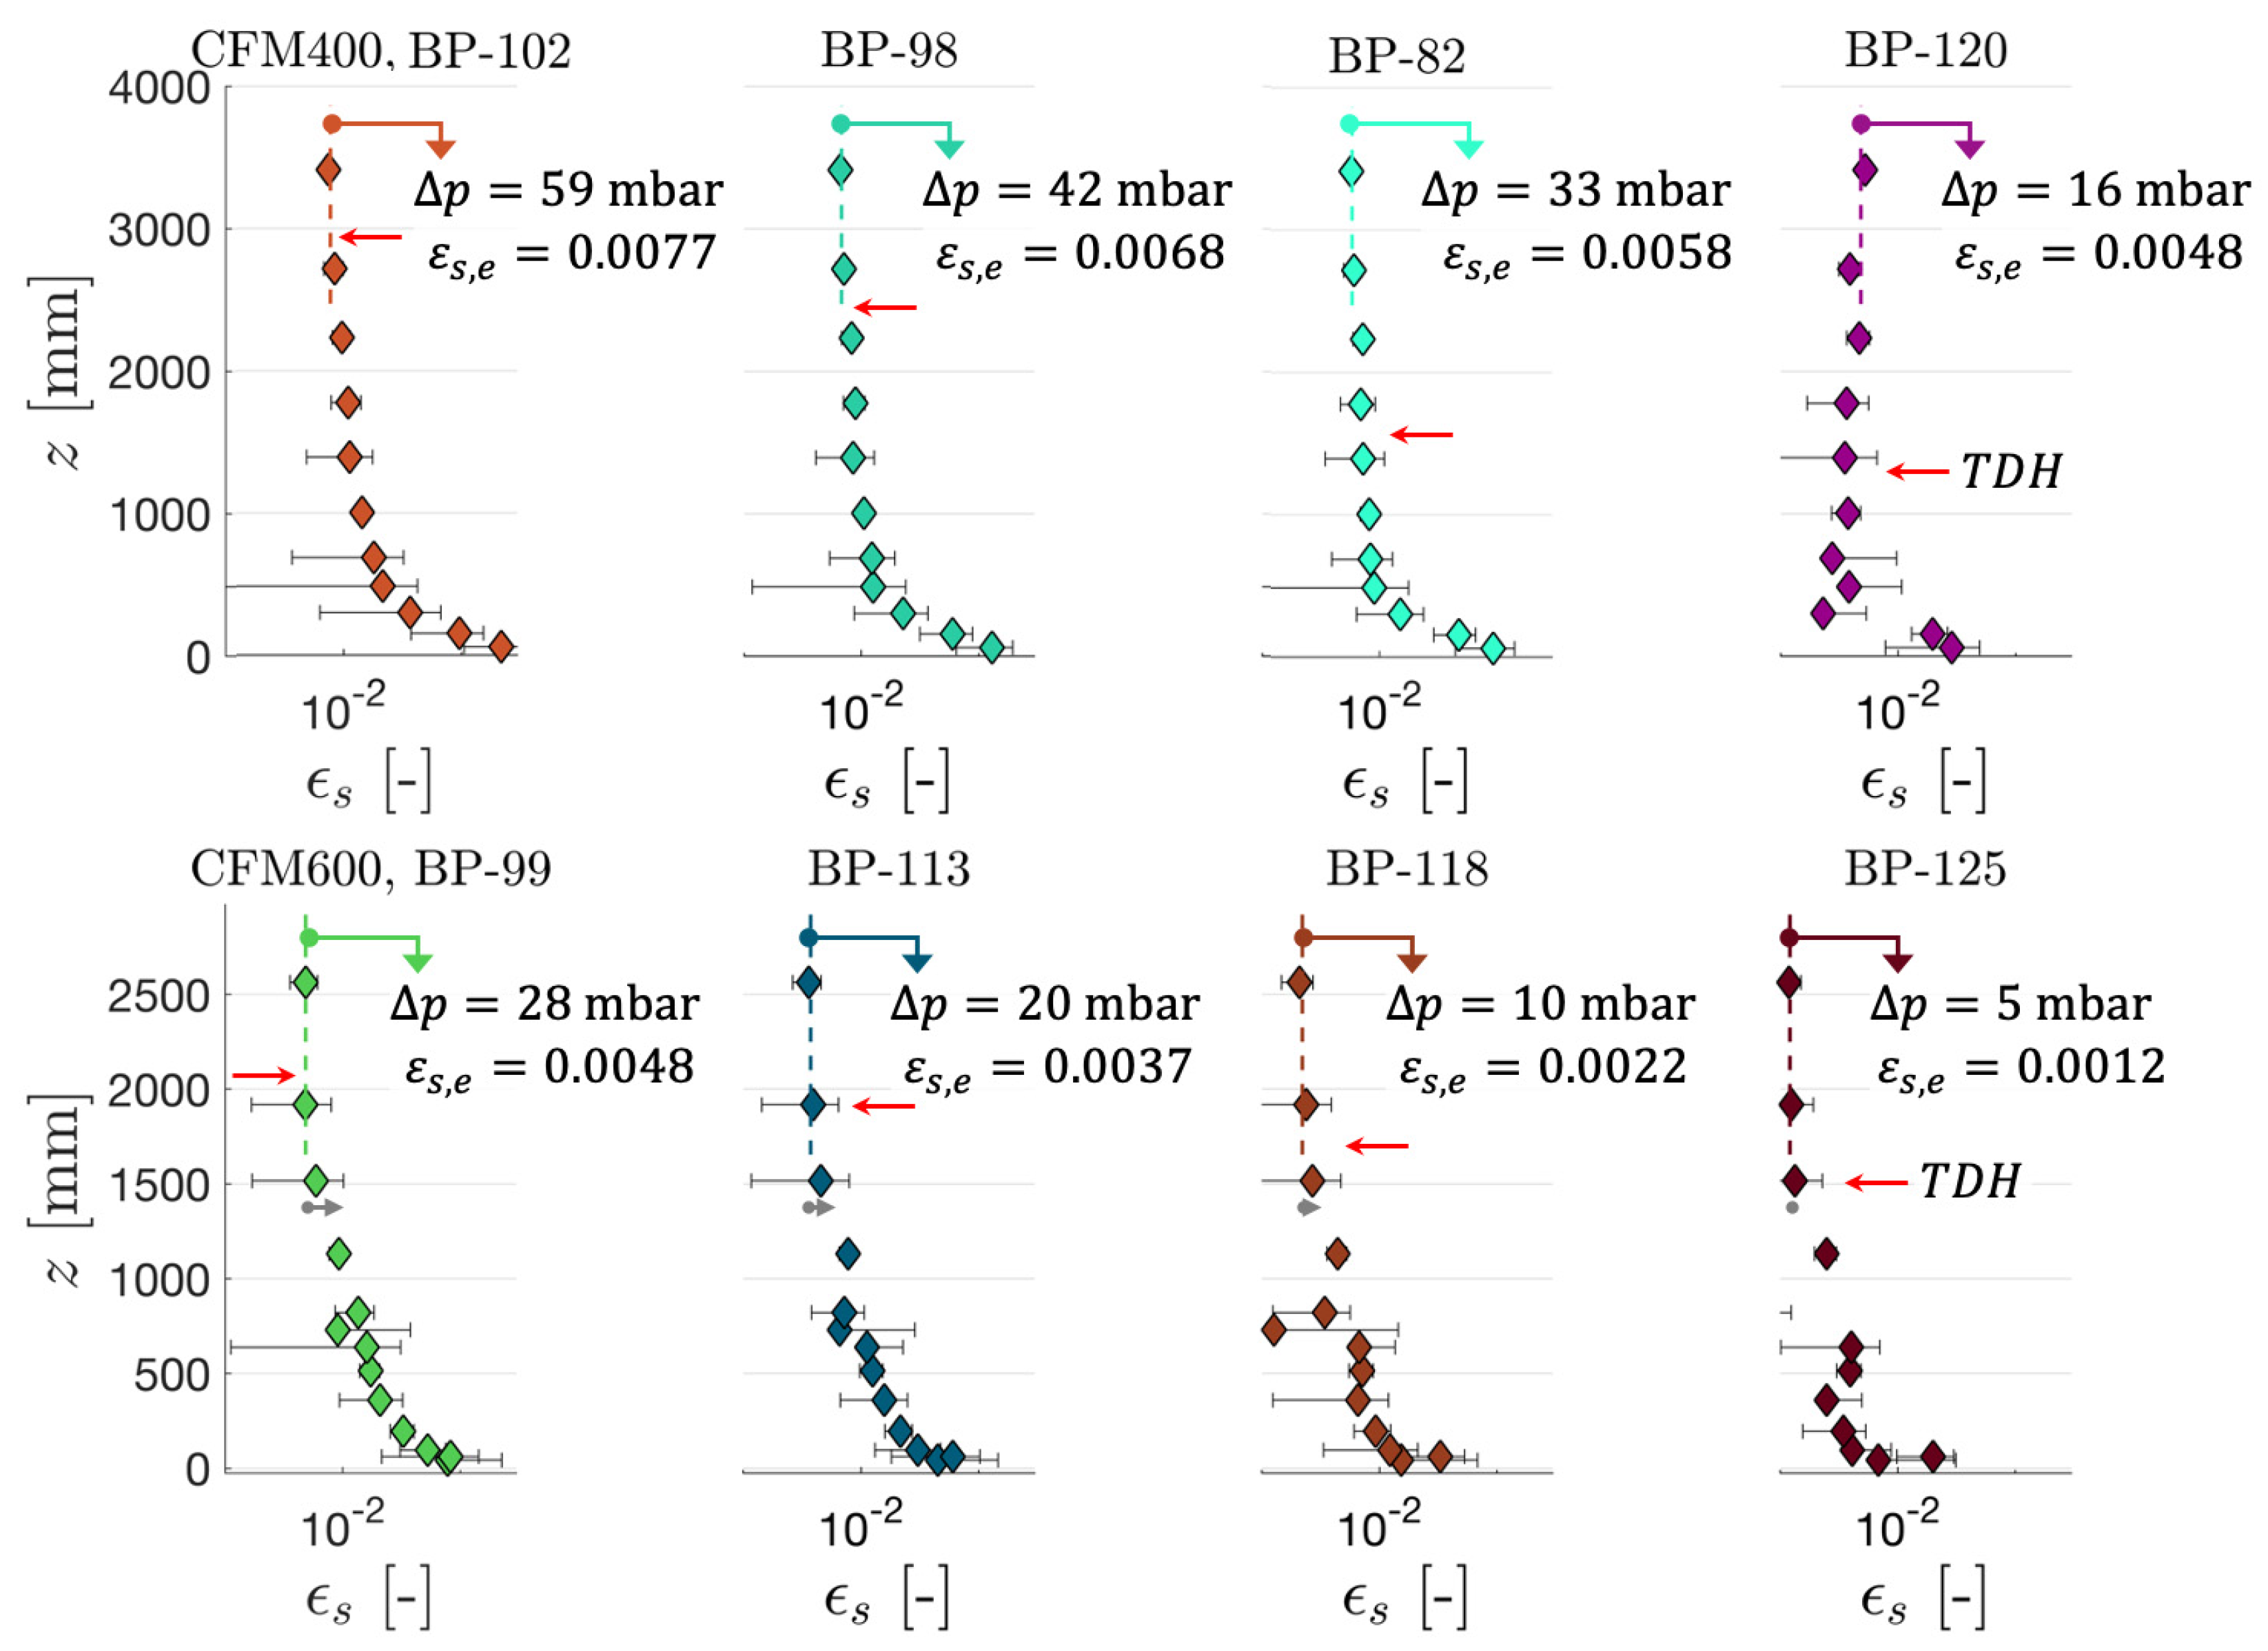
4.1.2. Comparison of Different Operating periods in Cold Flow Model and 1 MWth Pilot Plant

Using the basic operating rules developed in Section 4.1.1, 128 stable operating periods with varying boundary conditions were investigated in the CFM (more details see Section 2.4.2). As shown in Figure 10, a clear correlation between gas velocities and reactor pressure drops is visible for the AR. This can be explained by the fact that due to the internal recycling, the AR effectively functions as a solids reservoir. Here, the solid holdup in the riser decreases in case of increased gas velocities as the bed material is moved to the FR and the coupling elements (LS1 and LS5). Moreover, it is visible that in case of higher total reactor inventories, (Here, the total riser inventory minv.,tot signifies the sum of minv,AR and minv,FR, i.e., the sum of the mass of the material located inside both risers for a given operating period. The material located in the loop seals is not considered here), and riser inventories in the AR increase. On the other hand, similarly, clear-cut trends are not observable for the FR. This is related to the fact that the reactor inventory in the FR is not primarily governed by its gas velocity but can be starkly altered via changes in AR hydrodynamics (see Section 4.1.1), thus allowing for both high and low reactor inventories for a given subset of u0,FR and minv.,tot. Nonetheless, it is clearly visible that similar to the AR, higher riser inventories are attainable inside the FR at higher total inventories, even at high gas velocities. Consequently, the given reactor setup features great flexibility in terms of FR riser inventories, with stable operating points being attainable at pressure drops from 10 to above 70 mbar. In terms of reactor pressure fluctuations, it is visible that standard deviations of the measured pressure drop increase with reactor inventories for both reactors, as bubble coalescence occurs to greater extents [27], thus leading to higher fluctuations in the measured pressure signals upon bursting of the bubbles at the surface of the dense bed.
Due to the similarity of the systems, general trends derived for the cold flow model can also be observed when comparing the hydrodynamic boundary conditions for different stable operating periods obtained in the 1 MWth pilot plant. Figure 11 shows the pressure drops for the AR and FR for varying gas velocities for different total riser inventories, attained during the first test campaign (K1). It is clearly visible that for both reactors, the pressure drop decreases for higher gas velocities. As explained before, this can be attributed to the fact that as gas velocities are increased, the solid holdup is decreased, and more material is entrained from the riser. Hence, the reactor inventory decreases until a new steady state is obtained (see Figure 7). As explained above, the coupling of both reactors leads to the fact that a decrease in u0 in one reactor entails an increase in Δp, whereas Δp behaves inversely for the other reactor, as the overall reactor inventory is maintained constant. Consequently, the riser inventory can be altered in one reactor by changing the gas velocity in the other for a given total reactor inventory. One example of this is the operating periods BP3-1 and BP6-11, marked Figure 11 for which the total riser inventory in both reactors amounts to approx. 170 kg. Although the gas velocities are similar for both operation points for the AR, reactor inventories vary strongly. This is the case as for BP3-1, gas velocities in the FR are significantly higher than for BP6-11, and hence the solid holdup in the FR is lower for the former. Consequently, riser inventories are higher for BP3-1 in the AR. Another important finding which can be derived from the dataset visualized in Figure 11 is that varying total riser inventories are realizable by changing the total amount of OC present inside the system (e.g., the total reactor inventory can be increased by increasing the OC make-up rates beyond those required to achieve stable reactor inventories for a given period of time). As shown in Figure 11, total riser inventories between 120 and 290 kg were obtained during the test campaign for the operating periods under consideration. When comparing the operating periods BP9-10 and BP10-7, marked in Figure 11, it is visible that for the latter higher riser inventories were obtained at similar gas velocities in both reactors by increasing the total riser inventory from 191 kg to 224 kg. Generally, larger riser inventories are desired, especially in the FR, as they increase solid residence times for a given solid circulation rate and thereby enhance char and volatile conversion [21]. This means that OC make-up rates should be adjusted in such a way that riser inventories do not drop below given threshold values, at which sufficiently long residence times are attained.
For BP29 in K1, a maximization of FR inventories was targeted to boost solid residence times by increasing the total reactor inventory and operating the FR at comparably low gas velocities. One example of this is operating period BP29-3, highlighted in Figure 11. However, during this operating period, it was observed that the FR exhibited strongly fluctuating pressures in the lower sections of the riser. This can be attributed to the fact that due to the stronger coalescence of bubbles in the taller and denser fluidized bed at these high reactor inventories, bubble diameters reach sizes close to the reactor diameter and hence the fluidization regime can switch from turbulent to slugging [44]. Therefore, there exists an upper threshold to which values of the total reactor inventories can be increased while at the same time allowing for stable system hydrodynamics. Moreover, as elaborated before, material throughput through the J-valve decreases as the pressure gradient from AR to FR increases, making attaining high solid circulation rates more difficult at excessively high FR reactor inventories. (Additionally, it has to be noted that at higher reactor inventories sealing requirements intensify, which can lead to operational issues. One example of this is the solid feeding system of the FR, which has to be pressurized to higher pressures to avoid syngas backflow into the dosing container as FR inventories are increased).
The effect of bed material characteristics on system hydrodynamics can be further evaluated when comparing operating periods from the three different test campaigns, for which particle diameters in the 1 MWth unit varied distinctly (for bed material properties please refer to Tables S1–S3 in the Supplementary Material). (For K2 larger OC particle diameters were attained due to the utilization of coarser Ilmenite (ILMc), while for K3 feedstock-related agglomeration led to an increase in average particle size in the CLG system). Figure 12 shows that in the case of larger particle diameters (K2-triangles and K3-squares), the dual fluidized bed system was operated at visibly higher gas velocities, necessary to achieve the required global solid circulation (more details see Section 4.2). Apart from this observation, the data points fall along the previously explained trends, highlighting that the general operational rules apply regardless of the characteristics of the utilized bed material, albeit the exact boundary conditions to reach the desired operational window will vary.
Further insights into system hydrodynamics can be made by in-depth analyses of individual operating periods. One such example is presented in Figure 13, showing pressure profiles for AR and FR for the CFM and the 1 MWth pilot plant for two comparable operating periods (see Table 7). For each setup, both reactors show typical CFB pressure profiles, with pressures decaying exponentially with reactor height, as the solid holdup decreases [44]. As shown in Figure 13b, a relatively short, dense bed with a height of approx. 200 mm was obtained for the FR (1 MWth) at these boundary conditions, meaning that the feedstock is fed onto the top of the dense bed by the feedings screw, located at a height of around 350 mm. This is related to the fact that relatively high gas velocities (5.5–7 m/s) are necessary in the FR in order to achieve the required solid entrainment from the riser of the CFB. Moreover, the conical shape of the FR in the lower part reinforces this behavior as gas velocities exceeding 10 m/s are attained in the lower reactor sections, further impeding significant solid holdups in the lower sections for the FR [36]. On the other hand, the dense bed in the AR is higher (see Figure 13a), reaching a height of approx. 500 mm, despite the lower reactor inventory for the AR due to the slower gas velocities in the AR and the purely cylindrical shape of it. Similar observations can be made when considering the profiles obtained for the CFM (see Figure 13c,d), showing a good agreement with the 1 MWth data. In terms of freeboard pressures, both reactors show an exponential decay of the solids concentration above the dense bed with only marginally decreasing solid concentrations being obtained above around one-third of their height, signifying the typical behavior for tall CFBs [44]. This consequently allows for a determination of the solids concentration at the reactor outlet (εs,e), via Equation (18) using the three uppermost pressure transmitters in each riser. For the CFM as well as the 1 MWth pilot plant values for εs,e between 0.005 and 0.007 were obtained for the operating periods under investigation. (As this parameter is dimensionless, scaling is not necessary when transferring between the CFM and the 1 MWth pilot plant). Generally, slightly higher values are obtained for the AR than for the FR for both setups, despite the lower gas velocities present inside the AR, showing the effect of reactor height on solids concentration at the reactor outlet. While a good agreement is attained for εs,e for the FR for the CFM and the 1 MWth pilot plant, the difference in εs,e for the AR can be related to the visible discrepancy in (scaled) gas velocities between the two selected operating periods (see Table 7). Nonetheless, the results illustrated in Figure 13 demonstrate that in the case of similar (scaled) operating conditions in the CFM and the 1 MWth pilot plant, good comparability between the two datasets is obtained for each reactor, despite slight deviations in Glicksman’s dimensionless numbers.

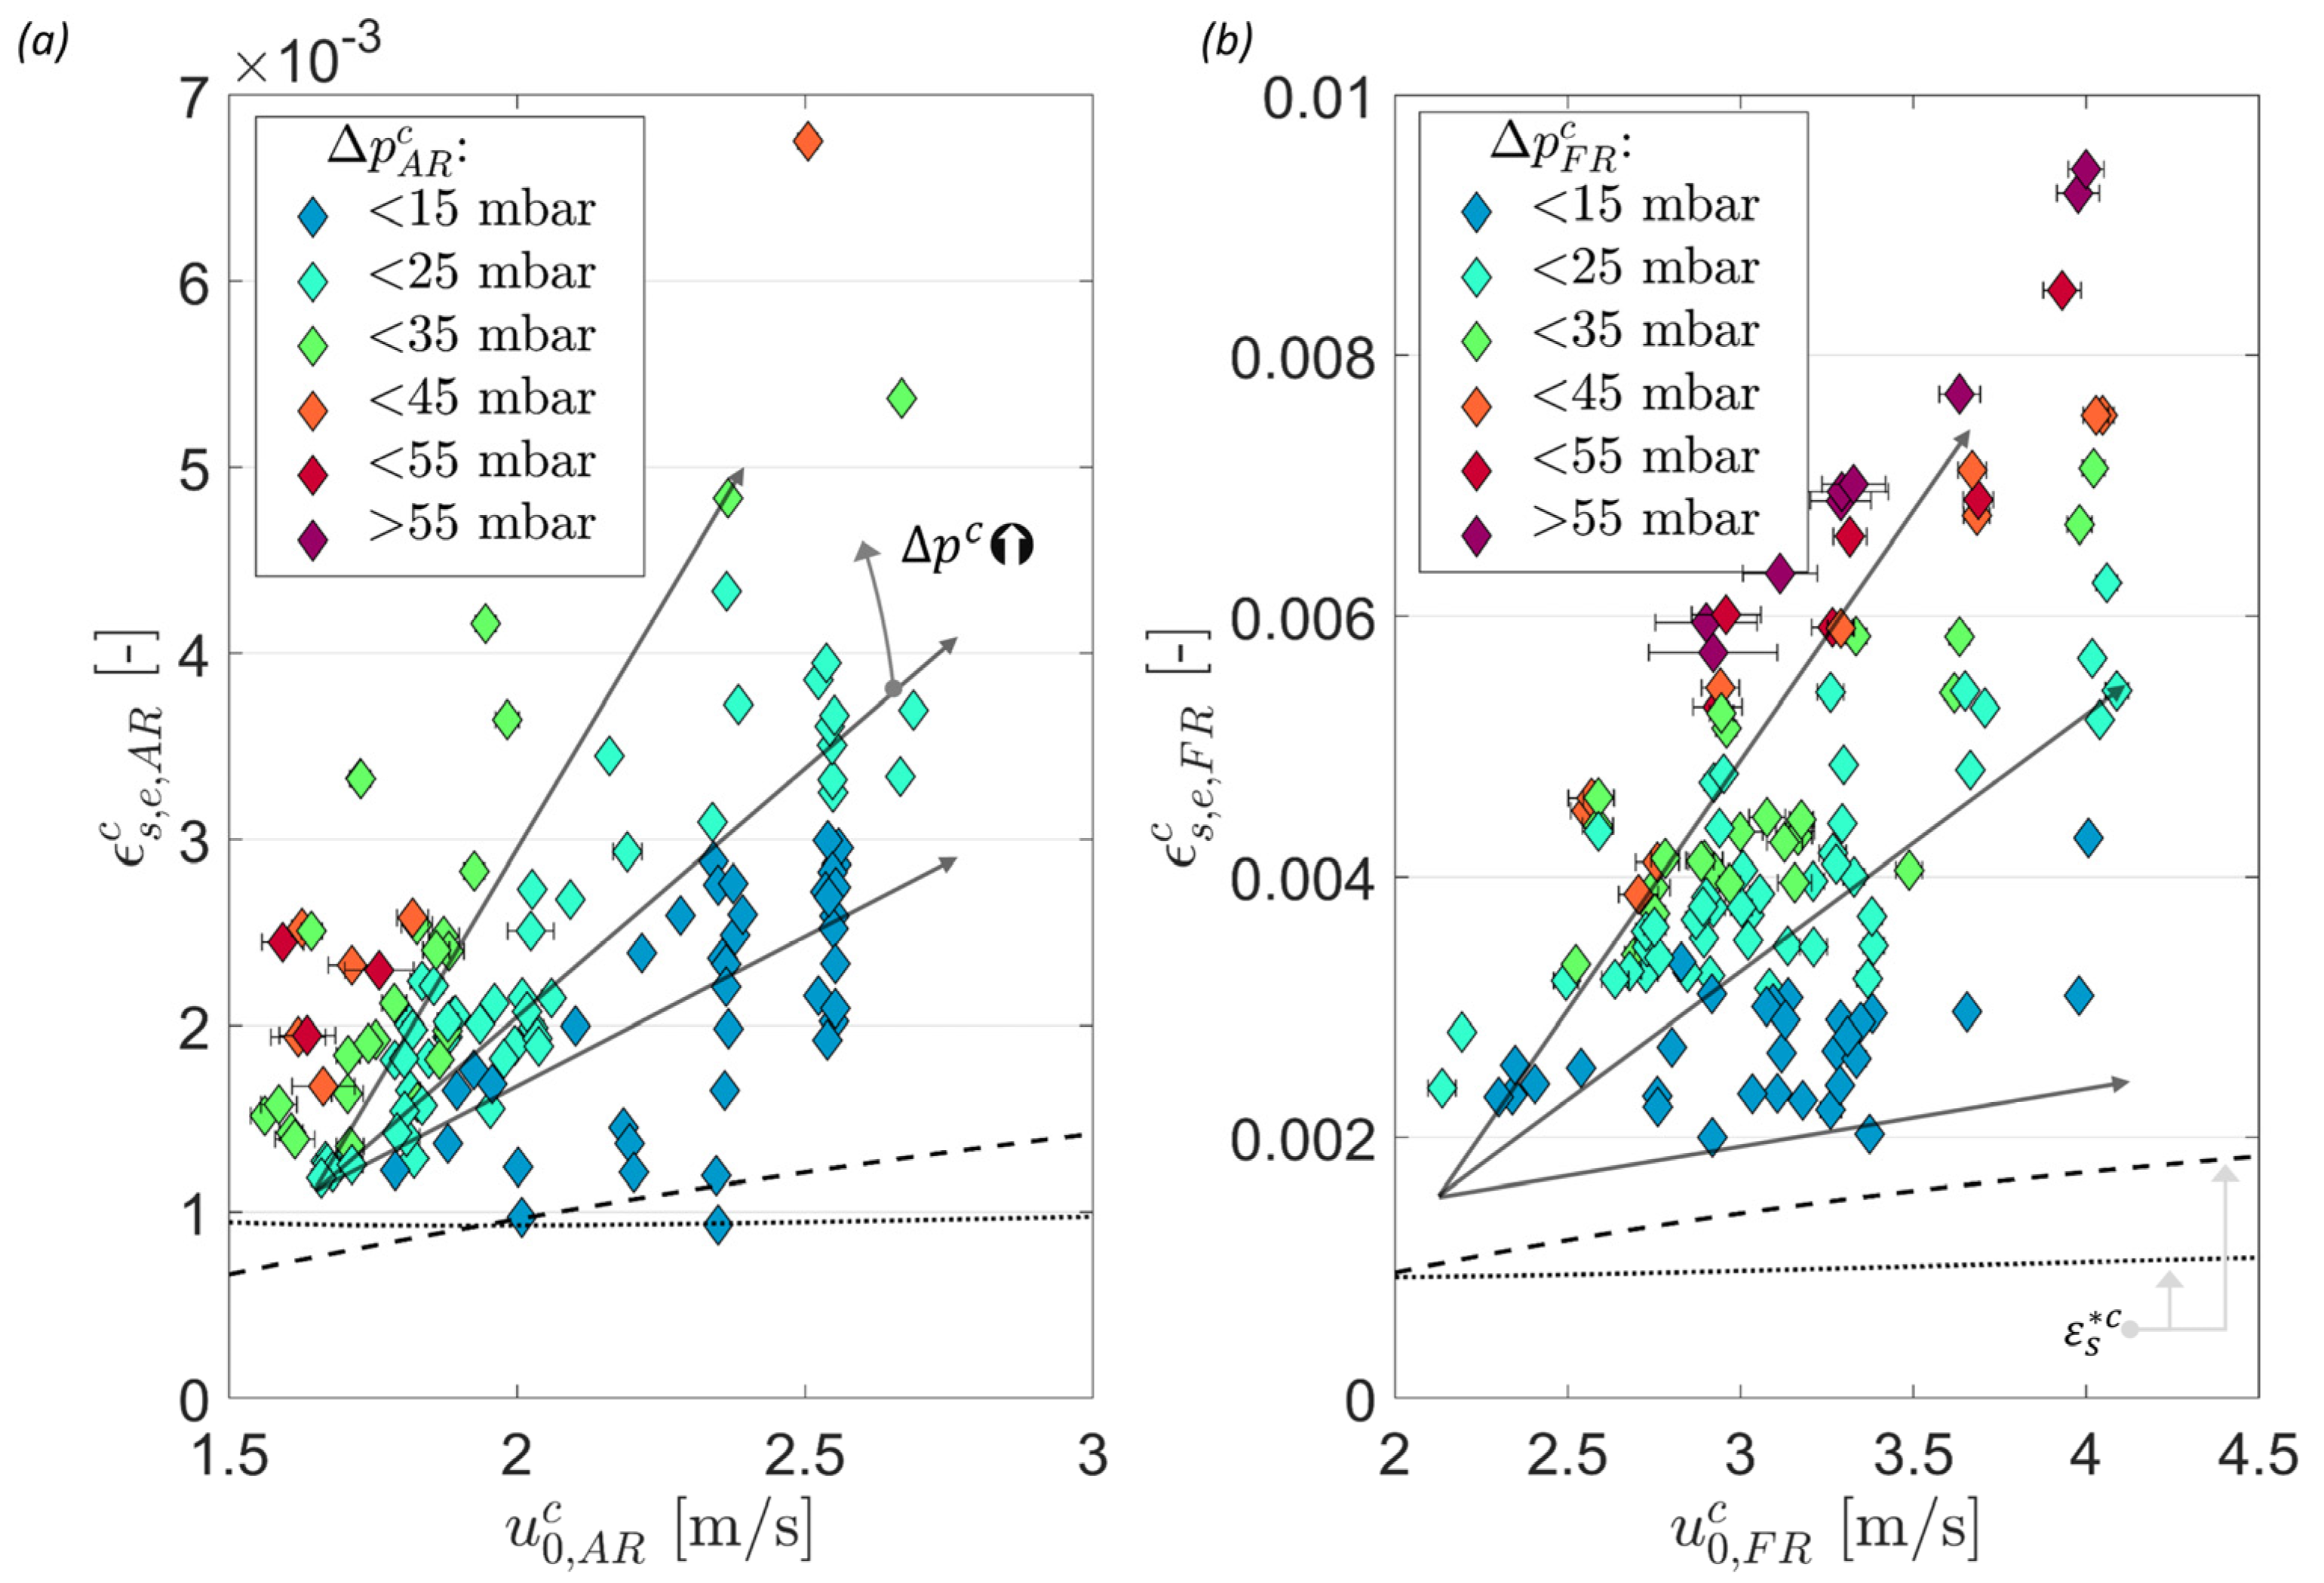
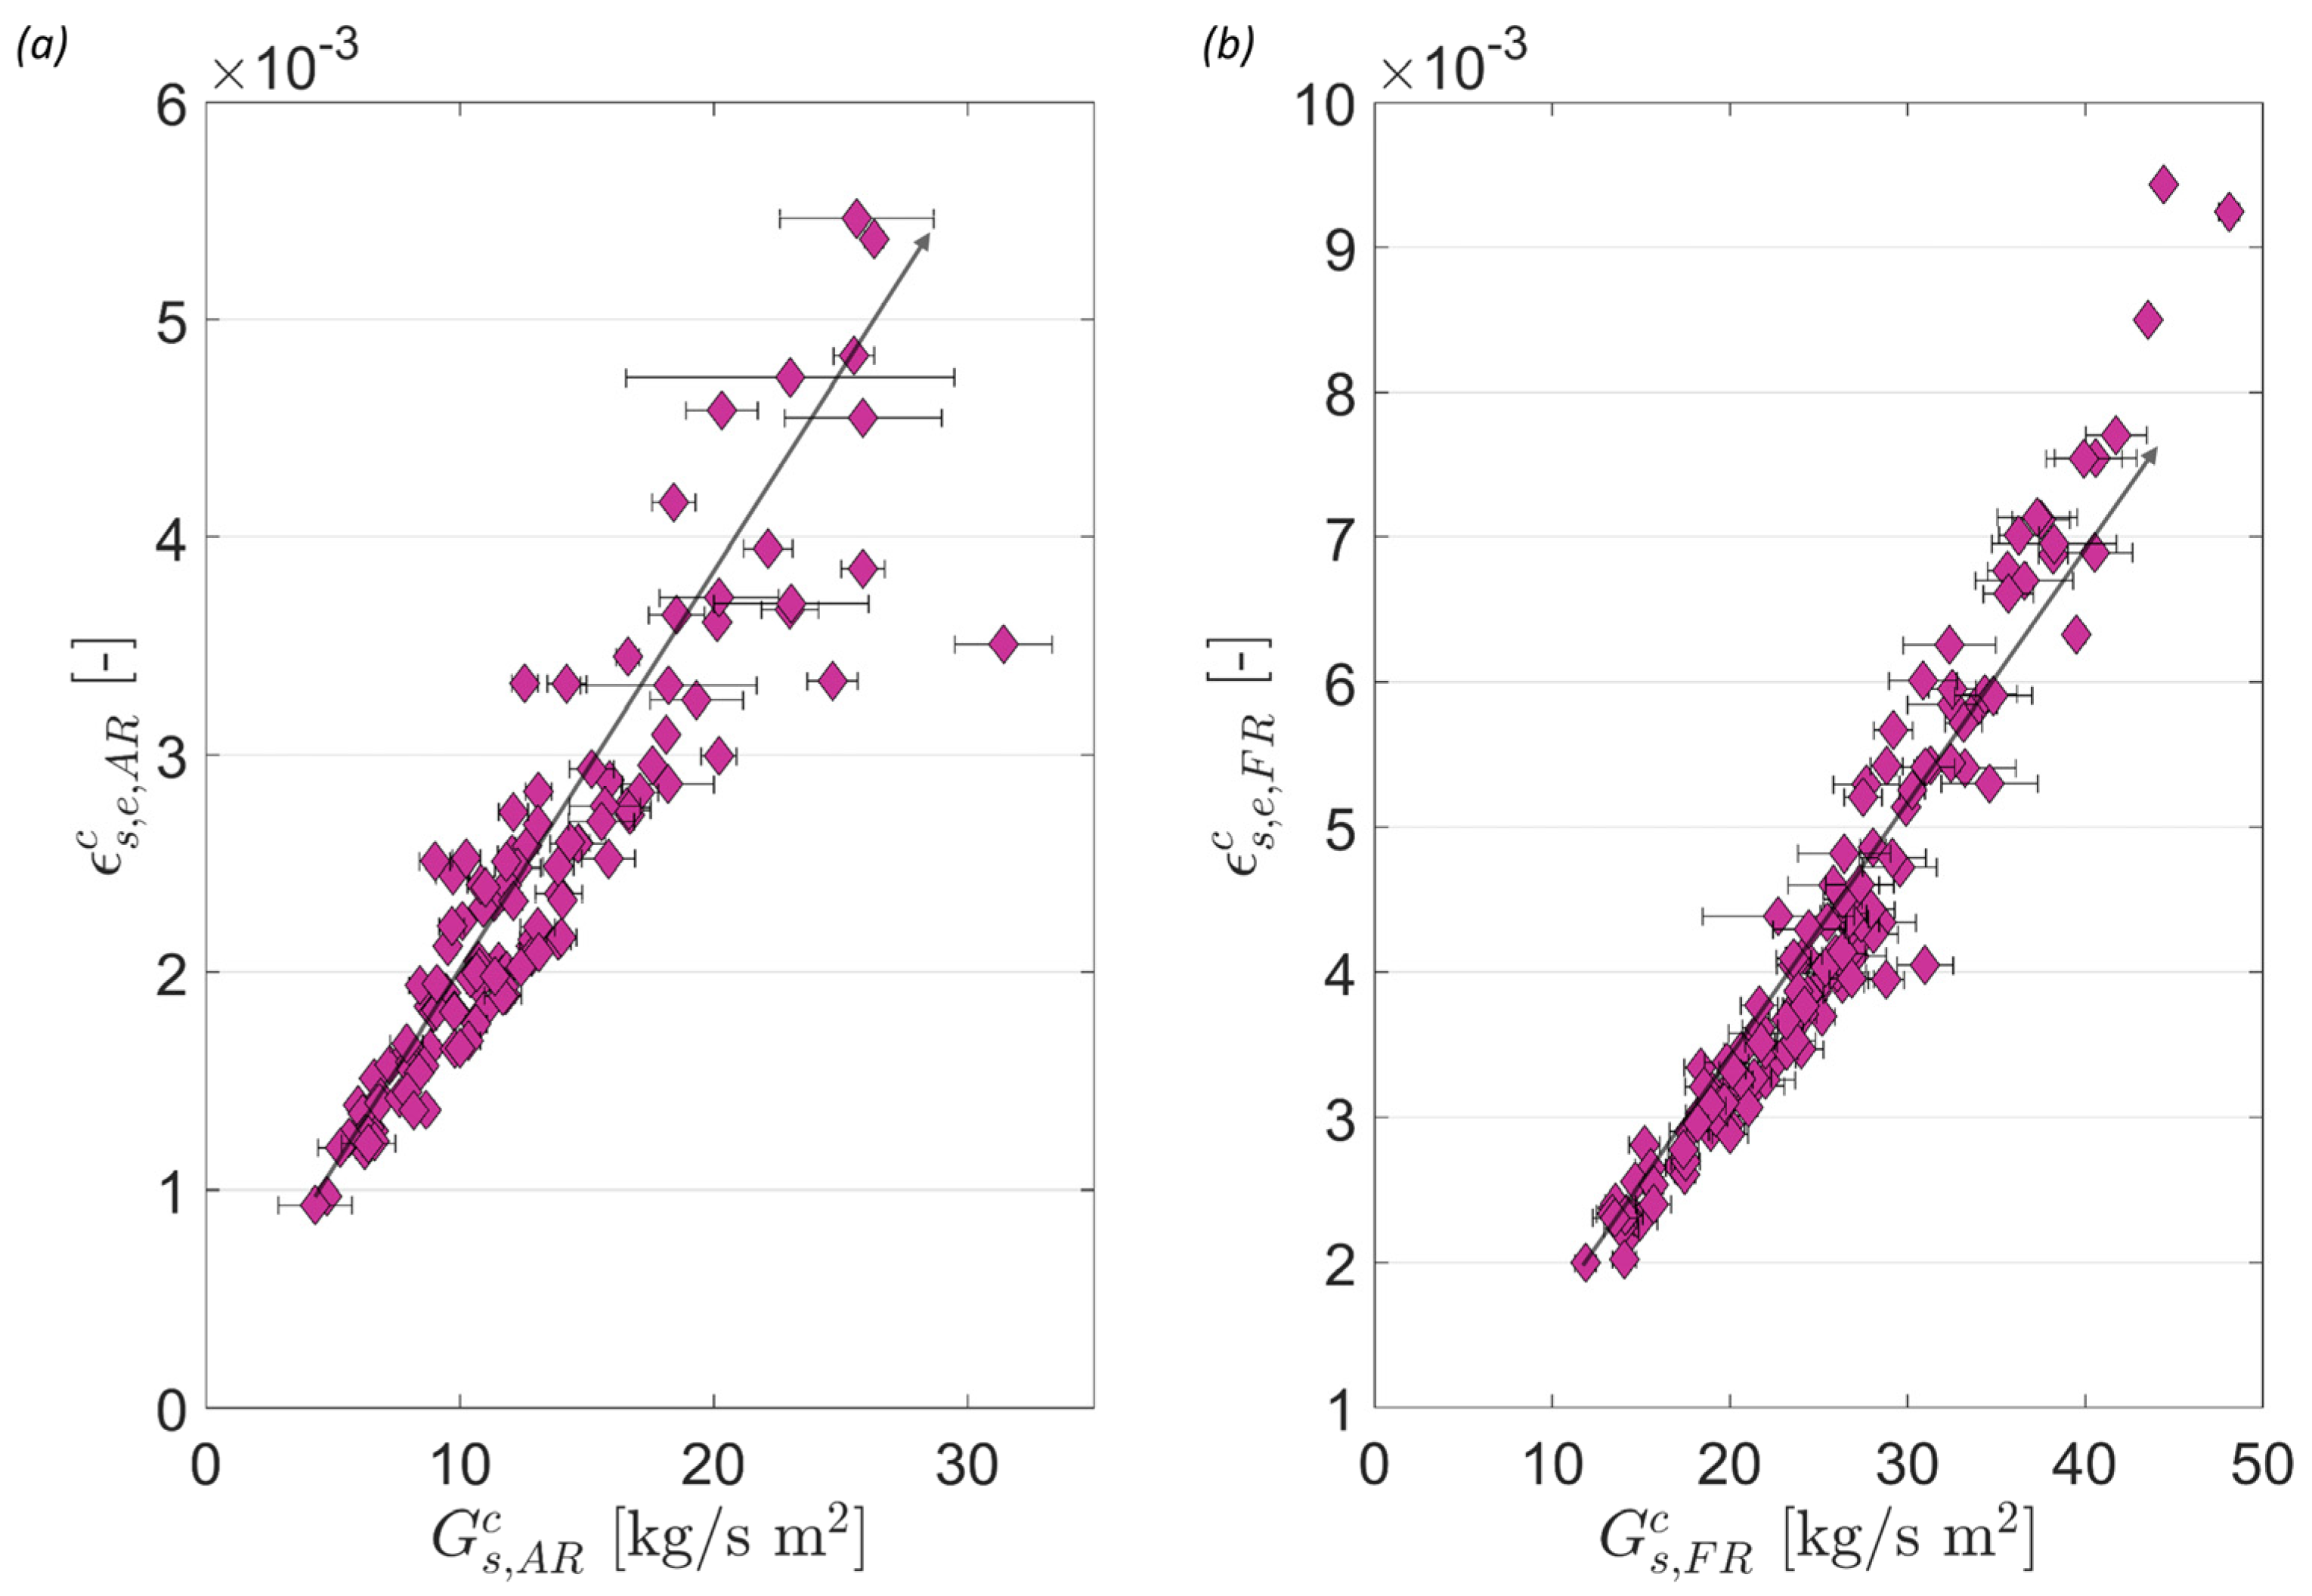
4.2. Entrainment and Solid Circulation of the Dual Circulating Fluidized Bed Reactor System

After establishing the hydrodynamic behavior of the dual-fluidized bed system and underlining the importance of solid entrainment from the AR and FR for stable operation and process control, this section will analyze the impact of different operating variables on entrainment from both reactors for the CFM (Section 4.2.1) and the 1 MWth pilot plant (Section 4.2.2).

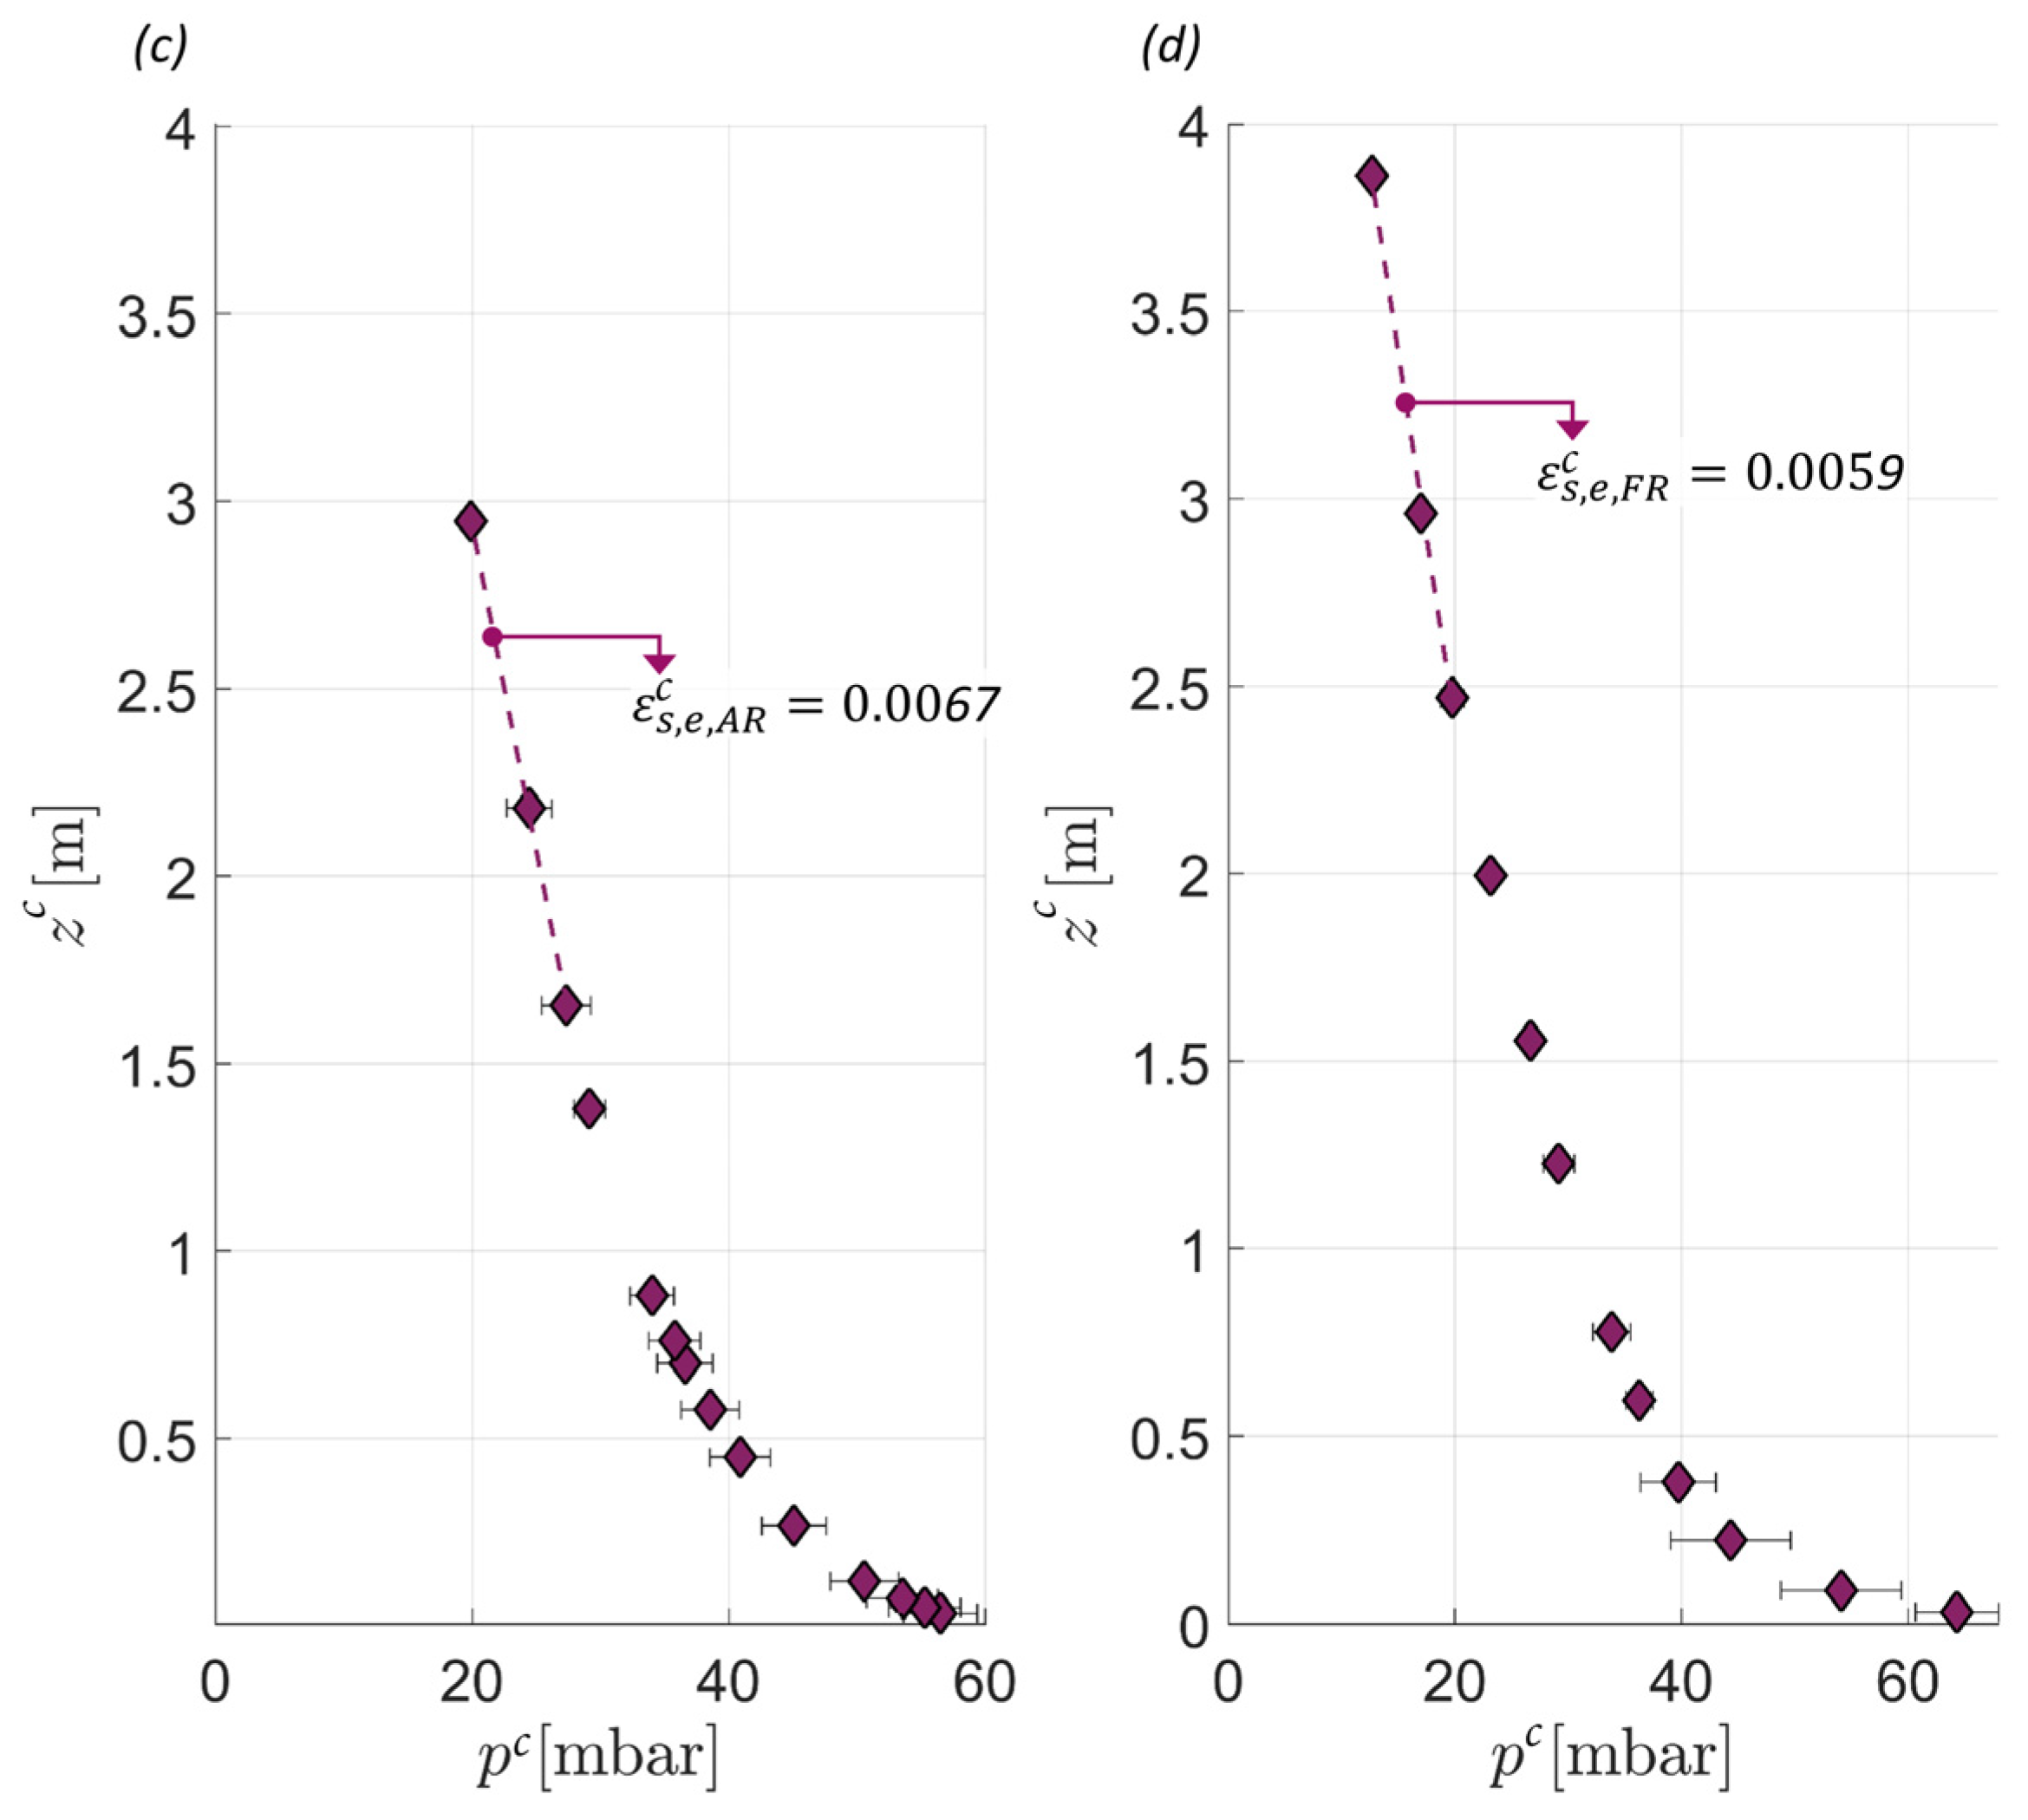
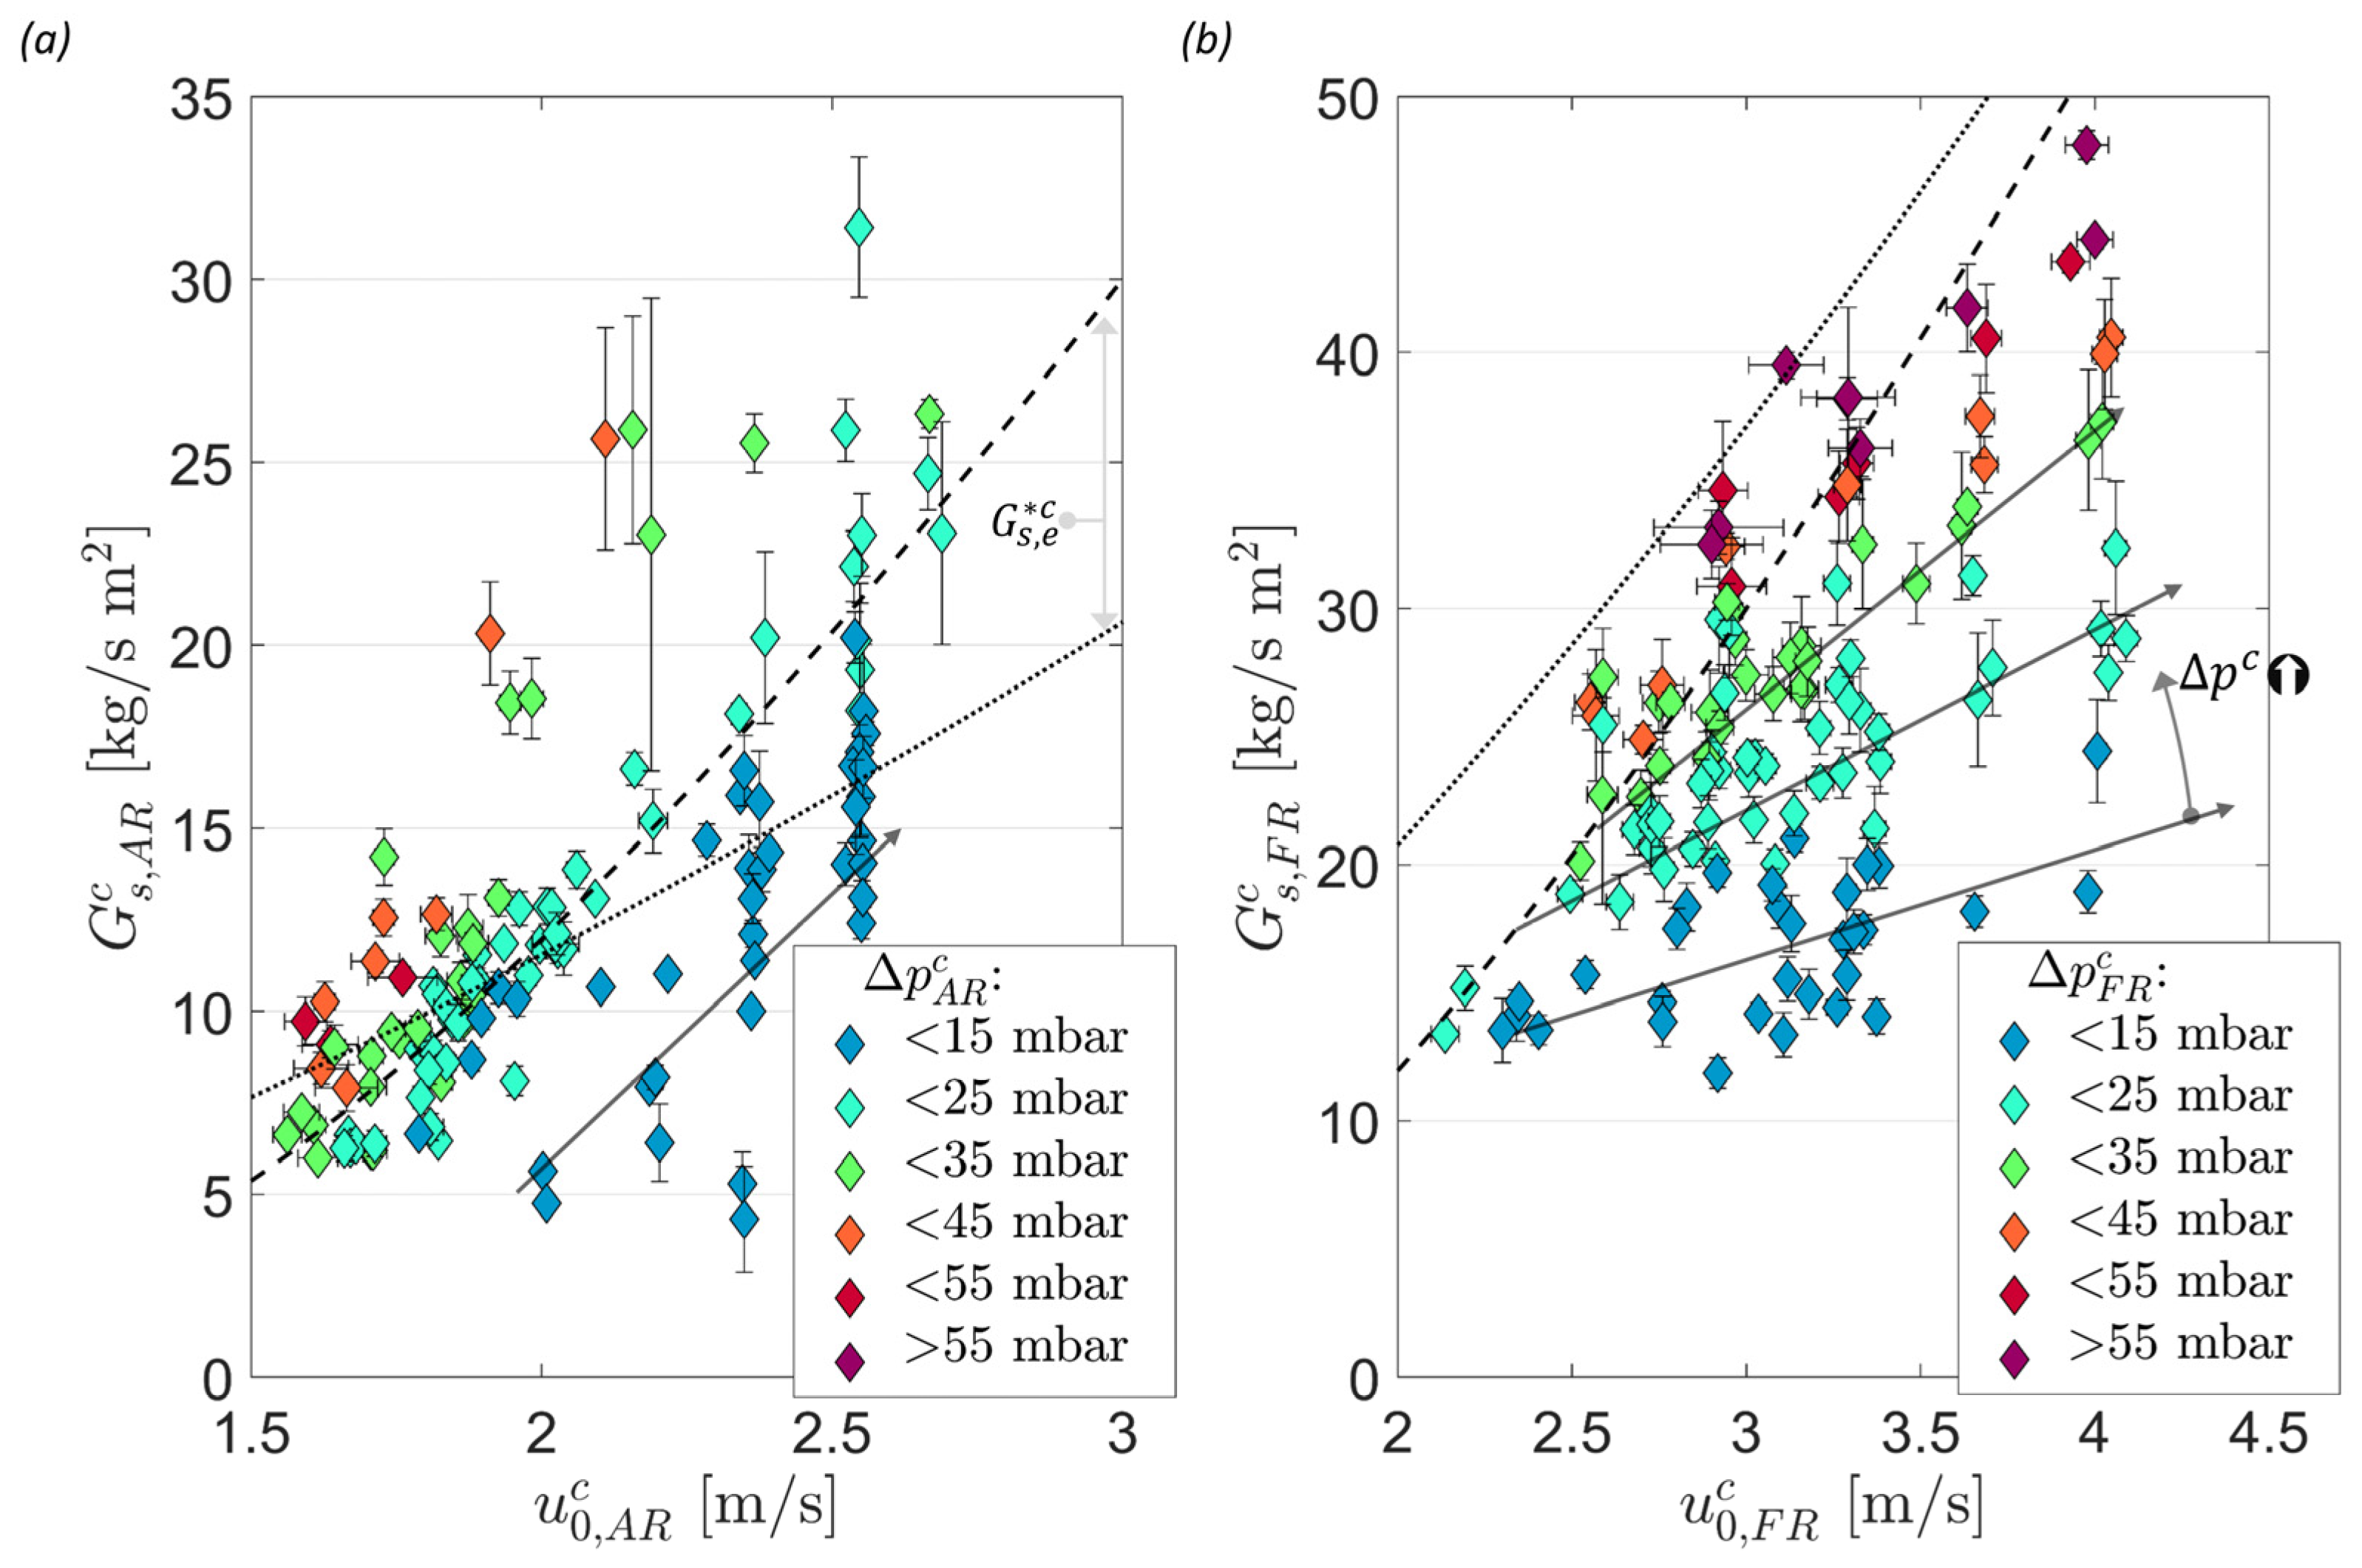
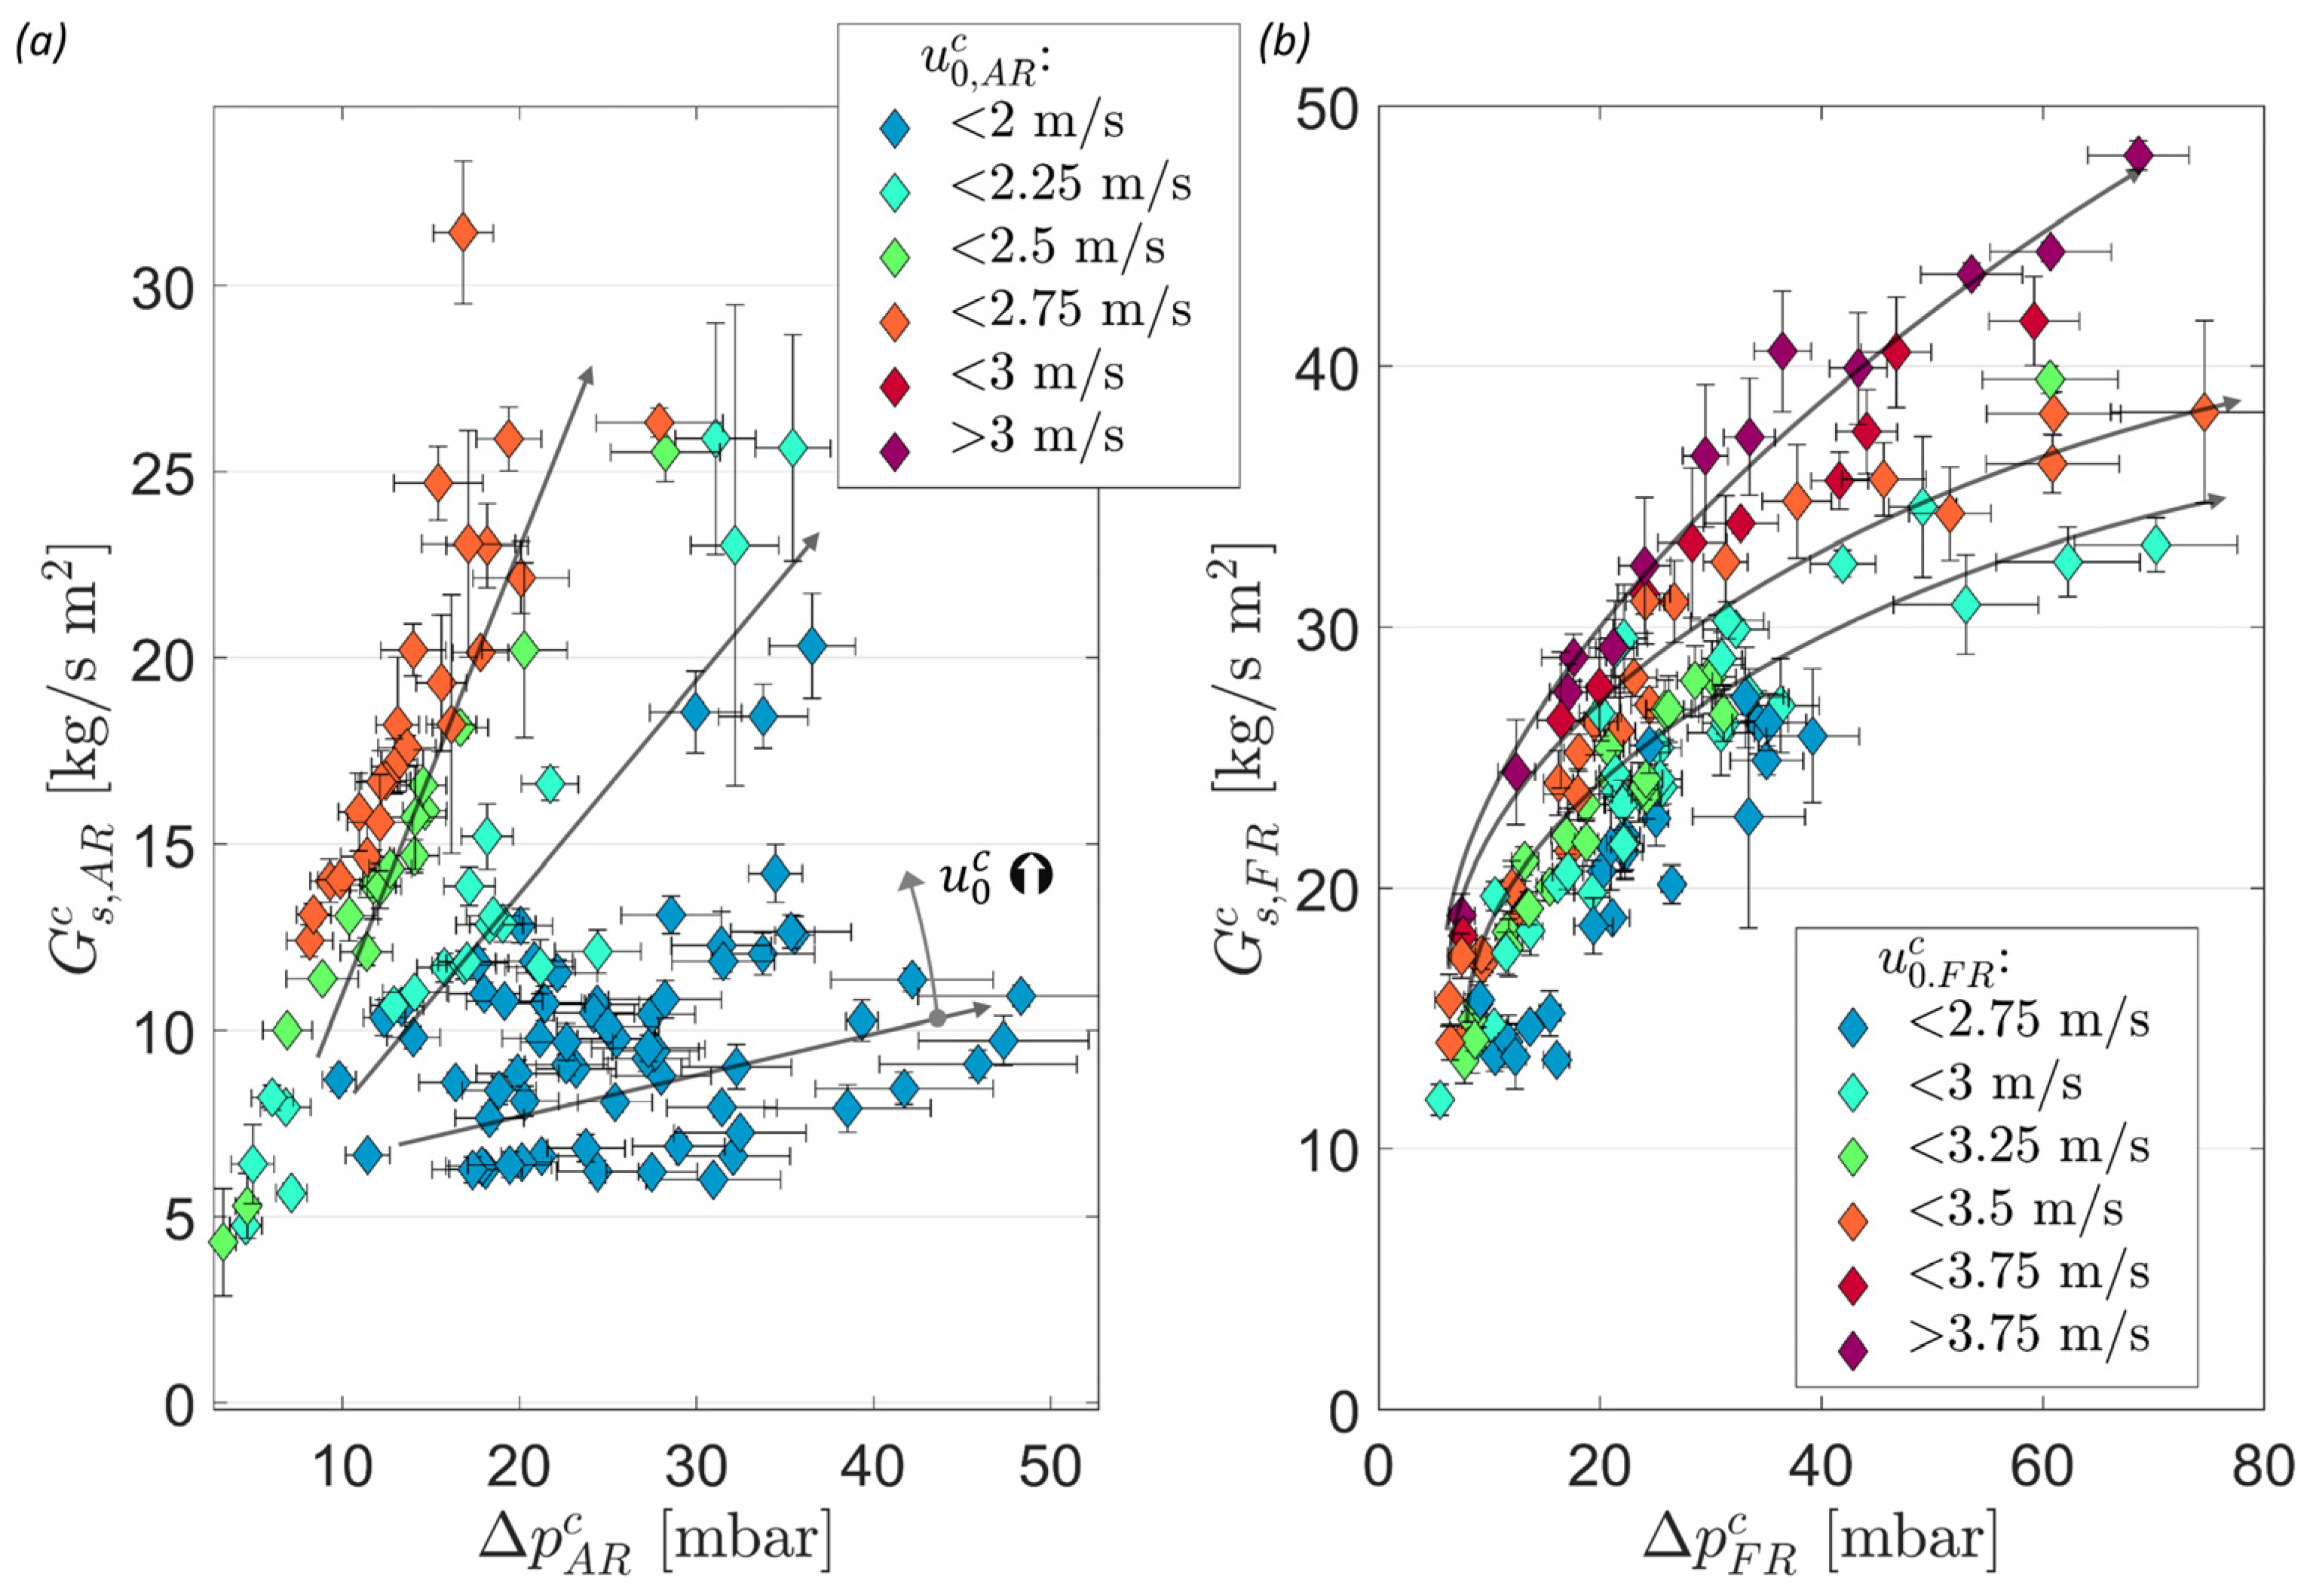
4.2.1. Entrainment from Dual Circulating Fluidized Bed Cold Flow Model

Due to the permanent presence of stable and unvarying boundary conditions (e.g., PSD, ρp), the achievability of rapid designated alterations of given operating variables, and the possibility to easily measure solid entrainment from both reactors (see Section 2.4.2), the CFM poses ideal conditions to examine the impact of different operating variables on solid entrainment. Subsequently, the impact of riser gas velocity, reactor inventory, and PSD on solid entrainment from the AR and FR will be evaluated. (As elaborated in Section 4.1, J-valve boundary conditions (i.e., gas velocity and acting pressure) also have an important impact on the overall system hydrodynamics. The most important correlations for the behavior of the J-valve are summarized in Appendix B.1).
It is well established that solid entrainment increases with riser gas velocity, with numerous approaches to quantify this impact existing in literature [53,61,62,63], which are, however, known to be restricted to given boundary conditions (e.g., particle type and properties, reactor layout, boundary conditions) [27]. Moreover, the entrainment determined via these approaches signifies the saturation carrying capacity of the gas in an idealized experimental setup. (Generally, this means that the setup exhibits a smooth reactor exit ( e n t . =1) and features a tall CFB riser with H   > TDH. Moreover, the CFB system has to be operated with a fully saturated dense bed with ε s   = const [61]).
The approaches by Tasirin and Geldart [53] and Breault et al. [38], elaborated on in Section 2.5, is given as a reference in Figure 14 (dashed and dotted line, respectively) together with the results determined experimentally in the CFM. It is visible that the experimental values show a similar trend as the values calculated via Equations (13) and (14), with entrainment increasing with increasing gas velocities. However, the following discrepancies can be observed in Figure 14:
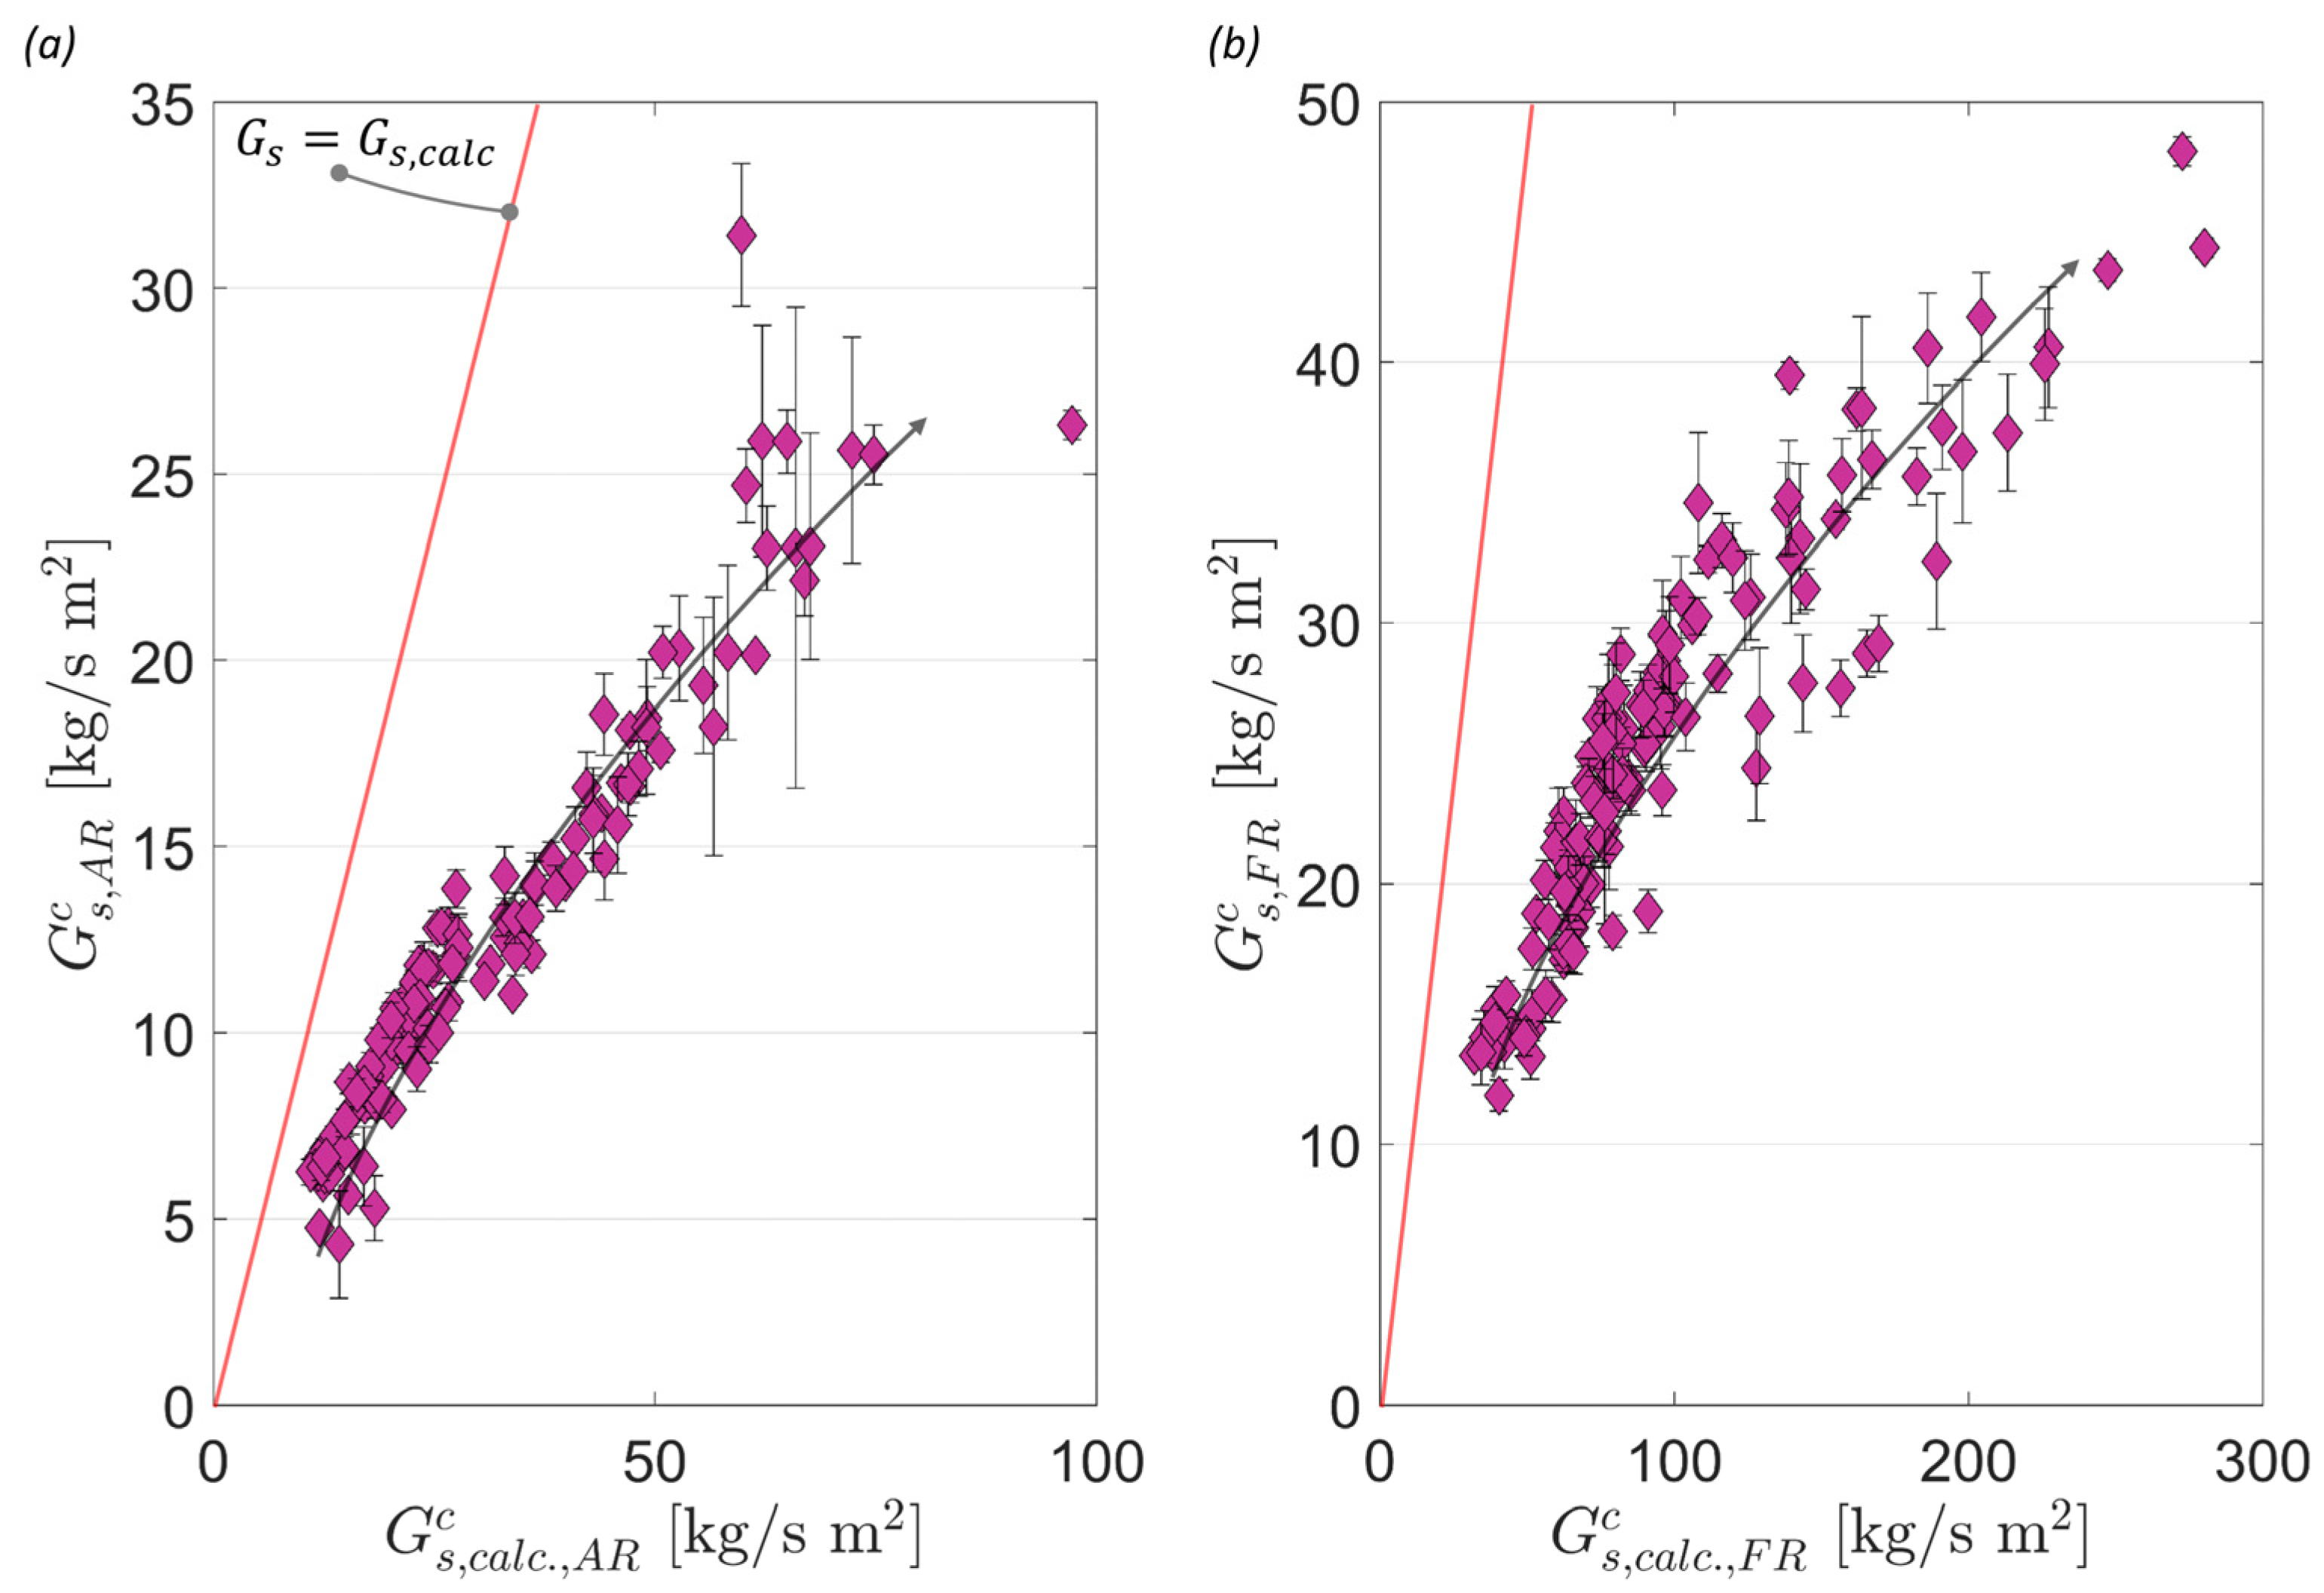
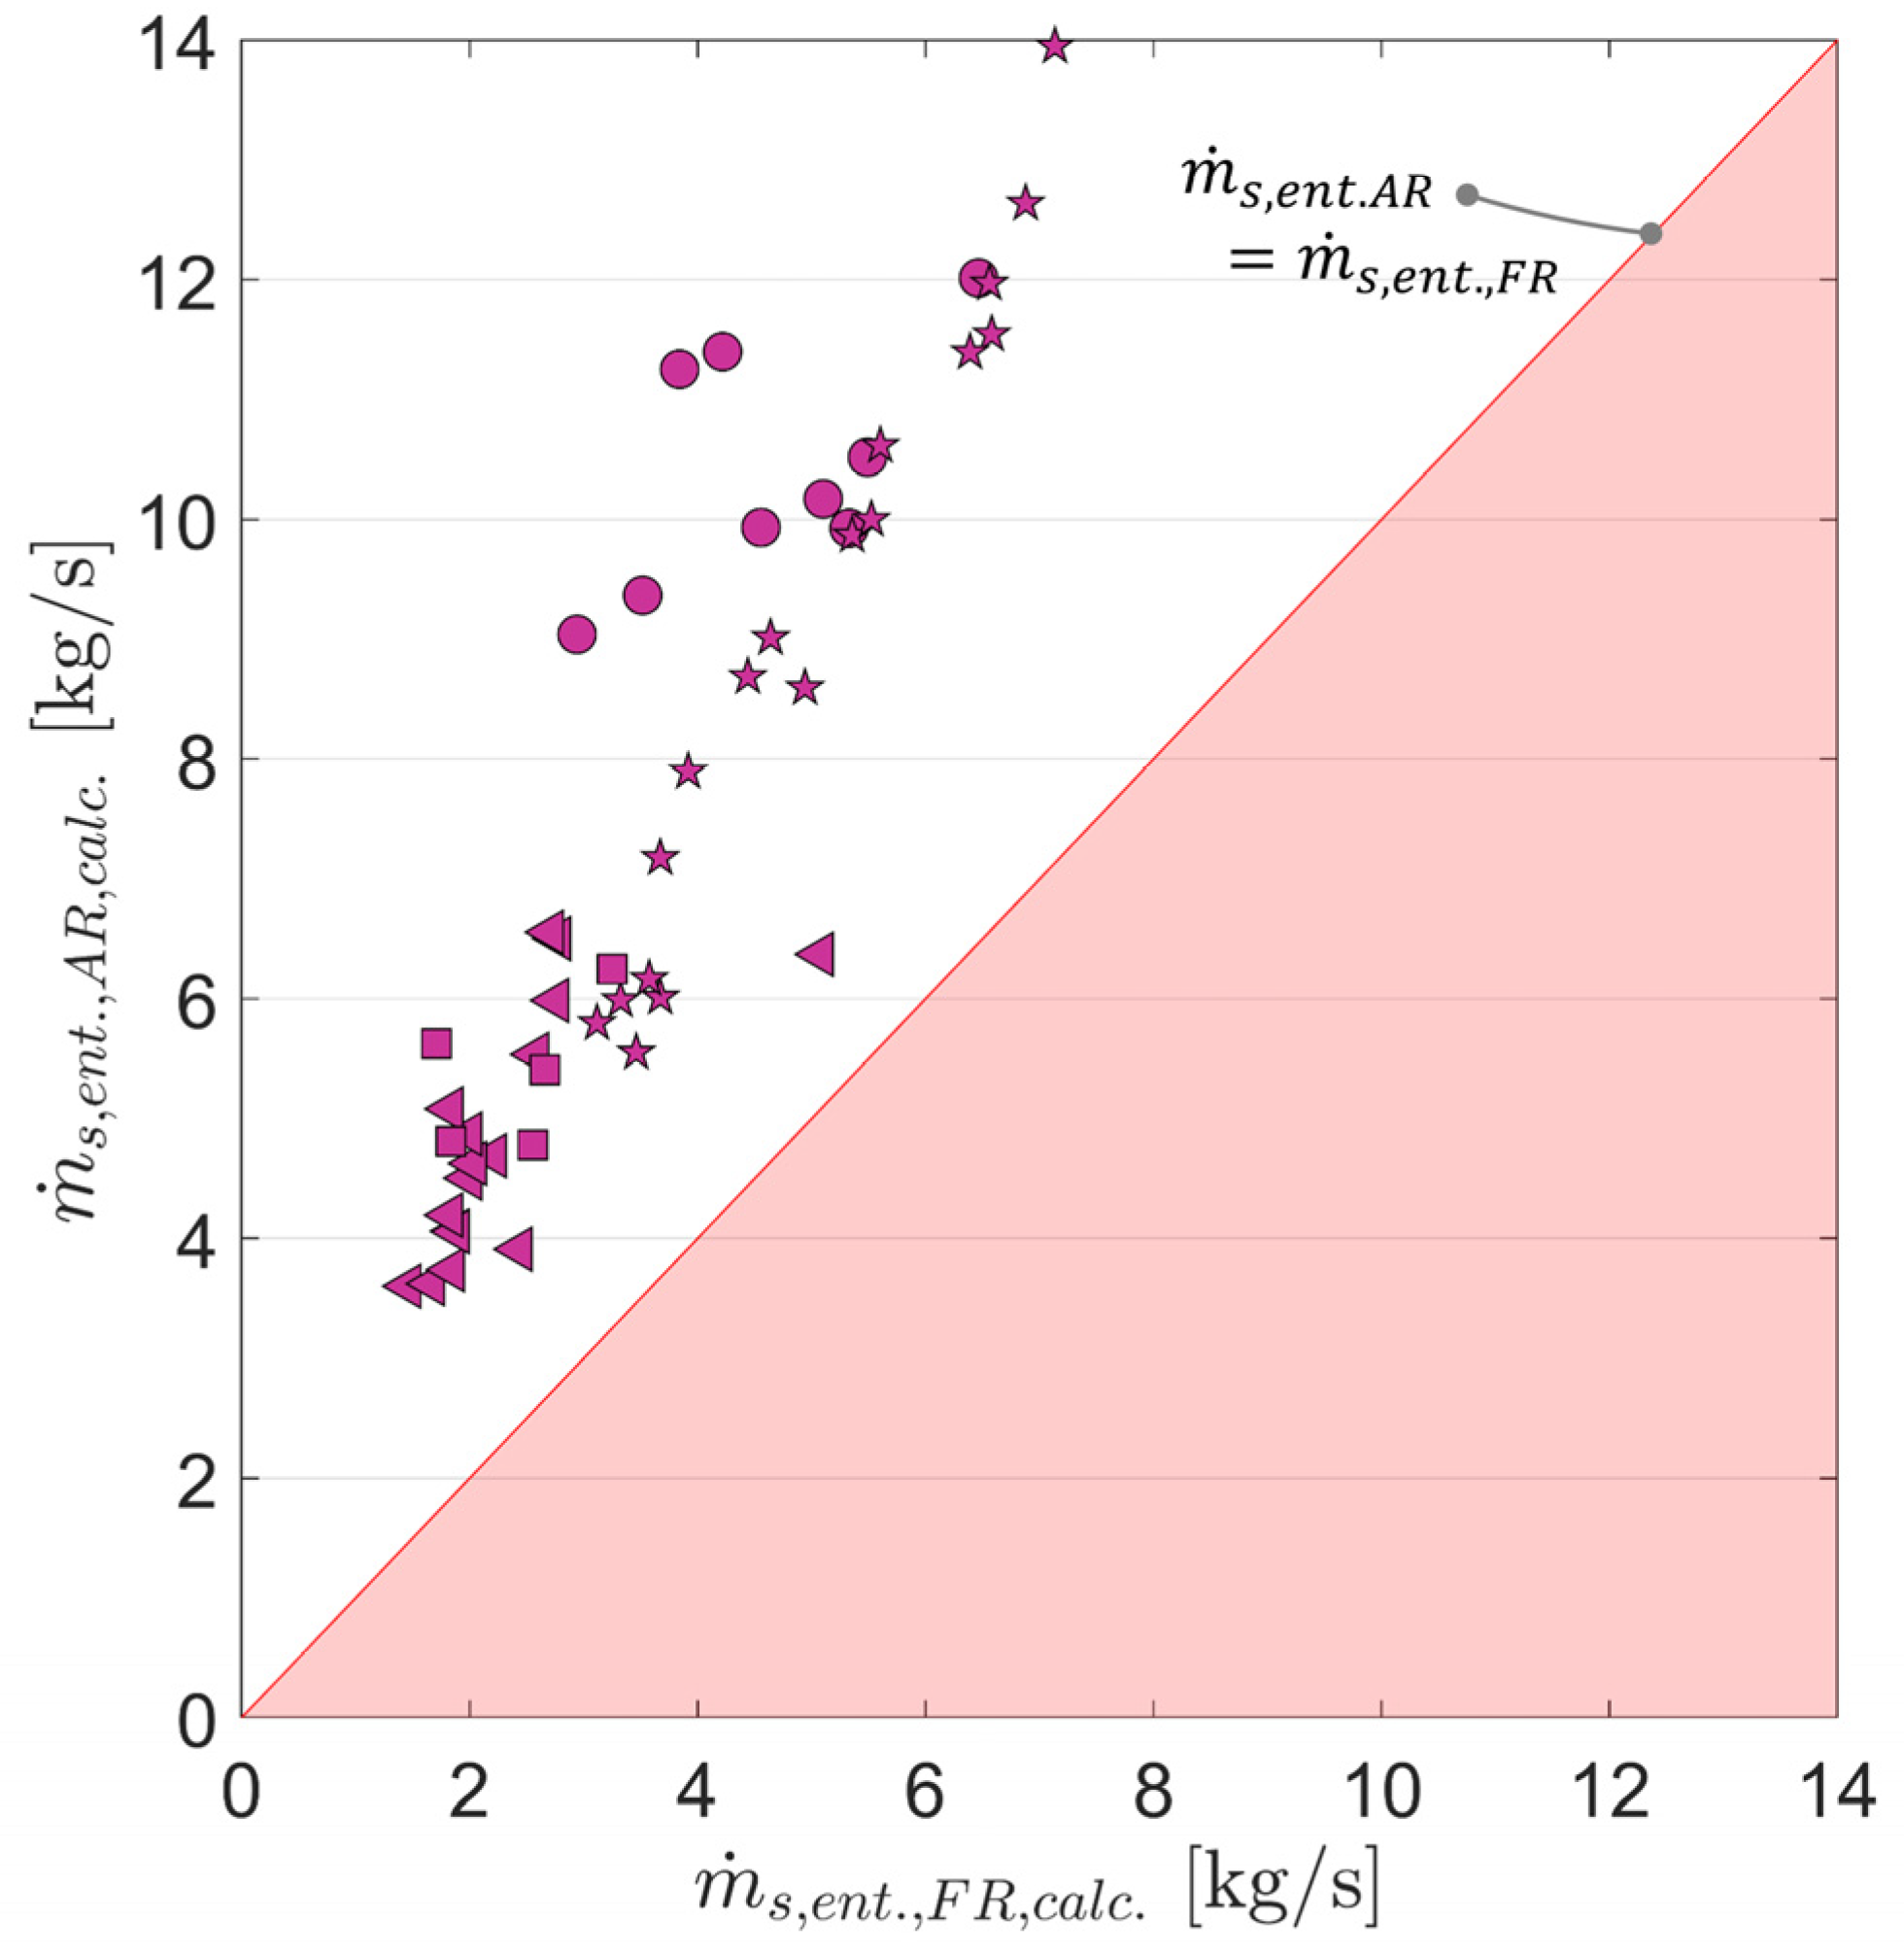
  • For most operating periods, the calculated values are larger than the experimentally determined ones for both reactors;
  • While a distinct impact of the reactor inventory on solids entrainment is visible in the experimental data in Figure 14 (esp. for the FR where the inventory was varied strongly), this is not reflected in the calculated data, as existing calculation approaches, allowing for a direct estimation without further fitting or modeling efforts, do not account for the effect of reactor inventory (see also Equations (8)–(14)).
Apart from the fact that the boundary conditions (e.g., PSD of bed material) in the CFM do not exactly match those used to derive Equations (13) and (14), the former can be explained by the fact that in a real CFB system, entrainment probabilities smaller than one are obtained (i.e., solid material travels back at the top of the riser, intensifying the core-annulus flow, see Figure 4). In order to cast light on the latter, i.e., the effect of reactor inventory on solids entrainment, Figure 15 shows the dataset from Figure 14 with Δp on the abscissa. As well established in literature [23,49], entrainment increases with increasing riser pressure drop, which can be related to two phenomena (albeit only the latter is relevant for tall CFB risers):
(i)
For CFB reactors with heights smaller than the TDH, solid loading decreases continuously with increasing reactor height (i.e., the solid loading does not reach a constant value within the riser). As the reactor inventory is increased, the height of the bottom bed increases, leading to a decrease in the distance from the top of the dense bed and the reactor outlet and hence an increase in solid concentration throughout the entire freeboard. Due to this higher solid concentration in the freeboard, entrainment increases; [27]
(ii)
With increasing reactor inventory, bubble coalescence in the bed intensifies, leading to a more pronounced ejection of particles into the freeboard when those larger bubbles reach the top of the dense bed [27]. As particle concentrations in the freeboard increase due to this effect, entrainment intensifies.
While a continuous linear increase in entrainment with reactor inventory is visible for the AR for a given gas velocity (see Figure 15a), the data follows a logarithmic-like trend for the FR. Another notable finding, visible in Figure 15b, is that the effect of gas velocity on solids entrainment is weaker for the FR (especially fast-circulating at ΔpFR < 20 mbar). These findings indicate that although both reactors are operated as fluidized beds according to the categorization of Grace [27,28], they behave differently to changes of the underlying boundary conditions. An explanation for this can be obtained when considering the different geometries of the two CFBs. While the FR exhibits a small reactor diameter and a large riser height, resembling the key features of a tall CFB, the opposite is true for the AR. Consequently, changes in reactor inventory lead to the fact that the transport disengaging height reaches the reactor exit region even at low inventories for the AR, as the distance from the top of the dense bed to the reactor exit is comparably small, which is illustrated in the bottom four subplots of Figure 16. Hence, solid entrainment increases with increasing reactor inventory due to (i) and (ii) for the AR and the effect of the reactor inventory on entrainment is pronounced. Moreover, as the TDH increases with gas velocity [64], the effect of gas velocity on entrainment is strong for the AR, as more and more coarse particles (even those with ut > u0) reach the reactor exit with increasing u0 for a given reactor inventory. On the other hand, the TDH only reaches the reactor exit zone for large reactor pressure drops (Δp > 40 mbar) for the FR, exhibiting tall CFB characteristics (see top subplots in Figure 16). Hence entrainment rates only increase weakly with increasing u0 for low reactor inventories for the FR. Once the TDH reaches the reactor exit zone (at approx. 40 mbar), the positive impact of u0 on entrainment rates increases for the FR, as (i) and (ii) come into effect. The strong impact of Δp on entrainment rates for the FR at low reactor inventories (Δp < 20 mbar), visible in Figure 15, can be attributed to the formation of a dense bed once the reactor features sufficiently high reactor inventories, thus leading to a pronounced increase in solid entrainment for a given gas velocity [46], due to (ii).
Another parameter known to affect solid entrainment from a fluidized bed [27], which is prone to changes in a chemical looping setup (e.g., due to attrition, agglomeration, etc.) [57], is the particle size distribution of the bed material cycled through the system. To investigate the impact of this parameter on solid entrainment, the AR of the CFM was operated with the two different ilmenite types (ILMc and ILMf, see Section 2.3) at four different gas velocities. The results of this experimental series are summarized in Figure 17. When comparing the calculated theoretical entrainment velocities (see Equation (10)), for the fine (0.84 m/s) and coarse (1.66 m/s) ilmenite in air (ρg = 1.225 kg/m3, μg = 1.9 10−5 Pa s), it becomes obvious why entrainment was negligible for the lowest investigated gas velocity (approx. 1.3 m/s) for the coarse ilmenite. On the other hand, measurable entrainment was observed for all four investigated gas velocities for the fine material, as the terminal velocities were exceeded for each operating period. Moreover, entrainment rates for the fine ilmenite were approximately four times larger than for the coarse ilmenite for each gas velocity, with the absolute difference in entrainment increasing substantially with increasing u0 (see also Equation (13)). These findings clearly indicate the effect of particle size on entrainment, highlighting that in case of process-related changes of this parameter, significant impacts on system hydrodynamics, related to changes in the entrainment behavior of the particle system, can be expected. Consequently, exact knowledge of the PSD in the hot system is necessary to be able to adequately scale it in the cold flow model, due to the strong sensitivity of entrainment on the PSD of the particle system. Following this logic, in case of the occurrence of unexpected process-related changes of this parameter during hot operation, results obtained through a priori experiments in a scaled cold flow model will become unusable for direct scaling attempts. This means that without prior knowledge of the impact of the hot process conditions on the bed material’s properties (e.g., PSD), adequate scaling in a CFM becomes challenging.
In summary, the findings regarding entrainment from both risers made in the CFM setup show that for a given reactor setup and particle system, gas velocity and reactor inventory are the main operating variables affecting solids entrainment. For given boundary conditions, changes in the bed material properties (e.g., PSD, ρp) were demonstrated to significantly alter solid entrainment. Therefore, general trends and approximate values for solid entrainment can be predicted via CFM studies, yet direct extrapolations from the dataset are only viable in case all boundary conditions match the scaled ones in the hot unit. Additionally, correlations not considering the entire state of the CFB system (i.e., particle properties, reactor geometry, gas velocity, and reactor inventory) cannot be expected to yield accurate predictions.

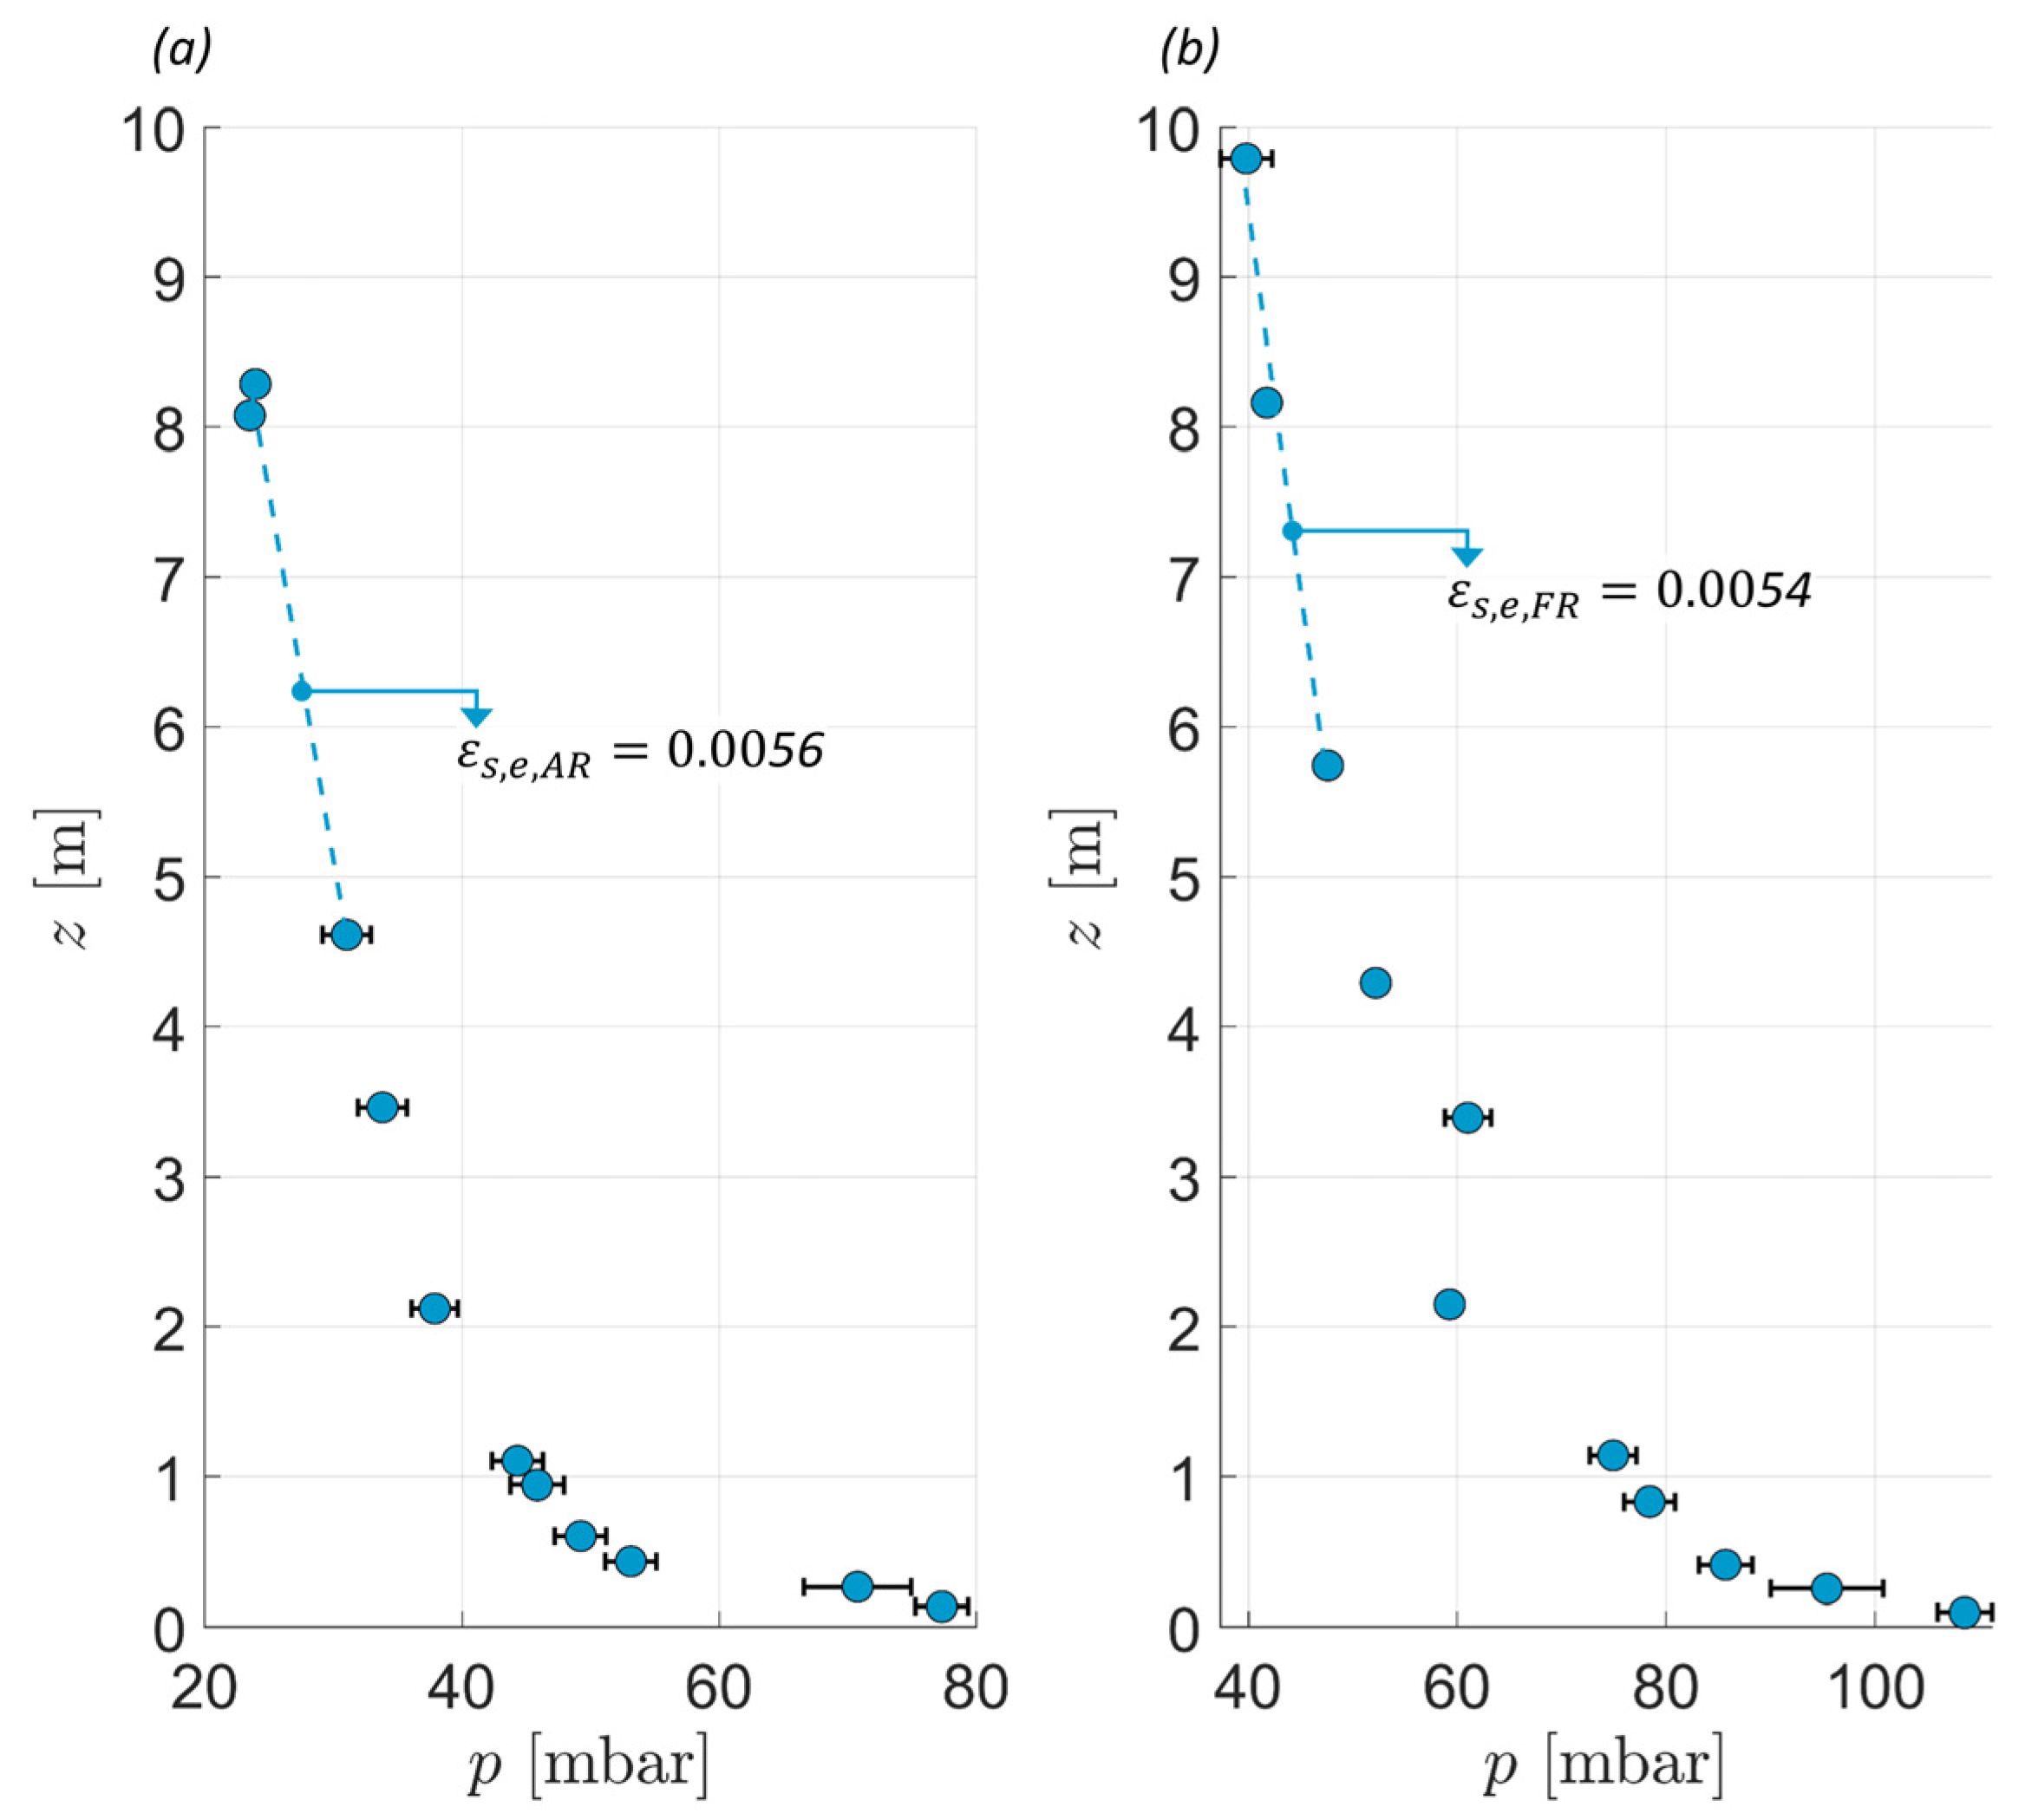
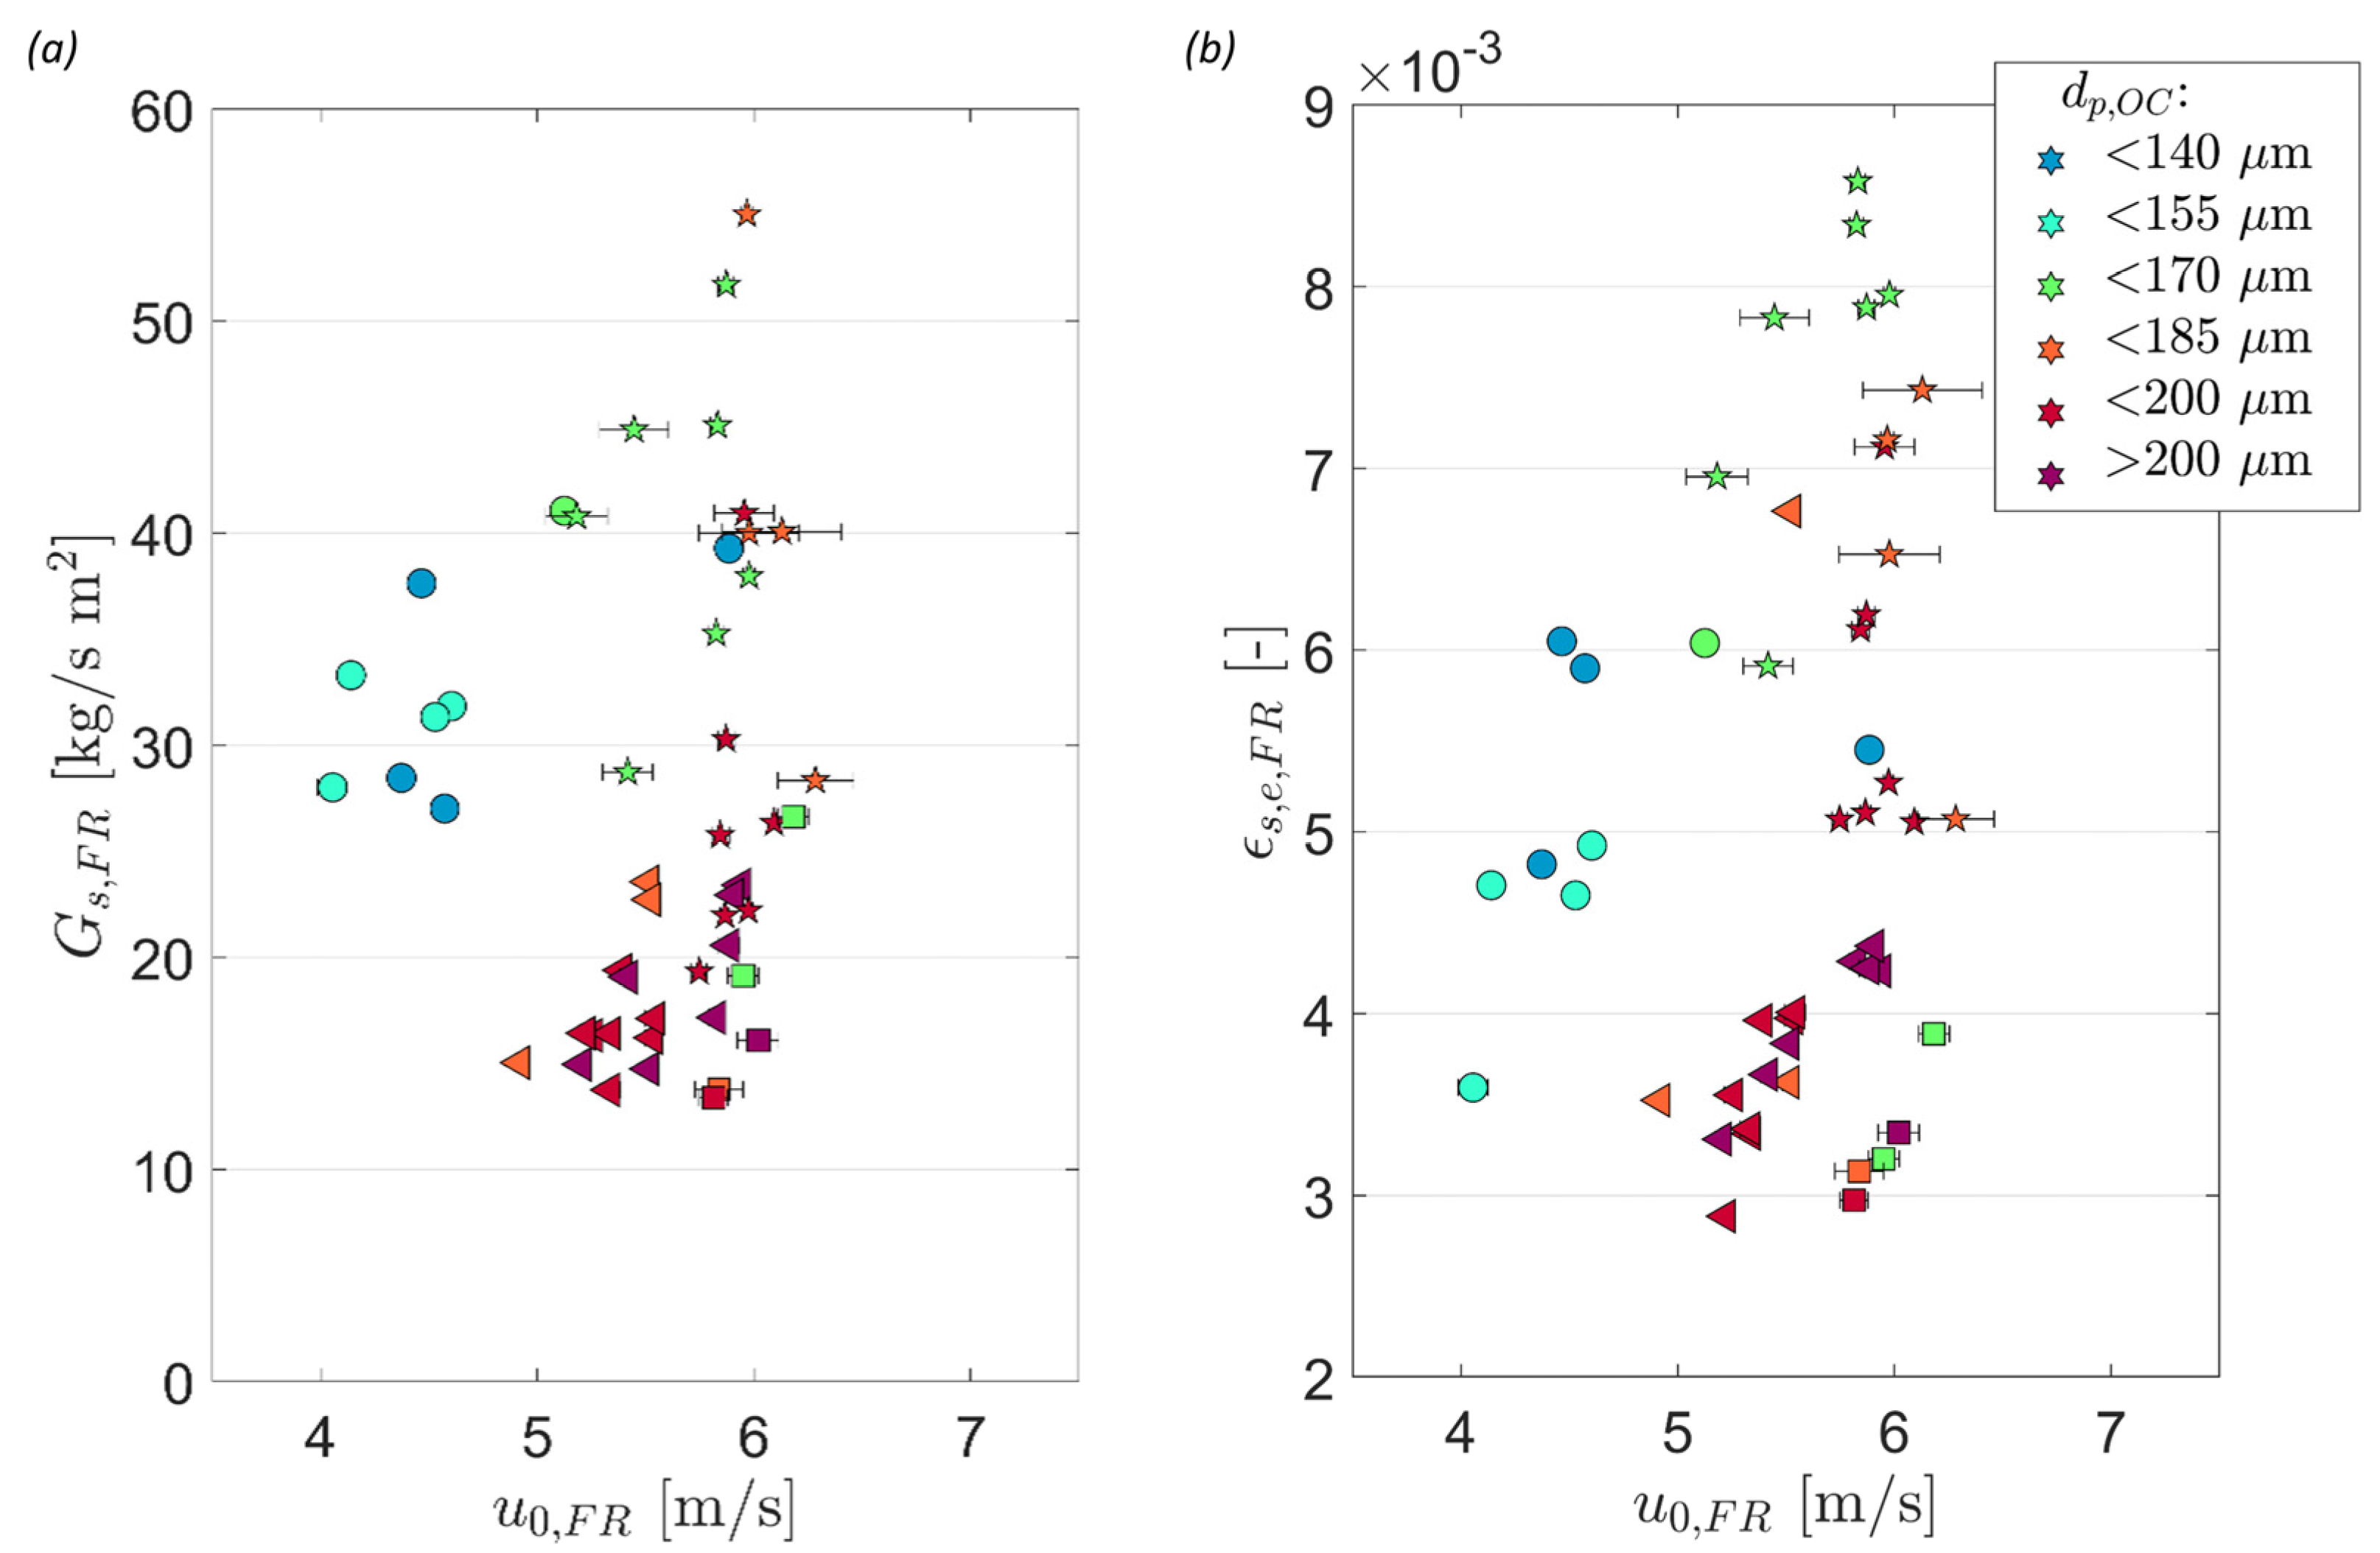
4.2.2. Entrainment from 1 MWth DFB Chemical Looping Gasifier

Using the insights regarding entrainment from the CFM, the entrainment behavior of the 1 MWth pilot plant is further illuminated in this section. As only the global solid circulation can be determined in the hot unit, using the approach detailed by Marx et al. [50], the subsequent elucidations will be restricted to the entrainment rates from the FR.
Figure 18 summarizes the calculated entrainment from the FR for all three test campaigns in the 1 MWth unit. Due to simultaneous occurrence of multiple phenomena and the increased effort necessary to determine values for the solid entrainment when compared to the CFM, a controlled parameter study for the most important hydrodynamic boundary conditions was not possible for the 1 MWth unit. Nonetheless, 49 operating periods, for which loop seal samples were collected and boundary conditions were kept constant, exhibiting varying FR gas velocities, reactor inventories, and particle diameters were aggregated. (Albeit other parameters crucial for system hydrodynamics (e.g., ρp) were found to vary between operating periods, elaborations are restricted to the three selected variables, having the strongest effect on entrainment, for brevity). When considering the data points shown in Figure 18a, a clear dependence of solid entrainment on gas velocity is visible. Moreover, two distinct regions, one with operating periods for which ilmenite with a mean diameter smaller than 170 µm was used and one with operating periods for which dp,m > 170 µm, are visible, showing that in order to maintain sufficiently high global solid circulation rates in the CLG unit, higher gas velocities are necessary when dp,m increases. This is also visible in Figure 18b, showing that the calculated solid concentration at the reactor exit (εs,e) is significantly lower at higher dp,m for a given gas velocity, illustrating that transferring larger particles towards the reactor exit requires higher gas velocities (see also Section 4.2.1). In terms of the reactor inventory, clear-cut effects on solids entrainment were not discernable for the 1 MWth unit, which is caused by the fact that the number of operating periods for which u0 and dp,m are similar, but ∆p varies is limited.
Therefore, it can be concluded that while some of the general trends regarding solids entrainment, established in the CFM, are also visible in the dataset collected for the 1 MWth pilot plant, the increased system complexity of the latter as well as the smaller size of the corresponding dataset make a direct comparison of both datasets for prediction purposes difficult. This will be elaborated in detail in the subsequent Section 4.3 before an alternate approach to purposefully predict the solids entrainment in the 1 MWth unit will be introduced.

4.3. Prediction of Entrainment and Solid Circulation of Dual Circulating Fluidized Bed Reactor System

In a first attempt to predict solid entrainment, the data obtained from the CFM is scaled according to Glicksman’s simplified scaling laws (see Section 3), in order to assess the promise of the direct scaling approach for entrainment estimation in Section 4.3.1. Thereafter, a novel approach to estimate entrainment from live data measured during CFB operation is derived and applied in Section 4.3.2.

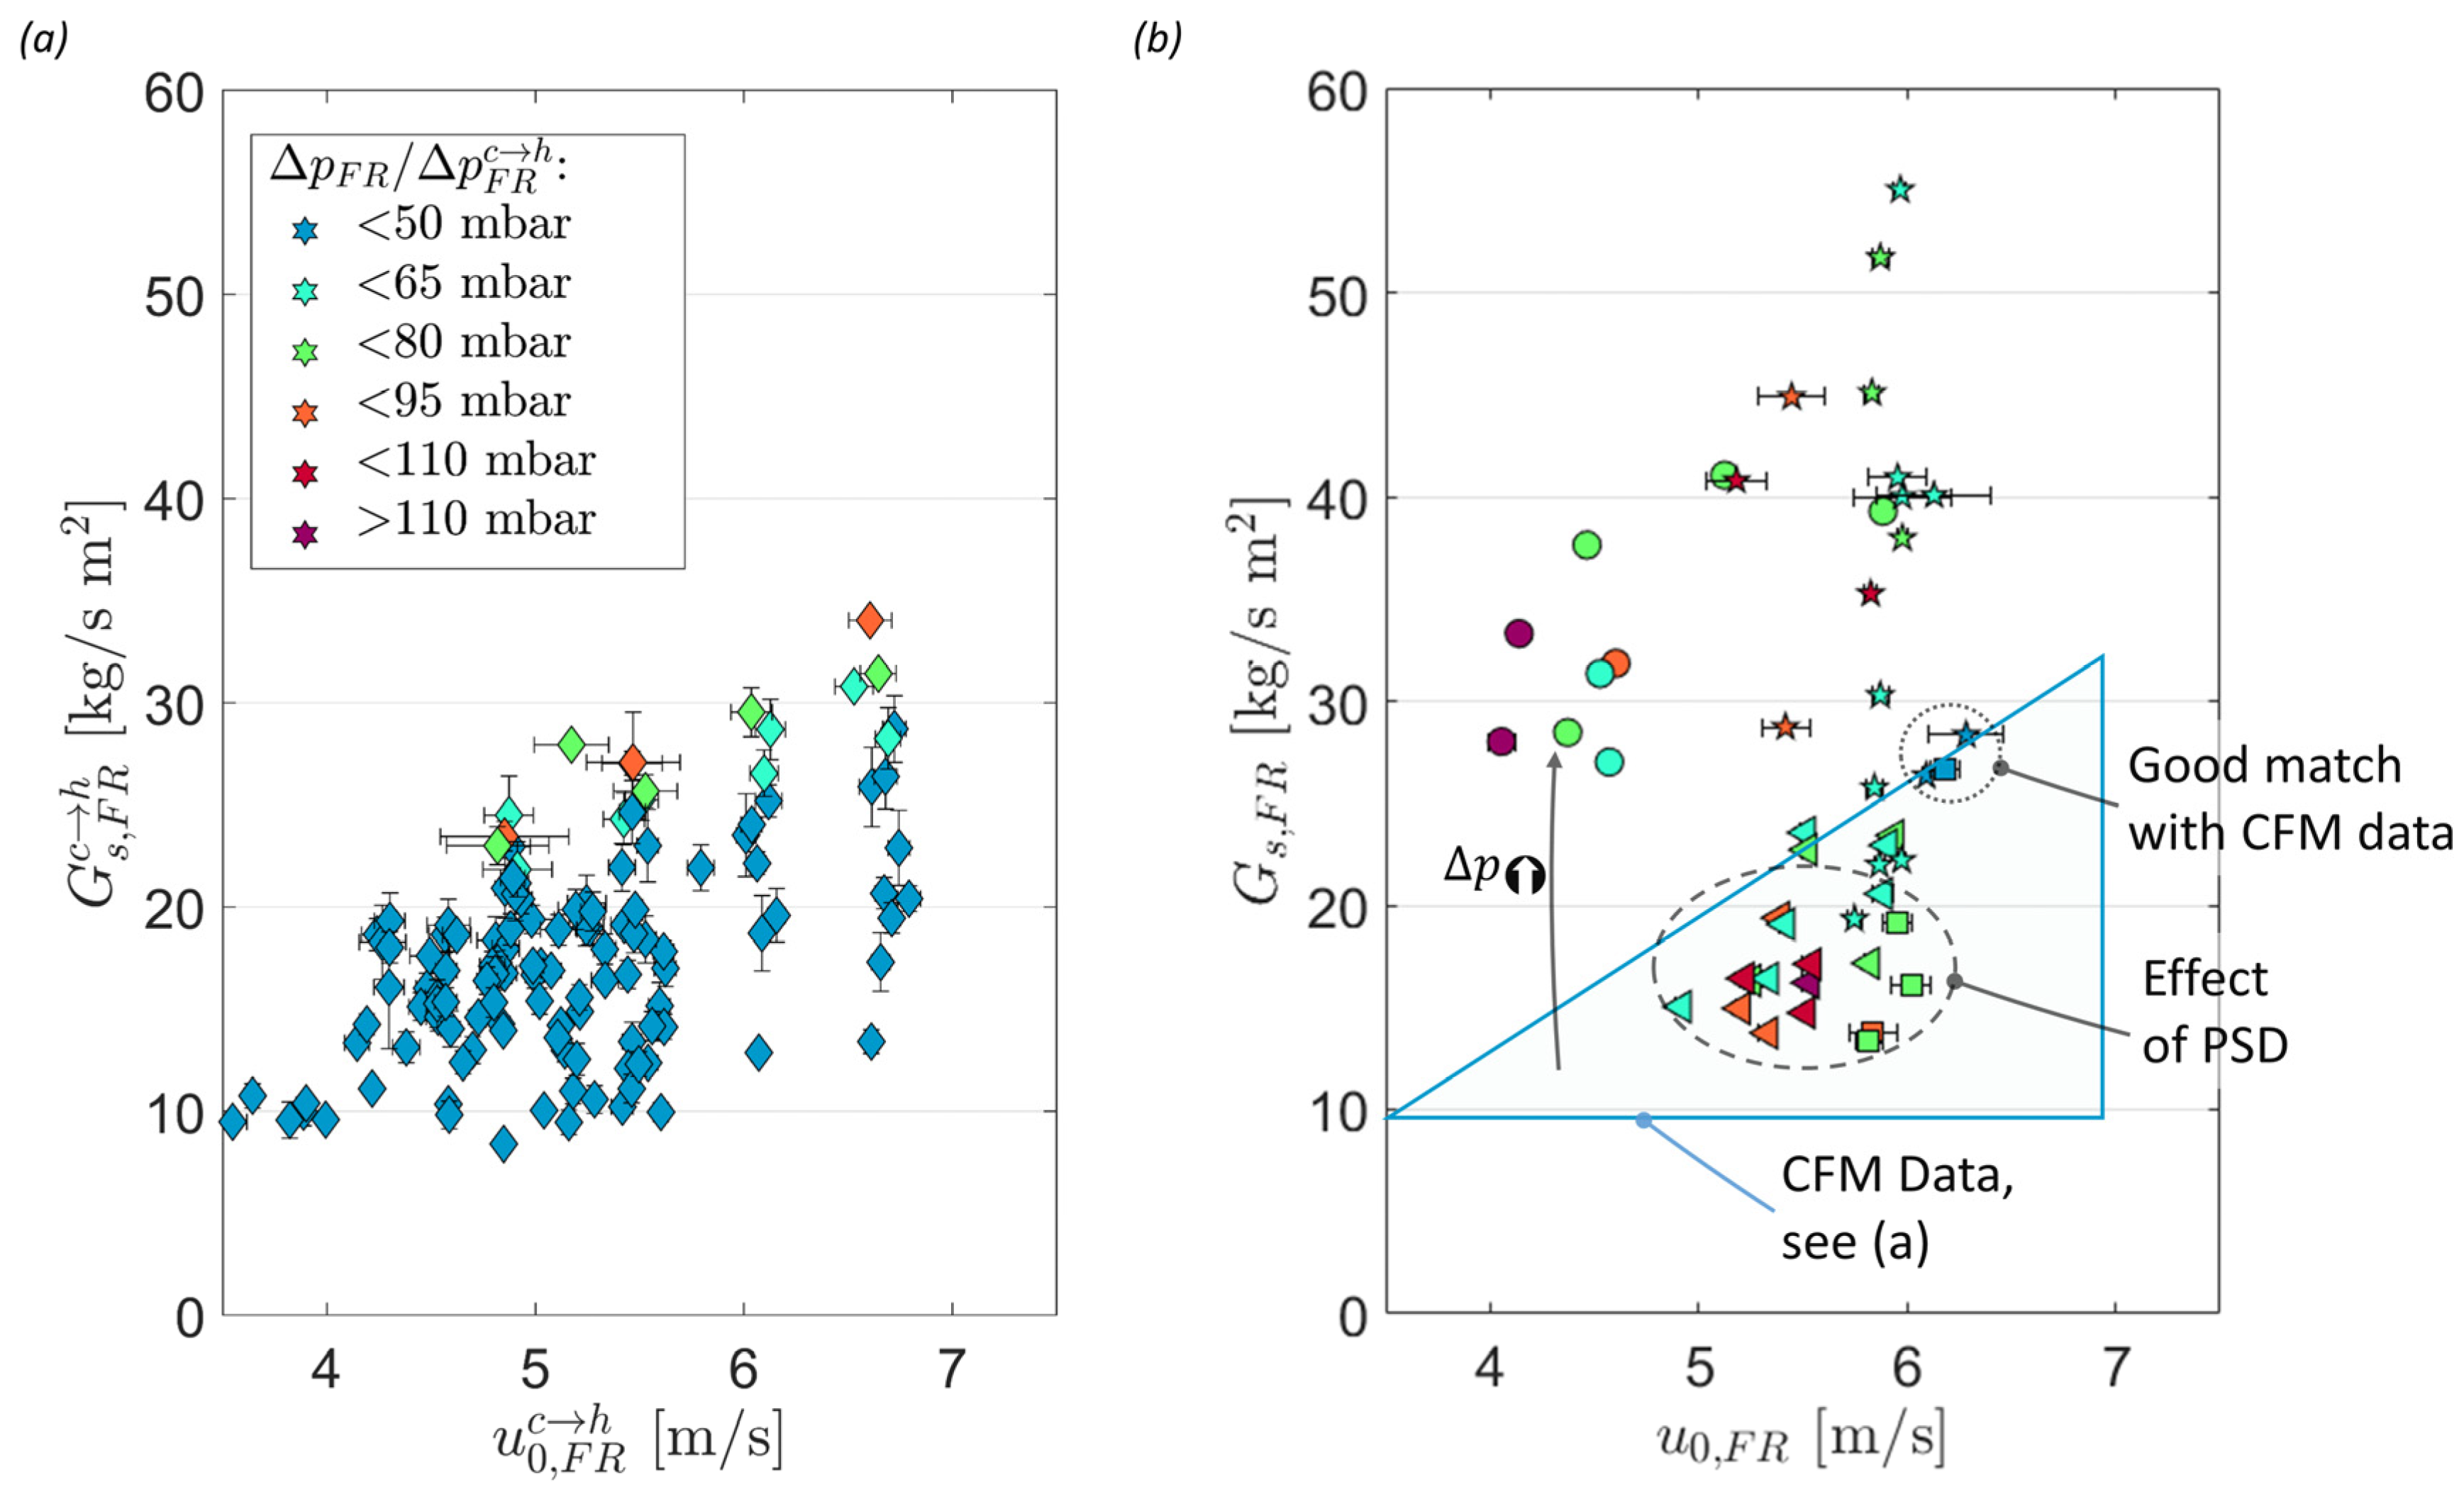
4.3.1. Prediction of Entrainment via Scaling of Data from Dual Circulating Fluidized Bed Cold Flow Model

As it has been shown that the CFM and the 1 MWth pilot plant show a good qualitative agreement in terms of their hydrodynamic behavior (see Section 4.1), the merit of CFM data for a quantitative assessment of riser entrainment in the 1 MWth pilot plant is investigated subsequently. In order to do so, CFM data was scaled using Equations (26)–(28), for u0, Gs, and ∆p, respectively. The resulting scaled values (denoted with the superscript c→h) are given in Figure 19a. Unsurprisingly, the scaled CFM data closely resembles the original CFM data in terms of the governing trends on Gs (i.e., increase with u0 and ∆p, compare Figure 14b). To allow for meaningful comparisons, the entrainment data from the 1 MWth pilot plant (see Figure 18a) was also plotted into the characteristic u0-∆p map in Figure 19b (again only the system’s global solid circulation, i.e., entrainment from the FR is shown here). Upon consideration of the two datasets it becomes clear that while similar general trends are apparent, the following differences are visible:
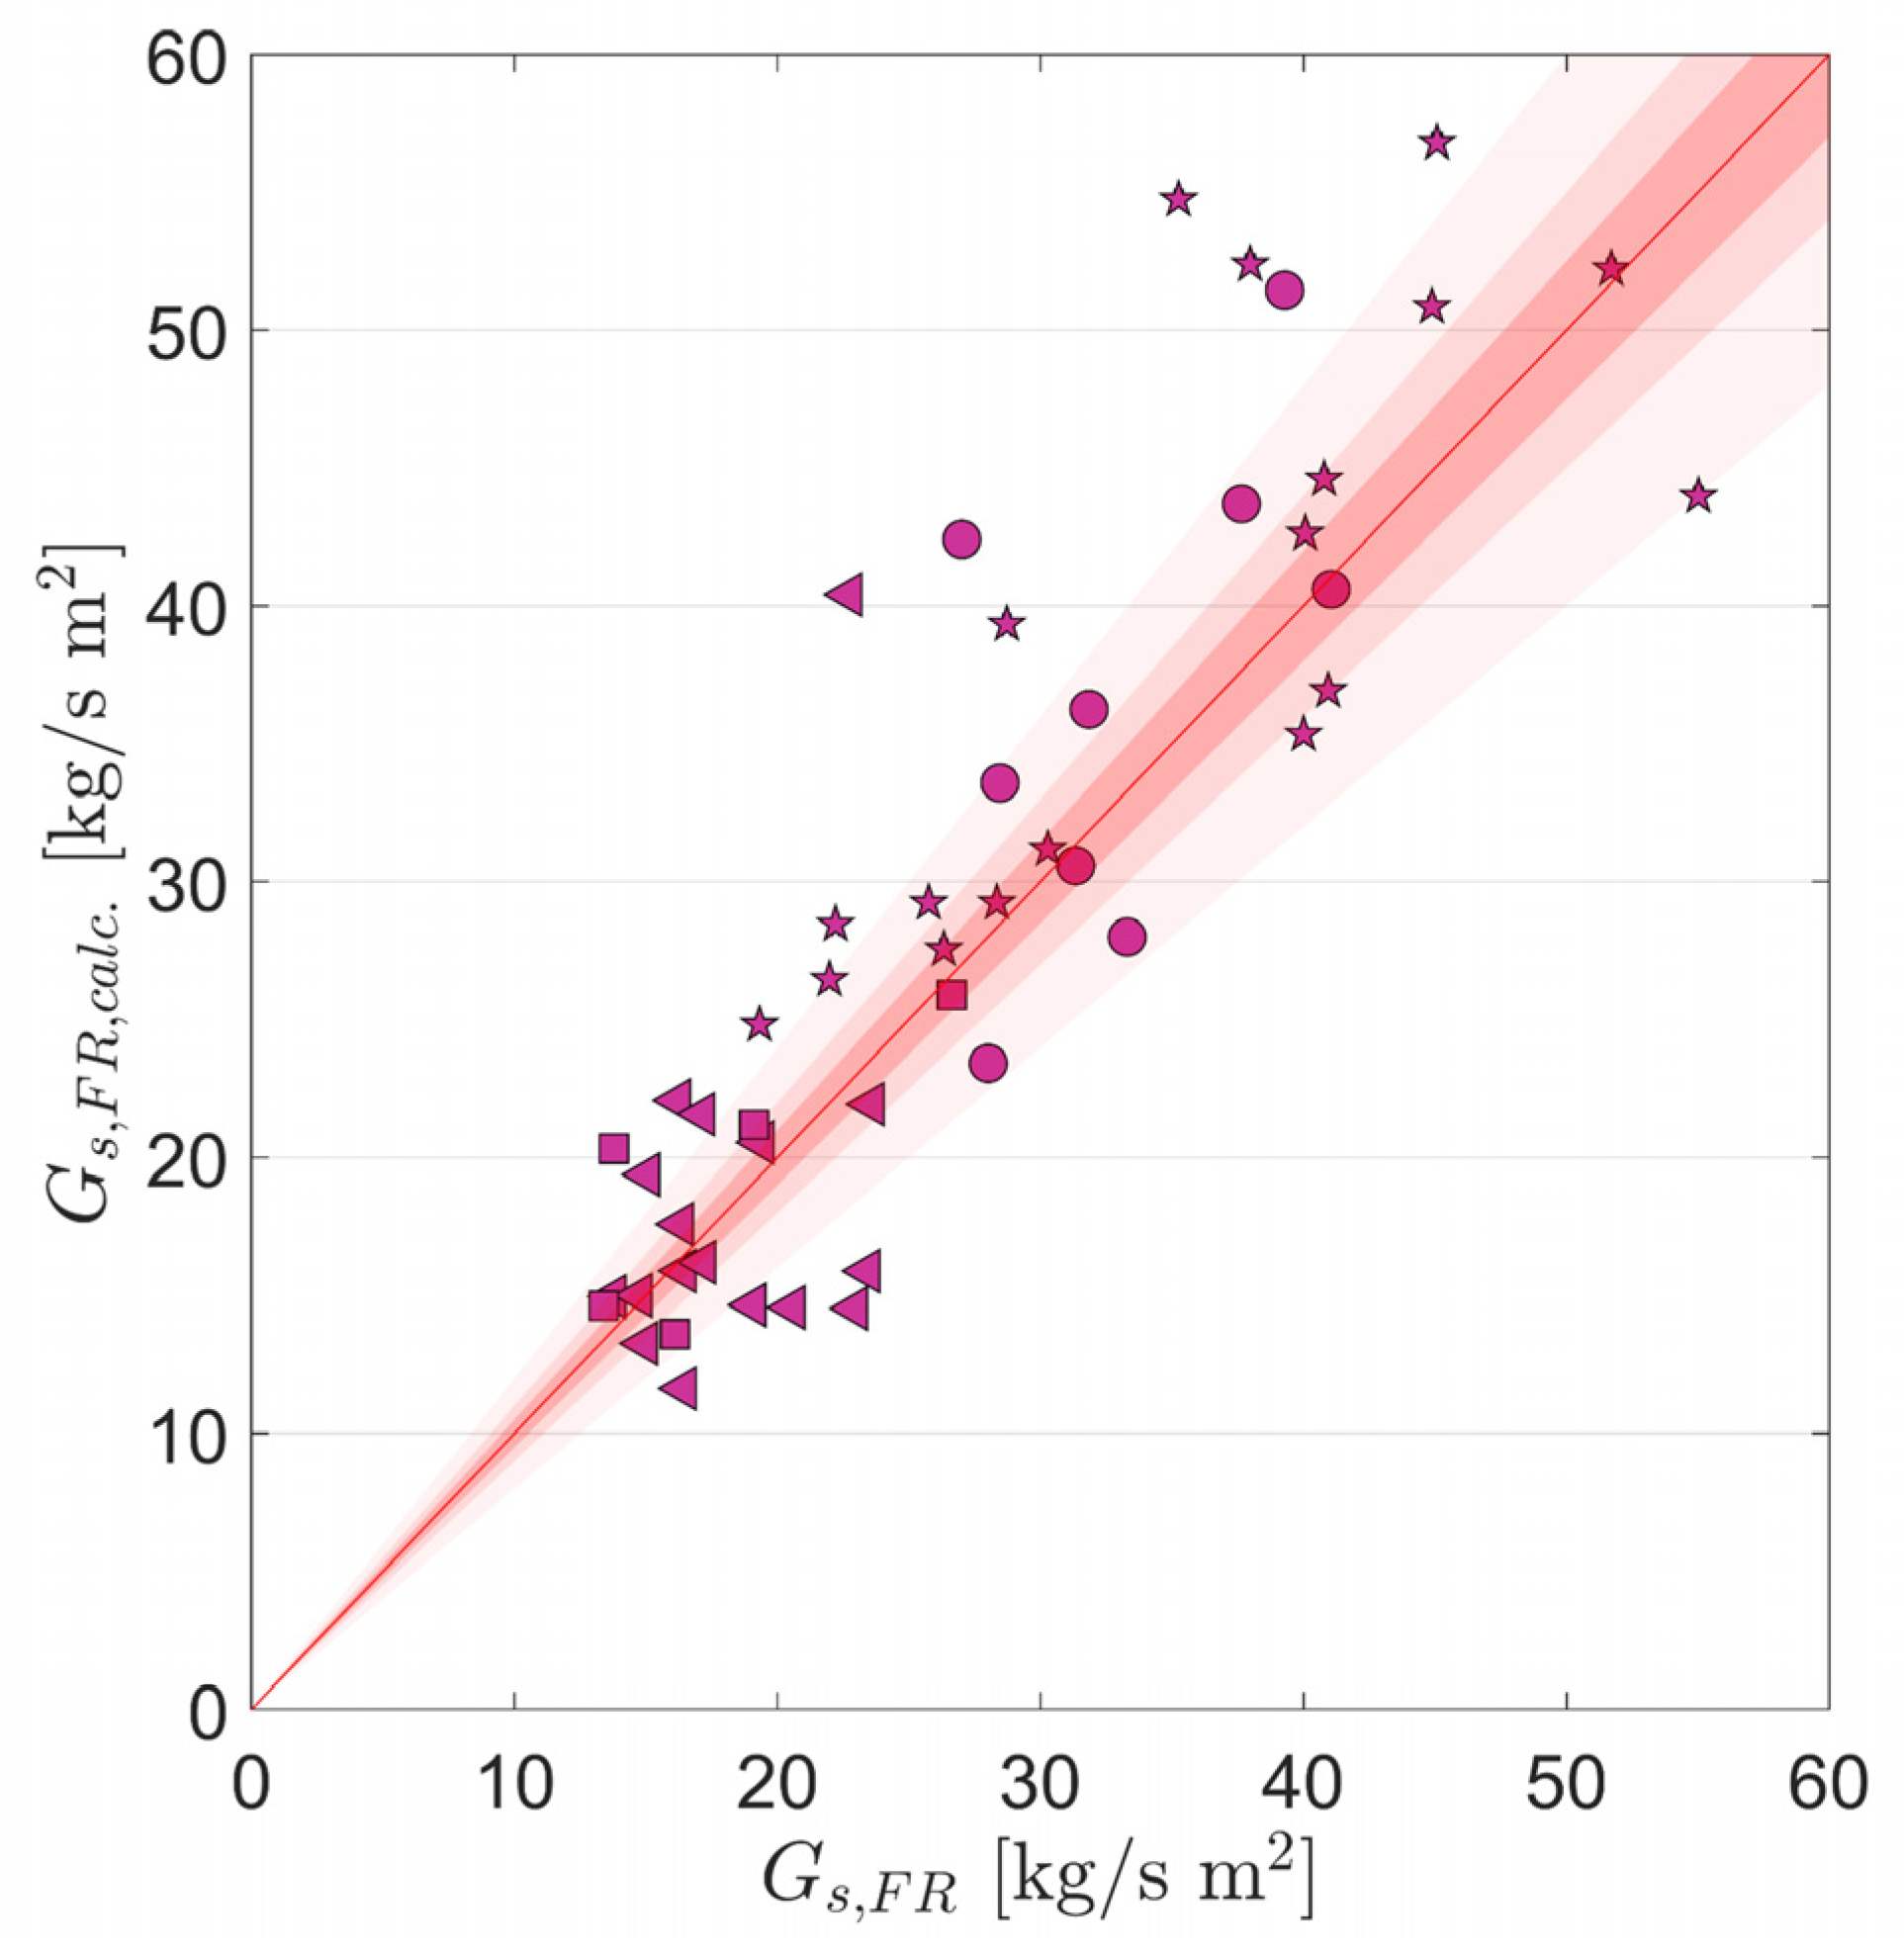
  • For the vast majority of operating periods, reactor inventories were significantly higher in the 1 MWth pilot plant, than for the CFM, generally leading to larger entrainment rates for the former (see grey arrow in Figure 19b). Although a wide range of FR reactor inventories was investigated in the CFM, operation in the 1 MWth pilot plant was found to be more efficient at even higher inventories than previously deemed suitable during CFM operation (e.g., due to longer solid residence times enhanced feedstock conversions inside the FR [19] and increased entrainment for a given gas velocity). Hence, a direct comparison of the two datasets is only viable for a handful of data points.
  • For data points with matching boundary conditions, a decent agreement was obtained (see dotted circle in Figure 19), showing that a direct scaling of CFM data yields good results in the case of well-matched boundary conditions.
  • On the other hand, a certain disparity in entrainment rates is visible for several operating periods. Here, lower entrainment rates were obtained for the 1 MWth pilot for a given gas velocity and reactor inventory (see dashed circle in Figure 19b). This can be explained by the effect of the average particle diameter, which was larger in K2 (triangles in Figure 19b) due to the utilization of coarse ilmenite, and K3 (squares in Figure 19) because of feedstock-related particle agglomeration, (The PSD of the bronze powder used for CFM experiments was selected in such a fashion that it fulfills Glicksman’s scaling laws in case the fine ilmenite (ILMf) is used in the 1 MWth pilot in the absence of agglomeration (more details see Section 3)), thus leading to lower solid entrainment for given values of u0 and Δp than predicated by direct scaling of the CFM data. Here it becomes clear that in case of the occurrence of unexpected process-related changes in bed material properties, direct scaling of the CFM data is no longer possible.
These findings show that while the datasets suggest that a direct scaling of CFM data using Glicksman’s simplified scaling set is viable, exact matching of all relevant boundary conditions is a strictly mandatory prerequisite. While this requirement is easily attainable in theory, its practical execution can be elaborate, especially when attempting to predict entrainment rates in a hot unit by preceding CFM studies (as attempted in this study), necessitating an exact prediction of all operating variables and boundary conditions in the hot unit prior to its operation. On the other hand, this is not a problem in case CFM studies are to be utilized to estimate entrainment rates for an existing hydrodynamic dataset from a hot unit, where all boundary conditions and operating variables are known. Nonetheless, due to the limited universality and flexibility of the direct scaling approach, an alternate methodology, allowing for a direct estimation of entrainment rates from readily available process data, would be desirable.

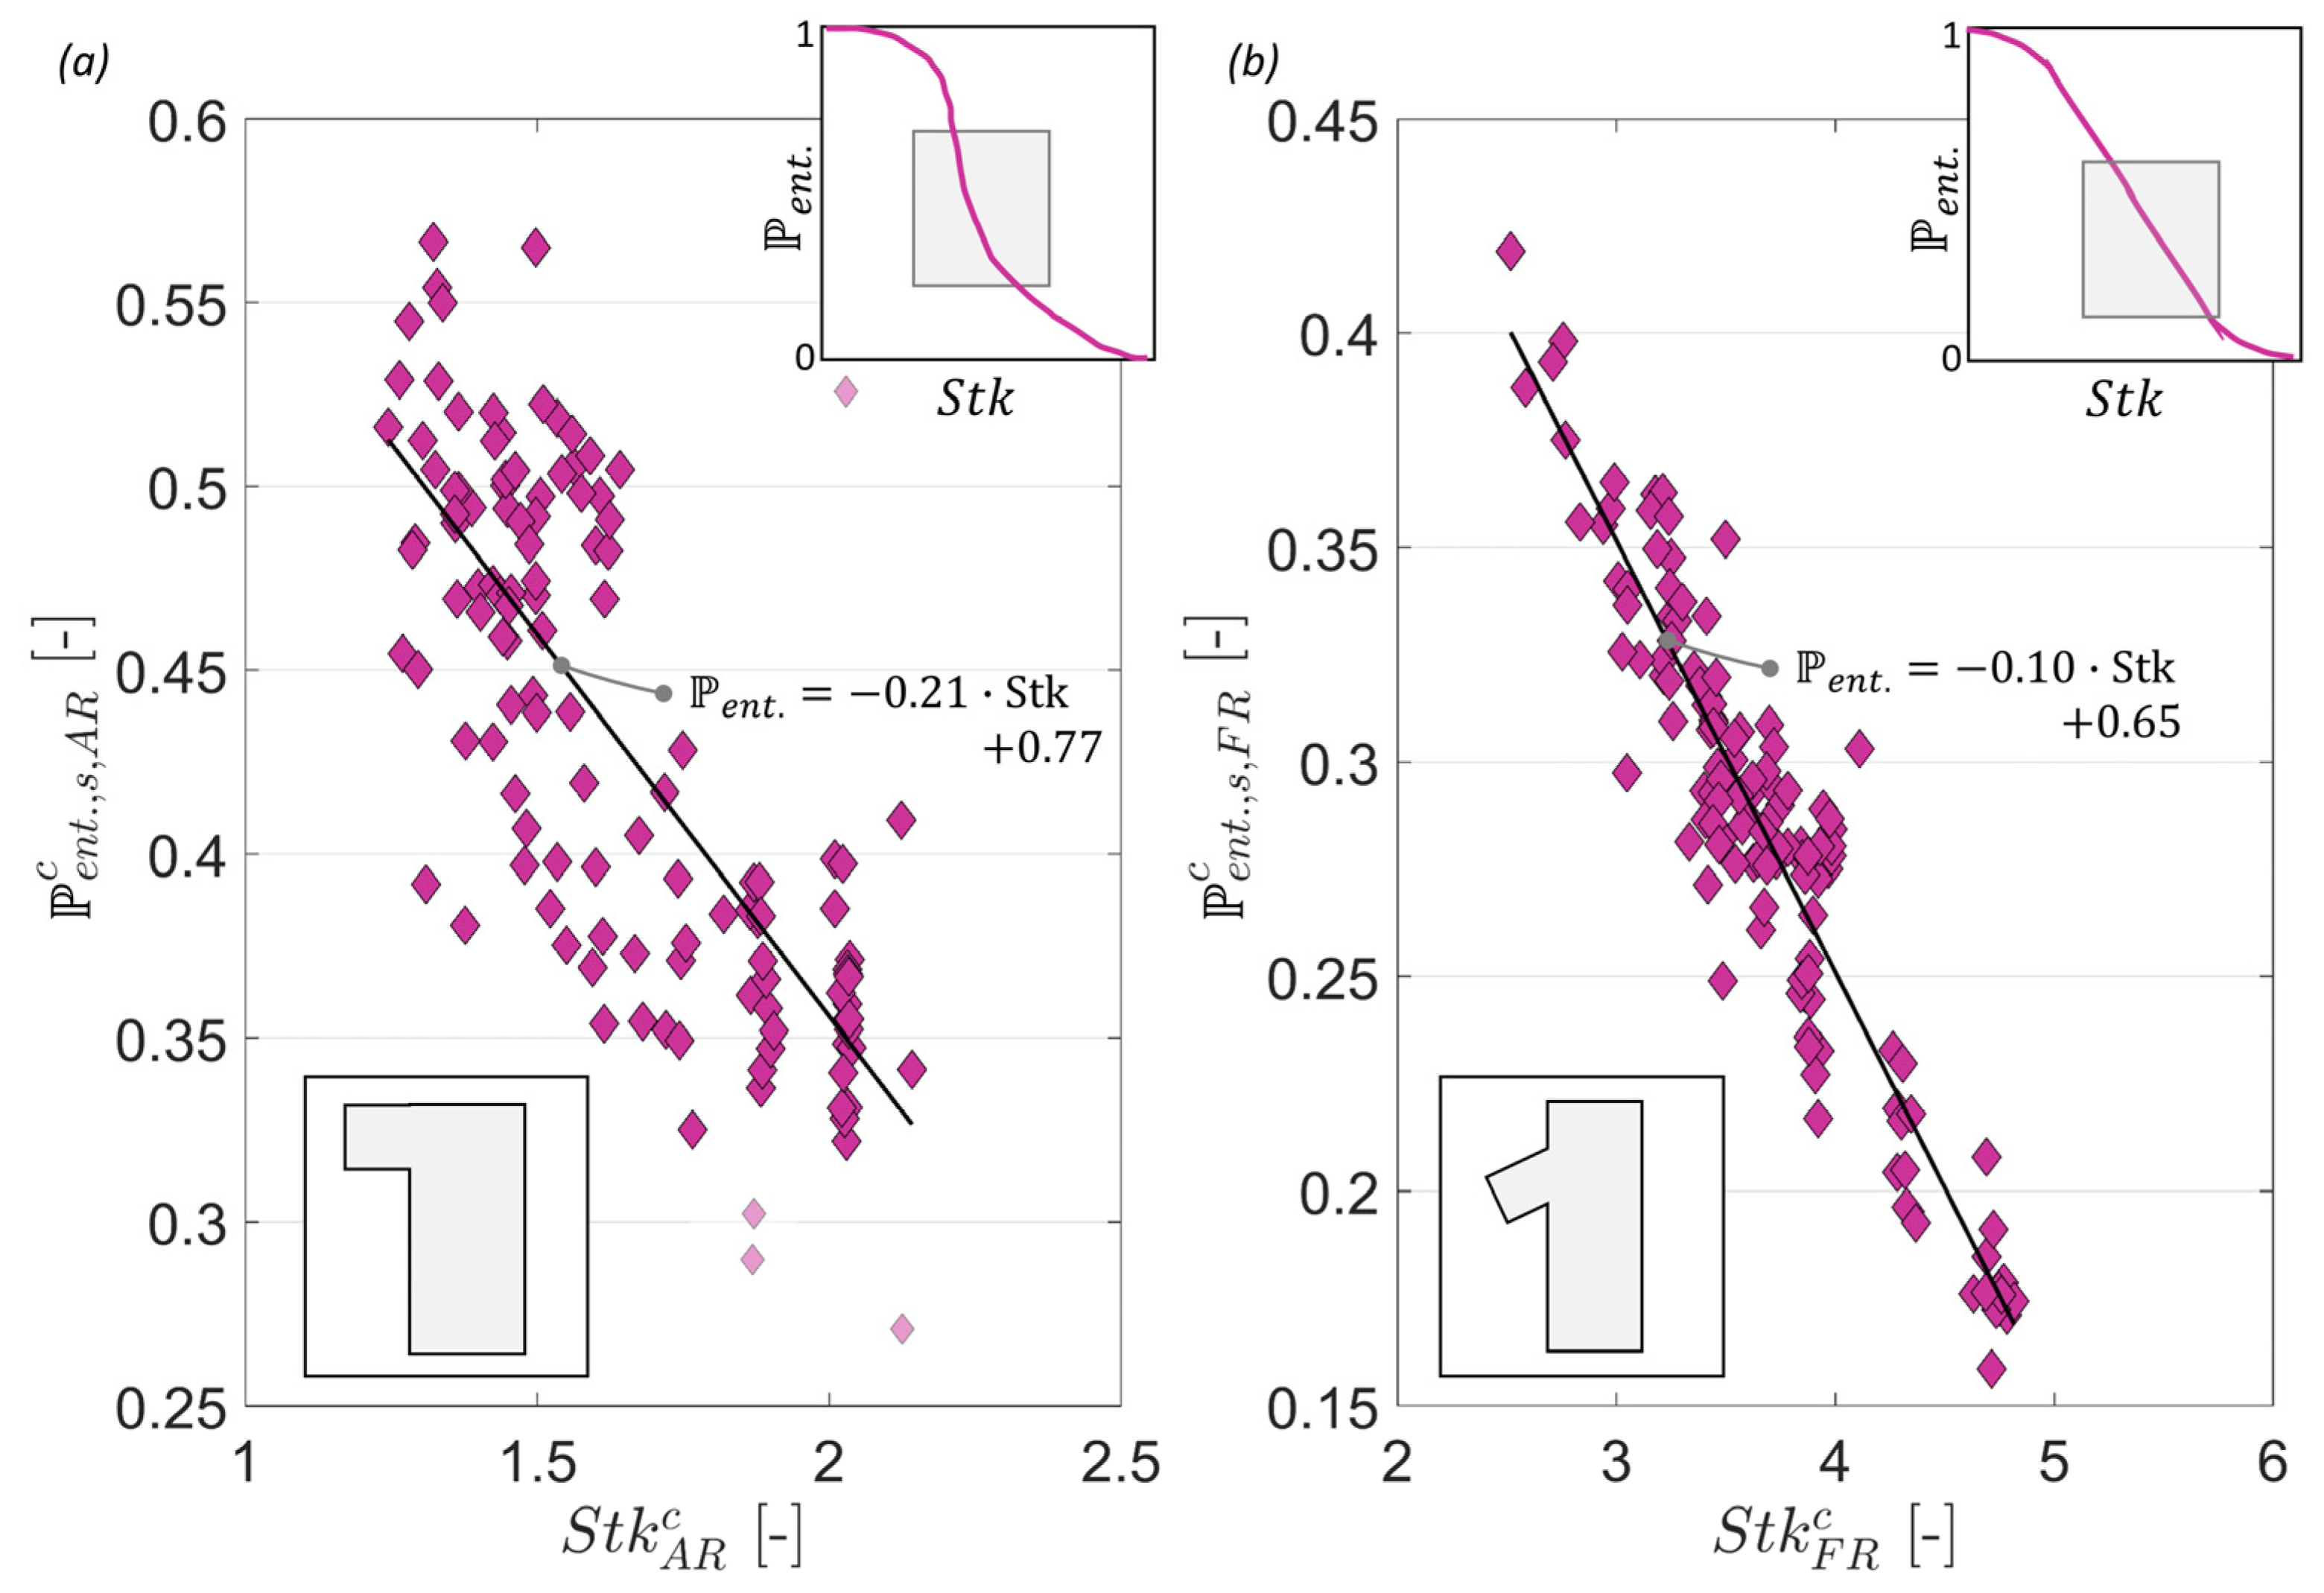
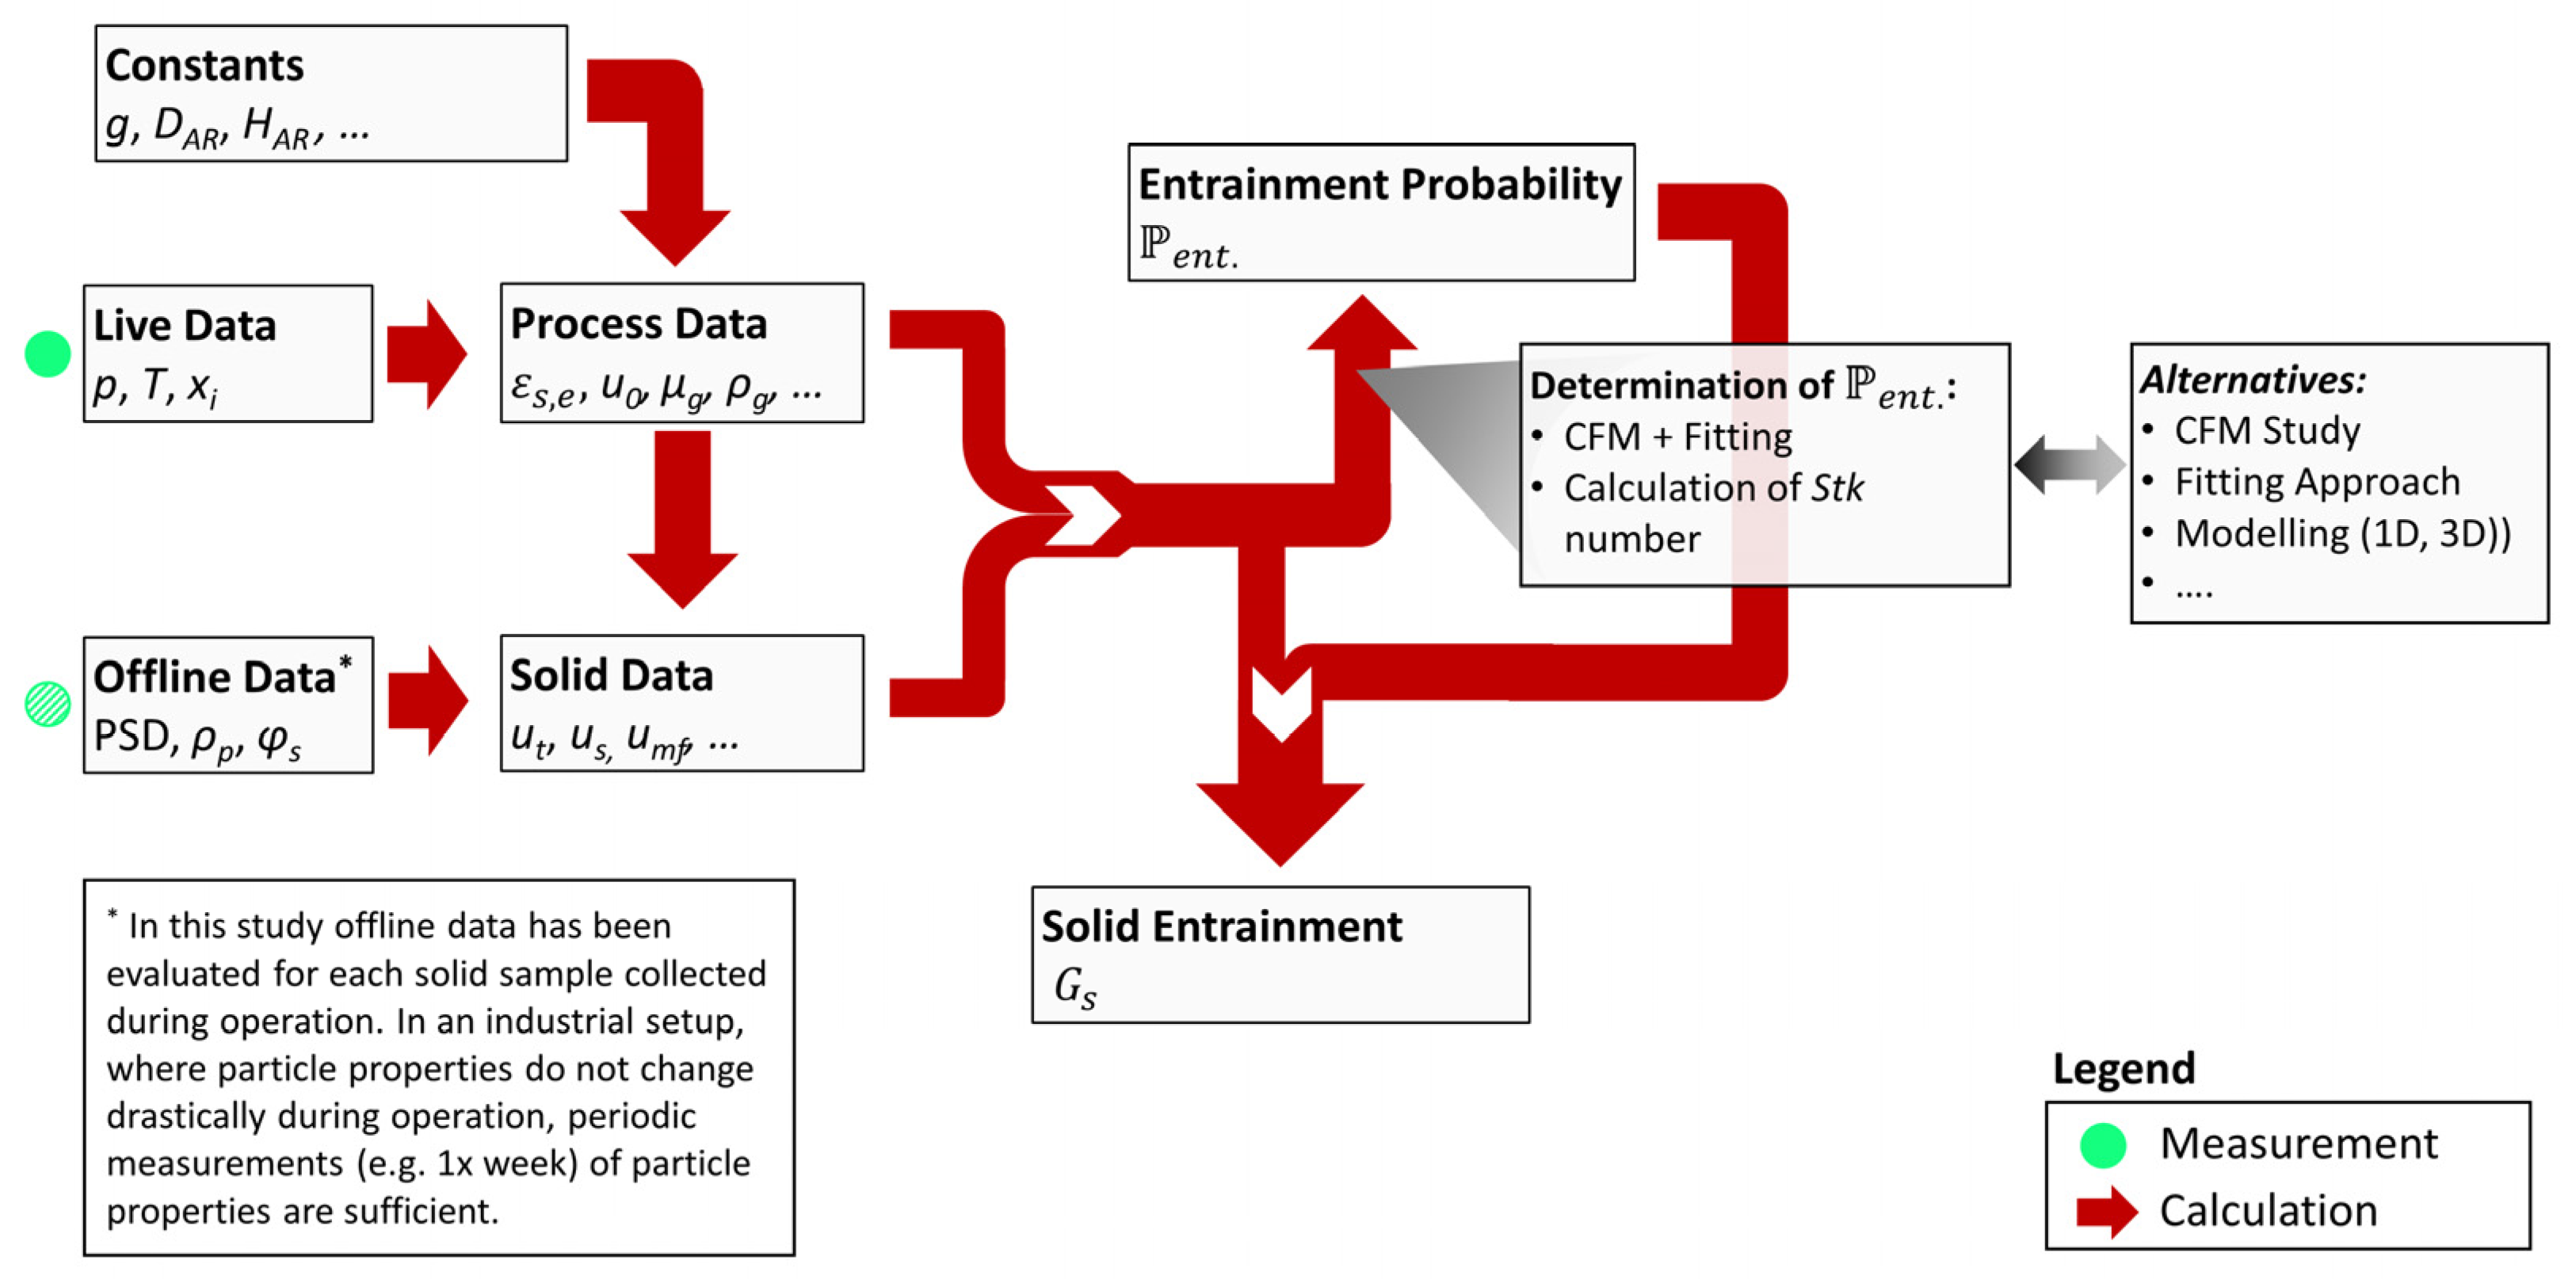
4.3.2. Novel Method for Prediction of Entrainment from Dual Circulating Fluidized Bed Cold Flow Model

In order to establish a more universal approach to calculate entrainment rates from a CFB riser, Equation (15), stating that Gs is equal to the product of particle velocity (up), particle density (ρs), and solids concentration (εs), is used as a starting point. Here, the estimation of the solids concentration in the gas stream leaving the riser is the most challenging task. As an approximation, the solids concentration at the reactor exit (εs,e), calculated via Equation (18) is used, yielding Equation (16) with an entrainment probability of unity ( e n t . = 1 ).
To firstly assess the merit of Equation (18) to estimate solid concentrations at the reactor exit, Figure 20 shows the calculated values for εs,e for all operating periods investigated in the CFM. Clearly, the observable trends for εs,e strongly resemble those previously obtained for Gs, with εs,e increasing with gas velocity and reactor inventory. Again, a similar explanation can be provided here, with the gas stream’s ability to carry particles increasing with gas velocity and the expulsion rate of particles from the dense bed increasing with reactor inventory (more details see Section 4.2). When comparing the calculated values of εs,e with the saturation carrying capacity εs* (dashed and dotted lines in Figure 20), calculated via Equation (15), it can be seen that the majority of experimentally determined values for εs,e exceed the saturation carrying capacity, with sole values obtained for low reactor inventories falling into the proximity of εs*. Therefore, it can be conjectured that in the case of an infinitely tall riser, for which the effect of the dense bed on particle concentrations at the reactor exit would be negligible, experimentally determined values for εs,e would approach the saturation carrying capacity. However, as the effect of particle expulsion from the dense bed on solid concentrations in the CFB freeboard leads to εs,e > εs*, the experimentally determined values determined for εs,e provide a better estimation of the solids concentration at the top of the riser freeboard than the saturation carrying capacity εs*. Moreover, it can be expected that the accuracy of the calculated values for εs,e can be enhanced by increasing the number of pressure measurement points around the reactor exit region.
When considering Equations (15) and (16), it becomes clear that a positive correlation between the solids concentration at the reactor outlet and the CFB entrainment rate should be visible as particle entrainment increases at higher solid loadings of the gas stream. This expected positive correlation is illustrated in Figure 21, showing εs,e as a function of the measured solids entrainment for the CFM. Interestingly, a linear correlation between the two variables can be observed for the AR and the FR riser. This finding sparks curiosity, as theoretically, entrainment rates should increase more strongly (i.e., more than linearly) with increasing εs,e, due to the positive impact of u0 on εs,e, as well as the higher particle velocities obtained at higher gas velocities (see Equation (11)). However, a similar correlation was previously observed by Chen et al. [34] in a cold flow model of a 1.5 MWth chemical looping combustion plant, showing a linear correlation between entrainment rates and the pressure drop at the top of the freeboard. (One the one hand, the utilization of εs,e instead of the freeboard pressure drop, as done in this study, represents a more robust approach, as more than two pressure sensors are used, thus reducing the impact of measurement accuracy on the results. Moreover, the application of εs,e allows for further building on this finding, i.e., using εs,e for the direct estimation of Gs, as done in the following). This shows that another phenomenon, related to the entrainment probability of the particles at the riser exit, is central for achievable entrainment rates, thus limiting the positive effect of u0 and εs,e on particle elutriation.
In order to obtain a better understanding of this phenomenon, the maximum entrainment rate from the CFB riser was calculated via the employment of the calculated εs,e values, using Equation (16) and assuming e n t = 1 . ( e n t = 1 , meaning that all particles suspended in the gas stream inside the riser leave the riser towards the cyclone). The results of this endeavor are illustrated in Figure 22, showing the calculated maximum entrainment rate from the AR and FR of the CFM as a function of the measured entrainment rate. Clearly, the calculated maximum entrainment rates signify an overestimation of the entrainment rate, with calculated values being 2–6 times larger than the measured entrainment rate. This can be explained by the fact that for the calculation of the maximum entrainment rate the entrainment probability was set to one, i.e., all particles traveling with the gas stream were assumed to leave the riser towards the cyclone. Yet, it is known that this is not the case, as a fraction of particles travels back down inside the riser (see also Figure 4), intensifying the well-established core-annulus particle flow inside the CFB [35,46,48]. Additionally, Figure 22 shows that the entrainment probability clearly decreases with increasing solids entrainment for both reactors, as the relative difference between the calculated maximum entrainment rate and measured entrainment rate increases with increasing solids entrainment. This shows that the entrainment probability is not only dependent on reactor geometry and the utilized particle system, but also changes with varying boundary conditions (e.g., u0, Gs), which was also observed by Alghamdi et al. [48]
To assess the effect of boundary conditions on entrainment probability, it was first calculated for all operating periods for the AR and FR of the CFM and then correlated to different boundary conditions (e.g., u0, up, Δp, etc.) to find applicable correlations. Apart from the selected boundary conditions, the entrainment probability was also correlated to the Stokes number. This parameter was selected due to the findings made by Djerf et al. [46], who established that e n t . is closely related to the particle Stokes number, which describes the extent to which particles are able to follow a fluid in the proximity of an obstacle and hence governs the phenomenon of the solid-loaded gas stream bending into the exit duct towards the cyclone. The entire approach is explained in Appendix B.3.
Although several variables yielded a similarly good linear correlation for the entrainment probability in the investigated operating range for both reactors (e.g., up), the Stokes number correlation was selected due to the following reasons:
  • Acquisition of a good linear fit for AR and FR (albeit with a better linear correlation being obtained for the FR), illustrated in Figure 23;
  • The physically sound explanation for the established correlation of entrainment probability and Stokes number and corroborating findings by Djerf et al. [46] (i.e., the low likelihood that the established linear correlation is a random statistical artifact or a peculiarity of the given reactor setup);
  • Easy application in the hot unit, not requiring scaling, as the entrainment probability as well as the Stokes number is dimensionless.
The resulting correlations for the entrainment probability are shown in Figure 23, together with the experimentally determined values for e n t . . Clearly, an excellent linear correlation was obtained for the FR (R2 = 0.88), whereas a certain skew from the data is visible for the AR (R2 = 0.61). One reason for this could be that the AR was operated at significantly lower Stokes numbers (lower gas velocity, higher riser diameter). Djerf et al. [46] established that at very low Stokes numbers, the entrainment probability is equal to one, whereas it drops to zero for high Stokes numbers, meaning that it has to follow a sigmodal progress. Therefore, a linear correlation can only be expected for Stokes numbers lying in between those extremes, for which the sigmodal curve shape slopes off. Whereas the FR was operated at Stokes numbers falling into this linear regime (see inset in Figure 23b), this was not the case for the AR (see inset in Figure 23a). Nonetheless, the utilized linear correlation also yields a reasonable fit for the AR data. Therefore, both correlations are deemed suitable for subsequent estimation of particle entrainment from the hot unit (more details see below). When comparing the entrainment probabilities obtained for both units with one another, it can be seen that, generally, higher values were obtained for the AR. This can be related to the lower Stokes numbers at which the AR was operated (i.e., boundary conditions that favor that particles follow the path of the fluid stream). Another explanation for this could be the difference in exit geometry for both reactors, which plays a role in the solid flow pattern at the reactor exit (especially at high solid loads, which is the case in chemical looping configurations) [35], with the AR featuring a smoother cyclone outlet shape (see bottom insets in Figure 23).
Using the correlation for the entrainment probability established in the CFM, the approach described below can be utilized to calculate the entrainment in any hot unit.
(i)
Determination/estimation of particle properties (i.e., PSD, ρp, φs);
(ii)
Determination/estimation of gas properties (i.e., μg, ρg);
(iii)
Calculation of particle terminal velocity and particle slip velocity via Equations (10) and (11);
(iv)
Determination of u0 (see Equation (1) (The gas volume flow Vn is determined via a venturi measurement, which per se, is a combination of temperature and pressure measurements)) and εs,e via Equation (18) from temperature and pressure measurements in the hot unit;
(v)
Calculation of Stokes number via Equation (7);
(vi)
Calculation of entrainment probability via linear correlation (see Figure 23);
(vii)
Calculation of riser entrainment for current boundary conditions via Equation (16).
When utilizing this approach, illustrated in Figure 24, the subsequent points have to be considered:
  • While all necessary data required for calculation is easily obtainable from live measurements in the hot unit, particle properties for the current operating period (see (i)) can only be obtained via solid sampling. However, when running a continuously operated system with a known bed material, particle properties are unlikely changed dramatically during operation, which means that these parameters can also be treated as constants if the prerequisites are given;
  • Generally, the approach can be utilized for any given CFB setup. However, it has to be noted that the entrainment probability was previously found to be dependent on particle properties and reactor geometry [35]. While the impact of particle properties on entrainment is considered in the given approach, (Whether the given correlation are also valid for a bed material with different properties remains to be investigated in further studies), the latter is only partially (via the riser diameter in Equation (7)). Hence, it can be stated that a suitable correlation for the entrainment probability first has to be established for each riser, e.g., via CFM studies, before allowing for an application of the described method. As indicated in Figure 24, alternatives to determine the entrainment probability are different modeling approaches.
To investigate the merit of the novel approach for the estimation of solid entrainment, it was applied for the FR of the 1 MWth unit, yielding a dataset of calculated values for Gs. These calculated values (Gs,FR,calc.) were subsequently compared to the values determined using the method by Marx et al. [50]. The results of this comparison are given in Figure 25. Clearly, a good correlation between the two datasets is obtained, showcasing that the novel approach developed within this study yields reliable values for the solids entrainment from the CFB reactor. When considering the maximum uncertainty of 20% for the values determined via Marx’s method [50], a total of 33 from the 49 investigated operating periods show a perfect agreement. This is the case despite the fact that the PSD of the OC varies measurably between the different operating periods, leading to deviations from the scaled operating conditions in the CFM on the basis of which the approach was developed. Hence, the data suggest that the novel approach also features good robustness towards changing boundary conditions, which indicates that a universal application is feasible. (An even higher accuracy of the given approach can be obtained by different measures described in Section 5).
Apart from its simplicity, meaning that asides from live data only knowledge of the particle properties is required, the novel approach also allows for a direct calculation of entrainment from any CFB riser, whereas the approach by Marx et el. [50] requires the transport of an active bed material between two risers. Hence, solid entrainment can be calculated for both risers of the 1 MWth unit, as well as for any operating period, as long as particle properties are known. Making use of this thus also allows for a comparison of entrainment rates of the AR and the FR for selected operating periods. Figure 26 shows the calculated solid entrainment rates for AR and FR, using the novel approach. Clearly, entrainment rates for the AR exceed those of the FR for each operating period, meaning that Equation (29) is fulfilled and the reactor system is operated in a stable fashion without emptying LS1. Interestingly, AR entrainment rates are up to three times larger than FR entrainment for the majority of operating periods for which fine ilmenite was used (circles and pentagrams in Figure 26), suggesting optimization potential in terms of AR fluidization velocities, i.e., significantly lower quantities of fluidization medium could have been utilized for those operating periods without disturbing system hydrodynamics, which would have led to increased CLG process efficiency [24]. On the other hand, AR entrainment rates were closer to FR entrainment rates when operating the CLG unit with coarse ilmenite, which is in line with findings made during the operation, where it was observed that the filling degree of LS1 reacted sensitively to changes in u0,AR when coarse ilmenite was used. This can be explained by the fact that the AR is operated at lower gas velocities than the FR, and hence AR entrainment rates reacted more sensitively to changes in the PSD, especially so in case a large fraction of particles with utu0,AR were located within the riser.
Apart from its advantages, the given method for CFB entrainment prediction exhibits certain limitations and could be refined further. For one, accurate measurement of the pressure in the exit zone of the freeboard is required, making multiple measurement points in this reactor region indispensable. Further, properties of the bed material have to be known accurately (esp. dp and ρp) to allow for precise model predictions. Additional refining of the model could be achieved by only considering particles traveling upwards in the riser in the term ε s , e in Equation (16), e.g., by using the approach detailed by Alghamdi et al. [48], thereby improving model predictions. Lastly, the determination of the entrainment probability for each combination of reactor setup, boundary conditions, and bed material remains an arduous task. A more universal approach could potentially be established by correlating e n t . with the Stokes number for different boundary conditions and bed materials in varying reactor geometries, thereby greatly improving the range of applicability for the given method.

5. Conclusions

To describe the hydrodynamics of a dual-fluidized bed system, this study carried out an elaborate parameter study in a scaled cold flow model to comprehend its fundamental hydrodynamic behavior and quantify solids entrainment from both CFB reactors. Thereafter, the results were successfully applied onto the hot 1 MWth pilot plant setup. Based on the ensuing results, the following conclusions can be made:
  • In the given setup consisting of two CFB reactors, one (the AR) being equipped with an internal solid recycle, the dual-fluidized bed system constitutes a self-regulating system, when operated within a defined stable operating range. This means that individual operating variables can be varied freely without requiring further system adjustments, highlighting the robustness of the given reactor setup.
  • Due to the importance of solid circulation and hence CFB solid entrainment on CLG process efficiency, the effect of the most important operating variables and boundary conditions on entrainment were investigated in the cold and hot units. It was found that entrainment correlates positively with increasing riser gas velocity, increasing reactor inventory and decreasing particle diameter, amongst others. Due to the interdependence of entrainment on multiple parameters, existing simplified semi-empirical approaches fail to adequately predict solids entrainment and modeling demands are elaborate.
  • An alternative prediction approach is the direct scaling of CFM data to a hot system. It was shown that while this approach is valid in case of exactly matching boundary conditions, it generally suffers from limited universality and flexibility.
  • Application of a novel calculation approach, allowing for a straightforward estimation of solid entrainment from any CFB riser, on data gathered during autothermal CLG operation in the 1 MWth pilot plant showed good agreement with literature data, proving its suitability any CFB system, if the riser entrainment probability and particle properties are known. A method to derive the former parameter using CFM data, is presented within this study.
In summary, the results presented in this paper provide a comprehensive understanding of the hydrodynamics of the investigated dual-fluidized bed system as well as the dependence of boundary conditions on solid entrainment. The developed ground-set of operating rules can be utilized to successfully operate different dual-fluidized bed setups and optimize their hydrodynamic performance.
Moreover, the novel approach to calculate solids entrainment from a CFB riser, allows for universal application in different setups. The given approach can be further refined by:
  • Optimizing sensor technology in the riser freeboard (i.e., multiple pressure measurements towards the riser exit), thereby increasing method accuracy and robustness.
  • Application of the method in given reactor setups with different bed materials to verify its universal applicability regardless of particle characteristics.
  • Further investigation of the effect of a wide range of Stoke numbers on riser entrainment probability in different setups in order to establish a universally applicable correlation between the two parameters.
In doing so, the calculation approach can be further extended, ultimately yielding a universal technique to estimate solid entrainment from a wide array of CFB risers operated with different bed materials, thereby closing a crucial research gap.

Supplementary Materials

The following supporting information can be downloaded at: https://www.mdpi.com/article/10.3390/en16155630/s1, File S1: Boundary conditions for operating points from 1 MWth pilot plant (Tables S1–S3); File S2: Boundary conditions for operating points from cold flow model (Tables S4 and S5).

Author Contributions

P.D.: Conceptualization, Methodology, Investigation, Data Curation, Writing—Original Draft, Visualization. F.M.: Writing—Review and Editing, Methodology, Investigation, Data Curation. J.S.: Writing—Review and Editing, Supervision, Project Administration, Funding Acquisition. B.E.: Resources, Funding Acquisition. All authors have read and agreed to the published version of the manuscript.

Funding

This work has received funding of the European Union’s Horizon 2020-Research and Innovation Framework Programme under grant agreement No. 817841 (Chemical Looping gasification foR sustainAble production of biofuels—CLARA). The content of this work reflects only the author’s view, and the European Commission is not responsible for any use that may be made of the information it contains.

Data Availability Statement

All relevant data is contained within the article or supplementary material. Additional data can be made available upon request.

Acknowledgments

The authors would like to thank Aichernig Engineering GmbH, Austria, for their support in the design and safety analysis of the 1 MWth CLG unit. Moreover, the authors would like to thank AB Torkapparater, Sweden, for the production, storage and shipping of pine forest residue and wheat straw pellets. Lastly, the authors would like to thank Sarah Keller and Bryan Engelen for their efforts during the operation of the CFM as well as Marvin Jost and Levent Aytemiz for their support in the lab analysis of the OC samples.

Conflicts of Interest

The authors declare no conflict of interest.

Nomenclature

Latin Symbols
A Cross section p Pressure
a Slope for linear fit   R O C Oxygen transport capability
A r Archimedes Number R 2 R-squared value
b Y-Intercept for linear fit R e Reynolds number
D Reactor diameter S t k Stokes Number
d p Particle diameter T Temperature
g Earth’s gravity t Time
G s Surface specific solid entrainment   u 0 Gas velocity
H Height   u p Particle velocity
  k b Particle backflow ratio   u t Terminal velocity
L s c Scaling factor V Volume
m i n v . Mass inventory of riser V ˙ Volume flow
m i Mass of species i w i Mass fraction of species i
m i ˙ Mass flow of species i X S Conversion of Oxygen Carrier
  e n t . Particle entrainment probability z i Height of measuring port i
Greek Symbols
Δ X s Difference in oxidation degree of OC μ Dynamic Viscosity
Δ p Riser pressure drop ϕ Sphericity
Δ z Change in height ρ Density
ε s Solids volume concentration
Acronyms/Abbreviations
ARAir ReactorILMcCoarse ilmenite
BFBBubbling Fluidized BedILMfFine ilmenite
BPOperating periodIWPIndustrial wood pellets
CFBCirculating Fluidized Bed ReactorK1/2/3Campaign 1/2/3
CFMCold Flow ModelLSLoop Seal
CLGChemical Looping GasificationOCOxygen Carrier
CLCChemical Looping CombustionPFRPine forest residue
DFBGDual Fluidized Bed GasificationPSDParticle Size Distribution
DFBDual Fluidized BedTDHTransport disengaging height
FRFuel ReactorWSPWheat straw pellets
GHGGreenhouse Gas
Indices
ARAir ReactorOCOxygen Carrier
backBackflow in riseroutOutlet
bulkBulk oxOxidized
calcCalculatedpParticle
cCold Unit—Cold Flow ModelredReduced
ent.EntrainedRReactor
eExit sSolid
FMFluidization mediumSPStand Pipe
gGastterminal
hHot Unit—1 MWth pilot planttopTop of Riser
inInlettot.Total
mfMinimum Fluidization1010% of weight cumulative PSD
meas.Measured9090% of weight cumulative PSD
mmean . Ambient conditions
nNorm (at norm conditions)*Dimensionless parameter (u/dp)
OOxygen
While the superscripts c and c→h denote the state in the cold and scaled hot state of the CFM, respectively, variables without a superscript or with the superscript h can be associated with the 1 MWth pilot plant.

Appendix A. Further Derivation for Scaling of Fluidized Beds

Equation (26), relating the gas velocity in the hot and cold fluidized bed, can be derived by assuming a constant Froude number in both units and then inserting Equation (24):
u 0 h 2 g · D h = u 0 c 2 g · D c
For estimation of the solid entrainment, the similitude of the dimensionless entrainment can be used:
G s h u 0 h · ρ p h = G s c u 0 c · ρ p c
Inserting Equation (A1) thus yields Equation (27).
For the pressure drop, it is firstly assumed that it derives solely from the particles inside the riser:
Δ p = m i n v , R · g A R = 0 1 ε s ( ξ ) d ξ · V R · ρ p g A R
By then assuming similitude in terms of the solid concentration over the dimensionless height ( ξ ):
0 1 ε s h ( ξ h ) d ξ h = 0 1 ε s c ( ξ c ) d ξ c ,
one obtains:
Δ p h D h · ρ p h · g = Δ p c D c · ρ p c · g
Inserting Equation (24) into Equation (A5) finally yields Equation (28).

Appendix B. Additional Data from Cold Flow Model

Appendix B.1. Effect of Boundary Conditions on Material Throughput through J-Valve

As global solid circulation in the coupled dual-fluidized bed system is not only dependent on the entrainment from the riser but also the material throughput through the J-valve, it is worthwhile to also highlight the impact of the most important boundary conditions on the latter. (Since material throughput through the J-valve is similar to entrainment for steady-state operating periods, experimentally determined values for Gs,FR are considered for the J-valve in the following). As shown in Figure A1 and as reported in the literature [51], material transport through the J-valve was found to increase with the gas volume flow through the J-valve. This finding can be explained, when considering that material transport in the J-valve resembles pneumatic transport, and the solids carrying capacity of a gas stream increases with gas velocity (see Equations (13)–(15)). Yet, as already briefly mentioned in Section 4.1.1, Figure A1 illustrates that apart from gas velocities, the pressure drop over the J-valve also correlates positively with material transport. Here, it is assumed that as the pressure drop over the J-valve increases, a fraction of the gas used for fluidization of LS1 also travels via the J-valve, thus increasing the effective gas velocity inside the J-valve and hence material transport towards the FR. Consequently, the J-valve throughput is not only influenced by designated alterations of the inlet gas volume flow but also dependent on the pressure profile of the entire dual-fluidized bed system (esp. FR inventory, difference in overhead pressure of AR and FR riser).
Figure A1. Area-specific entrainment for FR as a function of gas flow used for J-valve fluidization for all CFM operating periods with bronze power (see Table S4).
Energies 16 05630 g0a1

Appendix B.2. Effect of PSD on Entrainment from Riser

As elaborated in Section 4.2, entrainment decreases with increasing particle diameter. This can be attributed to the fact that coarser particles have a lower likelihood of being entrained for a given set of boundary conditions, thus leading to lower solids concentration at the reactor outlet for higher particle diameters. The close correlation between entrainment and particle loadings at the reactor outlet, is given in Figure A2. Clearly, both bed material types follow the same trend, showing that the stated correlation exists regardless of particle properties (e.g., PSD). Another interesting trend visible in Figure A2 is that entrainment probabilities equal to one are attained at low entrainment rates (=low Stokes number). Moreover, both bed material types follow a similar trend in terms of entrainment probability, showing that the entrainment probability is governed by similar mechanisms, regardless of particle properties.
Figure A2. Left: Calculated solids concentration at reactor outlet as a function of area-specific entrainment for AR as a function of gas velocity for all CFM operating periods operated with ilmenite power (see Table S5). Right: Area-specific entrainment for AR as a function of calculated area-specific solid entrainment (via Equation (15)) with e n t . = 1 ) operating periods operated with ilmenite power (see Table S5).
Energies 16 05630 g0a2

Appendix B.3. Correlation for Riser Entrainment Probability for Different Operating Variables

To be able to transfer the findings from made for the CFM to the 1 MWth pilot plant, a suitable correlation for the entrainment probability, which was found to change with varying boundary conditions, had to be established. In order to do so, the calculated values for e n t . were fitted over all relevant boundary conditions, (Only boundary conditions easily obtainable in a hot CFB setup were used for fitting, to allow for a straightforward application on the 1 MWth pilot dataset), using linear, exponential, logarithmic, and polynomic fits, amongst others, using the MATLAB® function fit. Thereafter, the resulting correlations were compared, using the resulting R-squared (R2) values. Finally, the most suitable correlation was selected for subsequent calculations (see Section 4.3.2). As linear fitting yielded the most promising results and allowed for a straightforward application, the subsequent elaborations are limited to the linear fitting approach.
In the first step, the data was fitted in a linear fashion using MATLAB®:
e n t . = a · x + b
Subsequently, R-squared values were calculated via:
R 2 = 1 ( e n t . , i e n t . , f i t , i ) 2 ( e n t . , i ¯ e n t . ) 2
Here, i signifies one data point, the subscript fit signifies the fitted value and ¯ e n t . signifies the average entrainment probability for the entire dataset.
Ultimately, the results, summarized in Table A1, were compared to one another and the most suitable correlation was selected. The correlation for the Stokes number was finally selected due to the following reasons:
  • Good fit for AR and FR (high R-squared values)
  • Results by Djerf et al. [46], showing a connection between the entrainment probability and the Stokes number in another cold flow setup.
  • Easy application in the hot unit, not requiring scaling, as the entrainment probability as well as the Stokes number are dimensionless.
Table A1. Fitting parameters obtained for linear fitting of the calculated entrainment probability over different operating variables.
Operating Variable (x)ARFR
abR2abR2
up [m/s]−0.1650.6740.61−0.1190.5830.88
u0 [m/s]−0.1650.7710.61−0.1190.6530.88
Gs,calc [kg/m2s]−0.00350.5330.59−0.00910.370.69
Δp [mbar]0.00210.3890.09−0.00120.3130.11
Stk [-]−0.2080.7710.61−0.1010.6530.88
εs,e [-]−49.80.5490.42−24.60.3890.48

References

  1. Global Monitoring Laboratory (GML); National Oceanic and Atmospheric Administration (NOAA). Monthly Average Mauna Loa CO2. Carbon Cycle Greenhouse Gases. Available online: https://gml.noaa.gov/ccgg/trends/ (accessed on 10 March 2023).
  2. European Environmental Agency (EEA). Greenhouse gas emissions from transport in Europe. EEA Indicators. Available online: https://www.eea.europa.eu/ims/greenhouse-gas-emissions-from-transport (accessed on 10 March 2023).
  3. International Energy Agency (IEA). Global Electric Vehicle Outlook 2022; International Energy Agency: Paris, France, 2022. [Google Scholar]
  4. Directive (EU) 2018/2001 of the European Parliament and of the Council of 11 December 2018—On the Promotion of the Use of Energy from Renewable Sources; p. 128. Available online: https://eur-lex.europa.eu/legal-content/EN/TXT/?uri=uriserv:OJ.L_.2018.328.01.0082.01.ENG (accessed on 10 March 2023).
  5. Atsonios, K.; Nesiadis, A.; Detsios, N.; Koutita, K.; Nikolopoulos, N.; Grammelis, P. Review on dynamic process modeling of gasification based biorefineries and bio-based heat & power plants. Fuel Process. Technol. 2020, 197, 106188. [Google Scholar] [CrossRef]
  6. Kumar, T.R.; Mattisson, T.; Rydén, M.; Stenberg, V. Process Analysis of Chemical Looping Gasification of Biomass for Fischer–Tropsch Crude Production with Net-Negative CO2 Emissions: Part 1. Energy Fuels 2022, 36, 9687–9705. [Google Scholar] [CrossRef]
  7. Nguyen, N.M.; Alobaid, F.; Dieringer, P.; Epple, B. Biomass-Based Chemical Looping Gasification: Overview and Recent Developments. Appl. Sci. 2021, 11, 7069. [Google Scholar] [CrossRef]
  8. Huang, Z.; Zhang, Y.; Fu, J.; Yu, L.; Chen, M.; Liu, S.; He, F.; Chen, D.; Wei, G.; Zhao, K.; et al. Chemical looping gasification of biomass char using iron ore as an oxygen carrier. Int. J. Hydrogen Energy 2016, 41, 17871–17883. [Google Scholar] [CrossRef]
  9. Guo, Q.; Cheng, Y.; Liu, Y.; Jia, W.; Ryu, H.-J. Coal Chemical Looping Gasification for Syngas Generation Using an Iron-Based Oxygen Carrier. Ind. Eng. Chem. Res. 2014, 53, 78–86. [Google Scholar] [CrossRef]
  10. Yan, J.; Sun, R.; Shen, L.; Bai, H.; Jiang, S.; Xiao, Y.; Song, T. Hydrogen-rich syngas production with tar elimination via biomass chemical looping gasification (BCLG) using BaFe2O4/Al2O3 as oxygen carrier. Chem. Eng. J. 2020, 387, 124107. [Google Scholar] [CrossRef]
  11. Liu, Q.; Hu, C.; Peng, B.; Liu, C.; Li, Z.; Wu, K.; Zhang, H.; Xiao, R. High H2/CO ratio syngas production from chemical looping co-gasification of biomass and polyethylene with CaO/Fe2O3 oxygen carrier. Energy Convers. Manag. 2019, 199, 111951. [Google Scholar] [CrossRef]
  12. Huseyin, S.; Wei, G.-Q.; Li, H.-B.; He, F.; Huang, Z. Chemical-looping gasification of biomass in a 10 kWth interconnected fluidized bed reactor using Fe2O3/Al2O3 oxygen carrier. J. Fuel Chem. Technol. 2014, 42, 922–931. [Google Scholar] [CrossRef]
  13. Condori, O.; García-Labiano, F.; de Diego, L.F.; Izquierdo, M.T.; Abad, A.; Adánez, J. Biomass chemical looping gasification for syngas production using LD Slag as oxygen carrier in a 1.5 kWth unit. Fuel Process. Technol. 2021, 222, 106963. [Google Scholar] [CrossRef]
  14. Condori, O.; García-Labiano, F.; de Diego, L.F.; Izquierdo, M.T.; Abad, A.; Adánez, J. Biomass chemical looping gasification for syngas production using ilmenite as oxygen carrier in a 1.5 kWth unit. Chem. Eng. J. 2021, 405, 126679. [Google Scholar] [CrossRef]
  15. Ge, H.; Guo, W.; Shen, L.; Song, T.; Xiao, J. Biomass gasification using chemical looping in a 25 kW th reactor with natural hematite as oxygen carrier. Chem. Eng. J. 2016, 286, 174–183. [Google Scholar] [CrossRef]
  16. Wei, G.; He, F.; Huang, Z.; Zheng, A.; Zhao, K.; Li, H. Continuous Operation of a 10 kWth Chemical Looping Integrated Fluidized Bed Reactor for Gasifying Biomass Using an Iron-Based Oxygen Carrier. Energy Fuels 2015, 29, 233–241. [Google Scholar] [CrossRef]
  17. Pissot, S.; Vilches, T.B.; Maric, J.; Seemann, M. Chemical looping gasification in a 2–4 MWth dual fluidized bed gasifier. In Proceedings of the 23rd International Conference on Fluidized Bed Conversion, Seoul, Republic of Korea, 13–17 May 2018; p. 10. [Google Scholar]
  18. Marx, F.; Dieringer, P.; Ströhle, J.; Epple, B. Design of a 1 MWth Pilot Plant for Chemical Looping Gasification of Biogenic Residues. Energies 2021, 14, 2581. [Google Scholar] [CrossRef]
  19. Condori, O.; García-Labiano, F.; de Diego, L.F.; Izquierdo, M.T.; Abad, A.; Adánez, J. Syngas production via Biomass Chemical Looping Gasification (BCLG) in a 50 kWth unit using ilmenite as oxygen carrier. Proc. Fluid. Bed Convers. Conf. 2022, 2022, 10. [Google Scholar]
  20. Pröll, T.; Rupanovits, K.; Kolbitsch, P.; Bolhàr-Nordenkampf, J.; Hofbauer, H. Cold Flow Model Study on a Dual Circulating Fluidized Bed (DCFB) System for Chemical Looping Processes. Chem. Eng. Technol. 2009, 32, 418–424. [Google Scholar] [CrossRef]
  21. Ohlemüller, P.; Busch, J.-P.; Reitz, M.; Ströhle, J.; Epple, B. Chemical-Looping Combustion of Hard Coal: Autothermal Operation of a 1 MWth Pilot Plant. J. Energy Resour. Technol. 2016, 138, 042203. [Google Scholar] [CrossRef]
  22. Pröll, T.; Bolhàr-Nordenkampf, J.; Kolbitsch, P.; Hofbauer, H. Syngas and a separate nitrogen/argon stream via chemical looping reforming—A 140kW pilot plant study. Fuel 2010, 89, 1249–1256. [Google Scholar] [CrossRef]
  23. Kunii, D.; Levenspiel, O. Circulating fluidized-bed reactors. Chem. Eng. Sci. 1997, 52, 2471–2482. [Google Scholar] [CrossRef]
  24. Dieringer, P.; Marx, F.; Alobaid, F.; Ströhle, J.; Epple, B. Process Control Strategies in Chemical Looping Gasification—A Novel Process for the Production of Biofuels Allowing for Net Negative CO2 Emissions. Appl. Sci. 2020, 10, 4271. [Google Scholar] [CrossRef]
  25. Dieringer, P.; Marx, F.; Michel, B.; Ströhle, J.; Epple, B. Design and control concept of a 1 MWth chemical looping gasifier allowing for efficient autothermal syngas production. Int. J. Greenh. Gas Control. 2023, 127, 103929. [Google Scholar] [CrossRef]
  26. Mirek, P. Influence of The Model Scale on Hydrodynamic Scaling in Cfb Boilers. Braz. J. Chem. Eng. 2016, 33, 885–896. [Google Scholar] [CrossRef]
  27. Kunii, D.; Levenspiel, O. Fluidization Engineering, 2nd ed.; Butterworth-Heinemann Series in Chemical Engineering; Butterworth-Heinemann: Boston, MA, USA, 1991. [Google Scholar]
  28. Grace, J.R. Contacting modes and behaviour classification of gas-solid and other two-phase suspensions. Can. J. Chem. Eng. 1986, 64, 353–363. [Google Scholar] [CrossRef]
  29. Balasubramanian, N.; Srinivasakannan, C.; Basha, C.A. Transition velocities in the riser of a circulating fluidized bed. Adv. Powder Technol. 2005, 16, 247–260. [Google Scholar] [CrossRef]
  30. Wang, H. Study on Separation Efficiency of Cyclone Separator for 75t/h Circulating Fluidized Bed Boiler. IOP Conf. Series: Mater. Sci. Eng. 2020, 721, 012037. [Google Scholar] [CrossRef]
  31. Breault, R.W.; Monazam, E.R.; Shadle, L.J.; Rowan, S.; Macfarlan, L.H. The effect of riser end geometry on gas-solid hydrodynamics in a CFB riser operating in the core annular and dilute homogeneous flow regimes. Powder Technol. 2017, 316, 181–189. [Google Scholar] [CrossRef]
  32. Yang, H.; Yue, G.; Xiao, X.; Lu, J.; Liu, Q. 1D modeling on the material balance in CFB boiler. Chem. Eng. Sci. 2005, 60, 5603–5611. [Google Scholar] [CrossRef]
  33. Johnsson, F.; Andersson, S.; Leckner, B. Expansion of a freely bubbling fluidized bed. Powder Technol. 1991, 68, 117–123. [Google Scholar] [CrossRef]
  34. Chen, H.; Li, Z.; Liu, X.; Li, W.; Cai, N.; Bertholin, S.; Tebianian, S.; Yazdanpanah, M.; Zhang, A. Solid Circulation Study in a 1.5 MWth Cold Flow Model of Chemical Looping Combustion. Ind. Eng. Chem. Res. 2021, 60, 2265–2277. [Google Scholar] [CrossRef]
  35. Pallarès, D.; Johnsson, F. Macroscopic modelling of fluid dynamics in large-scale circulating fluidized beds. Prog. Energy Combust. Sci. 2006, 32, 539–569. [Google Scholar] [CrossRef]
  36. Ohlemüller, P.; Alobaid, F.; Abad, A.; Adanez, J.; Ströhle, J.; Epple, B. Development and validation of a 1D process model with autothermal operation of a 1 MW th chemical looping pilot plant. Int. J. Greenh. Gas Control 2018, 73, 29–41. [Google Scholar] [CrossRef]
  37. Breault, R.W.; Weber, J. Saturation Carrying Capacity for Group A Particles in a Circulating Fluidized Bed. Energies 2021, 14, 2809. [Google Scholar] [CrossRef]
  38. Breault, R.W.; Weber, J.; Yang, J. Saturation carrying capacity Group B particles in a circulating fluidized bed. Powder Technol. 2021, 384, 442–451. [Google Scholar] [CrossRef]
  39. LGlicksman, L.; Hyre, M.; Farrell, P. Dynamic similarity in fluidization. Int. J. Multiph. Flow 1994, 20, 331–386. [Google Scholar] [CrossRef]
  40. Glicksman, L.R. Scaling relationships for fluidized beds. Chem. Eng. Sci. 1984, 39, 1373–1379. [Google Scholar] [CrossRef]
  41. Glicksman, L.; Hyre, M.; Woloshun, K. Simplified scaling relationships for fluidized beds. Powder Technol. 1993, 77, 177–199. [Google Scholar] [CrossRef]
  42. Breault, R. Maintaining Microstructure—The Path to Successful Technology Maturation in Fluidized Systems; Report Number: DOE/NETL-2023/3866; National Energy Technology Laboratory (NETL): Pittsburgh, PA, USA, 2023. Available online: https://www.osti.gov/biblio/1986293 (accessed on 10 July 2023).
  43. Junk, M.; Reitz, M.; Ströhle, J.; Epple, B. Thermodynamic Evaluation and Cold Flow Model Testing of an Indirectly Heated Carbonate Looping Process. Chem. Eng. Technol. 2013, 36, 1479–1487. [Google Scholar] [CrossRef]
  44. Bischi, A.; Langørgen, Ø.; Morin, J.-X.; Bakken, J.; Ghorbaniyan, M.; Bysveen, M.; Bolland, O. Hydrodynamic viability of chemical looping processes by means of cold flow model investigation. Appl. Energy 2012, 97, 201–216. [Google Scholar] [CrossRef] [Green Version]
  45. Sato, M.; Itaya, H.; Taguchi, S. A Circulation and Reduction Behavior of lron Ore in Circulating Fluidized Bed. ISIJ Int. 1994, 34, 393–400. [Google Scholar]
  46. Djerf, T.; Pallarès, D.; Johnsson, F. Solids flow patterns in large-scale circulating fluidised bed boilers: Experimental evaluation under fluid-dynamically down-scaled conditions. Chem. Eng. Sci. 2021, 231, 116309. [Google Scholar] [CrossRef]
  47. Alghamdi, Y.; Peng, Z.; Zanganeh, J.; Moghtaderi, B.; Doroodchi, E. Hydrodynamics similarities in cold flow model of chemical looping combustors: An experimental study. Powder Technol. 2019, 343, 542–550. [Google Scholar] [CrossRef]
  48. Alghamdi, Y.; Peng, Z.; Shah, K.; Moghtaderi, B.; Doroodchi, E. A correlation for predicting solids holdup in the dilute pneumatic conveying flow regime of circulating and interconnected fluidised beds. Powder Technol. 2016, 297, 357–366. [Google Scholar] [CrossRef]
  49. Markström, P.; Lyngfelt, A. Designing and operating a cold-flow model of a 100 kW chemical-looping combustor. Powder Technol. 2012, 222, 182–192. [Google Scholar] [CrossRef]
  50. Marx, F.; Dieringer, P.; Ströhle, J.; Epple, B. Solid flux measurement in dual fluidized bed processes based on solid samples. Fuel 2023, 341, 127589. [Google Scholar] [CrossRef]
  51. Ströhle, J.; Orth, M.; Epple, B. Chemical looping combustion of hard coal in a 1 MWth pilot plant using ilmenite as oxygen carrier. Appl. Energy 2015, 157, 288–294. [Google Scholar] [CrossRef]
  52. Ohlemüller, P.; Ströhle, J.; Epple, B. Chemical looping combustion of hard coal and torrefied biomass in a 1 MW th pilot plant. Int. J. Greenh. Gas Control 2017, 65, 149–159. [Google Scholar] [CrossRef]
  53. Tasirin, S.; Geldart, D. Entrainment of FCC from fluidized beds—A new correlation for the elutriation rate constants Ki∞*. Powder Technol. 1998, 95, 240–247. [Google Scholar] [CrossRef]
  54. Geldart, D.; Cullinan, J.; Georghiades, S.; Gilvray, D.; Pope, D.J. Effect of fines on entrainment from gas fluidized beds. Trans. Inst. Chem. Eng. 1979, 57, 269–275. Available online: https://www.osti.gov/etdeweb/biblio/5049007 (accessed on 12 June 2023).
  55. ISO 697-1981; Bestimmung der Schüttdichte, Verfahren durch Messen der Masse eines gegebenen Volumens. DIN: Berlin, Germany, 1984.
  56. DIN EN ISO 1183-1:2019-09; Kunststoffe—Verfahren zur Bestimmung der Dichte von nicht verschäumte Kunststoffen—Teil 1: Eintauchverfahren, Verfahren mit Flüssigkeitspyknometer und Titrationsverfahren. DIN: Berlin, Germany, 2019.
  57. Adanez, J.; Abad, A.; Garcia-Labiano, F.; Gayan, P.; de Diego, L.F. Progress in Chemical-Looping Combustion and Reforming technologies. Prog. Energy Combust. Sci. 2012, 38, 215–282. [Google Scholar] [CrossRef] [Green Version]
  58. Larsson, A.; Israelsson, M.; Lind, F.; Seemann, M.; Thunman, H. Using Ilmenite to Reduce the Tar Yield in a Dual Fluidized Bed Gasification System. Energy Fuels 2014, 28, 2632–2644. [Google Scholar] [CrossRef]
  59. Ohlemüller, P.; Alobaid, F.; Gunnarsson, A.; Ströhle, J.; Epple, B. Development of a process model for coal chemical looping combustion and validation against 100 kWth tests. Appl. Energy 2015, 157, 433–448. [Google Scholar] [CrossRef]
  60. Abad, A.; Adánez, J.; Gayán, P.; de Diego, L.F.; García-Labiano, F.; Sprachmann, G. Conceptual design of a 100 MWth CLC unit for solid fuel combustion. Appl. Energy 2015, 157, 462–474. [Google Scholar] [CrossRef] [Green Version]
  61. Bai, D.; Kato, K. Saturation carrying capacity of gas and flow regimes in CFB. J. Chem. Eng. Jpn. 1995, 28, 179–185. [Google Scholar] [CrossRef] [Green Version]
  62. Colakyan, M.; Levenspiel, O. Elutriation from fluidized beds. Powder Technol. 1984, 38, 223–232. [Google Scholar] [CrossRef]
  63. Wen, C.Y.; Hashinger, R.F. Elutriation of solid particles from a dense-phase fluidized bed. AIChE J. 1960, 6, 220–226. [Google Scholar] [CrossRef]
  64. Fournol, A.B.; Bergougnou, M.A.; Baker, C.G.J. Solids entrainment in a large gas fluidized bed. Can. J. Chem. Eng. 1973, 51, 401–404. [Google Scholar] [CrossRef]
Figure 1. Schematic illustration of CLG process.
Energies 16 05630 g001
Figure 2. Simplified flow diagram of the 1 MWth CLG pilot plant.
Energies 16 05630 g002
Figure 3. Simplified flow diagram of cold flow model (CFM).
Energies 16 05630 g003
Figure 4. Schematic illustration of the path of solid particles at the top of the AR riser with an indication of the most important streams.
Energies 16 05630 g004
Figure 5. Cumulative dimensionless particle size distribution (PSD) for ilmenite (h) and bronze (c) powder.
Energies 16 05630 g005
Figure 6. The layout of reactor system of the 1 MWth pilot plant with an indication of different solid streams cycling through the system.
Energies 16 05630 g006
Figure 7. Response of dual circulating fluidized bed reactor system to alterations in the hydrodynamic boundary conditions. Time series on the left show the changes in gas velocity and pressure drop for AR and FR of the CFM filled with bronze powder. Illustrations on the right show the change in solid circulation. (a) Increase in AR gas velocity, (b) Increase in FR gas velocity, (c) Increase in J-valve fluidization, and (d) Increase in pressure at the top of FR riser. Colors for the arrows indicating changes in the solid flow rates relate to the coloration of the solid stream in Figure 6.
Energies 16 05630 g007
Figure 8. Overview of ground-set of rules to adapt hydrodynamic conditions in the dual-circulating fluidized bed reactor system.
Energies 16 05630 g008
Figure 9. Schematic illustration of the self-regulating hydrodynamic system of 1 MWth CLG unit. Changes in one variable (e.g., u0) align with a counter-acting change in another variable (e.g., Δp), leading to the finding of a new stable operating point.
Energies 16 05630 g009
Figure 10. Reactor inventory (pressure drop) as a function of the gas velocity for selected operating periods in AR ((a) 20 mbar < ΔpFR < 40 mbar) and FR ((b) 5 mbar < ΔpAR < 20 mbar) from the cold flow model operated with bronze powder (see Table S4).
Energies 16 05630 g010
Figure 11. Reactor inventory (pressure drop) as a function of the gas velocity in AR (a) and FR (b) for all operating periods from K1 (see Table S1). Grey lines and arrows guide the eye.
Energies 16 05630 g011
Figure 12. Reactor inventory (pressure drop) as a function of the gas velocity in AR (a) and FR (b) for selected 1 MWth pilot plant operating periods. K1 (circles, see Table S1), K2 (ILMc-triangles, ILMf-pentagrams, see Table S2), and K3 (squares, see Table S3).
Energies 16 05630 g012
Figure 13. Pressure profiles for 1 MWth unit (K1, BP10-7) AR (a) and FR (b). Pressure profiles for CFM (BP97) AR (c), FR (d).
Energies 16 05630 g013aEnergies 16 05630 g013b
Figure 14. Area-specific entrainment for AR (a) and FR (b) as a function of gas velocity for all operating CFM points with bronze power (see Table S4). The black dashed and dotted line illustrate G s , e * , calculated via Equations (13) and (14), respectively. Grey arrows to guide the eye.
Energies 16 05630 g014
Figure 15. Area-specific entrainment for AR (a) and FR (b) as a function of gas reactor pressure drop for all CFM operating periods with bronze power (see Table S4). Grey arrows to guide the eye.
Energies 16 05630 g015
Figure 16. Top: FR solid concentration profiles for selected operating periods with constant u0,FR (3.65 ± 0.05 m/s) and varying FR solid inventories. Bottom: AR solid concentration profiles for selected operating periods with constant u0,AR (2.3 ± 0.1 m/s) and varying AR solid inventories. Red arrows mark the graphically determined TDH.
Energies 16 05630 g016
Figure 17. Area-specific entrainment for AR as a function of gas velocity for all CFM operating periods operated with ilmenite power (see Table S5).
Energies 16 05630 g017
Figure 18. (a) Area-specific entrainment for FR as a function of FR gas velocity for 1 MWth pilot operating periods. (b) Solids volume concentration at FR riser outlet as a function of FR gas velocity for 1 MWth pilot operating periods. K1 (circles, see Table S1), K2 (ILMc-triangles, ILMf-pentagrams, see Table S2), and K3 (squares, see Table 3). Operating periods colored according to the mean particle diameter of the OC.
Energies 16 05630 g018
Figure 19. (a) Scaled (c→h) area-specific entrainment for FR as a function riser gas velocity for all CFM operating periods with bronze power (diamonds, operating periods see Table S4). (b) Area-specific entrainment for the FR as a function of riser gas velocity for 1 MWth pilot plant for operating periods for which solid samples were collected. K1 (circles, see Table S1), K2 (ILMc-triangles, ILMf-pentagrams, see Table S2), and K3 (squares, see Table S3).
Energies 16 05630 g019
Figure 20. Solids volume fraction at reactor outlet for the AR (a) and FR (b) as a function of riser gas velocity for all CFM operating periods with bronze power (see Table S4).Coloring according to reactor pressure drop. The black dashed (Geldat et al. [53]) and dotted (Breault et al. [38]) line illustrates ε s * , calculated via Equation (15). Grey arrows to guide the eye.
Energies 16 05630 g020
Figure 21. Calculated solids volume fraction at reactor outlet for the AR (a) and FR (b) as a function of area-specific solid entrainment for all CFM operating periods with bronze power (see Table S4).
Energies 16 05630 g021
Figure 22. Area-specific solid entrainment for the AR (a) and FR (b) as a function of calculated area-specific solid entrainment (via Equation (16) with e n t . = 1 ) for all CFM operating periods with bronze power (see Table S4). The red angle bisector illustrates the line for which calculated and measured values for Gs are equal. Grey arrows to guide the eye.
Energies 16 05630 g022
Figure 23. Calculated entrainment probability for AR (a) and FR (b) as a function of particle Stokes Number for all CFM operating periods with bronze power (see Table S4). The straight line signifies the linear fit obtained via the approach explained in Appendix B.3. For the AR, certain outliers, paled out in the left subplot, were not used for fitting. The top inset illustrates the location of the dataset on the theoretical sigmodal-shaped curve of the entrainment probability over varying Stokes numbers. The bottom insets illustrate a schematic of the reactor exit geometry for each riser.
Energies 16 05630 g023
Figure 24. Schematic illustration of novel calculation approach for solid entrainment (Gs) from the riser of any CFB system.
Energies 16 05630 g024
Figure 25. Calculated area-specific entrainment for the FR as a function of area-specific entrainment (using the method by Marx et al. [50]) for 1 MWth pilot plant for operating periods for which solid samples were collected. K1 (circles, see Table S1), K2 (ILMc-triangles, ILMf-pentagrams, see Table S2), and K3 (squares, see Table S3). The angle bisector denotes the line for which calculated values and the values determined via Marx’s [50] method are identical. Red shaded areas denote a relative deviation of 5% (dark), 10% (medium), and 20% (light).
Energies 16 05630 g025
Figure 26. Calculated entrainment rates for the AR as a function of calculated entrainment rates for the FR for 1 MWth pilot plant for operating periods for which solid samples were collected. K1 (circles, see Table S1), K2 (ILMc-triangles, ILMf-pentagrams, see Table S2), and K3 (squares, see Table S3).
Energies 16 05630 g026
Table 1. Overview of selected scaling approaches using the scaling approach by Glicksman.
Author(s)Reactor SetupResearch Focus
Junk et al. [43]CFB-BFB
  • Proof-of-concept for novel coupled fluidized bed reactor concept.
Bischi et al. [44]CFB-CFB
  • Validation of validity of coupled fluidized bed reactor setup.
Masahiko and Hiroshi [45]CFB
  • Investigation of effect of main boundary conditions on solid entrainment.
Djerf et al. [46]CFB
  • Investigation of solid flow patterns and entrainment.
  • Effect of boundary conditions on entrainment and entrainment probability.
Pröll et al. [20]CFB-CFB
  • Proof-of-concept of a reactor system for CLC application.
  • Effect of boundary conditions on entrainment and solid profiles in CFB.
Alghamadi et al. [47,48]CFB-BFB
  • Effect of boundary conditions on entrainment and entrainment probability.
  • Derivation of equation for solid holdup in CFB system.
Markström and Lyngfelt [49]CFB-BFB
  • Proof-of-concept of a reactor system for CLC application.
  • Effect of boundary conditions on hydrodynamic system behavior.
Table 2. Pressure sensors of AR and FR risers of 1 MWth pilot plant.
ARFR
NameHeight [mm]NameHeight [mm]
AR-CP011135FR-CP01195
AR-CP012265FR-CP012253
AR-CP013435FR-CP013412
AR-CP014605FR-CP015834
AR-CP015945FR-CP0161141
AR-CP0161105FR-CP0182150
AR-CP0212122FR-CP0213392
AR-CP0223462FR-CP0224292
AR-CP0314615FR-CP0315741
AR-CP0418076FR-CP0388161
AR-CP0428286FR-CP0419790
AR-Cy-CP001Cycl. OutletFR-Cy-CP001Cycl. Outlet
Table 3. Pressure sensors of AR and FR risers of the cold flow model.
ARFR
NameHeight [mm]NameHeight [mm]
AR135FR131.6
AR250FR289
AR473FR4223
AR6120FR6378
AR9269FR7569.4
AR11451FR8777.9
AR12577FR91229
AR13701FR101556
AR14761FR111995
AR15883FR122470.8
AR171380FR132961.1
AR181655FR153862.5
AR202182Cy2Cycl. Outlet
AR222946
Cy1Cycl. Outlet
Table 4. Proximate and ultimate analysis for industrial wood pellets (IWP), pine forest residue pellets (PFR), and wheat straw pellets (WSP).
FeedstockIWPPFRWSPFeedstockIWPPFRWSP
Componentwt.-% (d.a.f.)Componentwt.-% (a.r.)
C50.848.942.50C-fix13.316.6316.3
H6.05.85.10Volatiles79.676.7768.7
O43.238.336.70Ash0.652.204.2
N0.070.430.10Moisture6.54.4010.8
S0.0080.0240.48
Cl0.0060.010.071
Table 5. Design parameters of a cold flow model (c) and 1 MWth pilot plant (h).
ParameterUnitAR hAR cFR hFR c
D [mm]590213400144
H [mm]8660411311,3503138
d p [µm]1545615456
ρ p [kg/m3]3710871037108710
ϕ p **[-]0.70.70.70.7
ρ g [kg/m3]0.2971.1640.2391.164
μ g [Pa s]4.74 × 10−51.86 × 10−54.34 × 10−51.86 × 10−5
u 0 [m/s]3.0–4.51.8–2.7 *5.0–6.53.0–3.9 *
G s [kg/s m2]10.2–14.214.2–20.1 *22.1–30.930.9–40.7 *
Δ p [mbar]50–7043–60 *60–10051–85 *
* Data for CFM estimated using simplified scaling laws by Glicksman (see Equation (25)). ** Sphericity for both particle types estimated.
Table 6. Dimensionless groups for cold flow model (c) and 1 MWth pilot plant (h).
ExpressionAR hAR cAR h/AR cFR hFR cFR h/FR c
u 0 2 g · D 2.122.121.009.809.860.99
ρ p ρ g 1.55 × 1043.64 × 1040.431.55 × 1043.64 × 1040.43
u 0 u m f 317.46835.140.38515.111479.390.35
G s u 0 · ρ p 1.10 × 10−31.10 × 10−31.001.35 × 10−31.35 × 10−31.00
H D 14.1514.211.0028.3828.560.99
D d p 3831.23750.01.022597.42535.21.02
Table 7. Comparison of main operating periods for two similar operating periods from CFM and 1 MWth pilot plant.
UnitBPu0,AR [m/s]pAR [mbar]u0,FR [m/s]pFR [mbar]
1 MWth pilotK1-BP10-73.4353.385.8868.78
CFMBP-972.5036.603.2751.61
CFM (scaled)BP-97 (scaled)4.1643.025.4260.66
Disclaimer/Publisher’s Note: The statements, opinions and data contained in all publications are solely those of the individual author(s) and contributor(s) and not of MDPI and/or the editor(s). MDPI and/or the editor(s) disclaim responsibility for any injury to people or property resulting from any ideas, methods, instructions or products referred to in the content.

