
Energy-Exergy–Economic (3E) -Optimization Analysis of a Solar System for Cooling, Heating, Power, and Freshwater Generation System for a Case Study Using Artificial Intelligence (AI)

Abstract
:1. Introduction
2. Methodology
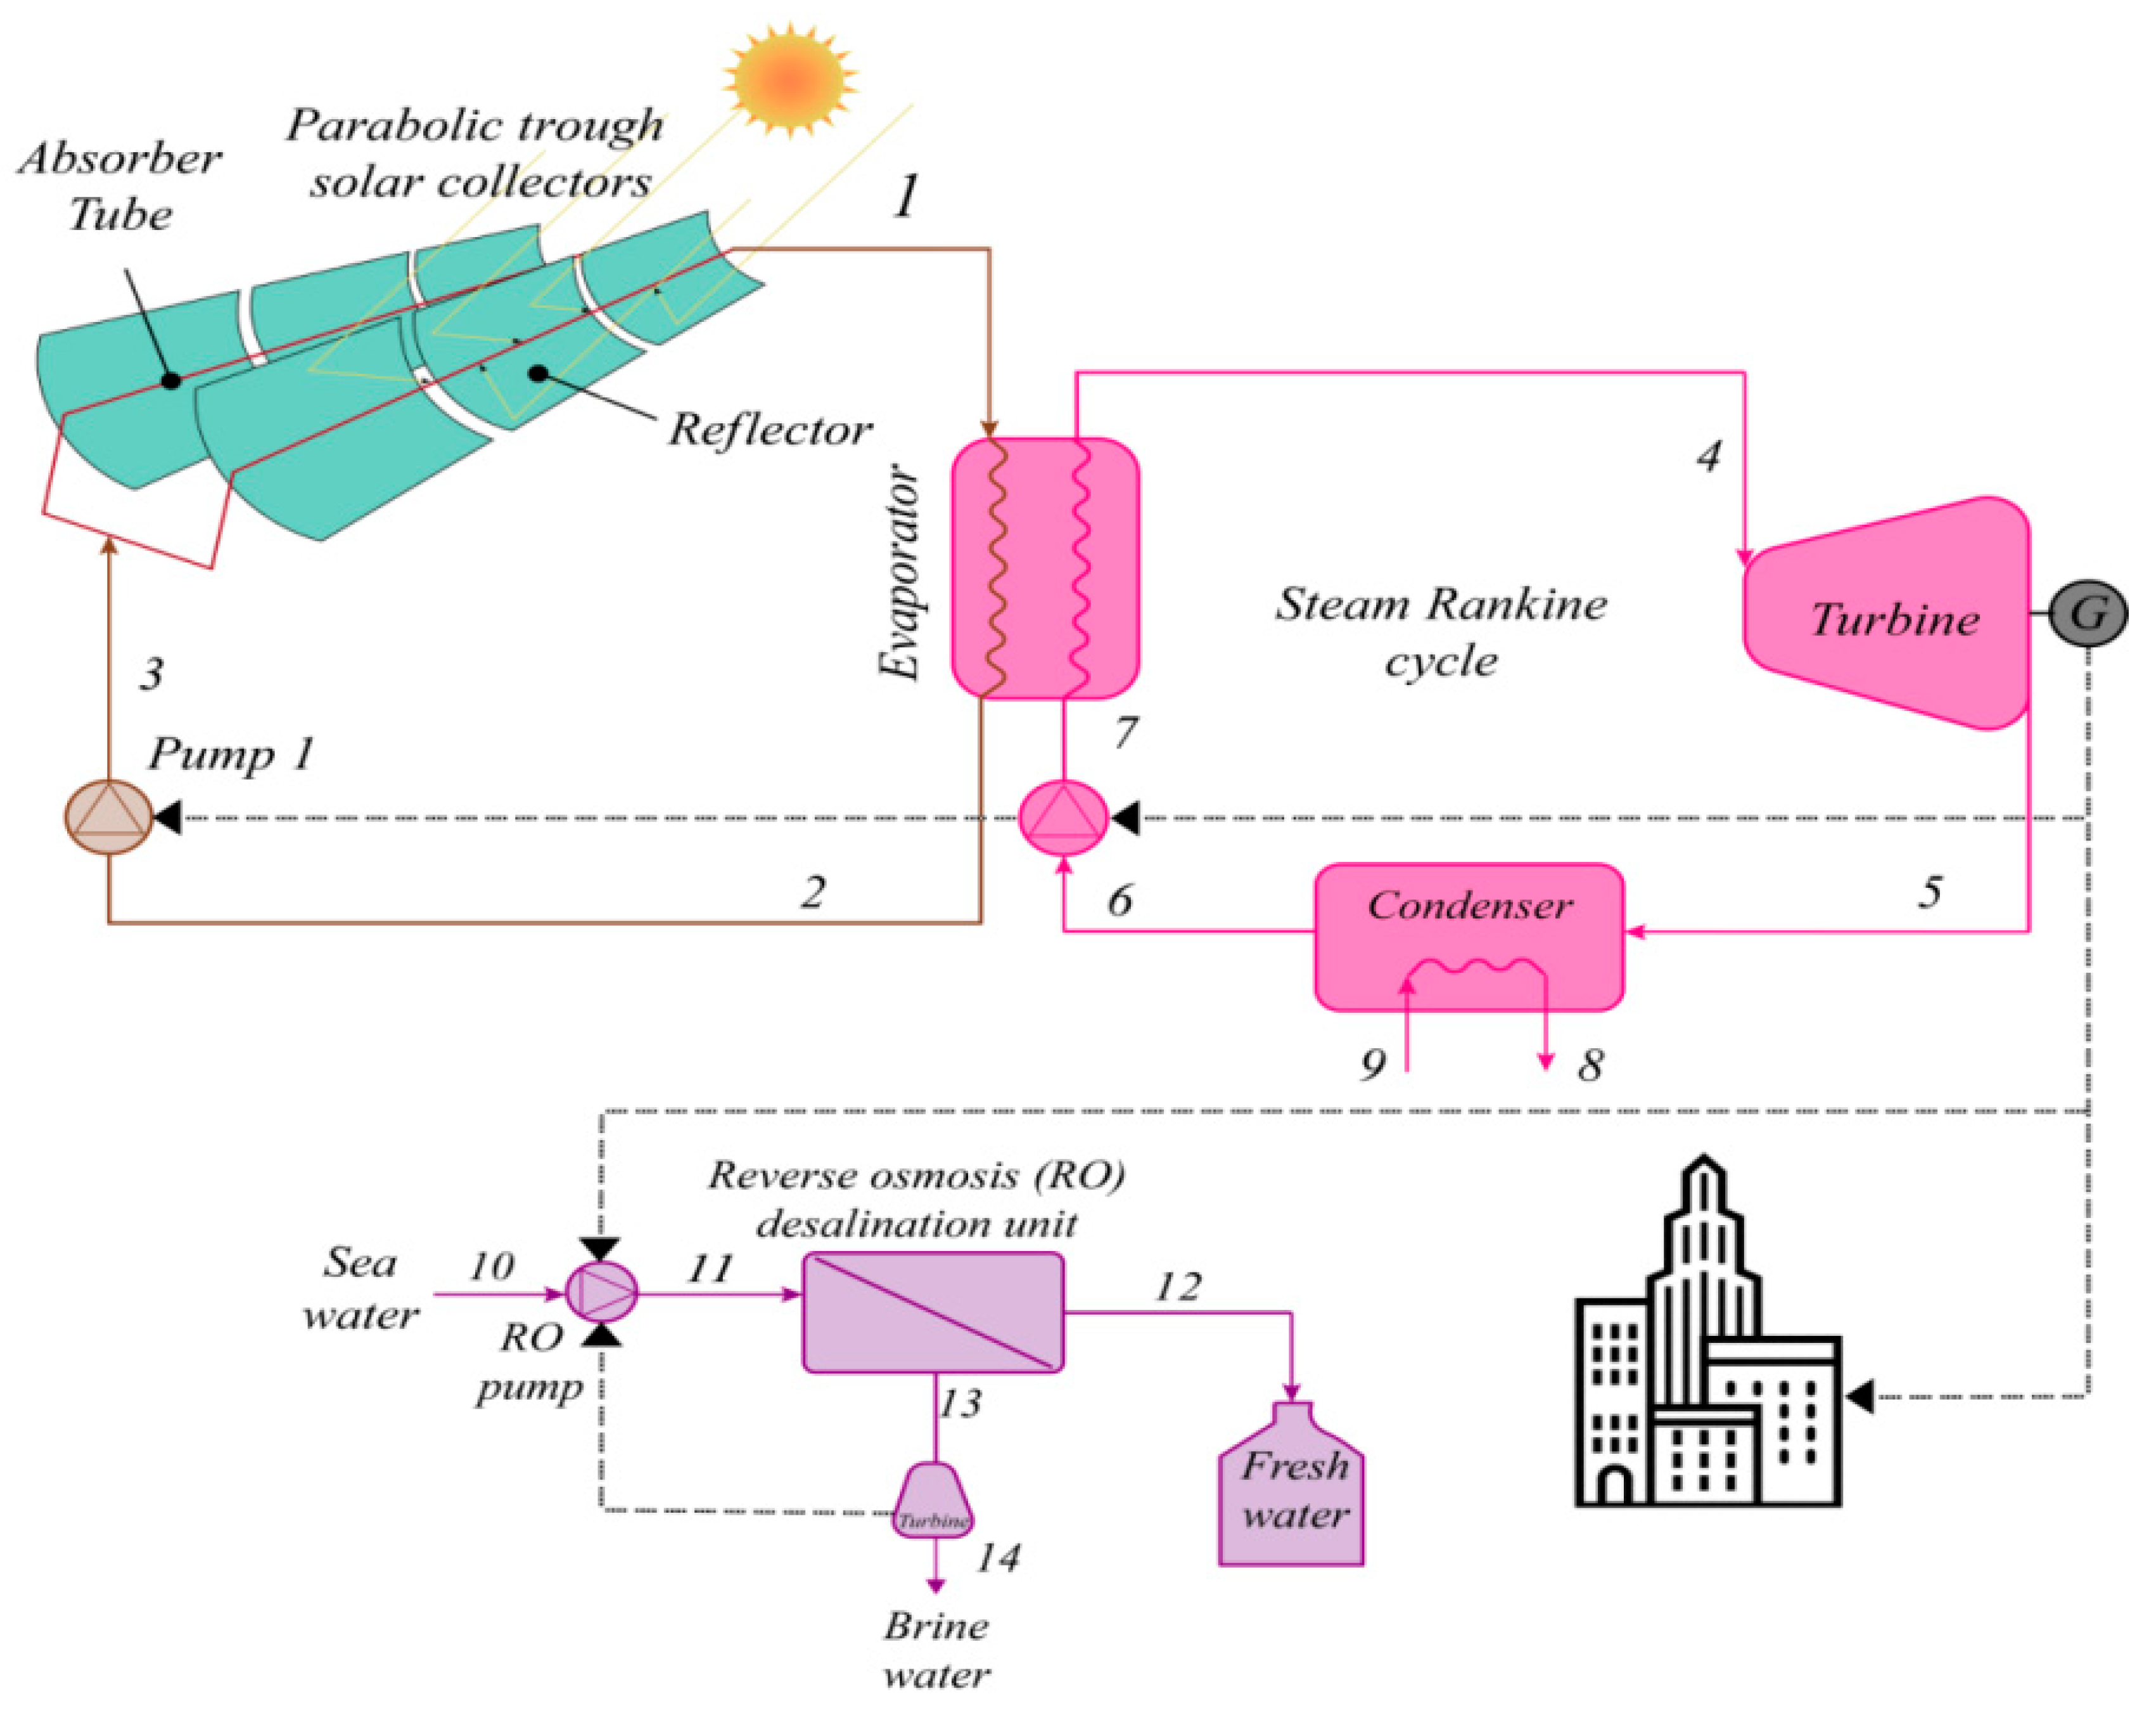
2.1. Energy System
2.2. Thermodynamic Modeling and Evaluation
- A steady state setting;
- An isentropic condition is considered for both pumps and turbines;
- The pressure drop in pipelines is insignificant [15];
- The outlet of the condenser is saturated liquid and the outlet of the evaporator is saturated vapor [15];
- Variations of kinetic and potential energy are insignificant [16].
2.3. Parabolic Solar Collector Analysis
2.4. Reverse Osmosis Analysis (RO)
2.5. Exergy Analysis
2.6. Economic Evaluation
3. Results and Discussion
3.1. Validation
3.2. Sensitivity Analysis
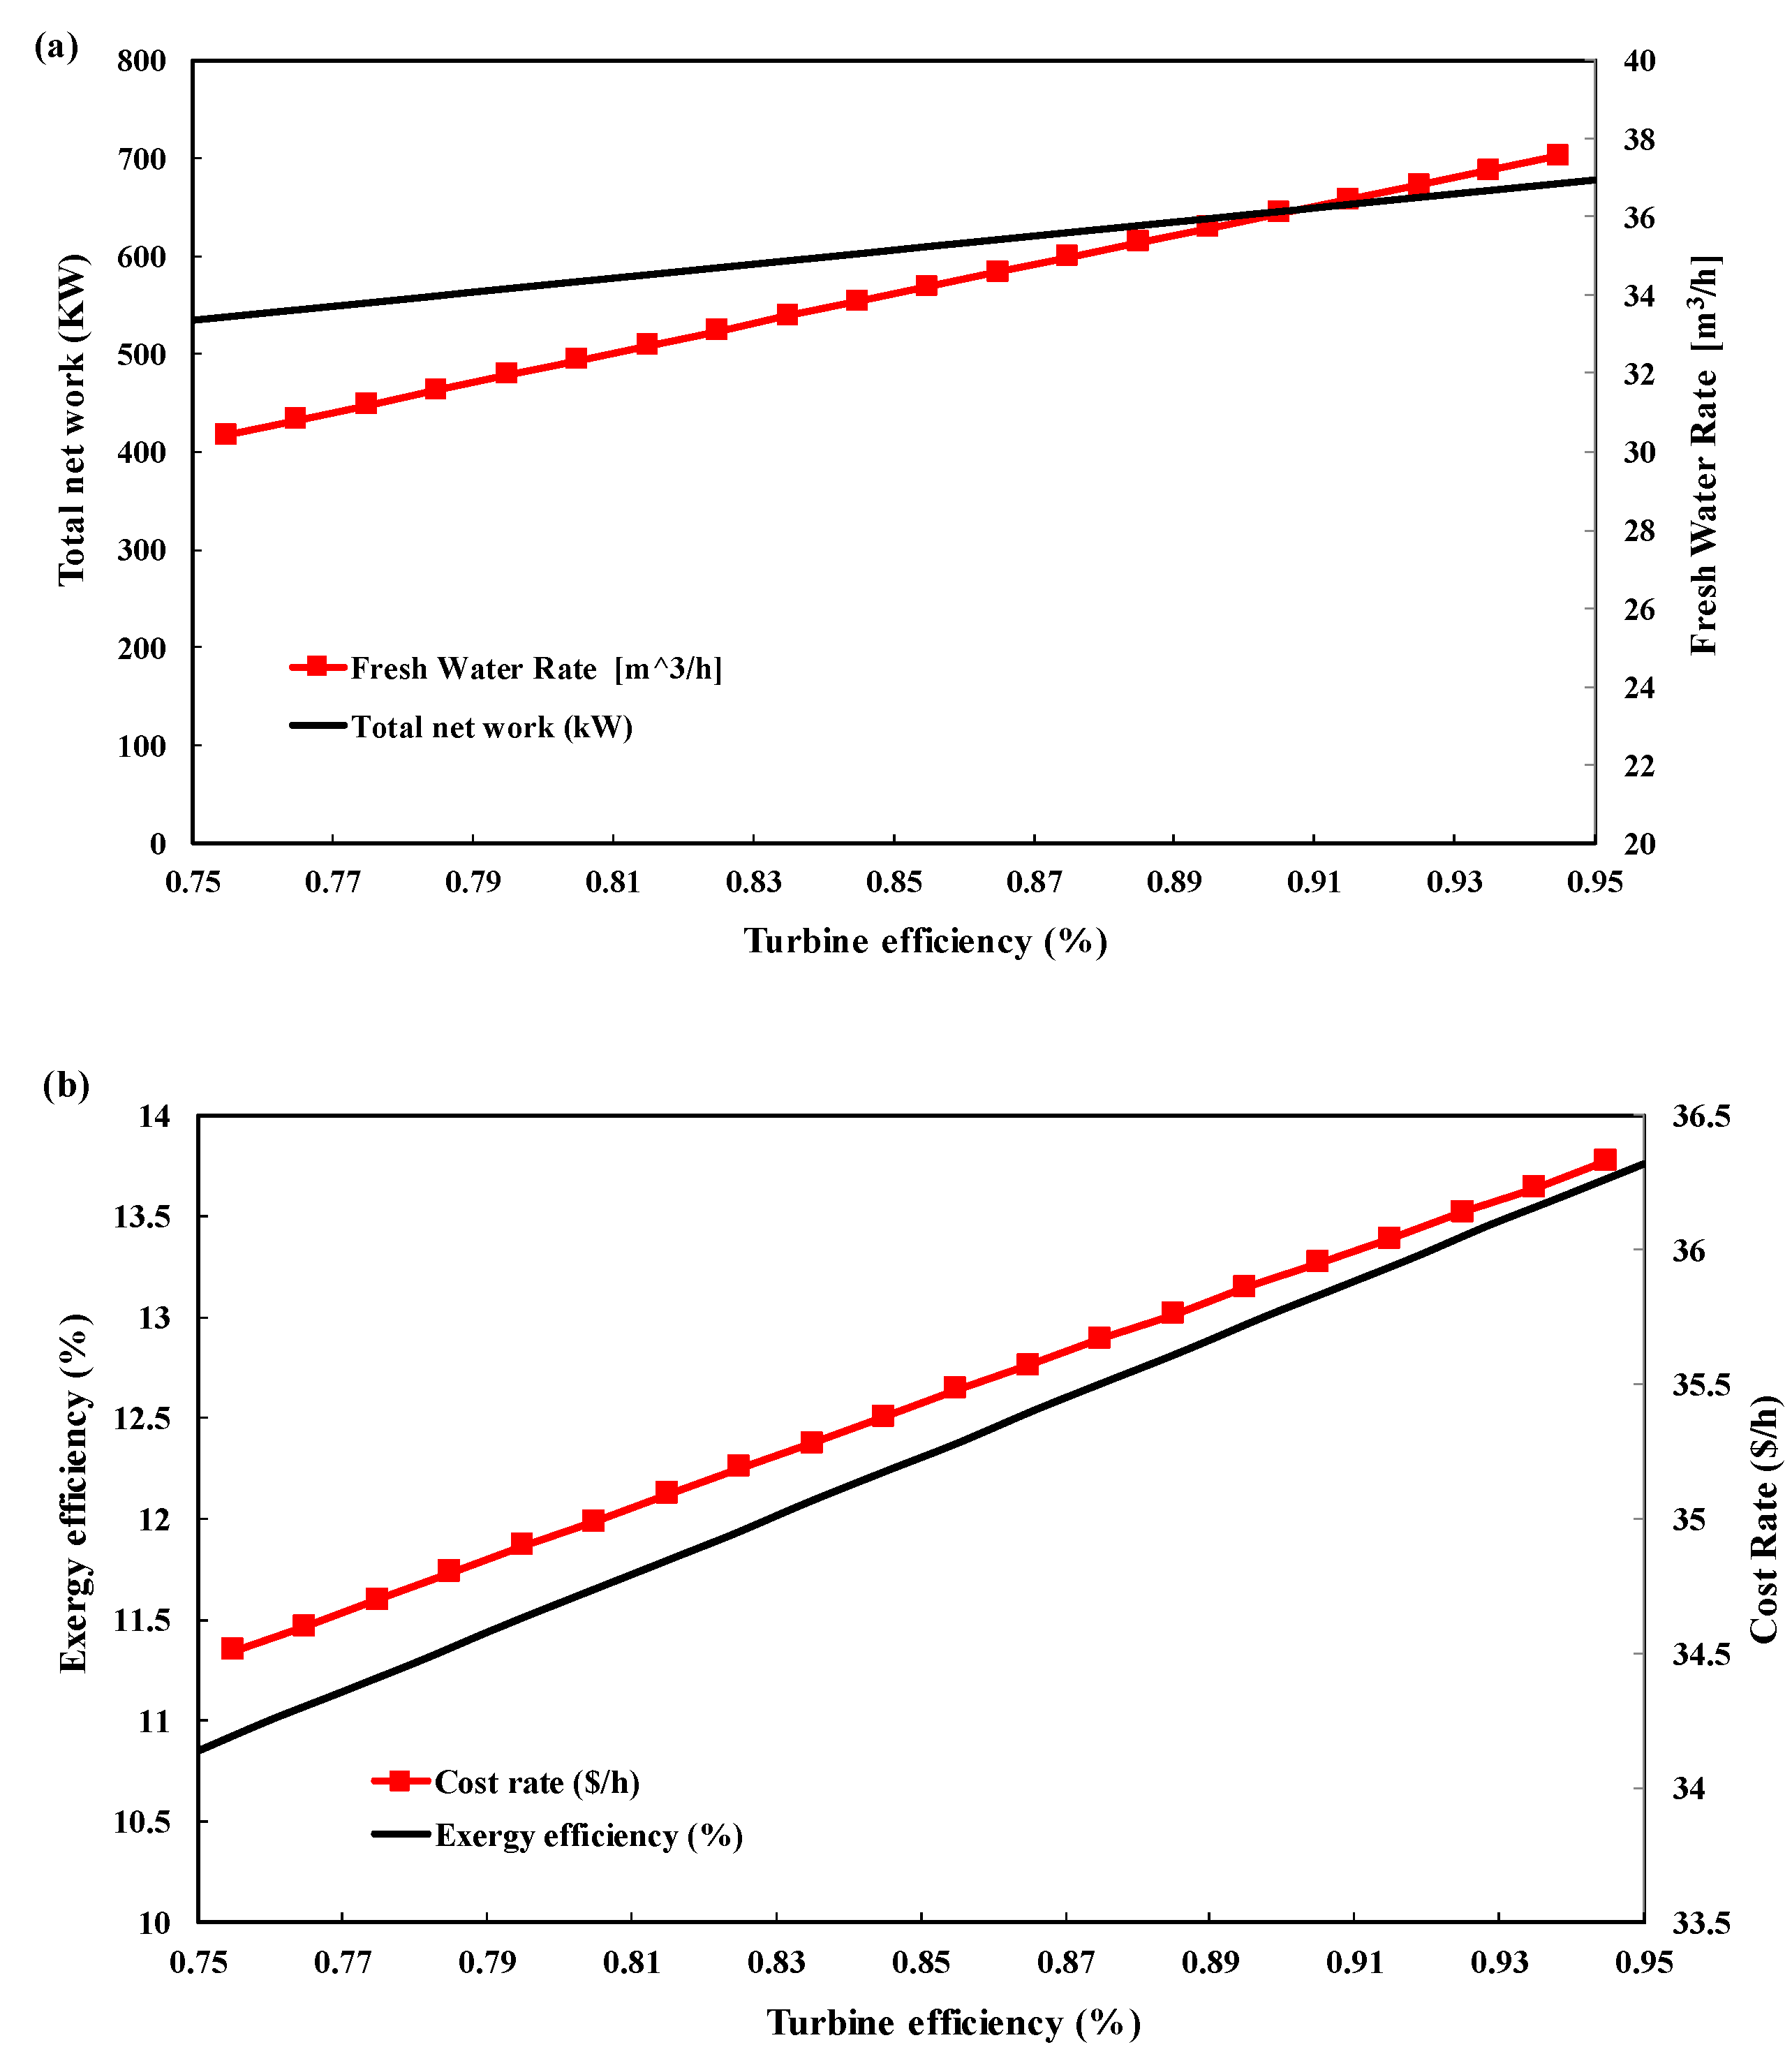
- Power production and exergy efficiency are directly related to each other, so by increasing or decreasing the power production of the system, the value of exergy efficiency increases or decreases as well.
- With the increase in the production capacity of the system and the need for larger equipment and more maintenance, the cost rate of the system also increases.
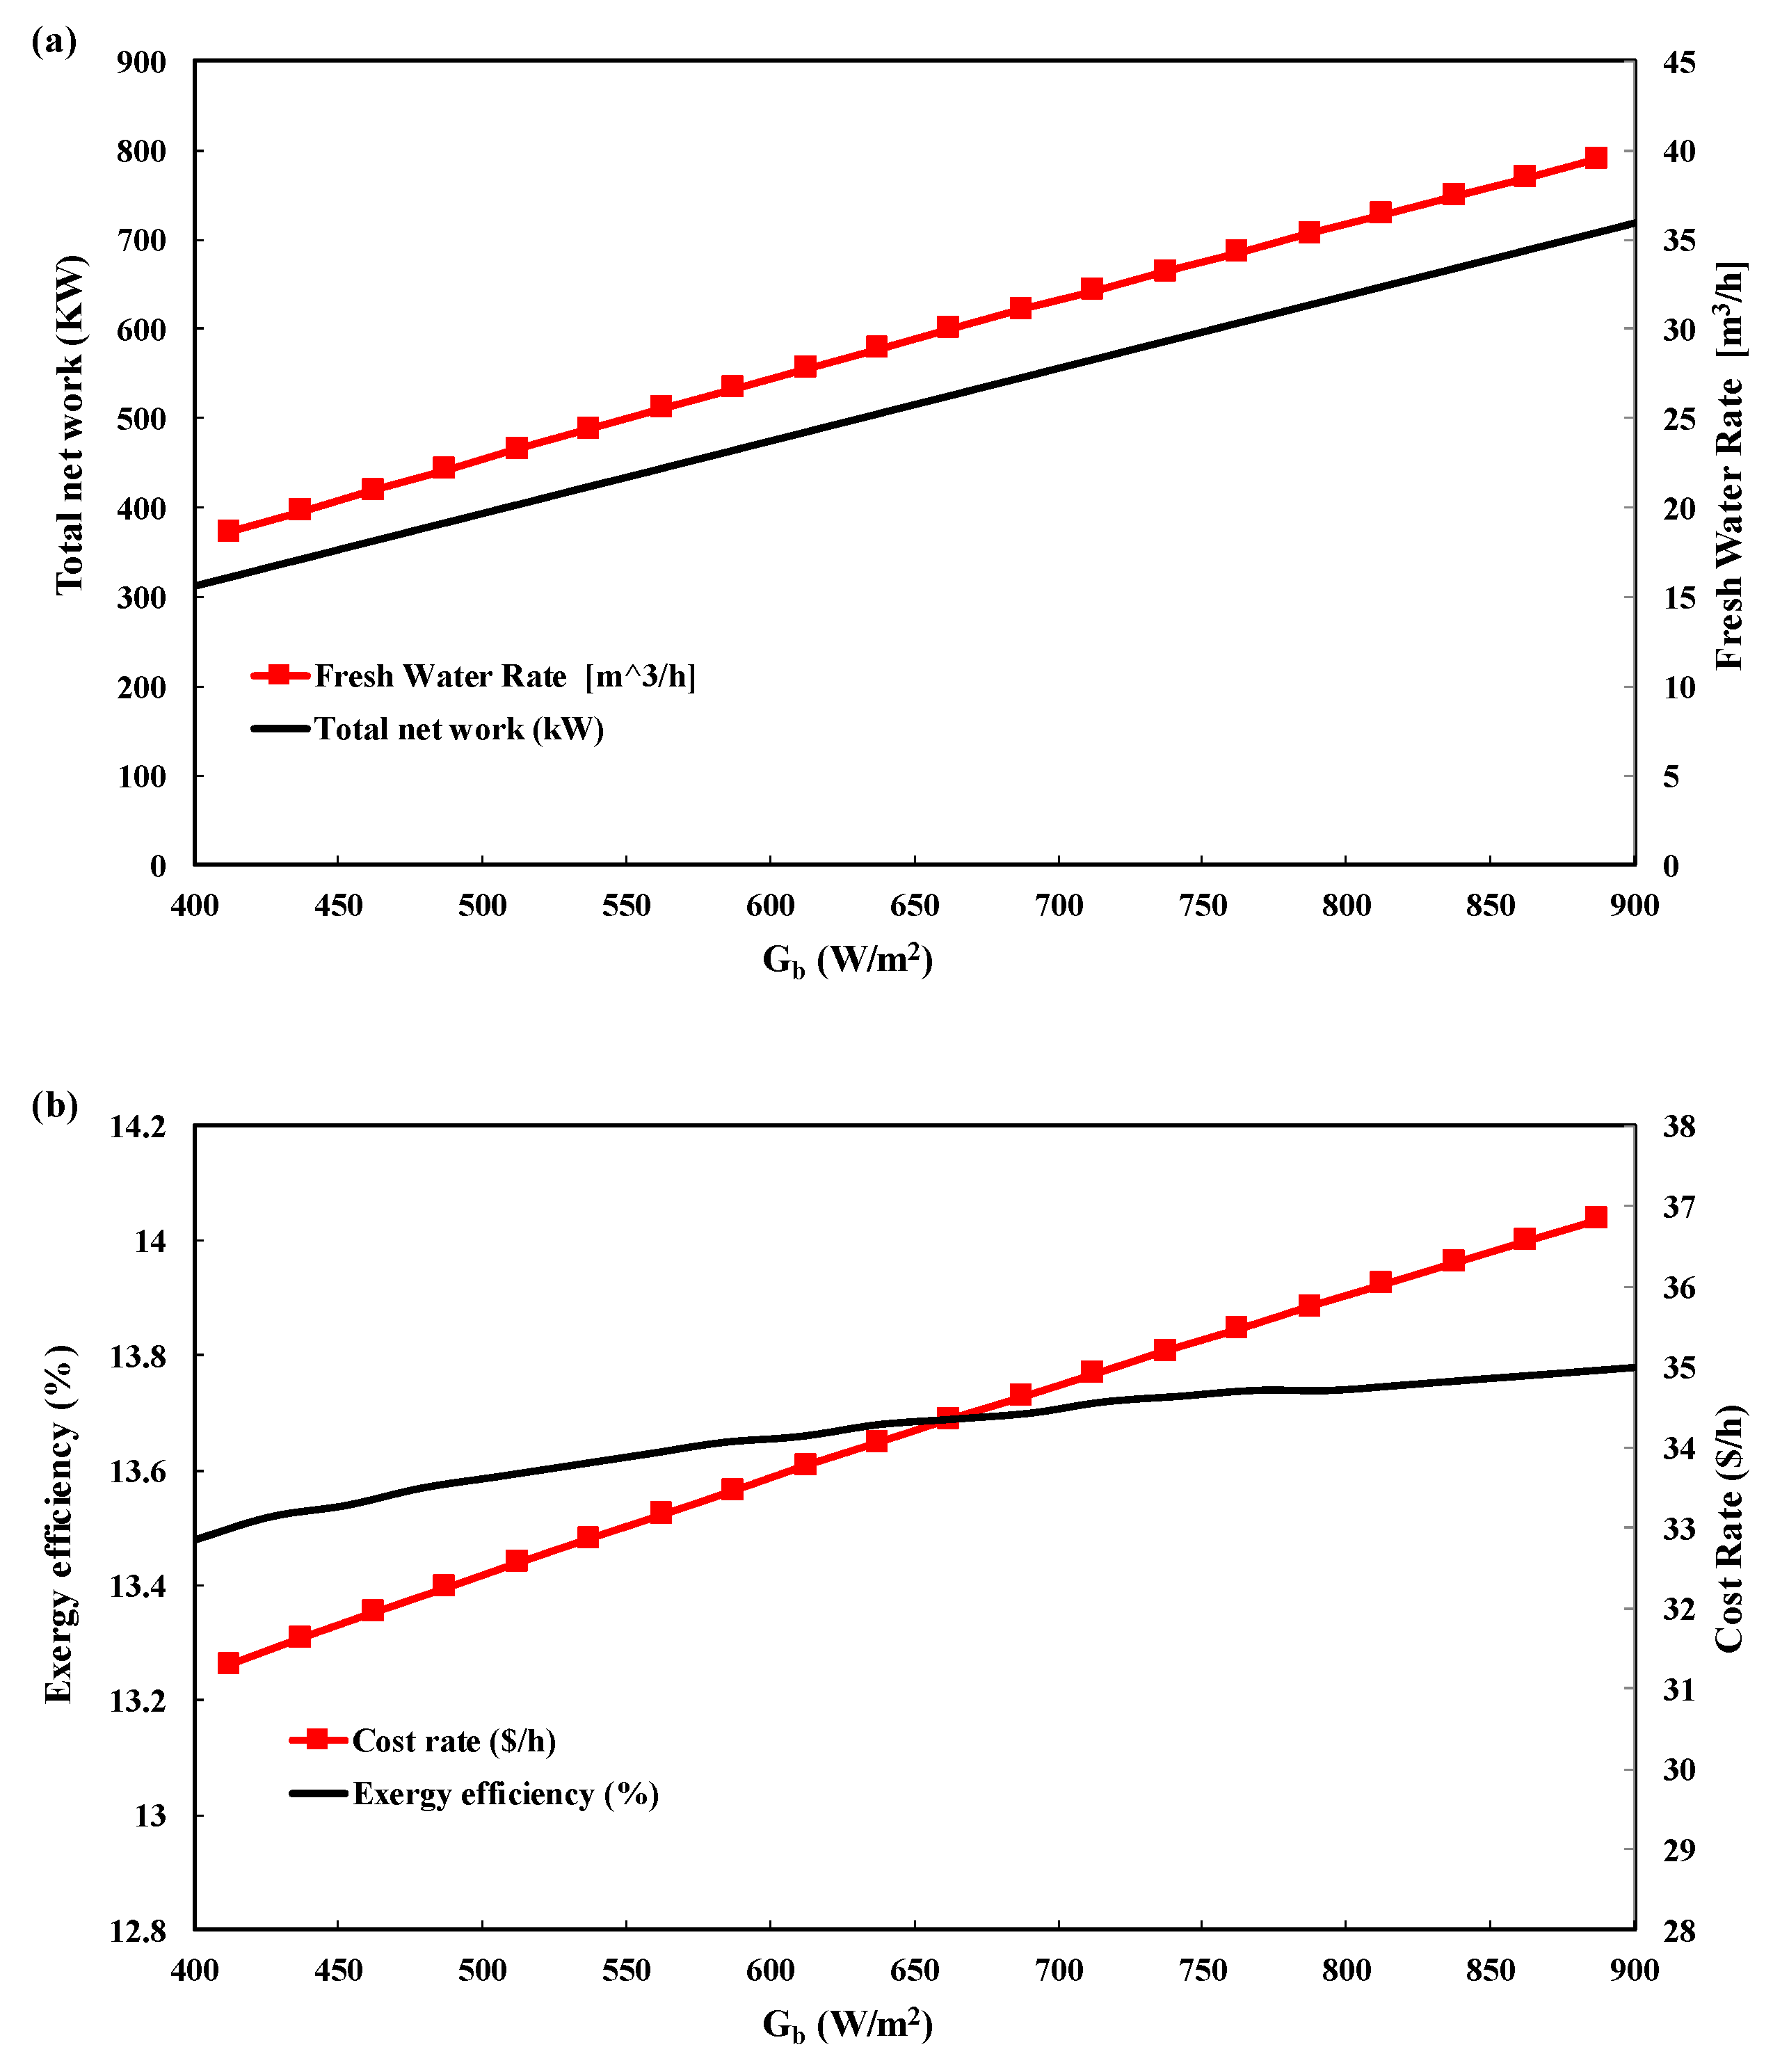
- The performance and efficiency of solar collectors depend more on the intensity of solar radiation than any other factor because all the power required to produce energy is provided by solar collectors from sunlight, and the higher the amount of solar radiation, the more efficient the solar collectors will be. It is also found that increasing or decreasing the performance of the solar collector has a direct effect on the performance of the system because the energy required by the Rankine cycle is provided by solar energy.
- With the increase in solar radiation, the flow rate of the input fluid to the solar collectors increases, and as a result, the output work of the subsystems also increases. With the increase in the flow rate, the total output work will also increase and vice versa.
- With the increase in the temperature of the evaporator, the input enthalpy to the steam Rankine cycle turbine also increases, and as a result, the total work increases with the increase in enthalpy and vice versa.
- As the pinch point temperature of the evaporator increases, its amount of heat transfer decreases; as a result, with the decrease in heat transfer from the evaporator to the steam Rankine cycle, the work output of the entire system does not increase much.
- Increasing or decreasing the amount of heat transfer has a direct relationship with the work of the whole system.
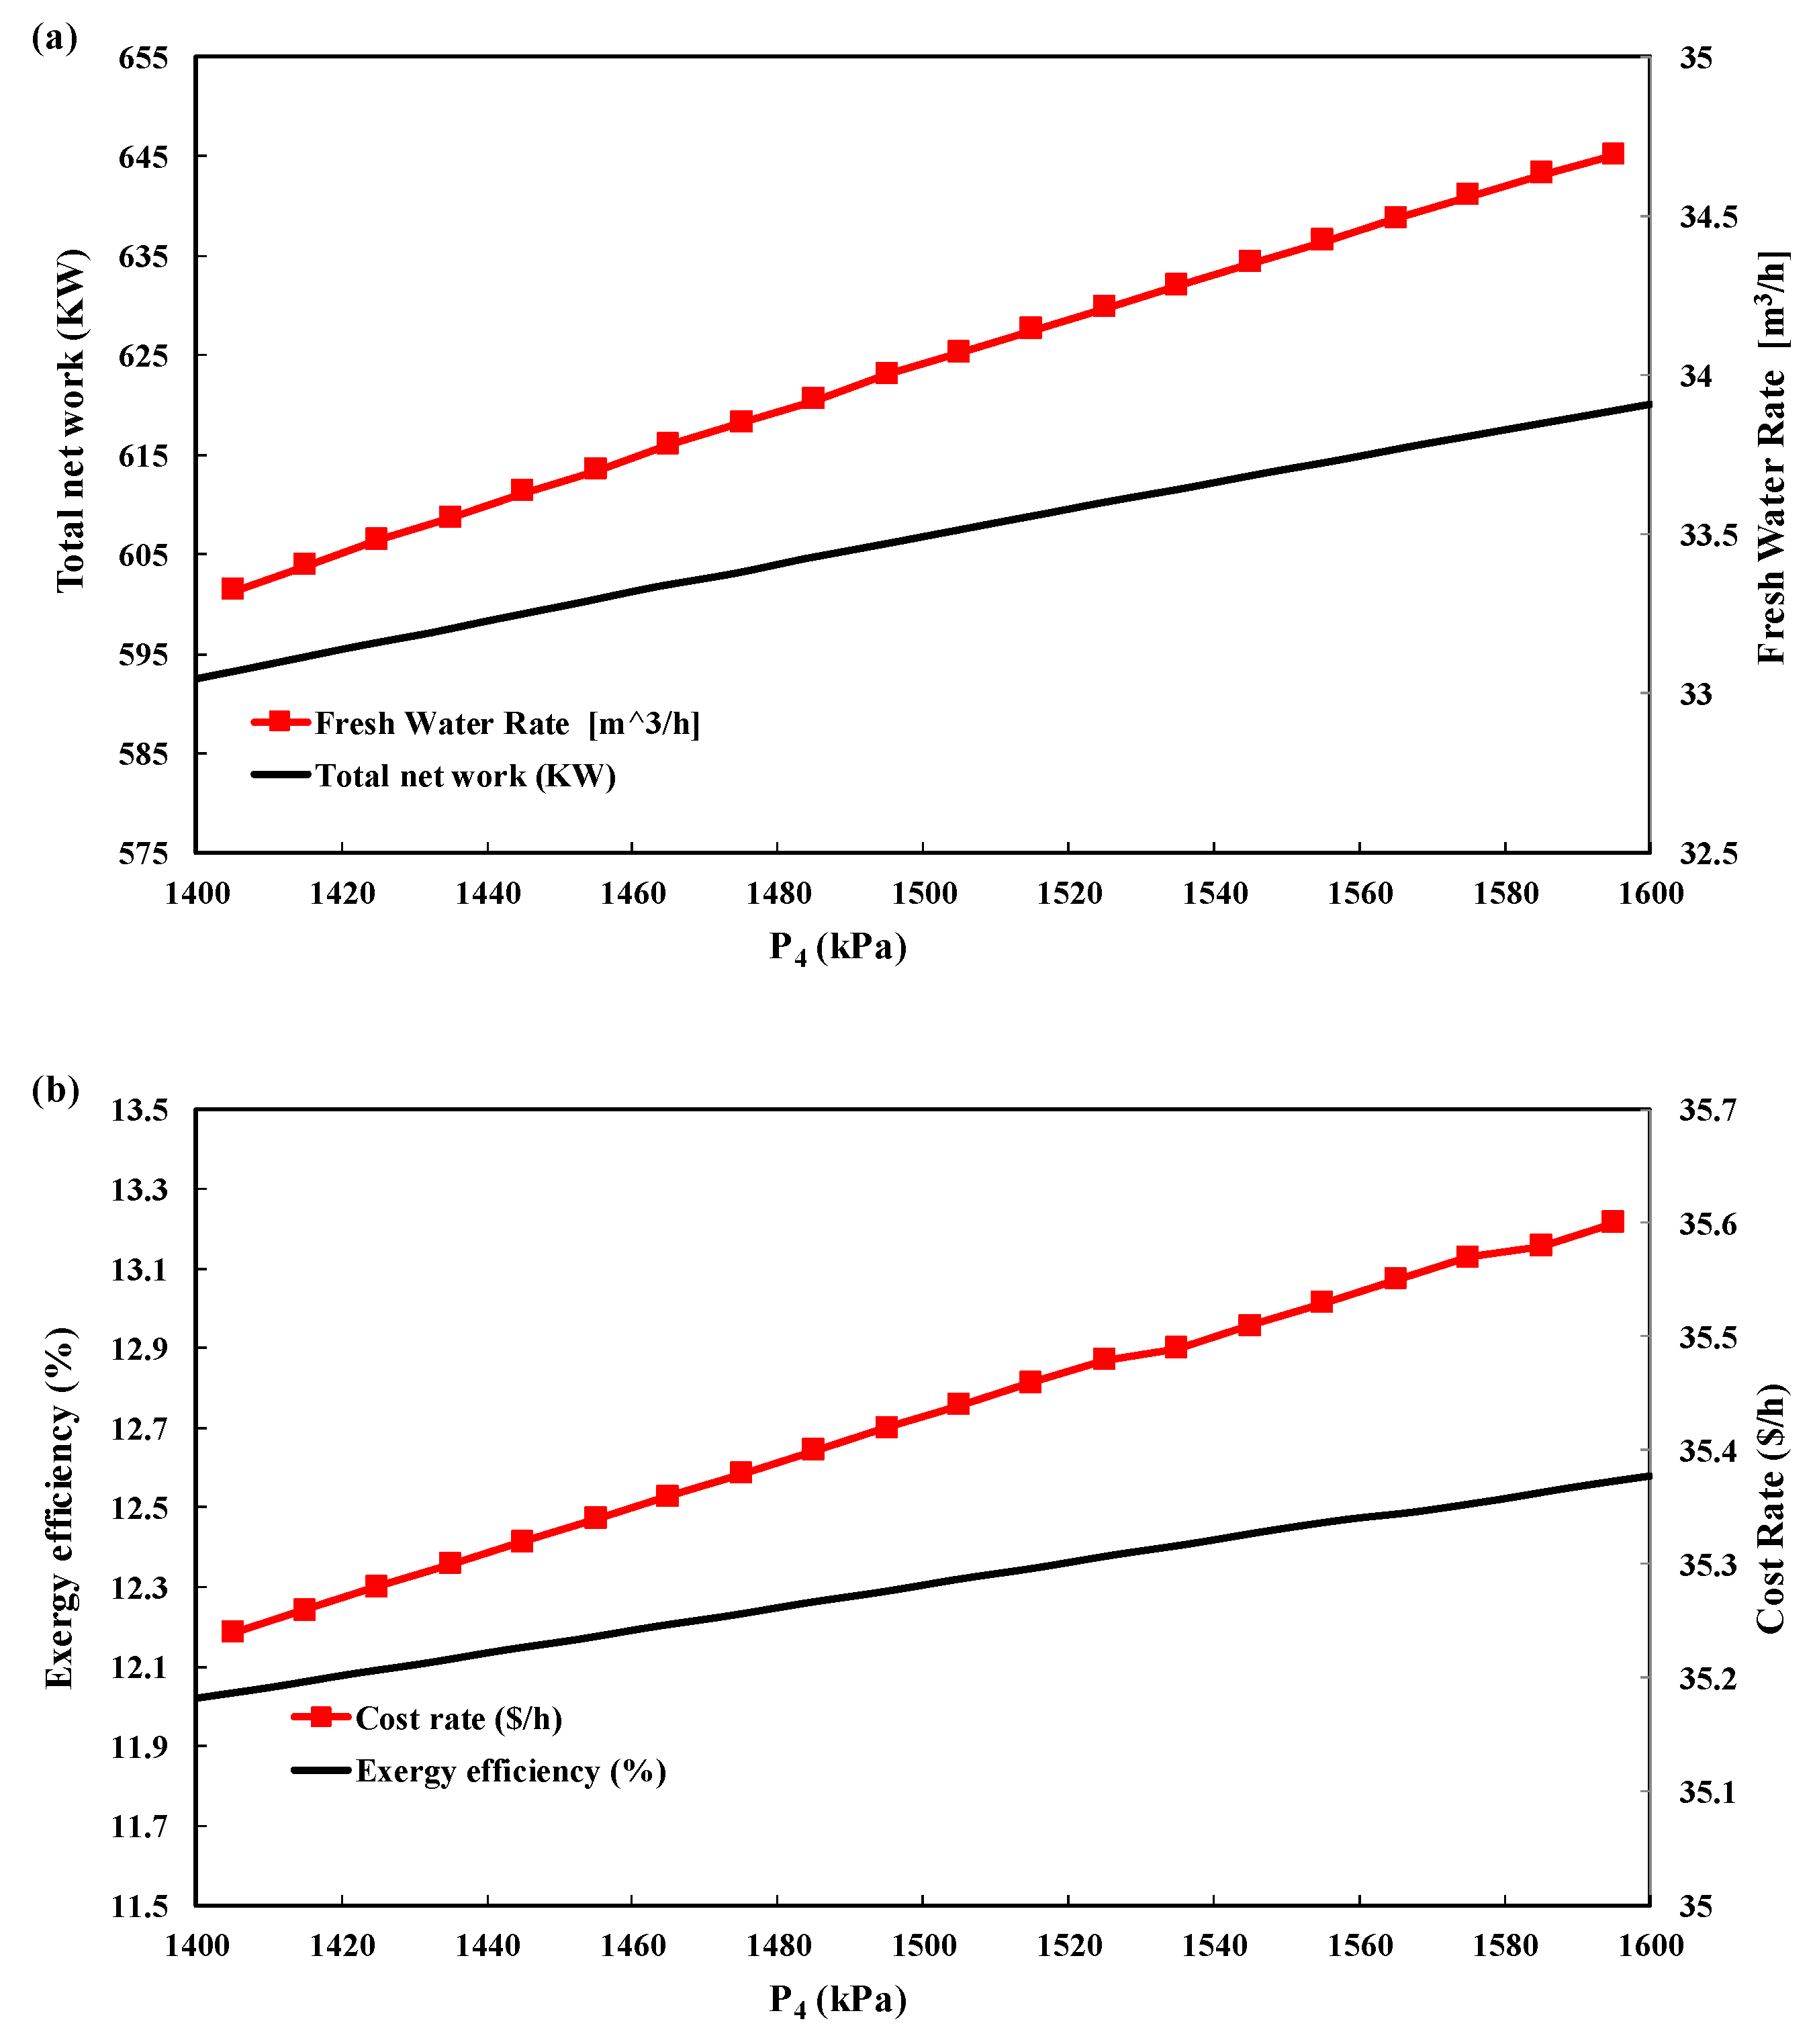
- By increasing the input pressure of the steam Rankine cycle turbine, the enthalpy of the fluid also increases at this point, and as a result, it increases the total work of the turbine and steam Rankine cycle, which increases the total work for this cycle.
- By increasing the input pressure of the steam Rankine cycle turbine, the output pressure from the turbine rises as well. The output pressure from the turbine increases the input energy to produce the power of the system, so with the increase in the input pressure of the turbine, the energy production also increases.
3.3. Parametric Study
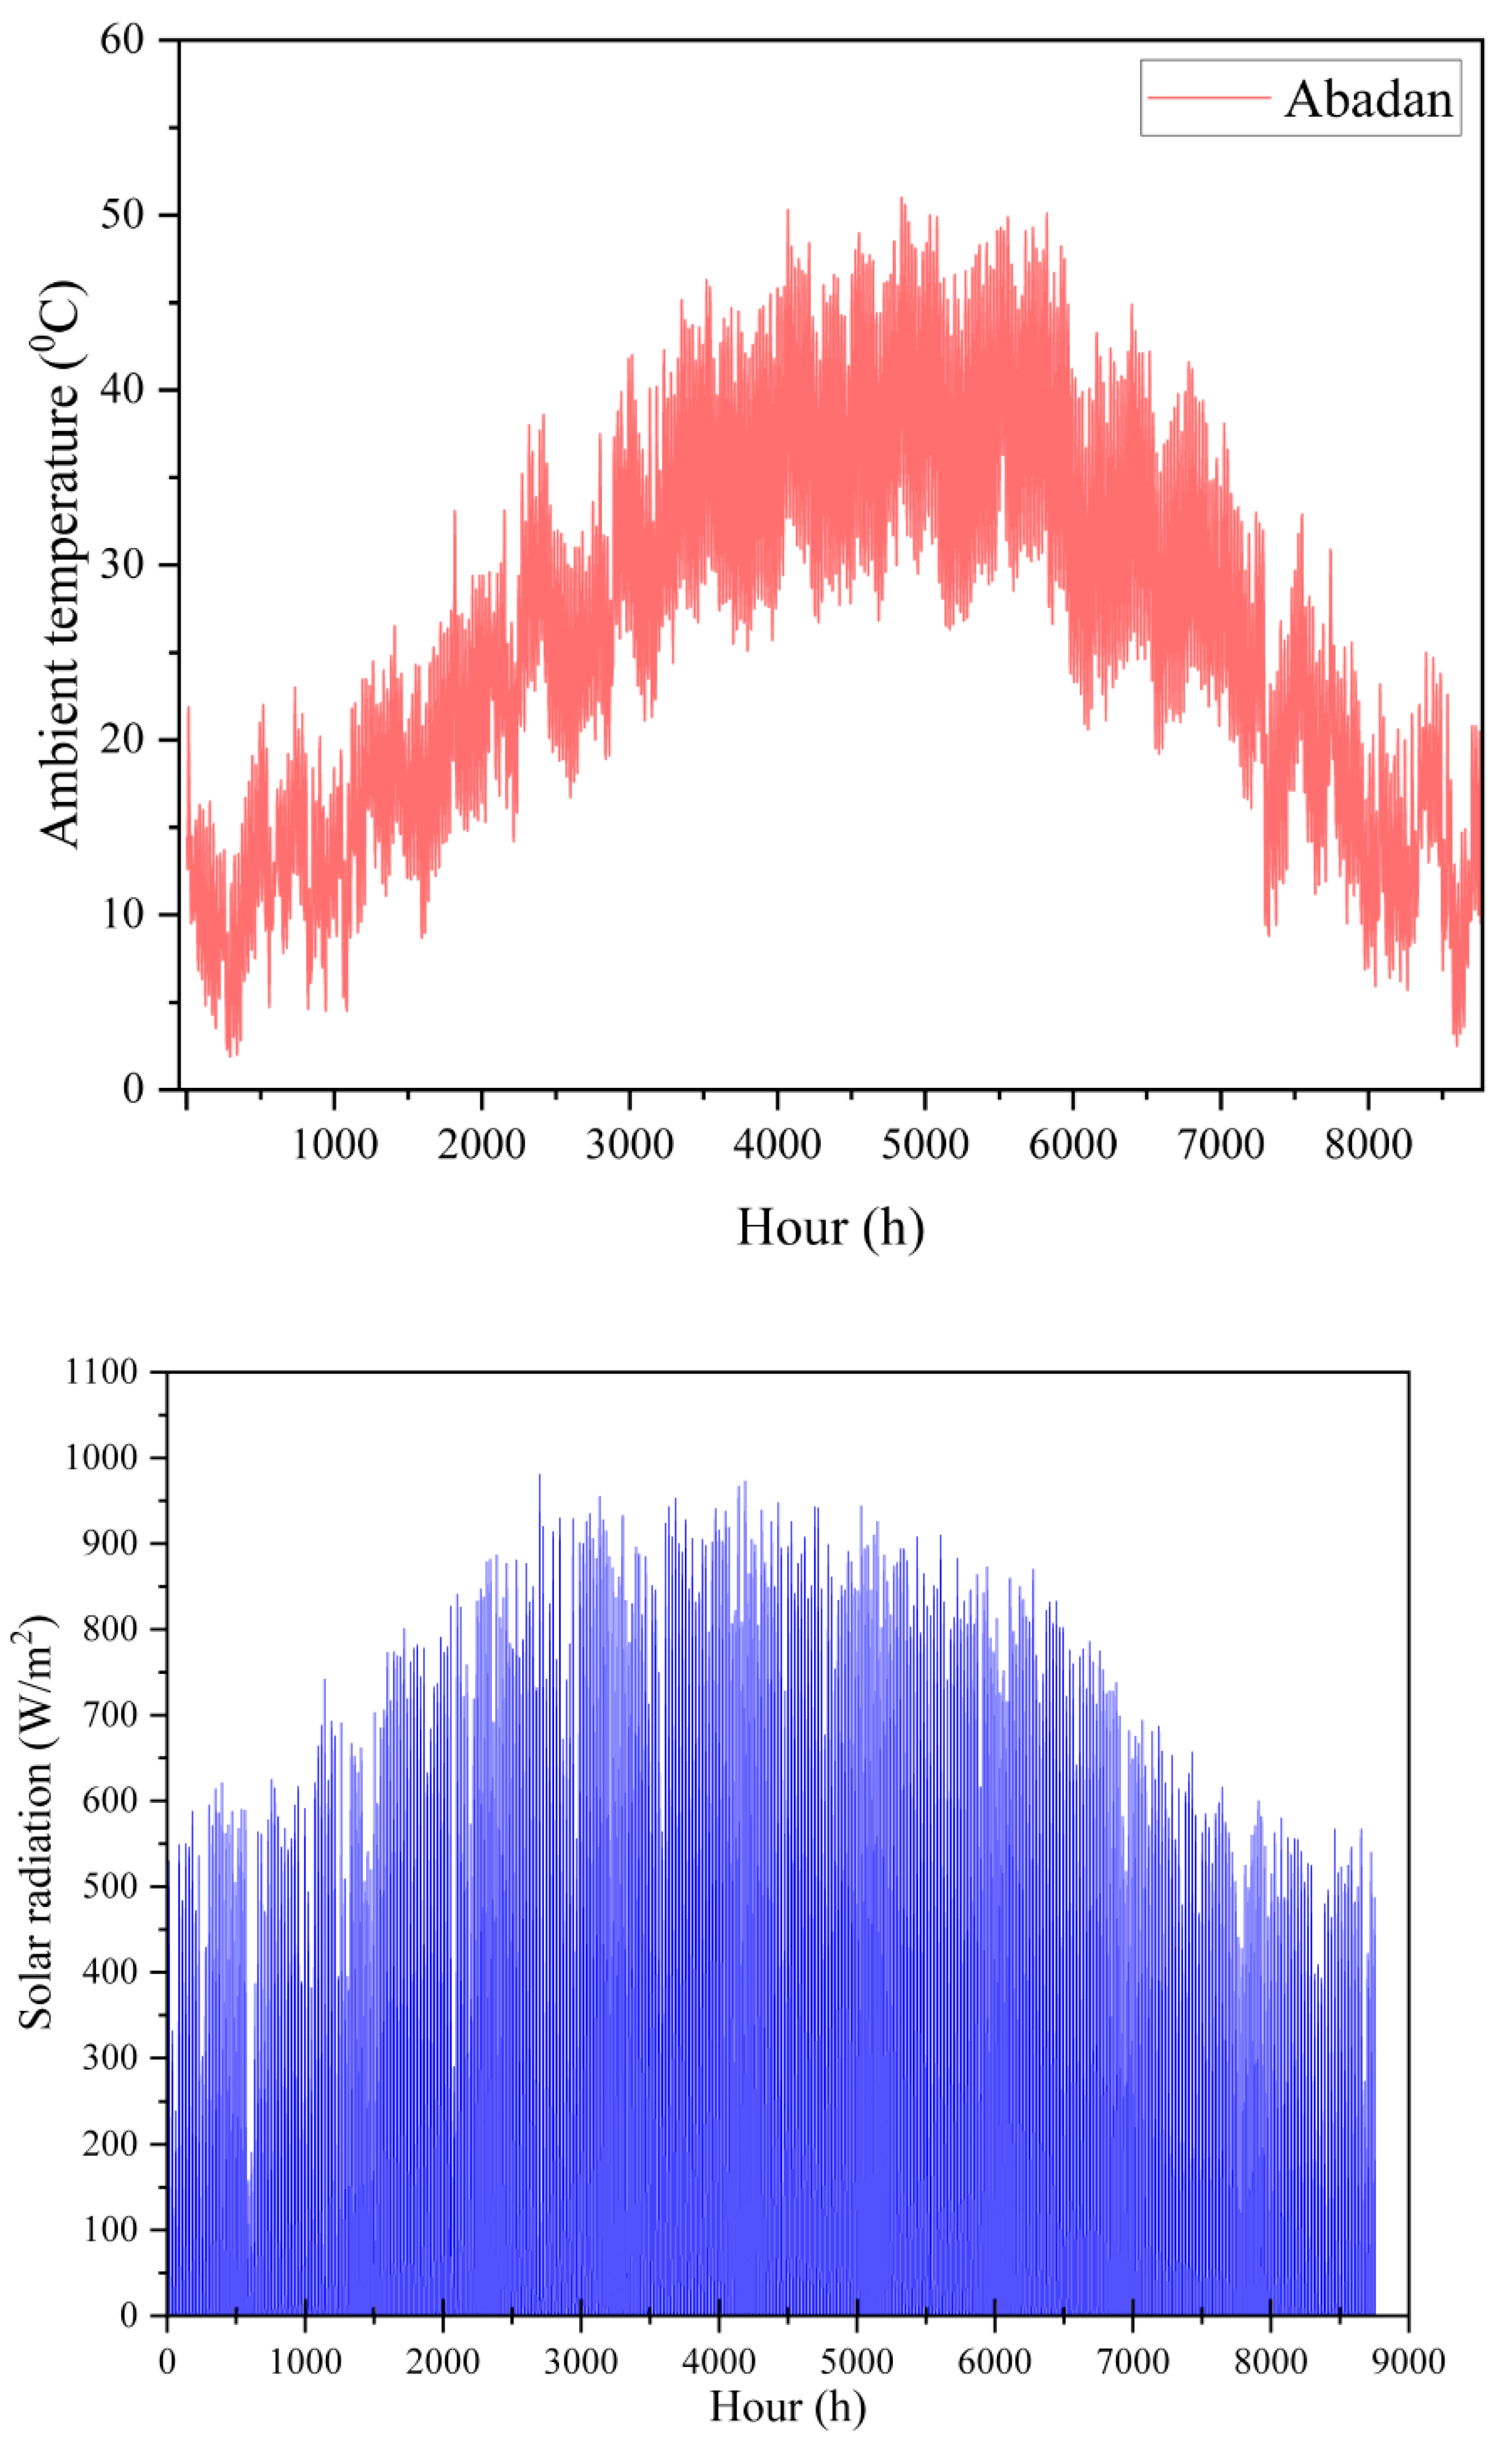
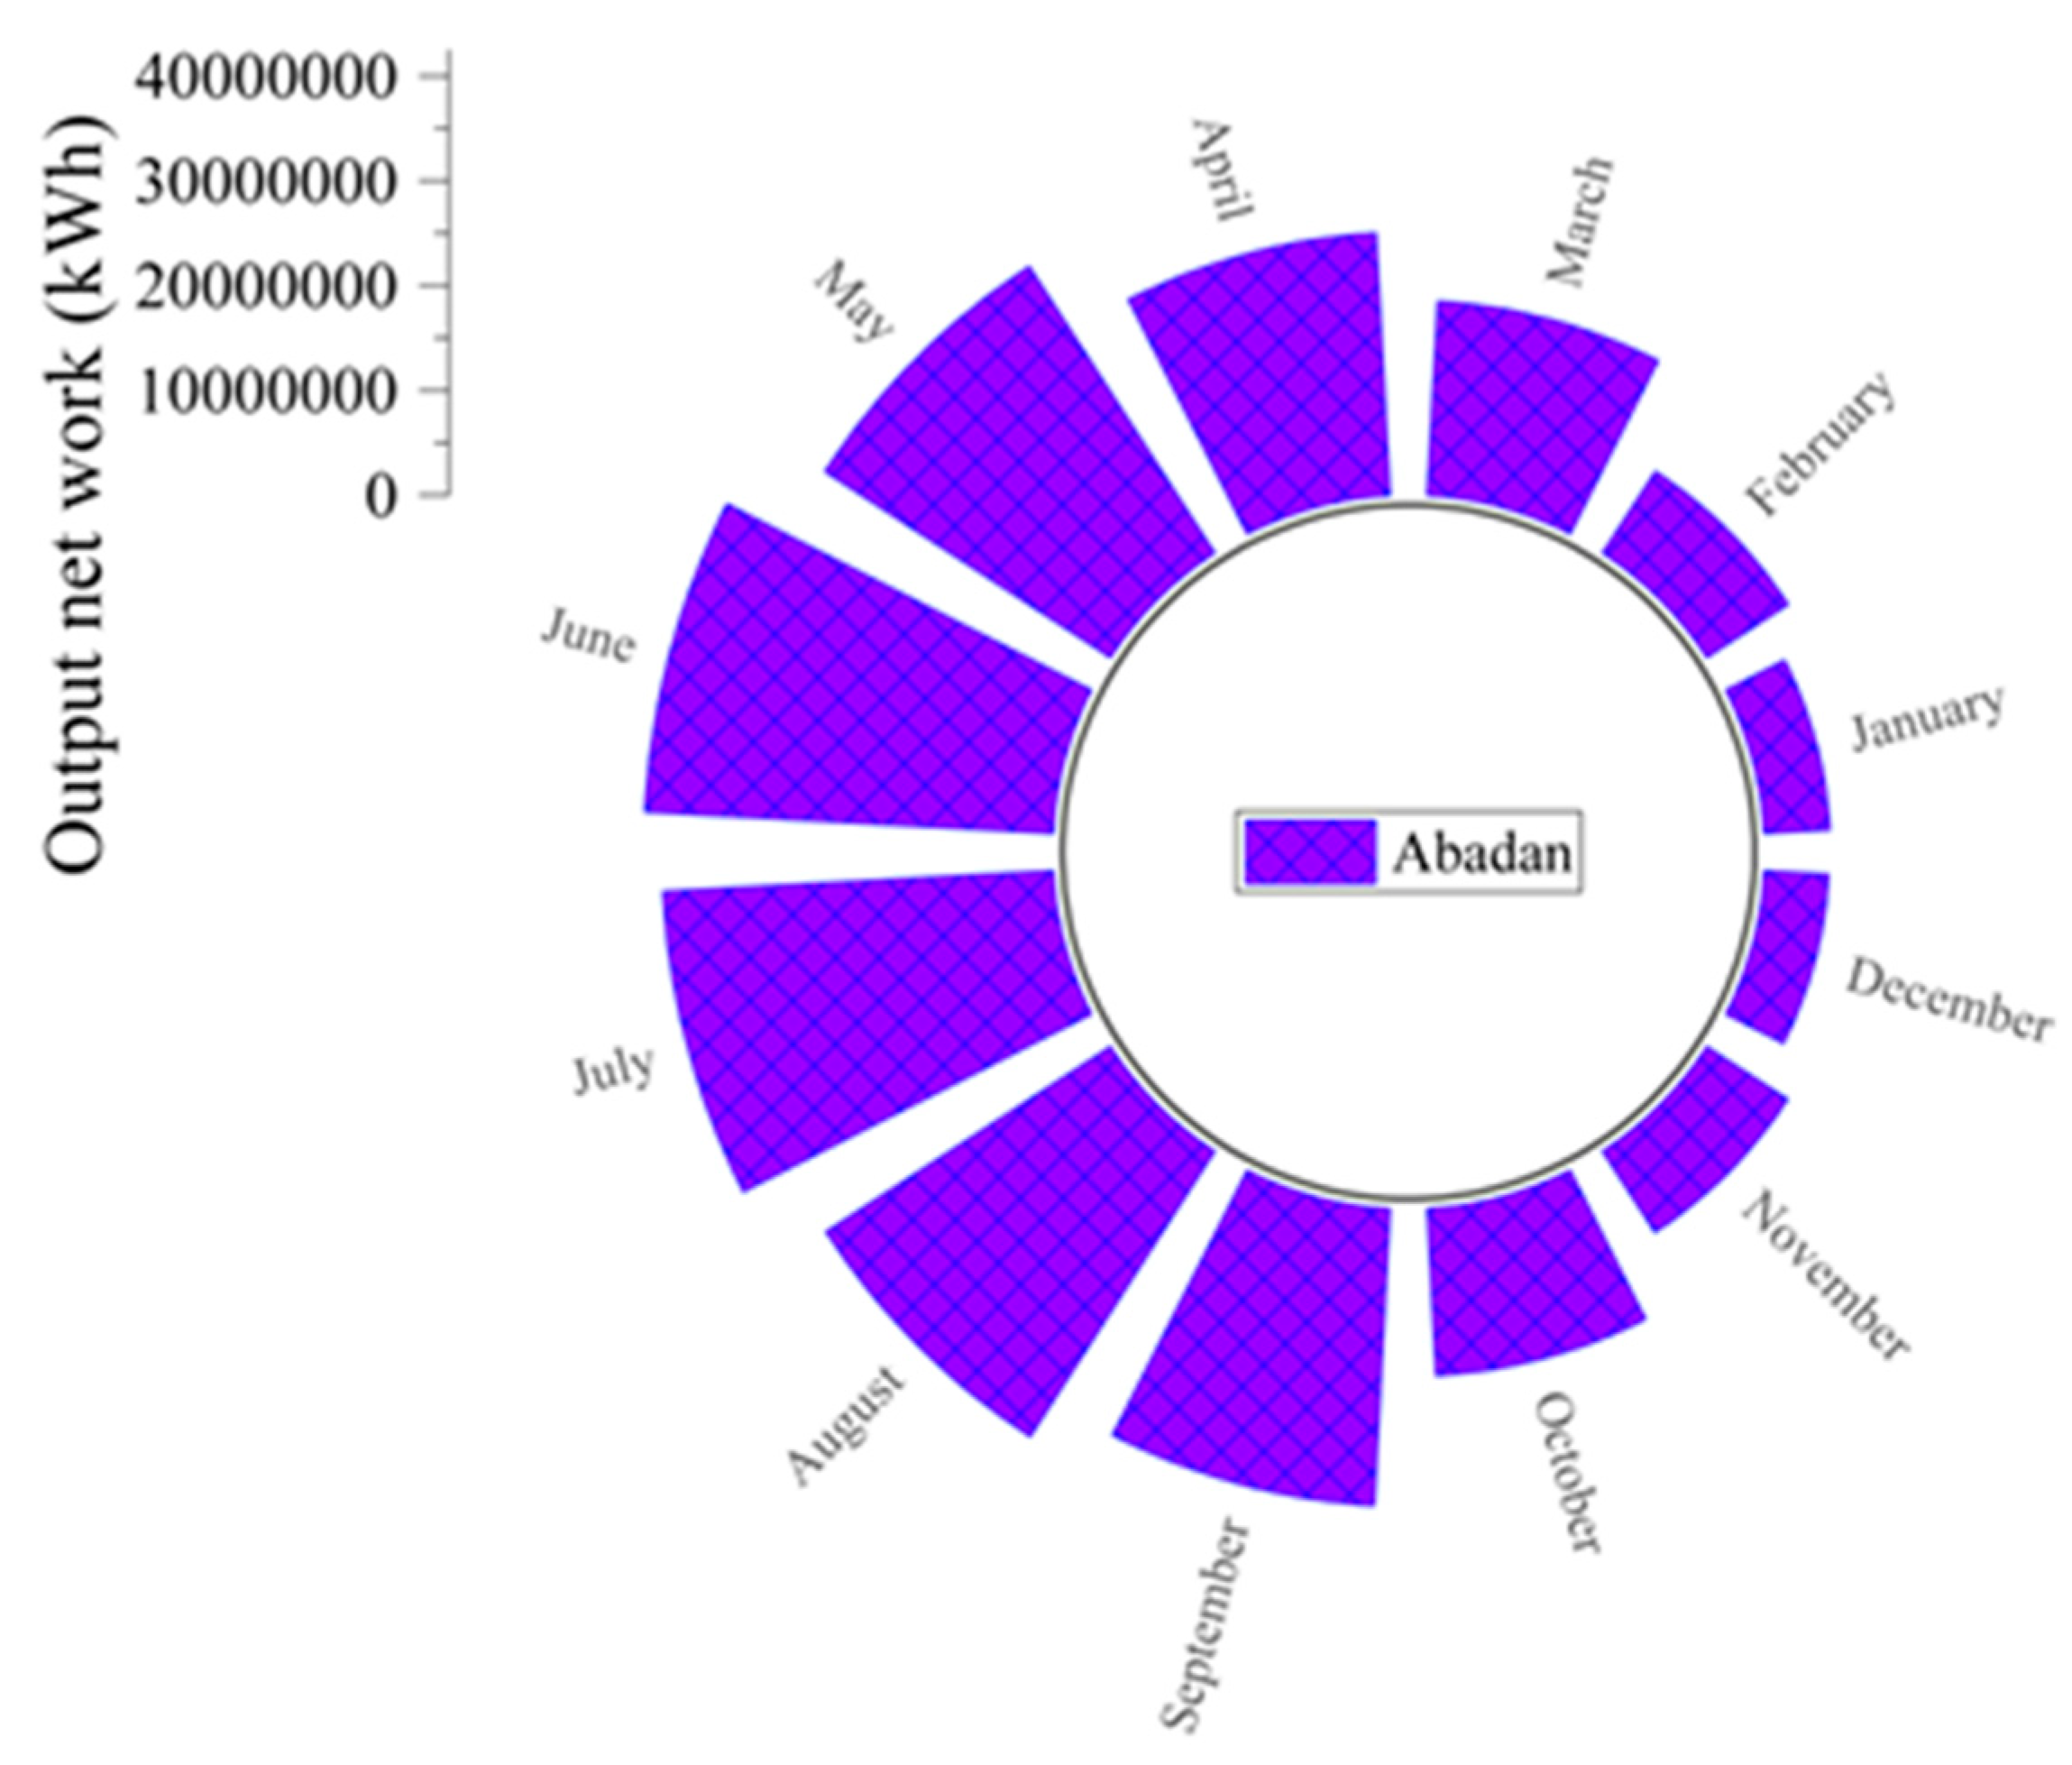
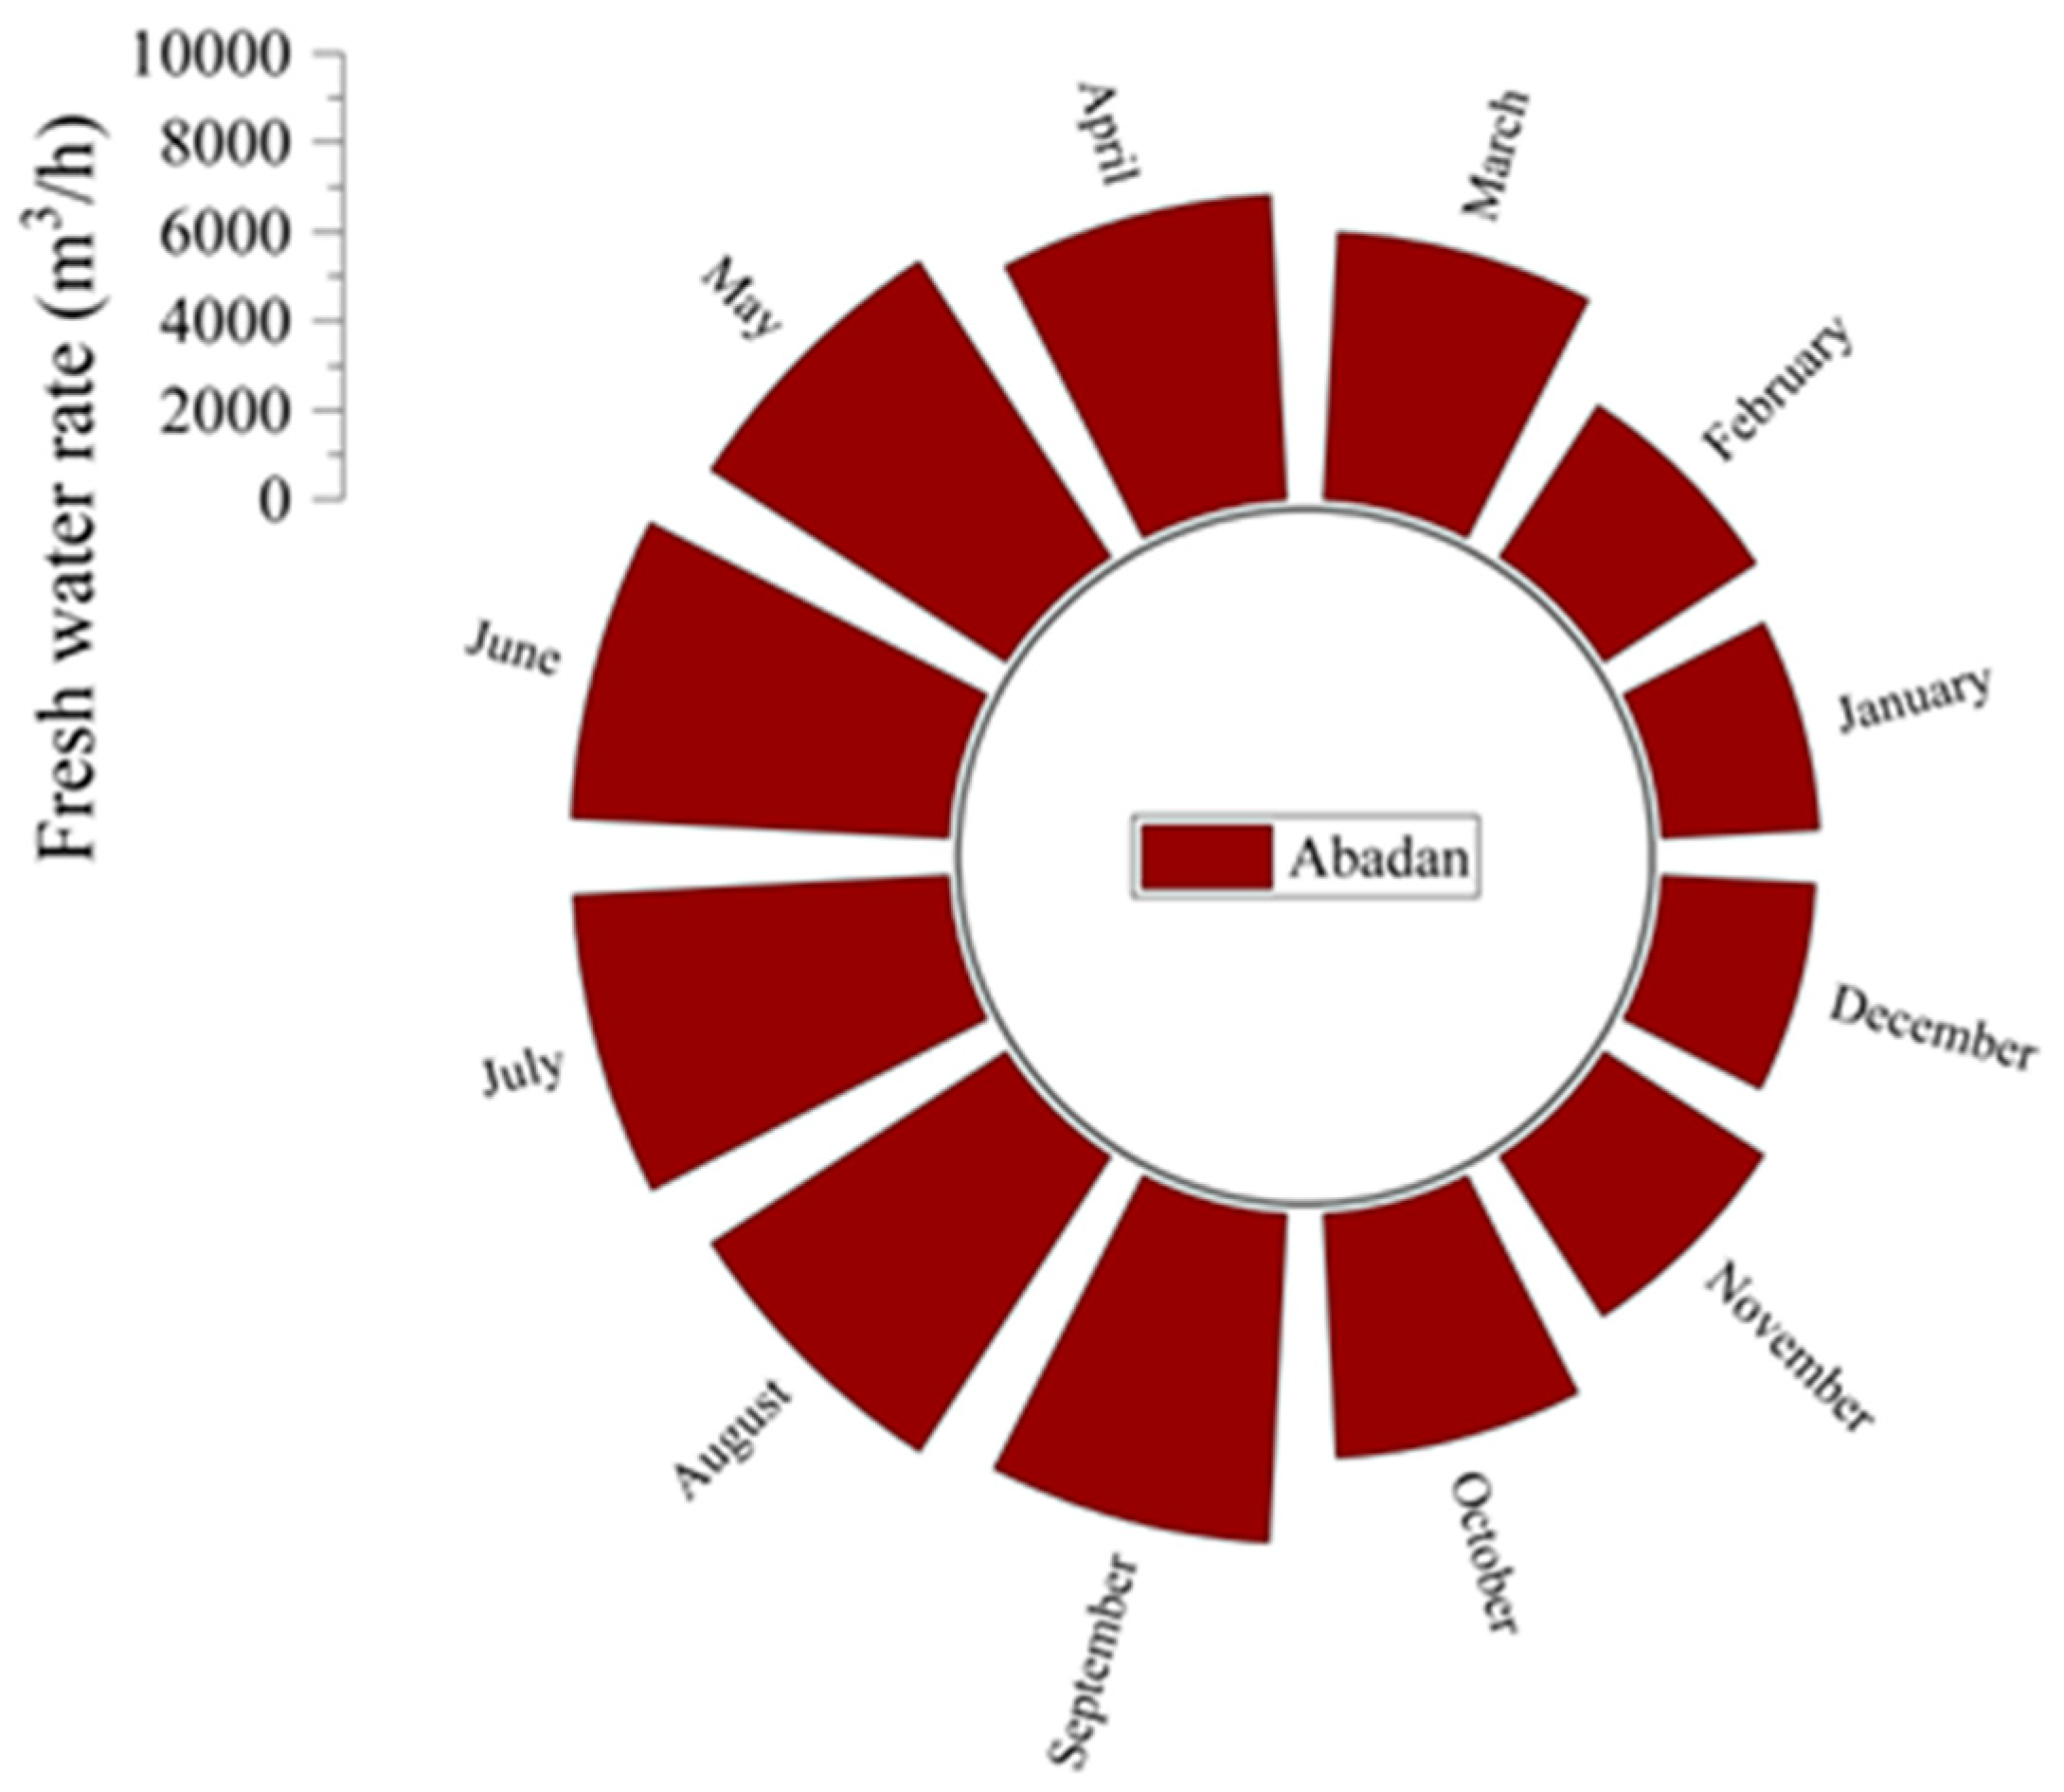
4. Case Study
Case Study Results
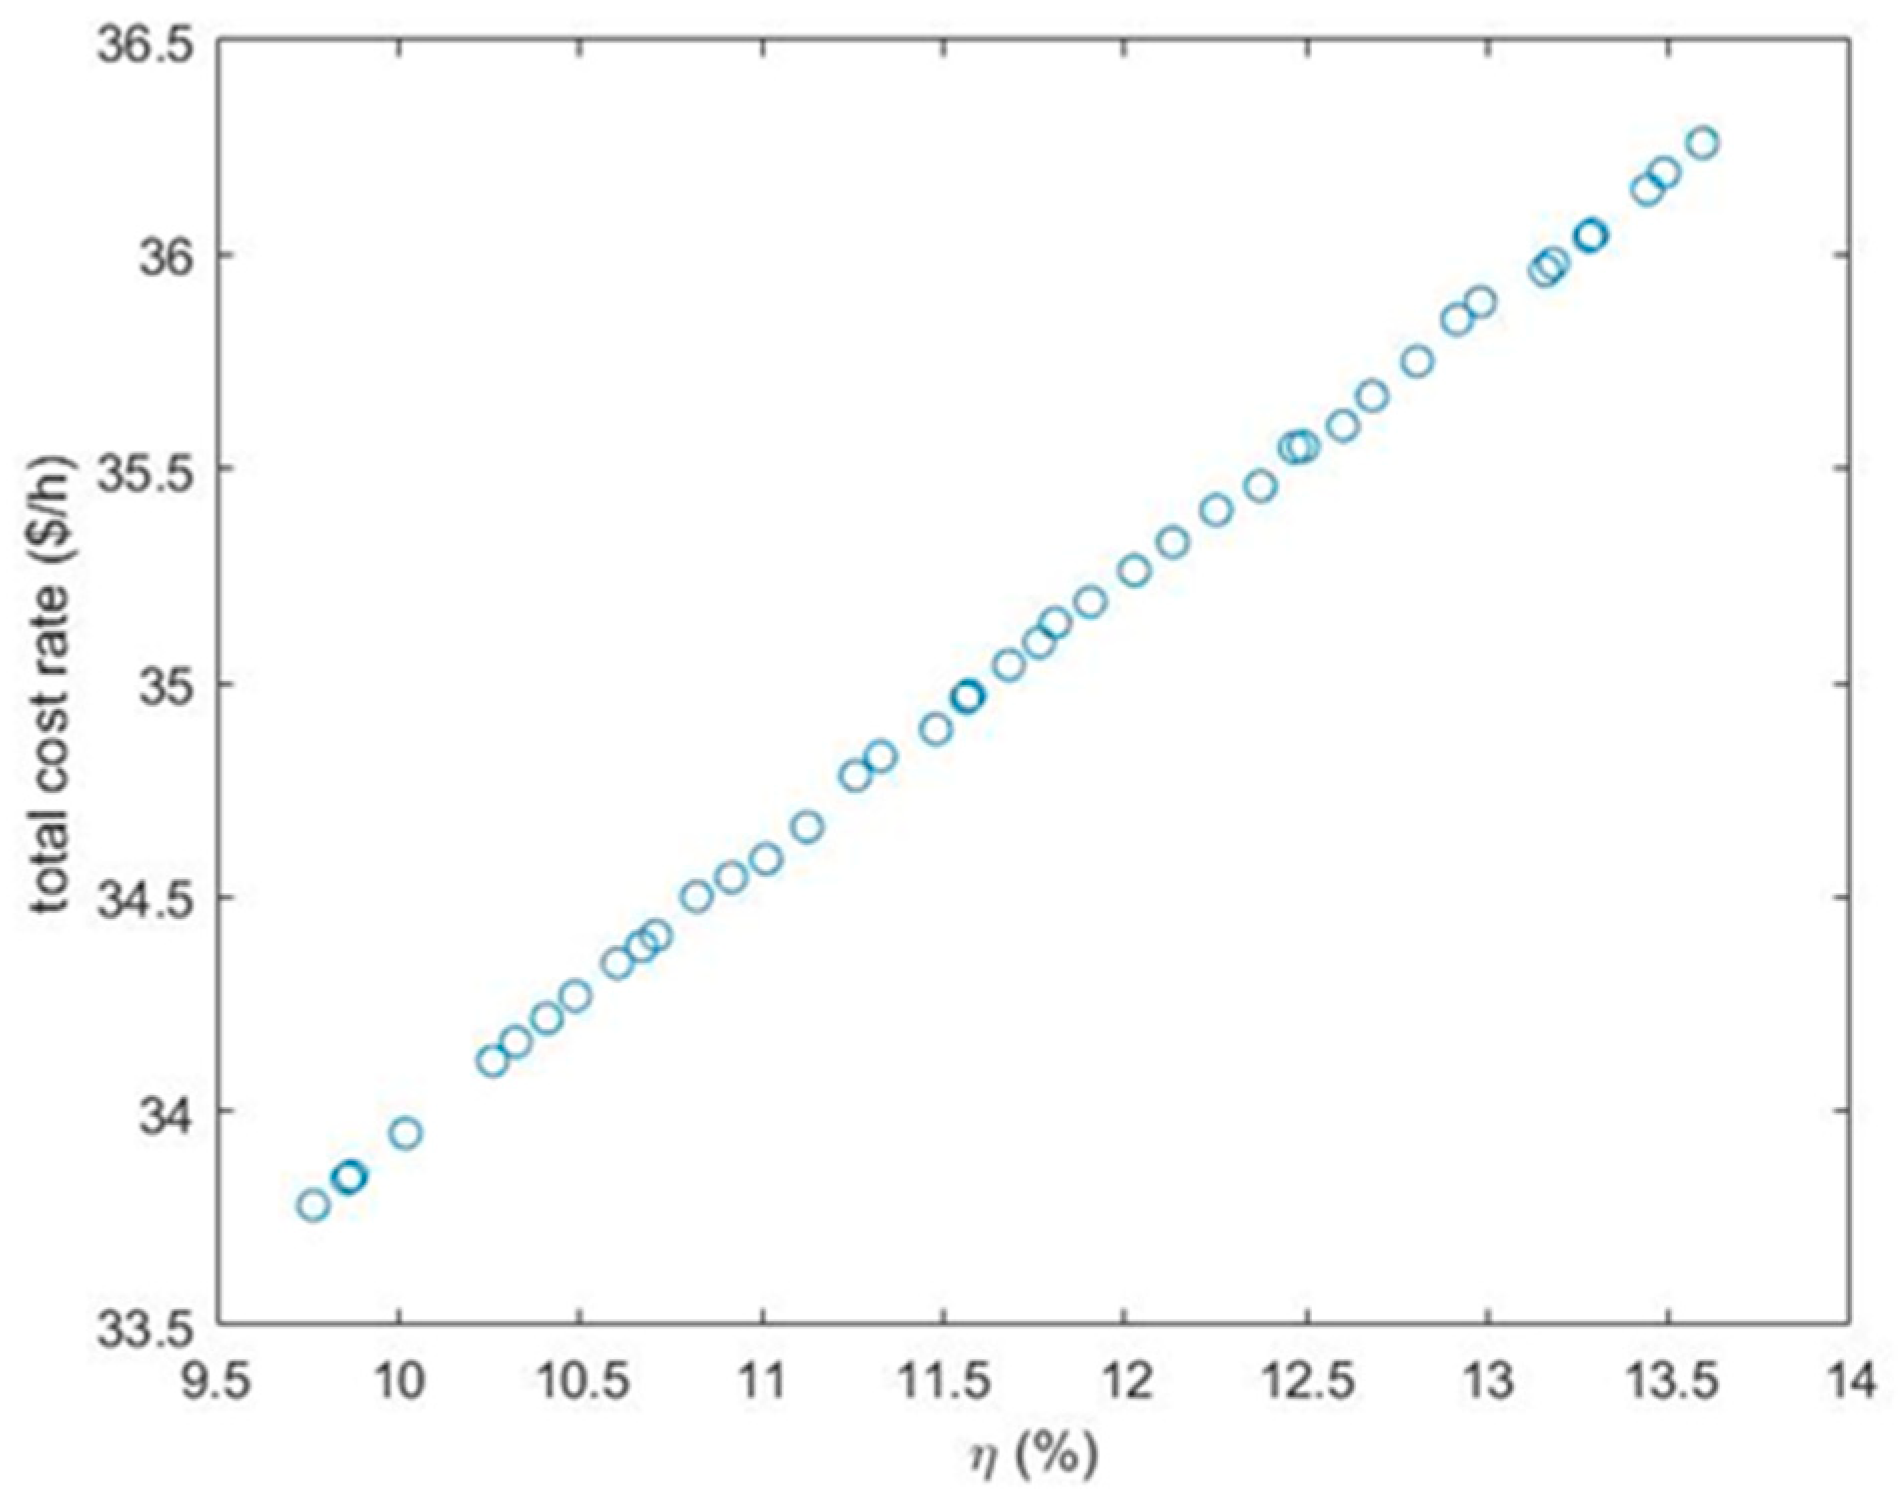
5. Optimization Study
5.1. NSGA-II Algorithm
5.2. Optimization Results
6. Conclusions
Author Contributions
Funding
Data Availability Statement
Conflicts of Interest
Nomenclature
| Aperture area, m2 | |
| Receiver area, m2 | |
| T | Temperature, °C |
| p | Pressure, kPa |
| Heat transfer rate, kW | |
| A | Area, m2 |
| Exergy, kW | |
| Feed water mass flow rate, kg/s | |
| CP | Specific heat of air and water at constant pressure, kJ/kg.K |
| Specific heat of working fluid, kJ/kg.K | |
| Receiver’s outside diameter, m | |
| Receiver’s inside diameter, m | |
| Solar radiation intensity, W/m2 | |
| Mass flow rate in the collector, kg/s | |
| Collector heat gained, kW | |
| Mass flow rate, kg/s | |
| S | Absorbed solar radiation, Wm−2 |
| Number of collectors | |
| s | Specific entropy, kJ/kg.K |
| U | Overall heat transfer coefficient, kW/m2.K |
| Heat loss coefficient | |
| Specific enthalpy, kJ/kg | |
| Heat transfer coefficient | |
| x | Salinity, ppm |
| Z | Investment cost, $ |
| Cost rate, $/h | |
| FR | Heat removal factor |
| F1 | Collector efficiency factor |
| K | The ratio of specific heat |
| Power, kW | |
| Subscripts | |
| PTC | Parabolic trough collector |
| Organic Rankine Cycle | |
| RO | Reverse Osmosis |
| Abbreviations | |
| pp | Pinch point |
| tur | Turbine |
| Evaporator | |
| 0 | Dead state |
| I | In |
| e | Out |
| ph | Physical |
| ch | Chemical |
| cv | Control volume |
| cond | Condenser |
| sc | Solar collector |
| Greek symbols | |
| η | Efficiency |
| Correction factor for diffuse radiation | |
| Transmissivity of the cover glazing, cm2/s | |
| Effective transmissivity of the parabolic trough collector, cm2/s | |
| Absorptivity of receiver | |
References
- Lopez, J.C.; Escobar, A.; Cárdenas, D.A. Parabolic trough or linear fresnel solar collectors An exergy comparison of a solar-assisted sugarcane cogeneration power plant. Renew. Energy 2021, 165, 139–150. [Google Scholar] [CrossRef]
- Gupta, D.K.; Kumar, R.; Kumar, N. Performance analysis of PTC field based ejector organic Rankine cycle integrated with a triple pressure level vapor absorption system (EORTPAS). Eng. Sci. Technol. Int. J. 2020, 23, 82–91. [Google Scholar] [CrossRef]
- Alirahmi, S.M.; Rahmani, S.; PouriaAhmadi, D.; Wongwises, S. Multi-objective design optimization of a multi-generation energy system based on geothermal and solar energy. Energy Convers. Manag. 2020, 205, 112426. [Google Scholar] [CrossRef]
- Keshavarzzadeh, A.H.; Ahmadi, P.; Safaei, M.R. Assessment and optimization of an integrated energy system with electrolysis and fuel cells for electricity, cooling and hydrogen production using various optimization techniques. Int. J. Hydrogen Energy 2019, 44, 21379–21396. [Google Scholar] [CrossRef]
- Qureshy, A.M.M.I.; Dincer, I. Energy and exergy analyses of an integrated renewable energy system for hydrogen production. Energy 2020, 204, 117945. [Google Scholar] [CrossRef]
- Behzadi, A.; Habibollahzade, A.; Ahmadi, P.; Gholamian, E.; Houshfar, E. Multi-objective design optimization of a solar based system for electricity, cooling, and hydrogen production. Energy 2019, 169, 696–709. [Google Scholar] [CrossRef]
- Yüksel, Y.E. Thermodynamic assessment of modified Organic Rankine Cycle integrated with parabolic trough collector for hydrogen production. Int. J. Hydrogen Energy 2018, 43, 5832–5841. [Google Scholar] [CrossRef]
- Gholamian, E.; Habibollahzade, A.; Zare, V. Development and multi-objective optimization of geothermal-based organic Rankine cycle integrated with thermoelectric generator and proton exchange membrane electrolyzer for power and hydrogen production. Energy Convers. Manag. 2018, 174, 112–125. [Google Scholar] [CrossRef]
- Heidarnejad, P.; Genceli, H.; Asker, M.; Khanmohammadi, S. A comprehensive approach for optimizing a biomass assisted geothermal power plant with freshwater production: Techno-economic and environmental evaluation. Energy Convers. Manag. 2020, 226, 113514. [Google Scholar] [CrossRef]
- Ghorbani, B.; BorzooMahyari, K.; Mehrpooya, M.; Hamedi, M.H. Introducing a hybrid renewable energy system for production of power and freshwater using parabolic trough solar collectors and LNG cold energy recovery. Renew. Energy 2020, 148, 1227–1243. [Google Scholar] [CrossRef]
- Kianfard, H.; KhalilaryaM, S.; Jafarmadar, S. Exergy and exergoeconomic evaluation of hydrogen and distilled water production via combination of PEM electrolyzer, RO desalination unit and geothermal driven dual fluid ORC. Energy Convers. Manag. 2018, 177, 339–349. [Google Scholar] [CrossRef]
- Alirahmi, S.M.; Assareh, E. Energy, exergy, and exergoeconomics (3E) analysis and multi-objective optimization of a multi-generation energy system for day and night time power generation—Case study: Dezful city. Int. J. Hydrogen Energy 2020, 45, 31555–31573. [Google Scholar] [CrossRef]
- Assareh, E.; Alirahmi, S.M.; Ahmadi, P. A Sustainable model for the integration of solar and geothermal energy boosted with thermoelectric generators (TEGs) for electricity, cooling and desalination purpose. Geothermics 2021, 92, 102042. [Google Scholar] [CrossRef]
- Razmi, A.R.; Janbaz, M. Exergoeconomic assessment with reliability consideration of a green cogeneration system based on compressed air energy storage (CAES). Energy Convers. Manag. 2020, 204, 112320. [Google Scholar] [CrossRef]
- Mehrpooya, M.; Raeesi, M.; Pourfayaz, F.; Delpisheh, M. Investigation of a hybrid solar thermochemical water-splitting hydrogen production cycle and coal-fueled molten carbonate fuel cell power plant. Sustain. Energy Technol. Assess. 2021, 47, 101458. [Google Scholar] [CrossRef]
- Delpisheh, M.; Haghghi, M.A.; Athari, H.; Mehrpooya, M. Desalinated water and hydrogen generation from seawater via a desalination unit and a low temperature electrolysis using a novel solar-based setup. Int. J. Hydrogen Energy 2021, 46, 7211–7229. [Google Scholar] [CrossRef]
- Kalogirou, S.A. Solar Energy Engineering: Processes and Systems, 2nd ed.; Elsevier: Amsterdam, The Netherlands, 2014. [Google Scholar]
- Al-Sulaiman, F.A. Exergy analysis of parabolic trough solar collectors integrated with combined steam and organic Rankine cycles. Energy Convers. Manag. 2014, 77, 441–449. [Google Scholar] [CrossRef]
- Rashidi, H.; Khorshidi, J. Exergoeconomic analysis and optimization of a solar based multigeneration system using multiobjective differential evolution algorithm. J. Clean. Prod. 2018, 170, 978–990. [Google Scholar] [CrossRef]
- Nemati, A.; Sadeghi, M.; Yari, M. Exergoeconomic analysis and multi-objective optimization of a marine engine waste heat driven RO desalination system integrated with an organic Rankine cycle using zeotropic working fluid. Desalination 2017, 422, 113–123. [Google Scholar] [CrossRef]
- Naseri, A.; Bidi, M.; Ahmadi, M.H.; Saidur, R. Exergy analysis of a hydrogen and water production process by a solar-driven transcritical CO2 power cycle with Stirling engine. J. Clean. Prod. 2017, 158, 165–181. [Google Scholar] [CrossRef] [Green Version]
- Dincer, I.; Rosen, M.A.; Ahmadi, P. Optimization of Energy Systems; John Wiley & Sons, Ltd.: Chichester, UK, 2017. [Google Scholar]
- Nafey, A.S.; Sharaf, M.A. Combined solar organic Rankine cycle with reverse osmosis desalination process: Energy, exergy, and cost evaluations. Renew. Energy 2010, 35, 2571–2580. [Google Scholar] [CrossRef]


| No. | Parameter | Symbol | Value |
|---|---|---|---|
| 1 | Ambient temperature | 25 [°C] | |
| 2 | Pressure | 101.3 [kPa] | |
| 3 | Sun temperature | 5800 [°C] | |
| 4 | Input temperature to evaporator | 300 [°C] | |
| 5 | Inlet flow rate to evaporator | 10 [kg/h] | |
| 6 | Solar radiation intensity | Gb | 850 [W/] |
| 7 | Transmissivity of collector cover | 0.96 [-] | |
| 8 | Turbine efficiency | 0.85 [-] | |
| 9 | Pump efficiency | 0.9 [-] | |
| 10 | Evaporator pinch point | 5 [°C] | |
| 11 | Condenser pinch point | 5 [°C] | |
| 12 | Input pressure to turbine | 1500 [Kpa] | |
| 13 | Input pressure to pump | 100 [Kpa] | |
| 14 | Input pressure to evaporator | 250 [Kpa] | |
| 15 | Heat loss collector coefficient | 3.82 [W/m2.°C] |
| System Components | Energy Balance |
|---|---|
| Turbine | |
| Condenser | |
| Evaporator | |
| Pump No. 1 | |
| Pump No. 2 | |
| Solar collector |
| Coefficients | Value |
|---|---|
| p1 | 0.06739 (-) |
| p2 | 183.2 (-) |
| p3 | 130.2 (-) |
| q1 | 867.3 (-) |
| Equation No. | Component | Equation |
|---|---|---|
| 17 | Turbine | |
| 18 | Condenser | |
| 19 | Evaporator | |
| 20 | Pump No. 1 | |
| 21 | Pump No. 2 | |
| 22 | Solar collector | |
| 23 | Reverse osmosis |
| Parameter | Unit | Current Research | Nafey and Sharaf [23] | Difference (%) |
|---|---|---|---|---|
| Wpump, RO | kW | 1122 | 1131 | 0.796 |
| Mf | m3/h | 485.9 | 485.9 | 0 |
| SR | - | 0.9944 | 0.9944 | 0 |
| Xb | ppm | 64,180 | 64,180 | 0 |
| Xd | ppm | 252 | 250 | 0.8 |
| ΔP | kPa | 6856 | 6850 | 0.088 |
| Design Parameters | Upper Limit | Lower Limit |
|---|---|---|
| Efficiency of pump (%) | 0.95 | 0.75 |
| Efficiency of turbine (%) | 0.95 | 0.75 |
| Turbine inlet pressure (kPa) | 1600 | 1400 |
| Pump inlet pressure (kPa) | 110 | 90 |
| Evaporator pinch point (°C) | 5 | 15 |
| Solar radiation (W/m2) | 400 | 900 |
| Evaporator inlet temperature (°C) | 400 | 300 |
| No. | Parameter | Toral Work (kW) | Rate of Fresh Water (m3/h) | Exergy Eficency (%) | Cost Rate ($/h) |
|---|---|---|---|---|---|
| 1 | Efficiency of pump | Max: 606.9 Min: 606.3 Difference = 0.09% | Max: 34.04 Min: 34.01 Difference = 0.08% | Max: 12.31 Min: 12.3 Difference = 0.08% | Max: 35.44 Min: 35.43 Difference = 0.02% |
| 2 | Efficiency of turbine | Max: 678.5 Min: 535.1 Difference = 26.72% | Max: 37.55 Min: 30.43 Difference = 23.39% | Max: 13.76 Min: 10.85 Difference = 26.82% | Max: 36.33 Min: 34.51 Difference = 5.27% |
| 3 | Turbine inlet pressure | Max: 620.1 Min: 592.5 Difference = 4.65% | Max: 34.69 Min: 33.32 Difference = 4.11% | Max: 12.58 Min: 12.02 Difference = 4.65% | Max: 35.6 Min: 35.24 Difference = 1.02% |
| 4 | Pump inlet pressure | Max: 623.2 Min: 591.6 Difference = 5.41% | Max: 34.85 Min: 33.28 Difference = 4.71% | Max: 12.64 Min: 12 Difference = 5.33% | Max: 35.64 Min: 35.24 Difference = 1.13% |
| 5 | Evaporator pinch point | Max: 608.3 Min: 606.8 Difference = 0.24% | Max: 34.11 Min: 34.03 Difference = 0.23% | Max: 12.34 Min: 12.31 Difference = 0.25% | Max: 35.45 Min: 35.43 Difference = 0.05% |
| 6 | Solar radiation | Max: 643.1 Min: 497.8 Difference = 29.37% | Max: 35.83 Min: 28.52 Difference = 25.63% | Max: 12.32 Min: 12.26 Difference = 0.48% | Max: 35.9 Min: 33.98 Difference = 5.65% |
| 7 | Evaporator inlet temperature | Max: 360 Min: 340 Difference = 5.88% | Max: 34.26 Min: 34.03 Difference = 0.67% | Max: 12.4 Min: 12.31 Difference = 0.73% | Max: 35.5 Min: 35.43 Difference = 0.19% |
| Parameter | Total Power (kW) | Freshwater Water (m3) |
|---|---|---|
| Value | 260,847,658.6 | 73,821.34 |
| Optimization Variable | Upper Limit | Lower Limit |
|---|---|---|
| T1 (°C) | 400 | 300 |
| P4 (kPa) | 1700 | 1300 |
| Pinch point evaporator (°C) | 6 | 4 |
| Turbine efficiency (%) | 0.9 | 0.7 |
| Target Function | Value |
|---|---|
| Exergy efficiency (%) | 12.02 |
| Cost ($/h) | 35.26 |
| Optimization Parameter | Value |
|---|---|
| T1 (°C) | 345.05 |
| P4 (kPa) | 1505.22 |
| Evaporator pinch point (°C) | 5.62 |
| Turbine efficiency (%) | 0.82 |
Disclaimer/Publisher’s Note: The statements, opinions and data contained in all publications are solely those of the individual author(s) and contributor(s) and not of MDPI and/or the editor(s). MDPI and/or the editor(s) disclaim responsibility for any injury to people or property resulting from any ideas, methods, instructions or products referred to in the content. |
© 2023 by the authors. Licensee MDPI, Basel, Switzerland. This article is an open access article distributed under the terms and conditions of the Creative Commons Attribution (CC BY) license (https://creativecommons.org/licenses/by/4.0/).
Share and Cite
Assari, M.R.; Assareh, E.; Agarwal, N.; Setareh, M.; Alaei, N.; Moradian, A.; Lee, M. Energy-Exergy–Economic (3E) -Optimization Analysis of a Solar System for Cooling, Heating, Power, and Freshwater Generation System for a Case Study Using Artificial Intelligence (AI). Energies 2023, 16, 4873. https://doi.org/10.3390/en16134873
Assari MR, Assareh E, Agarwal N, Setareh M, Alaei N, Moradian A, Lee M. Energy-Exergy–Economic (3E) -Optimization Analysis of a Solar System for Cooling, Heating, Power, and Freshwater Generation System for a Case Study Using Artificial Intelligence (AI). Energies. 2023; 16(13):4873. https://doi.org/10.3390/en16134873
Chicago/Turabian StyleAssari, Mohammad Reza, Ehsanolah Assareh, Neha Agarwal, Milad Setareh, Nazanin Alaei, Ali Moradian, and Moonyong Lee. 2023. "Energy-Exergy–Economic (3E) -Optimization Analysis of a Solar System for Cooling, Heating, Power, and Freshwater Generation System for a Case Study Using Artificial Intelligence (AI)" Energies 16, no. 13: 4873. https://doi.org/10.3390/en16134873