
Selection of Photovoltaic Panels Based on Ranges of Criteria Weights and Balanced Assessment Criteria

Institute of Management, University of Szczecin, Aleja Papieża Jana Pawła II 22A, 70-453 Szczecin, Poland
Energies 2023, 16(17), 6382; https://doi.org/10.3390/en16176382
Submission received: 25 July 2023
/
Revised: 21 August 2023
/
Accepted: 30 August 2023
/
Published: 3 September 2023
(This article belongs to the Collection Renewable and Sustainable Energy)
Abstract
:In recent years, the share of PV (photovoltaic) panels in the generation of renewable energy has been dynamically growing. During this time, the Polish government introduced numerous programs to assist households in switching to PV panels as the primary source of energy. Therefore, the aim of the article is to indicate the PV panels that are best suited to work for individual users in households in Poland. PV panels were assessed using the PROSA multi-criteria decision analysis method, supported by a stochastic approach, based on the Monte Carlo method. This approach made it possible to choose the most balanced solutions, in terms of individual criteria, and to take into account the uncertainty and imprecision of the weights of the assessment criteria. In particular, the use of reliable weight ranges in the Monte Carlo simulations allowed the construction of a whole spectrum of evaluation and ranking models. These models indicate the PV panels that best meet the requirements and have the best balance between the individual assessment criteria. As a result of the research, it was found that the requirements of PV installations in households in Poland are best met by panels produced in China and in the Chinese–Polish cooperation. Panels of Polish production ranked further down, which means that Polish producers do not offer products that are tailored to the needs of PV installations for households in Poland.
1. Introduction
Although fossil fuels (coal, natural gas, petroleum, etc.) remain the dominant energy sources in the world, maintaining the current level of energy consumption threatens to quickly exhaust these sources [1]. In addition, the use of fossil fuels causes negative effects on the environment, and they are related to the emission of greenhouse gases and other pollutants [2]. These effects may be limited thanks to the diversification of energy sources and the partial use of renewable energy sources. In this context, the European Green Deal was introduced in the EU (European Union) to lead Europe to climate neutrality in 2050 and create sustainable industry and transport, the main goal of which is to reduce pollution [3]. Renewable energy is becoming a major area of interest, as it is the most promising source of clean, renewable energy in the world [4]. On the other hand, solar energy is widely recognized as one of the most important sources of renewable energy, and it has been a reliable source of electricity for a very long time [5]. The use of renewable energy, including solar energy, allows for the achievement of a sustainable energy policy and broadly understood sustainability [6,7].
The history of obtaining electricity from the sun began in 1839, when Alexandre Edmond Becquerel discovered the so-called photovoltaic effect [8]. Becquerel’s discovery spurred research and experimentation in the field of solar energy. Willoughby Smith, in 1876, observed the photoelectric properties of selenium [9]. Then, 3 years later, William Grylls Adams and Richard Evans Day discovered that exposure of selenium to sunlight generates an electric current [10]. The development of modern solar cells began in 1941 when Russell Ohl invented the semi-conductor-based solar cell [11]. In 1954, the first PV (photovoltaic) panel, built by Gerald Pearson, Daryl Chapin, and Calvin Fuller in Bell Labs, was seen. The first panel had an efficiency of around 6%, and it was designed for space applications. Already 4 years after this achievement, the Vanguard 1 satellite [12] was equipped with solar panels. By 1960, solar cells with an efficiency of 14% were produced, but they were too expensive and commercially unviable [13]. During the further development of PV panels, cell efficiency has improved, and costs have been significantly reduced [12]. Currently, PV cells achieve an efficiency of up to 25% [13].
PV panels have certain advantages and disadvantages over other energy sources, including renewable ones. PV systems are easy to install and operate, and they can be integrated with other energy systems. Another advantage is decentralization, i.e., the immediate vicinity of energy-generating panels and electrical devices powered by the panels. Universality is another advantage because these systems can be installed in many sunny places, and they do not need any special conditions for operation, such as a hydro or wind power plant [14]. In addition, solar panels, unlike wind turbines, for example, do not emit noise and shadow flicker effects [15], so they can be easily used in urban areas [14]. It should also be noted that solar energy is considered “clean” and environmentally friendly because PV systems reduce CO2 and other greenhouse gas emissions [16]. However, PV systems cannot be considered fully ecological, and the development of solar energy may be associated with the risk of causing non-trivial environmental effects [17]. During the production of PV panels, dangerous pollutants are emitted (e.g., heavy metals, chemical solvents, and acids). In addition, hazardous materials used in the production of PV panels are very difficult to recycle [18]. The operation of PV panels can also be dangerous for the environment, especially in the case of large-scale PV power plants. The construction of such power plants causes changes in land-use distribution, and functioning PV power plants cause changes in soil moisture, changes in micrometeorology and the water resource utilization efficiency, cause surface disturbances of the soil, change the precipitation distribution, and form a heat island effect. These changes have a decisive influence on the factors that determine the local microclimate, such as evaporation, wind speed, temperature, soil moisture, and soil temperature [19]. PV power plants also affect biodiversity, leading to habitat loss [20]. Although the development of PV panels has had a positive impact on the decarbonization of the energy system, used panels can become toxic waste if they are not properly disposed of [21]. This is a serious problem, taking into account the predictions that, by 2050, there will be approx. 70 million tons of waste from PV panels of which will have to be disposed [22]. Despite the indicated disadvantages of PV panels, their market is dynamically developing, and solar energy has become the preferred technology driving the transition to renewable energy [23].
In recent years, the consumption of energy from renewable sources has been increasing all over the world. Only in the years 2020–2021, this consumption increased by over 5 EJ (exajoules) from 34.8 EJ in 2020 to 39.91 EJ in 2021 [24]. In turn, solar energy in 2021 had a 13% share in the renewable energy mix, and solar PV installations reached a total capacity of 940 GW (gigawatt). In 2021 alone, out of 302 GW of new renewable energy generation capacity, solar PV accounted for 168 GW, i.e., more than half of the newly installed capacity [25]. In Poland, the total capacity of solar PV installations is also growing dynamically. While, in 2014, it was only 27 MW (megawatt), the total capacity reached 1539 MW in 2019, 3955 MW in 2020, and 7665 MW in 2021 [26]. It is estimated that, by 2026, the capacity of PV installations in Poland will reach a total of over 29,000 MW [25].
Households, which have the largest share in investments in PV panels, are responsible for the dynamic increase in the capacity of PV installations in Poland. According to data from 2020, households invested over PLN 6.5 billion in PV panels, while the total value of investments was PLN 10 billion [27]. The main reason for these investments can be attributed to the fact that households are struggling with ever higher energy prices resulting from EU policy—mainly from fees for CO2 emissions [28]. Meanwhile, PV installations make it possible to significantly reduce building operating costs by providing electricity [14] and the electrification of the heating sector by powering heat pumps with energy from PV panels [27]. In recent years, government programs have been introduced in Poland to increase interest in the use of solar PV panels in households, primarily in the on-grid configuration, i.e., being connected to the public power grid. The main elements of such incentives are included in the “My electricity” program, which allows for partial co-financing of investments in PV installations, as well as energy and heat storage facilities [29]. The main objective of the “My electricity” program is to increase the number of prosumers of PV micro-installations with a capacity of 2–10 kW among households in Poland, and the program itself is relatively popular [28]. Similarly, within the “Clean air” program, you can obtain co-financing for PV installations in combination with the replacement of a non-ecological heat source [30]. Another incentive is the possibility of taking advantage of the thermos-modernization relief when settling income tax. This relief may be applied, among others, in the case of the PV system installation [31].
Taking into account the scale of investments in PV panels by households, the potential financial benefits of these investments, as well as the support under the Polish government programs, the right choice of PV panels for household installations is an important issue. Therefore, the purpose of this article is to compare the parameters of selected PV panels available on the Polish market and to indicate the panels that are best suited to work for individual users in households in Poland. PV panels can be characterized by many parameters, such as power, efficiency, temperature coefficient of power, guaranteed power performance, etc. Therefore, the assessment of PV panels should be multi-criteria in nature. The best tools to carry out such an assessment are MCDA (Multi-Criteria Decision Analysis) methods, which allow you to capture many parameters of the operation of PV panels and aggregate the assessment result into one numerical value, ordering the PV panels in the ranking. In this study, the MCDA method called PROSA (PROMETHEE for Sustainability Assessment), which indicates a pareto-optimal solution, was used. At the same time, in the multi-criteria assessment, it takes into account the balance between individual criteria [32]. In addition, the PROSA method was supported by a stochastic analysis based on the Monte Carlo method, thanks to which a wide space of solutions to the problem of PV panel assessment was taken into account.
The basic applications of MCDA methods in PV panel assessment problems and the decision criteria used in such assessments are presented in Section 2. Section 3 discusses the research methodology and the basics of the PROSA and Monte Carlo methods used. Section 4 presents the results of the assessment of PV panels using the PROSA method and a stochastic approach, taking into account a wide but, at the same time, expertly limited solution space. Section 5 presents the results of an additional analysis, examining the full spectrum of solutions. A summary, research limitations, and an indication of further research directions are found in Section 6.
2. Literature Review
All investments in PV panels are of great importance for maintaining energy sustainability [33]. PV panel technology is recognized as an environmentally friendly and sustainable solution to contemporary energy problems [34]. Therefore, the assessment of PV panels is, in fact, a sustainability assessment problem, and MCDA methods are widely used in such problems [35]. Sustainability assessment problems require the management of a wide spectrum of information, parameters, and uncertainties [36]. These are multidimensional problems involving the search for a compromise between indicators that are in conflict with each other [37]. Therefore, these problems often require the use of the MCDA methodology to identify the best option [38]. MCDA methods deal with finding optimal solutions in complex scenarios by taking into account various indicators, conflicting goals, and criteria [39].
In the literature, you can find numerous applications of MCDA methods in energy sustainability problems, including decision-making problems related to the choice of a PV panel and the selection of a supplier of such panels. Table 1 presents selected studies on this subject from recent years.
Balo and Şağbanşua [40] used the AHP (Analytic Hierarchy Process) method to select the best panel for a PV system. For a similar problem, El-Bayeh et al. used a combination of RWR (Rank-Weigh-Rank) and TOPSIS (Technique for Order of Preference by Similarity to Ideal Solution) methods twice [43,45]. Bączkiewicz et al. considered the problem of assessing PV panels using COMET (Characteristic Objects Method) and SPOTIS (Stable Preference Ordering Towards Ideal Solution) [42], and Kozlov and Sałabun used the COMET and TOPSIS methods [44]. Ziemba and Szaja used the NEAT F-PROMETHEE method [46] to evaluate PV panels. In turn, Rani et al. used combinations of PF (Pythagorean Fuzzy), SWARA (Stepwise Weight Assessment Ratio Analysis), VIKOR (VlseKriterijumska Optimizcija I Kaompromisno Resenje), and a set of PF and TOPSIS methods [41]. A combination of many MCDA methods was also used by Pacana and Siwiec, who developed a model for predicting the quality of PV panels using the SMARTER (Specific Measurable Achievable Relevant Time-bound Exciting Recorded), DEMATEL (Decision Making Trial and Evaluation Laboratory), AHP, and WPM (Weighted Product Model) methods [47]. Kaur et al. used the Entropy and TOPSIS methods to select a solar PV panel for rural electrification [48]. Shayani Mehr et al., using BWM (Best-Worst Method) and MULTIMOOSRAL (Multi-Multi-Objective Optimization on the basis of Simple Ratio Analysis and Logarithmic approximation), compared three generations of PV panels [47]. Wang and Tsai [50], similarly to Cao et al. [51], considered the problem of choosing a supplier of PV panels. Wang and Tsai used Fuzzy AHP and DEA (Data Envelopment Analysis) methods for this purpose, while Cao et al. used SWARA, EDAS (Evaluation based on Distance from Average Solution), and a combination of FUCOM (Full Consistent Method) and GRA (Grey Relational Analysis) methods. In turn, Liaqait et al. considered the broader problem of choosing a supplier of PV panels and allocating orders using the TOPSIS, Fuzzy AHP, Fuzzy TOPSIS, and Fuzzy MINLP (Mixed-Integer Non-Linear Programming) methods. All the cited studies confirm the wide applicability of MCDA methods in decision-making problems regarding PV panels, particularly in the problem of selecting and assessing PV panels.
In the assessment of PV panels, various criteria are used to describe the technical characteristics of PV panels. These criteria are presented in Table 2.
However, in the problem of choosing panels for households, some of the criteria presented in Table 2 are not relevant. The following criteria should be considered valid.
- Power rating—determines what power in STC (standard test conditions) the PV panel can generate. STC are defined by the following parameters: irradiance = 1000 W/m2; cell temperature = 25 °C; air mass = 1.5 G. The value of this criterion should be as high as possible so that the panel is able to produce as much electricity as possible.
- Power tolerance—defines the fluctuation range of the power rating value. This parameter can only have a positive value, so the power tolerance determines how much higher the power rating in STC can be due to measurement errors and differences between the executions of individual panels. The value of this criterion should be as high as possible, as this means higher additional power of the PV panel.
- Temperature coefficient of power rating—this parameter determines the decrease in power with every 1 °C change in temperature. This is a very important parameter because the conditions in which PV panels operate usually differ significantly from STC, among others, in terms of temperature. This variable has negative values; therefore, the value of this criterion should be as high as possible (as close to 0 as possible).
- Efficiency—determines what part of the solar energy reaching the PV panel will be converted into electricity. The value of this parameter decreases over time during the operation of PV panels, but the efficiency should be as high as possible. The higher the efficiency, the more solar energy will be converted into electricity. Initial efficiency is important, but efficiency is also important in subsequent years, which is often not taken into account in research. Sometimes, instead of efficiency in subsequent years, manufacturers provide a value describing the percentage degradation of panels in subsequent years. Efficiency degradation should be as small as possible so that, in the next years of operation, the PV panel continues to convert as much solar energy into electricity as possible.
- Open circuit voltage, short circuit current—these parameters determine, respectively, the voltage at maximum panel illumination and no connection to other devices, as well as the current flowing through the panel at maximum illumination, when positive and negative leads of the panel are connected together. These parameters, together with the power rating value, allow you to determine the fill factor of the PV panel. The fill factor value determines to what extent the characteristics of the PV panel are close to the ideal characteristics. This value should be as large as possible; therefore, the open circuit voltage and short circuit current parameters should be as small as possible.
- Temperature coefficient of open circuit voltage, temperature coefficient of short circuit current—together, with the values of open circuit voltage, short circuit current, power rating, and the temperature coefficient of power rating, determine how the fill factor changes depending on the temperature. These values should also be as small as possible.
- Cost per Watt—determines the price in relation to the maximum power of the panel. This is a much better parameter than the independent ‘Cost’ criterion. The cost of lower power panels is usually lower; therefore, the cost of the PV panel should be considered in relation to its power. Of course, the cost per Watt should be minimized.
- Area—a parameter that partially determines the possibility of installing panels. Household panels are usually installed on roofs that have limited space. On the other hand, if an investor has a large area for the installation of PV panels, they can purchase panels with a larger unit area or more panels with less power, which will be compensated by a lower price. However, the aim is to keep the value of the area criterion as small as possible.
- Warranty—specifies the duration of the warranty. However, the cited studies did not take into account that there are usually two warranties for PV panels, which differ in duration. The first warranty applies to the product itself and its possible failures, and the second defines the maximum allowable decrease in efficiency over time. Of course, the period of each of these two types of warranty should be as long as possible.
The other criteria presented in Table 2, in the case of PV panels for households, are basically irrelevant.
- The max power voltage and max power current values, together, determine the power rating. Therefore, the use of these criteria and a power rating that is fully dependent on them would lead to redundancy in the rating criteria family. The combined use of these criteria is a common mistake made during the multi-criteria evaluation of PV panels.
- Number of cells—determines how many cells make up a single panel. However, this does not significantly affect the efficiency or power of the PV panels.
- Weight—as mentioned earlier, PV panels in households are most often installed on the roofs of buildings, so the lighter the weight of panels, the lower the roof load. However, assuming that the total power of PV panels in households can be up to approx. 10 kW (the average in Poland is 8.78 kW [28]), which corresponds to the number of approx. 22–25 panels, the weight differences between PV installations will be within 100 kg. The difference is basically negligible.
- Similarly, the maximum system voltage and series fuse-rating criteria will not be relevant. These characteristics determine the maximum number of panels connected in one PV installation. Typical values of these characteristics are approx. 1000–1500 V and 20–30 A. With the number of about 25 panels connected in series-parallel, there is no risk of exceeding the typical values of these characteristics.
An important criterion that has not been used in practice so far, in publications on the selection of PV panels, is the strength of the panels. Weather conditions prevailing in Poland expose PV panels to snow and wind. Therefore, the maximum static load from the front (e.g., snow load) and the rear (e.g., wind load) are important. Another important criterion, related to the durability of the entire PV installation, is the ingress protection of the junction box. Table 3 presents a full list of criteria that were used in the multi-criteria assessment of PV panels for households in Poland.
As indicated earlier, the problem of assessing PV panels is multidimensional, and its essence is finding a balance between individual dimensions that are in conflict with each other. An inherent feature of such an assessment is the uncertainty of decision-makers/consumers regarding the weights of individual dimensions or assessment criteria. The decision-maker, who is the consumer, is usually unable to precisely and unambiguously determine the importance of the individual PV panel assessment criteria. However, it is possible to estimate weights within a certain range. For example, if the decision-maker has limited financial resources to purchase PV panels, one of the most important criteria will be the cost in relation to the power of the panels. In turn, when the decision-maker has a significantly limited area on which they can install PV panels, one of the important criteria will be the area occupied by the panels. Similarly, if the consumer has a high demand for generated energy, the power rating will be an important criterion, and if they live in a region with more difficult weather conditions, the criteria related to the strength and resistance of the panels—and the entire PV installation—may be important. In addition, criteria related to efficiency, warranty, and temperature coefficients will always be important to some extent. Similarly, if the decision-making problem concerns a group of stakeholders (experts), their opinions on the criteria weights may differ even when they come from one region or country [53]. In such a situation, a reasonable solution is to aggregate the opinions of individual experts, in terms of weights, instead of seeking any consensus and precise values of the criteria weights.
The problem is finding a solution that maintains a balance between the individual criteria that are important to the decision-maker. Therefore, the PROSA method, supported by stochastic analysis, was used in this study. This approach allows for the simultaneous search for balanced solutions (models of PV panels) while taking the uncertainty and imprecision of the criteria weights into account.
3. Methodology
The adopted research methodology used the stochastic modeling of criteria weights based on the Monte Carlo method [54]. At the beginning, the decision-maker provides reliable ranges of weights for individual criteria in the form of numerical ranges. In the study, it was assumed that the weight of each criterion is given as a numerical range, the infimum of which is 0, and the supremum is 100 [0, 100]. Of course, for each criterion, the decision-maker may specify a different range, , but this must be within the original range [inf,sup]. In this way, the decision-maker defines a range of weights for each j-th criterion in the form of a discrete uniform distribution [55]. It should be noted that, instead of a single decision-maker, the opinions of a group of experts can be used at this stage, each of which provides the weights of the criteria proposed by them. In this case, on the basis of these proposals, weight ranges should be defined while covering all proposed weights. In each l-th Monte Carlo iteration, criteria weights are generated in accordance with Formula (1):
where L is the number of all iterations of the Monte Carlo algorithm, n is the number of criteria, and i.i.d. means independent and identically distributed [56].
After generating the criteria weights in the l-th iteration, these weights are normalized according to Formula (2):
Then, in the l-th iteration of Monte Carlo, the PROSA procedure is used, which determines the ranking of alternatives (PV panels) [57]. For each criterion, the preference function is used, and based on the difference between the alternatives, the preference , between the tested pair of alternatives , is determined according to Formula (3):
where is the value of the alternative on the j-th criterion.
In the next step, the single criterion net flow (4) is calculated for each alternative on each criterion:
Single criterion net flows are aggregated into overall net flows using normalized criteria weights (5) [58]:
The next step is to calculate the weighted mean absolute deviation, , for each alternative using the compensation (balance) factor (6):
In fact, describes how far all partial solutions of , together, are far from the solution of . In turn, is an additional weight that determines how important the distance between the j-th partial solution and the aggregated solution is for the final solution.
In the last step, PROSA net value is calculated, correcting the solution based on (7) [59]:
The net values allow for the ranking of alternatives in the l-th ranking. Each such ranking ranks the alternatives in descending order based on the values obtained. In fact, each l-th iteration of the Monte Carlo algorithm is a separate decision-making scenario based on the criteria weights drawn from the previously defined range of possible weights. This approach significantly reduces the influence of experts on solving the decision problem because the Monte Carlo method considers a significant part of the space of potential solutions, and indicates it the most frequently obtained solutions in various scenarios.
After performing the Monte Carlo L iteration, a set of rankings is obtained. Then, the statistic is calculated, which determines how many times the alternative is highlighted in the r-th position in the set [60]. For each alternative, the rank acceptability index, , is calculated. This determines the percentage ratio of the number of simulations in which alternative took the r-th position in the rankings from the set to the number of all performed Monte Carlo simulations (8) [61,62]:
Based on the value of rank acceptability indices, calculated for each considered alternative and for each r-th position in the set of rankings , it is possible to indicate the alternative that most often occupies leading positions in the rankings, based on the weights of the criteria defined at the beginning, in the specified ranges of values [min, max].
The use of the Monte Carlo simulation allows for the capture of the uncertainty and imprecision of criteria weights through exhaustive exploitation of the entire space of possible solutions (rankings) [63]. On the other hand, relying on the PROSA method in the study prefers alternatives (PV panels) that are the most balanced in terms of the value of the criteria.
4. Results
In the conducted study, at the beginning, the weight ranges of individual criteria and preference functions were defined by expert during the discussion. These parameters are presented in Table 4.
For the C17 criterion, the usual preference function, otherwise known as the true criterion, was used. It assumes that, with any advantage of alternative over , strict preference over is assumed. The use of this function, in the case of C17 criterion, results from the fact that ingress protection is qualitative in nature (it is divided into protection classes), and each higher standard of ingress protection is undoubtedly much better than the previous one. In the literature, it is recognized that true criterion [64] is applicable for this type of qualitative criteria. For the remaining criteria (C1–C16), a linear preference function was used, which was otherwise known as pre-criterion. The use of this function results from the fact that the C1–C16 criteria are quantitative in nature [64]. The pre-criterion linearly increases the preference value of the alternative over from 0 to the value of the preference threshold () set by the decision-maker. According to the literature, the threshold value was twice the sample standard deviation [46]. The value of the compensation (balance) coefficient for each criterion was . True criterion and pre-criterion are described by Formulas (9) and (10), respectively [65]:
Using the criteria and their weights given in Table 4, 15 PV panels were evaluated. These were largely PV panels from Chinese (5 panels) and German (4 panels) manufacturers, but panels from South Korea (1 panel) and Norwegian-Singapore (1 panel) were also included in the assessment. The study concerned the Polish market, so PV panels of Polish production (2 panels) and Polish–Chinese (2 panels) were also included. The following panels were taken into account in the study: A1—Astronergy CHSM54M-HC (China) [66], A2—Bauer BS-410-108M10HB (Germany) [67], A3—Bruk-Bet PEM.WB-405 (Poland) [68], A4—Heckert NEMO 4.2 80 M (Germany) [69], A5—Hyundai HiE-S410VG (Korea) [70], A6—Ja Solar JAM60S20 390/MR (China) [71], A7—Jinko JKM430N-54HL4 (China) [72], A8—Kensol KS395M-SH (Poland/China) [73], A9—Meyer Burger White 400 Wp (Germany) [74], A10—Phono Solar PS420M4-22/WH (China) [75], A11—REC REC380AA (Norway/Singapore) [76], A12—Risen RSM40-8-410M (Poland/China) [77], A13—Selfa SV108M.3-410 (Poland) [78], A14—Trina Solar TSM-DE09.08 405 W (China) [79], A15—Viessmann M390WG (Germany) [80]. The parameters of these panels are listed in Table 5.
After applying the calculation procedure described in Section 3, the rank acceptability indices were obtained, as shown in Table 6. These results were obtained after 10,000 simulations, which ensures an error of up to 1% at the 95% confidence level [81].
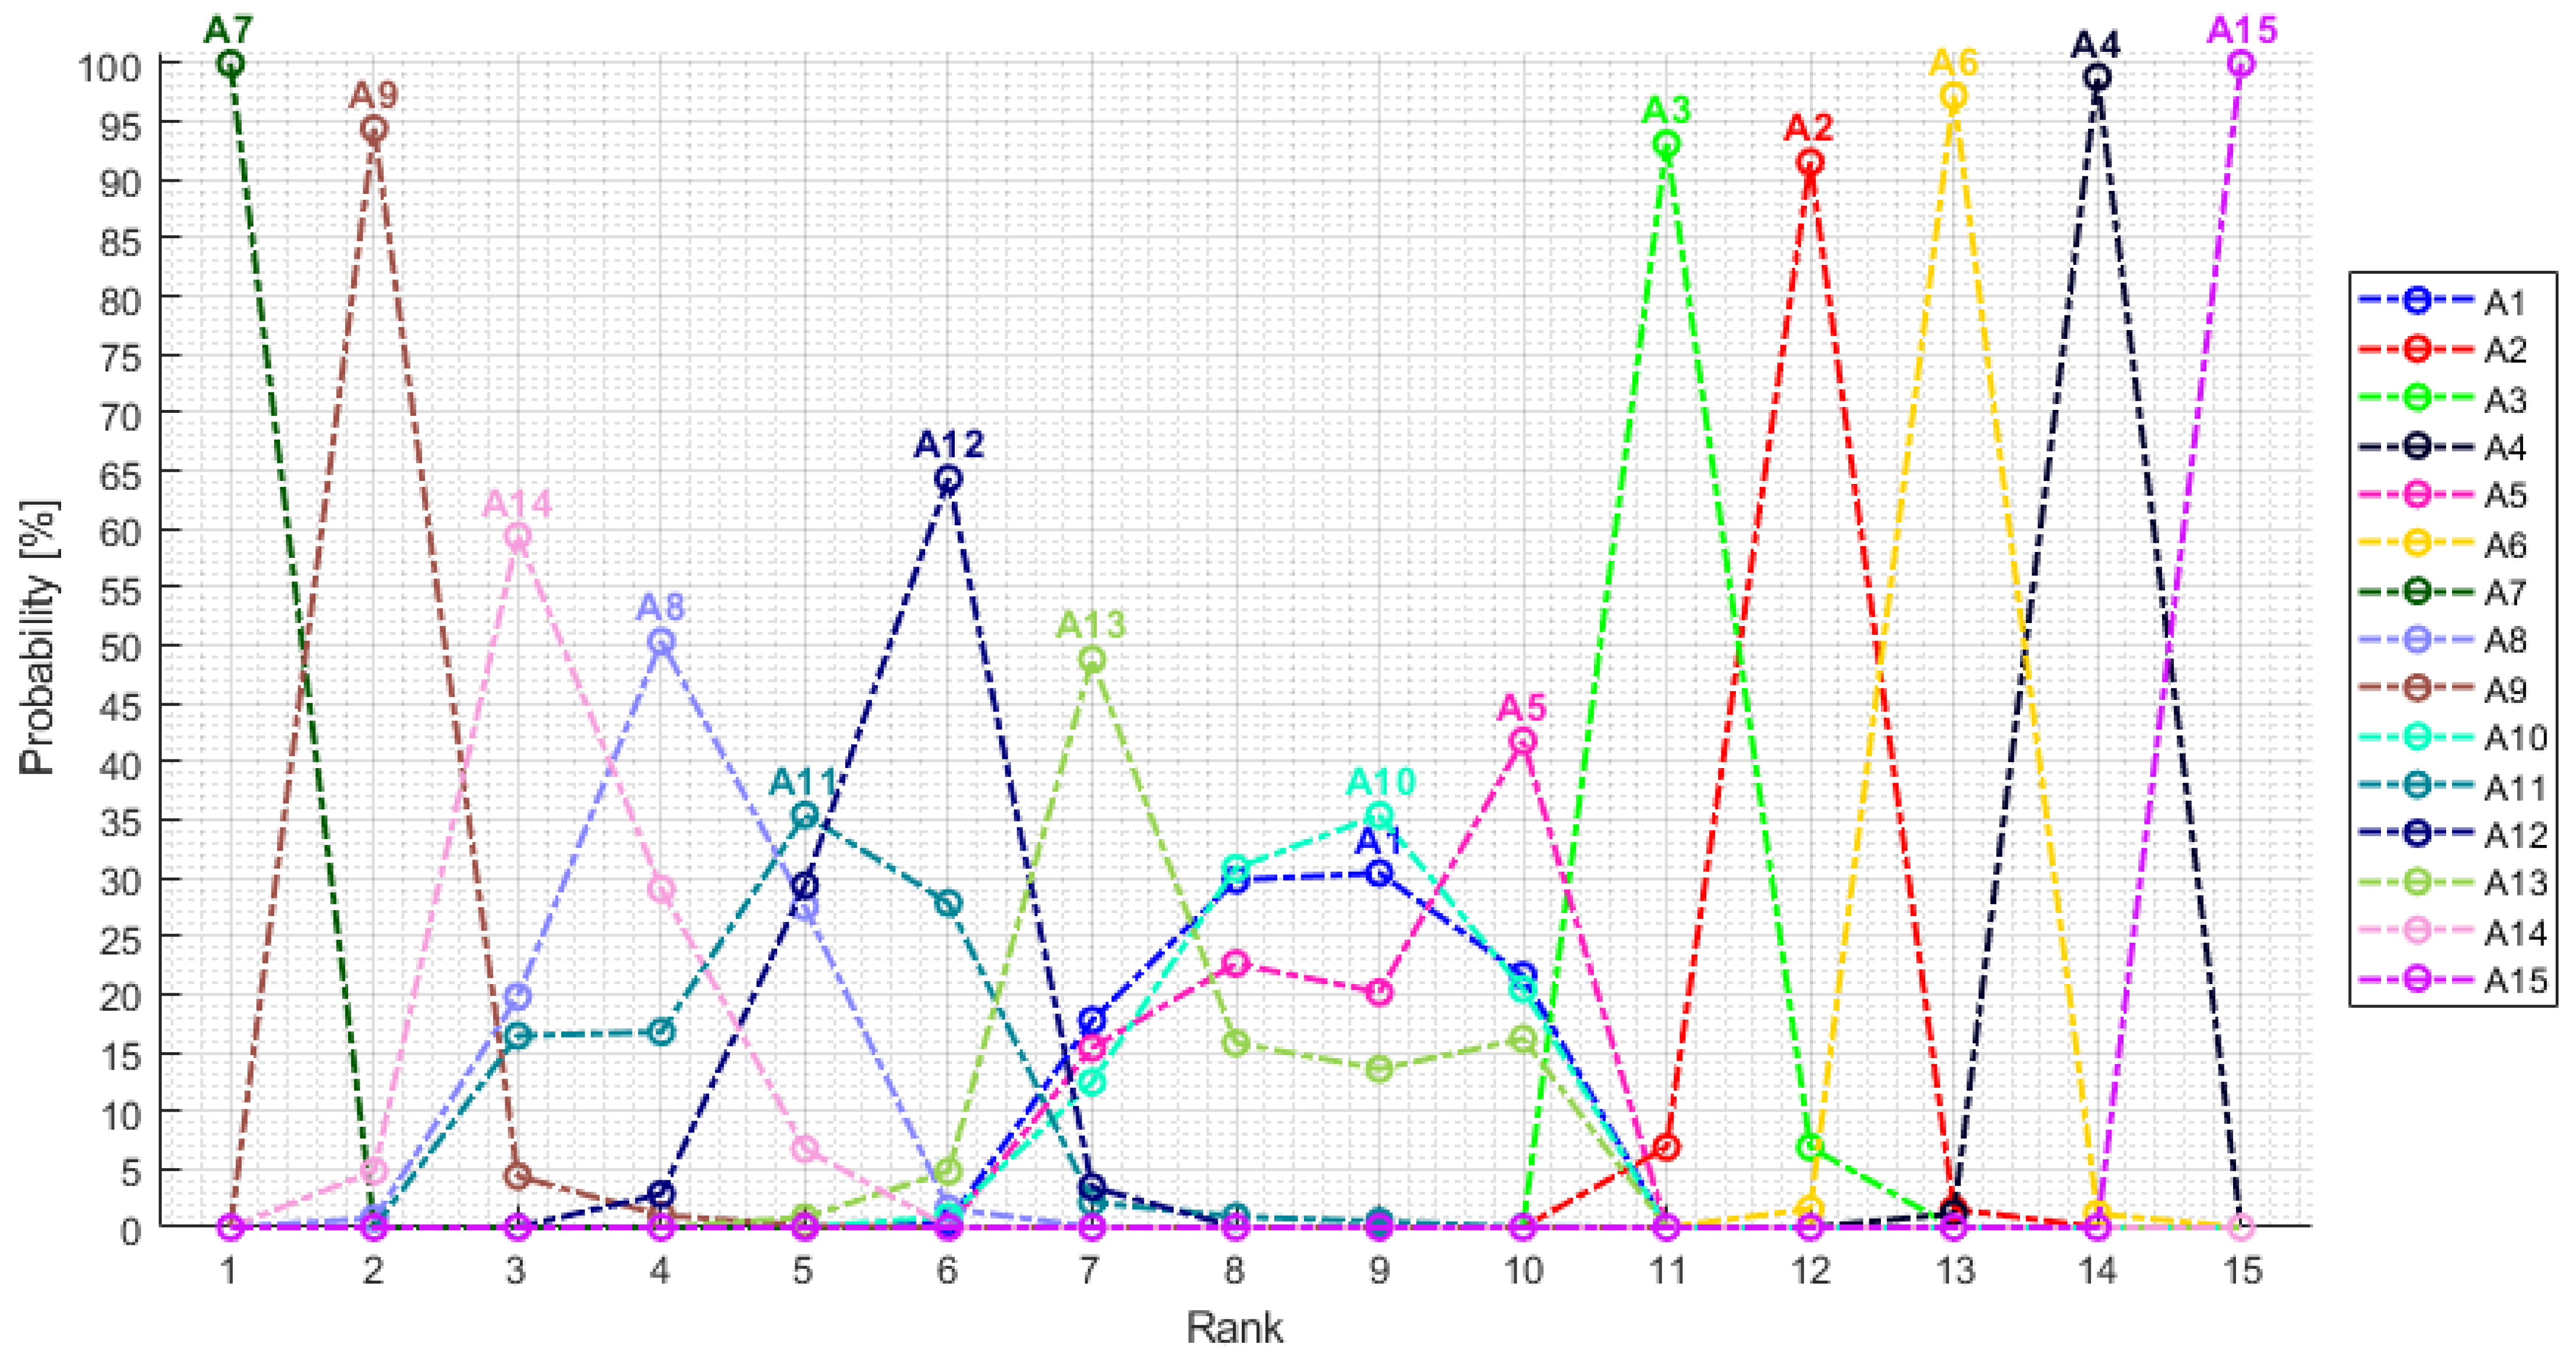
The graphical form of the obtained solution is shown in Figure 1, which uses, for this purpose, a graphical representation of the stochastic solution [82].
The conducted analysis shows that, when using the criteria weights from the ranges given in Table 4, the A7—Jinko JKM430N-54HL4 always turned out to be the best PV panel among those considered. The second place in almost 95% of the considered decision models was occupied by A9—Meyer Burger White 400 Wp. In about 5% of the models, it was A14—Trina Solar TSM-DE09.08 405 W, and in less than 1% of the models, the second place went to A8—Kensol KS395M-SH. The third position in the rankings was most often occupied by A14—Trina Solar TSM-DE09.08 405 W (59.4%), A8—Kensol KS395M-SH (19.76%), and A11—REC REC380AA (16.42%). As for the PV panel occupying the last positions in the rankings, in 100% of the decision models, it was A15—Viessmann M390WG. The 14th place, in almost 99% of the considered decision models, was occupied by A4—Heckert NEMO 4.2 80 M, and the 13th place, in over 97% of the rankings, was occupied by A6—Ja Solar JAM60S20 390/MR. The 12th place, in over 90% of the rankings, was achieved by A2—Bauer BS-410-108M10HB, and the 11th place, which was also in over 90% of the decision models, was occupied by the A3 panel—Bruk-Bet PEM.WB-405. None of these panels took a position higher than 11 in any ranking. Table 7 indicates which positions in the rankings were most often occupied by individual panels. Rank 8 is missing from Table 7 because each of the PV panels ranked differently than rank 8. In particular, both A1 and A10 were marginally more likely to appear in rank 9.
The results of the conducted study indicate that the requirements of PV installations in households in Poland are best met by panels produced in China (A7, A14) and in Chinese–Polish cooperation (A8, A12). There is also one panel of German production (A9) at the forefront. On the other hand, the other considered PV panels of German production usually occupied the last positions in the rankings (A2, A4, A15). Panels of Polish production also occupy further positions in the ranking (A13, A3). This means that Polish producers are unable to adjust their products to the needs of PV installations for households in Poland. Polish panels supported by Chinese technology (Chinese–Polish cooperation) are much better in this respect. The data contained in Table 5 show that the A3 and A13 panels differ significantly in terms of parameters. Therefore, it is not possible to identify a single reason for the lower scores of these panels. However, comparing the parameters of the A3 and A13 panels with the parameters of the best panels of Chinese and Polish–Chinese production (A7, A8, A12, and A14), it is possible to indicate several parameters that make A3 and A13 perform worse (see: Table 5). It can be seen that, compared to A7, A8, A12, and A14, the A3 and A13 panels are characterized by higher Cost per Watt, lower efficiency, and higher efficiency degradation. These are some common disadvantages of A3 and A13 panels compared to the best panels of Chinese and Chinese–Polish production. Additionally, PV panels produced in Germany, neighboring Poland, are mostly not suited to the needs of the Polish market of individual users.
5. Discussion
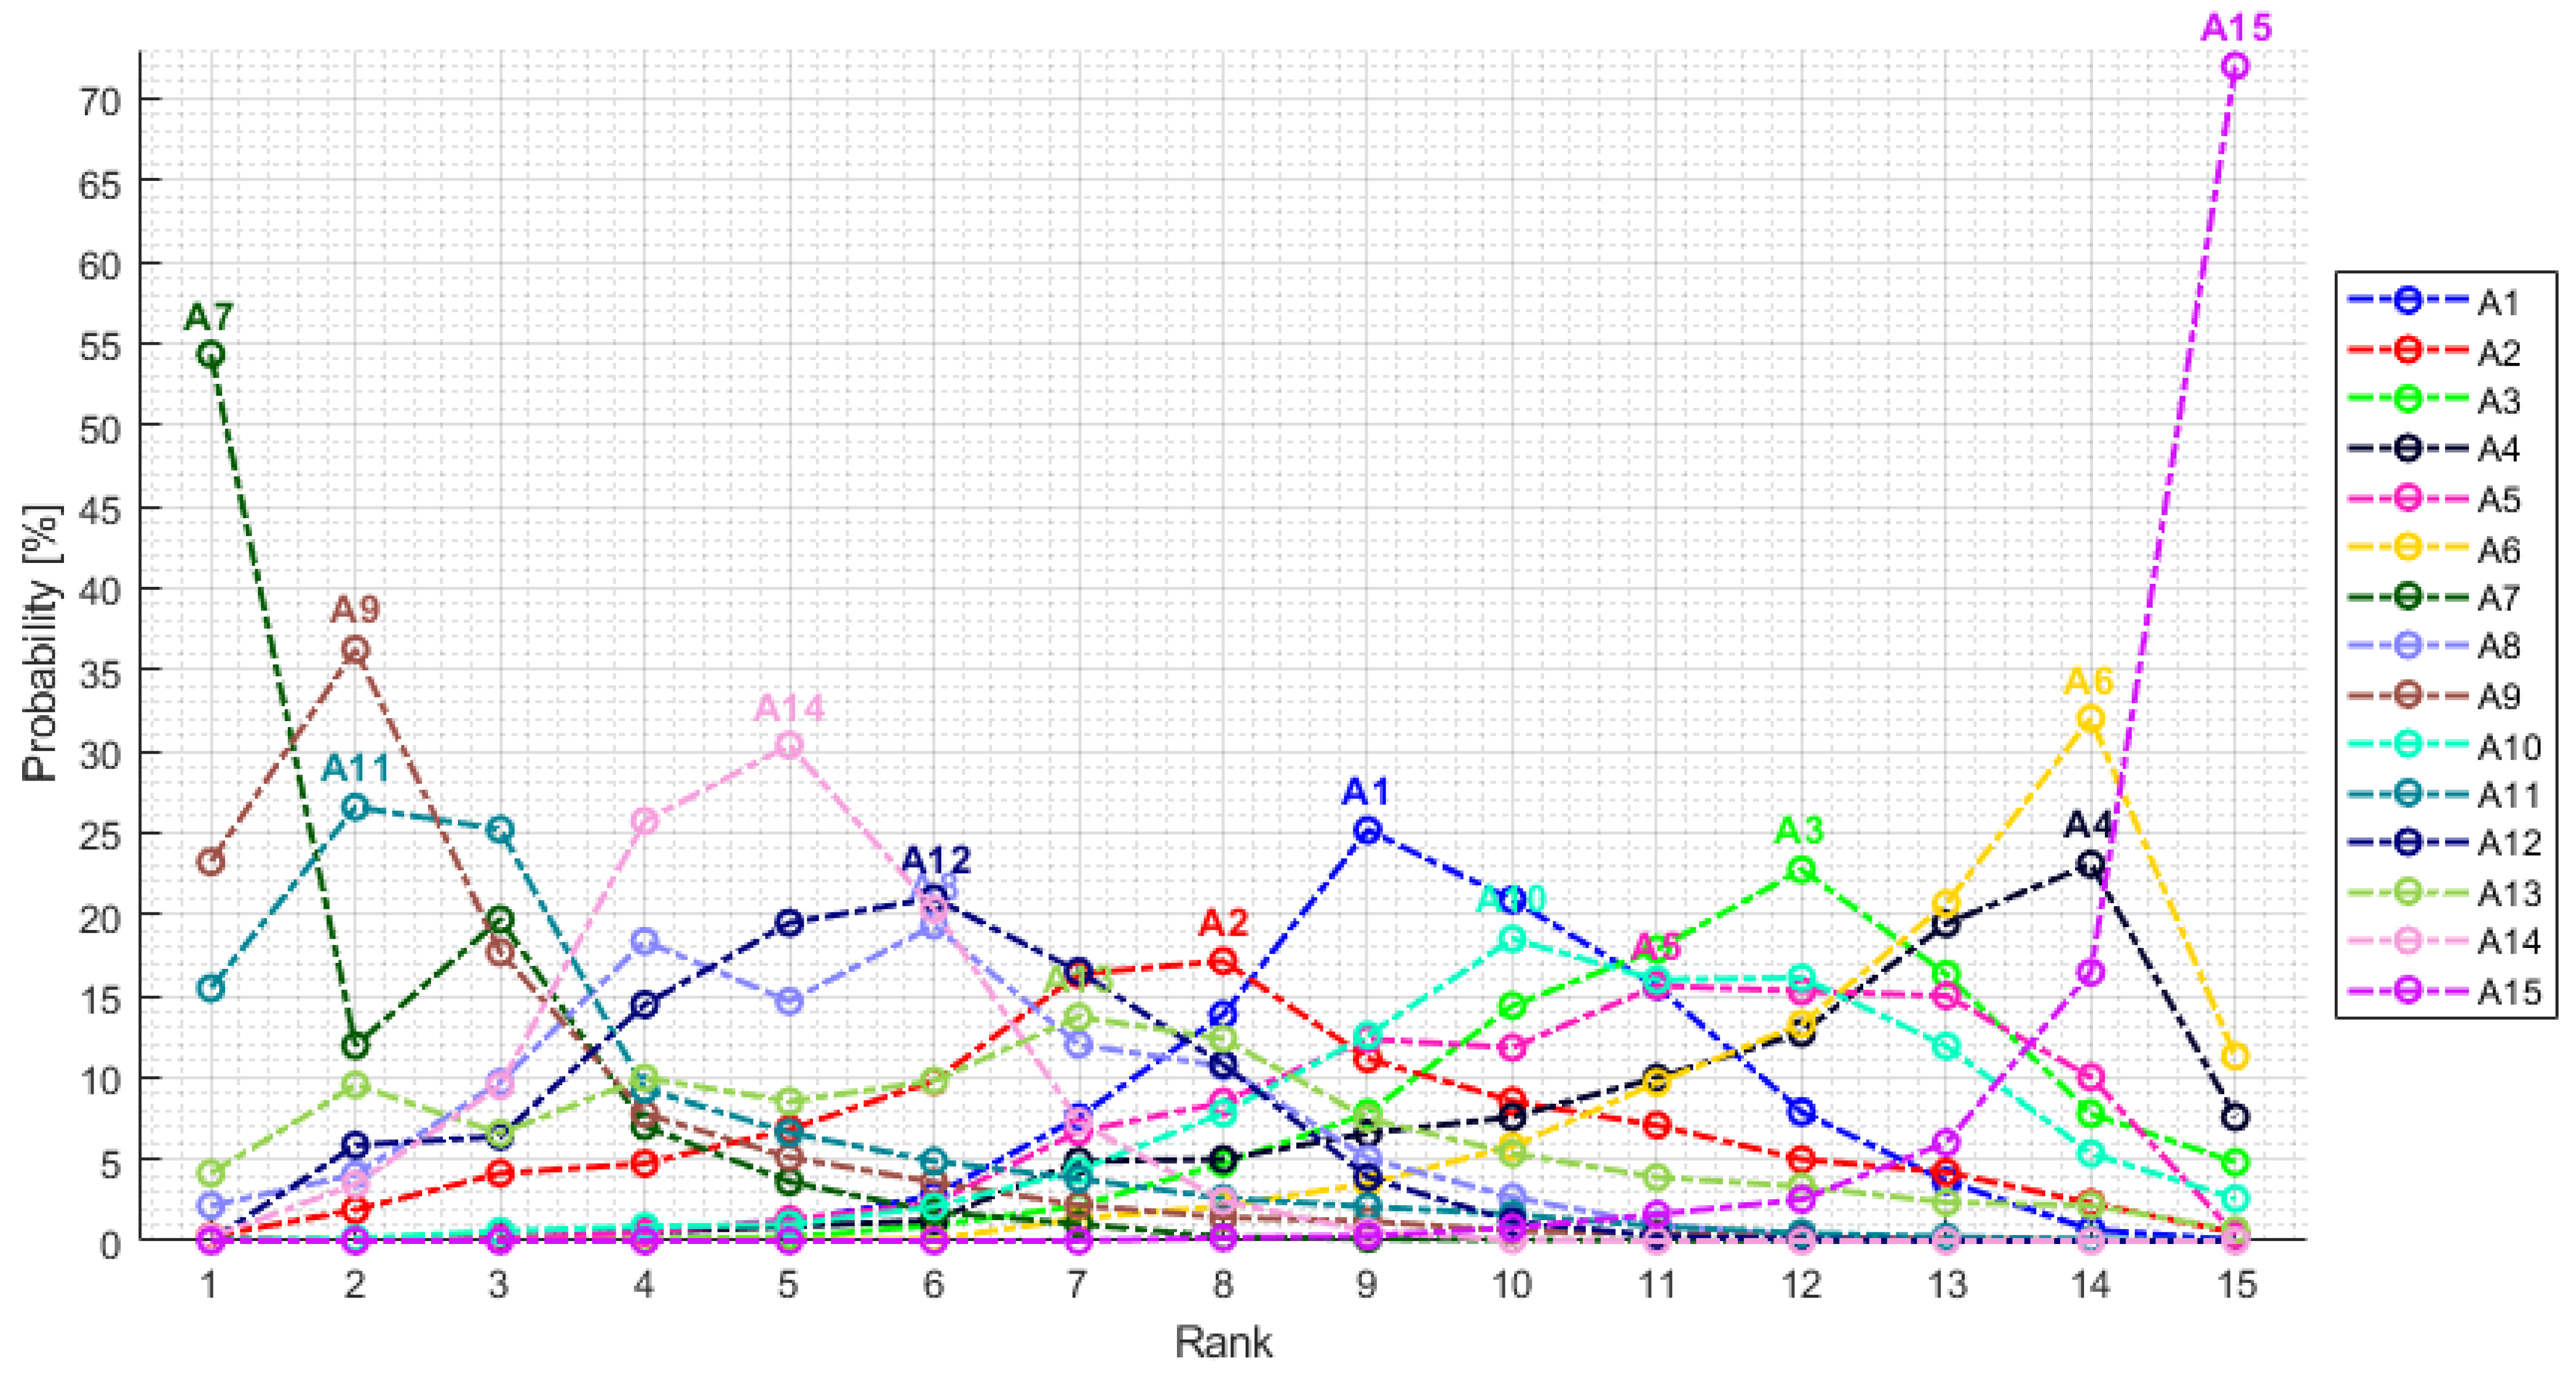
The results reported in Section 4 were obtained with expertly defined weight ranges. However, these weights, in sporadic cases, may not be in line with the preferences of an individual decision-maker considering the purchase of a specific model of PV panels. Therefore, a wider space of solutions to the decision problem was additionally examined, in which the weights of all criteria may take values outside the ranges given in Table 4. In an additional study, for each criterion, the range of weights in the full range [0, 100] was considered, thus examining the full space of solutions independent of the adopted ranges of criteria weights. The results of this analysis are presented in Table 8 and Figure 2.
The results of the additional study indicate that all PV panels, except A1, A3, A6, and A15, have a chance to be ranked first in the decision ranking when considering all possible criteria weights. Most often, the first position in the rankings was, again, occupied by the A7 alternative (54.34% of cases), but relatively often, the first place in the rankings was also occupied by PV panels A9 (23.21%) and A11 (15.46%). Panels A13 (4.15%) and A8 (2.17%) occupied the first place much less frequently. The remaining panels, i.e., A2, A4, A5, A10, A12, and A14, only occupied the first place in the rankings incidentally (below 1%). Consideration of the full space of solutions shows that the last position in the ranking is also much more uncertain. The last position is not solely occupied by A15 (72.01%), as it was in the case of rankings based on expert criteria weight ranges. The A6 (11.29%), A4 (7.6%), and A3 (4.83%) panels also have a relatively high chance of taking the last place in the ranking. Moreover, the last position can also be taken by PV panels, e.g., A9, A11, and A13, which also occupied the first place in the rankings.
A comparison of the results of Monte Carlo simulations, based on expert weight ranges and the full range of weights [0, 100], shows that defining the reliable ranges of criteria weights allows for a more reliable and precise solution. The results of simulations, based on expert weight ranges, allow for easier ordering of alternatives due to their optimality. On the other hand, considering the full possible range of criteria weights ([0, 100]) gave much less precise results, which were characterized by high uncertainty and some kind of indefiniteness. Comparing Table 6 and Table 8, as well as Figure 1 and Figure 2, it is clear that the results obtained for the full space of possible criteria weights are ‘blurred’. Based on these results, it is very difficult to sort the alternatives, in order from the PV panel, from most ranked first in the rankings, through the panels most ranked next, and to the panel that dominates the last position in the rankings. The comparison of the results clearly shows that the reduction in the uncertainty of the criteria weights results in the reduction in the uncertainty of the order of the alternatives. On the other hand, the use of weight ranges, instead of precise crisp numbers, allows you to limit the impact of the decision-maker—and the weights assigned by them—on the final results of the evaluation of alternatives. Therefore, the use of a stochastic approach, in the form of numerical ranges, for weighting criteria is a compromise between the certainty of the solution and the influence of the decision-maker on the solution. Wider ranges of criteria weights will limit the influence of the decision-maker, but at the same time, they will increase the uncertainty of the obtained solution.
6. Conclusions
The aim of the article was to select PV panels available on the Polish market that are best suited to work in households. This is an important issue due to the large share of individual users in the PV panel market and the policy of the Polish government strongly supporting the use of PV panels in household power supply. This goal was achieved using the MCDA method, called PROSA, and it was supported by the stochastic Monte Carlo method. The scientific contribution of the article is:
- The combination of the PROSA method and stochastic analysis to select PV panels,
- analyzing the criteria used in the assessment of PV panels, selecting these criteria, and supplementing them with new important criteria that have, so far, been omitted in the literature,
- the development and application of an approach in which the uncertainty and imprecision of the criteria weights reflect the decision-maker’s preferences is taken into account by using ranges of weight values instead of precise numerical values,
- comparison of the results obtained for expertly defined weight ranges (part of the space of possible solutions) with the results obtained for all possible weights (full space of possible solutions).
As a result of the conducted research, several types of PV panels were selected that are best suited to the needs of households in Poland. In particular, the modules A7—Jinko JKM430N-54HL4 and A9—Meyer Burger White 400 Wp can be indicated here. The practical aspect of the conducted research involving the selection of PV panels is associated with certain research limitations. These limitations consist, primarily, of the inability to assess all models of PV panels available on the Polish market, due to the size of the market and the associated number of various available PV panels. Another research limitation is that the use of other MCDA methods than PROSA could give slightly different results. However, the choice of the PROSA method is justified due to the need to maintain a balance between the values of individual criteria. This approach makes it possible to select PV panels that are good in all respects and omit panels that are very good in one aspect and very poor in another criterion.
The main conclusion from the research relates to the use of criteria weight ranges in the developed methodology. Such an approach to weighing criteria seems to be a reasonable compromise between too much influence of the decision-maker on the obtained solution and too much uncertainty of the solution. Relying on precise weights of criteria assigned by an expert may raise doubts about the quality of that expert. Undermining the skill of an expert would simultaneously undermine the obtained solution. On the other hand, the use of precise criteria weights allows for a precise solution to the decision problem. In turn, the complete elimination of the role of an expert in the weighing of criteria leads to a solution that is largely imprecise and blurred. The use of weight ranges, on the one hand, significantly reduces the expert’s influence on the solution, and on the other hand, it still allows for legible and relatively transparent results.
The research results can be generalized to a wider spectrum of decision problems relating to the evaluation and selection of alternatives. The presented approach to decision support focuses on the situation when:
- All alternative values are certain, or at least expressed, in the form of precise values;
- A partly uncertain element of the decision model includes the criteria weights;
- An important element of the problem is the balancing of criteria, not a strictly compromised solution.
The methodology presented in the article (Section 3) is reproducible, and it can be successfully applied to all decision-making problems, which is consistent with the characteristics of the decision-making situation presented above.
The directions of future research, resulting from the results obtained here, will be related to the methodological aspect and will concern the uncertain weights of the criteria. An interesting issue would be to compare the stochastic approach, based on the iterative application of weights drawn from a given range, with the fuzzy approach based on the use of linguistic weights that are based on trapezoidal and triangular fuzzy numbers.
Funding
This research received no external funding.
Institutional Review Board Statement
Not applicable.
Informed Consent Statement
Not applicable.
Data Availability Statement
Data are contained within the article.
Conflicts of Interest
The author declares no conflict of interest.
References
- Jung, J.; Han, S.; Kim, B. Digital Numerical Map-Oriented Estimation of Solar Energy Potential for Site Selection of Photovoltaic Solar Panels on National Highway Slopes. Appl. Energy 2019, 242, 57–68. [Google Scholar] [CrossRef]
- Huang, W.; Chen, W.; Anandarajah, G. The Role of Technology Diffusion in a Decarbonizing World to Limit Global Warming to Well below 2 °C: An Assessment with Application of Global TIMES Model. Appl. Energy 2017, 208, 291–301. [Google Scholar] [CrossRef]
- Manni, M.; Aghaei, M.; Sizkouhi, A.M.M.; Kumar, R.R.R.; Stølen, R.; Steen-Hansen, A.E.; Di Sabatino, M.; Moazami, A.; Völler, S.; Jelle, B.P.; et al. Solar Energy in the Built Environment. In Reference Module in Earth Systems and Environmental Sciences; Elsevier: Amsterdam, The Netherlands, 2023; ISBN 978-0-12-409548-9. [Google Scholar]
- Mohamed, S.A. Application of Geo-Spatial Analytical Hierarchy Process and Multi-Criteria Analysis for Site Suitability of the Desalination Solar Stations in Egypt. J. Afr. Earth Sci. 2020, 164, 103767. [Google Scholar] [CrossRef]
- Jathar, L.D.; Ganesan, S.; Awasarmol, U.; Nikam, K.; Shahapurkar, K.; Soudagar, M.E.M.; Fayaz, H.; El-Shafay, A.S.; Kalam, M.A.; Bouadila, S.; et al. Comprehensive Review of Environmental Factors Influencing the Performance of Photovoltaic Panels: Concern over Emissions at Various Phases throughout the Lifecycle. Environ. Pollut. 2023, 326, 121474. [Google Scholar] [CrossRef] [PubMed]
- Garraín, D.; Lechón, Y. Sustainability Assessments in Solar Energy Projects: Results of Case Studies. Sol. Compass 2023, 6, 100039. [Google Scholar] [CrossRef]
- Elaouzy, Y.; El Fadar, A. Solar and Photovoltaics Energy Utilization and Sustainability. In Reference Module in Earth Systems and Environmental Sciences; Elsevier: Amsterdam, The Netherlands, 2023; ISBN 978-0-12-409548-9. [Google Scholar]
- Jäger-Waldau, A. Solar Energy and Photovoltaics. In Encyclopedia of Inorganic and Bioinorganic Chemistry; John Wiley & Sons: New York, NY, USA, 2015; pp. 1–10. ISBN 978-1-119-95143-8. [Google Scholar]
- Wang, T.; Li, L.; Yin, Z.; Chen, S.; Wang, J. Selenium-Sensitized TiO2 p-n Heterojunction Thin Films with High Resistance to Oxidation and Moisture for Self-Driven Visible-Light Photodetection. Thin Solid Film. 2023, 774, 139853. [Google Scholar] [CrossRef]
- Momeni, A.; Rost, K. Identification and Monitoring of Possible Disruptive Technologies by Patent-Development Paths and Topic Modeling. Technol. Forecast. Soc. Change 2016, 104, 16–29. [Google Scholar] [CrossRef]
- Bashir, R.; Makhdoom, A.R.; Bilal, M.K.; Ahmad Badar, M. Comparative Study of the Photovoltaic Behavior of Ruthenium and the Other Organic and Inorganic Dye-Sensitized Solar Cells (DSSC). Optik 2018, 157, 11–15. [Google Scholar] [CrossRef]
- Kumar, M.; Kumar, A. Performance Assessment and Degradation Analysis of Solar Photovoltaic Technologies: A Review. Renew. Sustain. Energy Rev. 2017, 78, 554–587. [Google Scholar] [CrossRef]
- Alharbi, F.H.; Kais, S. Theoretical Limits of Photovoltaics Efficiency and Possible Improvements by Intuitive Approaches Learned from Photosynthesis and Quantum Coherence. Renew. Sustain. Energy Rev. 2015, 43, 1073–1089. [Google Scholar] [CrossRef]
- Wojewnik-Filipkowska, A.; Filipkowski, P.; Frąckowiak, O. Analysis of Investments in RES Based on the Example of Photovoltaic Panels in Conditions of Uncertainty and Risk—A Case Study. Energies 2023, 16, 3006. [Google Scholar] [CrossRef]
- Peri, E.; Tal, A. Is Setback Distance the Best Criteria for Siting Wind Turbines under Crowded Conditions? An Empirical Analysis. Energy Policy 2021, 155, 112346. [Google Scholar] [CrossRef]
- Yasmeen, R.; Yao, X.; Ul Haq Padda, I.; Shah, W.U.H.; Jie, W. Exploring the Role of Solar Energy and Foreign Direct Investment for Clean Environment: Evidence from Top 10 Solar Energy Consuming Countries. Renew. Energy 2022, 185, 147–158. [Google Scholar] [CrossRef]
- Tao, S.; Rogan, J.; Ye, S.; Geron, N. Mapping Photovoltaic Power Stations and Assessing Their Environmental Impacts from Multi-Sensor Datasets in Massachusetts, United States. Remote Sens. Appl. Soc. Environ. 2023, 30, 100937. [Google Scholar] [CrossRef]
- Tawalbeh, M.; Al-Othman, A.; Kafiah, F.; Abdelsalam, E.; Almomani, F.; Alkasrawi, M. Environmental Impacts of Solar Photovoltaic Systems: A Critical Review of Recent Progress and Future Outlook. Sci. Total Environ. 2021, 759, 143528. [Google Scholar] [CrossRef] [PubMed]
- Luo, L.; Zhuang, Y.; Liu, H.; Zhao, W.; Chen, J.; Du, W.; Gao, X. Environmental Impacts of Photovoltaic Power Plants in Northwest China. Sustain. Energy Technol. Assess. 2023, 56, 103120. [Google Scholar] [CrossRef]
- Jeal, C.; Perold, V.; Seymour, C.L.; Ralston-Paton, S.; Ryan, P.G. Utility-Scale Solar Energy Facilities—Effects on Invertebrates in an Arid Environment. J. Arid Environ. 2019, 168, 1–8. [Google Scholar] [CrossRef]
- Rathore, N.; Panwar, N.L. Strategic Overview of Management of Future Solar Photovoltaic Panel Waste Generation in the Indian Context. Waste Manag Res. 2022, 40, 504–518. [Google Scholar] [CrossRef]
- Mahmoudi, S.; Huda, N.; Behnia, M. Multi-Levels of Photovoltaic Waste Management: A Holistic Framework. J. Clean. Prod. 2021, 294, 126252. [Google Scholar] [CrossRef]
- Schmela, M.; Rossi, R.; Lits, C.; Chunduri, S.K.; Shah, A.; Muthyal, R.; Moghe, P.; Kalam, S.; Jamkhedkar, A.; Goel, S.; et al. Advancements in Solar Technology, Markets, and Investments—A Summary of the 2022 ISA World Solar Reports. Sol. Compass 2023, 6, 100045. [Google Scholar] [CrossRef]
- BP Statistical Review of World Energy; Whitehouse Associates: London, UK, 2022; Available online: https://www.bp.com/en/global/corporate/energy-economics/statistical-review-of-world-energy.html (accessed on 1 September 2023).
- Global Market Outlook for Solar Power 2022–2026; SolarPower Europe: Brussels, Belgium, 2022; Available online: https://www.solarpowereurope.org/insights/market-outlooks/global-market-outlook-for-solar-power-2022 (accessed on 1 September 2023).
- International Renewable Energy Agency Solar Energy. Available online: https://www.irena.org/Energy-Transition/Technology/Solar-energy (accessed on 23 June 2023).
- Moskwa-Bęczkowska, D.; Moskwa, A. Renewable Energy Sources in the Processes of Thermal Modernization of Buildings—Selected Aspects in Poland. Energies 2022, 15, 4613. [Google Scholar] [CrossRef]
- Skiba, S.; Maruszczak, M. The Impact of the COVID-19 Pandemic on the Decision to Use Solar Energy and Install Photovoltaic Panels in Households in the Years 2019–2021 within the Area of a Selected Polish Municipality. Energies 2022, 15, 7257. [Google Scholar] [CrossRef]
- Mój Prąd. Available online: https://mojprad.gov.pl/ (accessed on 25 June 2023).
- Program Czyste Powietrze. Available online: https://czystepowietrze.gov.pl/ (accessed on 25 June 2023).
- Ulga Termomodernizacyjna. Available online: https://www.podatki.gov.pl/pit/ulgi-odliczenia-i-zwolnienia/ulga-termomodernizacyjna/ (accessed on 25 June 2023).
- Ziemba, P. Multi-Criteria Stochastic Selection of Electric Vehicles for the Sustainable Development of Local Government and State Administration Units in Poland. Energies 2020, 13, 6299. [Google Scholar] [CrossRef]
- Seker, S.; Kahraman, C. Socio-Economic Evaluation Model for Sustainable Solar PV Panels Using a Novel Integrated MCDM Methodology: A Case in Turkey. Socio-Econ. Plan. Sci. 2021, 77, 100998. [Google Scholar] [CrossRef]
- Allouhi, A.; Rehman, S.; Buker, M.S.; Said, Z. Recent Technical Approaches for Improving Energy Efficiency and Sustainability of PV and PV-T Systems: A Comprehensive Review. Sustain. Energy Technol. Assess. 2023, 56, 103026. [Google Scholar] [CrossRef]
- Ziemba, P. Application Framework of Multi-Criteria Methods in Sustainability Assessment. Energies 2022, 15, 9201. [Google Scholar] [CrossRef]
- Cinelli, M.; Coles, S.R.; Kirwan, K. Analysis of the Potentials of Multi Criteria Decision Analysis Methods to Conduct Sustainability Assessment. Ecol. Indic. 2014, 46, 138–148. [Google Scholar] [CrossRef]
- Diaz-Balteiro, L.; González-Pachón, J.; Romero, C. Measuring Systems Sustainability with Multi-Criteria Methods: A Critical Review. Eur. J. Oper. Res. 2017, 258, 607–616. [Google Scholar] [CrossRef]
- Ibáñez-Forés, V.; Bovea, M.D.; Pérez-Belis, V. A Holistic Review of Applied Methodologies for Assessing and Selecting the Optimal Technological Alternative from a Sustainability Perspective. J. Clean. Prod. 2014, 70, 259–281. [Google Scholar] [CrossRef]
- Kumar, A.; Sah, B.; Singh, A.R.; Deng, Y.; He, X.; Kumar, P.; Bansal, R.C. A Review of Multi Criteria Decision Making (MCDM) towards Sustainable Renewable Energy Development. Renew. Sustain. Energy Rev. 2017, 69, 596–609. [Google Scholar] [CrossRef]
- Balo, F.; Şağbanşua, L. The Selection of the Best Solar Panel for the Photovoltaic System Design by Using AHP. Energy Procedia 2016, 100, 50–53. [Google Scholar] [CrossRef]
- Rani, P.; Mishra, A.R.; Mardani, A.; Cavallaro, F.; Štreimikienė, D.; Khan, S.A.R. Pythagorean Fuzzy SWARA–VIKOR Framework for Performance Evaluation of Solar Panel Selection. Sustainability 2020, 12, 4278. [Google Scholar] [CrossRef]
- Bączkiewicz, A.; Kizielewicz, B.; Shekhovtsov, A.; Yelmikheiev, M.; Kozlov, V.; Sałabun, W. Comparative Analysis of Solar Panels with Determination of Local Significance Levels of Criteria Using the MCDM Methods Resistant to the Rank Reversal Phenomenon. Energies 2021, 14, 5727. [Google Scholar] [CrossRef]
- El-Bayeh, C.Z.; Zellagui, M.; Shirzadi, N.; Eicker, U. A Novel Optimization Algorithm for Solar Panels Selection towards a Self-Powered EV Parking Lot and Its Impact on the Distribution System. Energies 2021, 14, 4515. [Google Scholar] [CrossRef]
- Kozlov, V.; Sałabun, W. Challenges in Reliable Solar Panel Selection Using MCDA Methods. Procedia Comput. Sci. 2021, 192, 4913–4923. [Google Scholar] [CrossRef]
- El-Bayeh, C.Z.; Alzaareer, K.; Brahmi, B.; Zellagui, M.; Eicker, U. An Original Multi-Criteria Decision-Making Algorithm for Solar Panels Selection in Buildings. Energy 2021, 217, 119396. [Google Scholar] [CrossRef]
- Ziemba, P.; Szaja, M. Fuzzy Decision-Making Model for Solar Photovoltaic Panel Evaluation. Energies 2023, 16, 5161. [Google Scholar] [CrossRef]
- Pacana, A.; Siwiec, D. Model to Predict Quality of Photovoltaic Panels Considering Customers’ Expectations. Energies 2022, 15, 1101. [Google Scholar] [CrossRef]
- Kaur, H.; Gupta, S.; Dhingra, A. Selection of Solar Panel Using Entropy TOPSIS Technique. Mater. Today Proc. 2023. [Google Scholar] [CrossRef]
- Shayani Mehr, P.; Hafezalkotob, A.; Fardi, K.; Seiti, H.; Movahedi Sobhani, F.; Hafezalkotob, A. A Comprehensive Framework for Solar Panel Technology Selection: A BWM- MULTIMOOSRAL Approach. Energy Sci. Eng. 2022, 10, 4595–4625. [Google Scholar] [CrossRef]
- Wang, T.-C.; Tsai, S.-Y. Solar Panel Supplier Selection for the Photovoltaic System Design by Using Fuzzy Multi-Criteria Decision Making (MCDM) Approaches. Energies 2018, 11, 1989. [Google Scholar] [CrossRef]
- Cao, Q.; Esangbedo, M.O.; Bai, S.; Esangbedo, C.O. Grey SWARA-FUCOM Weighting Method for Contractor Selection MCDM Problem: A Case Study of Floating Solar Panel Energy System Installation. Energies 2019, 12, 2481. [Google Scholar] [CrossRef]
- Liaqait, R.A.; Warsi, S.S.; Zahid, T.; Ghafoor, U.; Ahmad, M.S.; Selvaraj, J. A Decision Framework for Solar PV Panels Supply Chain in Context of Sustainable Supplier Selection and Order Allocation. Sustainability 2021, 13, 13216. [Google Scholar] [CrossRef]
- Javed, M.S.; Ma, T.; Jurasz, J.; Mikulik, J. A Hybrid Method for Scenario-Based Techno-Economic-Environmental Analysis of off-Grid Renewable Energy Systems. Renew. Sustain. Energy Rev. 2021, 139, 110725. [Google Scholar] [CrossRef]
- Dunn, W.L.; Shultis, J.K. Chapter 2—The Basis of Monte Carlo. In Exploring Monte Carlo Methods, 2nd ed.; Dunn, W.L., Shultis, J.K., Eds.; Elsevier: Amsterdam, The Netherlands, 2023; pp. 25–54. ISBN 978-0-12-819739-4. [Google Scholar]
- Ziemba, P. Multi-Criteria Approach to Stochastic and Fuzzy Uncertainty in the Selection of Electric Vehicles with High Social Acceptance. Expert Syst. Appl. 2021, 173, 114686. [Google Scholar] [CrossRef]
- Ziemba, P. Selection of Electric Vehicles for the Needs of Sustainable Transport under Conditions of Uncertainty—A Comparative Study on Fuzzy MCDA Methods. Energies 2021, 14, 7786. [Google Scholar] [CrossRef]
- Ziemba, P.; Becker, J.; Becker, A.; Radomska-Zalas, A. Framework for Multi-Criteria Assessment of Classification Models for the Purposes of Credit Scoring. J. Big Data 2023, 10, 94. [Google Scholar] [CrossRef]
- Brans, J.-P.; De Smet, Y. PROMETHEE Methods. In Multiple Criteria Decision Analysis: State of the Art Surveys; Greco, S., Ehrgott, M., Figueira, J.R., Eds.; International Series in Operations Research & Management Science; Springer New York: New York, NY, USA, 2016; pp. 187–219. ISBN 978-1-4939-3094-4. [Google Scholar]
- Ziemba, P. Towards Strong Sustainability Management—A Generalized PROSA Method. Sustainability 2019, 11, 1555. [Google Scholar] [CrossRef]
- Lahdelma, R.; Salminen, P. Stochastic Multicriteria Acceptability Analysis (SMAA). In Trends in Multiple Criteria Decision Analysis; Ehrgott, M., Figueira, J.R., Greco, S., Eds.; International Series in Operations Research & Management Science; Springer US: Boston, MA, USA, 2010; pp. 285–315. ISBN 978-1-4419-5904-1. [Google Scholar]
- Lahdelma, R.; Salminen, P. SMAA in Robustness Analysis. In Robustness Analysis in Decision Aiding, Optimization, and Analytics; Doumpos, M., Zopounidis, C., Grigoroudis, E., Eds.; International Series in Operations Research & Management Science; Springer International Publishing: Cham, Switzerland, 2016; pp. 1–20. ISBN 978-3-319-33121-8. [Google Scholar]
- Ziemba, P. Uncertain Multi-Criteria Analysis of Offshore Wind Farms Projects Investments—Case Study of the Polish Economic Zone of the Baltic Sea. Appl. Energy 2022, 309, 118232. [Google Scholar] [CrossRef]
- Cinelli, M.; Coles, S.R.; Nadagouda, M.N.; Błaszczyński, J.; Słowiński, R.; Varma, R.S.; Kirwan, K. Robustness Analysis of a Green Chemistry-Based Model for the Classification of Silver Nanoparticles Synthesis Processes. J. Clean. Prod. 2017, 162, 938–948. [Google Scholar] [CrossRef]
- Deshmukh, S.C. Preference Ranking Organization Method of Enrichment Evaluation (Promethee). Int. J. Eng. Sci. Invent. 2013, 2, 28–34. [Google Scholar]
- Ziemba, P.; Gago, I. Uncertainty of Preferences in the Assessment of Supply Chain Management Systems Using the PROMETHEE Method. Symmetry 2022, 14, 1043. [Google Scholar] [CrossRef]
- E.N.F. Ltd ASTRO 5s CHSM54M-HC. Available online: https://www.enfsolar.com/pv/panel-datasheet/crystalline/58220 (accessed on 19 August 2023).
- E.N.F. Ltd Bauer BS-410-108M10HB. Available online: https://www.enfsolar.com/pv/panel-datasheet/crystalline/58550 (accessed on 19 August 2023).
- E.N.F. Ltd Bruk-Bet PEM.WB-405. Available online: https://www.enfsolar.com/pv/panel-datasheet/crystalline/58586 (accessed on 19 August 2023).
- Heckert Solar Heckert NEMO. Available online: https://www.heckertsolar.com/service/ (accessed on 19 August 2023).
- 7sun HYUNDAI HiE-S410VG. Available online: https://7sun.eu/pl/modul-hyundai-hie-s410vg,3,2172,2451 (accessed on 19 August 2023).
- E.N.F. Ltd JAM60S20 370-395/MR. Available online: https://www.enfsolar.com/pv/panel-datasheet/crystalline/46962 (accessed on 20 August 2023).
- E.N.F. Ltd Tiger Neo N-Type 54HL4-(V) 410-430W. Available online: https://www.enfsolar.com/pv/panel-datasheet/crystalline/58641 (accessed on 20 August 2023).
- E.N.F. Ltd KS395-400M-SH. Available online: https://www.enfsolar.com/pv/panel-datasheet/crystalline/52779 (accessed on 20 August 2023).
- E.N.F. Ltd White 380-400W. Available online: https://www.enfsolar.com/pv/panel-datasheet/crystalline/51416 (accessed on 20 August 2023).
- E.N.F. Ltd TwinPlus Pro 400-420 Mono-PERC. Available online: https://www.enfsolar.com/pv/panel-datasheet/crystalline/60247 (accessed on 20 August 2023).
- EnergySage REC Group Alpha REC380AA. Available online: https://www.energysage.com/solar-panels/rec-group/1488/rec380aa/ (accessed on 20 August 2023).
- CORAB RSM40-8-390M-410M. Available online: https://en.corab.pl/our-products/modules/risen-energy/rsm40-8-390m-410m (accessed on 20 August 2023).
- Selfa SV108M.3 BLACK FRAME. Available online: https://www.selfa-pv.com/moduly-fotowoltaiczne,Modul-monokrystaliczny-PREMIUM,7 (accessed on 20 August 2023).
- E.N.F. Ltd Vertex S TSM-DE09.08 390-405W. Available online: https://www.enfsolar.com/pv/panel-datasheet/crystalline/55625 (accessed on 20 August 2023).
- E.N.F. Ltd VITOVOLT 300 M385-400WG. Available online: https://www.enfsolar.com/pv/panel-datasheet/crystalline/51354 (accessed on 20 August 2023).
- Tervonen, T.; Lahdelma, R. Implementing Stochastic Multicriteria Acceptability Analysis. Eur. J. Oper. Res. 2007, 178, 500–513. [Google Scholar] [CrossRef]
- Ziemba, P.; Piwowarski, M.; Nermend, K. Visualization of Uncertain Data in the NEAT F-PROMETHEE Method. MethodsX 2023, 10, 102166. [Google Scholar] [CrossRef] [PubMed]
Figure 1.
A graphical representation of the rank acceptability indices obtained for the tested PV panels with expertly defined criteria weight ranges.
Figure 1.
A graphical representation of the rank acceptability indices obtained for the tested PV panels with expertly defined criteria weight ranges.

Figure 2.
A graphical representation of rank acceptability indices obtained for the tested PV panels with random criteria weights in the [0, 100] range.
Figure 2.
A graphical representation of rank acceptability indices obtained for the tested PV panels with random criteria weights in the [0, 100] range.


Table 1.
Multi-criteria decision problems related to PV panels.
| Decision Problem | MCDA Methods | No of Criteria/Subcriteria | No of Alternatives | Ref. |
|---|---|---|---|---|
| Selection of the best solar panel for a PV system | AHP | 5/26 | 6 | [40] |
| Selection of the appropriate type of solar PV panel to generate electricity | PF + SWARA + VIKOR/PF + TOPSIS | 8 | 5 | [41] |
| Evaluation of solar panels for PV systems | COMET/SPOTIS | 6 | 30 | [42] |
| Selection of the best solar panels in an existing market and optimally size the PV system | RWR/TOPSIS | 9 | 11 | [43] |
| Assessment of solar PV panels | COMET/TOPSIS | 6 | 8 | [44] |
| Selection of the best available PV module in the market | RWR/TOPSIS | 9 | 11 | [45] |
| Analyzing and evaluation the solar PV panels available on the Polish market based on technical criteria | NEAT F-PROMETHEE | 8 | 10 | [46] |
| Prediction of the quality of PV panels in the context of qualitative–ecological | SMARTER + DEMATEL + AHP + WPM | 14 | 12 | [47] |
| Choosing the optimum solar PV panel for rural electrification | Entropy + TOPSIS | 9 | 16 | [48] |
| Selection of the best solar PV panel technology from three generations of panels | BWM + MULTIMOOSRAL | 5/20 | 9 | [49] |
| Evaluation and selection of solar panel supplier for a PV system design | Fuzzy AHP + DEA | 4/15 | 15 | [50] |
| Evaluation of the contractors for the floating solar PV panel power system | SWARA/FUCOM + GRA/EDAS | 6/30 | 4 | [51] |
| Sustainable supplier selection and order allocation problem in solar PV panels supply chain networks | Fuzzy Extended AHP + Fuzzy TOPSIS + Fuzzy MINLP + TOPSIS | 3/14 | 5 | [52] |
Abbreviations: AHP—Analytic Hierarchy Process; PF—Pythagorean Fuzzy; SWARA—Stepwise Weight Assessment Ratio Analysis; VIKOR—VlseKriterijumska Optimizcija I Kaompromisno Resenje; COMET—Characteristic Objects Method; SPOTIS—Stable Preference Ordering Towards Ideal Solution; RWR—Rank-Weigh-Rank; TOPSIS—Technique for Order of Preference by Similarity to Ideal Solution; SMARTER—Specific Measurable Achievable Relevant Time-bound Exciting Recorded; DEMATEL—Decision Making Trial and Evaluation Laboratory; WPM—Weighted Product Model; BWM—Best-Worst Method; MULTIMOOSRAL—Multi-Multi-Objective Optimization on the basis of Simple Ratio Analysis and Logarithmic approximation; DEA—Data Envelopment Analysis; FUCOM—Full Consistent Method; GRA—Grey Relational Analysis; EDAS—Evaluation based on Distance from Average Solution; MINLP—Mixed-Integer Non-Linear Programming.
Table 2.
Criteria used in the assessment of PV panels.
| Criterion | Reference |
|---|---|
| Power rating [W] | [40,41,42,43,44,45,46,47,48,49] |
| Power tolerance [W] | [49] |
| Temperature coefficient of power rating [%/°C] | [40,49] |
| Efficiency [%] | [40,41,42,43,44,45,46,47,48,49] |
| Open circuit voltage [V] | [40,42,44,46,47,48,49] |
| Max power voltage [V] | [40,41,47,48,49] |
| Temperature coefficient of open circuit voltage [%/°C] | [40,49] |
| Maximum system voltage [V] | [40,47,49] |
| Short circuit current [A] | [40,42,44,46,47,48,49] |
| Max power current [A] | [40,41,47,48,49] |
| Temperature coefficient of short circuit current [%/°C] | [49] |
| Series fuse rating [A] | [40,49] |
| Cost per Watt [$/W] | [40,41,42,43,44,45,46,48,49] |
| Weight [kg] | [40,41,42,46,47,48] |
| Area [m2] | [40,44,46,47,49] |
| Warranty [years] | [46,47,49] |
| Number of cells | [40,48] |
Table 3.
The assessment criteria selected for use in the assessment of PV panels for households in Poland.
Table 3.
The assessment criteria selected for use in the assessment of PV panels for households in Poland.
| Criterion | Name | Unit | Preference Direction |
|---|---|---|---|
| C1 | Power rating | [W] | max |
| C2 | Power tolerance | [W] | max |
| C3 | Temperature coefficient of power rating | [%/°C] | max |
| C4 | Open Circuit Voltage | [V] | min |
| C5 | Temperature coefficient of open circuit voltage | [%/°C] | min |
| C6 | Short Circuit Current | [A] | min |
| C7 | Temperature coefficient of short circuit current | [%/°C] | min |
| C8 | Efficiency | [%] | max |
| C9 | Efficiency degradation after 1 year | [%] | min |
| C10 | Efficiency degradation after 25 years | [%] | min |
| C11 | Cost per Watt | [PLN/W] | min |
| C12 | Area | [m2] | min |
| C13 | Product warranty | [years] | max |
| C14 | Efficiency warranty | [years] | max |
| C15 | Maximum static load—front | [Pa] | max |
| C16 | Maximum static load—back | [Pa] | max |
| C17 | Ingress protection—junction box | [IP class] | max |
Table 4.
Weight ranges and criteria preference functions used in the solution.
| Criterion | Name | Weight Range W = [Min, Max] | |
|---|---|---|---|
| C1 | Power rating | [60, 70] | Linear |
| C2 | Power tolerance | [0, 15] | Linear |
| C3 | Temperature coefficient of power rating | [40, 60] | Linear |
| C4 | Open Circuit Voltage | [0, 10] | Linear |
| C5 | Temperature coefficient of open circuit voltage | [5, 15] | Linear |
| C6 | Short Circuit Current | [0, 10] | Linear |
| C7 | Temperature coefficient of short circuit current | [5, 15] | Linear |
| C8 | Efficiency | [60, 80] | Linear |
| C9 | Efficiency degradation after 1 year | [70, 85] | Linear |
| C10 | Efficiency degradation after 25 years | [70, 90] | Linear |
| C11 | Cost per Watt | [75, 100] | Linear |
| C12 | Area | [10, 15] | Linear |
| C13 | Product warranty | [50, 70] | Linear |
| C14 | Efficiency warranty | [55, 70] | Linear |
| C15 | Maximum static load—front | [10, 30] | Linear |
| C16 | Maximum static load—back | [10, 30] | Linear |
| C17 | Ingress protection—junction box | [5, 10] | Usual |
Table 5.
Parameters of the assessed PV panels.
| C1 | C2 | C3 | C4 | C5 | C6 | C7 | C8 | C9 | C10 | C11 | C12 | C13 | C14 | C15 | C16 | C17 | |
|---|---|---|---|---|---|---|---|---|---|---|---|---|---|---|---|---|---|
| A1 | 410 | 5 | −0.350 | 37.40 | −0.270 | 13.88 | 0.045 | 21.00 | 2 | 15.2 | 1.52 | 1.95 | 12 | 25 | 5400 | 2400 | 68 |
| A2 | 410 | 12.3 | −0.320 | 37.54 | −0.270 | 13.86 | 0.048 | 21.00 | 3 | 20.0 | 2.19 | 1.95 | 20 | 25 | 5400 | 5400 | 68 |
| A3 | 405 | 4.05 | −0.328 | 36.84 | −0.255 | 13.65 | 0.040 | 20.51 | 1 | 17.0 | 2.4 | 1.97 | 15 | 25 | 5520 | 2520 | 68 |
| A4 | 395 | 4.99 | −0.340 | 54.57 | −0.263 | 8.99 | 0.037 | 20.30 | 1 | 20.0 | 2.13 | 1.95 | 11 | 25 | 8100 | 2400 | 68 |
| A5 | 410 | 5 | −0.340 | 46.60 | −0.270 | 11.07 | 0.040 | 20.90 | 2 | 15.2 | 2.44 | 1.96 | 25 | 25 | 5400 | 2400 | 67 |
| A6 | 390 | 5 | −0.350 | 41.94 | −0.272 | 11.58 | 0.044 | 20.90 | 2 | 17.0 | 1.57 | 1.87 | 12 | 25 | 3600 | 1600 | 68 |
| A7 | 430 | 12.9 | −0.300 | 38.49 | −0.250 | 14.23 | 0.046 | 22.02 | 1 | 10.6 | 1.59 | 1.95 | 12 | 30 | 5400 | 2400 | 68 |
| A8 | 395 | 5 | −0.340 | 49.40 | −0.270 | 10.07 | 0.040 | 21.10 | 2 | 15.2 | 1.76 | 1.88 | 25 | 25 | 5400 | 2400 | 68 |
| A9 | 400 | 5 | −0.259 | 44.60 | −0.234 | 10.90 | 0.033 | 21.70 | 2 | 8.0 | 3.77 | 1.84 | 25 | 25 | 6000 | 4000 | 68 |
| A10 | 420 | 5 | −0.380 | 45.69 | −0.300 | 11.45 | 0.050 | 20.98 | 2 | 15.2 | 1.6 | 2.00 | 15 | 25 | 5400 | 2400 | 68 |
| A11 | 380 | 5 | −0.260 | 44.30 | −0.240 | 10.61 | 0.040 | 21.70 | 2 | 8.0 | 2.93 | 1.75 | 20 | 25 | 7000 | 4000 | 68 |
| A12 | 410 | 12.3 | −0.340 | 41.90 | −0.250 | 12.47 | 0.040 | 21.30 | 2 | 15.2 | 1.76 | 1.92 | 12 | 25 | 5400 | 2400 | 68 |
| A13 | 410 | 5 | −0.360 | 37.45 | −0.300 | 13.88 | 0.060 | 21.00 | 3 | 17.0 | 1.99 | 1.96 | 20 | 30 | 8000 | 5400 | 68 |
| A14 | 405 | 5 | −0.340 | 41.40 | −0.250 | 12.34 | 0.040 | 21.10 | 2 | 15.2 | 1.6 | 1.92 | 15 | 25 | 6000 | 4000 | 68 |
| A15 | 390 | 5 | −0.340 | 49.30 | −0.270 | 10.03 | 0.040 | 20.80 | 3 | 20.0 | 1.77 | 1.88 | 15 | 25 | 5400 | 2400 | 67 |
Table 6.
Rank acceptability indices obtained for the tested PV panels with expertly defined criteria weight ranges.
Table 6.
Rank acceptability indices obtained for the tested PV panels with expertly defined criteria weight ranges.
| Rank Acceptability Index [%] | |||||||||||||||
|---|---|---|---|---|---|---|---|---|---|---|---|---|---|---|---|
| 1 | 2 | 3 | 4 | 5 | 6 | 7 | 8 | 9 | 10 | 11 | 12 | 13 | 14 | 15 | |
| A1 | 0 | 0 | 0 | 0 | 0 | 0.44 | 17.75 | 29.81 | 30.41 | 21.59 | 0 | 0 | 0 | 0 | 0 |
| A2 | 0 | 0 | 0 | 0 | 0 | 0 | 0 | 0 | 0 | 0 | 6.89 | 91.53 | 1.58 | 0 | 0 |
| A3 | 0 | 0 | 0 | 0 | 0 | 0 | 0 | 0 | 0 | 0 | 93.11 | 6.89 | 0 | 0 | 0 |
| A4 | 0 | 0 | 0 | 0 | 0 | 0 | 0 | 0 | 0 | 0 | 0 | 0 | 1.17 | 98.83 | 0 |
| A5 | 0 | 0 | 0 | 0 | 0 | 0.05 | 15.39 | 22.63 | 20.15 | 41.78 | 0 | 0 | 0 | 0 | 0 |
| A6 | 0 | 0 | 0 | 0 | 0 | 0 | 0 | 0 | 0 | 0 | 0 | 1.58 | 97.25 | 1.17 | 0 |
| A7 | 100 | 0 | 0 | 0 | 0 | 0 | 0 | 0 | 0 | 0 | 0 | 0 | 0 | 0 | 0 |
| A8 | 0 | 0.77 | 19.76 | 50.31 | 27.52 | 1.62 | 0.02 | 0 | 0 | 0 | 0 | 0 | 0 | 0 | 0 |
| A9 | 0 | 94.4 | 4.4 | 1.04 | 0.16 | 0 | 0 | 0 | 0 | 0 | 0 | 0 | 0 | 0 | 0 |
| A10 | 0 | 0 | 0 | 0 | 0 | 0.93 | 12.42 | 30.83 | 35.38 | 20.44 | 0 | 0 | 0 | 0 | 0 |
| A11 | 0 | 0 | 16.42 | 16.74 | 35.4 | 27.83 | 2.16 | 0.92 | 0.5 | 0.03 | 0 | 0 | 0 | 0 | 0 |
| A12 | 0 | 0 | 0.02 | 2.85 | 29.33 | 64.32 | 3.47 | 0.01 | 0 | 0 | 0 | 0 | 0 | 0 | 0 |
| A13 | 0 | 0 | 0 | 0.02 | 0.86 | 4.81 | 48.79 | 15.8 | 13.56 | 16.16 | 0 | 0 | 0 | 0 | 0 |
| A14 | 0 | 4.83 | 59.4 | 29.04 | 6.73 | 0 | 0 | 0 | 0 | 0 | 0 | 0 | 0 | 0 | 0 |
| A15 | 0 | 0 | 0 | 0 | 0 | 0 | 0 | 0 | 0 | 0 | 0 | 0 | 0 | 0 | 100 |
Table 7.
Positions in the rankings most often obtained by individual PV panels.
| Alternative | A1 | A2 | A3 | A4 | A5 | A6 | A7 | A8 | A9 | A10 | A11 | A12 | A13 | A14 | A15 |
|---|---|---|---|---|---|---|---|---|---|---|---|---|---|---|---|
| Rank | 9 | 12 | 11 | 14 | 10 | 13 | 1 | 4 | 2 | 9 | 5 | 6 | 7 | 3 | 15 |
Table 8.
Rank acceptability indices obtained for the tested PV panels with random criteria weights in the [0, 100] range.
Table 8.
Rank acceptability indices obtained for the tested PV panels with random criteria weights in the [0, 100] range.
| Rank Acceptability Index [%] | |||||||||||||||
|---|---|---|---|---|---|---|---|---|---|---|---|---|---|---|---|
| 1 | 2 | 3 | 4 | 5 | 6 | 7 | 8 | 9 | 10 | 11 | 12 | 13 | 14 | 15 | |
| A1 | 0 | 0.03 | 0.14 | 0.53 | 1.16 | 2.79 | 7.58 | 13.84 | 25.15 | 20.88 | 15.57 | 7.9 | 3.68 | 0.69 | 0.06 |
| A2 | 0.29 | 1.91 | 4.15 | 4.75 | 6.85 | 9.76 | 16.33 | 17.13 | 11.14 | 8.55 | 7.09 | 5 | 4.22 | 2.32 | 0.51 |
| A3 | 0 | 0 | 0.04 | 0.11 | 0.25 | 0.95 | 2.16 | 4.76 | 7.82 | 14.39 | 17.85 | 22.73 | 16.32 | 7.79 | 4.83 |
| A4 | 0.1 | 0.14 | 0.17 | 0.54 | 0.89 | 1.27 | 4.89 | 5.01 | 6.61 | 7.6 | 9.97 | 12.72 | 19.42 | 23.07 | 7.6 |
| A5 | 0.01 | 0.03 | 0.13 | 0.53 | 1.33 | 2.3 | 6.71 | 8.49 | 12.35 | 11.82 | 15.62 | 15.28 | 15 | 10.01 | 0.39 |
| A6 | 0 | 0 | 0.02 | 0.04 | 0.08 | 0.11 | 1.38 | 2.14 | 3.53 | 5.81 | 9.67 | 13.27 | 20.65 | 32.01 | 11.29 |
| A7 | 54.34 | 11.95 | 19.68 | 7.04 | 3.63 | 1.81 | 1.04 | 0.25 | 0.14 | 0.08 | 0.03 | 0.01 | 0 | 0 | 0 |
| A8 | 2.17 | 4.07 | 9.7 | 18.34 | 14.66 | 19.31 | 12.02 | 10.67 | 5.06 | 2.69 | 1.01 | 0.29 | 0.01 | 0 | 0 |
| A9 | 23.21 | 36.24 | 17.67 | 7.8 | 5.13 | 3.61 | 2.2 | 1.45 | 1.21 | 0.62 | 0.46 | 0.24 | 0.13 | 0.02 | 0.01 |
| A10 | 0.02 | 0.16 | 0.6 | 0.9 | 1.01 | 2.11 | 4.33 | 7.83 | 12.58 | 18.49 | 15.98 | 16.11 | 11.91 | 5.37 | 2.6 |
| A11 | 15.46 | 26.57 | 25.2 | 9.29 | 6.64 | 4.89 | 3.82 | 2.62 | 2.11 | 1.63 | 0.9 | 0.48 | 0.26 | 0.11 | 0.02 |
| A12 | 0.01 | 5.88 | 6.41 | 14.46 | 19.47 | 20.98 | 16.5 | 10.79 | 3.91 | 1.2 | 0.3 | 0.09 | 0 | 0 | 0 |
| A13 | 4.15 | 9.54 | 6.61 | 9.96 | 8.53 | 9.79 | 13.71 | 12.36 | 7.51 | 5.36 | 3.91 | 3.34 | 2.37 | 2.18 | 0.68 |
| A14 | 0.24 | 3.48 | 9.48 | 25.71 | 30.36 | 20.31 | 7.32 | 2.46 | 0.57 | 0.07 | 0 | 0 | 0 | 0 | 0 |
| A15 | 0 | 0 | 0 | 0 | 0.01 | 0.01 | 0.01 | 0.2 | 0.31 | 0.81 | 1.64 | 2.54 | 6.03 | 16.43 | 72.01 |
Disclaimer/Publisher’s Note: The statements, opinions and data contained in all publications are solely those of the individual author(s) and contributor(s) and not of MDPI and/or the editor(s). MDPI and/or the editor(s) disclaim responsibility for any injury to people or property resulting from any ideas, methods, instructions or products referred to in the content. |
© 2023 by the author. Licensee MDPI, Basel, Switzerland. This article is an open access article distributed under the terms and conditions of the Creative Commons Attribution (CC BY) license (https://creativecommons.org/licenses/by/4.0/).
Share and Cite
MDPI and ACS Style
Ziemba, P. Selection of Photovoltaic Panels Based on Ranges of Criteria Weights and Balanced Assessment Criteria. Energies 2023, 16, 6382. https://doi.org/10.3390/en16176382
AMA Style
Ziemba P. Selection of Photovoltaic Panels Based on Ranges of Criteria Weights and Balanced Assessment Criteria. Energies. 2023; 16(17):6382. https://doi.org/10.3390/en16176382
Chicago/Turabian StyleZiemba, Paweł. 2023. "Selection of Photovoltaic Panels Based on Ranges of Criteria Weights and Balanced Assessment Criteria" Energies 16, no. 17: 6382. https://doi.org/10.3390/en16176382
Note that from the first issue of 2016, this journal uses article numbers instead of page numbers. See further details here.