1. Introduction
On 18 February 2022, the United Nations Environment Program (UNEP) released a scientific blueprint, “Making Peace with Nature,” before the United Nations Environment Assembly (UNEA-5) summit [
1]. The report called for international action, pointing to climate destruction, biodiversity degradation, and environmental pollution. The excessive use of fossil fuels due to industrialization in developing countries and an increase in the global population has caused an energy crisis and a shortage of industrial raw materials. In addition, the increase in greenhouse gas generation, such as carbon dioxide, due to industrialization has caused weather fluctuations, a lack of water due to a decrease in glacier sizes, and an increase in sea level. Moreover, the excessive use of fossil fuels has caused ecosystem destruction through air and water pollution. Measures to address these problems include the development of clean alternative energy technologies, suppression of fossil fuel use, resource regeneration technologies, and green resources [
2].
UN Secretary-General António Guterres stressed one’s choice and role in households at an online news conference on the blueprint announcement, saying, “Even individuals and communities other than the government or international institutions cannot be free from this responsibility” [
3]. In January 2022, the World Resources Institute (WRI) proposed key efforts for Net Zero, highlighting personal roles, such as increasing the use of electric vehicles and public transportation, reducing food waste, and reducing meat consumption [
4]. It is necessary to expand the use of clean-energy-based products to support this proactive individual behavior. Clean energy refers to hydrogen, solar, and wind energy that does not generate exhaust gas or waste that is harmful to the natural environment.
Most of the energy used in households is mainly used for both heating and hot water, and many countries supply it through district heating. The European Union is pursuing a policy to expand district heating and is steadily increasing the proportion of renewable energy in heat sources [
5]. However, in countries such as the United States, where most households are single houses and households themselves operate individual heating systems, many countries, including South Korea, use district heating but still adopt coal as a main heat source. Therefore, households in these countries must adopt clean energy individually, and due to the limited land area of these households, usable renewable energy products are limited to solar panels.
According to Enerdata [
6], an energy research company, the global proportion of renewable energy reached 9.5% in 2020. Among them, solar energy accounted for approximately 3%, a 20.4% increase compared to the previous year. The European Union, including Germany and Netherlands, the USA, and Brazil, had acceleration in newly installed solar power capacities; in numbers of 18 GW, 15 GW, and 3 GW each. Additionally, the US Department of Energy (DOE) has expressed its willingness to expand solar energy usage by releasing a blueprint indicating an increase in the proportion of solar energy to more than 40% of electricity in the United States by 2035 [
7]. According to the Power Statistical Information System (EPSIS), Korea’s new solar installation capacity also showed rapid growth from 1.1 GW in 2015 to 4.7 GW in 2020 [
8]. This is about 13.5% of the total energy generation capacity. The 30 years’ average weather conditions of mentioned countries are as follows; Germany’s annual average temperature was 9.6 °C with 47.6 mm of rainfall, the USA had an annual average temperature of 14.0 °C with 41.7 mm of rainfall, Brazil had an annual average temperature of 24.1 °C with 97.7 of mm rainfall, and Korea had an annual average temperature of 12.8 °C with 118.2 mm of rainfall. The monthly detailed figures are shown in
Table A1 in
Appendix A.
Solar thermal energy is renewable energy divided into photovoltaic (PV) and solar heat power. PV power directly converts solar energy into electricity, whereas solar heat power generates electricity by turning turbines into steam from boiling water and air. They are typically installed on the roofs or walls of buildings. In many cases, state support systems such as feed-in tariffs (FIT) or net metering are used to encourage installation. FIT is a system that prioritizes the purchase of electricity generated by renewable energy. The power company or the public sector purchases the electricity at the base price or supports the difference between the system marginal price (SMP) and the base price. Net metering is a system that reduces the electricity fee itself. The remaining renewable energy power after the usage of each household is sent back to the power company, and the net consumption obtained is calculated based on the rate.
Conventional solar thermal systems have advantages such as reduced electricity bills and carbon emissions [
9]. However, the power deviation of solar power generation equipment depends on the weather. In solar PV applications, efficiency is reduced at temperatures above 25 °C. According to Enlighten (2022), a PV module’s power generation efficiency is best at 25 °C and decreases by 0.5% each time the temperature increases by 1 °C [
10]. However, solar heat power modules are not vulnerable to temperature but are affected by seasons or regions. Additionally, they are difficult to miniaturize and require complex maintenance. Compared with these traditional solar thermal systems, photovoltaic thermal (PVT) systems maintain a compact size while eliminating efficiency constraints caused by weather or season.
The PVT system is a hybrid collector that can generate electricity from the PV system at the front and use solar energy simultaneously upon utilizing the heat generated from the rear. Similar to existing solar power generation methods, PVT systems have long lifecycles and do not require fuel to generate power. However, in contrast to solar thermal generation, excluding the heat storage tank reduces the spatial constraints because heat from the PV panels is used, which helps overcome the decrease in power generation efficiency [
11].
While existing studies mostly focus on various PVT technical aspects, such as energy efficiency and cooling performances, PVT is a market good, so it is also important to know the utility of PVT for individuals. In order to analyze the ripple effect on the market, it is necessary to analyze its impact on the consumer market and conduct an economic evaluation. Thus, this study differs from existing studies in that the latter lacks quantitative valuation, such as consumer utility and social benefits, apart from the importance of PVT technology. This study aims to conduct more sensory utility-oriented research, such as consumer utility and social benefits of PVT.
The remainder of this paper is organized as follows:
Section 2 presents a literature review on the format, efficiency, and economic evaluation of PVT technology.
Section 3 projects the contingent valuation method (CVM), mainly used to estimate the value of nonmarket goods such as environmental goods.
Section 4 presents data and results of the survey. It also briefly demonstrates how economic feasibility in the case of South Korea can be derived using an equation. The final section summarizes the findings and concludes.
2. Literature Review
Although PVT systems are powerful solar power generators, existing studies have primarily focused on their format or internal efficiency. Previous studies on PVT technology have mainly confirmed technical or performance aspects, such as morphology, efficiency, and economic evaluation.
Kim et al. [
12] compared the installation and application cases according to the shape of the heat transfer medium and collector and analyzed the characteristics. The heat transfer medium was divided into air and liquid types, and the shape of the collector was divided into flat plate and condensing types. These collectors should be selected based on the operating conditions of the PVT system. Cha [
13] presented technical trends and market prospects, especially regarding liquid-flat-plate-type, air-flat-plate-type, and building-integrated PVT systems. According to this study, the largest market for liquid PVT systems is expected to be households that use them for hot water production and heating combinations, with liquid collectors with glass covers as their main products. Therefore, this study measured the sensory utility of households with covers for liquid PVT systems. This panel survey of household heads was organized to provide information about satisfaction levels using convergent or non-convergent products.
Seo and Ko [
14] experimented with the internal flow of panels to increase the internal efficiency of PVT systems. This experiment presented the optimal flow rate for maximizing efficiency in the same environment. The power generation efficiency of the solar energy sector, expected to increase through research on optimization based on solar radiation and inlet fluid temperature, is also presented. Maeng, Kim, and Kim [
15] conducted a simulation study on the cooling performance of sheet-and-tube PVT collectors. Regarding the thermal and electrical efficiencies of the heat collection panel, the refrigerant performance may change according to its type. However, this content is mainly considered by companies or individual buyers before selection. Therefore, this study attempts to understand the consumer preference structure revealed after selection. This is because it is difficult to obtain consumers’ evaluations of the performance of a relative product in an actual market situation, where only selected information can be obtained. Therefore, this study uses a value estimation method that assumes a virtual market, imitates an actual market situation, and induces goods transactions among respondents.
Lastly, Yoon, Shin, and Park [
16] studied the performance analysis and economic evaluation module development of PVT systems for buildings. According to the results, the annual power generation of a 2.5 kWh PV system reduced electricity usage by 82.3% per year, corresponding to an 89.5% reduction in electricity bills. Lucheng et al. [
17] conducted an economic analysis of installing a solar energy power generation system in factory buildings in industrial complexes. In particular, the investment recovery periods of PV and liquid solar heat systems (L-PVTs) were compared and analyzed. The period is 45% shorter, and the production of electric energy is expected to increase by 20%. Based on these ideas, this study attempts to derive the social benefits of PVT. In addition, an economic evaluation of the regulatory operation was conducted because new industrial convergence products, such as PVT technology, must pass the certification criteria to be sold to general consumers. Economic evaluation is mainly used to evaluate projects subject to investment because it is possible to determine which alternative has greater utility under the assumption of the same cost.
3. Materials and Methods
The total economic value for calculating benefits is divided into utility and non-utility values. The utility value refers to the direct or indirect value of using resources in the present or future. Non-utility values include option, existence, and bequest values. Non-utility values can be collected using the revealed preference (RP) and the stated preference (SP) approaches. The SP approach is used for themes that are too complementary to measure and are difficult to apply. The representative methodology of SP is the contingent valuation measurement (CVM) [
18]. CVM is the most appropriate methodology for estimating the value of nonmarket goods such as environmental goods [
19]. Owing to the ease of estimation and validity of the questionnaire, the CVM has been used for various nonmarket goods, services, and policies such as cultural and scientific facilities [
20], environmental goods [
21], and energy policies [
22]. Particularly in the case of new convergence products, such as PVT, using the CVM is appropriate because there is no indirect proxy market.
The questionnaire used a dichotomous choice (DC) format because it causes relatively low respondent fatigue, derives reliable results, and excludes respondents’ unreasonable willingness-to-pay (WTP) responses and strategic actions [
23]. The models were differentiated according to the number of questions: single-bound (SB), double-bound (DB), and one-half-bound (OOHB) models [
24]. The OOHB model divides the number of questions according to the amount presented, presenting the upper bid again to respondents who responded to a lower bid and vice versa. A pilot test or a previous study should determine the amount presented. In addition, a spike model can be set up to distinguish whether the payment-resistance response is a protest bid or zero willingness to pay (0 WTP). Through this process, protest bid respondents can be considered irrational and excluded from the analysis, eliminating the possibility of overestimating WTP [
25].
Figure 1 illustrates the selection process combining the OOHB and spike models [
26].
The analysis was performed as follows: according to Carson and Hanemann [
27], when
j represents an individual’s characteristics,
m is income,
s represents other demographic characteristics, and
x is the respondent’s WTP. Therefore, the individual’s utility function can be expressed as in Equation (1):
Through the utility function, the WTP probability depends on the cumulative distribution function of
, as shown in Equation (2):
At this time,
is a cumulative distribution function for the respondent’s maximum payment intention,
WTP, and
can be calculated using
as a utility gap, if a respondent is offered a lower bid, the probability of responding “Yes-Yes” to both initial and secondary questions can be expressed as Equation (3), or (4) if the response was “Yes-No”, Equation (5) in the case of “No” response from the beginning.
Presenting an upper bid also involves the same process as described above. The maximum likelihood estimate (MLE) can calculate the final profit through a log-likelihood function consisting of a selection probability. This can be expressed using Equations (6) and (7).
Equation (7) can be expanded in the form of Equation (8) using an additional Spike model if the respondent does not derive the minimum amount of WTP with even 1 KRW by responding “No” or “No-No” in the OOHB model. The spike is defined as
[
28].
Parameter values
and
can be obtained based on the estimated coefficient, and the average
WTP value is estimated using Equation (9).
4. Results and Discussion
4.1. Data
As new industrial convergence products, such as PVT products, can be purchased by general consumers only after obtaining a conformity assessment, WTP was assessed as a temporary increase in additional income tax on regulatory operations. Simultaneously, the bid amount was derived through open-ended questions in a prior survey review. An OOHBDC spike model was combined to reflect the distinction between protest bids and zero WTP. Responses such as information uncertainty, government distrust, and dissatisfaction with payment methods were classified as protest bids, while responses such as lack of solvency, marginal utility from institutional changes, and meaningless changes were classified as 0 WTP [
29].
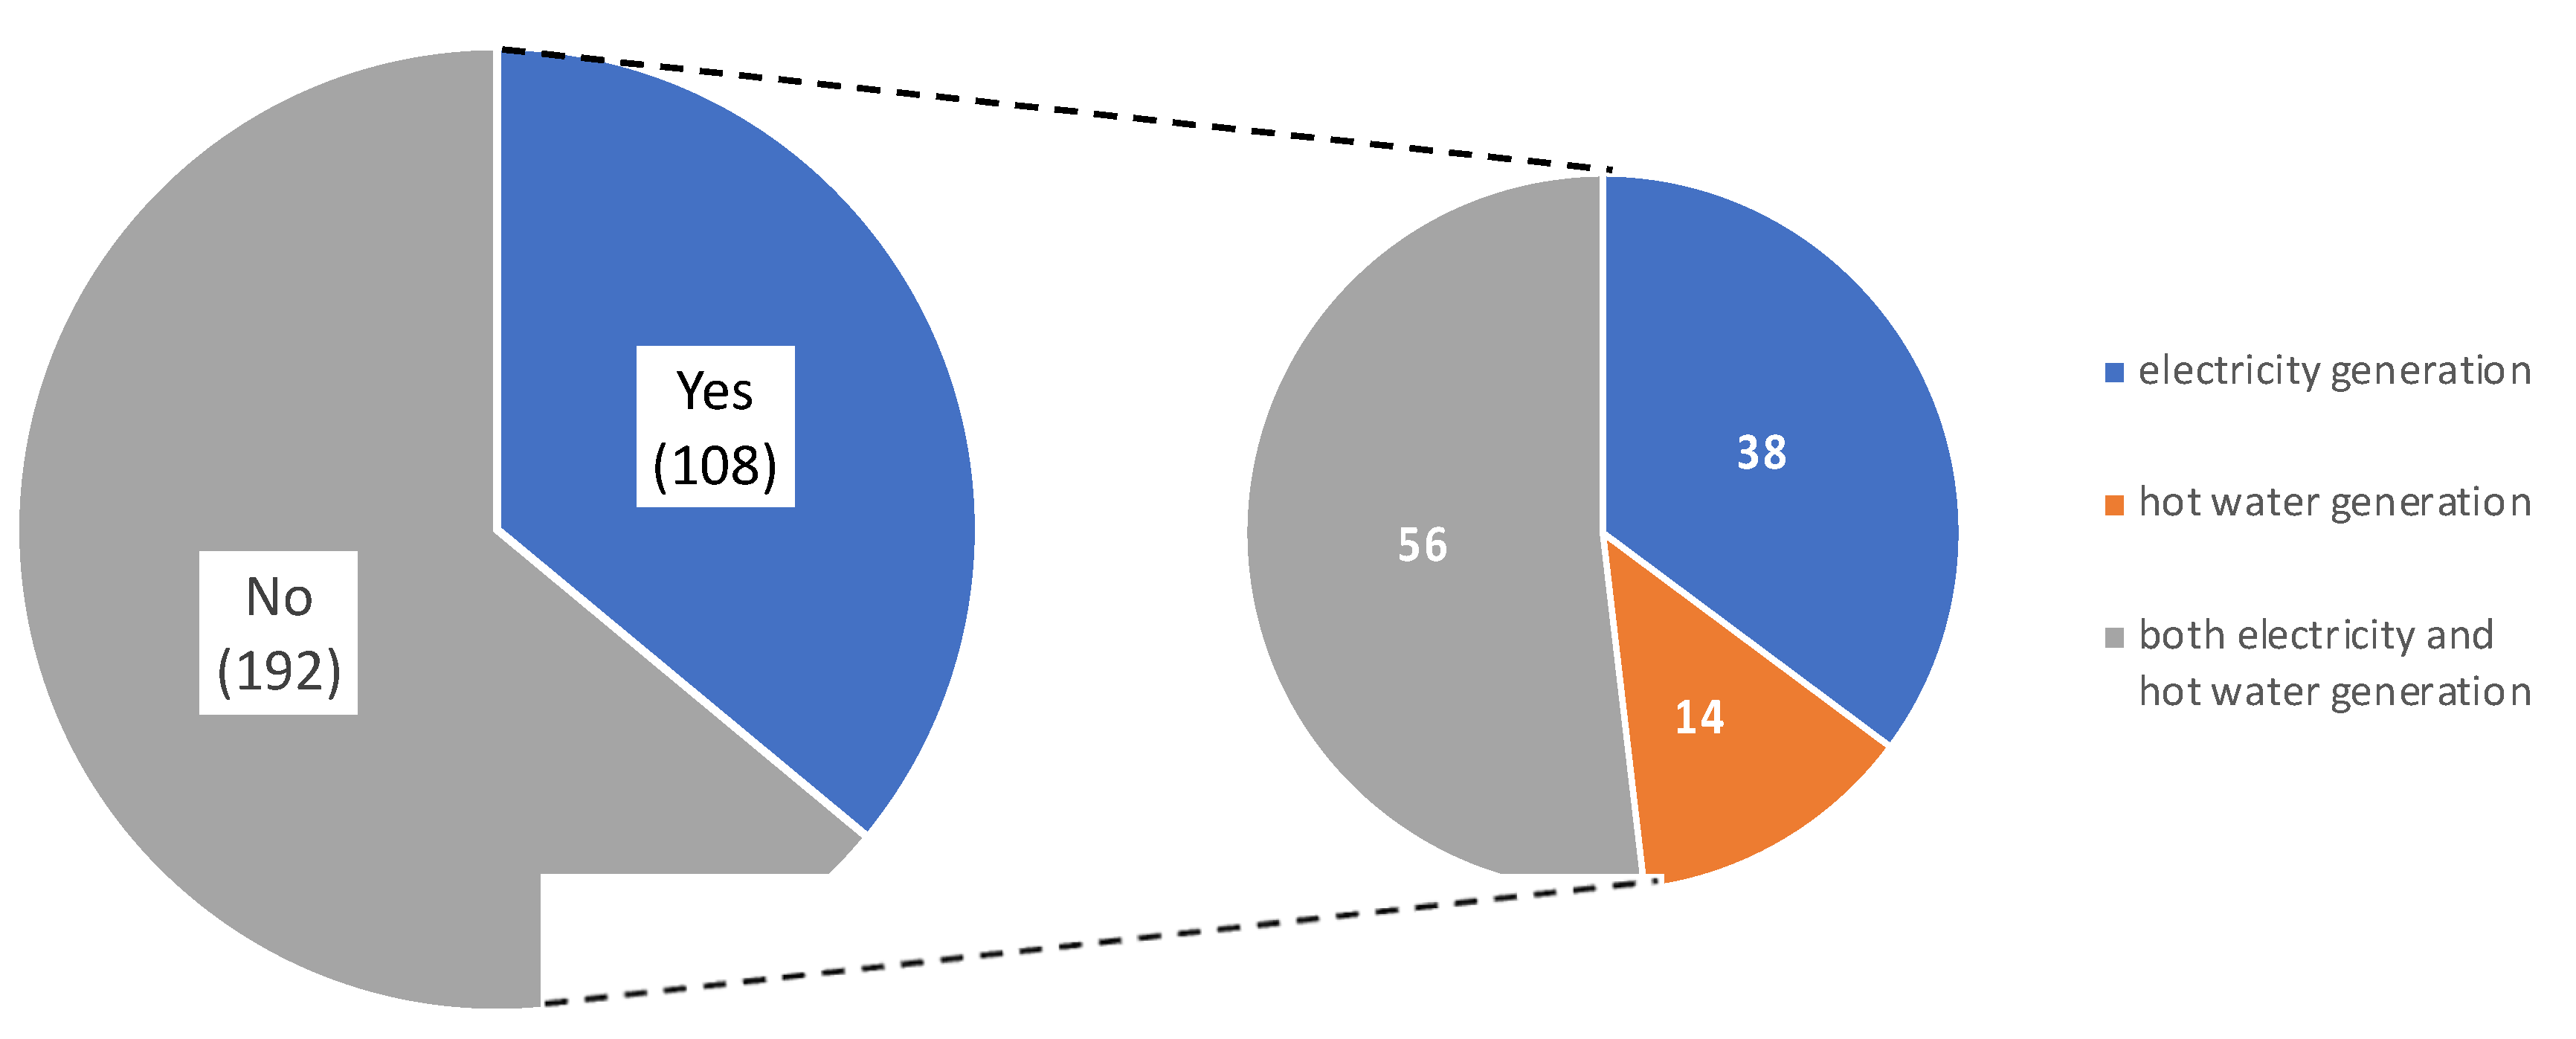
Table 1 presents the basic survey statistics. The total size of the sample is 300. By using stratified sampling, gender, age, and region were set to match the national statistical ratio, whereas income level and educational background were similar. Other basic statistics included checking the respondents’ understanding of the PVT explanations and whether solar energy was used in their houses. Regarding the understanding of PVT explanations, 184 (61%) selected “understood”, 75 (25%) selected “ordinary”, and 28 (9%) selected “fully understood”, confirming the reliability of the survey results. Of the survey participants, 108 (46%) used solar energy, 38 (13%) used solar modules for electricity generation, 14 (5%) used solar modules for hot water generation, and 56 (19%) used both as can be seen in
Figure 2.
The intention to pay for the hybrid PVT collectors was derived through CVM analysis, and the OOHB model was used, as previously described. In the pilot test, the WTP amount was ascertained through open-ended questions, and a dichotomous choice was set at (2000, 6000), (4000, 8000), (6000, 10,000), (8000, 12,000), (10,000, 16,000), and (14,000, 20,000) KRW (lower bid, upper bid).
Table 2 summarizes the covariate variables. Covariates were considered to improve the accuracy and explanatory power of the analyses. The CVM conducts surveys to measure perceptions or attitudes toward a particular value and builds a valuation model based on them. Here, covariate analysis considers the survey results and the various characteristics and backgrounds of the respondents. This helps improve the prediction accuracy of the model. In addition, the covariant analysis allowed us to analyze the interaction between the survey results and the respondents’ characteristics. This helps researchers identify and explain the factors that affect the survey results. The covariates considered were as follows:
“PV_elec_generate,” in
Table 2, shows whether respondents use a PV module as an electricity generator using dummy variables, and “Install_cost” shows the satisfaction levels of the installation cost on a 5-point Likert scale. “Stable_supply” shows the importance of stable electricity and hot water supply on a 5-point Likert scale, and “Metropolitan” divided the capital and megalopolis cities from the others using dummy variables. “Single-house” shows the residential type of the detached house using dummy variables, “Assess_TP” shows the tendency level of paying for the conduct of conformity assessment, which helps to develop a product with higher stability using a 5-point Likert scale, and “Assess_TA” shows the tendency level of using the conformity assessment certified product by 5-point Likert scale. “PV_using” shows the respondents who do not yet own PV modules using dummy variables, and “Install_plan” shows those who do not have any plan to install PV modules using dummy variables. “Damage_harm” shows the level of harm from PV damage regardless of whether it was theirs or not by ordinal scale, and “Uncomfy_exp” shows the inconvenience experience and the degree of damage to the PV module by 5-point Likert scale. “Paid_AS” shows the damage-resolution experience of the charged after-sales service using dummy variables. Finally, “House_income” divided income responses by average income level and made it into a dummy variable which was input as a fixed variable to confirm the direction of the model using dummy variables.
4.2. Results
Table 3 lists the estimated results of the OOHBDC spike model. The mean WTP came out to be KRW 10,608.35 (USD 7.9) per year. For interpretation, the model was divided into cognitive aspects. Covariate analysis can improve the accuracy and explanatory power of the model, and the reasons for dividing the analysis model into two are as follows. When constructing the survey, it was assumed that the utility gained by consumers from the release of PVT could be expressed in terms of the environment and safety; accordingly, the response results were divided into two levels. The environmental aspect explains that using solar power-generated energy in a single product would improve efficiency. The module applied to the PV plate removes heat and lowers the temperature during high temperatures in the summer to maintain efficiency. The safety aspect explains the protection of the module from natural disasters such as hail or gusts by wrapping the outside of the product in a polycarbonate case. This aspect also shows damage reduction in electricity and hot water cut-offs due to disasters. In Model 1, the covariates were classified to examine respondents’ perspectives who valued environmental aspects over safety. Model 2 classified the covariates for respondents who valued safety over environmental aspects. Accordingly, it is possible to measure the product’s value from a cognitive perspective.
The model was divided into satisfaction, such as stability for overall use, and dissatisfaction, such as an inconvenient experience. In Models 1 and 2, the coefficients of bids are statistically significant. As the estimated coefficient was significant, the corresponding results were used. Model 1 indicated satisfaction with the overall usage and stability of PV systems through conformity assessment variables. It can be interpreted as “the higher the importance of a stable supply of electricity and hot water, or the tendency to pay for the conformity assessment or the tendency to use the conformity assessment certified product is, the higher the willingness to pay for the certified products”. This suggests that, when evaluating PVT impacts on environmental aspects, considering a heterogeneous structure for stability across products, including electricity and hot water supplies, is crucial.
Model 2 can be interpreted as the perception of damage and the empirical aspect of inconvenience and can be interpreted as “The more the individuals are with the installation plans, or the stronger the level of discomfort experienced due to damage, the more the WTP is”. This suggests that when evaluating the value of the PVT in terms of safety, it is necessary to consider an individual’s plans or past experiences. Considering Korea, where most people live in apartments and use city gas, the difference between individuals with experience or plans to use solar collectors and those without is an understandable result. In addition, since Cha [
13] found out that liquid-type PVT with glass covers is the main product with the largest market share, PVT with polycarbonate cover has benefits in discomfort due to damage. Therefore, the PVT value can be interpreted as stable solar energy use.
The WTP for this stable use of PVT was identified as an additional income tax of KRW 10,608 per year. Considering that solar collectors reduce electricity costs, it is possible to calculate user benefits from stability by intersecting electricity prices with the average amount of electricity used by the general public and the amount of power expected from solar collectors other than PVT. This cost covers the ability to supply stable electricity and hot water independent of the season and weather and the reduced probability of damage caused by natural disasters. The installation cost of PVT can be lowered below the WTP value or suggest ways to increase stability to increase the benefits experienced by users.
According to Nomura and Akai [
30], people who view renewable energy as a reliable technology will be willing to pay higher electricity bills. This is consistent with our finding that the respondents’ installation plans affect their WTP with high reliability. It can also be interpreted that the PV module’s ability to be a stable supplement affects WTP because reliability includes stable supply capacity. Lee and Heo [
31] suggested that South Korea’s WTP for renewable energy sources is lower than that of other developed countries. This can be positively affected by policies aimed at increasing consumer knowledge and acceptance. In this study, the WTP for conformity assessment and the willingness to use the conformity assessment-certified product derived a higher WTP. This implies that policies, such as conformity assessment certification, positively affect renewable energy, such as solar PVT acceptance and WTP.
5. Conclusions
The significance of this study is as follows: It shows that it is possible to evaluate the net zero profitability of new industrial convergence products. The CVM was suggested for product economic evaluation, and a cost-benefit analysis was suggested for social benefit analysis. The survey was conducted online and nationwide; data from 300 people were used via the CVM method. This survey demonstrates that a stable supply of electricity and hot water, payment for conformity assessment, and conformity assessment certification of a product affect WTP. Furthermore, the number of individuals with PV module installation plans or the discomfort experienced due to module damage affects WTP. In other words, there is a high possibility of PVT adoption by individuals who have replaced or plan to replace their PV modules. Upon examining the characteristics of these respondents, individuals living in old apartments or households with 3–4 family members could become the target consumer group. Until now, the main consumer group of solar power generators was those with a wide area to utilize the volume of the panels; however, significant changes are needed for PVT adoption. Therefore, focusing on the consumer class presented in the initial conversion will provide PVT with a more effective market entry.
The social benefit substitution method was used to add economic feasibility to the results. Social benefits are concepts that encompass both negative and positive effects applied to society. As WTP analysis derives the utility value individuals expect, social benefits can be obtained by multiplying the number of people in the affected range and the ratio, excluding the protest bids and 0 WTP respondents. In this study, the WTP was calculated as the yearly income tax per household multiplied by the total number of households in 2020 [
32]. In addition, the ratio of protest bids to 0 WTP was 109 to 300; thus, 0.6367 was multiplied by this ratio. Therefore, the total social benefit was approximately KRW 145 billion (USD 108 million). The planned cost of the public sector’s R&D investment, including government and state-run companies in the solar and wind sectors, was KRW 157.1 billion (USD 116.9 million) in 2020 [
33]. According to KOSIS [
34,
35], the ratio of total production to power generation in the solar and wind sectors in the same year was approximately 6:1. In 2020, the total production of solar energy was 4,165,154 toe, and the total production of wind energy was 671,107 toe, showing approximately 6.21 times more solar than wind energy production. In addition, the total power generation of solar energy was 19,337,964 MWh, and the total power generation of wind energy was 3,149,948 MWh, showing approximately 6.14 times more solar energy production. Assuming that this ratio is proportional to the investment, the cost invested in the solar sector was approximately 135 billion KRW (USD 100 million). Therefore, the social benefits derived from this study are more significant than the investment costs, indicating that investment in PVT can be expected to be cost-effective.
This study is similar to existing research in that individuals’ installation plans and the PV module’s stable supply capacity positively affect WTP. Existing research proposes that people considering renewable energy as a reliable technology tend to have a high WTP. However, this study further differs in the system to support the reliability of new technologies, the expected stable use, and the expectation that it will improve dissatisfaction with past product use. Furthermore, according to this study and existing research, the conformity assessment impacts the WTP for PVT. The overall stability of the product influences the use value of PVT, its plans, and its experience; therefore, it can be interpreted as stable solar energy use. The WTP for the stable use of solar energy has been confirmed to be KRW 10,608 (USD 7.90). As mentioned, the PVT system produces electricity and hot water, reducing electricity and gas bill costs; thus, the WTP is compared to the two bills. The WTP shows that households evaluate the value of PVT as 3.69% of the monthly electricity bill and 2.8% of the monthly gas bill. According to KEPCO, the average electricity bill per household in 2020 is 23,998 KRW (USD 17.84), and the average gas bill per household in 2020 is 31,760 KRW (USD 23.61). In addition, the use of stable electricity is expected to have a greater advantage in the current situation, where heating costs produced by energy generation rather than renewable energy are unstable owing to carbon neutrality issues.
Most of Korea’s electricity is used in dense cities, and under these constraints, the use of solar energy has been limited. Through the economic evaluation of PVT in this study, it is expected that these constraints will also be offset. However, it is still necessary to add additional studies on regional limitations through further research. At this time, it is expected that the integrated district heating situation by region and the amount of power efficiency and sunlight that were not considered in this study will be considered. In addition, as PVT is a new product that has not yet been released, we could not calculate the efficiency of its electricity and hot water supply. However, when the information becomes readily available after the introduction, it is expected that future studies can analyze the economic and environmental effects compared to investment costs for PVT. Still, the implementation of various policies, such as conformity certification systems, is expected to support the launch of these new products with high personal and social benefits. According to Sin et al. [
36] and Kamolsook et al. [
37], economic valuation can be an important source to understand the social impact of new products and systems by identifying the social benefits when there is no quantitative derivation of benefits from the suitability certification of new products. This study served as such a foundation, and an efficiency valuation from environmental and safety perspectives can be conducted in subsequent studies.


